XPEL, Inc. · NASDAQ:XPEL
XPEL — Investor Presentation (May 2023)
24 slides from XPEL's investor presentation, May 10, 2023
Slide 1: Investor Presentation May 2023
INVESTOR PRESENTATION May 2023
Slide 2: Forward Looking Statement
2 FORWARD LOOKING STATEMENT This Presentation contains certain forward-looking statements in respect of various matters including upcoming events that involve known and unknown risks and uncertainties that are beyond the control of Management. Those risks and uncertainties include, among other thing
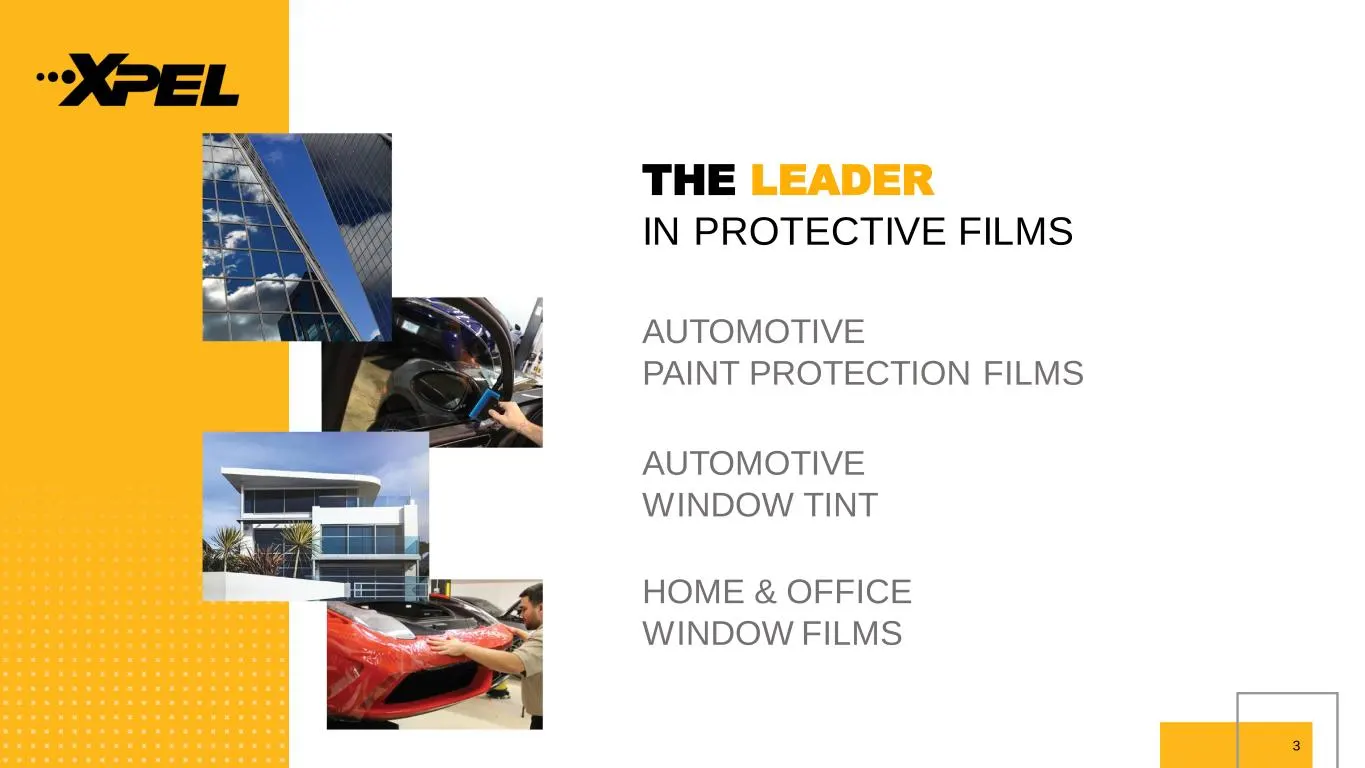
Slide 3: The Leader in Protective Films
3 THE LEADER IN PROTECTIVE FILMS AUTOMOTIVE PAINT PROTECTION FILMS AUTOMOTIVE WINDOW TINT HOME & OFFICE WINDOW FILMS
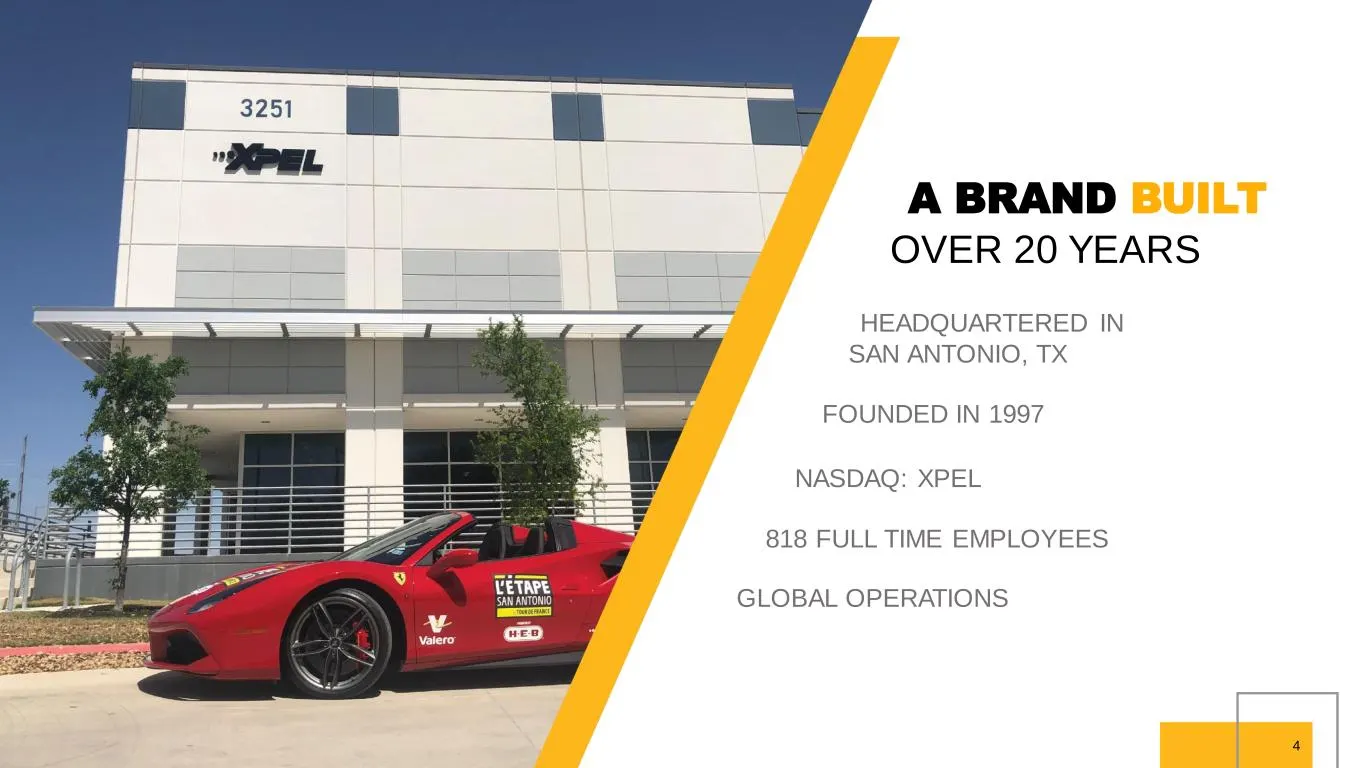
Slide 4: A Brand Built Over Years
4 A BRAND BUILT OVER 20 YEARS HEADQUARTERED IN SAN ANTONIO, TX FOUNDED IN 1997 NASDAQ: XPEL 818 FULL TIME EMPLOYEES GLOBAL OPERATIONS
Slide 5: History That Continues to Set the Standards
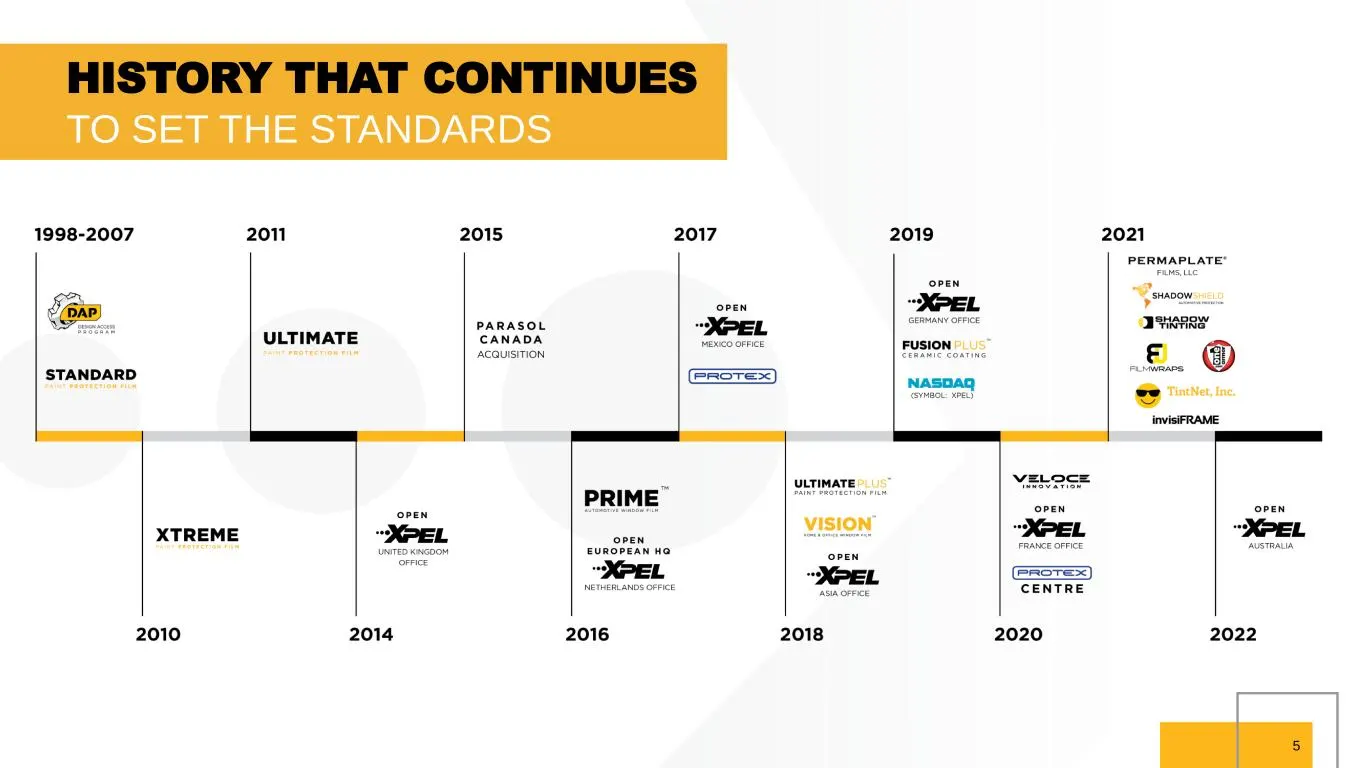
5 HISTORY THAT CONTINUES TO SET THE STANDARDS
Slide 6: Key Investments Highlights
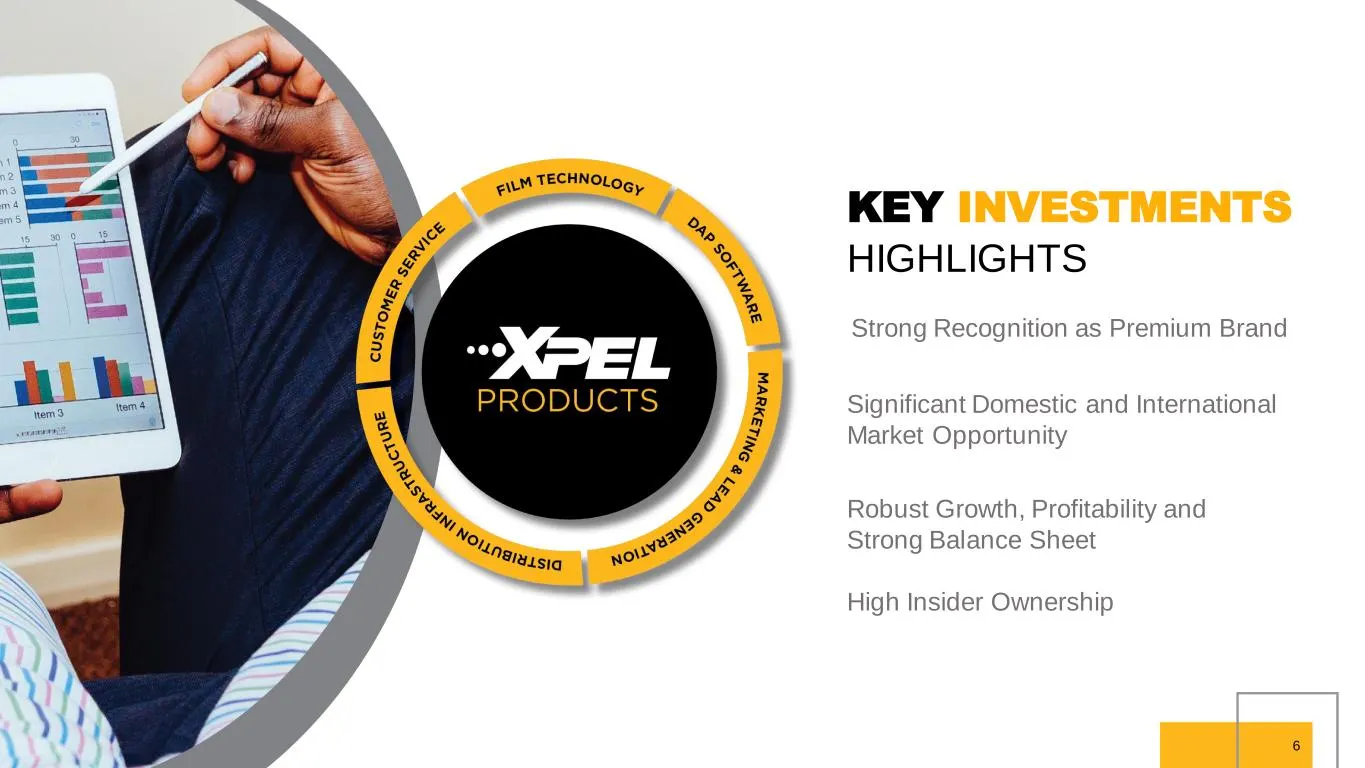
6 KEY INVESTMENTS HIGHLIGHTS Strong Recognition as Premium Brand Significant Domestic and International Market Opportunity Robust Growth, Profitability and Strong Balance Sheet High Insider Ownership
Slide 7: Automotive Products
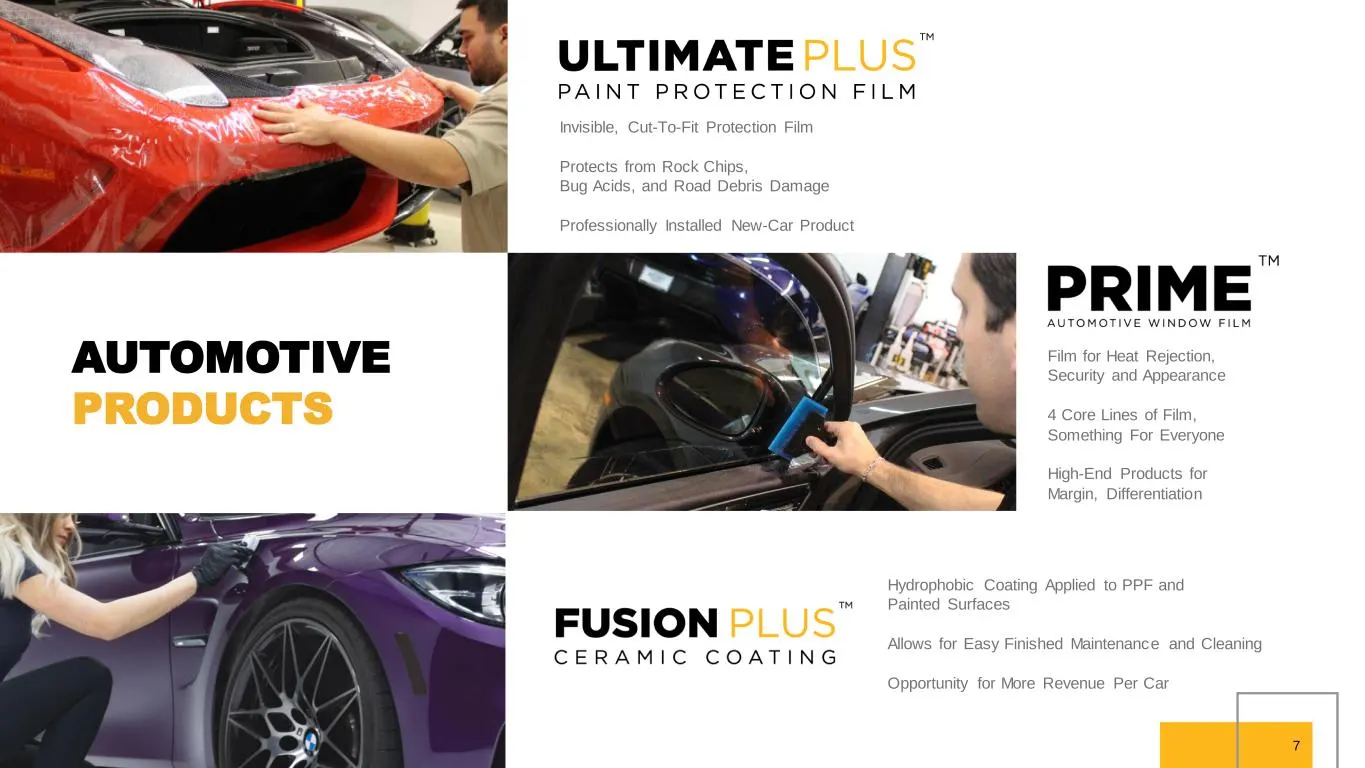
7 AUTOMOTIVE PRODUCTS Invisible, Cut-To-Fit Protection Film Protects from Rock Chips, Bug Acids, and Road Debris Damage Professionally Installed New-Car Product Film for Heat Rejection, Security and Appearance 4 Core Lines of Film, Something For Everyone High-End Products for Margin, Differentiation
Slide 8: Complete Protection
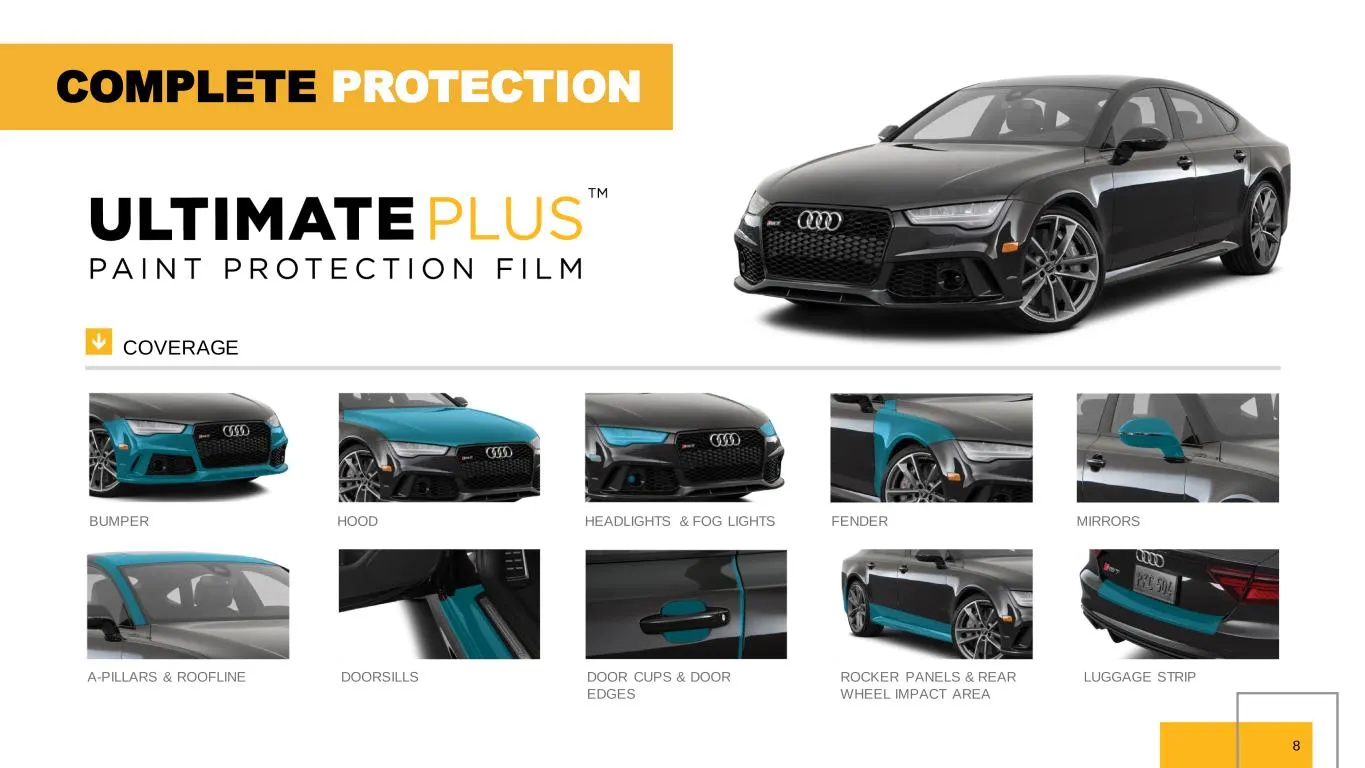
8 COMPLETE PROTECTION BUMPER HOOD HEADLIGHTS & FOG LIGHTS FENDER MIRRORS A-PILLARS & ROOFLINE DOORSILLS DOOR CUPS & DOOR EDGES ROCKER PANELS & REAR WHEEL IMPACT AREA LUGGAGE STRIP COVERAGE
Slide 9: End Customer PPF Economics
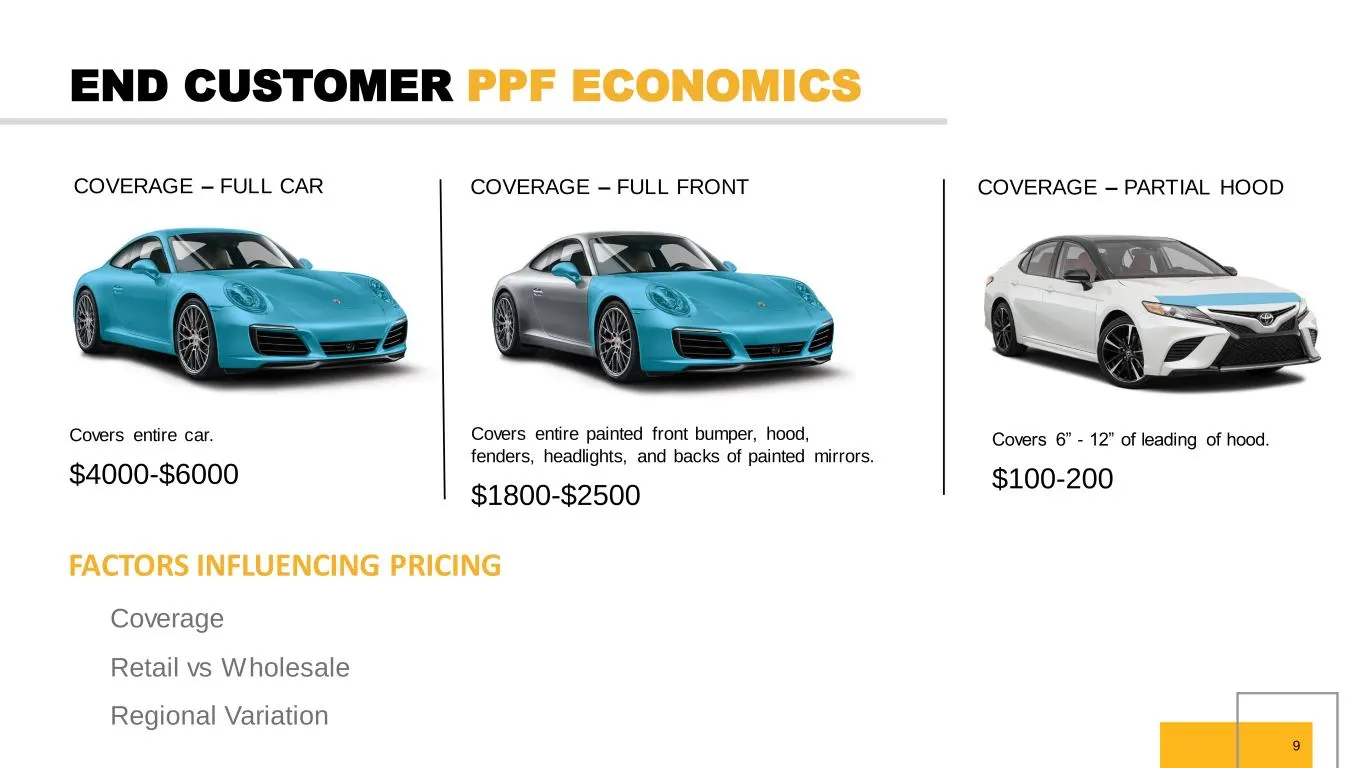
9 END CUSTOMER PPF ECONOMICS COVERAGE – FULL CAR COVERAGE – FULL FRONT COVERAGE – PARTIAL HOOD Covers entire car. $4000-$6000 Covers entire painted front bumper, hood, fenders, headlights, and backs of painted mirrors. $1800-$2500 Covers 6” - 12” of leading of hood. $100-200 FACTORS INFLUENCING PRIC
Slide 10: The XPEL Difference
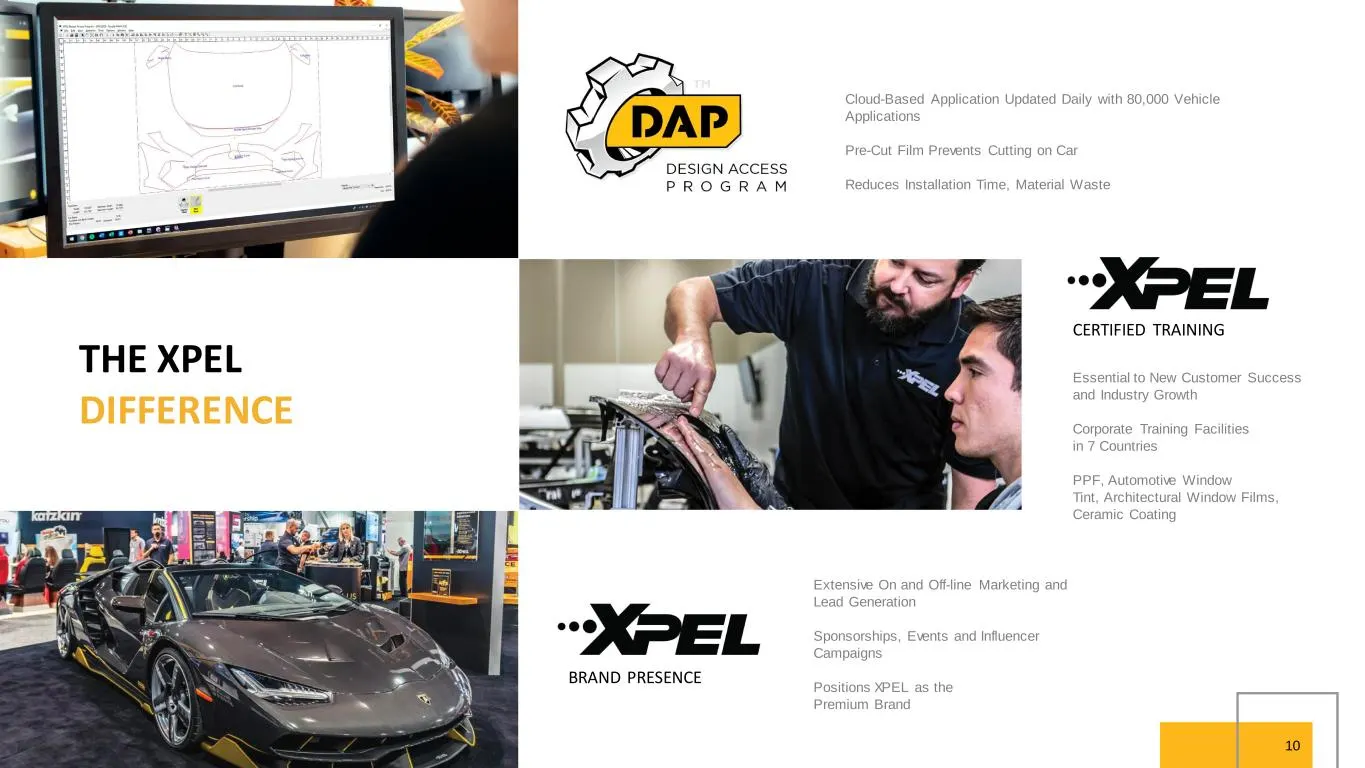
10 Cloud-Based Application Updated Daily with 80,000 Vehicle Applications Pre-Cut Film Prevents Cutting on Car Reduces Installation Time, Material Waste CERTIFIED TRAINING BRAND PRESENCE Essential to New Customer Success and Industry Growth Corporate Training Facilities in 7 Countries PPF, Automotiv
Slide 11: Dealership Services
11 DEALERSHIP SERVICES Unique Business Model - Serves only automotive dealership customers - Primarily window film installation today - Products are pre-loaded on vehicles prior to sale - Our labor is housed within the dealership Opportunity To Penetrate Down Market Opportunity To Introduce Paint Pr
Slide 12: Non-Automotive Products
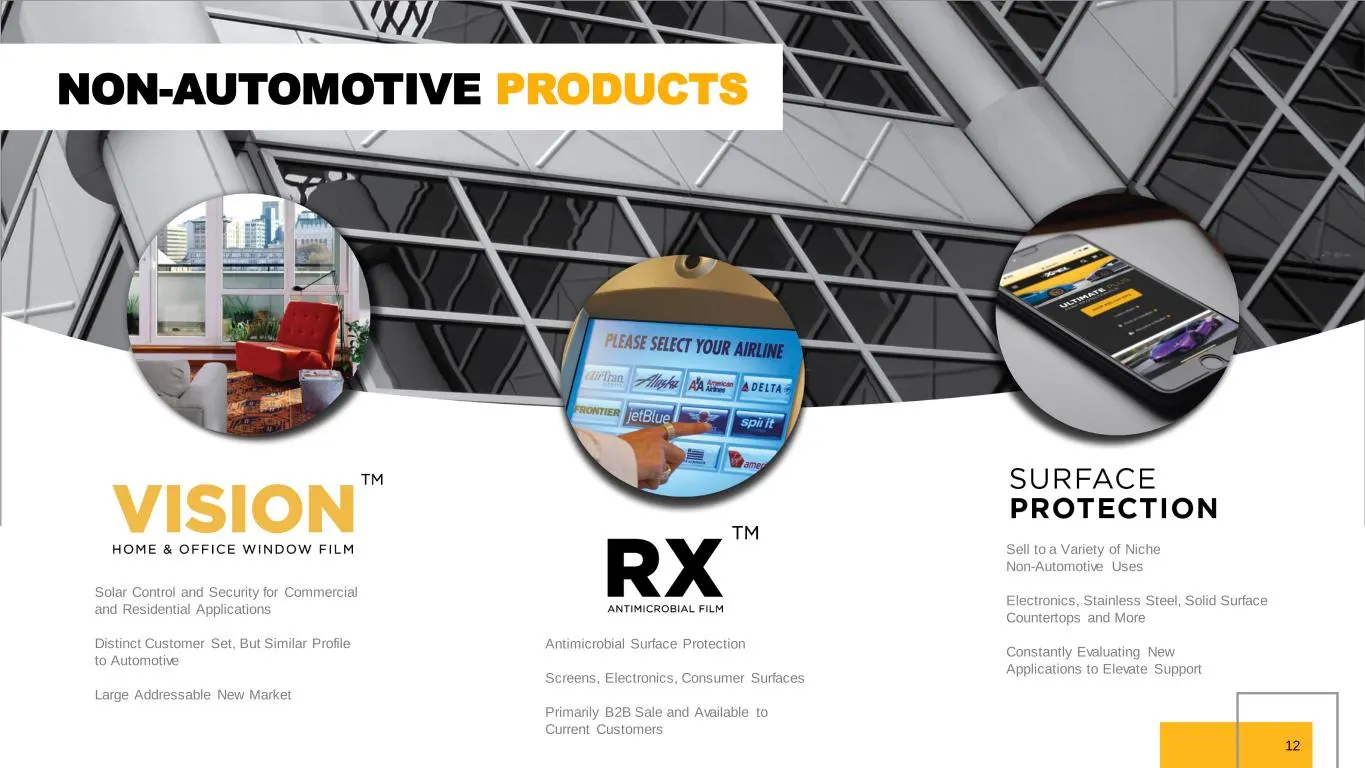
12 NON-AUTOMOTIVE PRODUCTS Solar Control and Security for Commercial and Residential Applications Distinct Customer Set, But Similar Profile to Automotive Large Addressable New Market Antimicrobial Surface Protection Screens, Electronics, Consumer Surfaces Primarily B2B Sale and Available to Current
Slide 13: XPEL Revenue Ecosystem
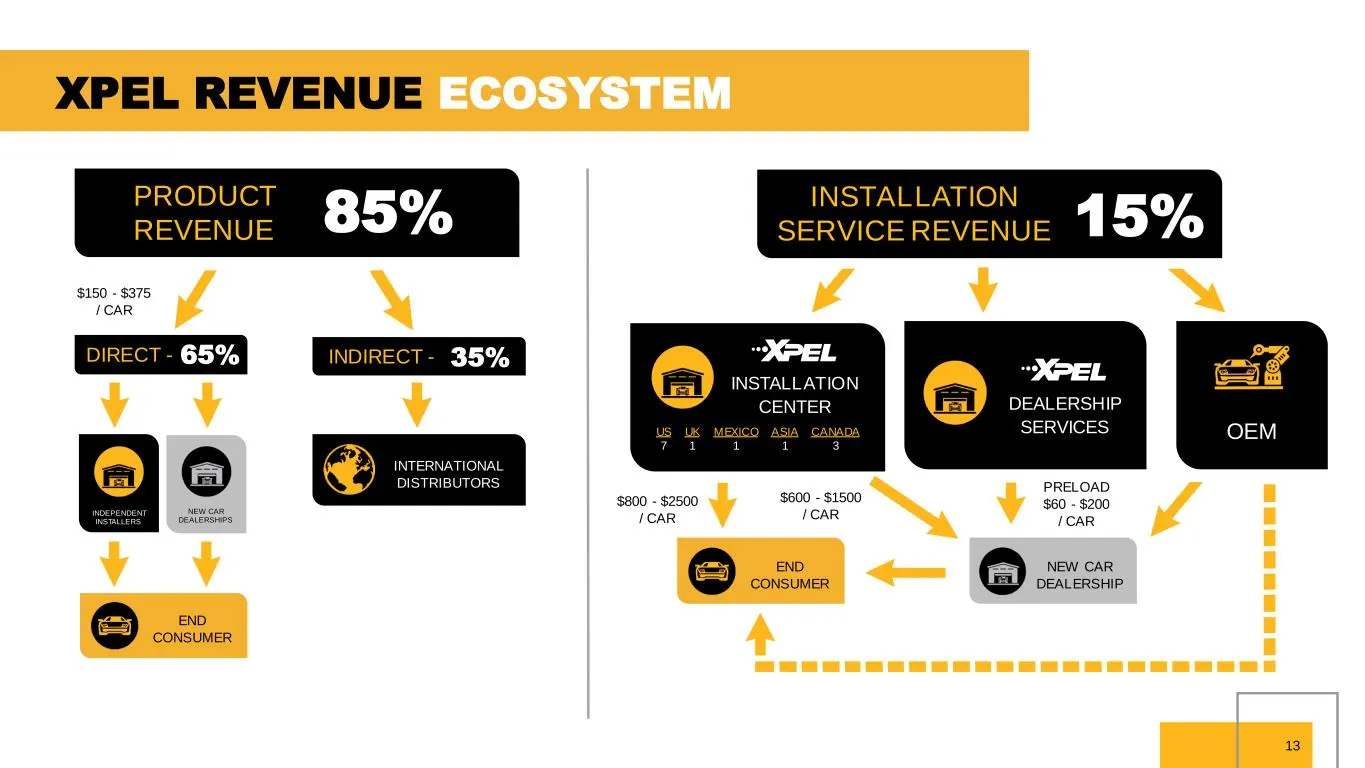
13 XPEL REVENUE ECOSYSTEM PRODUCT REVENUE 85% $150 - $375 / CAR $600 - $1500 / CAR $800 - $2500 / CAR DIRECT - 65% INDIRECT - 35% INTERNATIONAL DISTRIBUTORS INDEPENDENT INSTALLERS NEW CAR DEALERSHIPS END CONSUMER END CONSUMER NEW CAR DEALERSHIP PRELOAD $60 - $200 / CAR DEALERSHIP SERVICES INSTALLATI
Slide 14: Continue Global Expansion
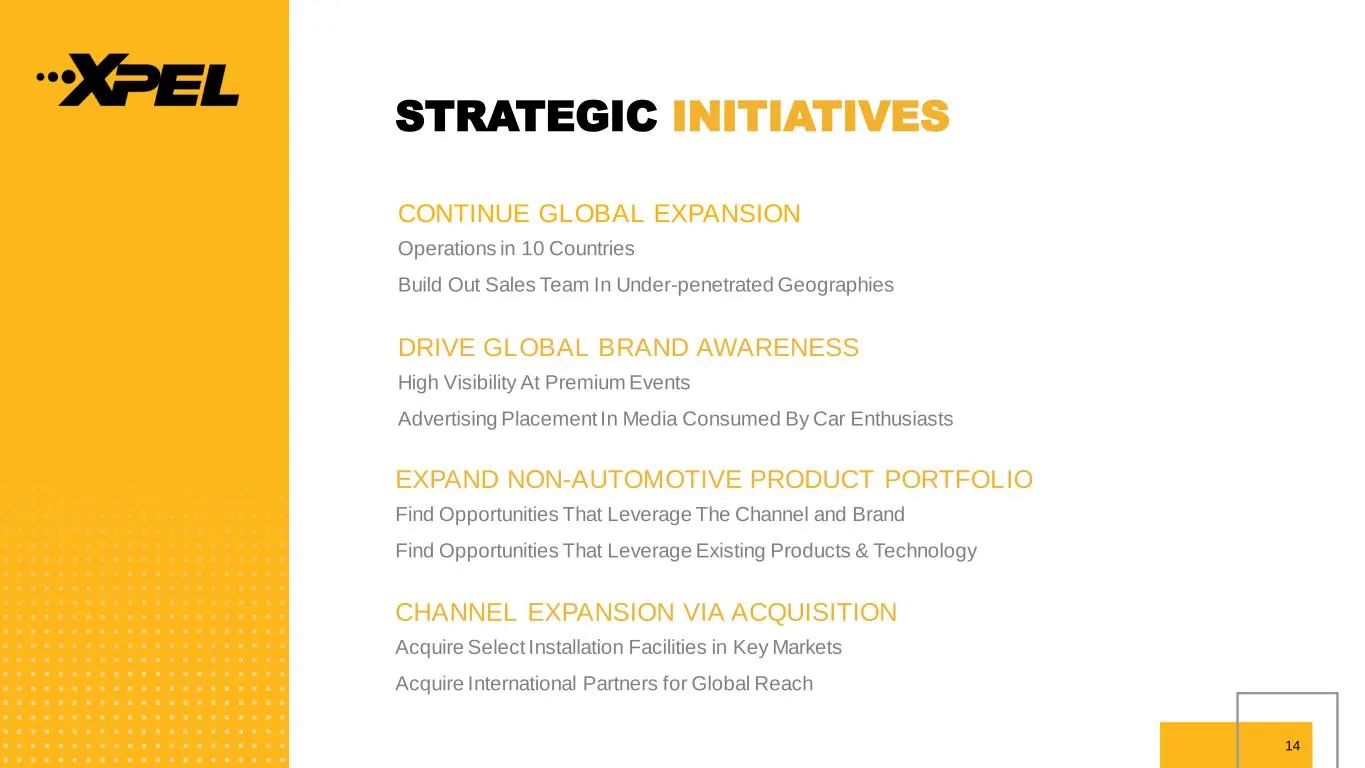
14 CONTINUE GLOBAL EXPANSION Operations in 10 Countries Build Out Sales Team In Under-penetrated Geographies STRATEGIC INITIATIVES DRIVE GLOBAL BRAND AWARENESS High Visibility At Premium Events Advertising Placement In Media Consumed By Car Enthusiasts EXPAND NON-AUTOMOTIVE PRODUCT PORTFOLIO Find Op
Slide 15: Revenue
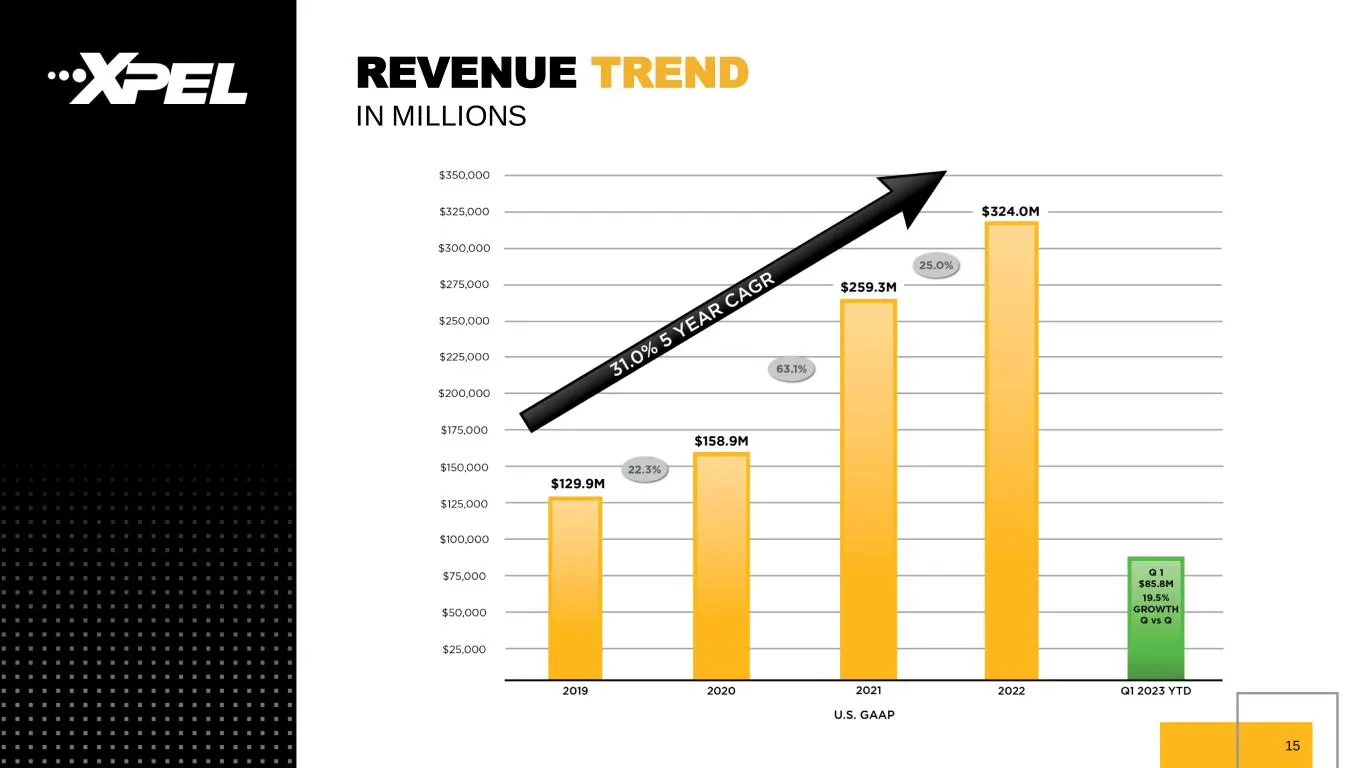
‘XPEL REVENUE IN MILLIONS $350,000 $325,000 $300,000 5,000 125,000 ‘$100,000 $25,000 $129.9M 22.3% $158.9M $259.3M 25.0% $324.0M 2019 2020 72021 U.S. GAAP 2022 ‘@1 2023 YTD 15
Slide 16: 2023 Sales Mix by Region
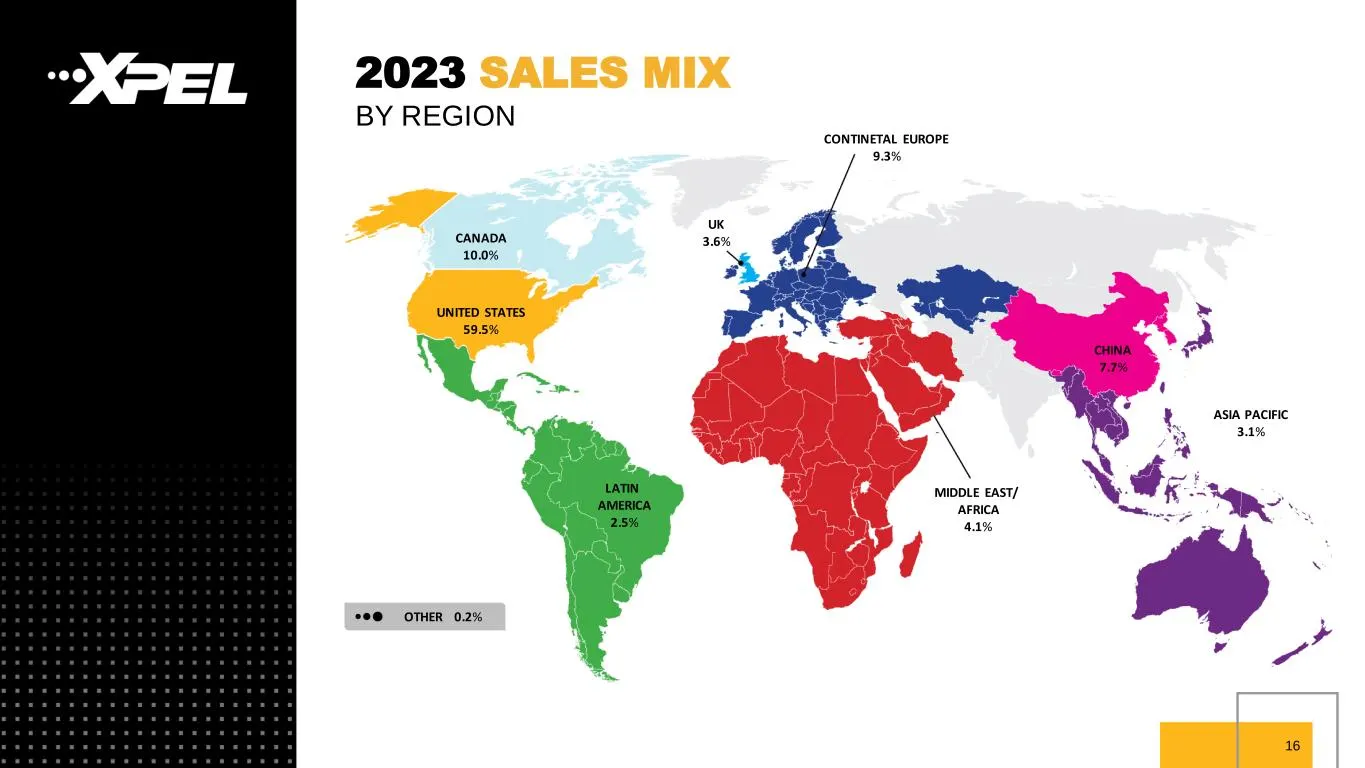
16 2023 SALES MIX BY REGION CANADA 10.0% UNITED STATES 59.5% LATIN AMERICA 2.5% MIDDLE EAST/ AFRICA 4.1% ASIA PACIFIC 3.1% CHINA 7.7% UK 3.6% CONTINETAL EUROPE 9.3% OTHER 0.2%
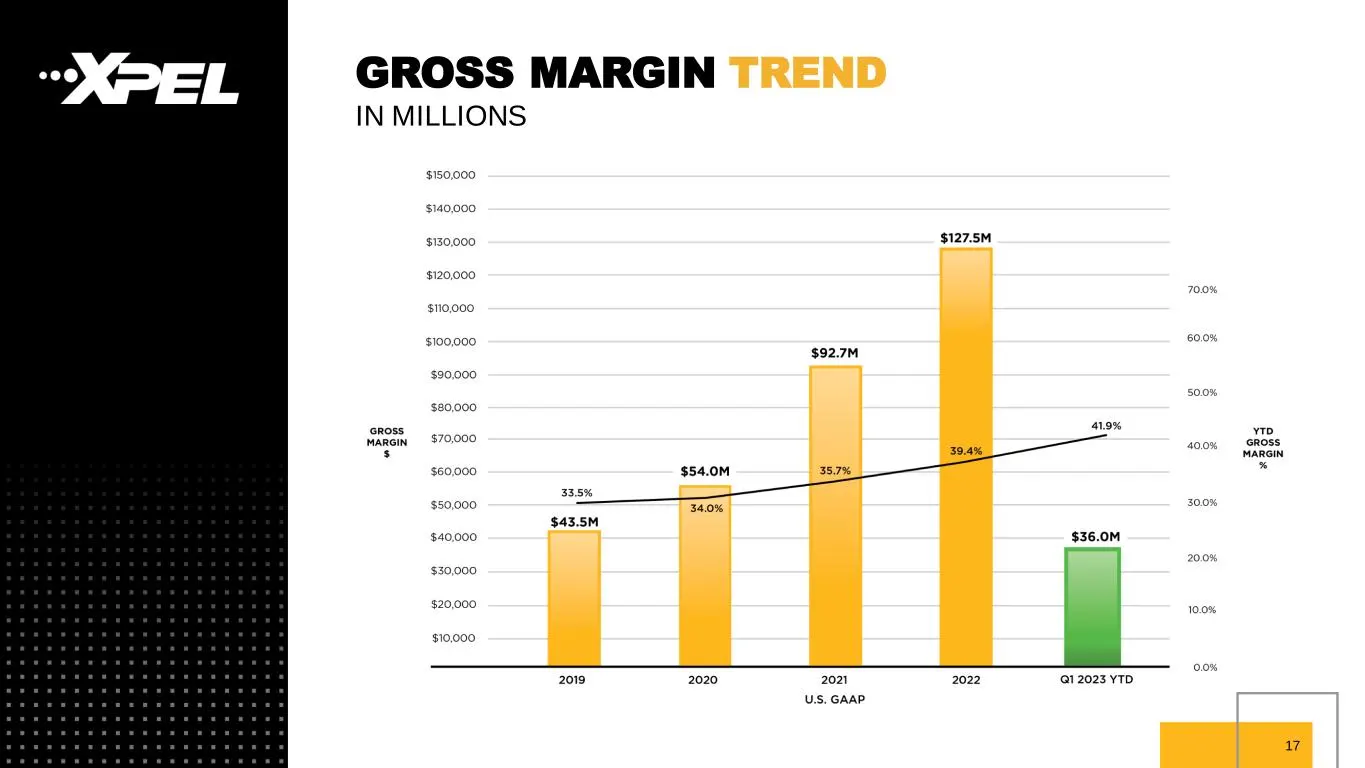
Slide 17: Gross Margin Trend
17 GROSS MARGIN TREND IN MILLIONS
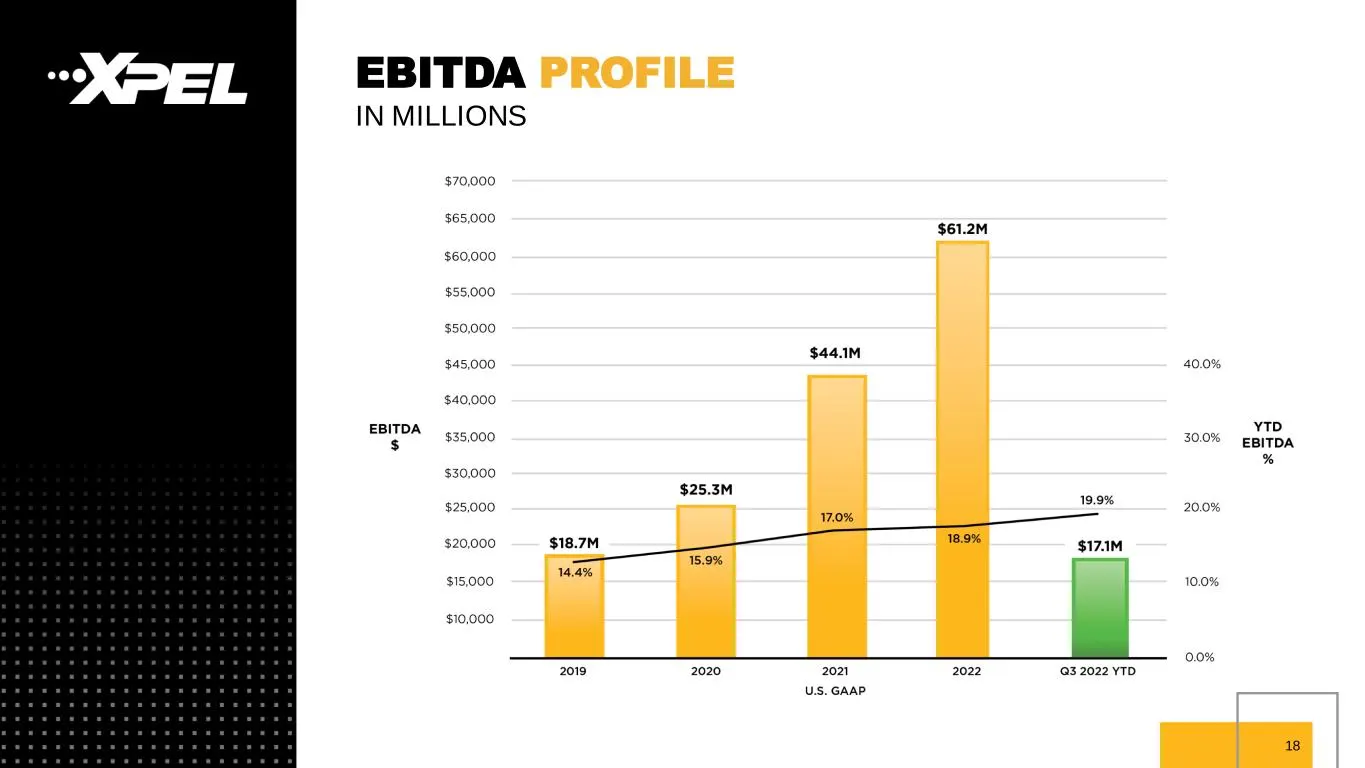
Slide 18: EBITDA Profile
18 EBITDA PROFILE IN MILLIONS
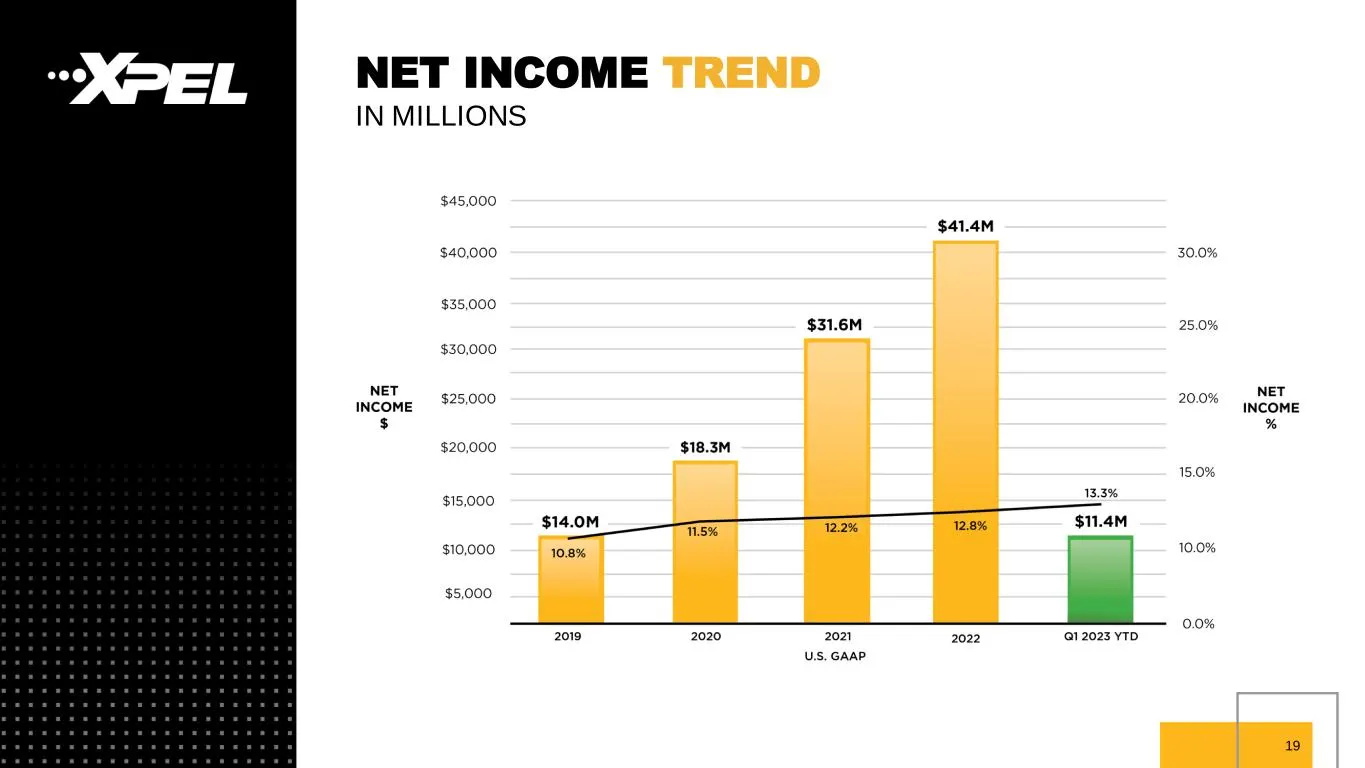
Slide 19: Net Income Trend
19 NET INCOME TREND IN MILLIONS
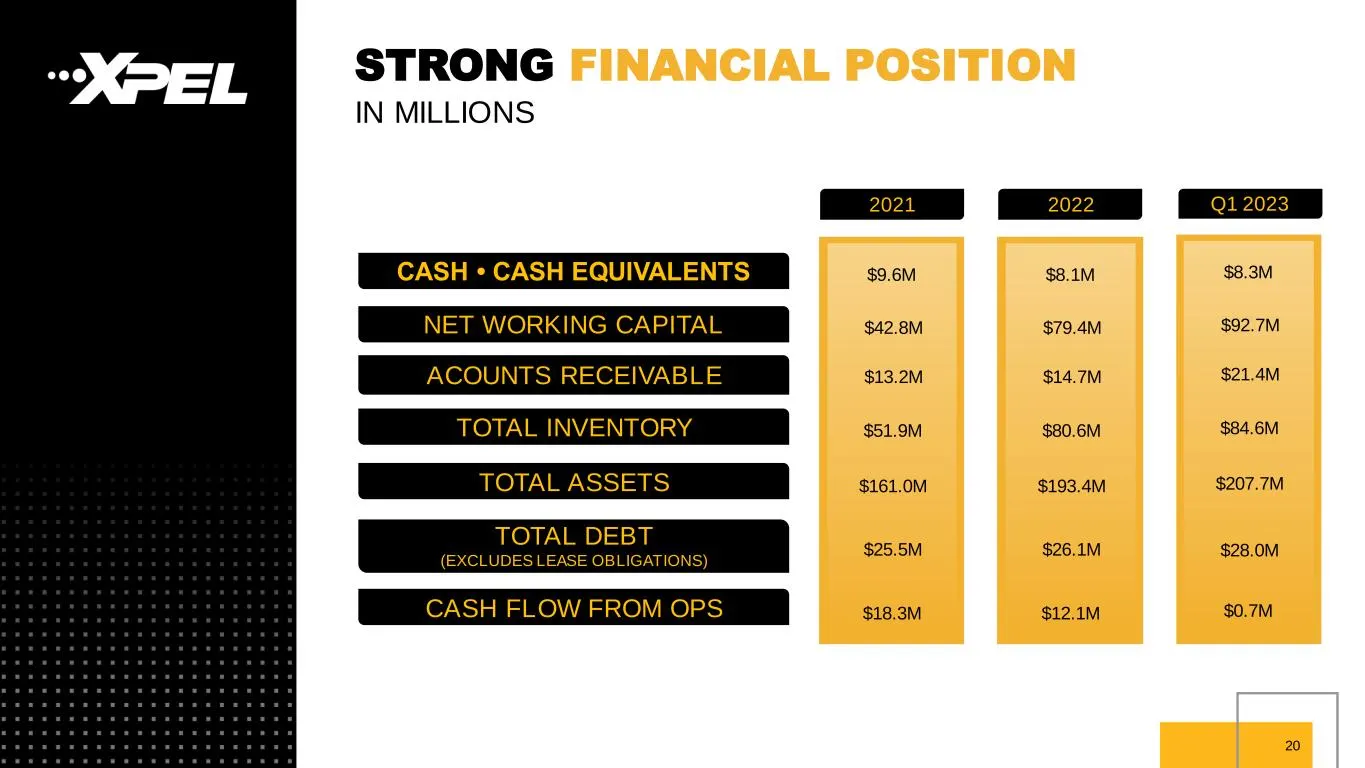
Slide 20: Strong Financial Position
20 STRONG FINANCIAL POSITION IN MILLIONS CASH • CASH EQUIVALENTS NET WORKING CAPITAL ACOUNTS RECEIVABLEACOUNTS EIVABLE TOTAL INVENTORY TOTAL ASSETS TOTAL DEBT (EXCLUDES LEASE OBLIGATIONS) CASH FLOW FROM OPS Q1 20232022 $8.1M $79.4M $14.7M $80.6M $193.4M $26.1M $12.1M $8.3M $92.7M $21.4M $84.6M $207.
Slide 21: Macro Growth Opportunities
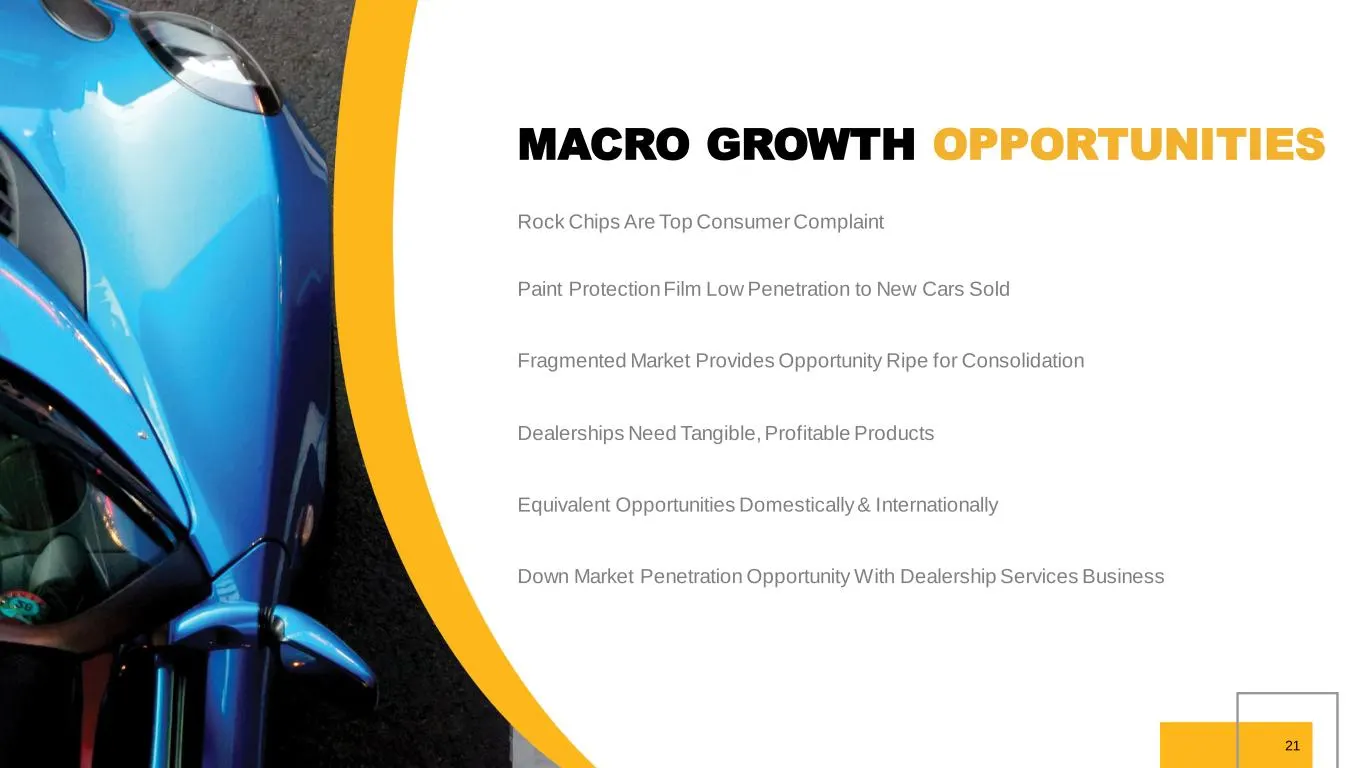
21 MACRO GROWTH OPPORTUNITIES Rock Chips Are Top Consumer Complaint Paint Protection Film Low Penetration to New Cars Sold Fragmented Market Provides Opportunity Ripe for Consolidation Dealerships Need Tangible, Profitable Products Equivalent Opportunities Domestically & Internationally Down Market
Slide 22: Appendix
APPENDIX
Slide 23: Non-GAAP Measures: EBITDA Reconciliation
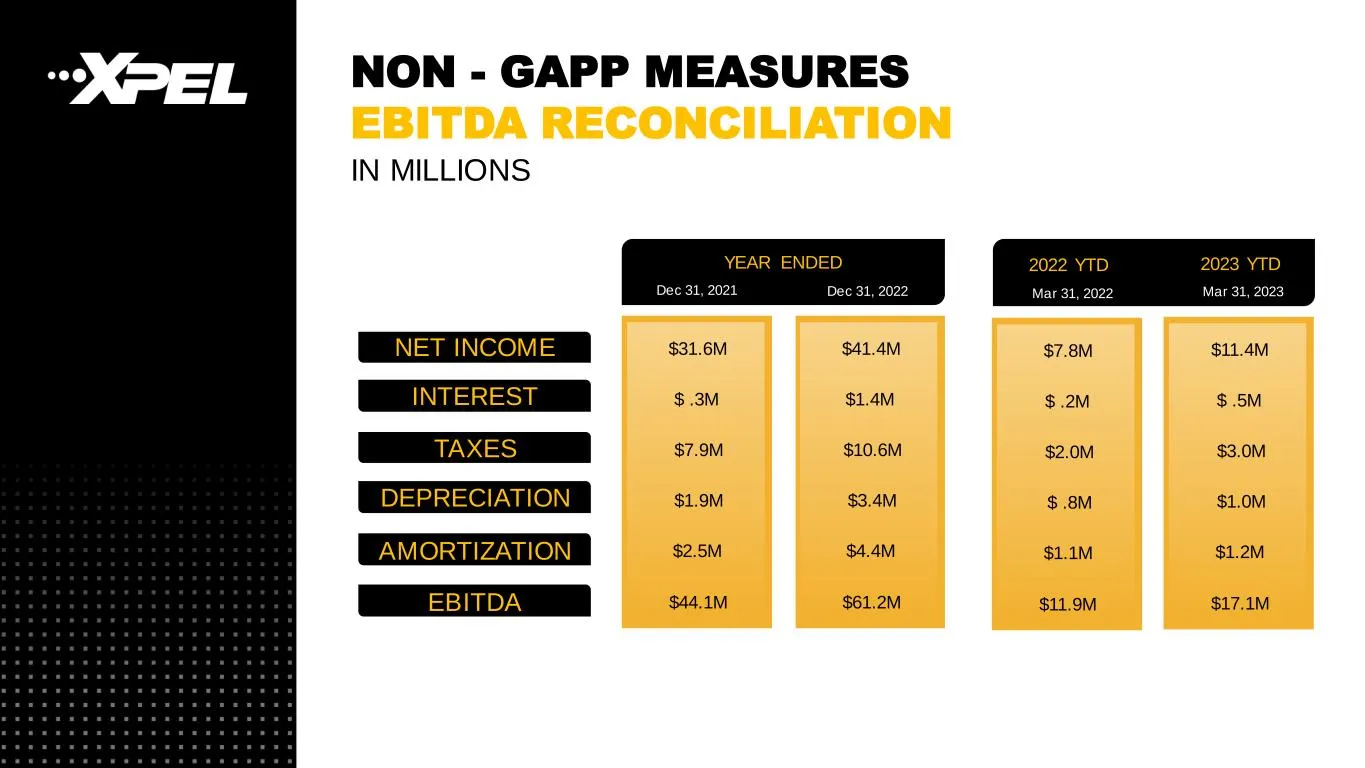
NON - GAPP MEASURES EBITDA RECONCILIATION IN MILLIONS NET INCOME INTEREST TAXES DEPRECIATION AMORTIZATION EBITDA $31.6M $ .3M $7.9M $1.9M $2.5M $44.1M YEAR ENDED Dec 31, 2021 $41.4M $1.4M $10.6M $3.4M $4.4M $61.2M Dec 31, 2022 $11.4M $ .5M $3.0M $1.0M $1.2M $17.1M Mar 31, 2023 2023 YTD $7.8M $ .2M $

Slide 24: Complete Protection, Unseen.
COMPLETE PROTECTION, UNSEEN. San Antonio, TX. USA +1 210-678-3700 XPEL.COM
Source: SEC EDGAR · 8-K filed May 10, 2023
More decks from XPEL, Inc.
 Q1 2026 Earnings Presentation31 slides · May 6, 2026
 Q4 2025 Earnings Presentation31 slides · Feb 25, 2026
 Q2 2026 Earnings Presentation32 slides · 2026
 Investor Presentation (October 2025)33 slides · October 2025
 Investor Presentation (May 2025)32 slides · May 2025
 Q3 2024 Earnings Presentation24 slides · November 2024