Hexpol AB Class B · OMXSTO:HPOL_B
Hexpol AB Class B — Investor Day (March 2023)
15 slides from Hexpol AB Class B's investor day presentation, Mar 20, 2023
Slide 1: Forward-Looking Statements
A Material Difference Forward-Looking Statements This presentation includes forward-looking statements that are subject to risks and uncertainties, including those pertaining to the anticipated benefits to be realized from the proposals described herein. This presentation contains several forward-lo
Slide 2: Peter Rosén, Deputy CEO and CFO
A Material Difference Peter Rosén Deputy CEO and CFO
Slide 3: Fast Growing And All-Time High Profits
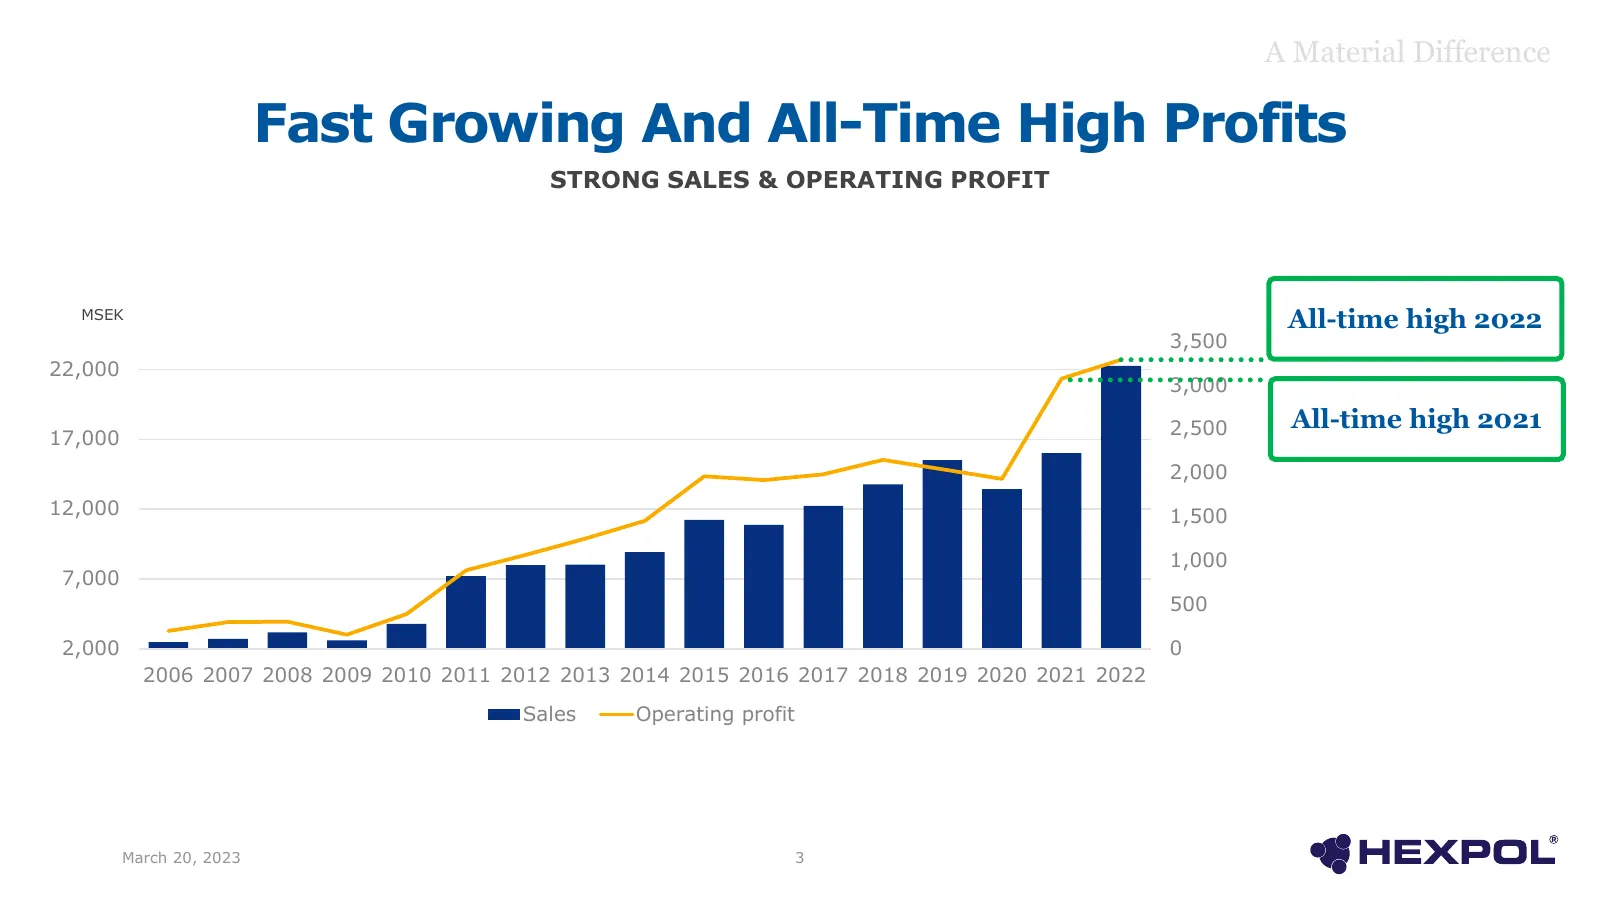
A Material Difference Fast Growing And All-Time High Profits STRONG SALES & OPERATING PROFIT MSEK All-time high 2022 3,500 22,000 3,000 2,500 All-time high 2021 17,000 2,000 12,000 1,500 1,000 7,000 500 2,000 0 2006 2007 2008 2009 2010 2011 2012 2013 2014 2015 2016 2017 2018 2019 2020 2021 2022 Sale
Slide 4: Financial Targets and Ambitions
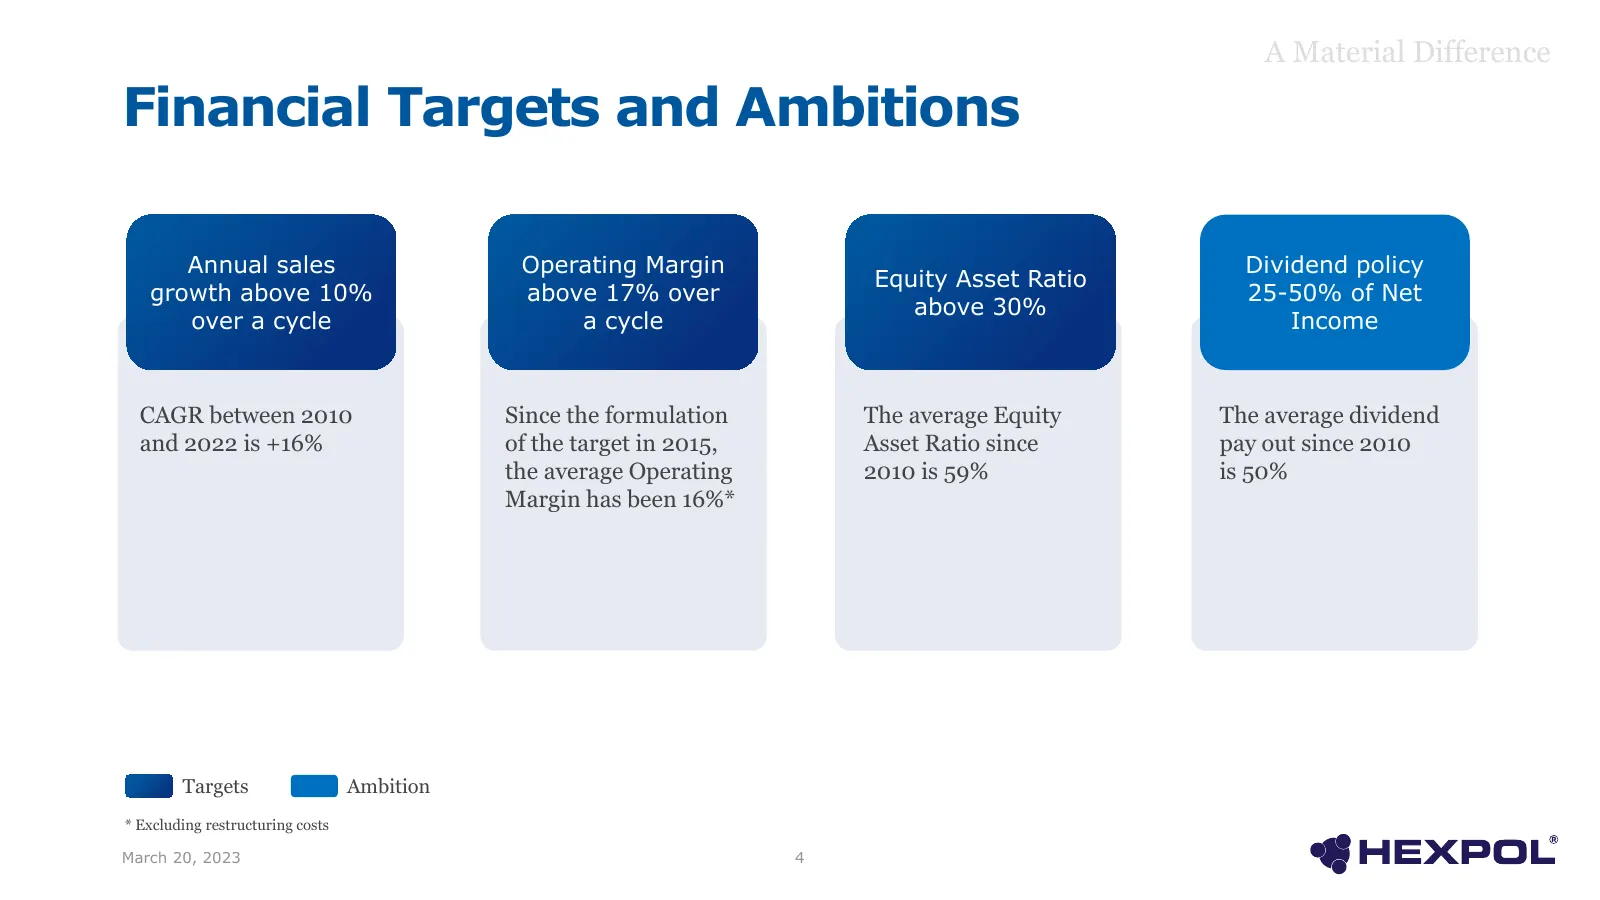
A Material Difference Financial Targets and Ambitions Annual sales Operating Margin Dividend policy Equity Asset Ratio growth above 10% above 17% over 25-50% of Net above 30% over a cycle a cycle Income CAGR between 2010 Since the formulation The average Equity The average dividend and 2022 is +16%
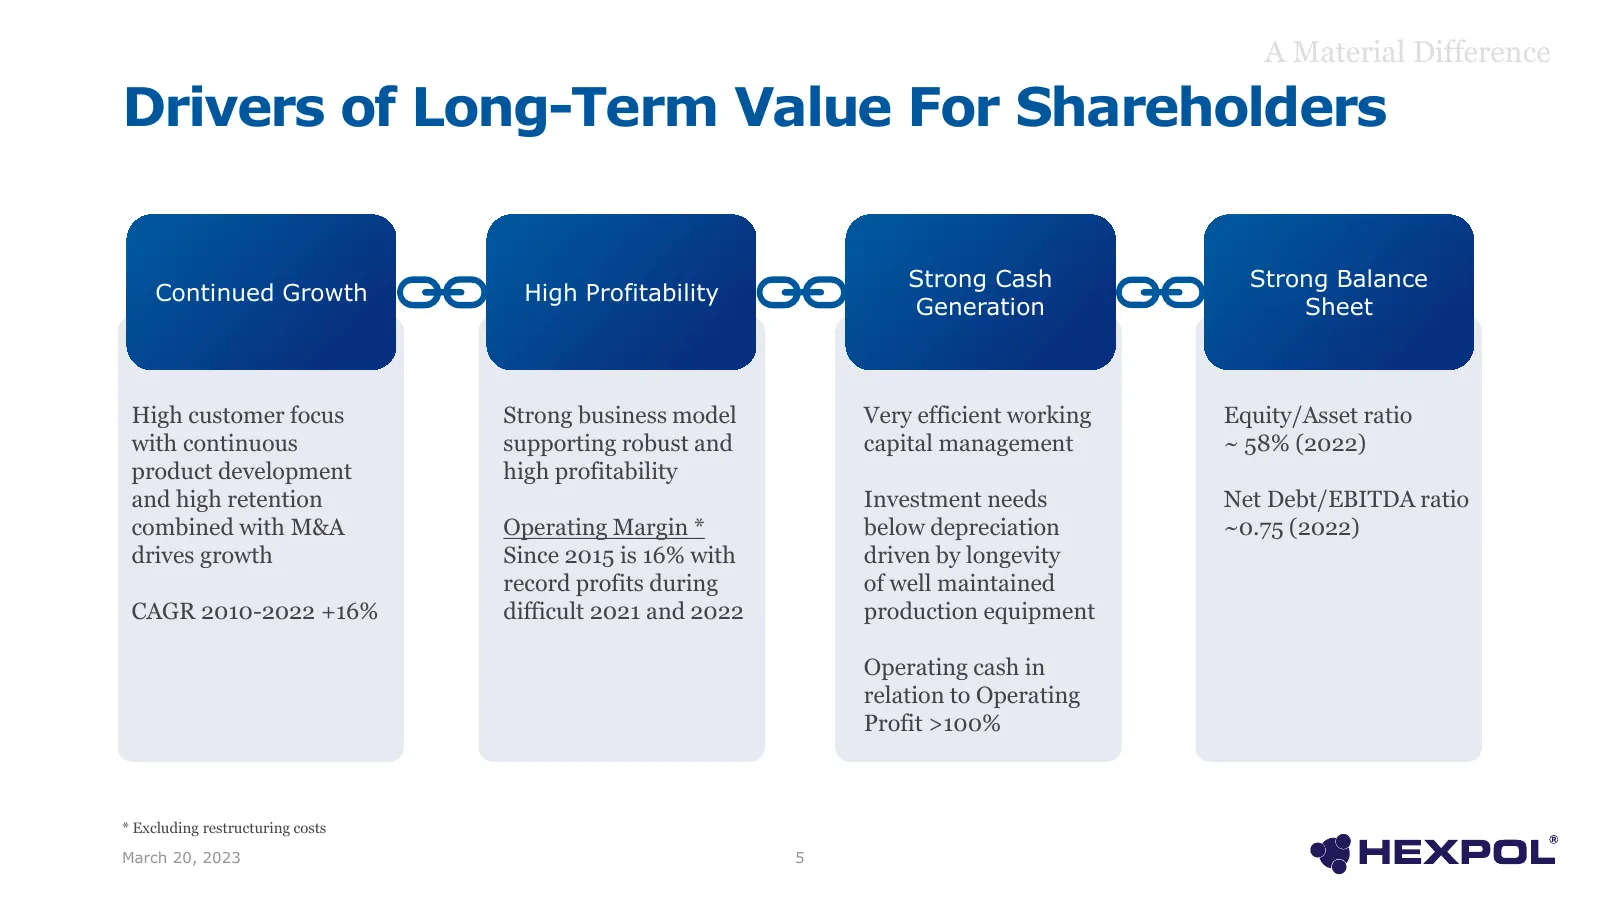
Slide 5: Drivers of Long-Term Value For Shareholders
A Material Difference Drivers of Long-Term Value For Shareholders Strong Cash Strong Balance Continued Growth High Profitability Generation Sheet High customer focus Strong business model Very efficient working Equity/Asset ratio with continuous supporting robust and capital management ~ 58% (2022)
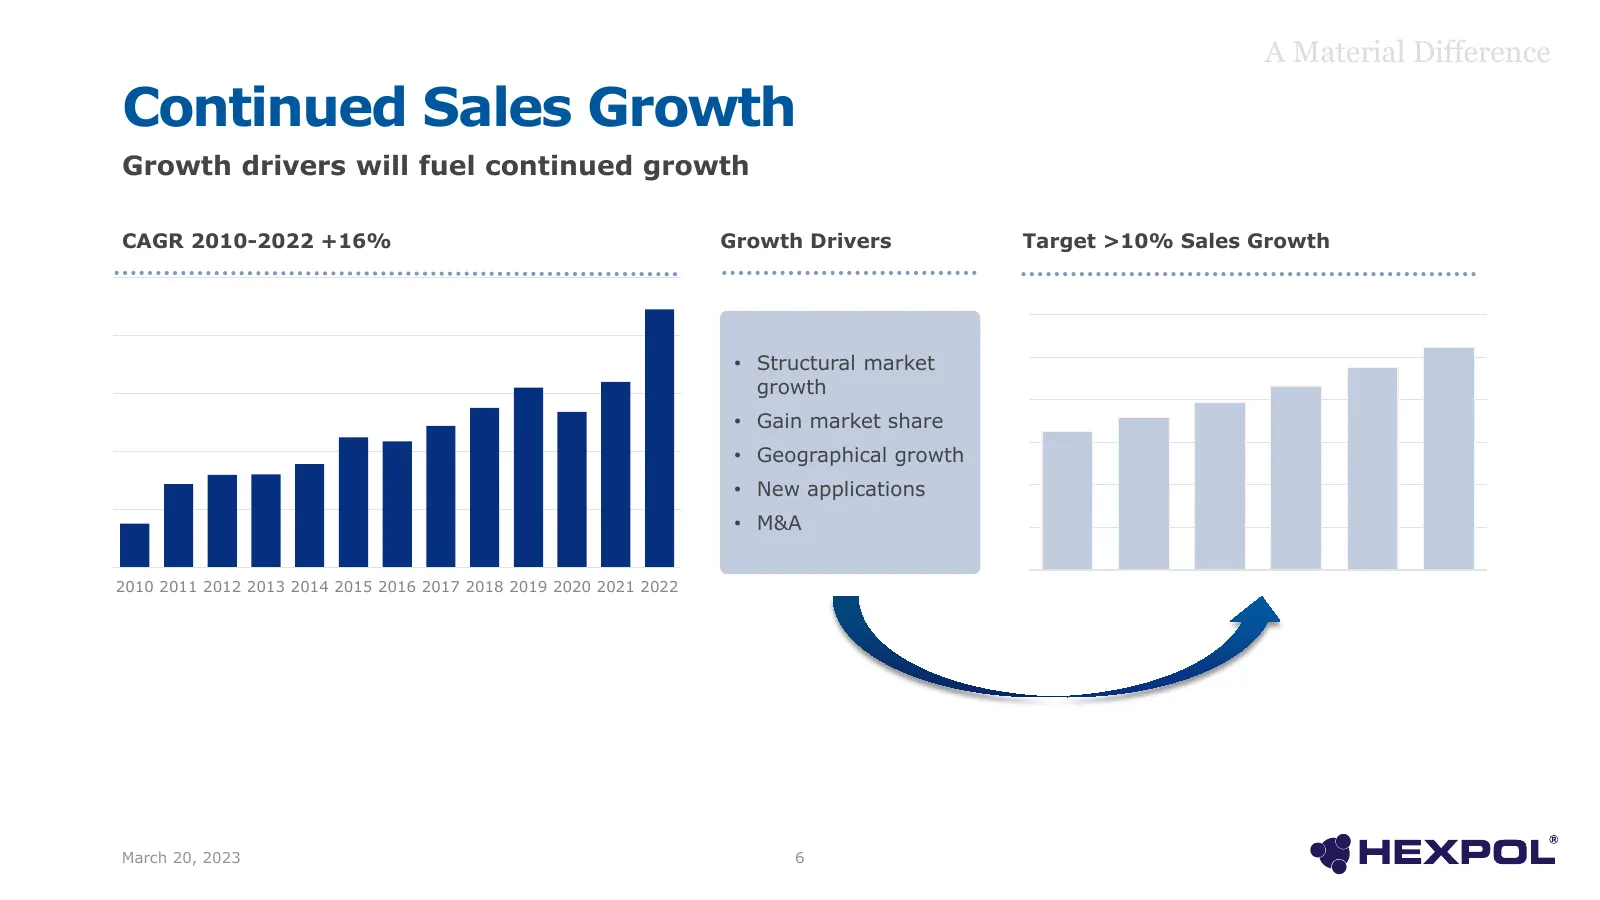
Slide 6: Continued Sales Growth
A Material Difference Continued Sales Growth Growth drivers will fuel continued growth CAGR 2010-2022 +16% Growth Drivers Target >10% Sales Growth • Structural market growth • Gain market share • Geographical growth • New applications • M&A 2010 2011 2012 2013 2014 2015 2016 2017 2018 2019 2020 2021
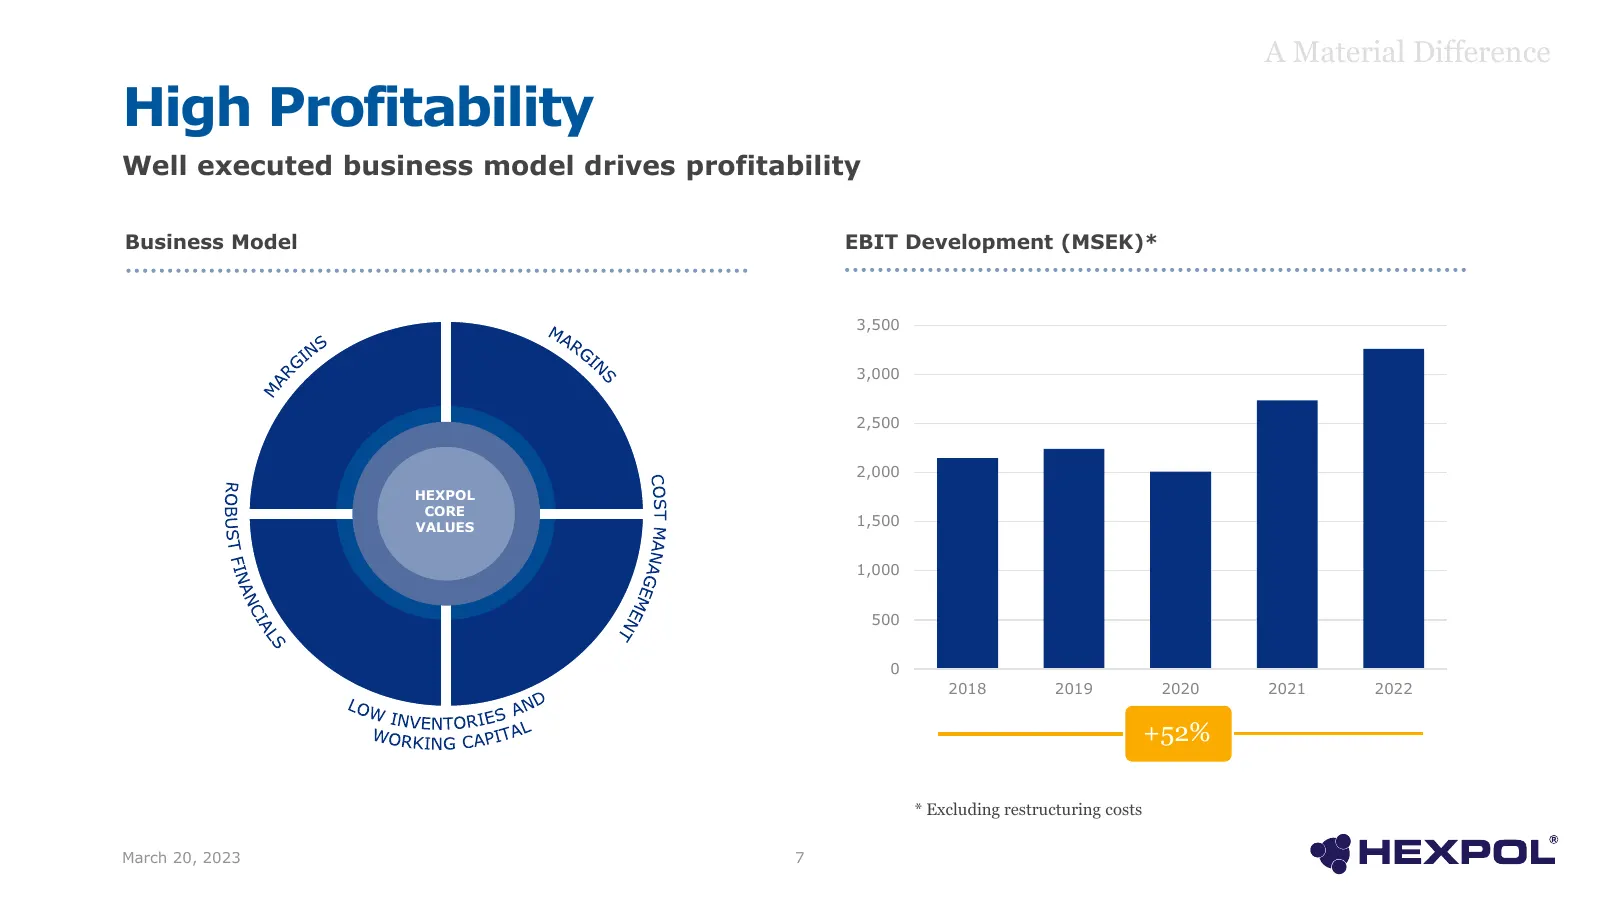
Slide 7: High Profitability
A Material Difference High Profitability Well executed business model drives profitability Business Model EBIT Development (MSEK)* 3,500 3,000 2,500 2,000 HEXPOL CORE VALUES 1,500 1,000 500 0 2018 2019 2020 2021 2022 +52% * Excluding restructuring costs March 20, 2023 7
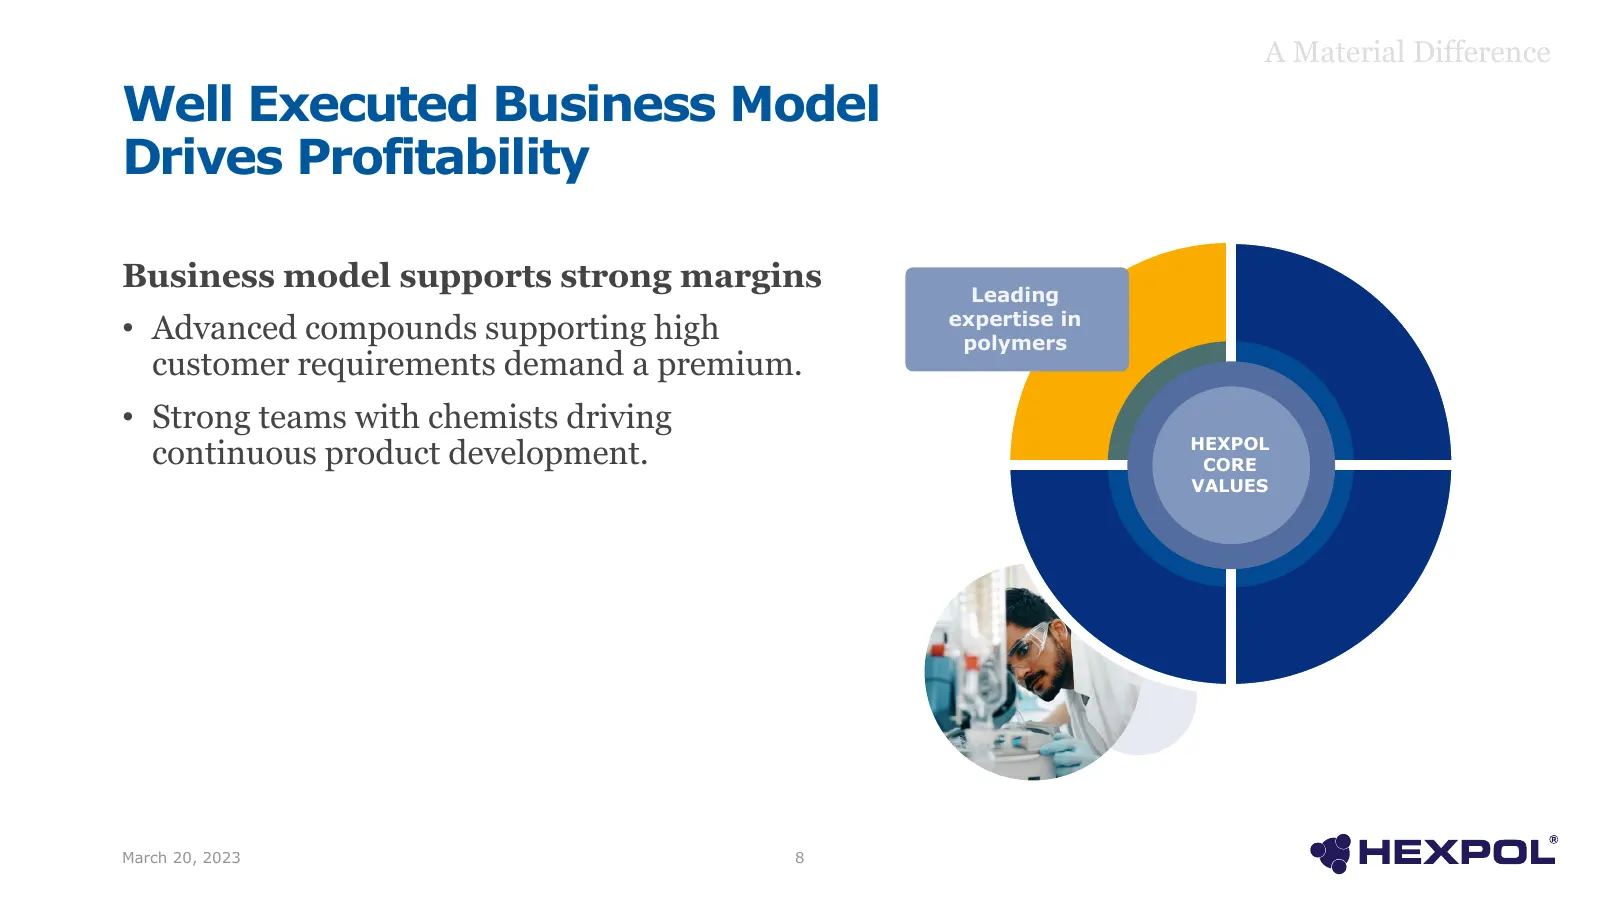
Slide 8: Well Executed Business Model Drives Profitability
A Material Difference Well Executed Business Model Drives Profitability Business model supports strong margins Leading • Advanced compounds supporting high expertise in polymers customer requirements demand a premium. • Strong teams with chemists driving HEXPOL continuous product development. CORE V
Slide 9: Well Executed Business Model Drives Profitability
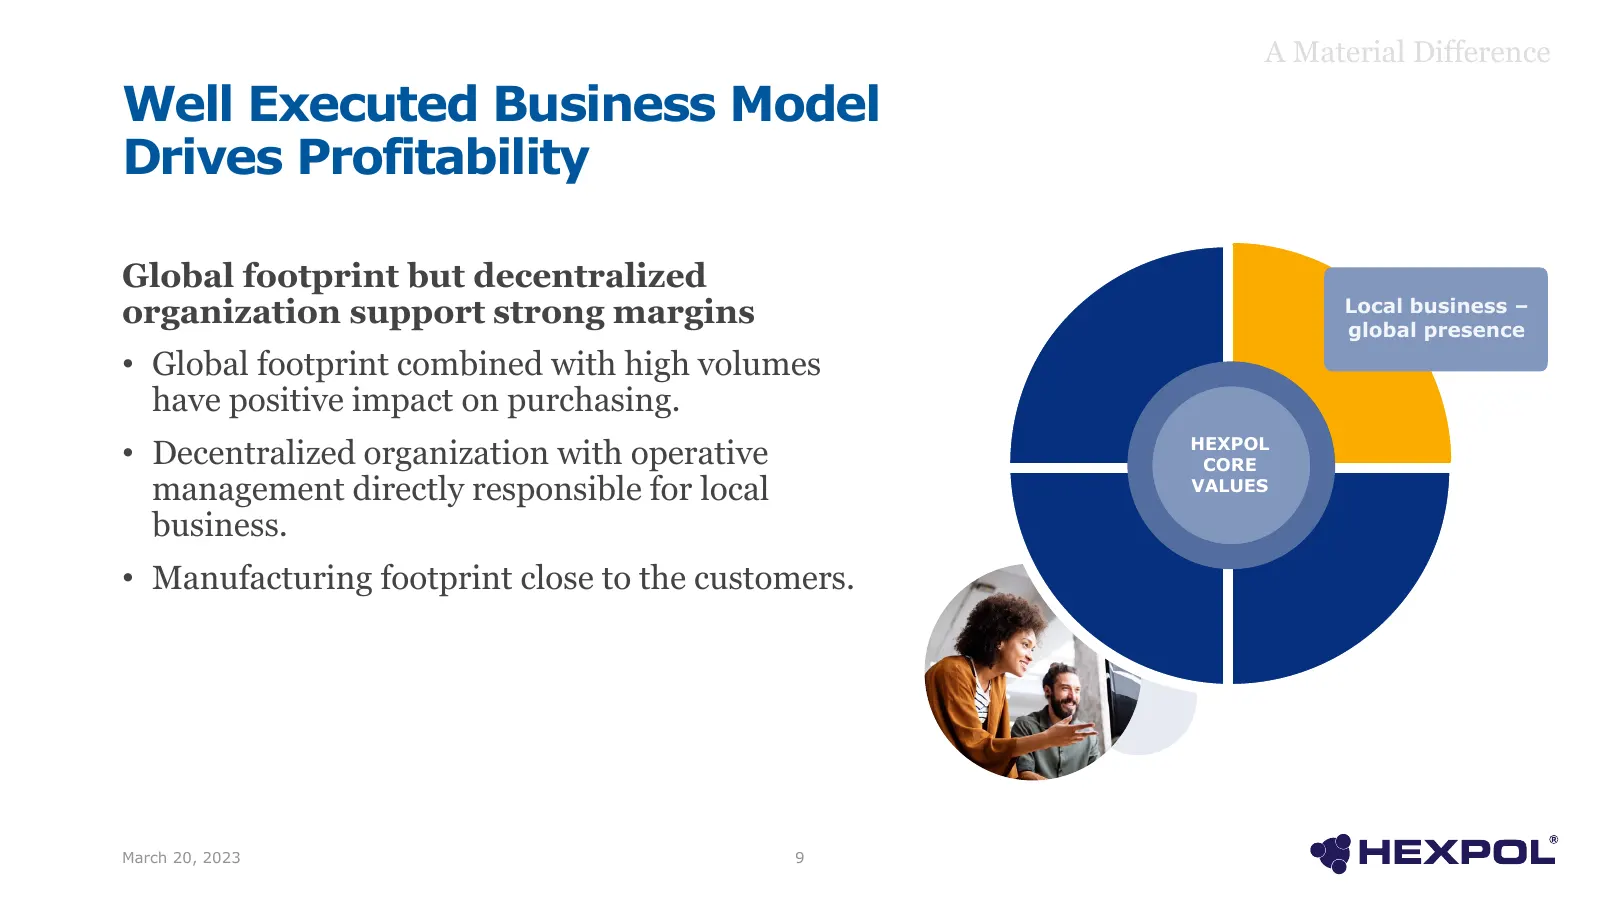
A Material Difference Well Executed Business Model Drives Profitability Global footprint but decentralized organization support strong margins Local business – global presence • Global footprint combined with high volumes have positive impact on purchasing. • Decentralized organization with operativ
Slide 10: Well Executed Business Model Drives Profitability
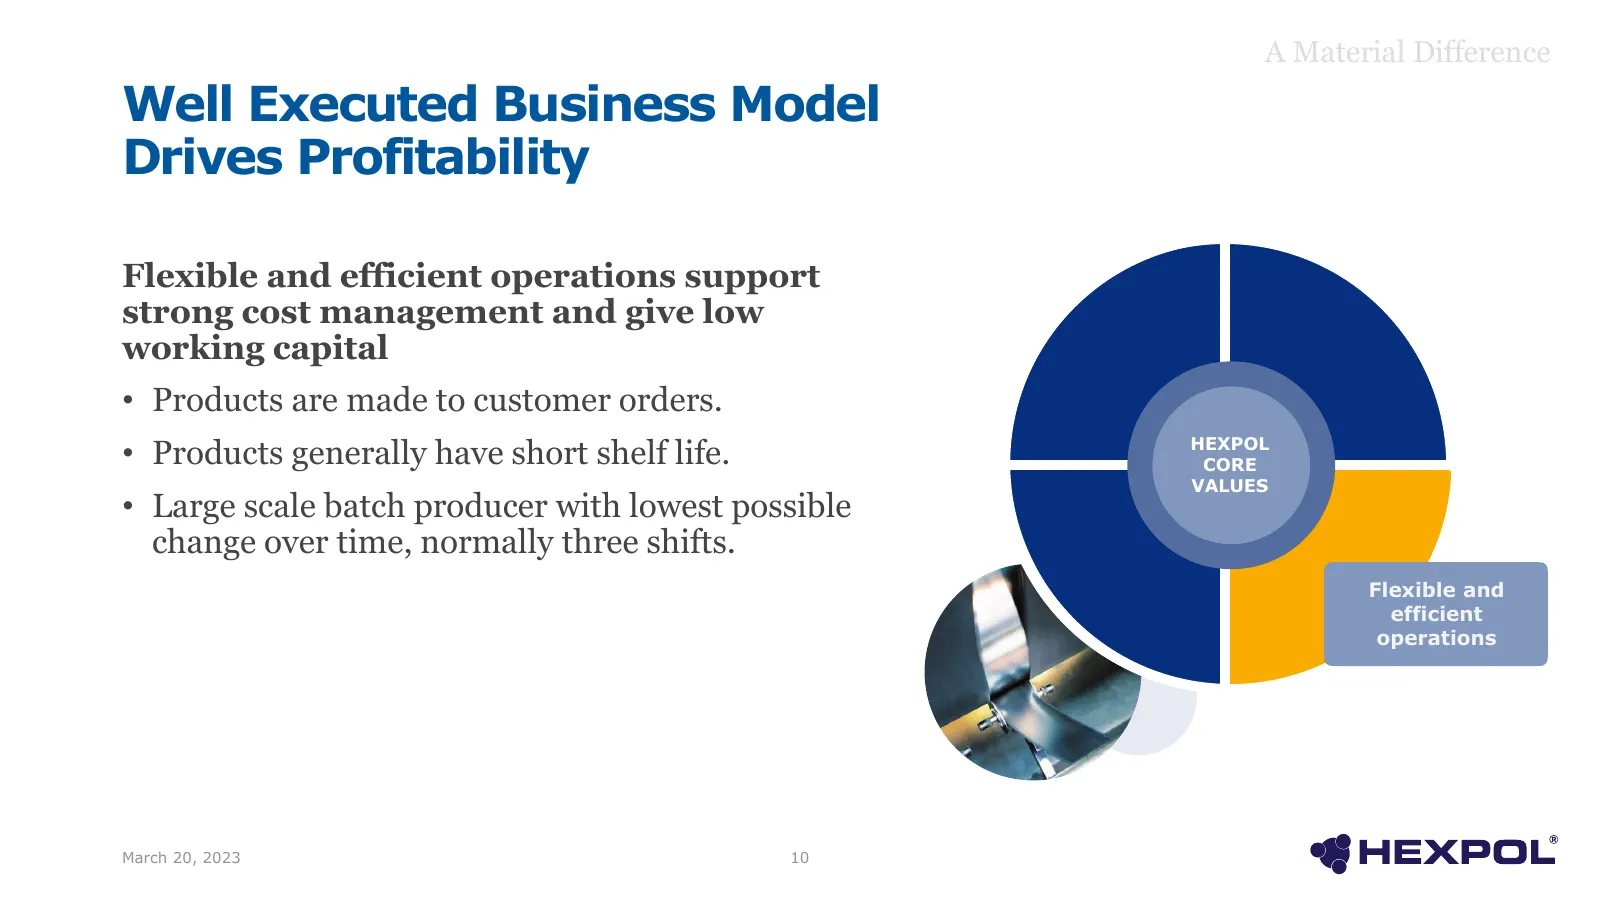
A Material Difference Well Executed Business Model Drives Profitability Flexible and efficient operations support strong cost management and give low working capital • Products are made to customer orders. • Products generally have short shelf life. HEXPOL CORE VALUES • Large scale batch producer wi
Slide 11: Well Executed Business Model Drives Profitability
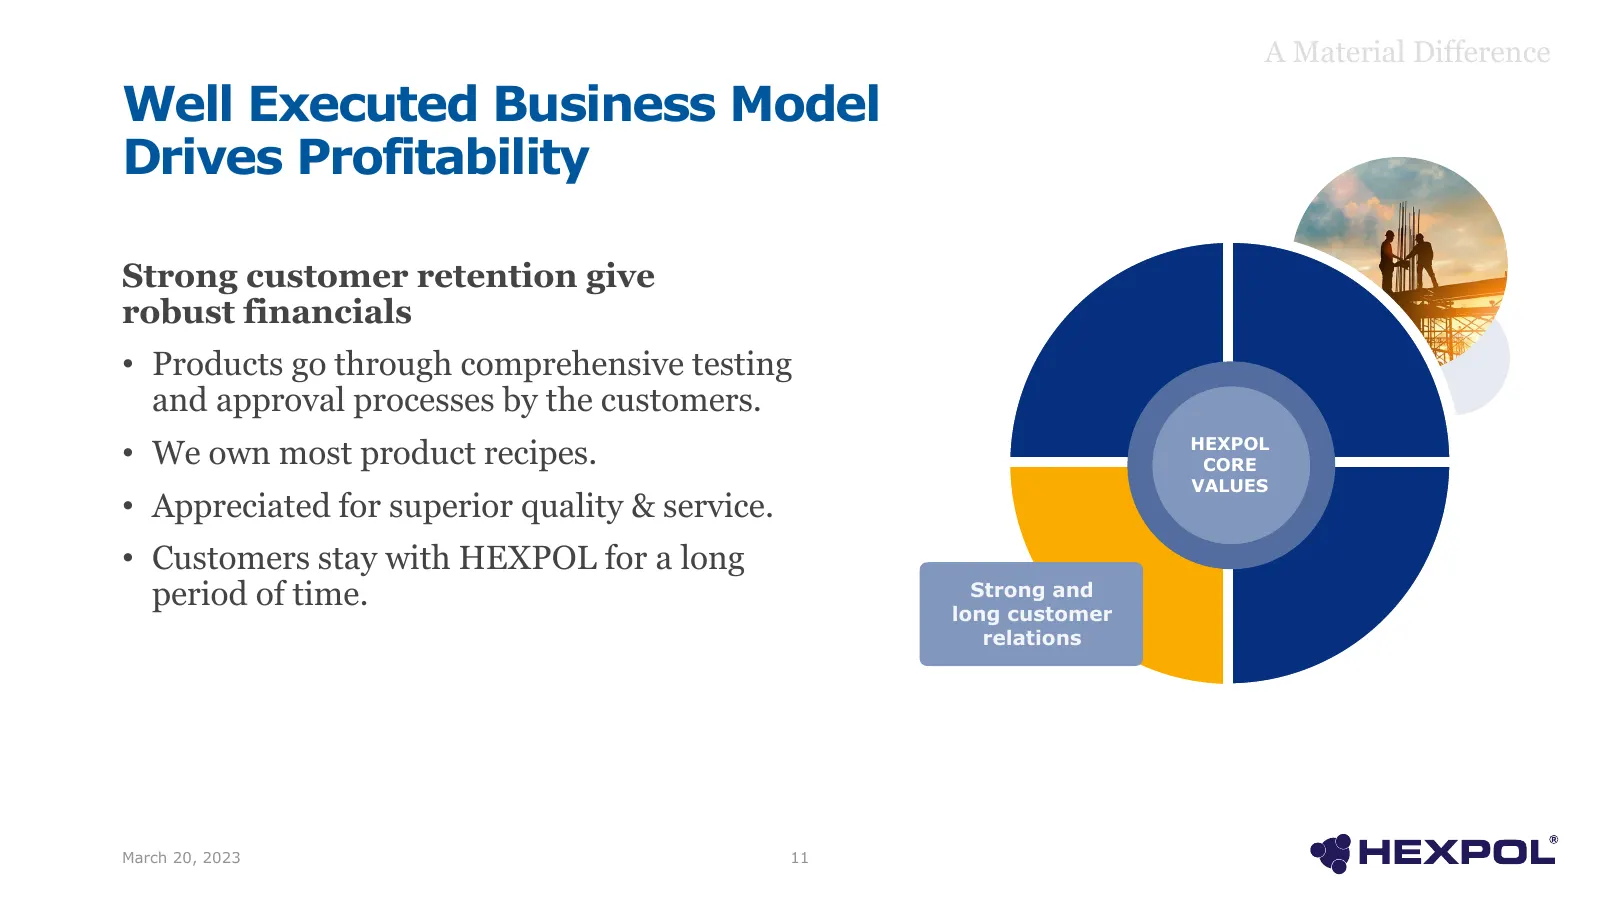
A Material Difference Well Executed Business Model Drives Profitability Strong customer retention give robust financials • Products go through comprehensive testing and approval processes by the customers. • We own most product recipes. HEXPOL CORE VALUES • Appreciated for superior quality & service
Slide 12: Financial Resilience Through Business Set Up
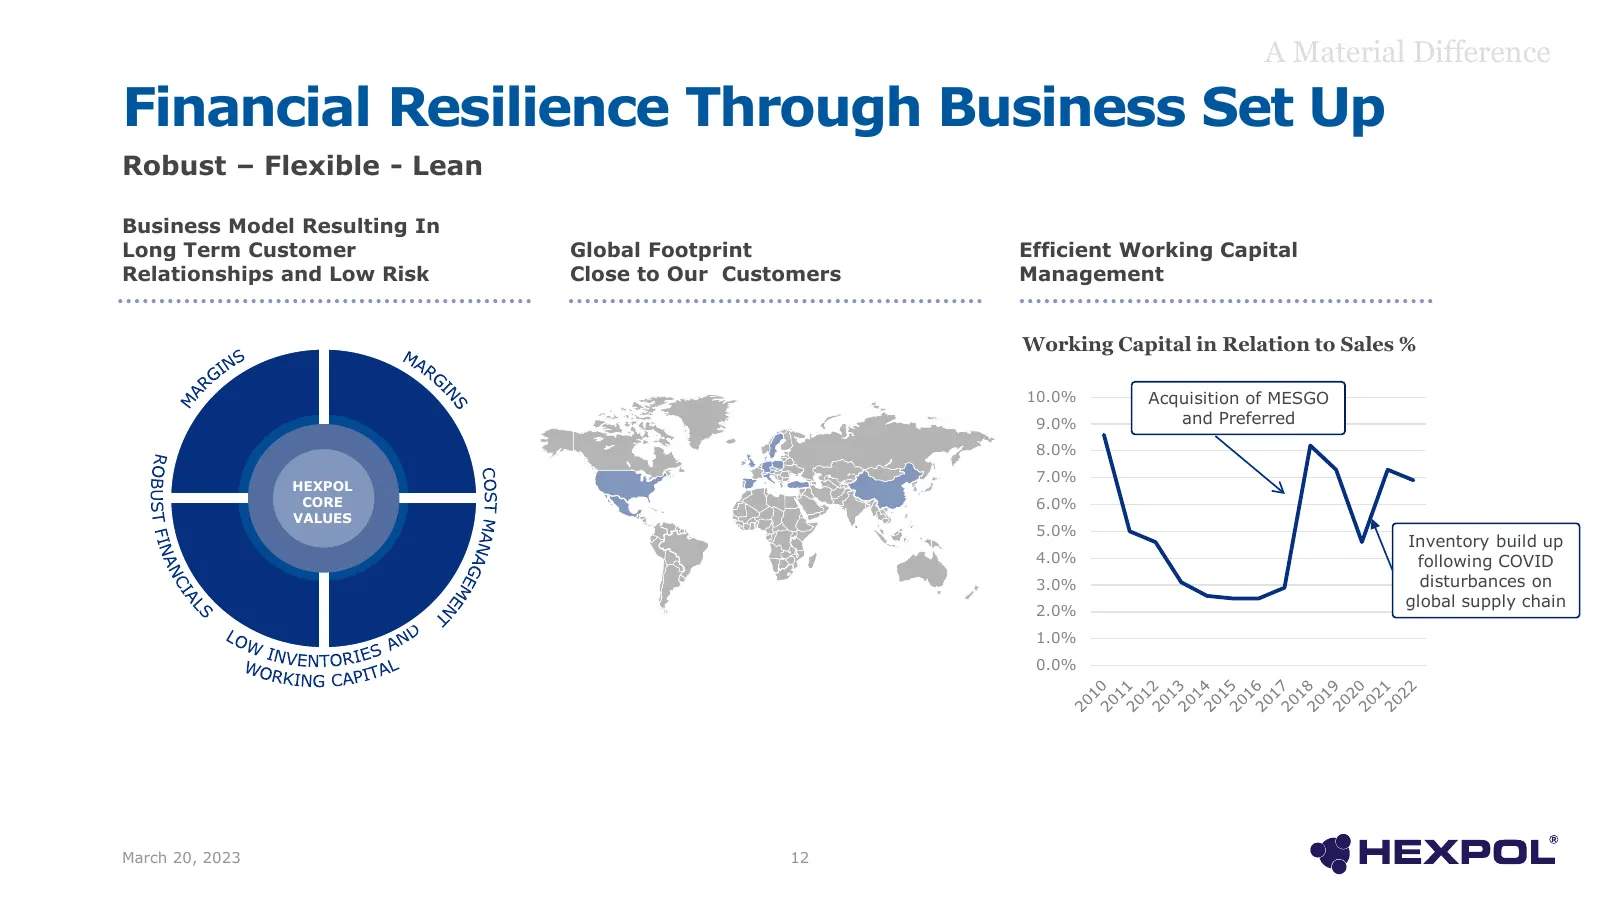
A Material Difference Financial Resilience Through Business Set Up Robust – Flexible - Lean Business Model Resulting In Long Term Customer Global Footprint Efficient Working Capital Relationships and Low Risk Close to Our Customers Management Working Capital in Relation to Sales % 10.0% Acquisition
Slide 13: Strong Operating Cash Generation
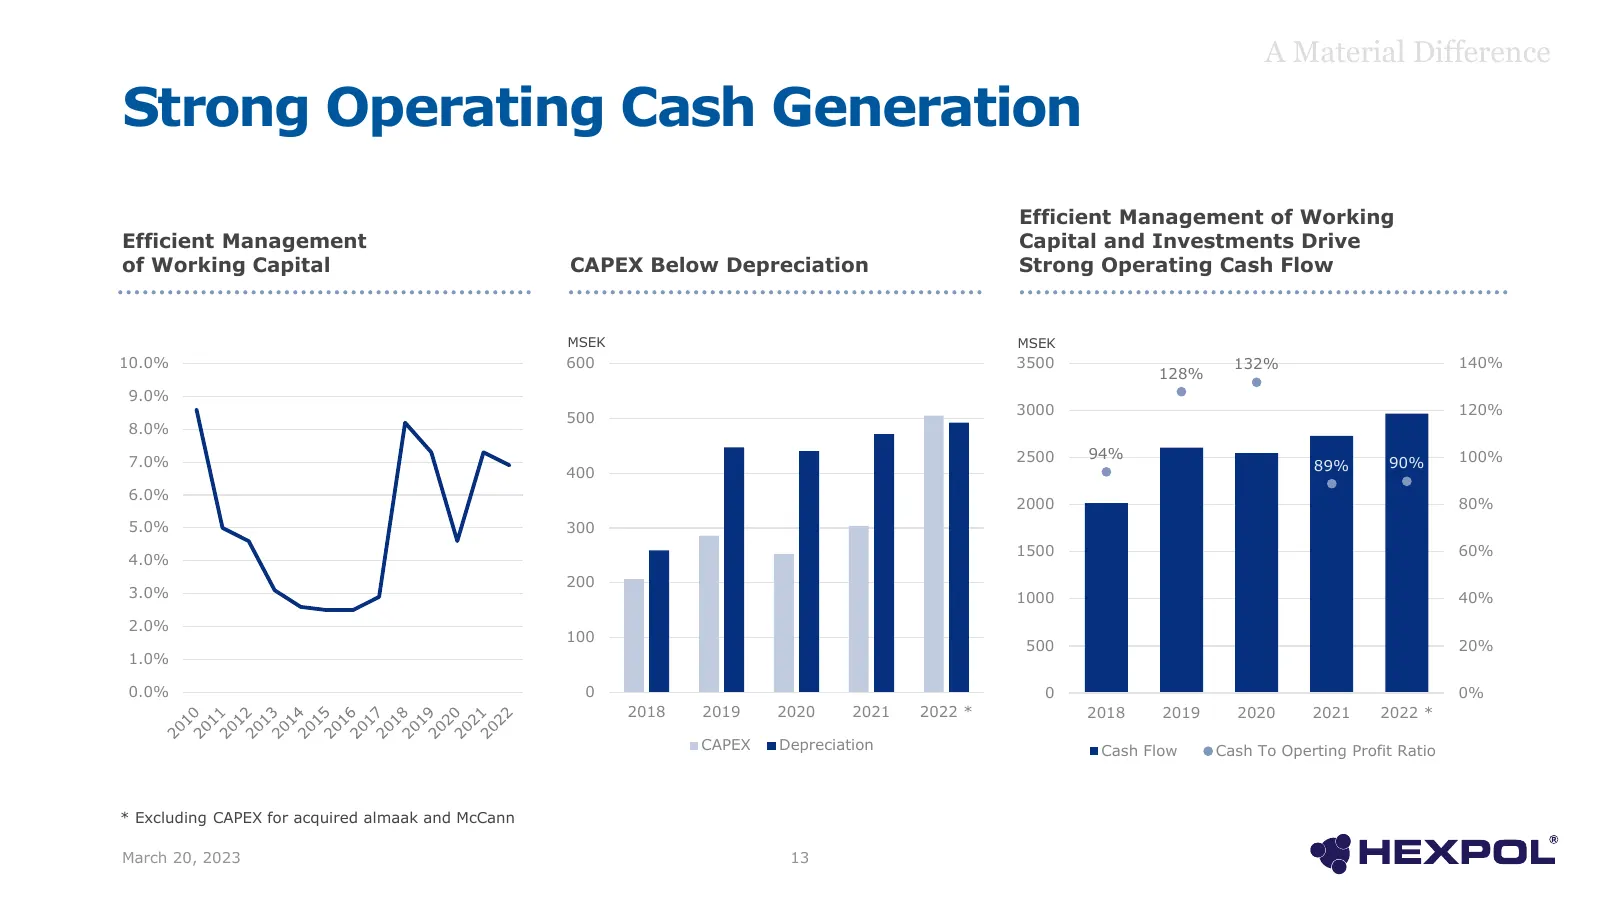
A Material Difference Strong Operating Cash Generation Efficient Management of Working Efficient Management Capital and Investments Drive of Working Capital CAPEX Below Depreciation Strong Operating Cash Flow MSEK MSEK 10.0% 600 3500 132% 140% 128% 9.0% 3000 120% 500 8.0% 2500 94% 100% 7.0% 89% 90%
Slide 14: Strong Balance Sheet
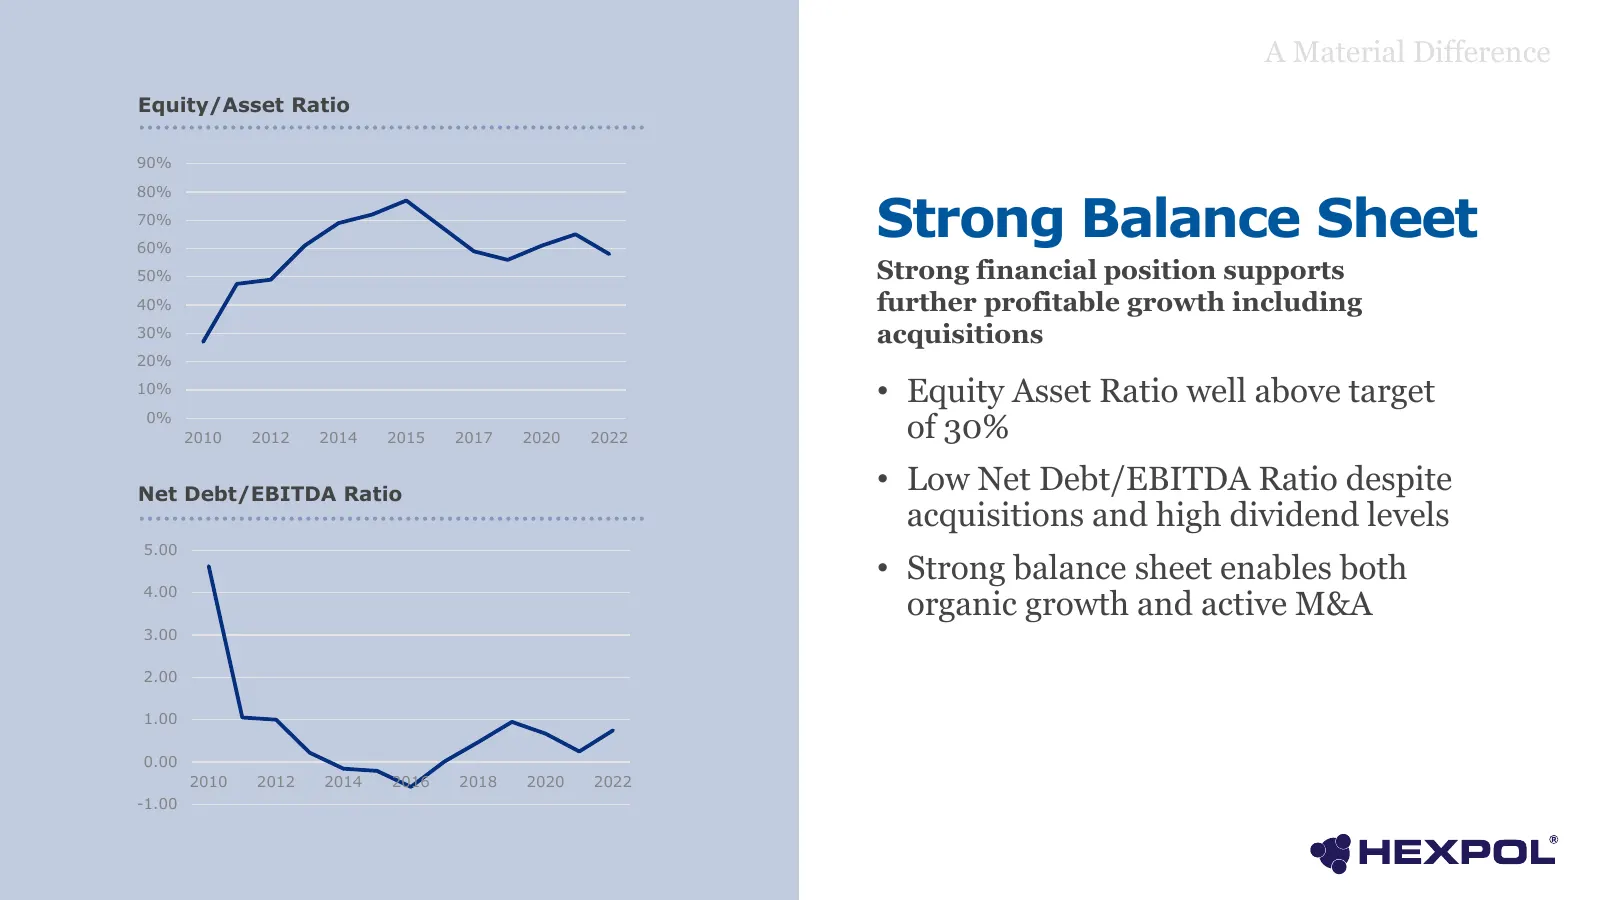
A Material Difference Equity/Asset Ratio 90% Strong Balance Sheet 80% 70% 60% 50% Strong financial position supports 40% further profitable growth including 30% acquisitions 20% 10% • Equity Asset Ratio well above target 0% 2010 2012 2014 2015 2017 2020 2022 of 30% Net Debt/EBITDA Ratio • Low Net De
Slide 15: investors.HEXPOL.com
A Material Difference investors.HEXPOL.com March 20, 2023 15
Source: Internet Archive copy of investors.hexpol.com
More decks from Hexpol AB Class B
 Q3 2026 Earnings Presentation21 slides · Oct 23, 2026
 Q2 2026 Earnings Presentation20 slides · Jul 20, 2026
 Q1 2026 Earnings Presentation24 slides · May 4, 2026
 Q4 2025 Earnings Presentation20 slides · Jan 29, 2026
 Q3 2025 Earnings Presentation18 slides · Oct 24, 2025
 Q2 2025 Earnings Presentation21 slides · Jul 18, 2025