Superior Well Services — A.G. Edwards Energy Conference (March 2006)
31 slides from Superior Well Services's conference presentation, Mar 15, 2006
Slide 1: A.G. Edwards Energy Conference
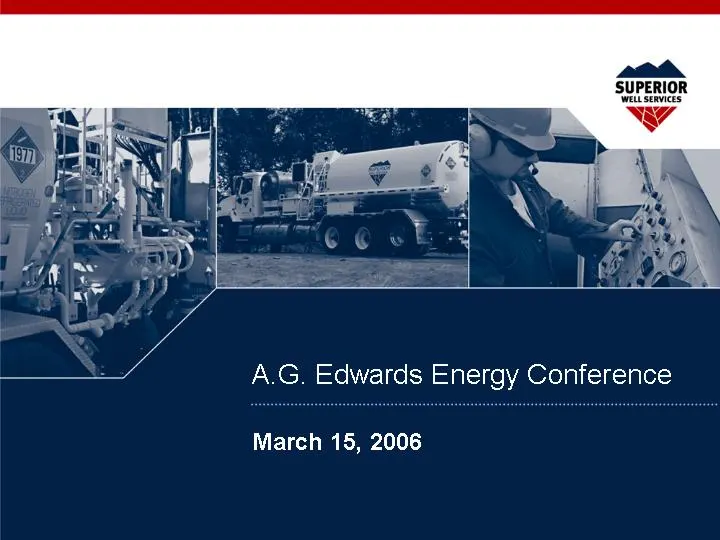
A.G. Edwards Energy Conference
Slide 2: Forward-Looking Statements
Forward-Looking Statements This presentation includes "forward-looking statements" within the meaning of Section 27A of the Securities Act of 1933, as amended, and Section 21E of the Securities Act of 1934, as amended. All statements, other than statements of historical facts, included in this prese
Slide 3: Offering Summary
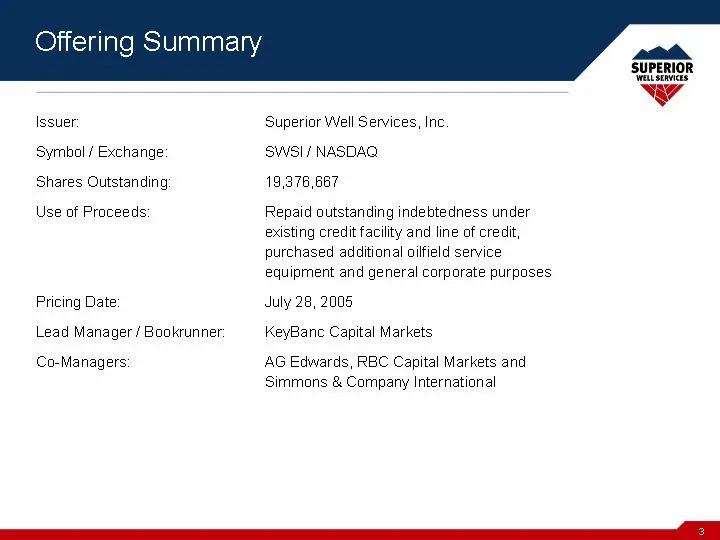
Offering Summary Issuer: Symbol / Exchange: Shares Outstanding: Use of Proceeds: Pricing Date: Lead Manager / Bookrunner: Co-Managers: Superior Well Services, Inc. SWSI / NASDAQ 19,376,667 Repaid outstanding indebtedness under existing credit facility and line of credit, purchased additional oilfiel
Slide 4: Management Representatives
David E. Wallace Chief Executive Officer Management Representatives Thomas W. Stoelk Chief Financial Officer
Slide 5: Executive Management Team
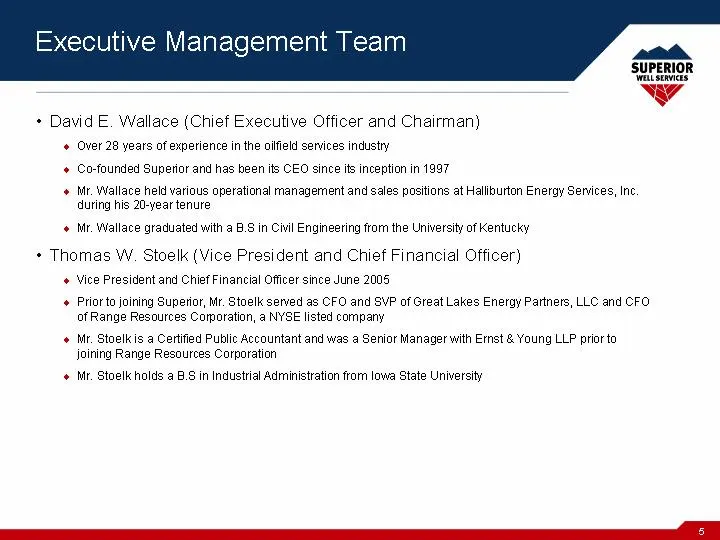
Executive Management Team David E. Wallace (Chief Executive Officer and Chairman) Over 28 years of experience in the oilfield services industry Co-founded Superior and has been its CEO since its inception in 1997 Mr. Wallace held various operational management and sales positions at Halliburton Ener
Slide 6: Strong Operating Team
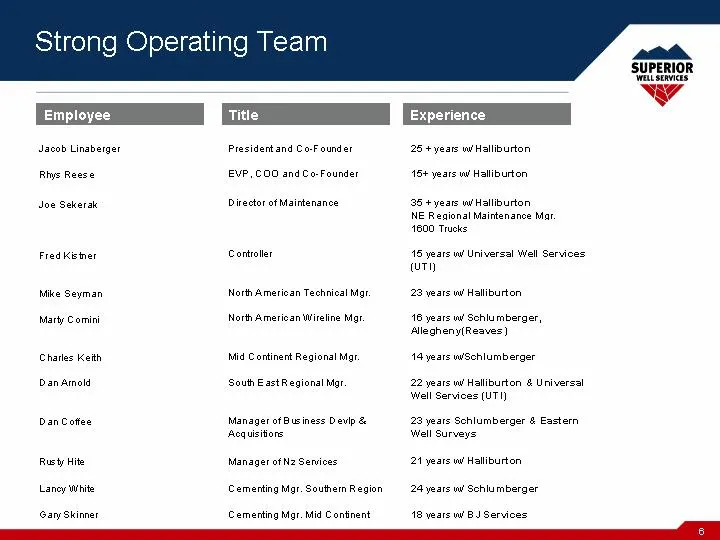
Experience Title Employee Strong Operating Team
Slide 7: History
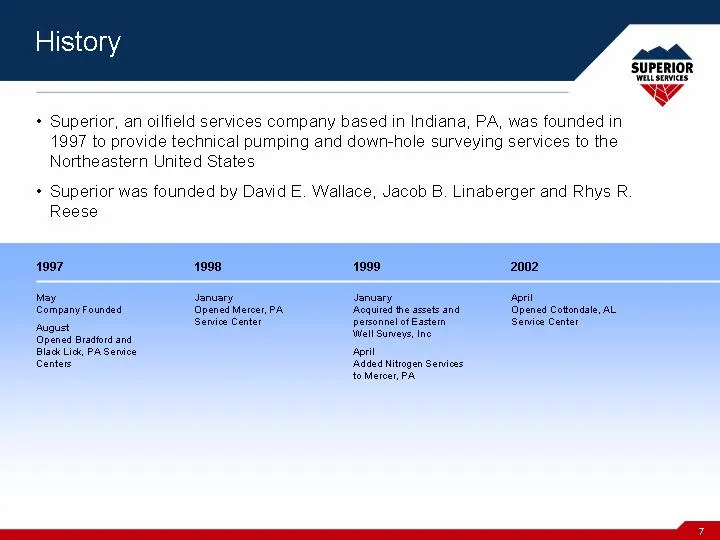
May Company Founded August Opened Bradford and Black Lick, PA Service Centers 1997 1998 1999 2002 History Superior, an oilfield services company based in Indiana, PA, was founded in 1997 to provide technical pumping and down-hole surveying services to the Northeastern United States Superior was foun
Slide 8: History Continued
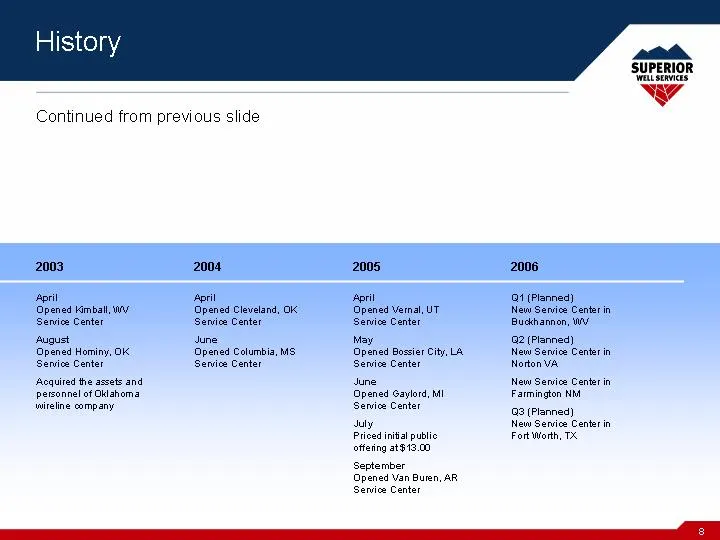
April Opened Kimball, WV Service Center August Opened Hominy, OK Service Center Acquired the assets and personnel of Oklahoma wireline company 2003 2004 2005 2006 April Opened Cleveland, OK Service Center June Opened Columbia, MS Service Center April Opened Vernal, UT Service Center May Opened Bossi
Slide 9: Current Operations
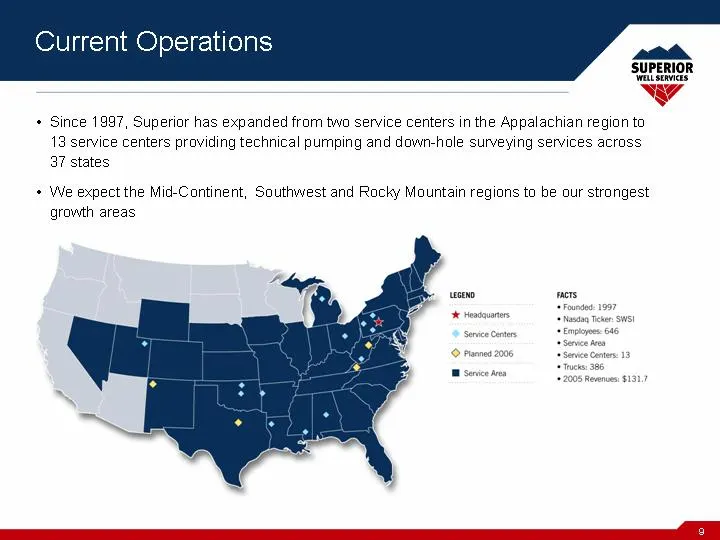
Current Operations Since 1997, Superior has expanded from two service centers in the Appalachian region to 13 service centers providing technical pumping and down-hole surveying services across 37 states We expect the Mid-Continent, Southwest and Rocky Mountain regions to be our strongest growth are
Slide 10: Superior Well Services Overview
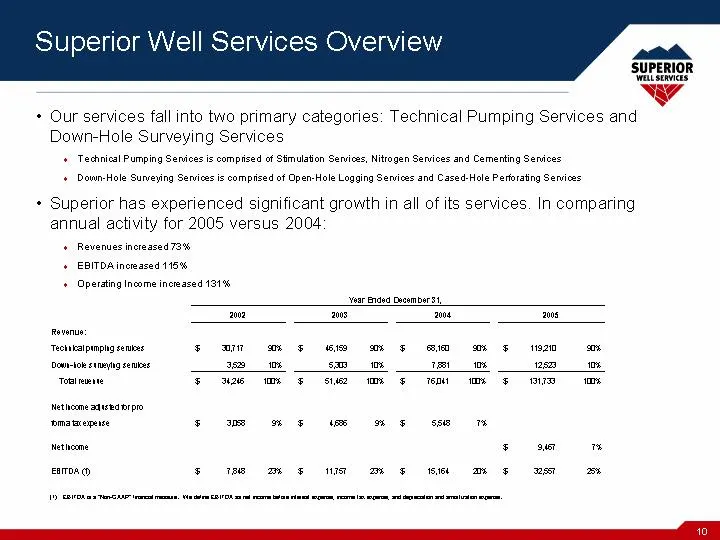
Superior Well Services Overview Our services fall into two primary categories: Technical Pumping Services and Down-Hole Surveying Services Technical Pumping Services is comprised of Stimulation Services, Nitrogen Services and Cementing Services Down-Hole Surveying Services is comprised of Open-Hole
Slide 11: Breadth of Customer Base
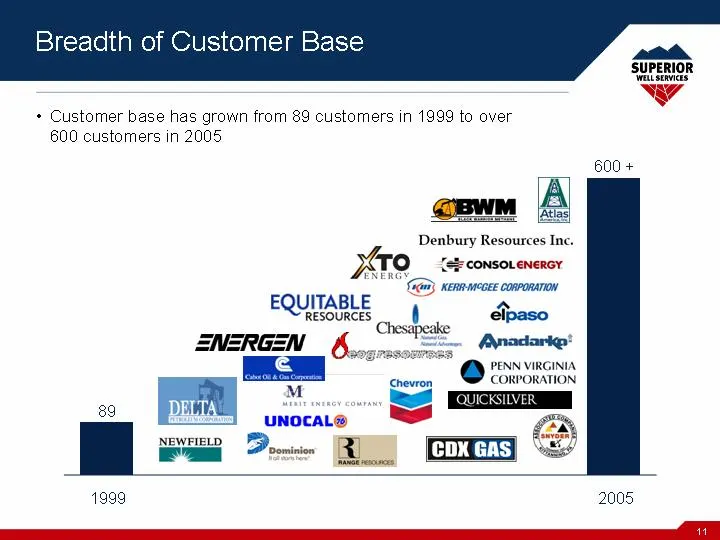
Breadth of Customer Base Customer base has grown from 89 customers in 1999 to over 600 customers in 2005 89 600 + 1999 2005
Slide 12: Industry Growth Drivers
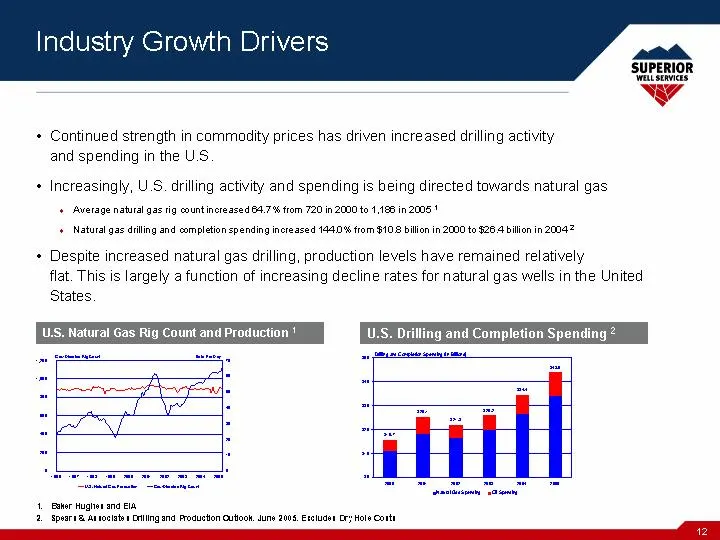
Continued strength in commodity prices has driven increased drilling activity and spending in the U.S. Increasingly, U.S. drilling activity and spending is being directed towards natural gas Average natural gas rig count increased 64.7% from 720 in 2000 to 1,186 in 2005 1 Natural gas drilling and co
Slide 13: Competitive Strengths
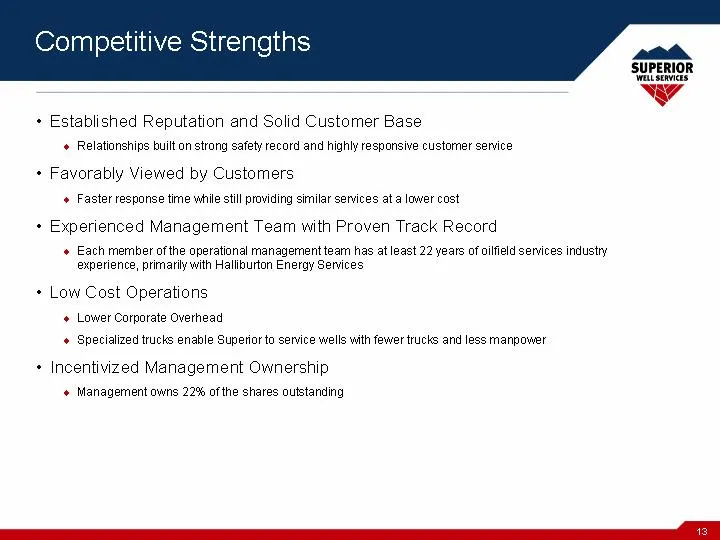
Competitive Strengths Established Reputation and Solid Customer Base Relationships built on strong safety record and highly responsive customer service Favorably Viewed by Customers Faster response time while still providing similar services at a lower cost Experienced Management Team with Proven Tr
Slide 14: Business Strategy
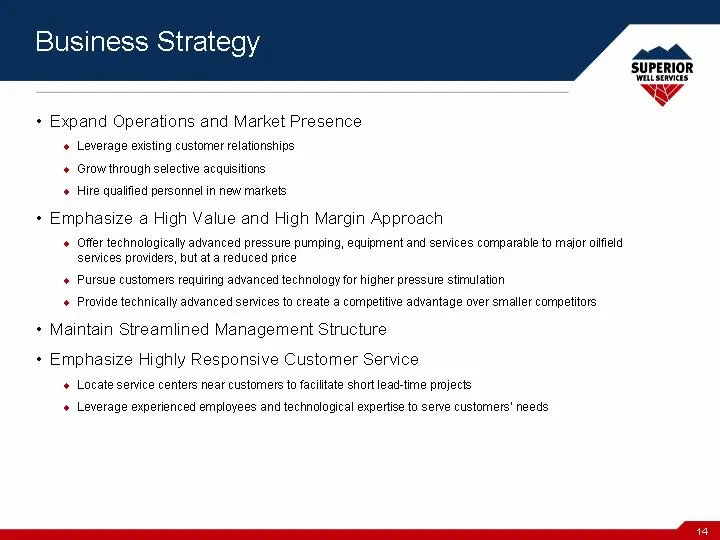
Business Strategy Expand Operations and Market Presence Leverage existing customer relationships Grow through selective acquisitions Hire qualified personnel in new markets Emphasize a High Value and High Margin Approach Offer technologically advanced pressure pumping, equipment and services compara
Slide 15: Revenue by Region and Growth Strategy
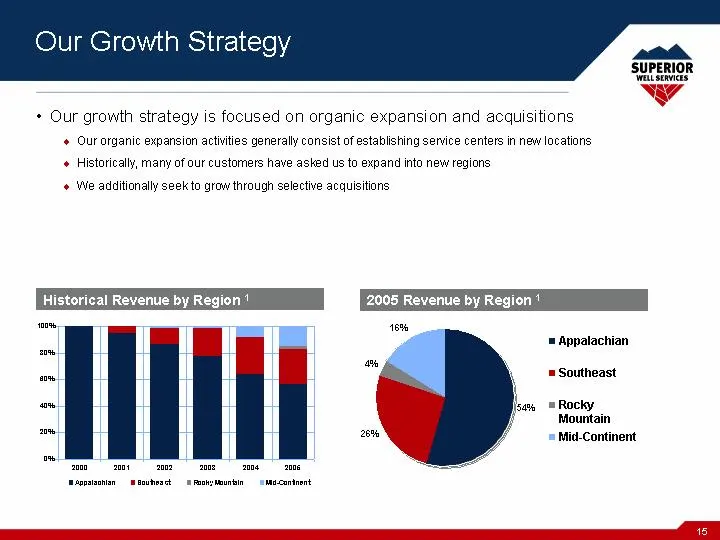
Appalachian Southeast Rocky Mountain Mid-Continent East 54.4 26 3.6 16 2005 Revenue by Region 1 Historical Revenue by Region 1 Our Growth Strategy Our growth strategy is focused on organic expansion and acquisitions Our organic expansion activities generally consist of establishing service centers i
Slide 16: Growth Strategy - Cottondale, AL Case Study
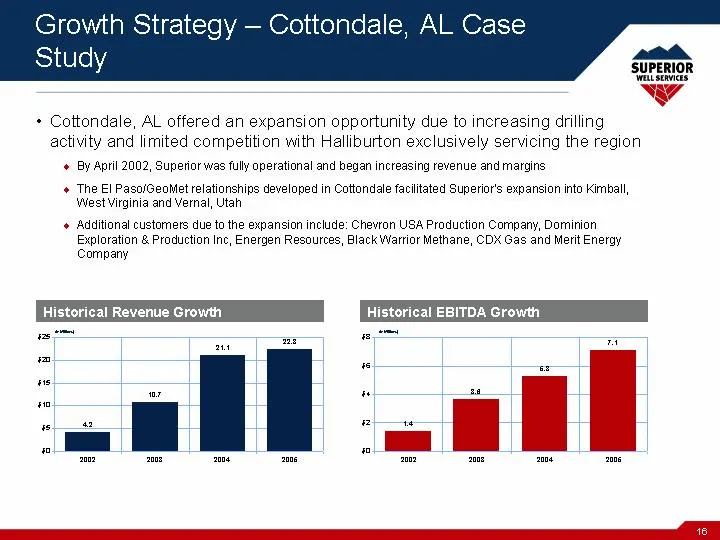
Historical Revenue Growth Historical EBITDA Growth Growth Strategy - Cottondale, AL Case Study Cottondale, AL offered an expansion opportunity due to increasing drilling activity and limited competition with Halliburton exclusively servicing the region By April 2002, Superior was fully operational a
Slide 17: Growth Strategy - Rocky Mountain Case Study
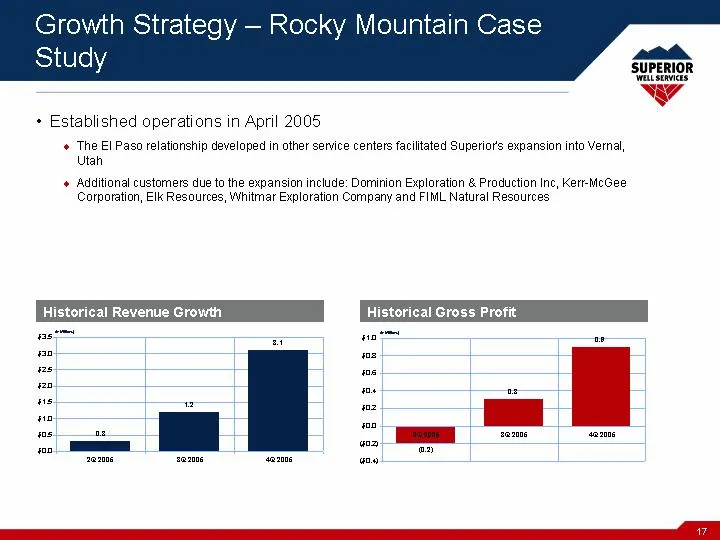
Historical Revenue Growth Historical Gross Profit Growth Strategy - Rocky Mountain Case Study Established operations in April 2005 The El Paso relationship developed in other service centers facilitated Superior's expansion into Vernal, Utah Additional customers due to the expansion include: Dominio
Slide 18: Vernal, UT Frac Job
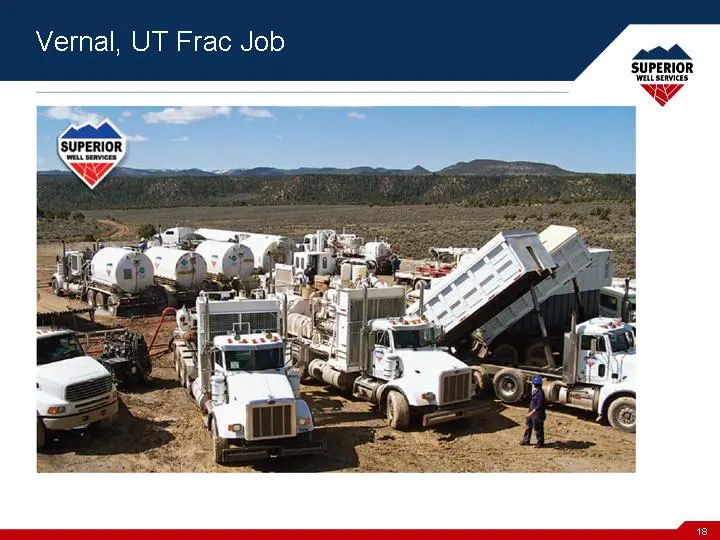
Vernal, UT Frac Job Vernal, UT Frac Job
Slide 19: Operations Overview
ey Spent Ww Operations Overview
Slide 20: Revenue by Services
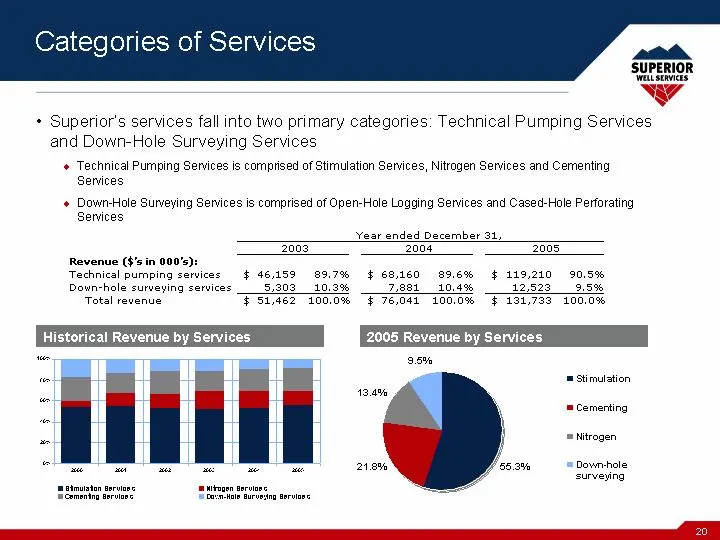
Stimulation Cementing Nitrogen Down-hole surveying East 55.3 21.8 13.4 9.5 2000 2001 2002 2003 2004 2005 Stimulation Services 54 54.8 53.4 52.2 52.4 55.3 Nitrogen Services 5.6 12.1 13.3 16.6 16.7 13.4 Cementing Services 22.3 19.1 21 19.4 20.5 21.8 Down-Hole Surveying Services 18.1 14 12.3 11.8 10.4
Slide 21: Stimulation Services
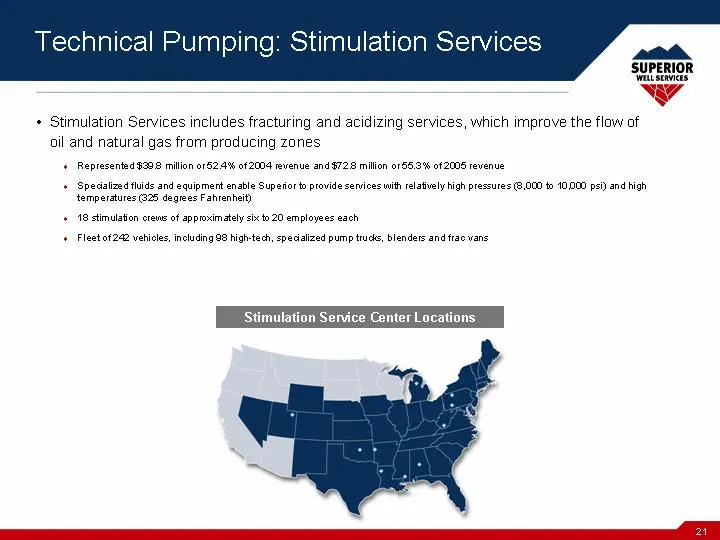
Stimulation Service Center Locations Technical Pumping: Stimulation Services Stimulation Services includes fracturing and acidizing services, which improve the flow of oil and natural gas from producing zones Represented $39.8 million or 52.4% of 2004 revenue and $72.8 million or 55.3% of 2005 reven
Slide 22: Technical Pumping: Nitrogen Services
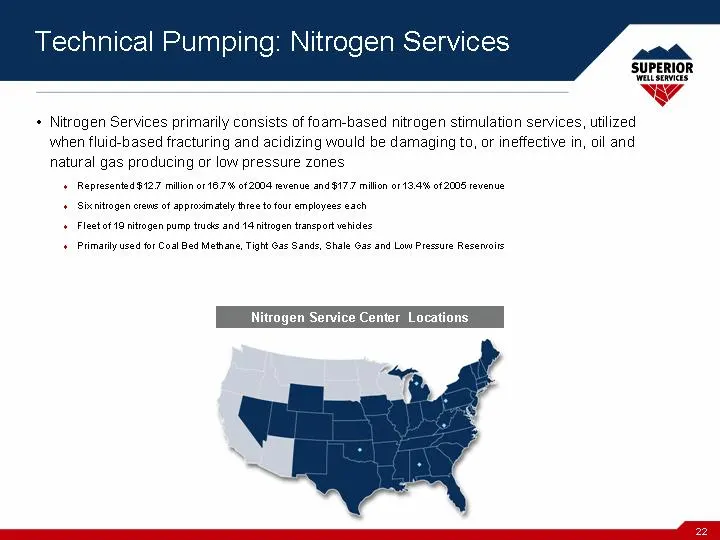
Technical Pumping: Nitrogen Services Nitrogen Services primarily consists of foam-based nitrogen stimulation services, utilized when fluid-based fracturing and acidizing would be damaging to, or ineffective in, oil and natural gas producing or low pressure zones Represented $12.7 million or 16.7% of
Slide 23: Technical Pumping: Cementing Services
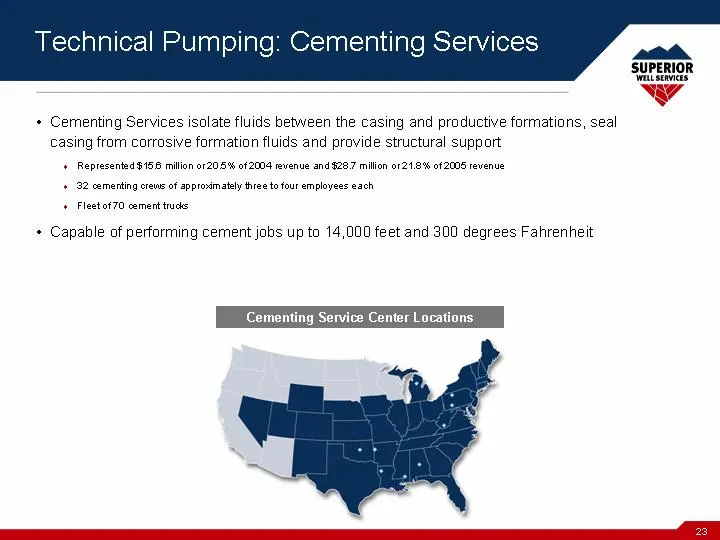
Technical Pumping: Cementing Services Cementing Services isolate fluids between the casing and productive formations, seal casing from corrosive formation fluids and provide structural support Represented $15.6 million or 20.5% of 2004 revenue and $28.7 million or 21.8% of 2005 revenue 32 cementing
Slide 24: Down-Hole Surveying Services
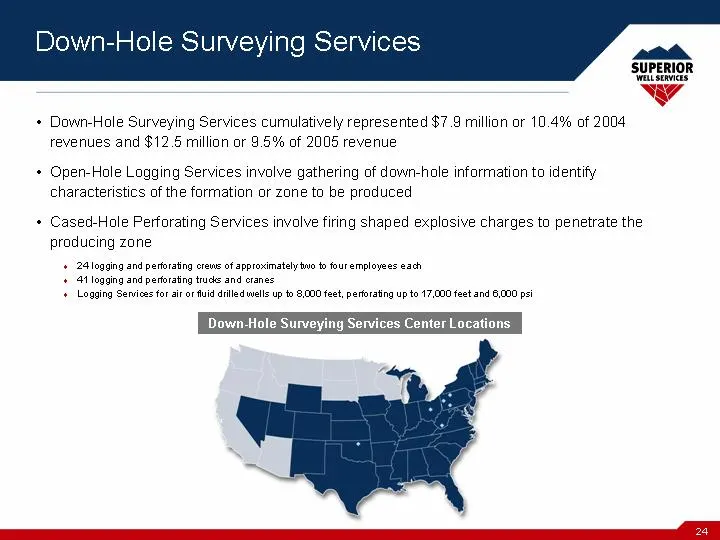
Down-Hole Surveying Services Down-Hole Surveying Services cumulatively represented $7.9 million or 10.4% of 2004 revenues and $12.5 million or 9.5% of 2005 revenue Open-Hole Logging Services involve gathering of down-hole information to identify characteristics of the formation or zone to be produce
Slide 25: Equipment Overview
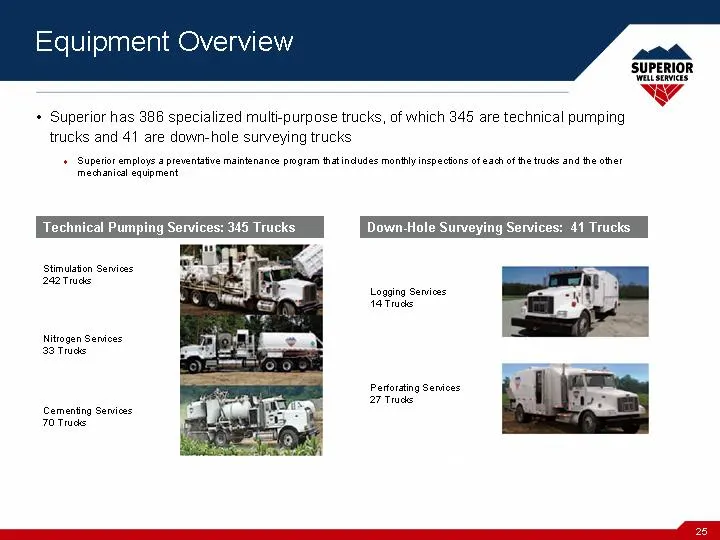
Equipment Overview Superior has 386 specialized multi-purpose trucks, of which 345 are technical pumping trucks and 41 are down-hole surveying trucks Superior employs a preventative maintenance program that includes monthly inspections of each of the trucks and the other mechanical equipment Down-Ho
Slide 26: Financial Overview
Financial Overview
Slide 27: Historical Performance
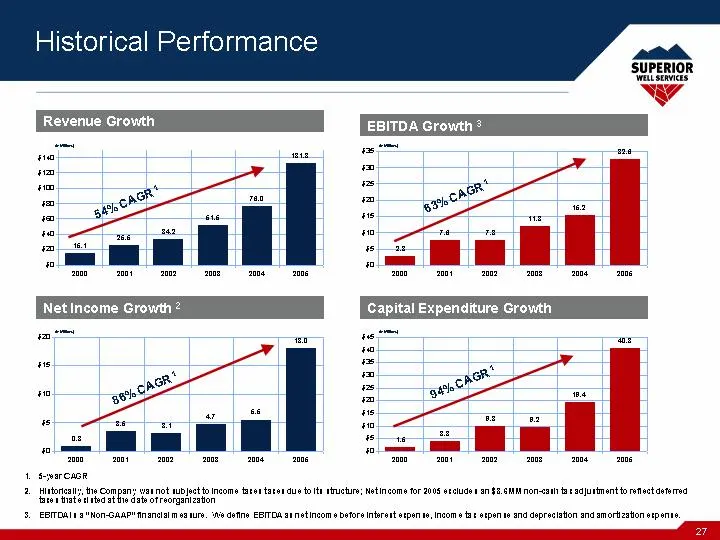
2000 2001 2002 2003 2004 2005 0.8 3.5 3.1 4.7 5.5 18 2000 2001 2002 2003 2004 2005 1.5 3.8 9.8 9.2 19.4 40.8 2000 2001 2002 2003 2004 2005 2.8 7.6 7.8 11.8 15.2 32.6 2000 2001 2002 2003 2004 2005 15.1 25.5 34.2 51.5 76 131.8 5-year CAGR Historically, the Company was not subject to income taxes taxes
Slide 28: Income tax and EBITDA notes
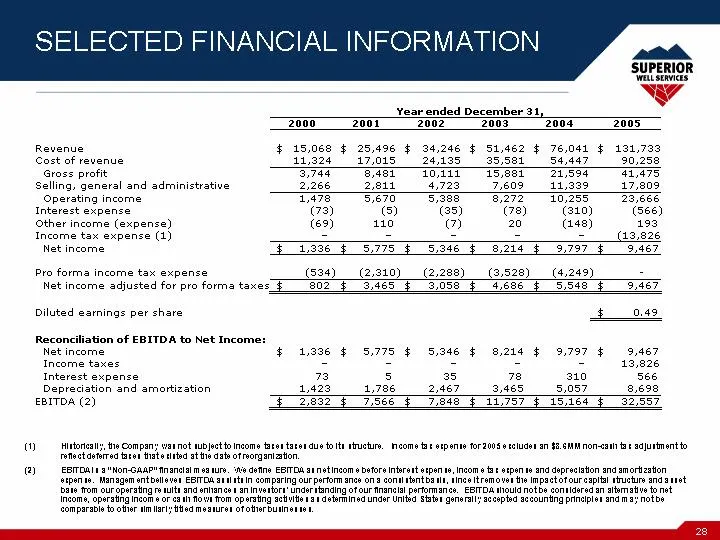
Historically, the Company was not subject to income taxes taxes due to its structure. Income tax expense for 2005 excludes an $8.6MM non-cash tax adjustment to reflect deferred taxes that existed at the date of reorganization. EBITDA is a "Non-GAAP" financial measure. We define EBITDA as net income
Slide 29: Consolidated Balance Sheets
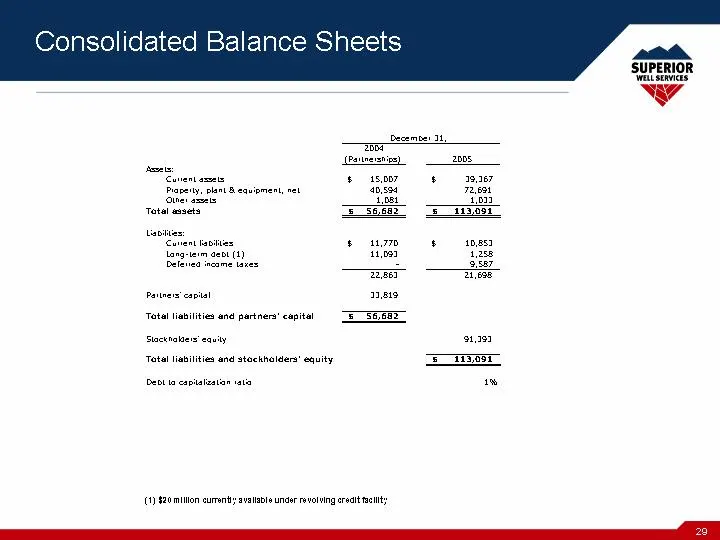
Consolidated Balance Sheets (1) $20 million currently available under revolving credit facility
Slide 30: Investment Highlights
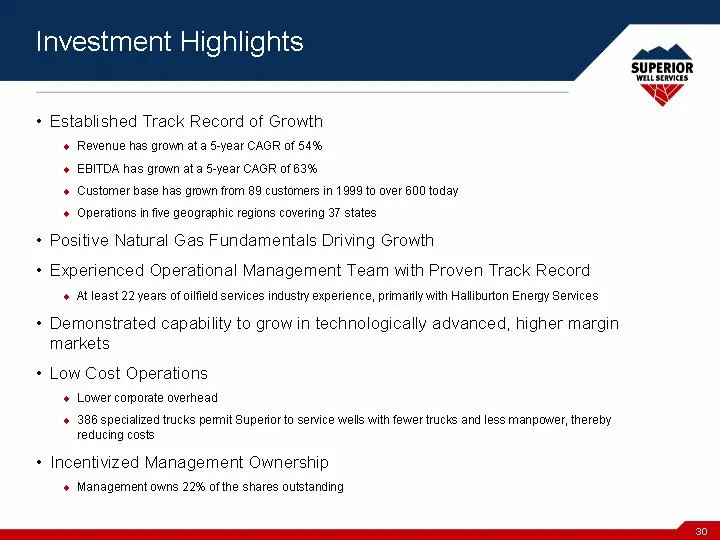
Investment Highlights Established Track Record of Growth Revenue has grown at a 5-year CAGR of 54% EBITDA has grown at a 5-year CAGR of 63% Customer base has grown from 89 customers in 1999 to over 600 today Operations in five geographic regions covering 37 states Positive Natural Gas Fundamentals D
Slide 31: A.G. Edwards Energy Conference
A.G. Edwards Energy Conference
Source: SEC EDGAR · 8-K filed Mar 15, 2006
More decks from Superior Well Services INC
 Investor Presentation (June 2010)28 slides · Jun 7, 2010
 Pritchard Capital Conference 201044 slides · May 19, 2010
 Investor Presentation (May 2010)28 slides · May 13, 2010
 Investor Presentation (March 2010)28 slides · Mar 16, 2010
 Pritchard Capital Partners Energize 201031 slides · Jan 5, 2010
 Pritchard Capital Partners Boston Appalachia Forum 200931 slides · Nov 13, 2009