Superior Well Services — Pritchard Capital Conference 2010
44 slides from Superior Well Services's conference presentation, May 19, 2010
Slide 1: Pritchard Capital May 19, 2010
Pritchard Capital May 19, 2010
Slide 2: Forward-Looking Statements
2 Forward-Looking Statements This presentation includes "forward-looking statements" within the meaning of Section 27A of the Securities Act of 1933, as amended, and Section 21E of the Securities Act of 1934, as amended. All statements, other than statements of historical facts, included in this pre
Slide 3: Company Overview
3 Company Overview Company Overview
Slide 4: Company Overview
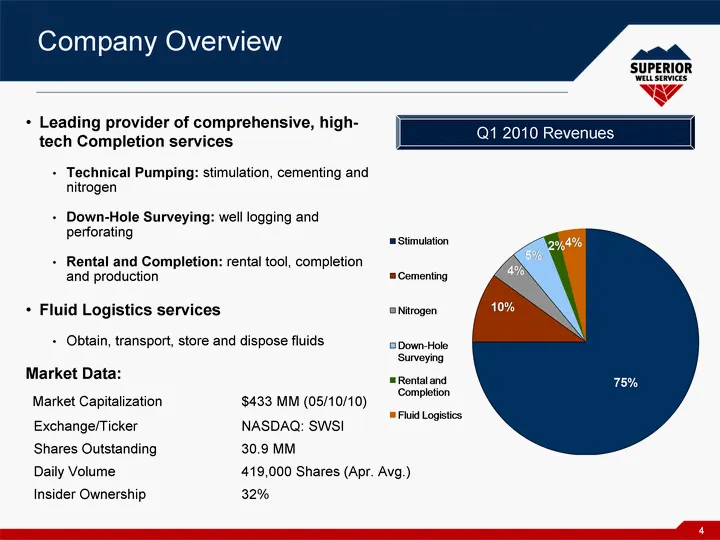
Leading provider of comprehensive, high- tech Completion services Technical Pumping: stimulation, cementing and nitrogen Down-Hole Surveying: well logging and perforating Rental and Completion: rental tool, completion and production Fluid Logistics services Obtain, transport, store and dispose fluid
Slide 5: Investment Highlights
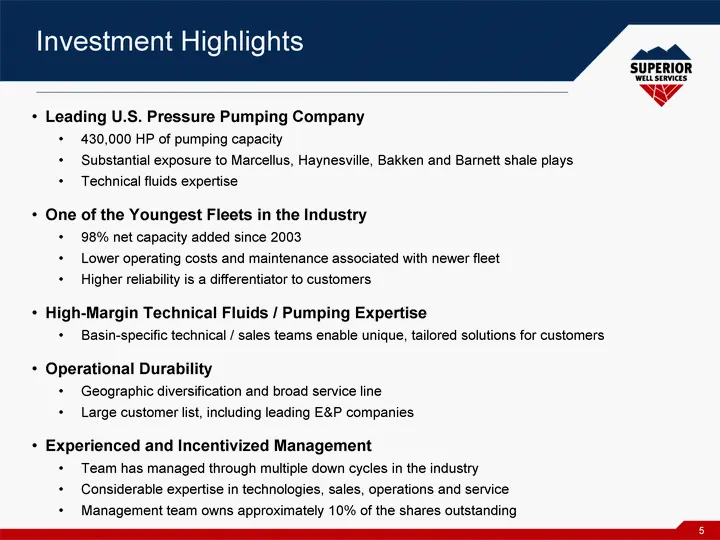
5 Investment Highlights Leading U.S. Pressure Pumping Company 430,000 HP of pumping capacity Substantial exposure to Marcellus, Haynesville, Bakken and Barnett shale plays Technical fluids expertise One of the Youngest Fleets in the Industry 98% net capacity added since 2003 Lower operating costs an
Slide 6: Located in High-Growth Basins
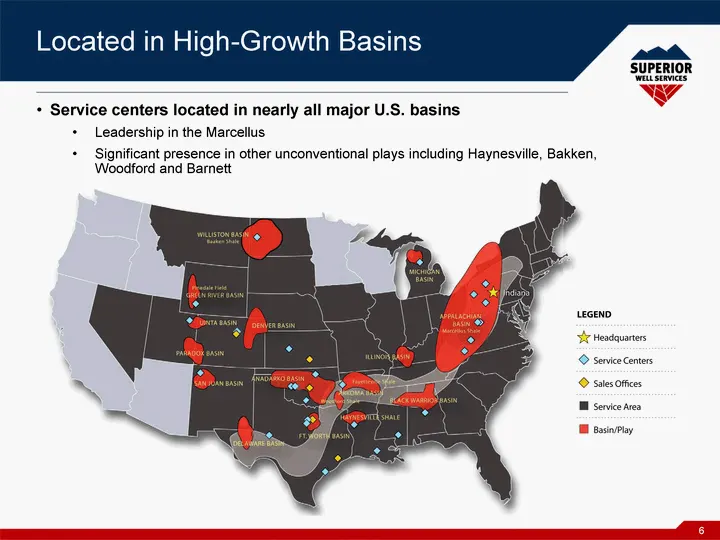
Located in High-Growth Basins 6 Service centers located in nearly all major U.S. basins Leadership in the Marcellus Significant presence in other unconventional plays including Haynesville, Bakken, Woodford and Barnett []
Slide 7: Technology Leadership
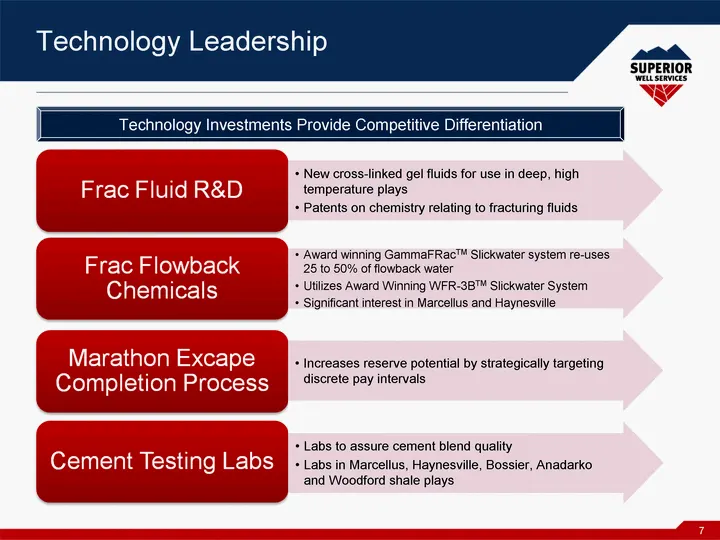
7 Technology Leadership Technology Leadership Technology Investments Provide Competitive Differentiation Labs to assure cement blend quality Labs in Marcellus, Haynesville, Bossier, Anadarko and Woodford shale plays New cross-linked gel fluids for use in deep, high temperature plays Patents on chemi
Slide 8: Competitive Landscape
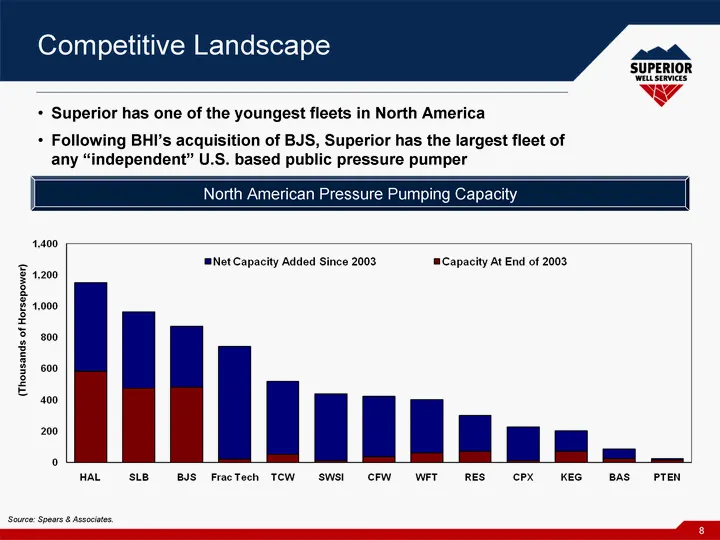
8 Competitive Landscape Source: Spears & Associates. (Thousands of Horsepower) Superior has one of the youngest fleets in North America Following BHI's acquisition of BJS, Superior has the largest fleet of any "independent" U.S. based public pressure pumper North American Pressure Pumping Capacity
Slide 9: U.S. Onshore Rig Count Overview
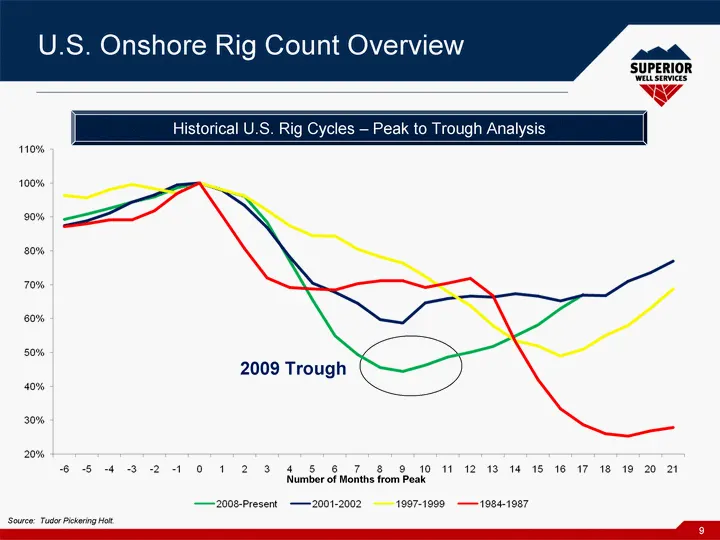
9 U.S. Onshore Rig Count Overview Number of Months from Peak Source: Tudor Pickering Holt. Historical U.S. Rig Cycles - Peak to Trough Analysis 2009 Trough
Slide 10: Growing Importance of Unconventional Plays
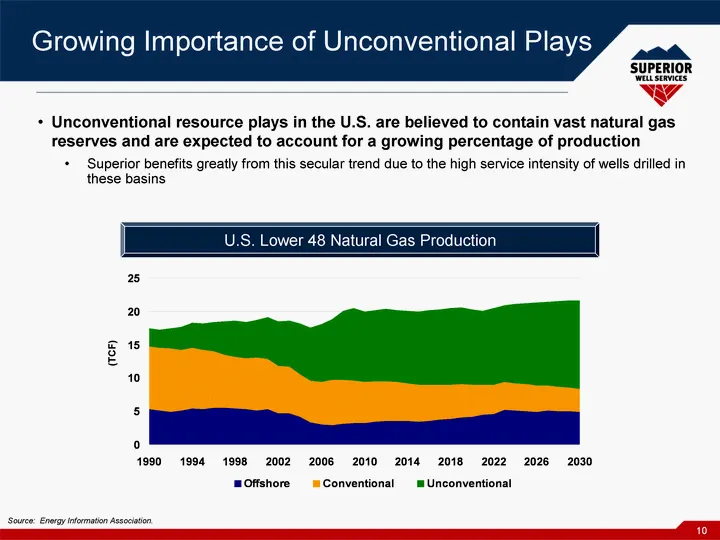
Unconventional resource plays in the U.S. are believed to contain vast natural gas reserves and are expected to account for a growing percentage of production Superior benefits greatly from this secular trend due to the high service intensity of wells drilled in these basins 10 Source: Energy Inform
Slide 11: North American Unconventional Plays
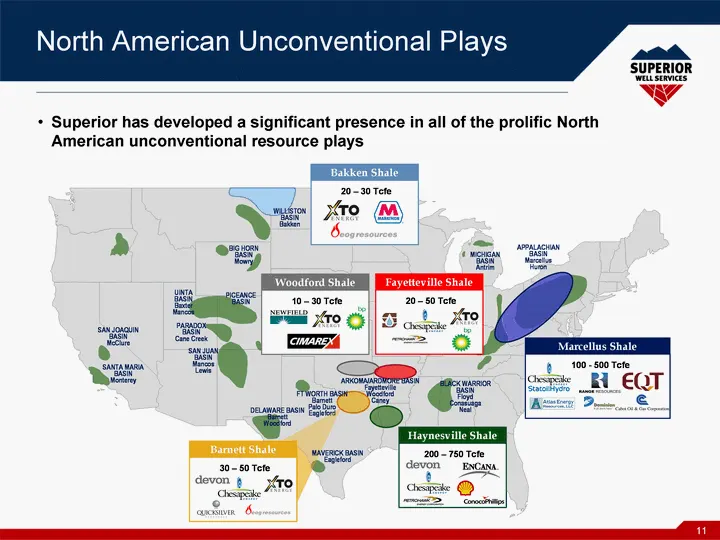
Superior has developed a significant presence in all of the prolific North American unconventional resource plays 11 North American Unconventional Plays
Slide 12: Operations Overview
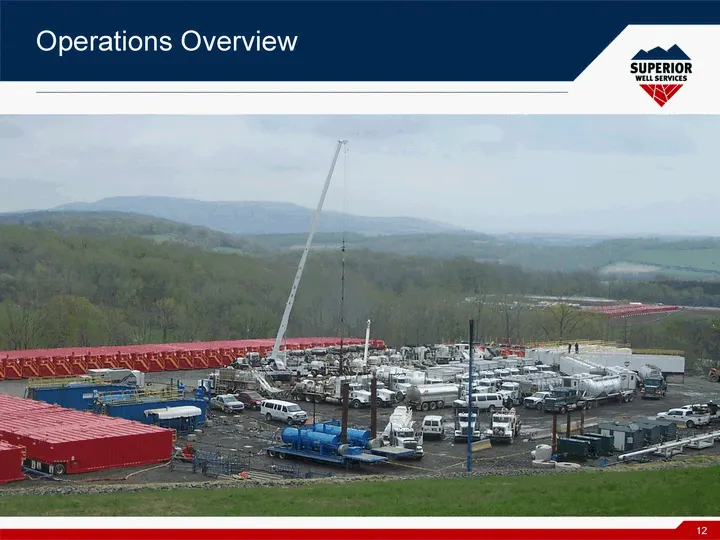
12 Operations Overview
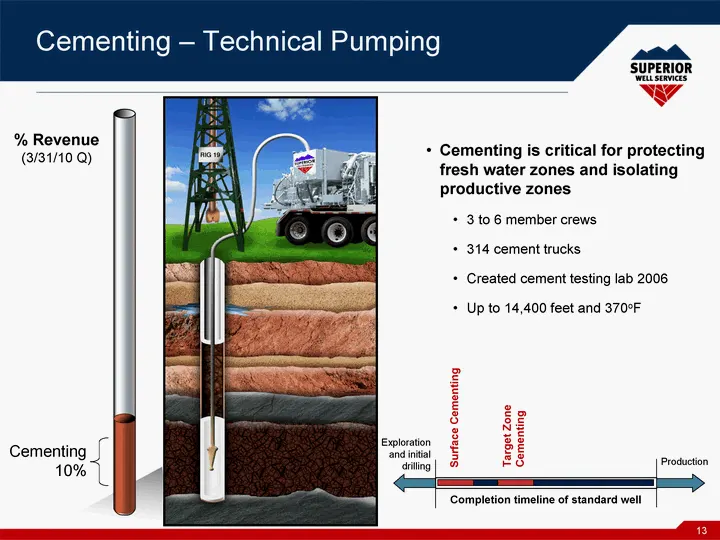
Slide 13: Cementing - Technical Pumping
13 Cementing - Technical Pumping Cementing is critical for protecting fresh water zones and isolating productive zones 3 to 6 member crews 314 cement trucks Created cement testing lab 2006 Up to 14,400 feet and 370oF Exploration and initial drilling Production Completion timeline of standard well Su
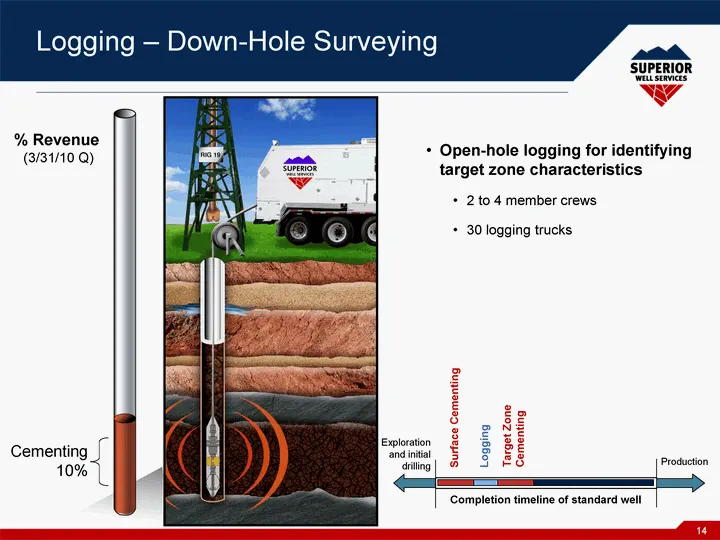
Slide 14: Logging - Down-Hole Surveying
14 Logging - Down-Hole Surveying Open-hole logging for identifying target zone characteristics 2 to 4 member crews 30 logging trucks Exploration and initial drilling Production Completion timeline of standard well Surface Cementing Target Zone Cementing Logging % Revenue (3/31/10 Q) Cementing 10%
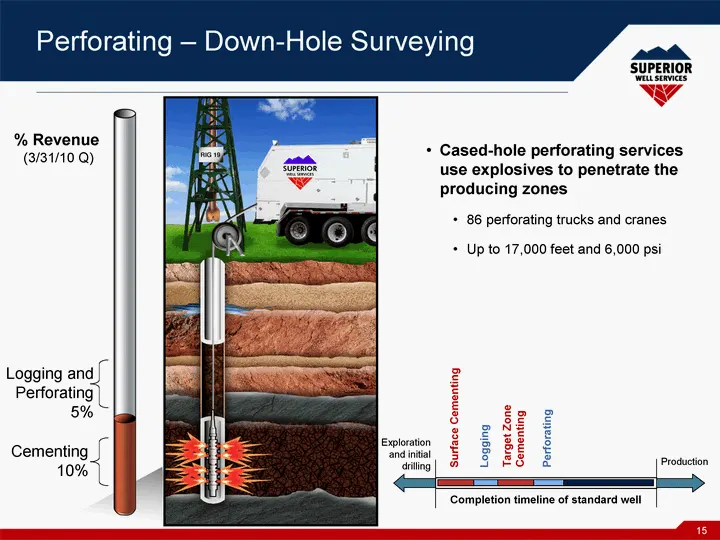
Slide 15: Perforating - Down-Hole Surveying
15 Perforating - Down-Hole Surveying Cased-hole perforating services use explosives to penetrate the producing zones 86 perforating trucks and cranes Up to 17,000 feet and 6,000 psi Exploration and initial drilling Production Completion timeline of standard well Surface Cementing Target Zone Cementi
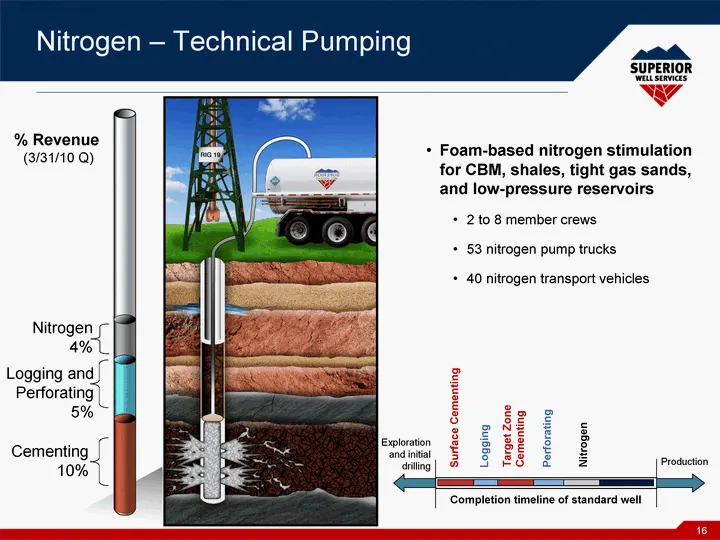
Slide 16: Nitrogen - Technical Pumping
16 Nitrogen - Technical Pumping Foam-based nitrogen stimulation for CBM, shales, tight gas sands, and low-pressure reservoirs 2 to 8 member crews 53 nitrogen pump trucks 40 nitrogen transport vehicles Exploration and initial drilling Production Completion timeline of standard well Surface Cementing
Slide 17: Stimulation & Completion - Technical Pumping
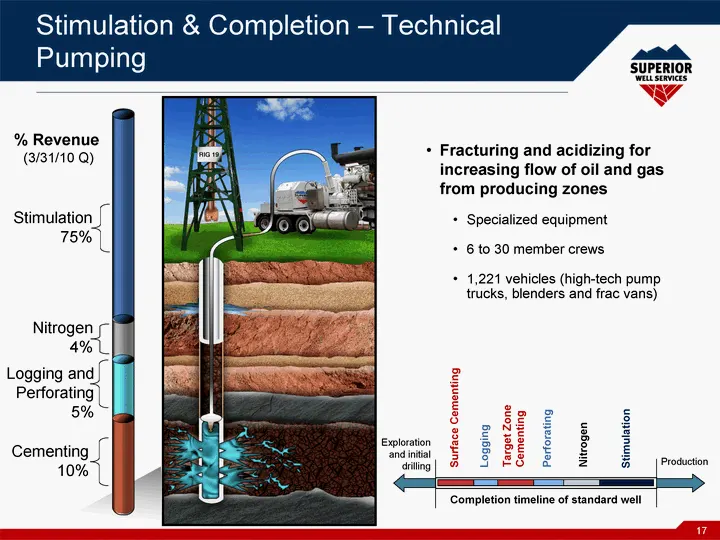
17 Stimulation Stimulation & Completion - Technical Pumping Fracturing and acidizing for increasing flow of oil and gas from producing zones Specialized equipment 6 to 30 member crews 1,221 vehicles (high-tech pump trucks, blenders and frac vans) Exploration and initial drilling Production Completio
Slide 18: Horizontal Stimulation & Completion
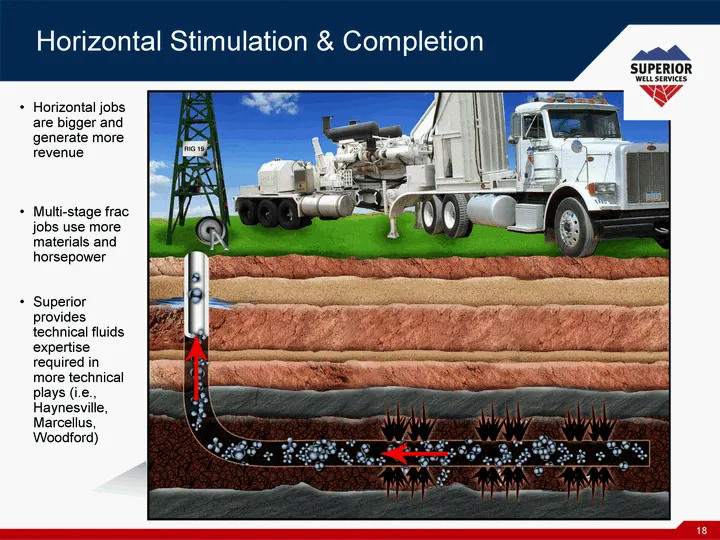
Horizontal Stimulation & Completion Horizontal jobs are bigger and generate more revenue Multi-stage frac jobs use more materials and horsepower Superior provides technical fluids expertise required in more technical plays (i.e., Haynesville, Marcellus, Woodford) 18
Slide 19: Fluid Logistics
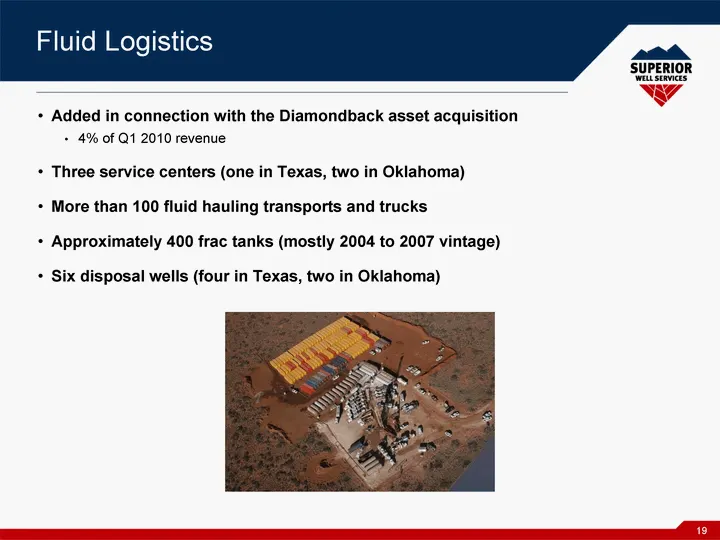
Fluid Logistics Added in connection with the Diamondback asset acquisition 4% of Q1 2010 revenue Three service centers (one in Texas, two in Oklahoma) More than 100 fluid hauling transports and trucks Approximately 400 frac tanks (mostly 2004 to 2007 vintage) Six disposal wells (four in Texas, two i
Slide 20: Rental and Completion
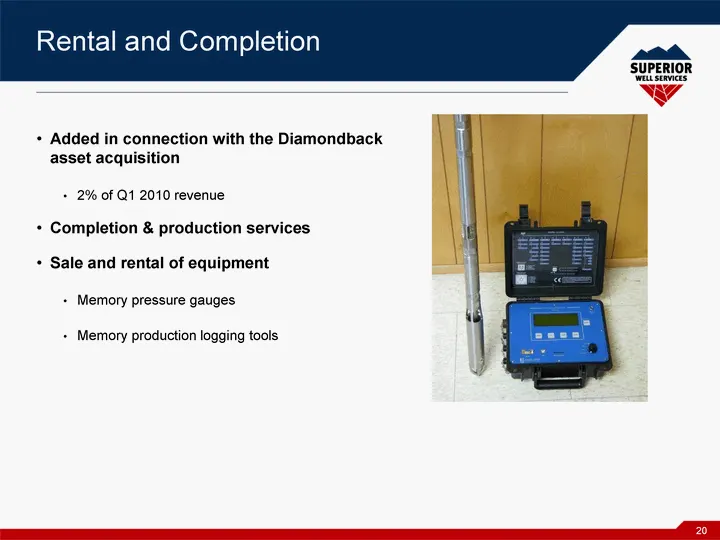
Rental and Completion Added in connection with the Diamondback asset acquisition 2% of Q1 2010 revenue Completion & production services Sale and rental of equipment Memory pressure gauges Memory production logging tools 20
Slide 21: Marcellus Overview
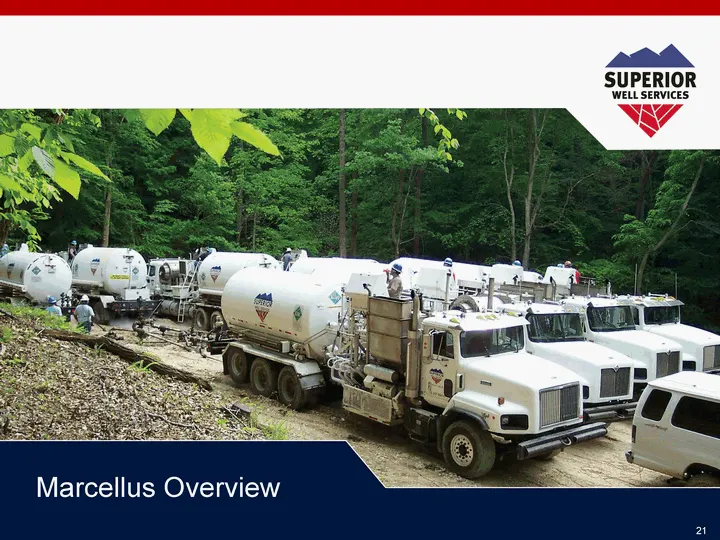
Aisin SUPERIOR ‘WELL SERVICES WW Marcellus Overview
Slide 22: Major Marcellus E&P Companies
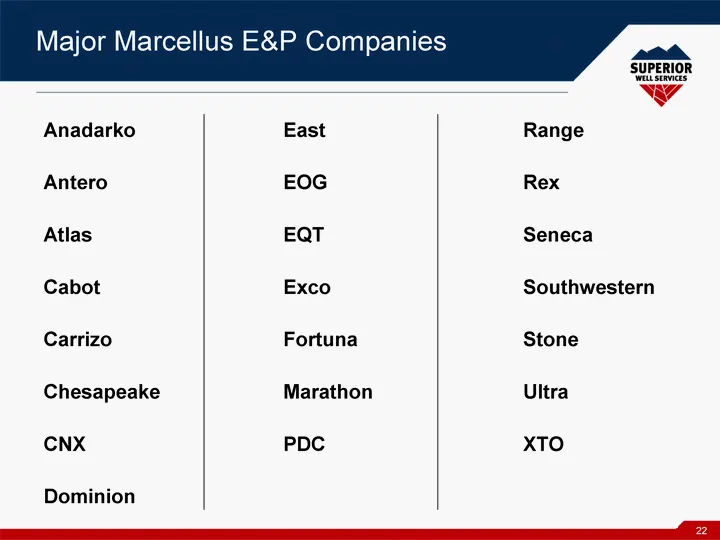
Major Marcellus E&P Companies 22 Anadarko East Range Antero EOG Rex Atlas EQT Seneca Cabot Exco Southwestern Carrizo Fortuna Stone Chesapeake Marathon Ultra CNX PDC XTO Dominion
Slide 23: Major Marcellus Pressure Pumpers
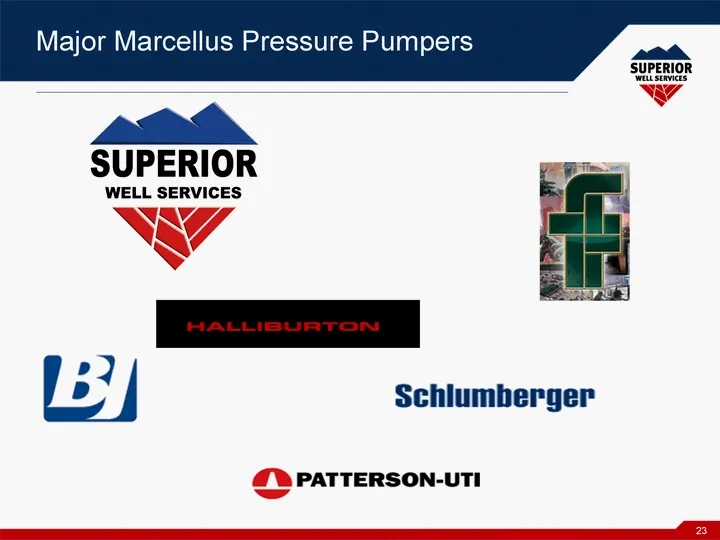
Major Marcellus Pressure Pumpers 23
Slide 24: Marcellus Pressure Pumping Market Factors
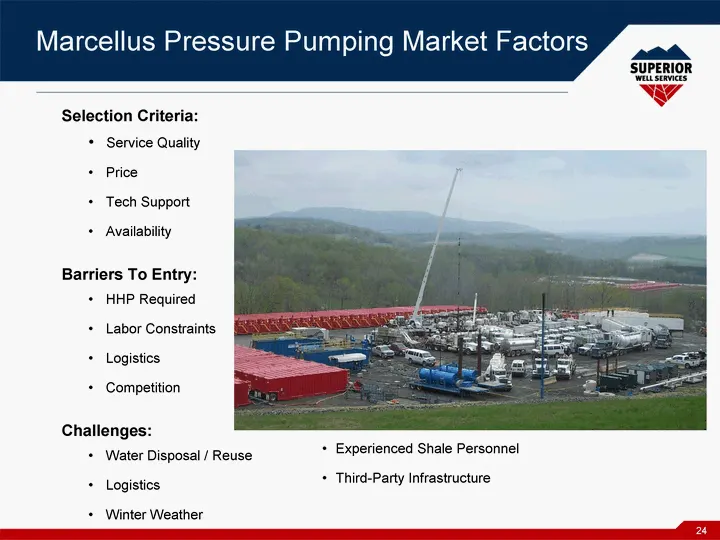
Marcellus Pressure Pumping Market Factors 24 Selection Criteria: Service Quality Price Tech Support Availability Barriers To Entry: HHP Required Labor Constraints Logistics Competition Challenges: Water Disposal / Reuse Logistics Winter Weather Experienced Shale Personnel Third-Party Infrastructure
Slide 25: Marcellus Shale Frac, Armstrong County, PA
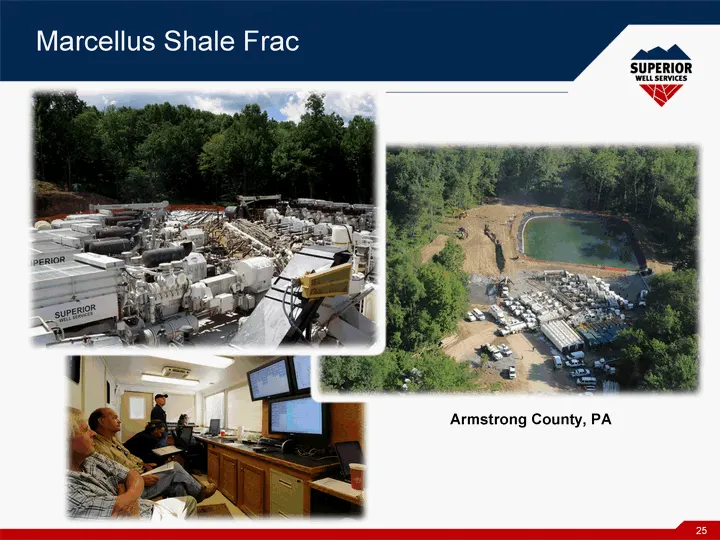
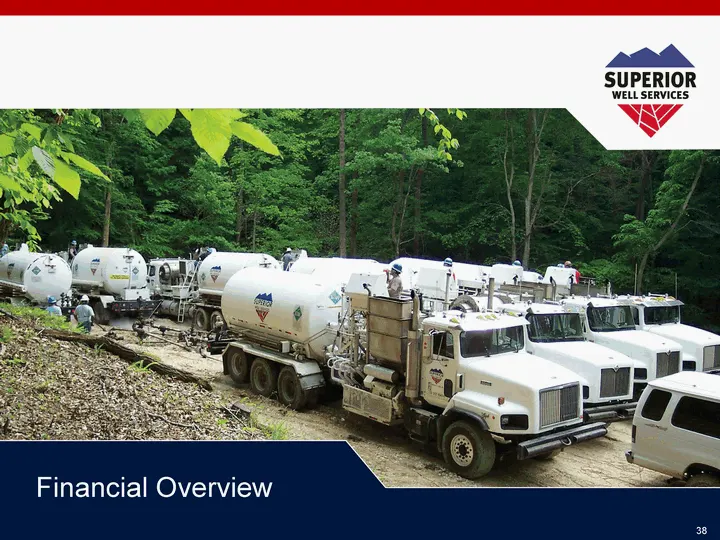
Marcellus Shale Frac Armstrong County, PA 25
Slide 26: Typical Frac Spread
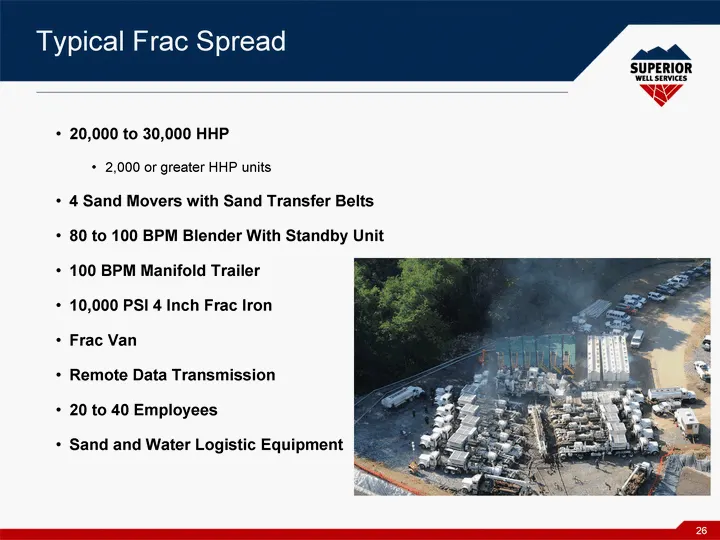
Typical Frac Spread 20,000 to 30,000 HHP 2,000 or greater HHP units 4 Sand Movers with Sand Transfer Belts 80 to 100 BPM Blender With Standby Unit 100 BPM Manifold Trailer 10,000 PSI 4 Inch Frac Iron Frac Van Remote Data Transmission 20 to 40 Employees Sand and Water Logistic Equipment 26
Slide 27: Typical Horizontal Marcellus Frac Design
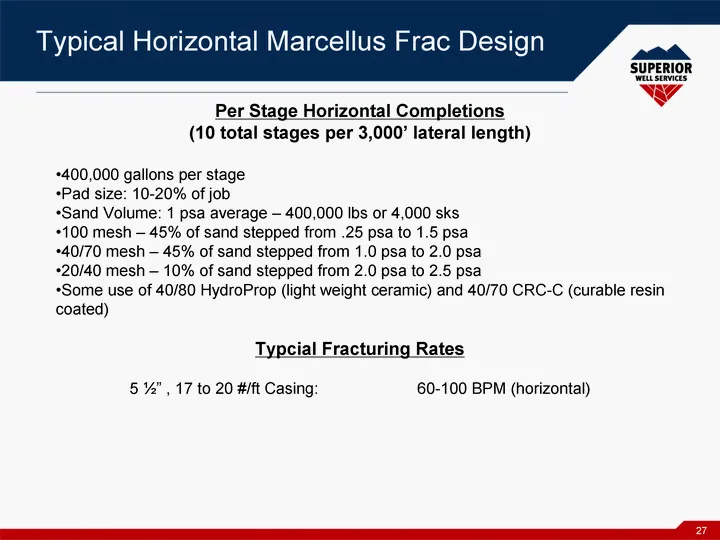
Typical Horizontal Marcellus Frac Design Per Stage Horizontal Completions (10 total stages per 3,000' lateral length) 400,000 gallons per stage Pad size: 10-20% of job Sand Volume: 1 psa average - 400,000 lbs or 4,000 sks 100 mesh - 45% of sand stepped from .25 psa to 1.5 psa 40/70 mesh - 45% of san
Slide 28: MFRAC/MSHALE - Stimulation Design Software
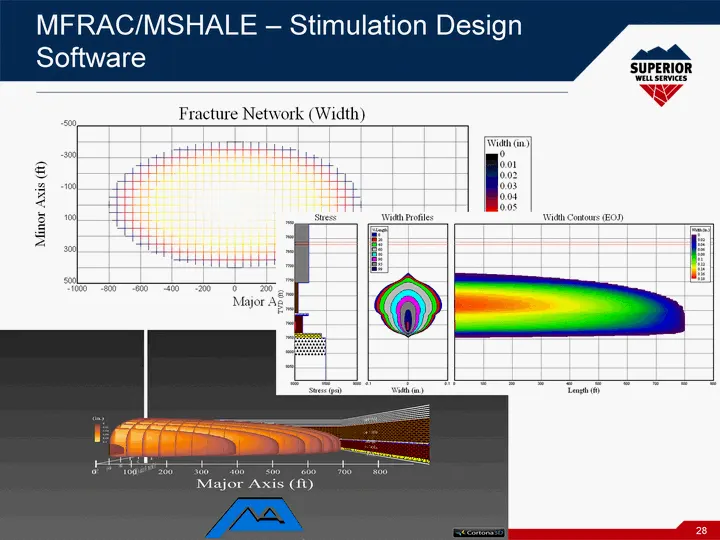
MFRAC/MSHALE - Stimulation Design Software 28
Slide 29: Shale Well Stimulation - Fluids Systems
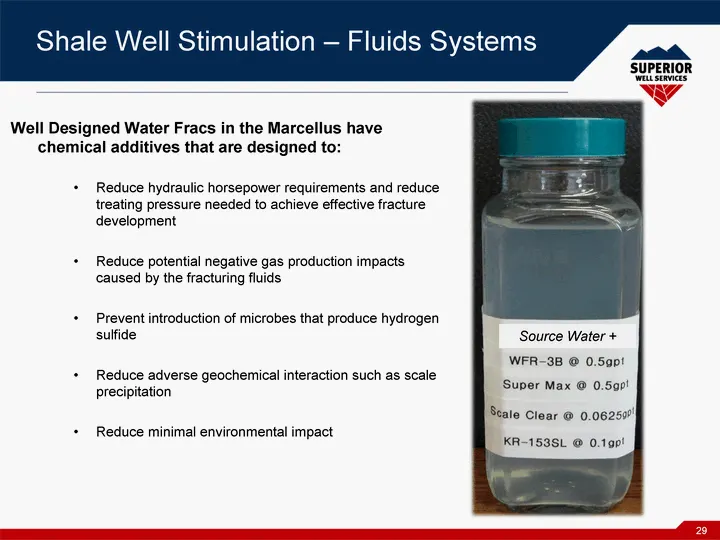
Shale Well Stimulation - Fluids Systems Well Designed Water Fracs in the Marcellus have chemical additives that are designed to: Reduce hydraulic horsepower requirements and reduce treating pressure needed to achieve effective fracture development Reduce potential negative gas production impacts cau
Slide 30: SWSI's WFR-3B Slickwater System
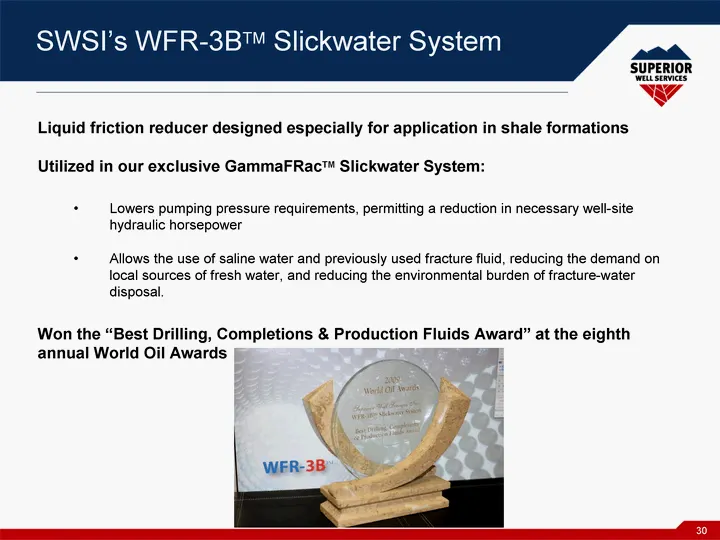
SWSI's WFR-3BTM Slickwater System Liquid friction reducer designed especially for application in shale formations Utilized in our exclusive GammaFRacTM Slickwater System: Lowers pumping pressure requirements, permitting a reduction in necessary well-site hydraulic horsepower Allows the use of saline
Slide 31: Breakthrough Slick Water
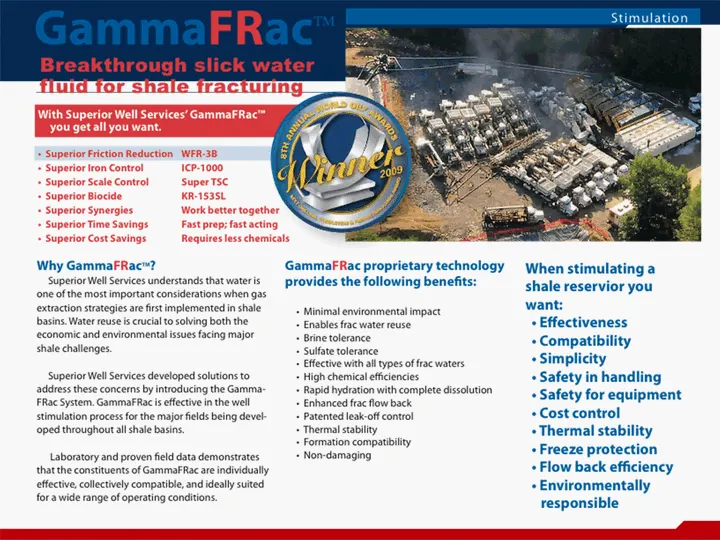
Breakthrough slick water Why GammaFRac™? GammaFRac proprietary technology When stimulating a Superior Well Services understands that wateris provides the following benefits: shale reservior you cone ofthe most important considerations when gas extraction sategies are fist implementedin shale. sinima
Slide 32: Flow Back TDS
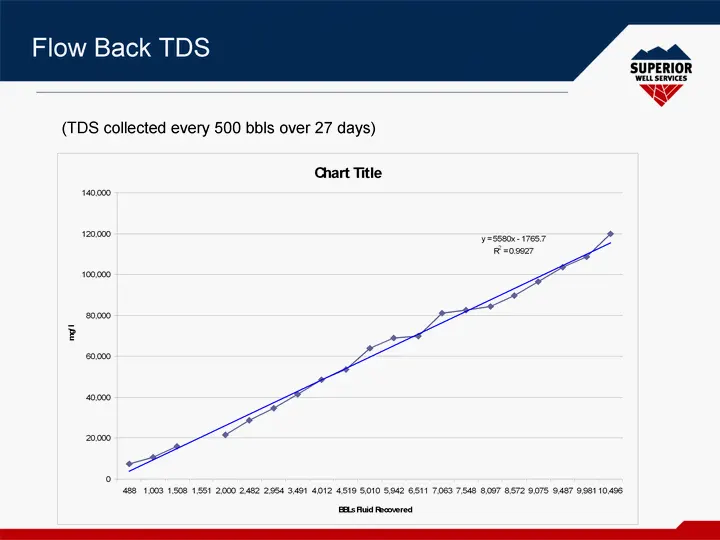
Flow Back TDS (TDS collected every 500 bbls over 27 days)
Slide 33: SWSI's WFR-3B Slickwater System
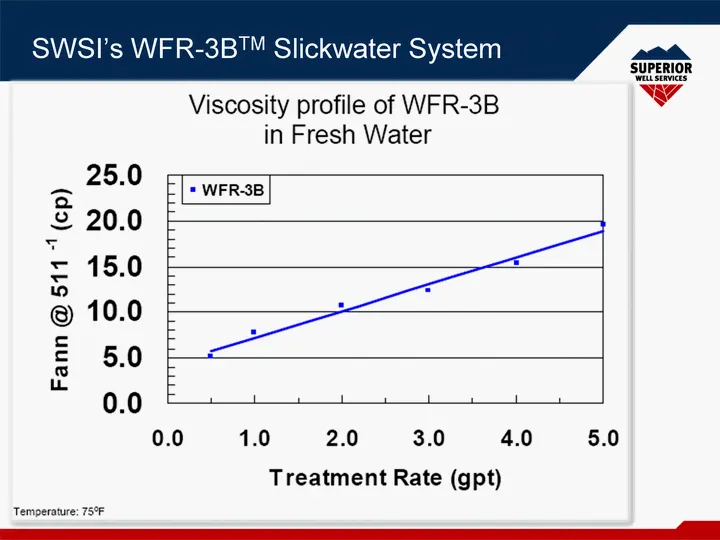
SWSI's WFR-3BTM Slickwater System
Slide 34: Geochemical Controls
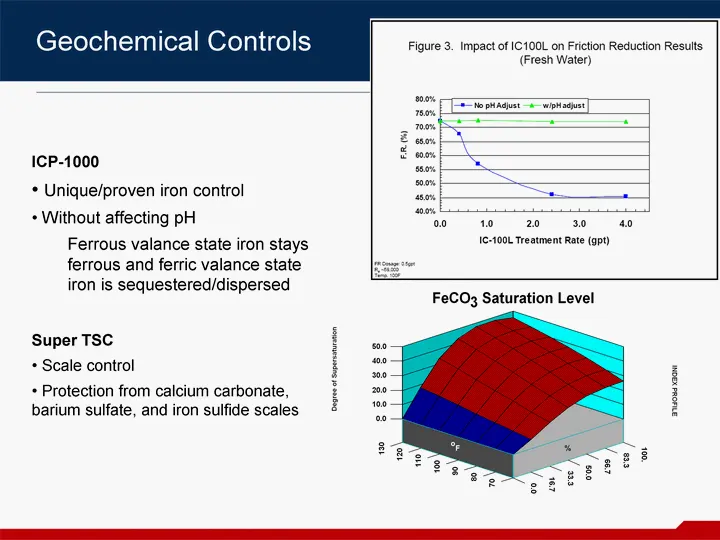
Geochemical Controls ICP-1000 Unique/proven iron control Without affecting pH Ferrous valance state iron stays ferrous and ferric valance state iron is sequestered/dispersed Super TSC Scale control Protection from calcium carbonate, barium sulfate, and iron sulfide scales
Slide 35: Reuse of Flow Back Water
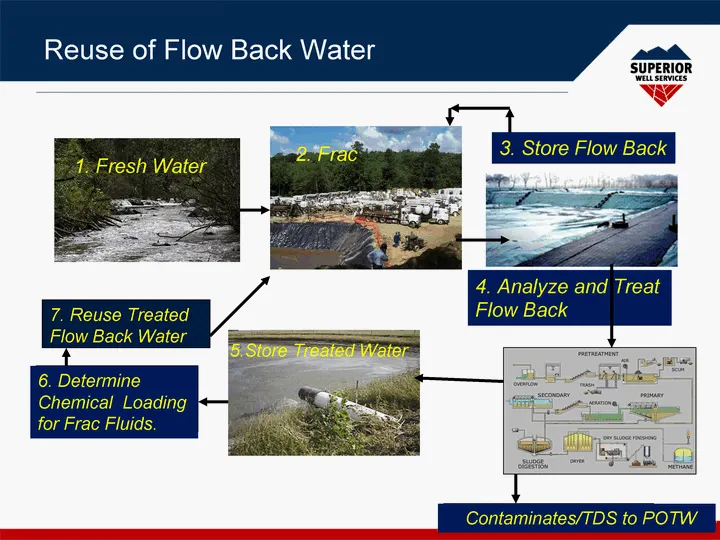
Reuse of Flow Back Water 3. Store Flow Back 4. Analyze and Treat Flow Back 5.Store Treated Water 1. Fresh Water 2. Frac 7. Reuse Treated Flow Back Water 6. Determine Chemical Loading for Frac Fluids. Contaminates/TDS to POTW
Slide 36: OPTV Wireline Imaging Tool
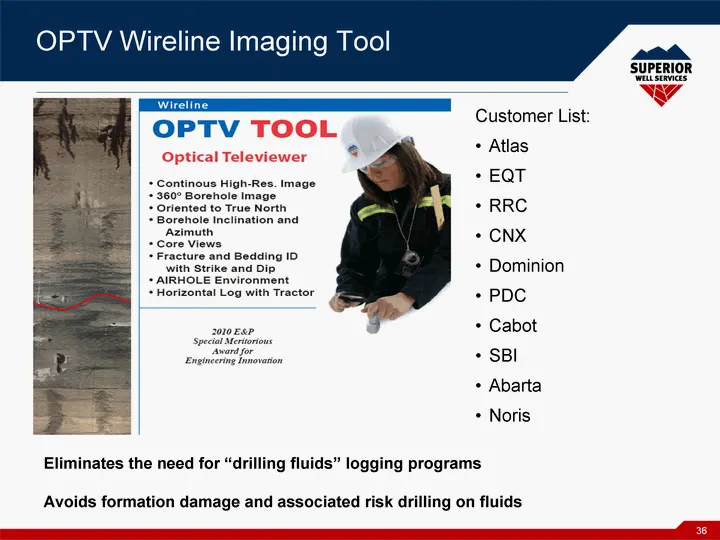
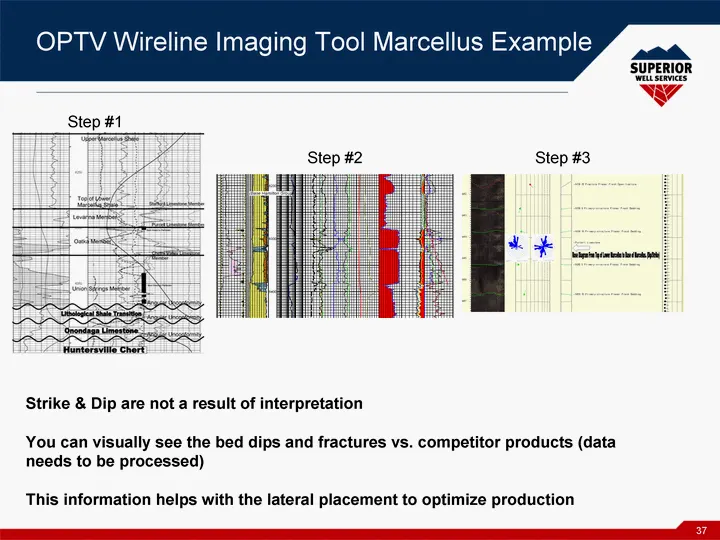
OPTV Wireline Imaging Tool Customer List: Atlas EQT RRC CNX Dominion PDC Cabot SBI Abarta Noris 36 Eliminates the need for "drilling fluids" logging programs Avoids formation damage and associated risk drilling on fluids
Slide 37: OPTV Wireline Imaging Tool Marcellus Example
OPTV Wireline Imaging Tool Marcellus Example 37 Strike & Dip are not a result of interpretation You can visually see the bed dips and fractures vs. competitor products (data needs to be processed) This information helps with the lateral placement to optimize production Step #1 Step #2 Step #3
Slide 38: Financial Overview
Vina SUPERIOR ‘WELL SERVICES WW Financial Overview
Slide 39: Summary Financial Results
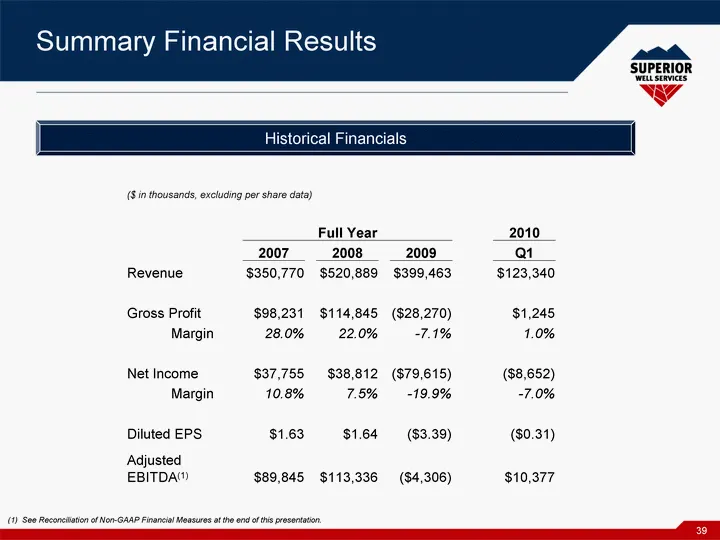
39 Summary Financial Results (1) See Reconciliation of Non-GAAP Financial Measures at the end of this presentation. Historical Financials ($ in thousands, excluding per share data) ($ in thousands, excluding per share data) ($ in thousands, excluding per share data) ($ in thousands, excluding per sh
Slide 40: Capitalization
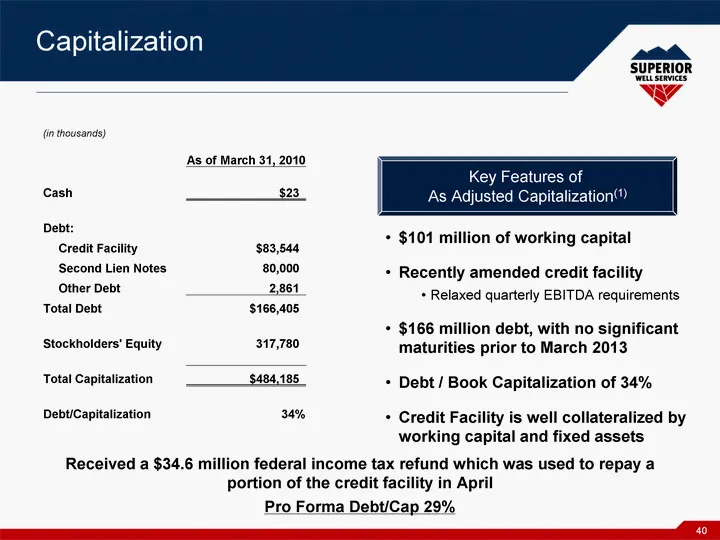
40 Capitalization $101 million of working capital Recently amended credit facility Relaxed quarterly EBITDA requirements $166 million debt, with no significant maturities prior to March 2013 Debt / Book Capitalization of 34% Credit Facility is well collateralized by working capital and fixed assets
Slide 41: Conclusion
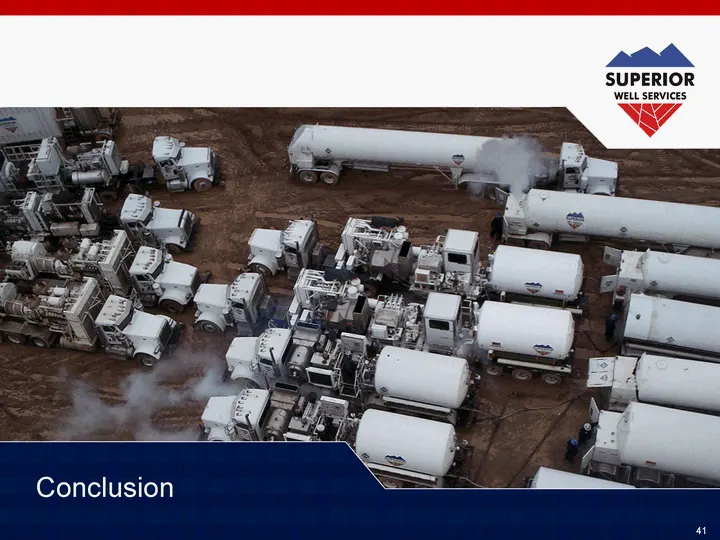
41 Conclusion
Slide 42: Investment Highlights
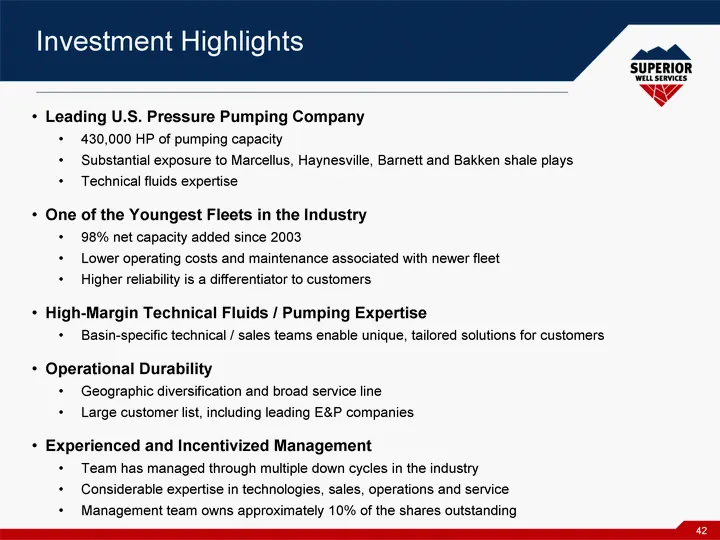
42 Investment Highlights Leading U.S. Pressure Pumping Company 430,000 HP of pumping capacity Substantial exposure to Marcellus, Haynesville, Barnett and Bakken shale plays Technical fluids expertise One of the Youngest Fleets in the Industry 98% net capacity added since 2003 Lower operating costs a
Slide 43: Appendix
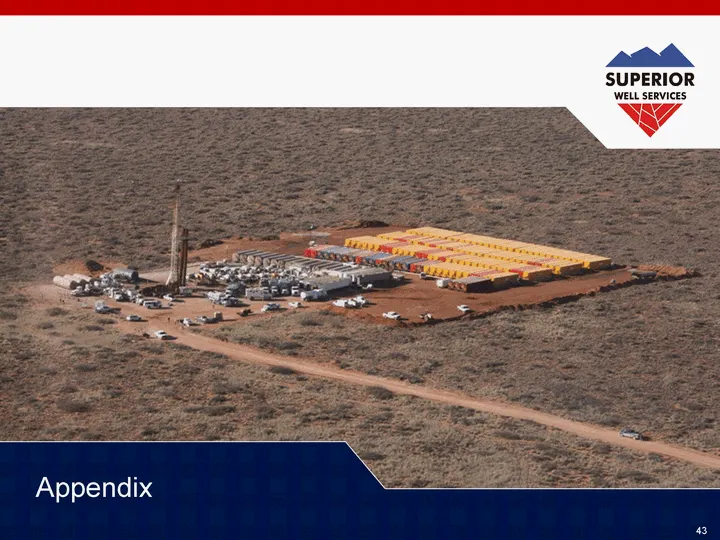
ye TN SUPE! R ‘WELL SERVICES SRV Vv Appendix
Slide 44: Reported Adjusted EBITDA Reconciliation (Non-GAAP Financial Measure)
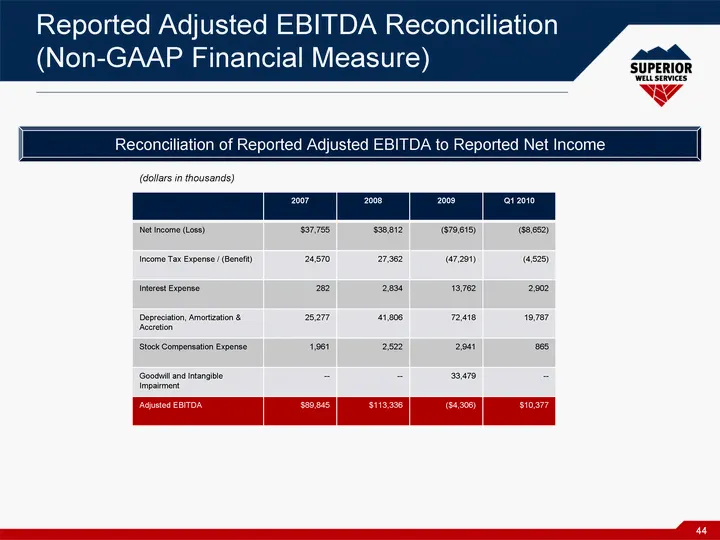
44 Reported Adjusted EBITDA Reconciliation (Non-GAAP Financial Measure) 2007 2008 2009 Q1 2010 Net Income (Loss) $37,755 $38,812 ($79,615) ($8,652) Income Tax Expense / (Benefit) 24,570 27,362 (47,291) (4,525) Interest Expense 282 2,834 13,762 2,902 Depreciation, Amortization & Accretion 25,277 41,8
Source: SEC EDGAR · 8-K filed May 19, 2010
More decks from Superior Well Services INC
 Investor Presentation (June 2010)28 slides · Jun 7, 2010
 Investor Presentation (May 2010)28 slides · May 13, 2010
 Investor Presentation (March 2010)28 slides · Mar 16, 2010
 Pritchard Capital Partners Energize 201031 slides · Jan 5, 2010
 Pritchard Capital Partners Boston Appalachia Forum 200931 slides · Nov 13, 2009
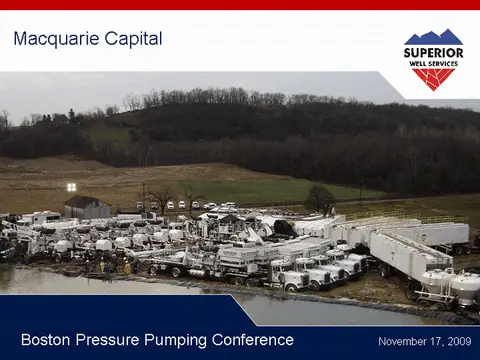 Macquarie Capital Boston Pressure Pumping Conference 200926 slides · Nov 13, 2009