GrafTech International Ltd. · NYSE:EAF
GrafTech International — Investor Presentation (February 2025)
43 slides from GrafTech International's investor presentation, February 2025
Slide 1: Investor Overview Presentation
NYSE: EAF www.graftech.com Investor Overview Presentation February 2025
Slide 2: Forward-Looking Statements
Forward-Looking Statements CAUTIONARY NOTE REGARDING FORWARD-LOOKING STATEMENTS: This presentation and related discussions may contain forward-looking statements within the meaning of the safe harbor provisions of the U.S. Private Securities Litigation Reform Act of 1995. Forward-looking statements

Slide 3: Business Overview
Business Overview GrarF lec!
Slide 4: Prioritizing Safety
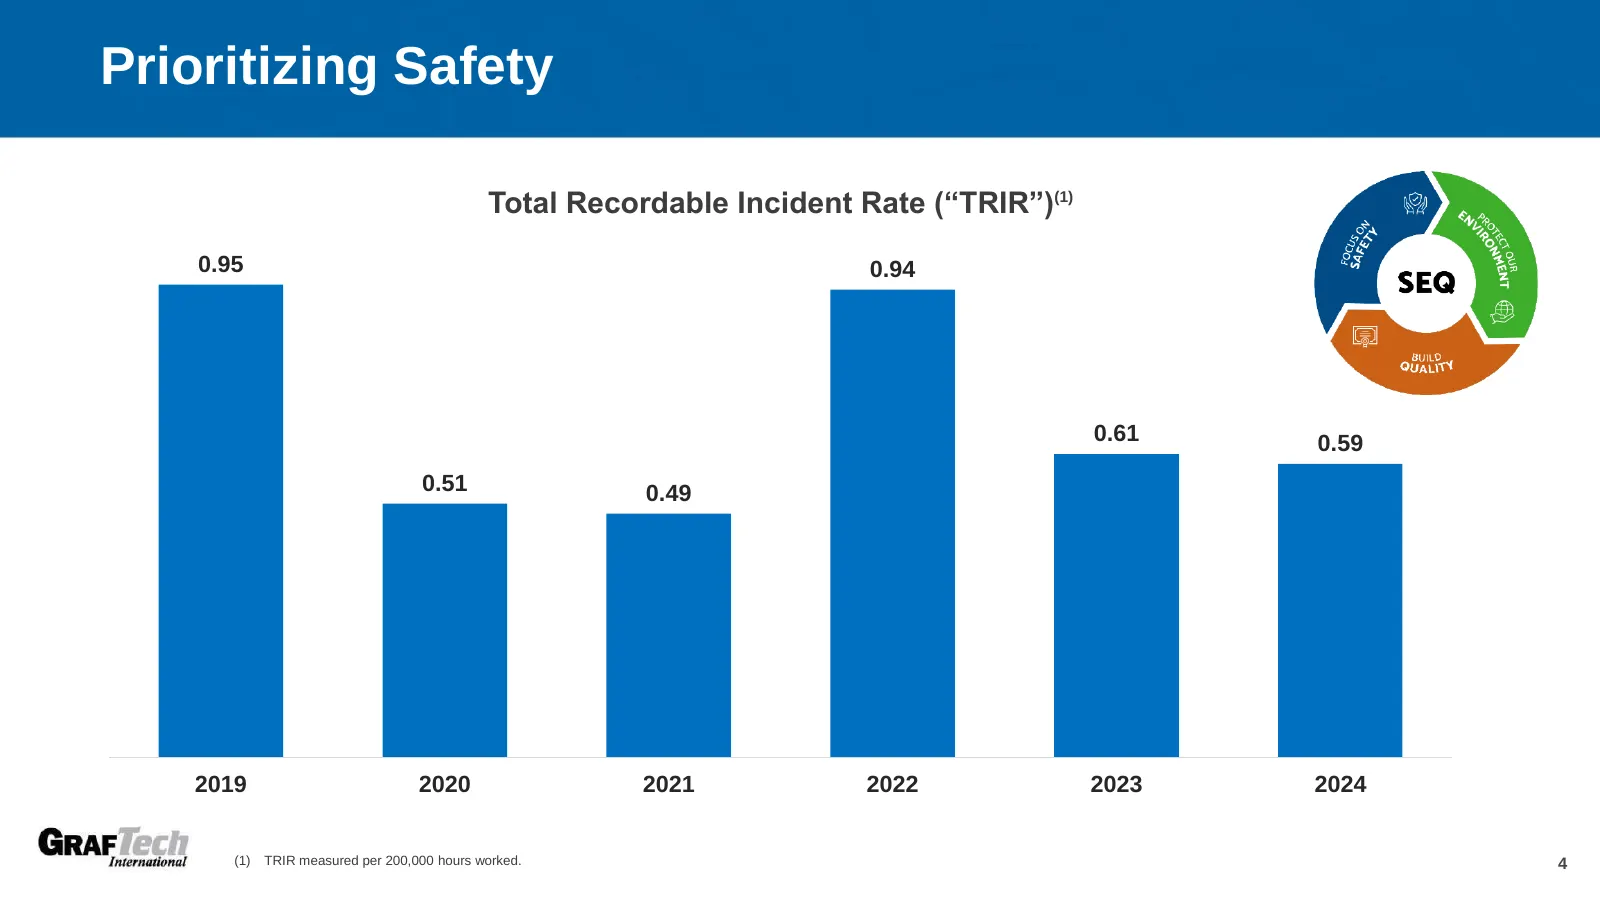
Prioritizing Safety Total Recordable Incident Rate (“TRIR”)(1) 0.95 0.94 0.61 0.59 0.51 0.49 2019 2020 2021 2022 2023 2024 (1) TRIR measured per 200,000 hours worked. 4
Slide 5: Why GrafTech?
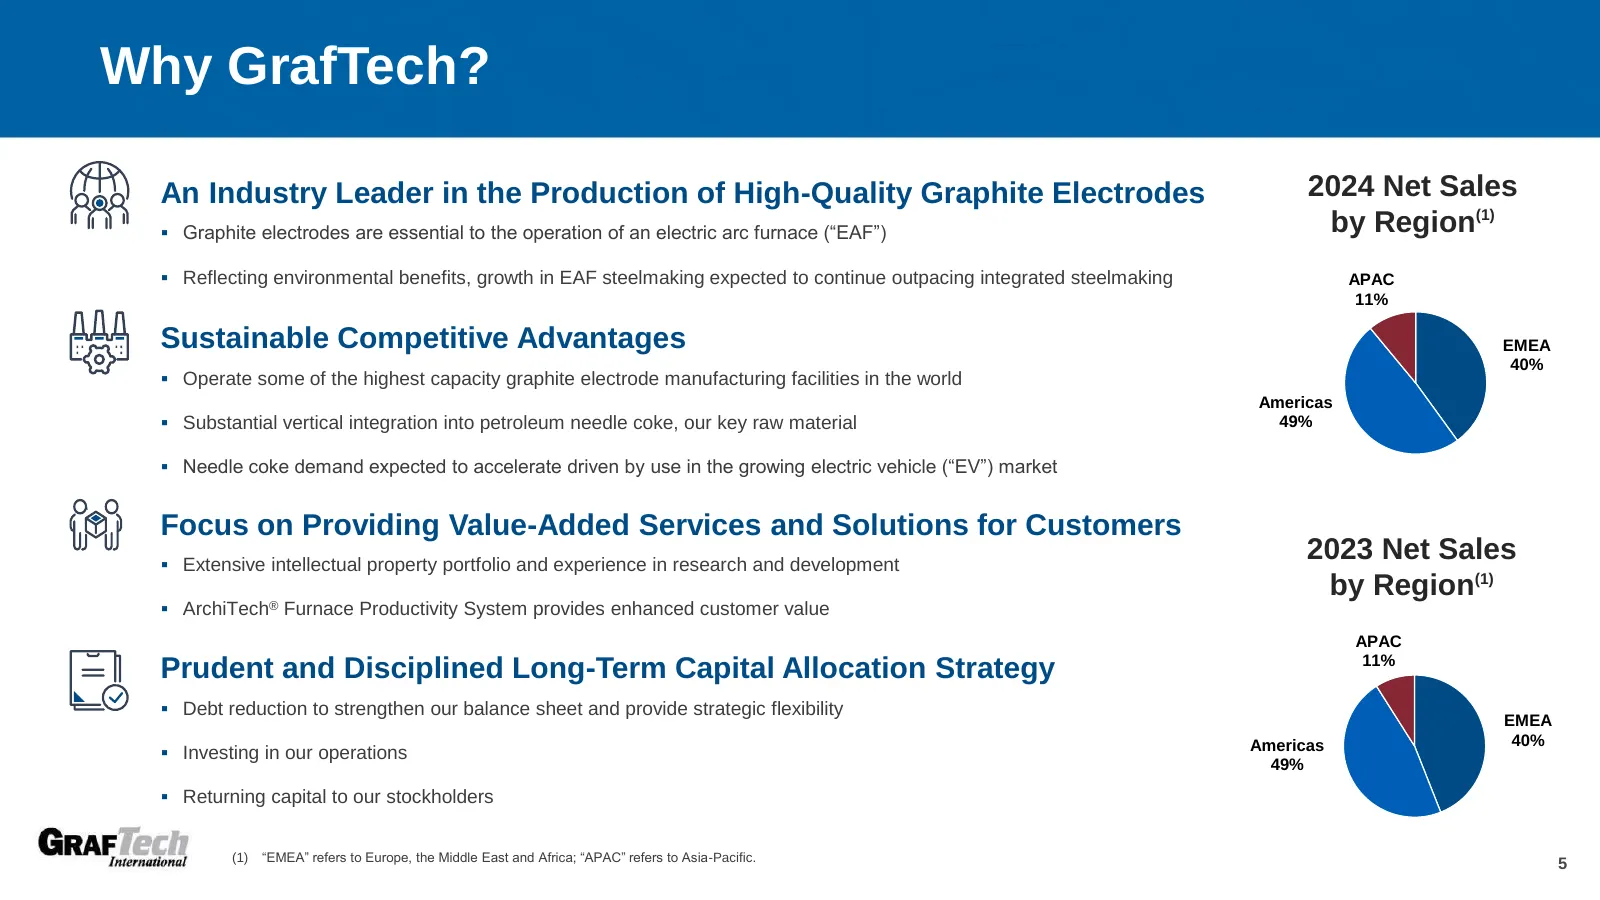
Why GrafTech? An Industry Leader in the Production of High-Quality Graphite Electrodes 2024 Net Sales ▪ Graphite electrodes are essential to the operation of an electric arc furnace (“EAF”) by Region(1) ▪ Reflecting environmental benefits, growth in EAF steelmaking expected to continue outpacing int
Slide 6: Graphite Electrodes – Mission Critical Consumable for EAF Steel Production
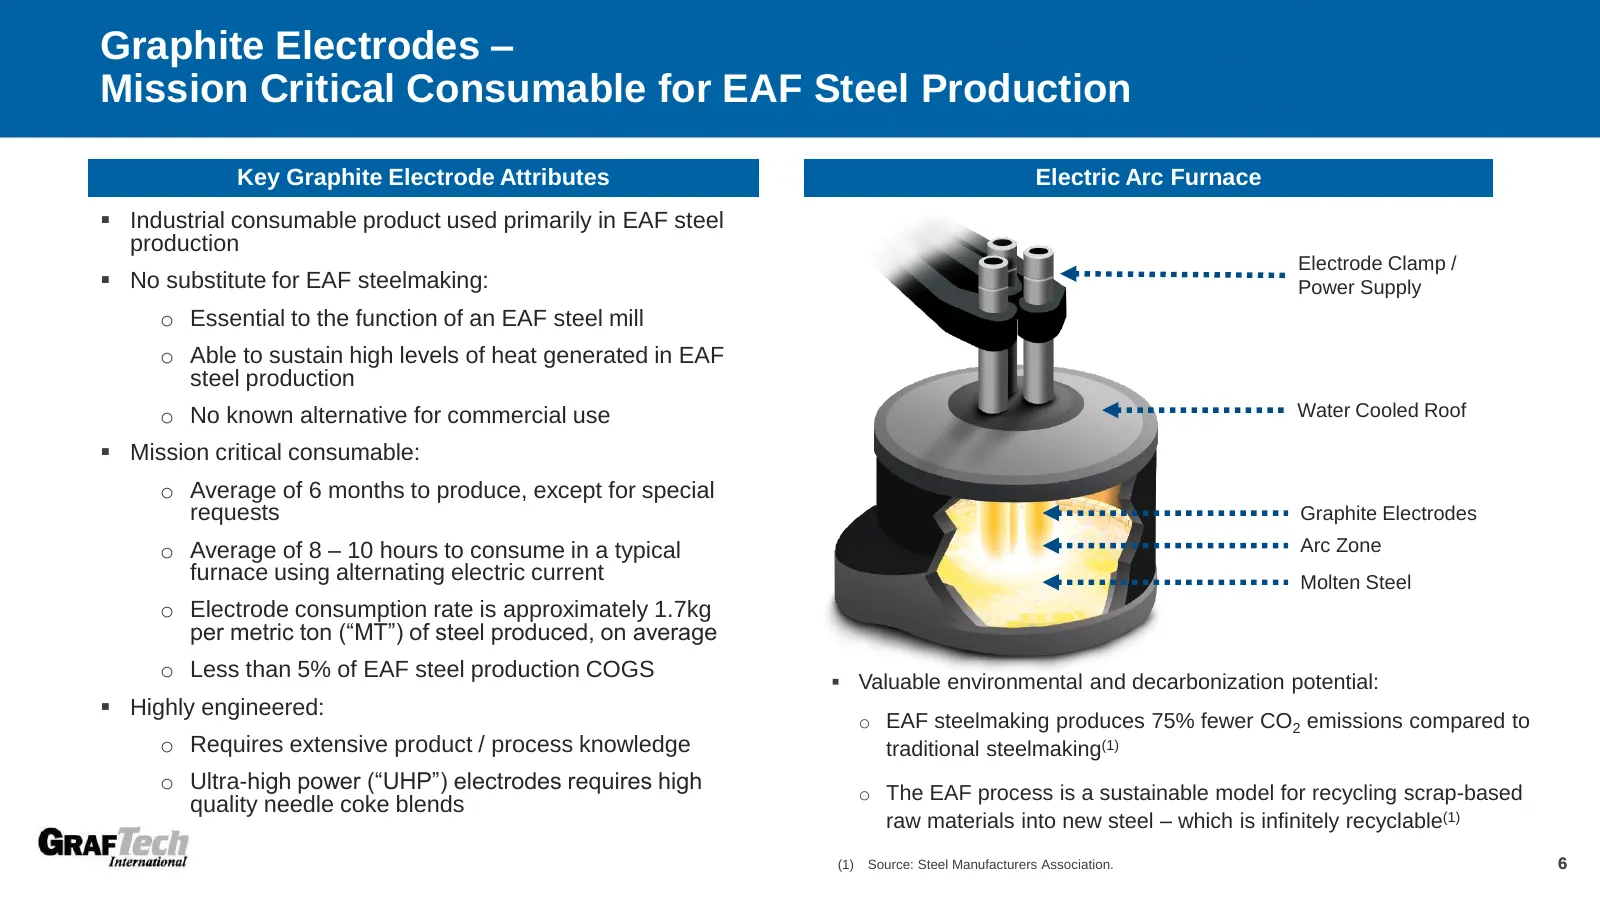
Graphite Electrodes – Mission Critical Consumable for EAF Steel Production Key Graphite Electrode Attributes Electric Arc Furnace ▪ Industrial consumable product used primarily in EAF steel production Electrode Clamp / ▪ No substitute for EAF steelmaking: Power Supply o Essential to the function of
Slide 7: Synthetic Graphite – Supply Chain Summary
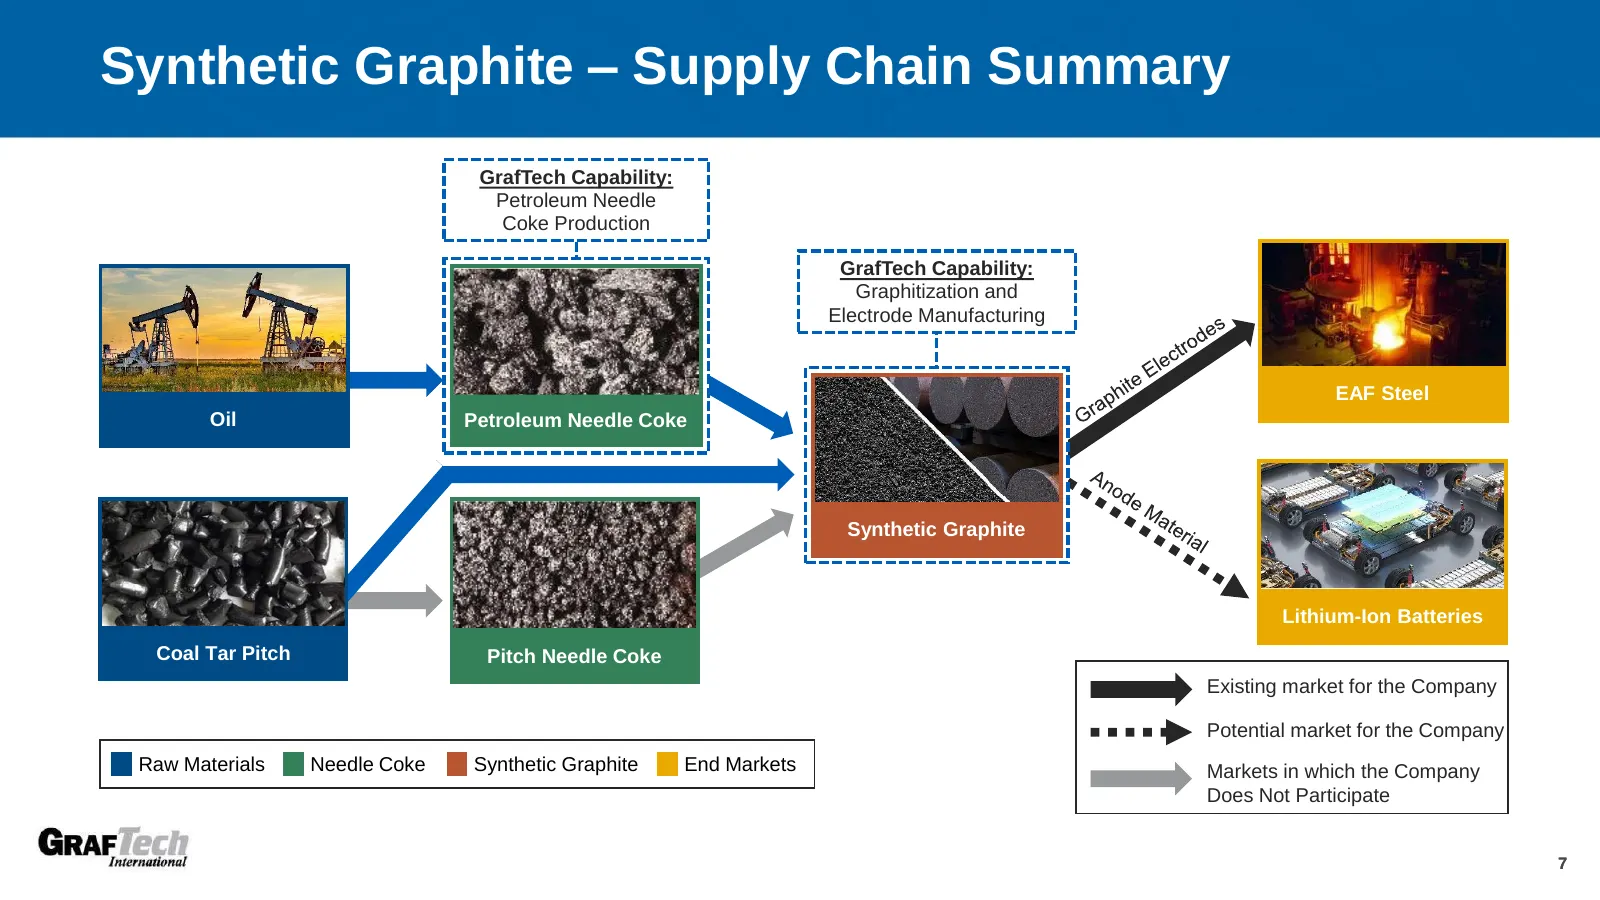
Synthetic Graphite – Supply Chain Summary GrafTech Capability: Petroleum Needle Coke Production GrafTech Capability: Graphitization and Electrode Manufacturing EAF Steel Oil Petroleum Needle Coke Synthetic Graphite Lithium-Ion Batteries Coal Tar Pitch Pitch Needle Coke Existing market for the Compan
Slide 8: Graphite Electrodes – Manufacturing Process
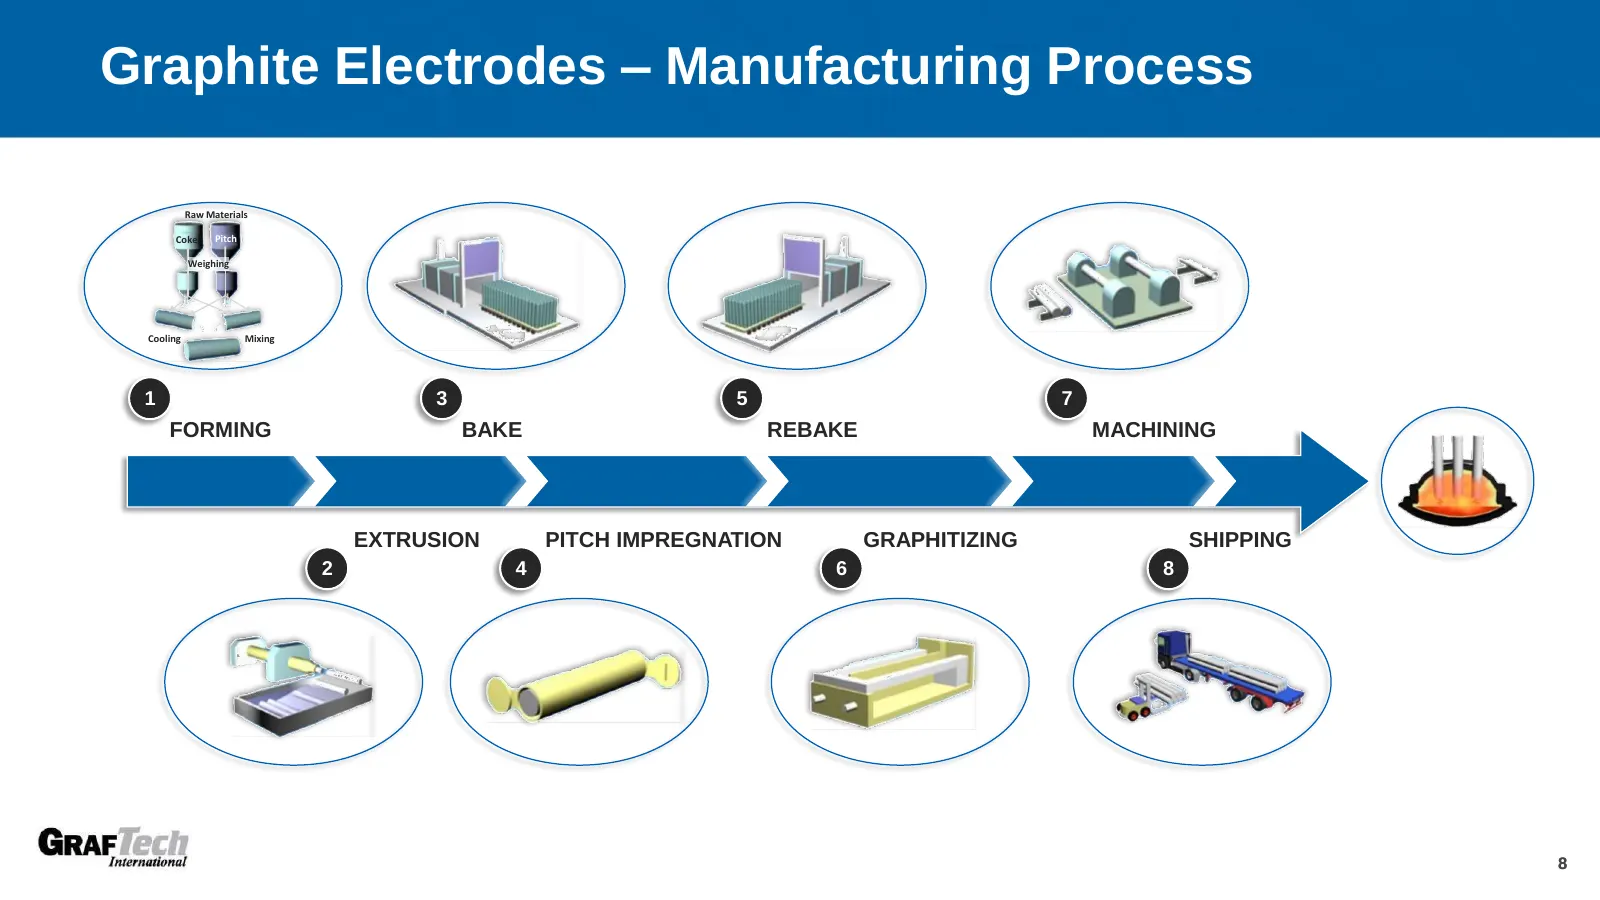
Graphite Electrodes – Manufacturing Process Raw Materials Coke Pitch Weighing Cooling Mixing 1 3 5 7 FORMING BAKE REBAKE MACHINING EXTRUSION PITCH IMPREGNATION GRAPHITIZING SHIPPING 2 4 6 8 8
Slide 9: Differentiated Customer Value Proposition
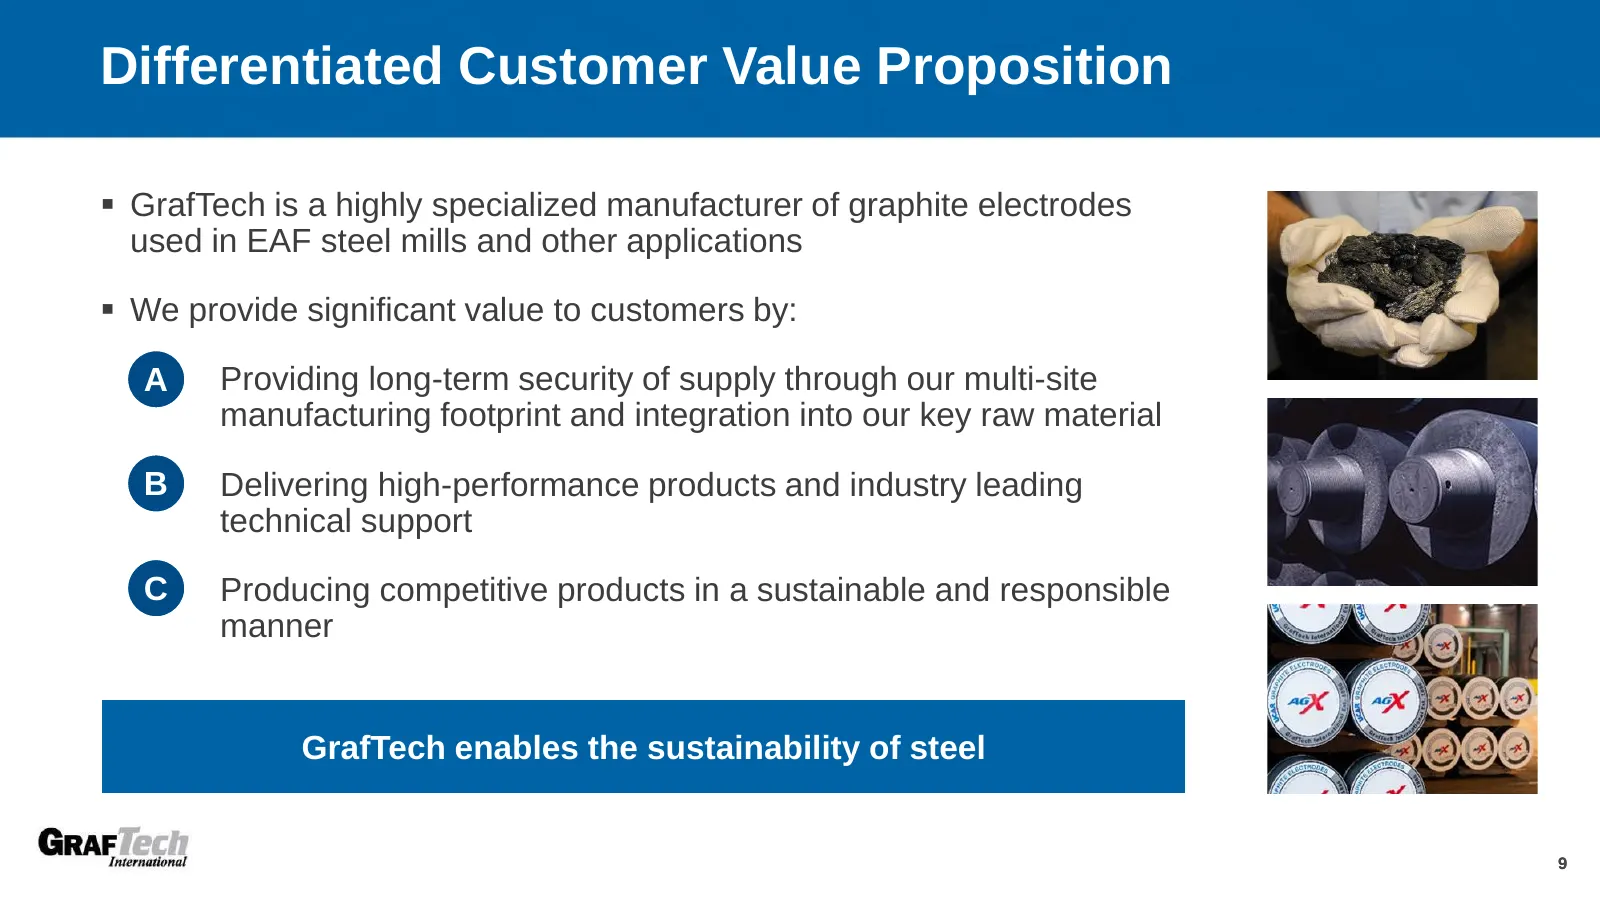
Differentiated Customer Value Proposition ▪ GrafTech is a highly specialized manufacturer of graphite electrodes used in EAF steel mills and other applications ▪ We provide significant value to customers by: A Providing long-term security of supply through our multi-site manufacturing footprint and
Slide 10: A Global Network of Production, Sales & Service
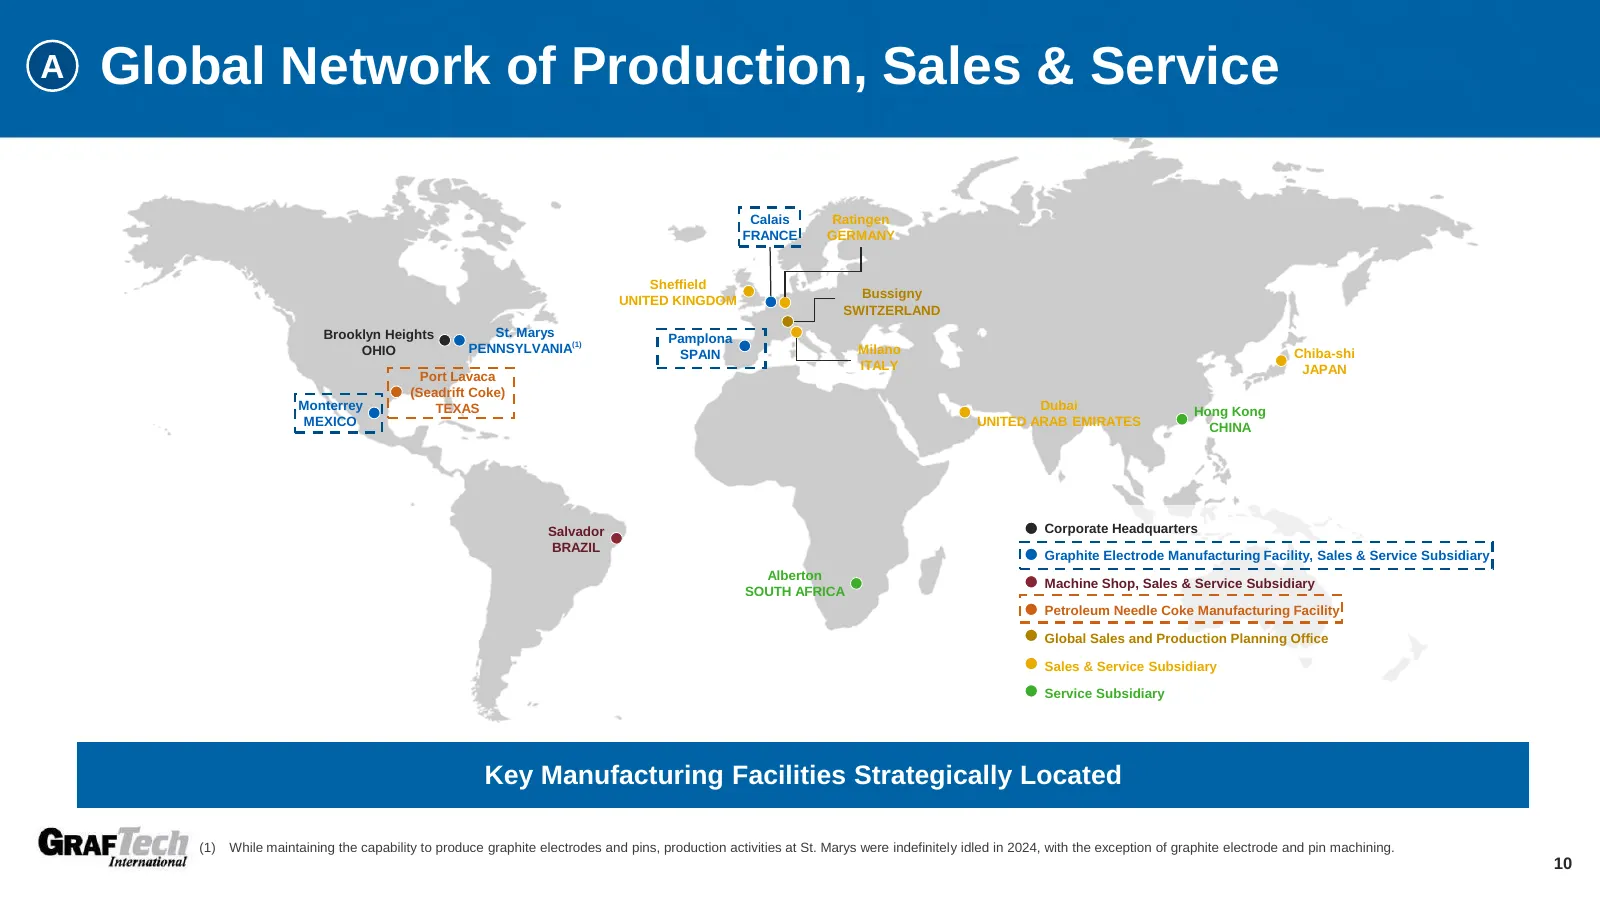
A Global Network of Production, Sales & Service Calais Ratingen FRANCE GERMANY Sheffield Bussigny UNITED KINGDOM SWITZERLAND Brooklyn Heights St. Marys Pamplona OHIO PENNSYLVANIA(1) Milano Chiba-shi SPAIN ITALY JAPAN Port Lavaca (Seadrift Coke) Monterrey TEXAS Dubai Hong Kong MEXICO UNITED ARAB EMIR
Slide 11: Seadrift Coke Provides Vertical Integration Into Key Raw Material
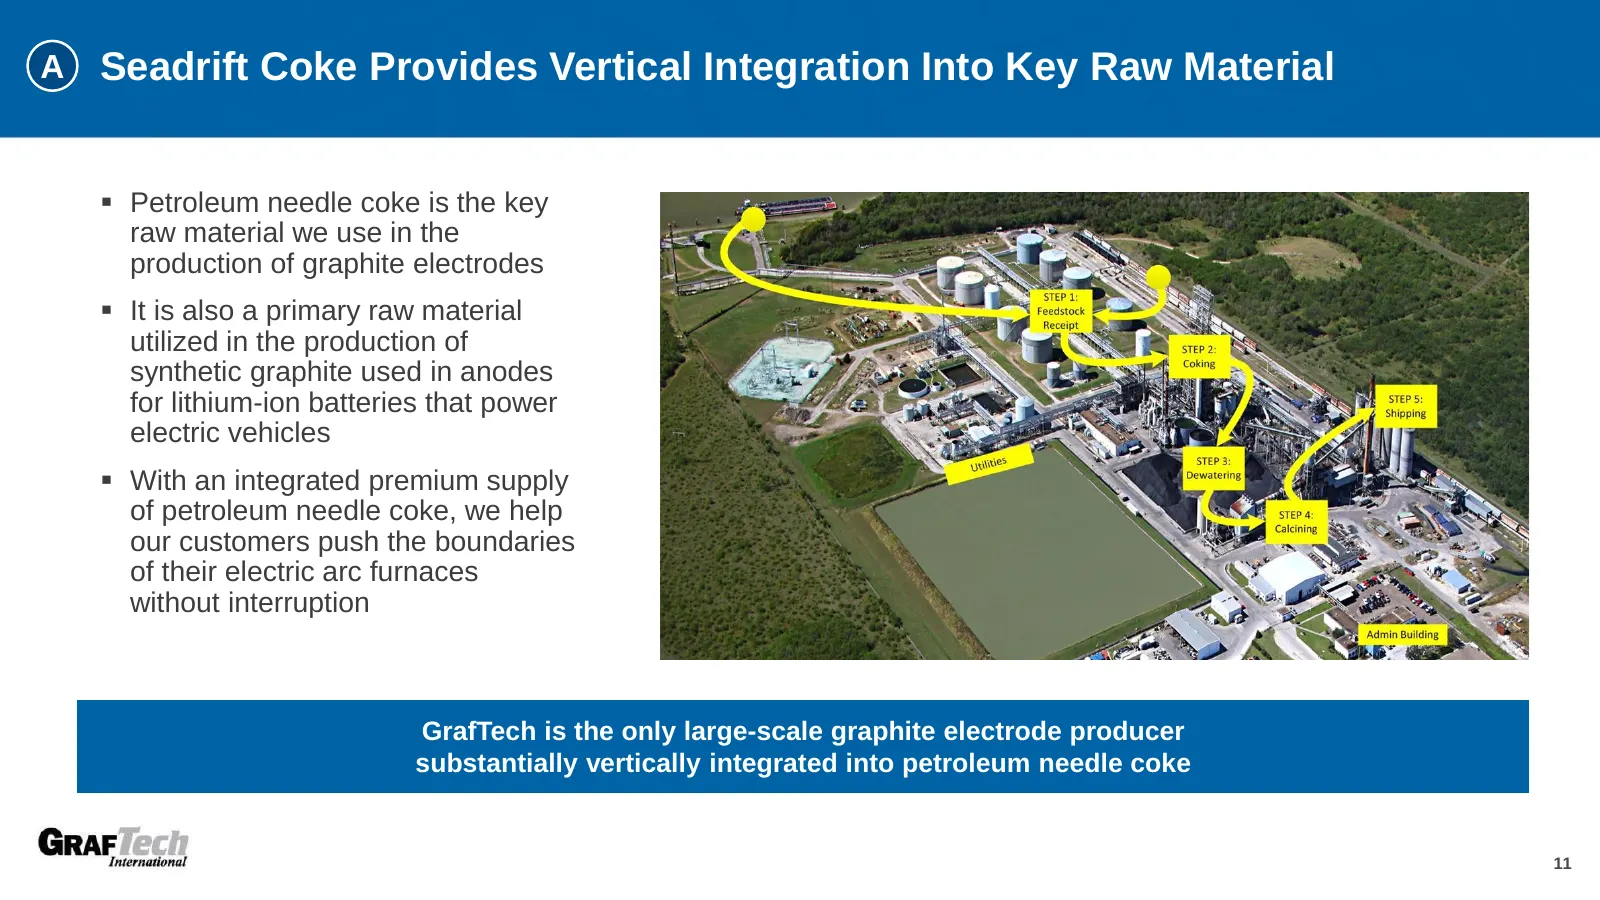
A Seadrift Coke Provides Vertical Integration Into Key Raw Material ▪ Petroleum needle coke is the key raw material we use in the production of graphite electrodes ▪ It is also a primary raw material utilized in the production of synthetic graphite used in anodes for lithium-ion batteries that power
Slide 12: Continuously Expanding Product and Commercial Offerings
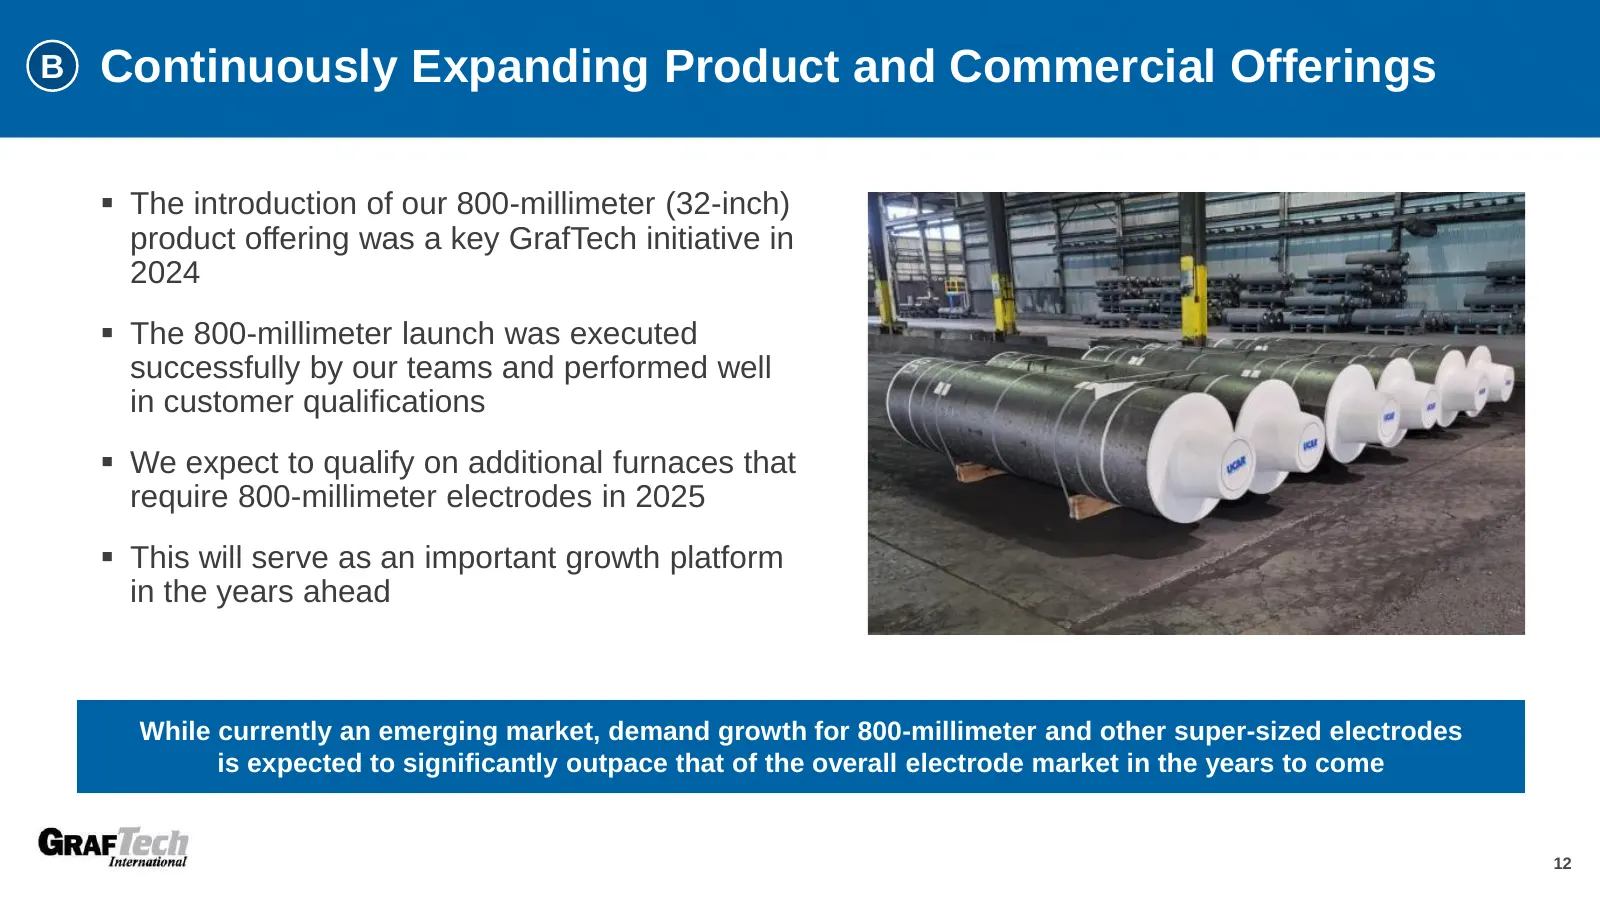
B Continuously Expanding Product and Commercial Offerings ▪ The introduction of our 800-millimeter (32-inch) product offering was a key GrafTech initiative in 2024 ▪ The 800-millimeter launch was executed successfully by our teams and performed well in customer qualifications ▪ We expect to qualify
Slide 13: ArchiTech Furnace Productivity System
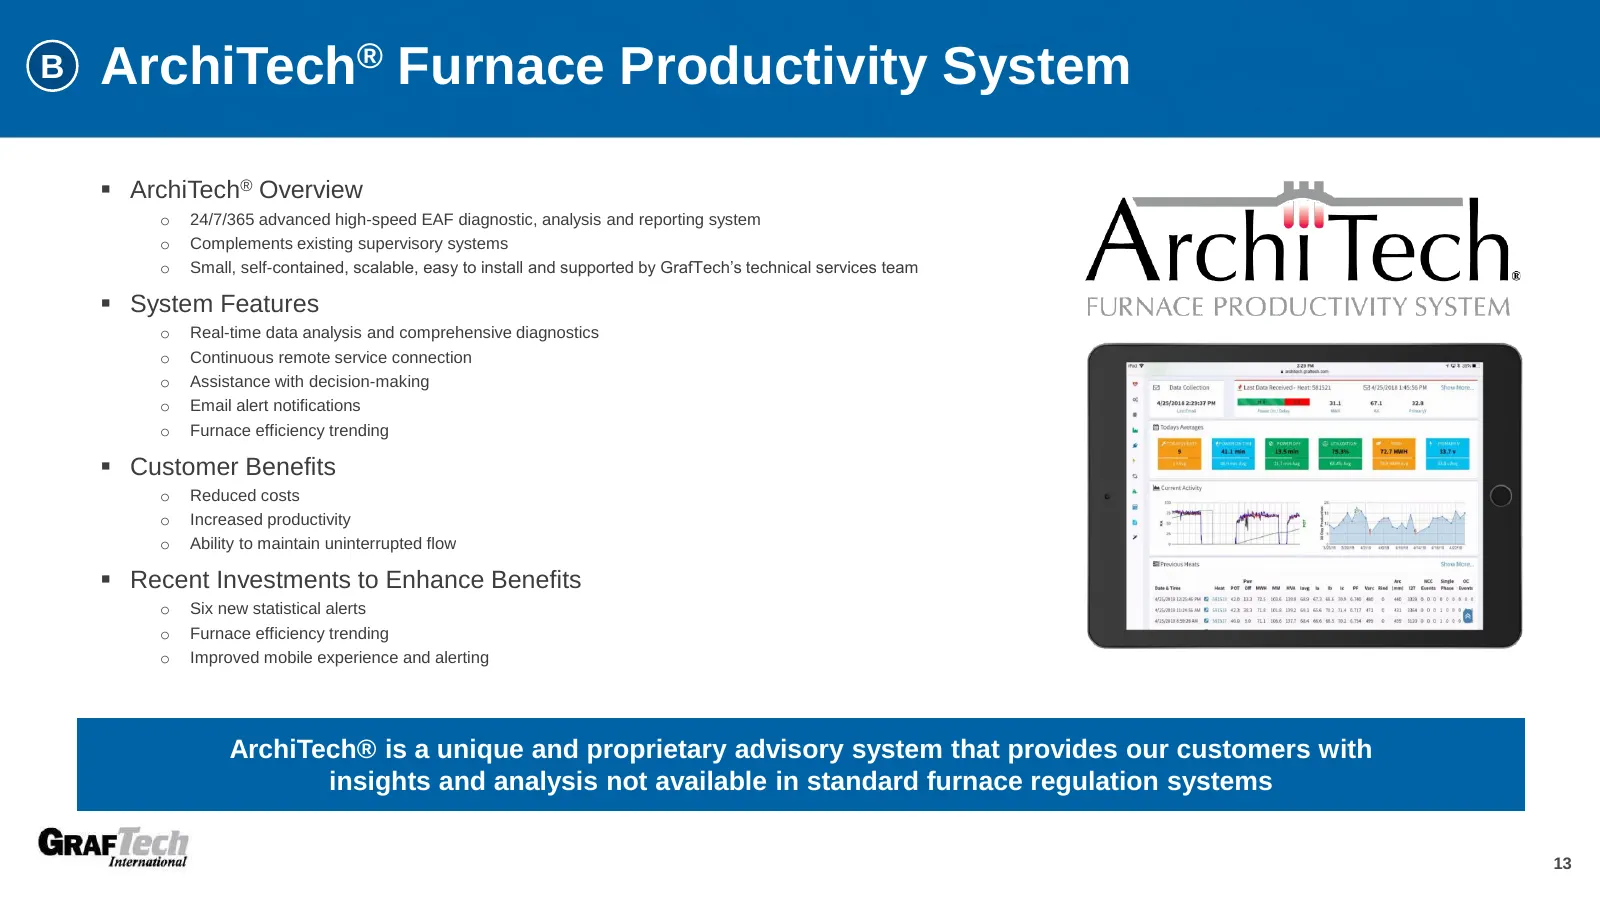
B ArchiTech® Furnace Productivity System ▪ ArchiTech® Overview o 24/7/365 advanced high-speed EAF diagnostic, analysis and reporting system o Complements existing supervisory systems o Small, self-contained, scalable, easy to install and supported by GrafTech’s technical services team ▪ System Featu
Slide 14: Success Stories Shared by GrafTech Customers using ArchiTech
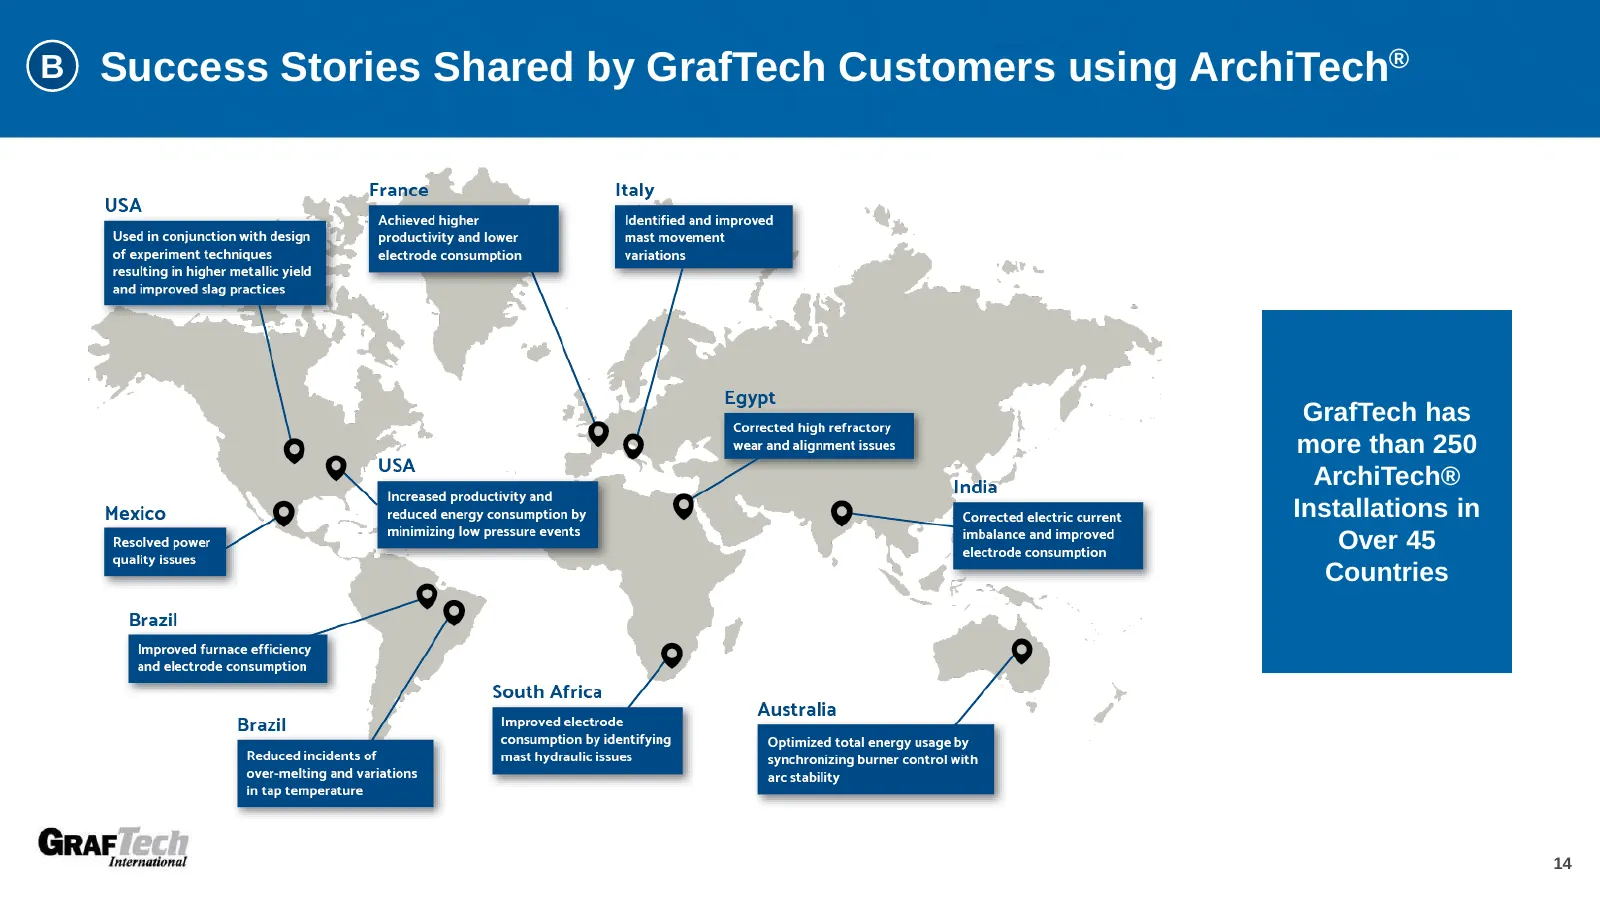
B Success Stories Shared by GrafTech Customers using ArchiTech® GrafTech has more than 250 ArchiTech® Installations in Over 45 Countries 14
Slide 15: Best-in-Class Customer Technical Service (CTS)
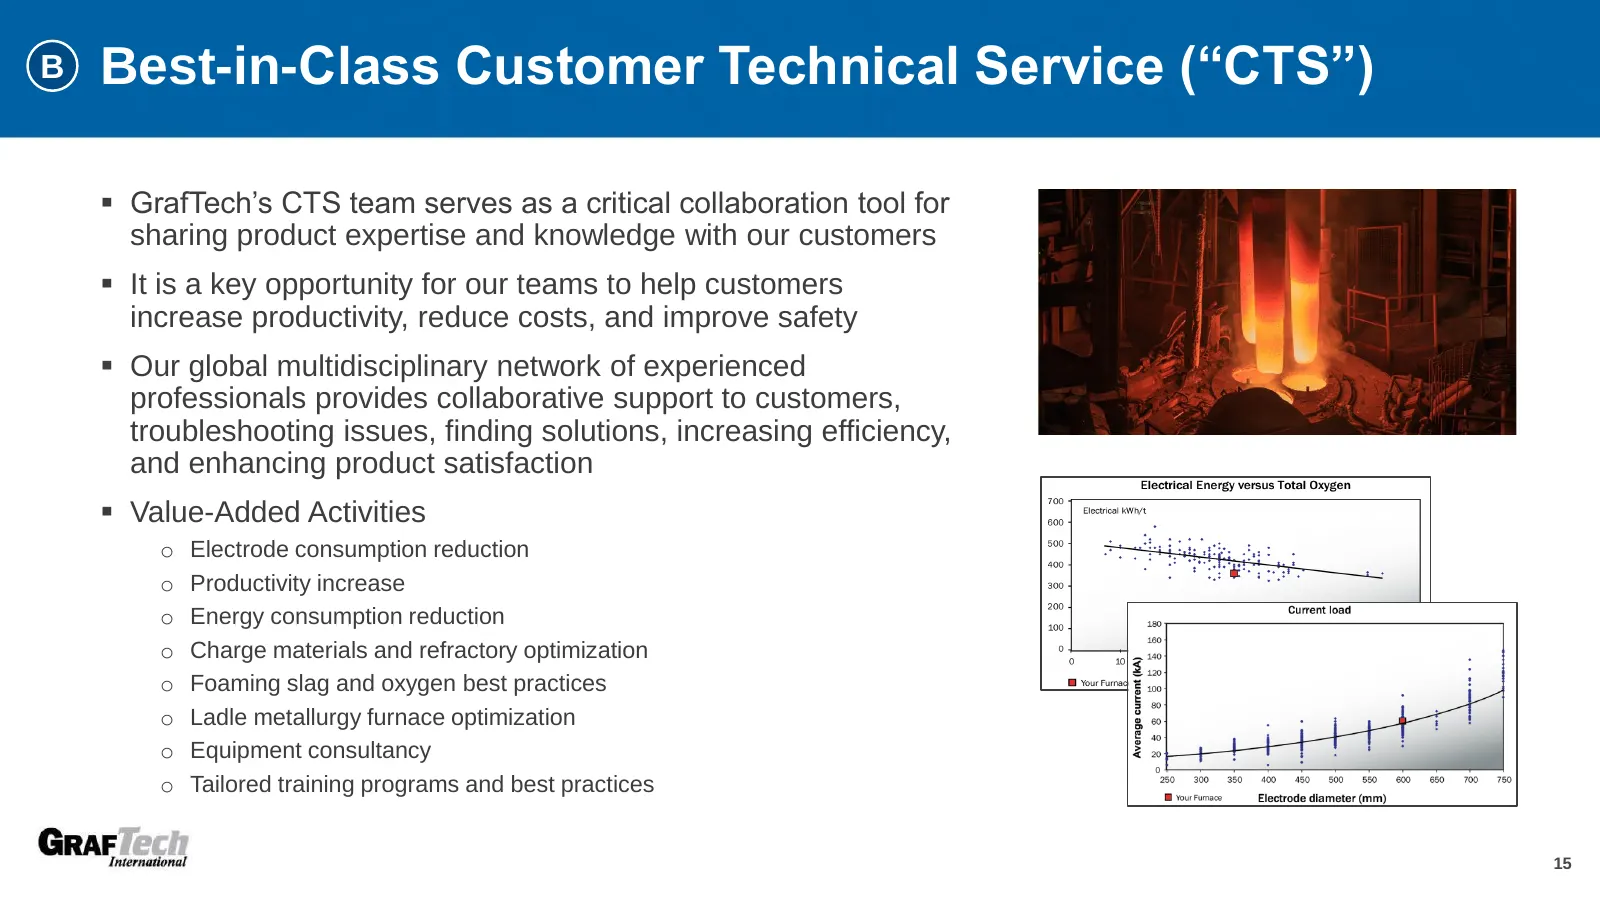
B Best-in-Class Customer Technical Service (“CTS”) ▪ GrafTech’s CTS team serves as a critical collaboration tool for sharing product expertise and knowledge with our customers ▪ It is a key opportunity for our teams to help customers increase productivity, reduce costs, and improve safety ▪ Our glob
Slide 16: Sustainability Is Fundamental to GrafTech's Business Strategy and Culture
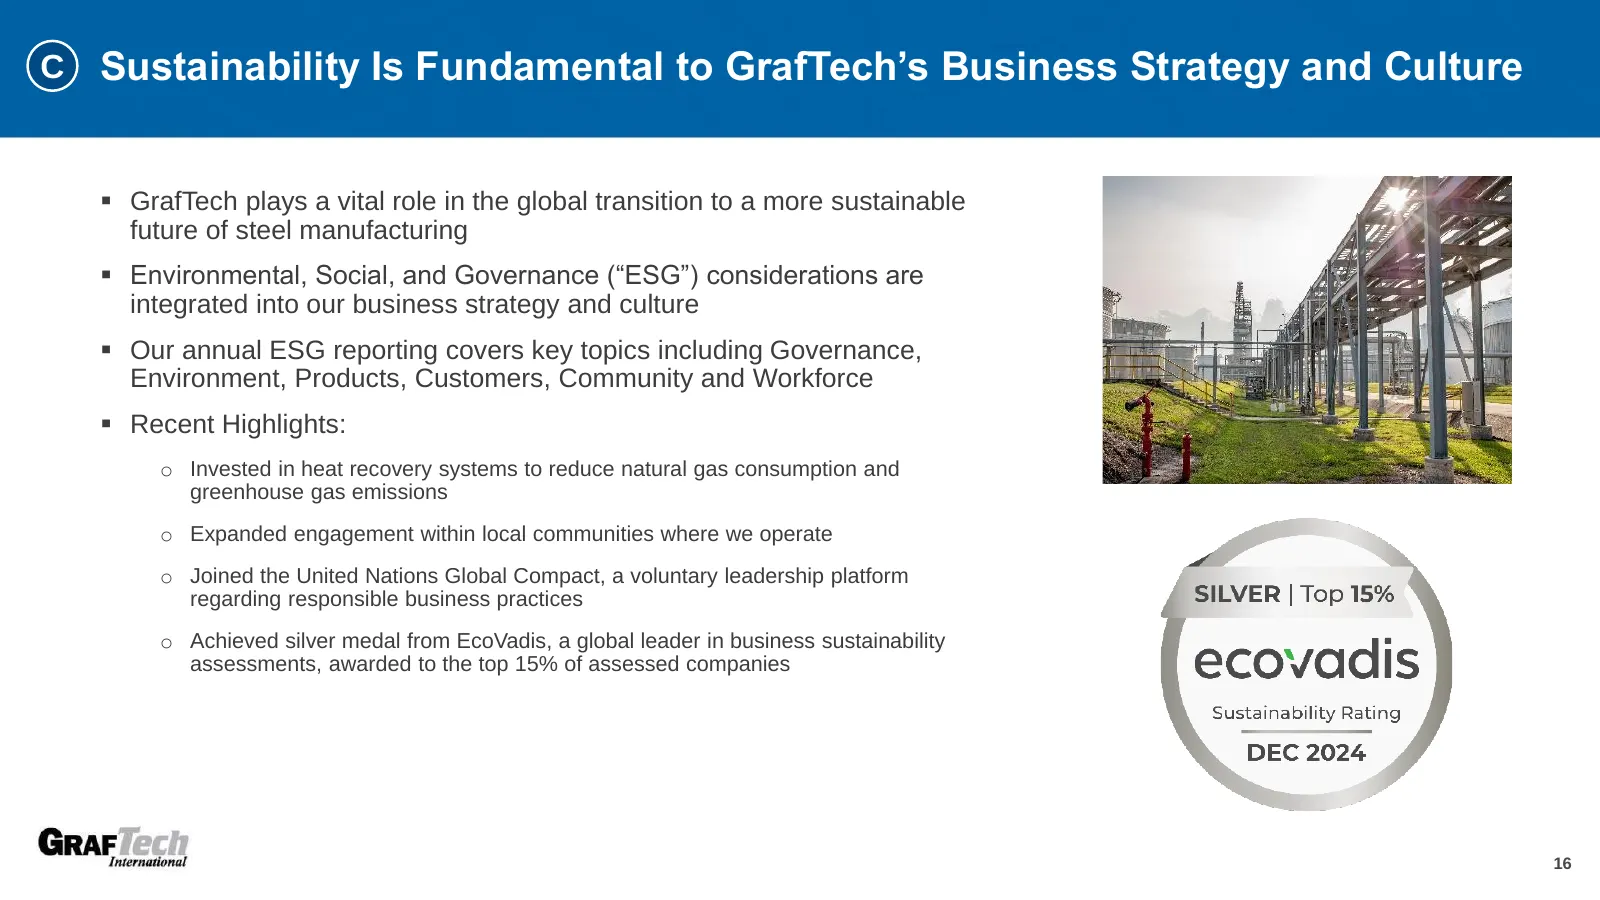
C Sustainability Is Fundamental to GrafTech’s Business Strategy and Culture ▪ GrafTech plays a vital role in the global transition to a more sustainable future of steel manufacturing ▪ Environmental, Social, and Governance (“ESG”) considerations are integrated into our business strategy and culture

Slide 17: Business Highlights
Business Highlights GraF lec)
Slide 18: Business Highlights
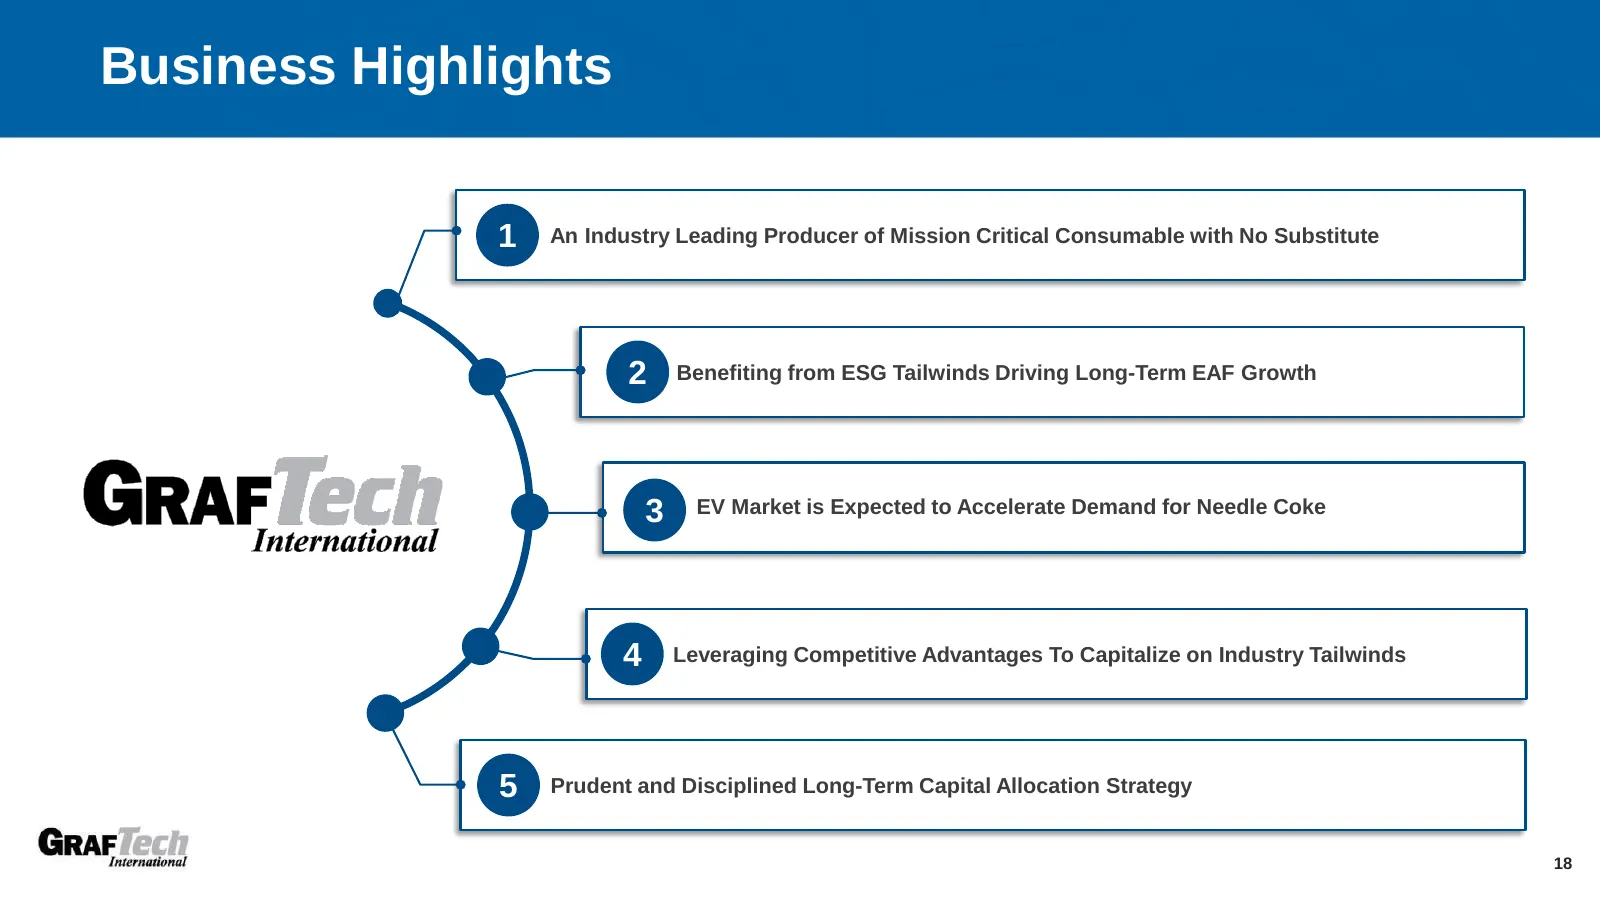
Business Highlights 1 An Industry Leading Producer of Mission Critical Consumable with No Substitute 2 Benefiting from ESG Tailwinds Driving Long-Term EAF Growth 3 EV Market is Expected to Accelerate Demand for Needle Coke 4 Leveraging Competitive Advantages To Capitalize on Industry Tailwinds 5 Pru
Slide 19: An Industry Leading Producer of Mission Critical Consumable with No Substitute
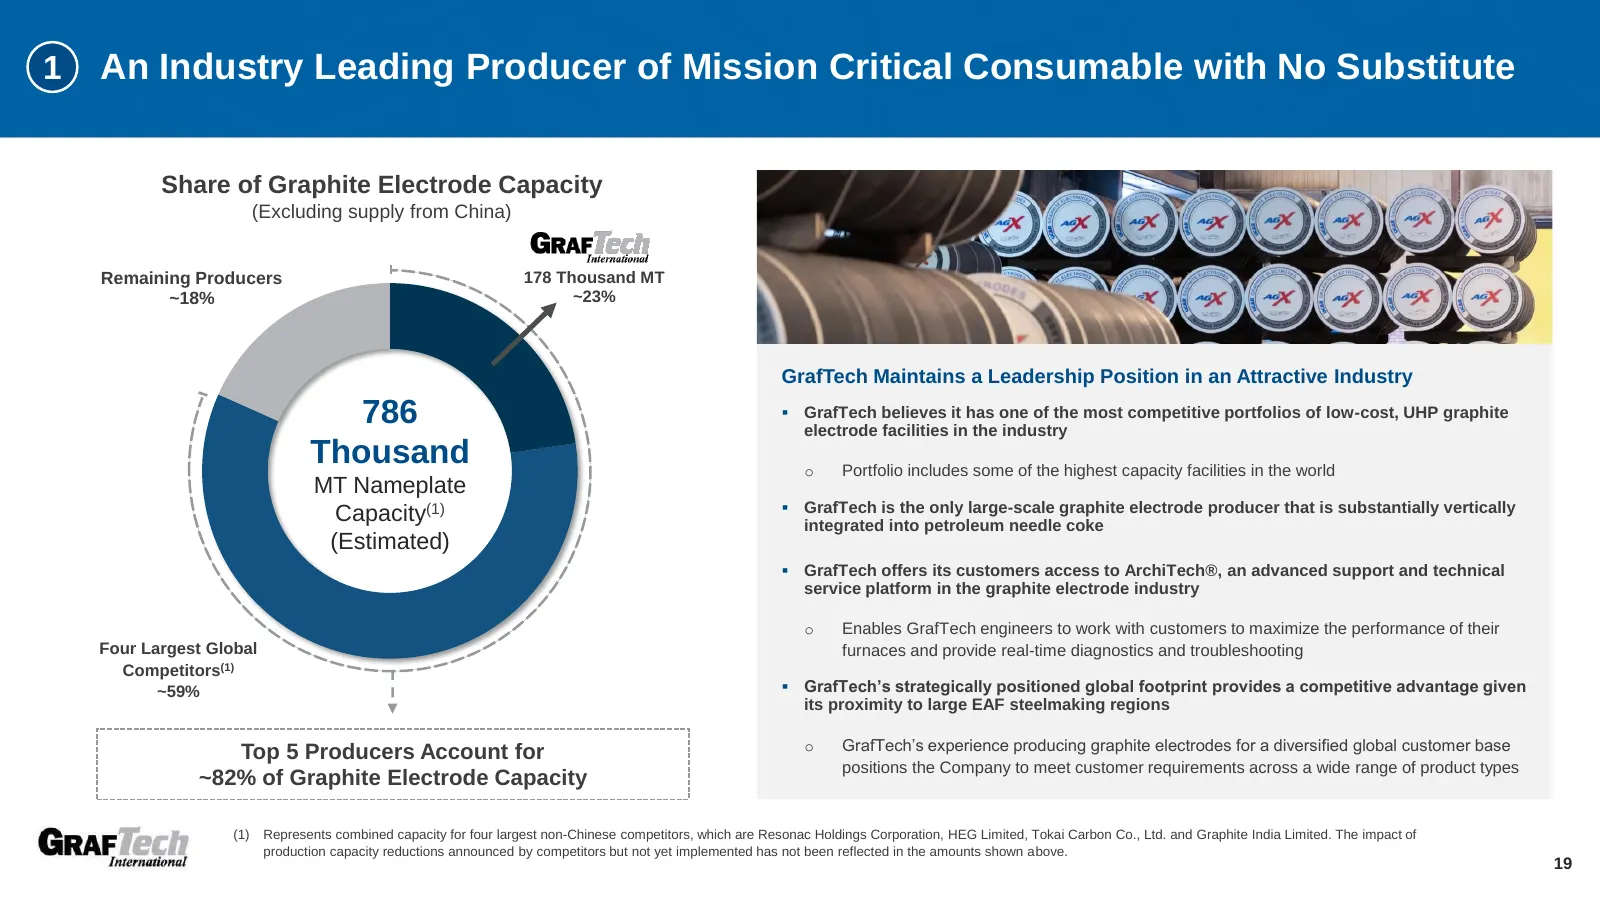
1 An Industry Leading Producer of Mission Critical Consumable with No Substitute Share of Graphite Electrode Capacity (Excluding supply from China) Remaining Producers 178 Thousand MT ~18% ~23% GrafTech Maintains a Leadership Position in an Attractive Industry 786 ▪ GrafTech believes it has one of t
Slide 20: Benefiting from ESG Tailwinds Driving Long-Term EAF Growth
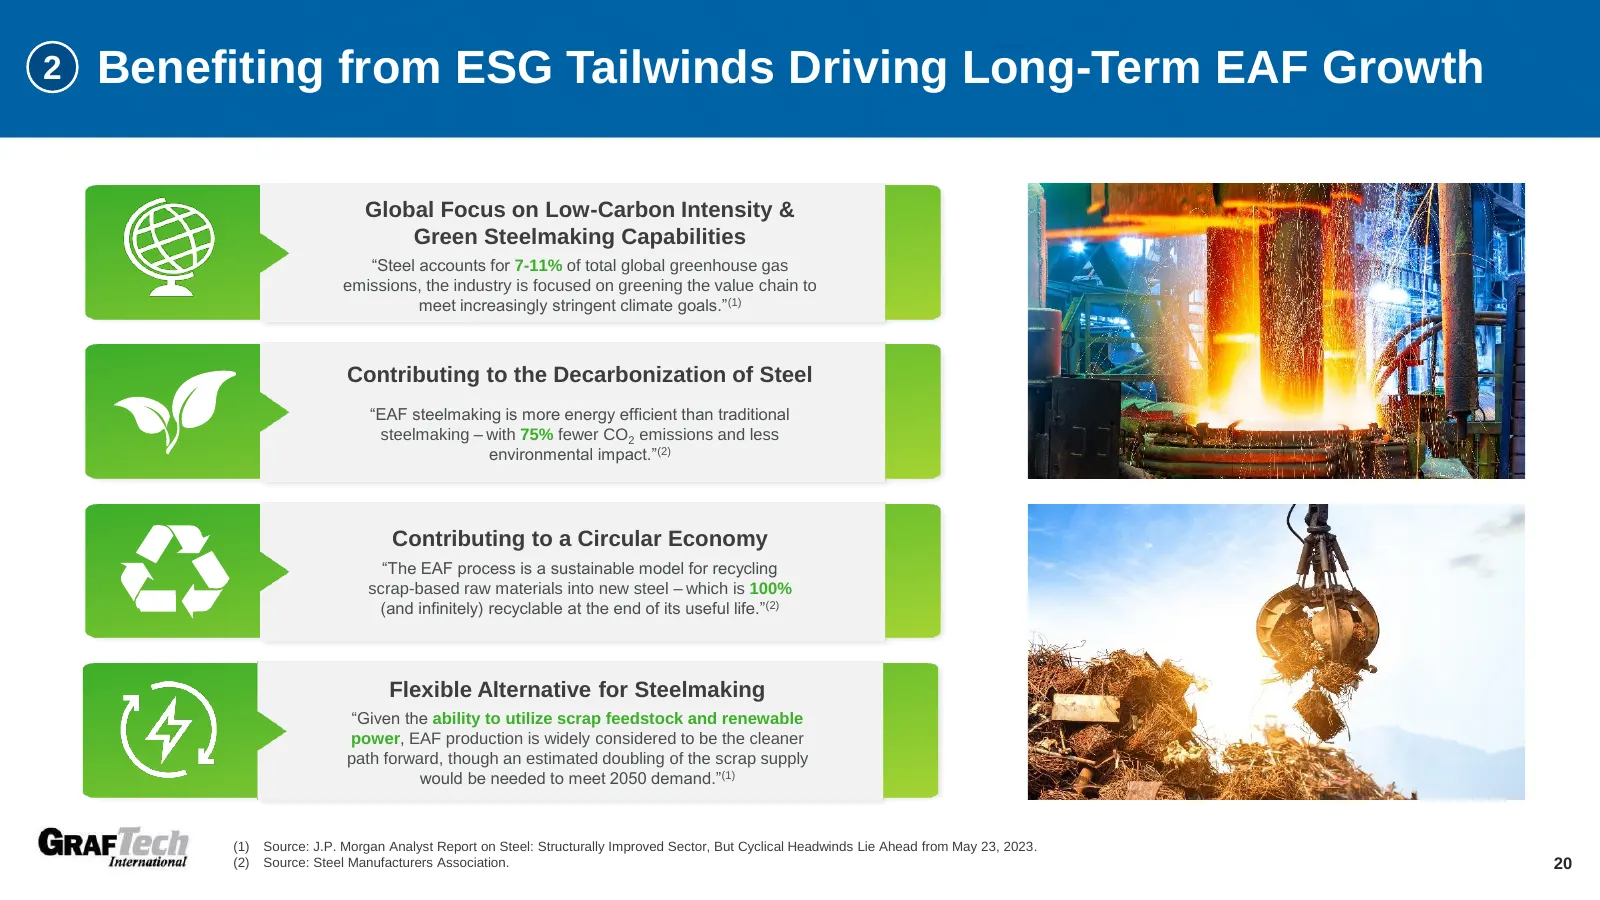
2 Benefiting from ESG Tailwinds Driving Long-Term EAF Growth Global Focus on Low-Carbon Intensity & Green Steelmaking Capabilities “Steel accounts for 7-11% of total global greenhouse gas emissions, the industry is focused on greening the value chain to meet increasingly stringent climate goals.”(1)
Slide 21: Benefiting from ESG Tailwinds Driving Long-Term EAF Growth (cont.)
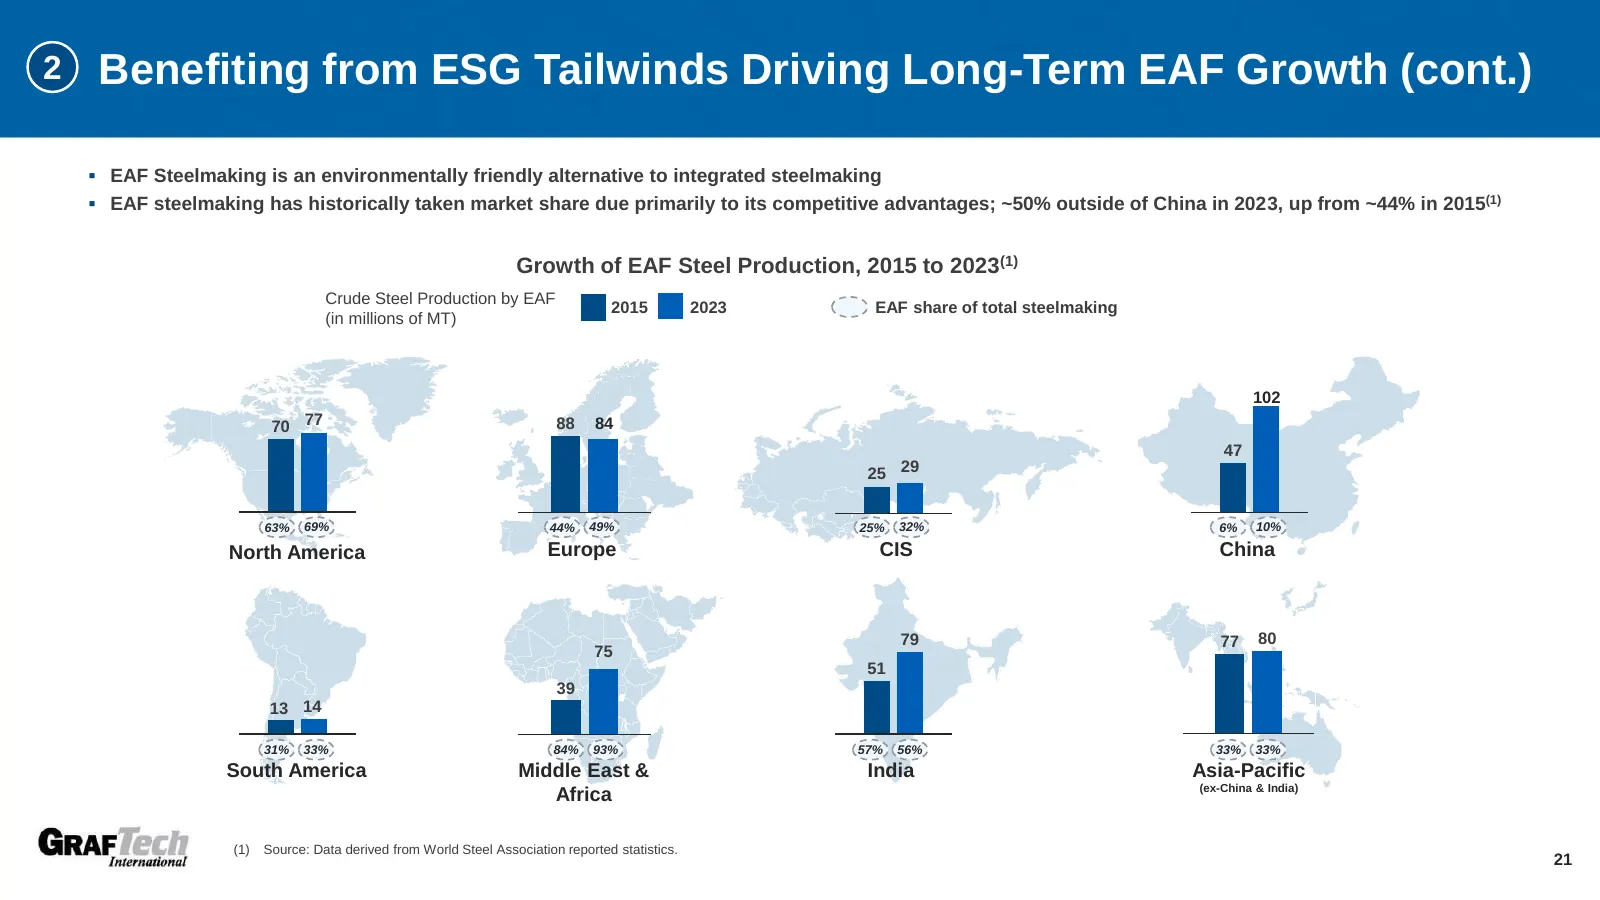
2 Benefiting from ESG Tailwinds Driving Long-Term EAF Growth (cont.) ▪ EAF Steelmaking is an environmentally friendly alternative to integrated steelmaking ▪ EAF steelmaking has historically taken market share due primarily to its competitive advantages; ~50% outside of China in 2023, up from ~44% i
Slide 22: Benefiting from ESG Tailwinds Driving Long-Term EAF Growth (cont.)
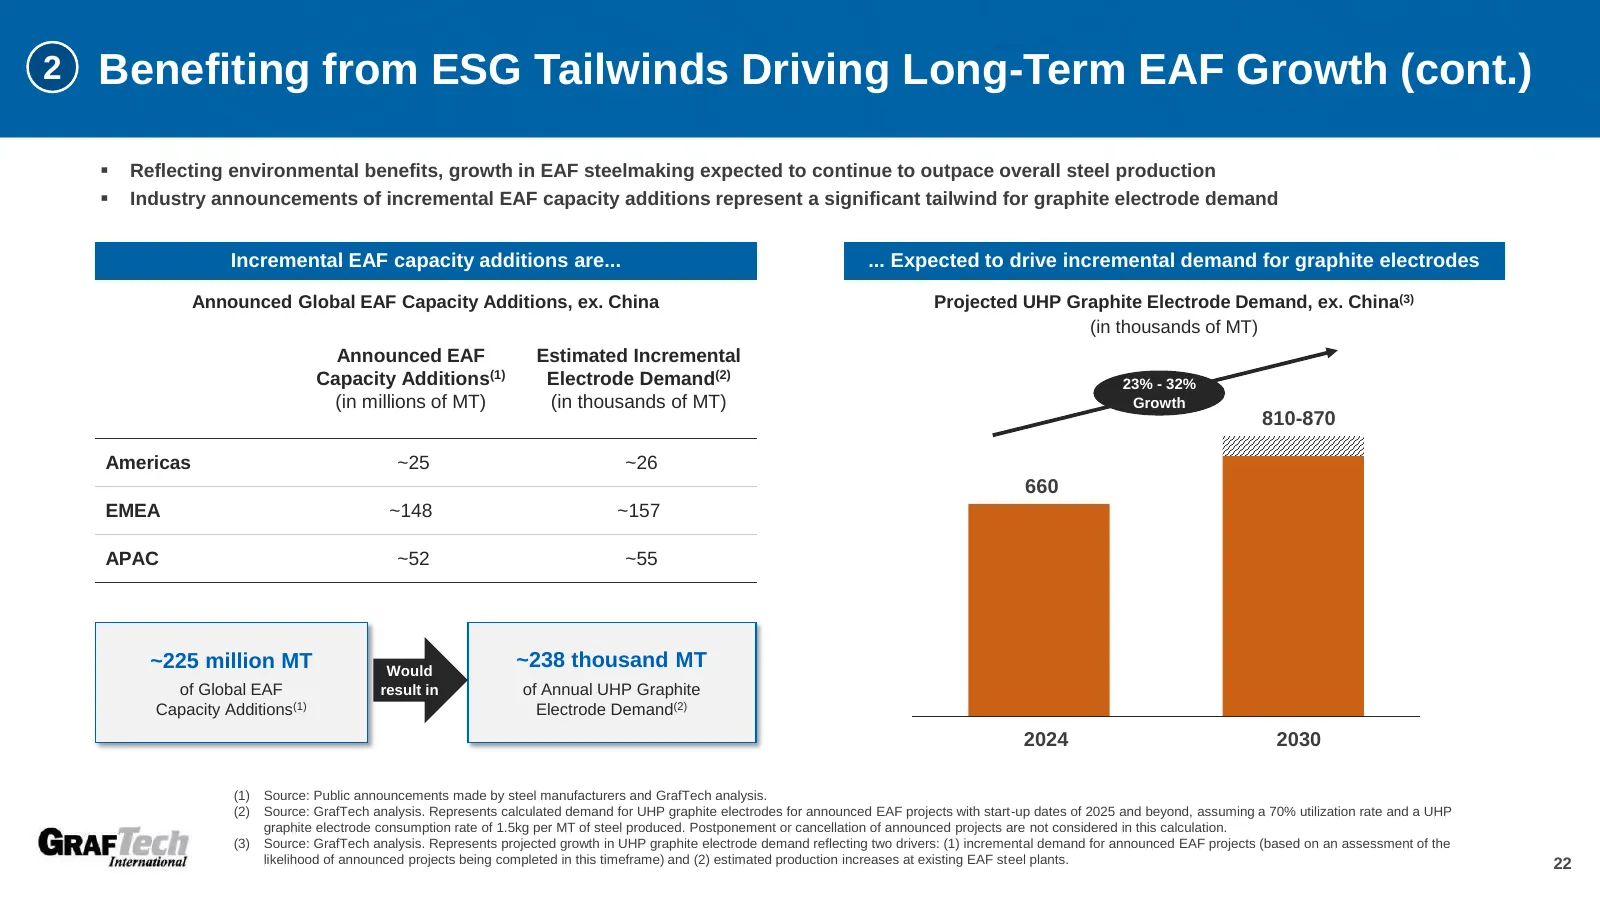
2 Benefiting from ESG Tailwinds Driving Long-Term EAF Growth (cont.) ▪ Reflecting environmental benefits, growth in EAF steelmaking expected to continue to outpace overall steel production ▪ Industry announcements of incremental EAF capacity additions represent a significant tailwind for graphite el
Slide 23: EV Market is Expected to Accelerate Demand for Needle Coke
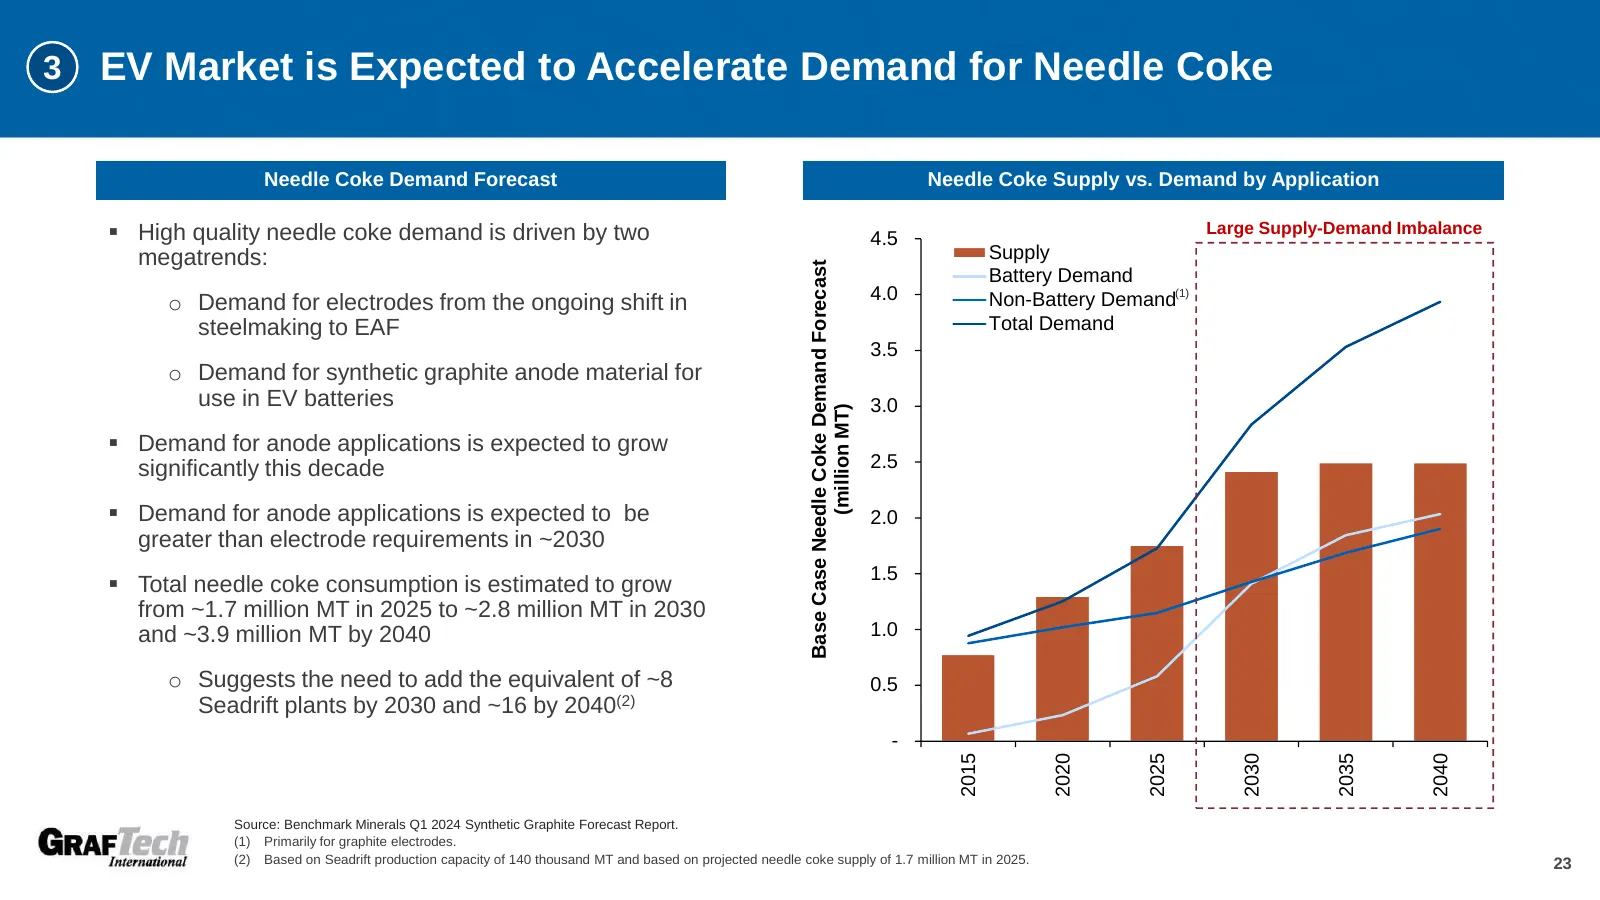
3 EV Market is Expected to Accelerate Demand for Needle Coke Needle Coke Demand Forecast Needle Coke Supply vs. Demand by Application ▪ High quality needle coke demand is driven by two 4.5 Large Supply-Demand Imbalance megatrends: Supply Base Case Needle Coke Demand Forecast Battery Demand o Demand
Slide 24: Leveraging Competitive Advantages To Capitalize on Industry Tailwinds
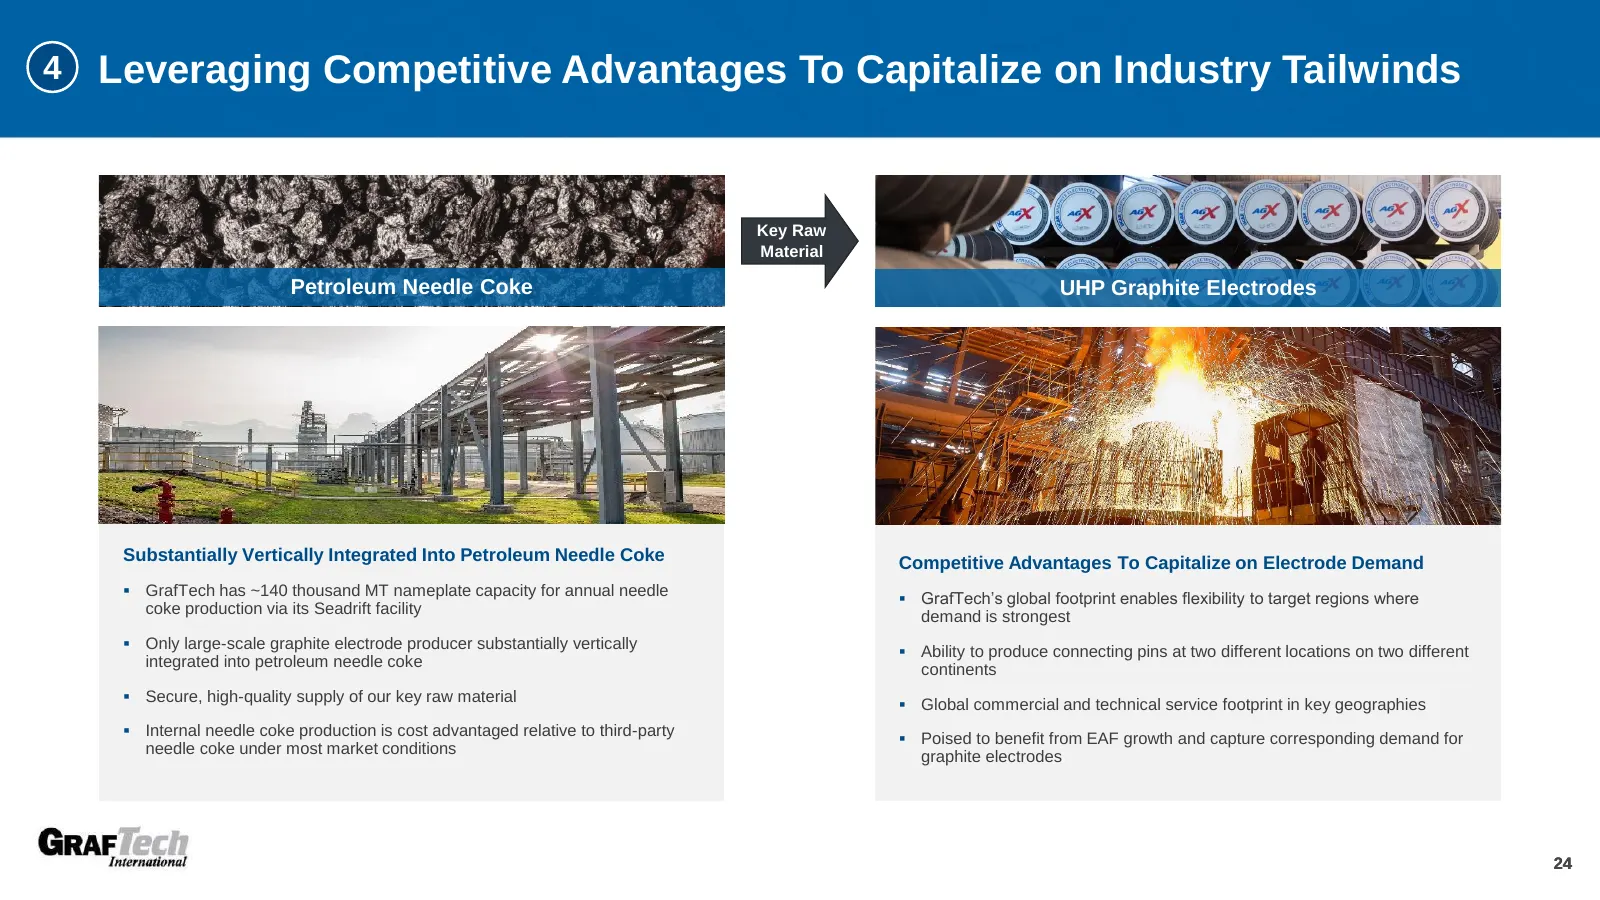
4 Leveraging Competitive Advantages To Capitalize on Industry Tailwinds Key Raw Material Petroleum Needle Coke UHP Graphite Electrodes Substantially Vertically Integrated Into Petroleum Needle Coke Competitive Advantages To Capitalize on Electrode Demand ▪ GrafTech has ~140 thousand MT nameplate cap
Slide 25: Leveraging Competitive Advantages To Capitalize on Industry Tailwinds (cont.)
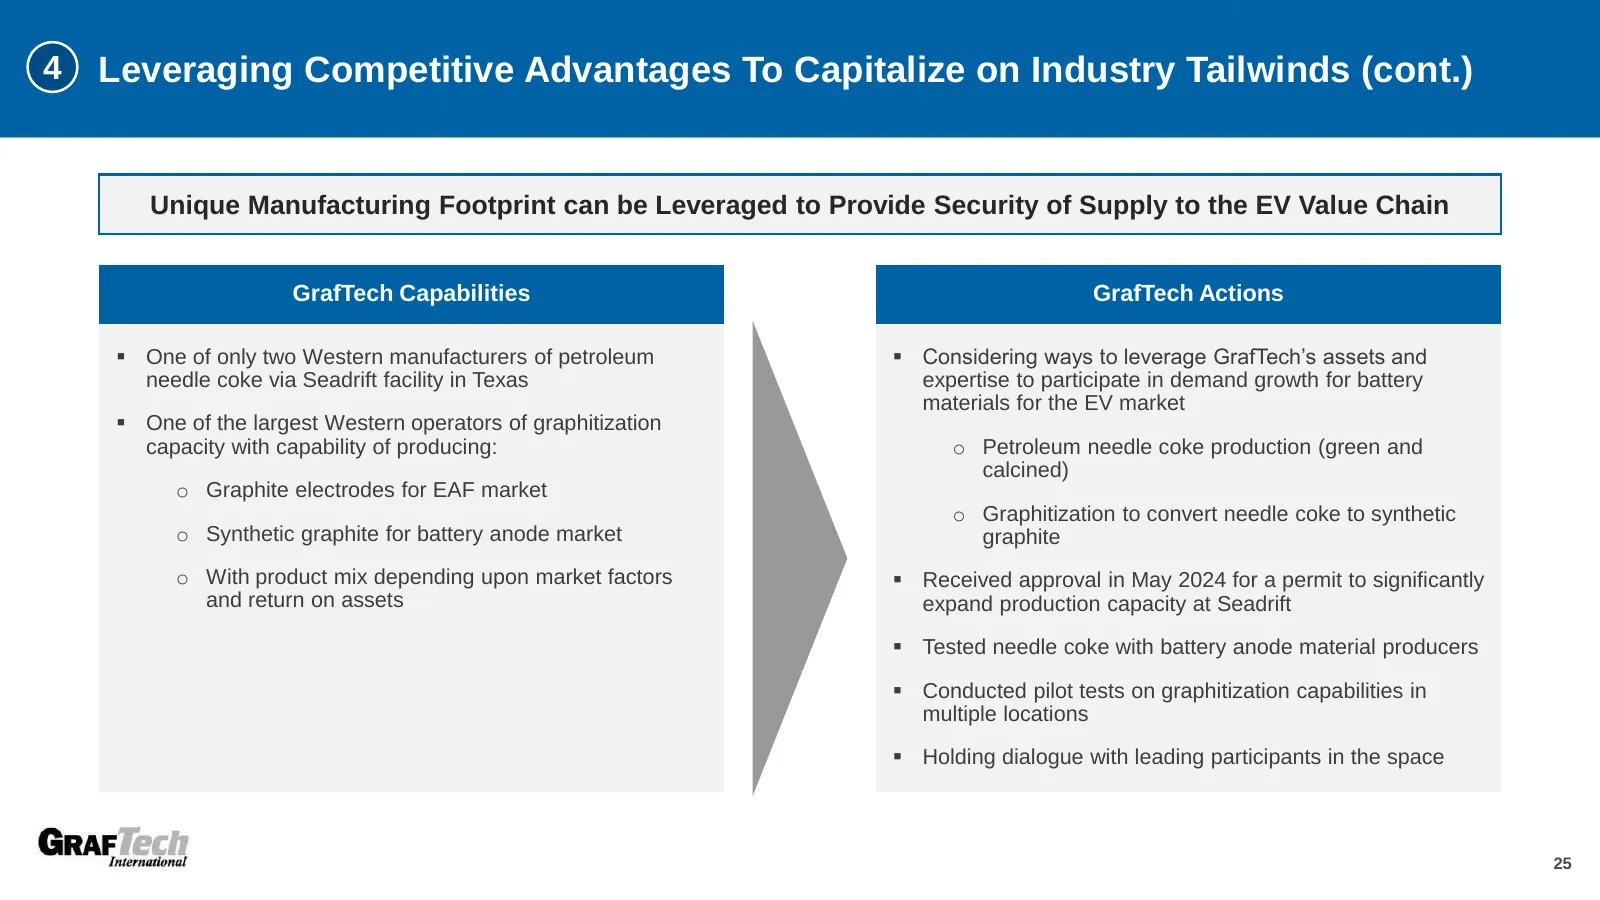
4 Leveraging Competitive Advantages To Capitalize on Industry Tailwinds (cont.) Unique Manufacturing Footprint can be Leveraged to Provide Security of Supply to the EV Value Chain GrafTech Capabilities GrafTech Actions ▪ One of only two Western manufacturers of petroleum ▪ Considering ways to levera
Slide 26: Prudent and Disciplined Long-Term Capital Allocation Strategy
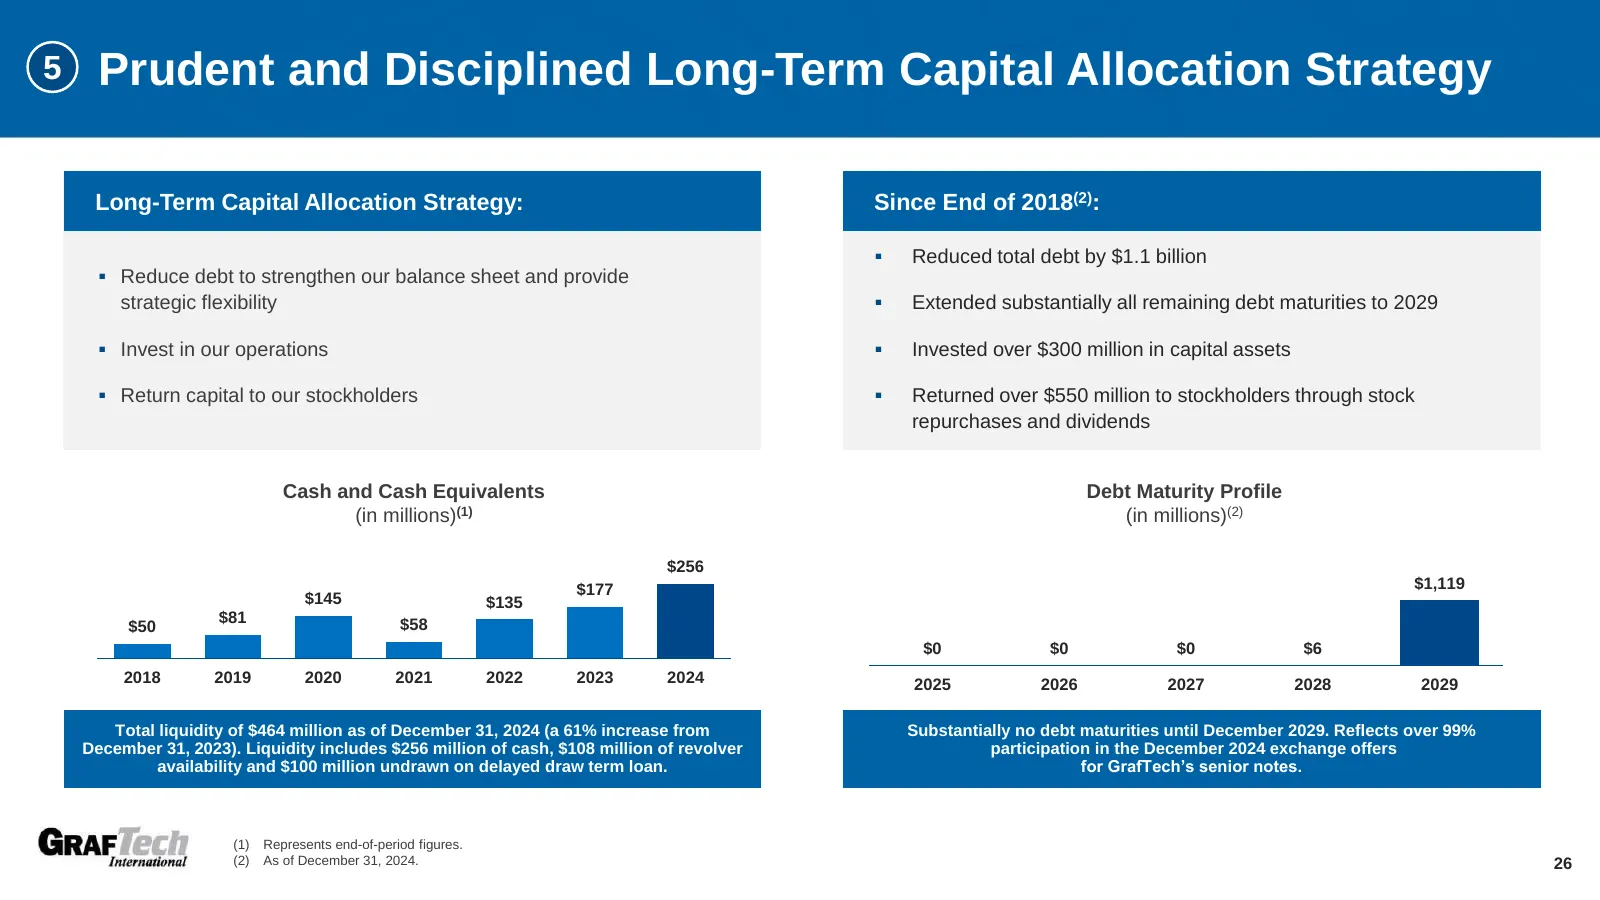
5 Prudent and Disciplined Long-Term Capital Allocation Strategy Long-Term Capital Allocation Strategy: Since End of 2018(2): ▪ Reduced total debt by $1.1 billion ▪ Reduce debt to strengthen our balance sheet and provide strategic flexibility ▪ Extended substantially all remaining debt maturities to
Slide 27: Business Update as of Q4 2024
Business Update as of Q4 2024 27
Slide 28: Successfully Delivered On Stated Objectives In 2024
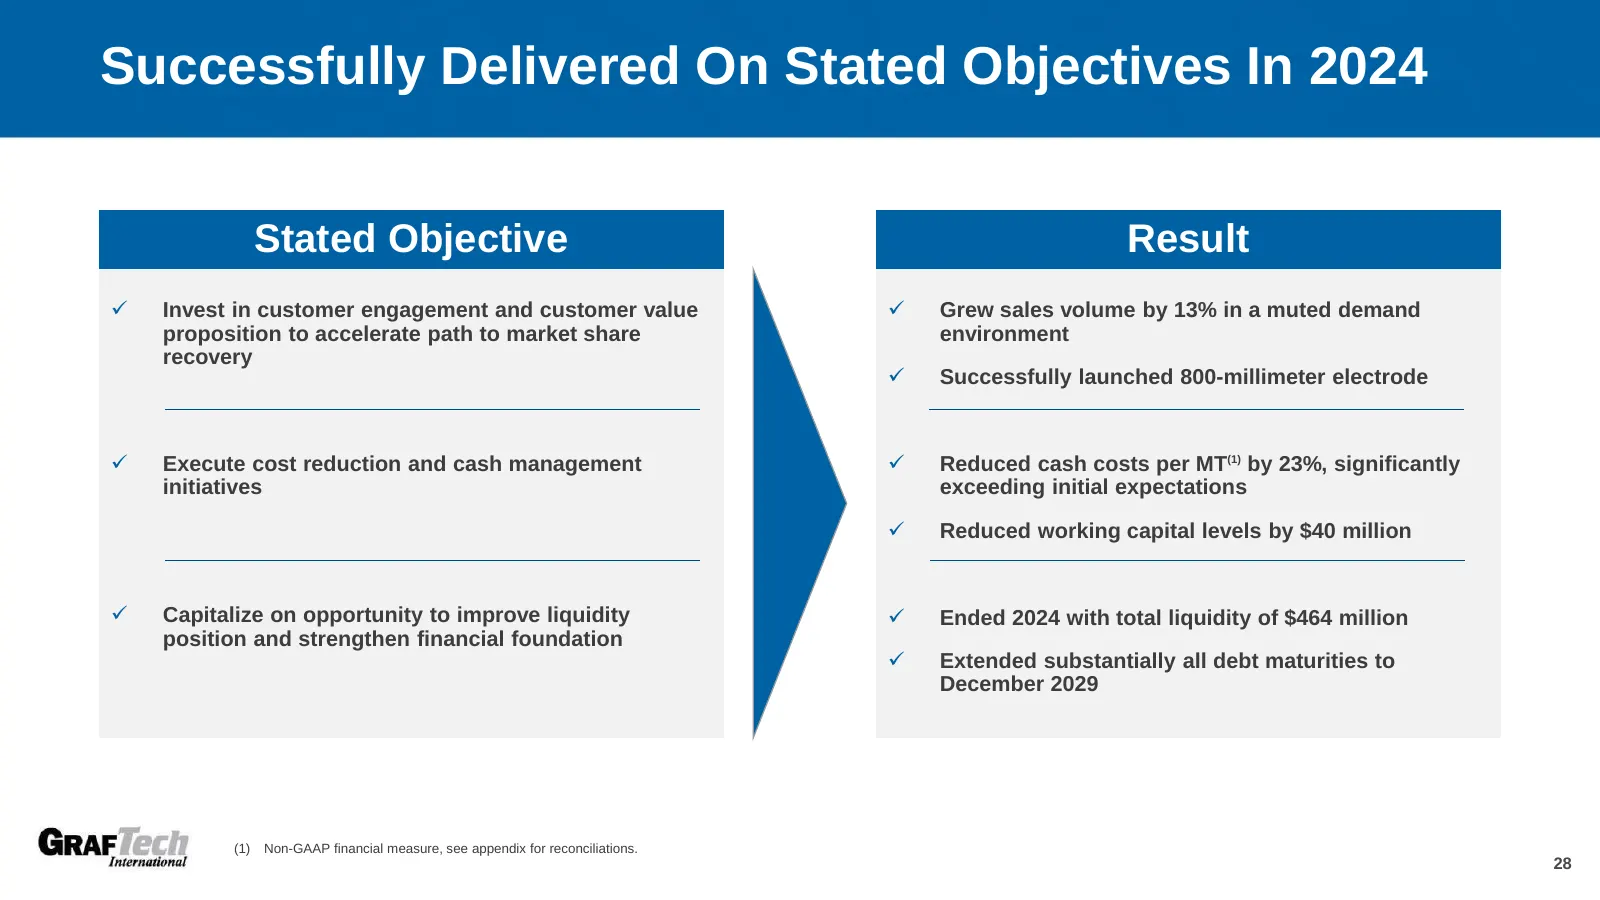
Successfully Delivered On Stated Objectives In 2024 Stated Objective Result ✓ Invest in customer engagement and customer value ✓ Grew sales volume by 13% in a muted demand proposition to accelerate path to market share environment recovery ✓ Successfully launched 800-millimeter electrode ✓ Execute c
Slide 29: Expanding Initiatives to Manage Persistent Near-term Industry Softness
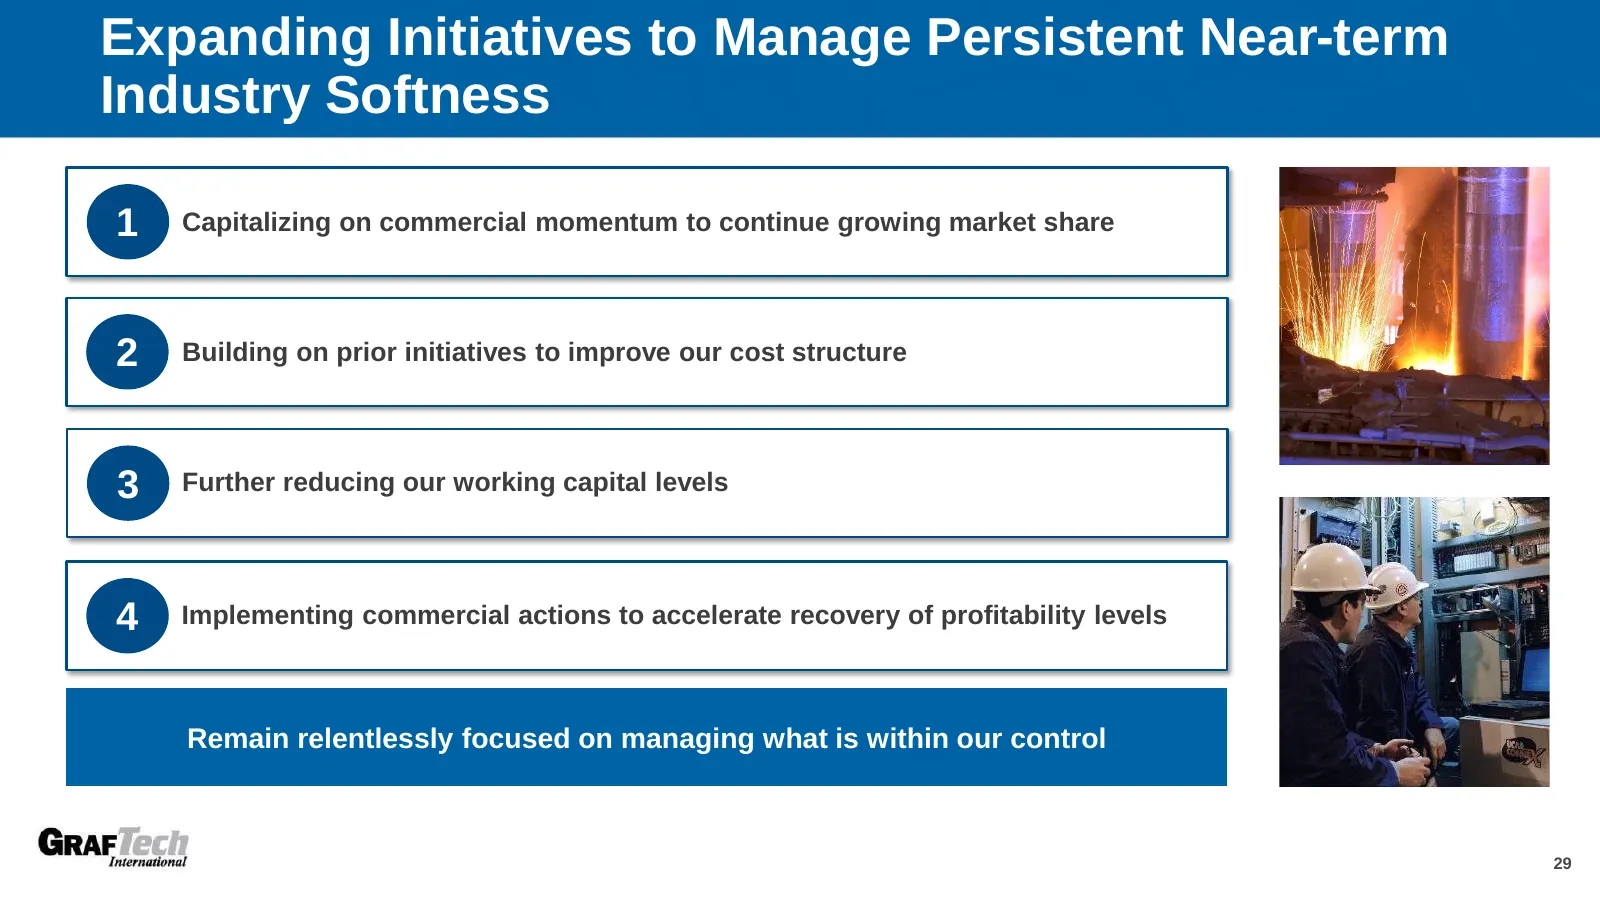
Expanding Initiatives to Manage Persistent Near-term Industry Softness 1 Capitalizing on commercial momentum to continue growing market share 2 Building on prior initiatives to improve our cost structure 3 Further reducing our working capital levels 4 Implementing commercial actions to accelerate re
Slide 30: Steel Industry Trends
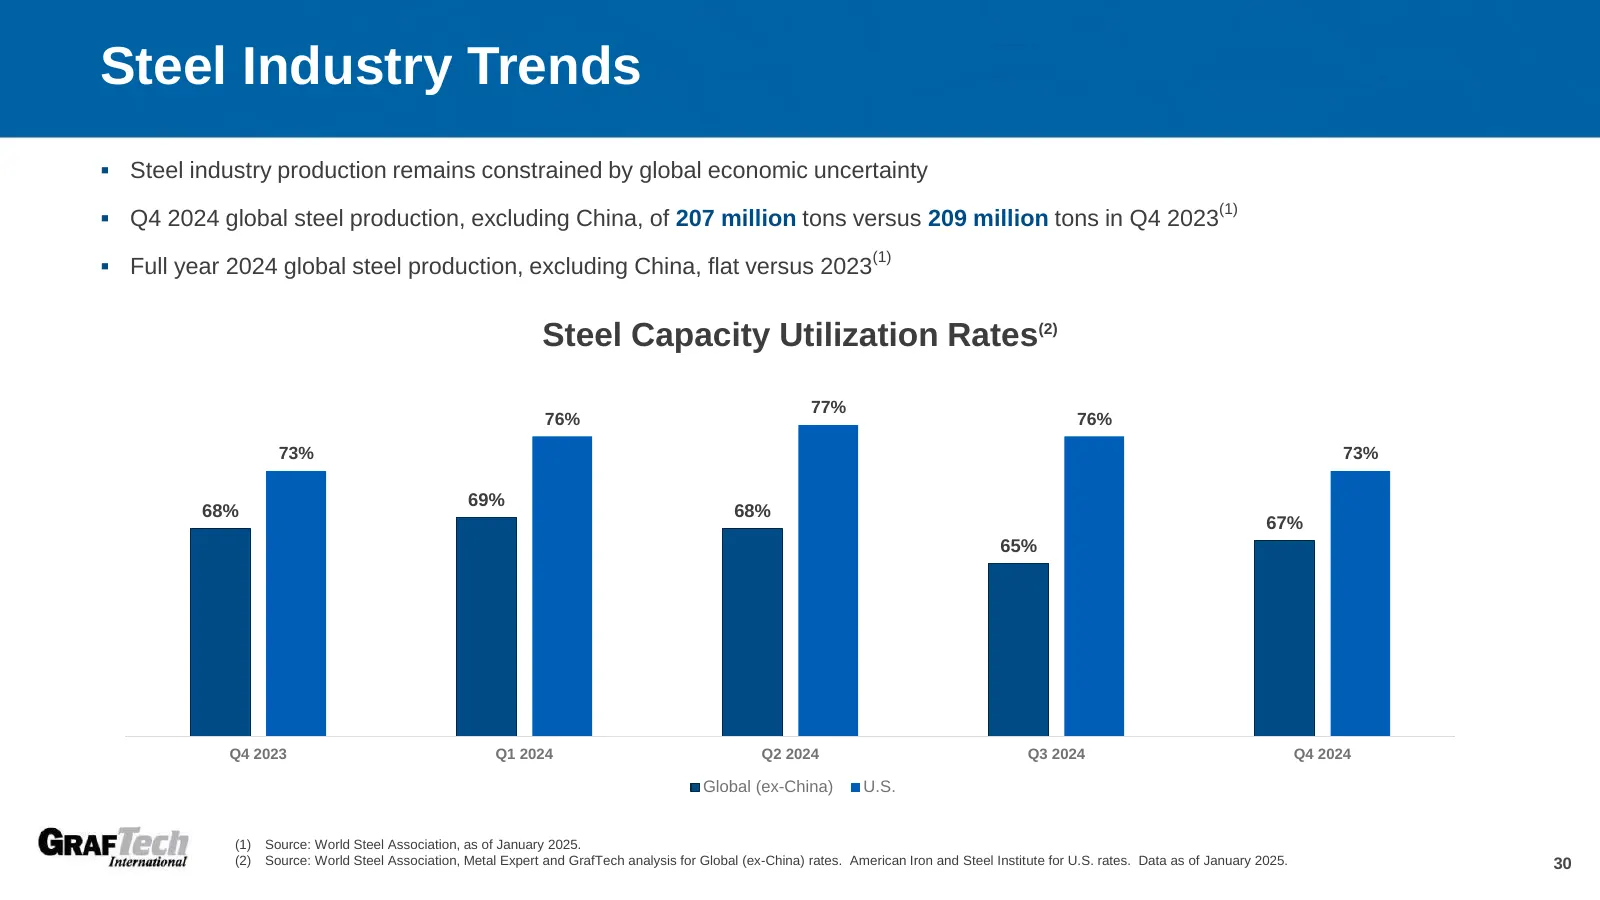
Steel Industry Trends ▪ Steel industry production remains constrained by global economic uncertainty (1) ▪ Q4 2024 global steel production, excluding China, of 207 million tons versus 209 million tons in Q4 2023 (1) ▪ Full year 2024 global steel production, excluding China, flat versus 2023 Steel Ca
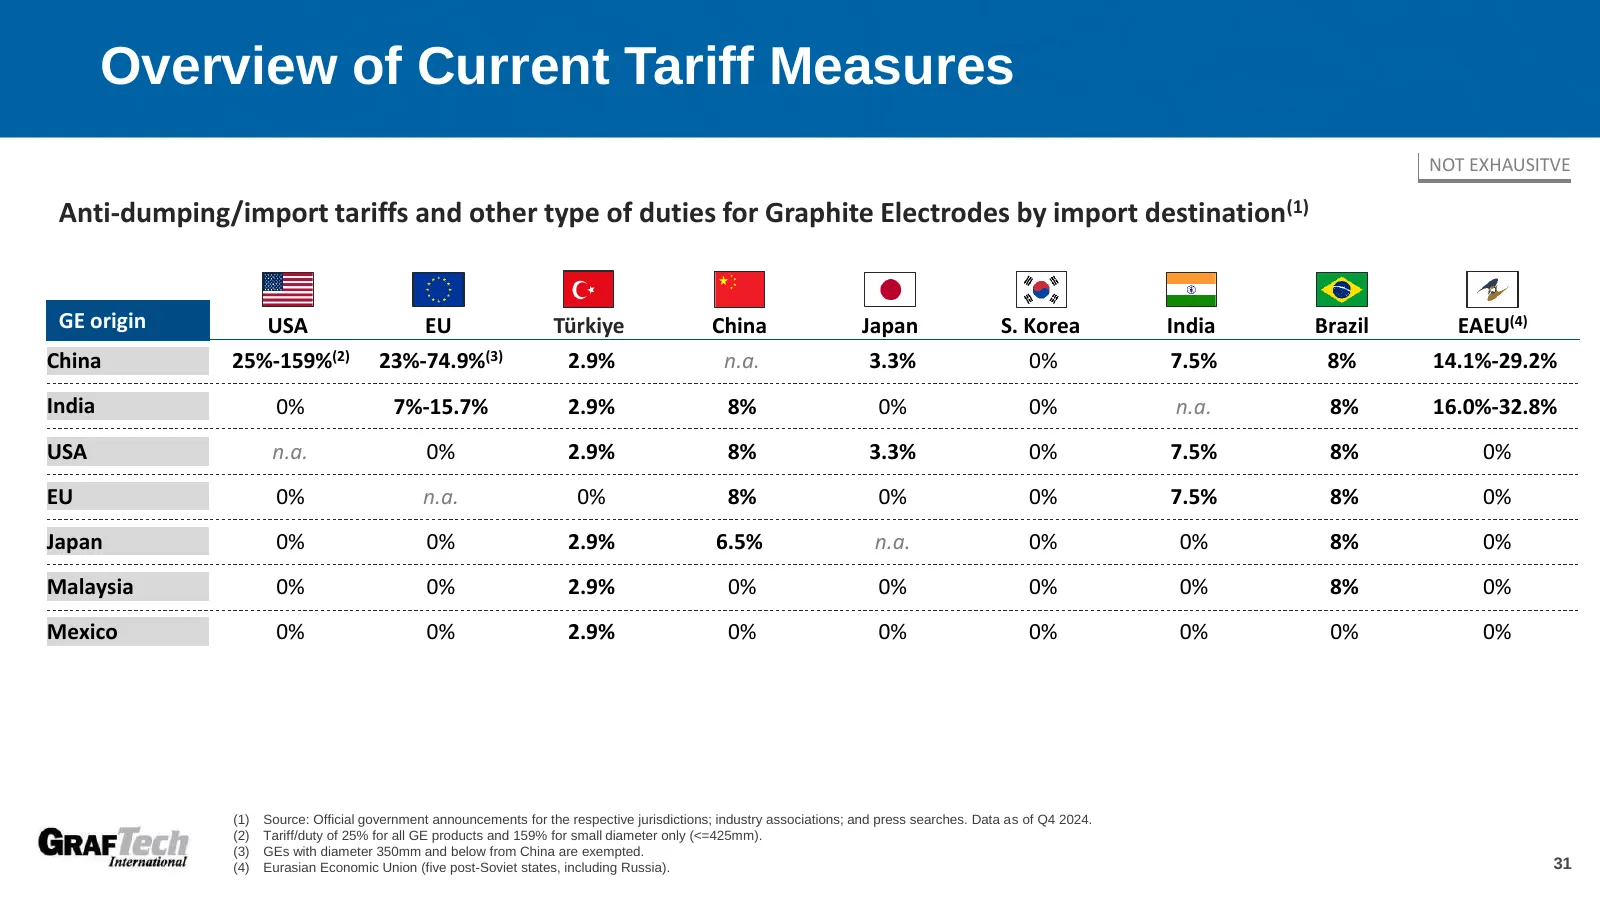
Slide 31: Overview of Current Tariff Measures
Overview of Current Tariff Measures NOT EXHAUSITVE Anti-dumping/import tariffs and other type of duties for Graphite Electrodes by import destination(1) GE origin USA EU Türkiye China Japan S. Korea India Brazil EAEU(4) China 25%-159%(2) 23%-74.9%(3) 2.9% n.a. 3.3% 0% 7.5% 8% 14.1%-29.2% India 0% 7%
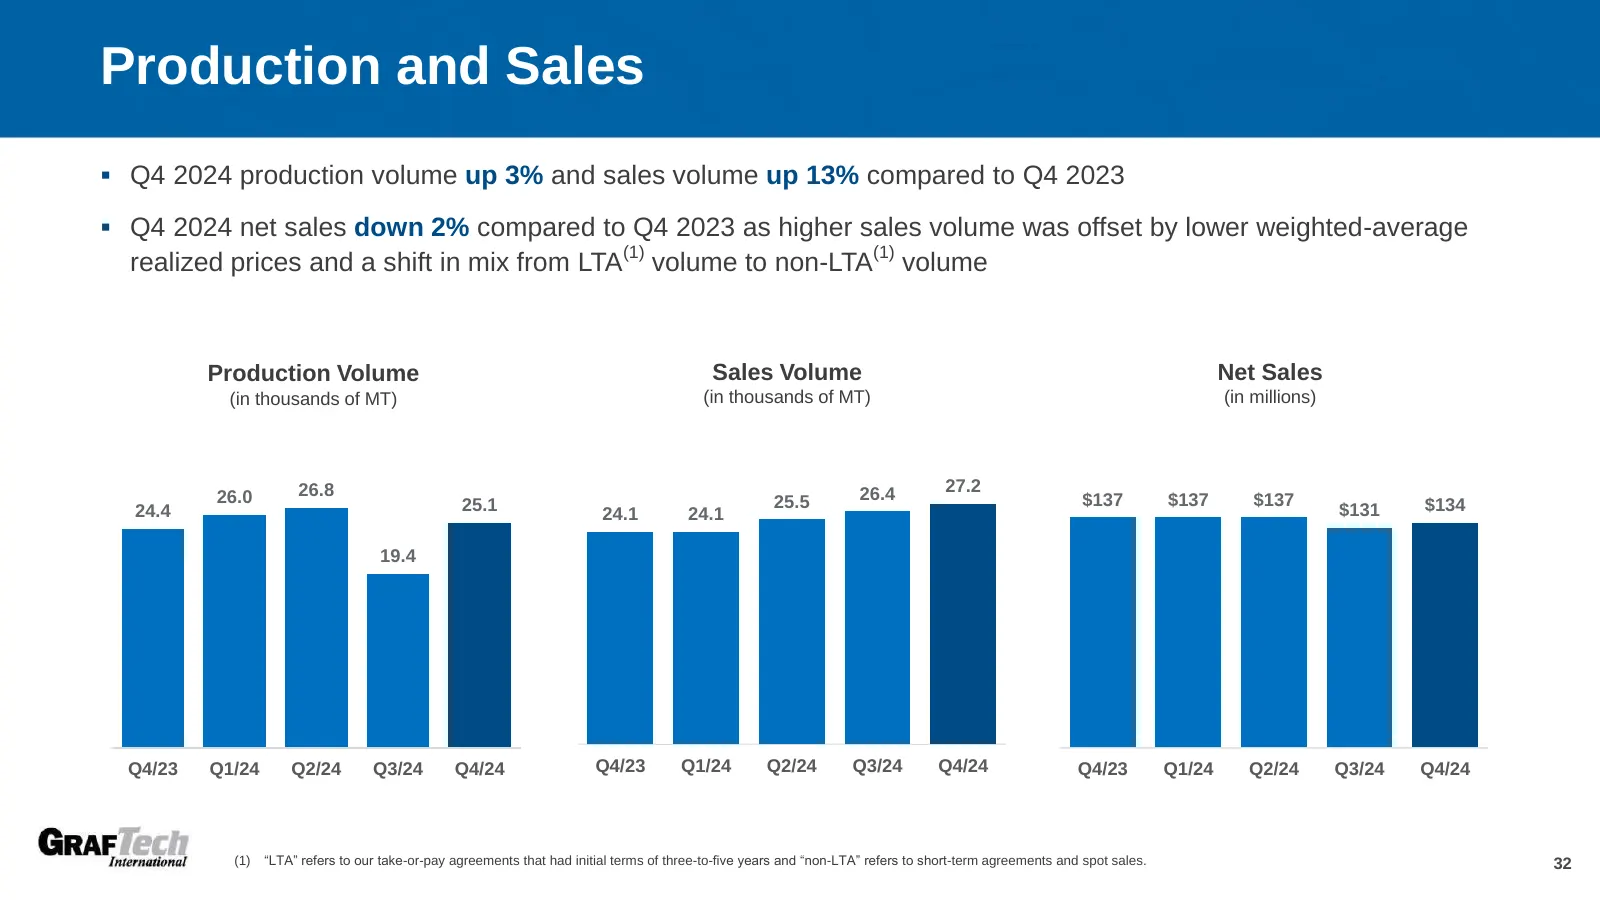
Slide 32: Production and Sales
Production and Sales ▪ Q4 2024 production volume up 3% and sales volume up 13% compared to Q4 2023 ▪ Q4 2024 net sales down 2% compared to Q4 2023 as higher sales volume was offset by lower weighted-average (1) (1) realized prices and a shift in mix from LTA volume to non-LTA volume Production Volum
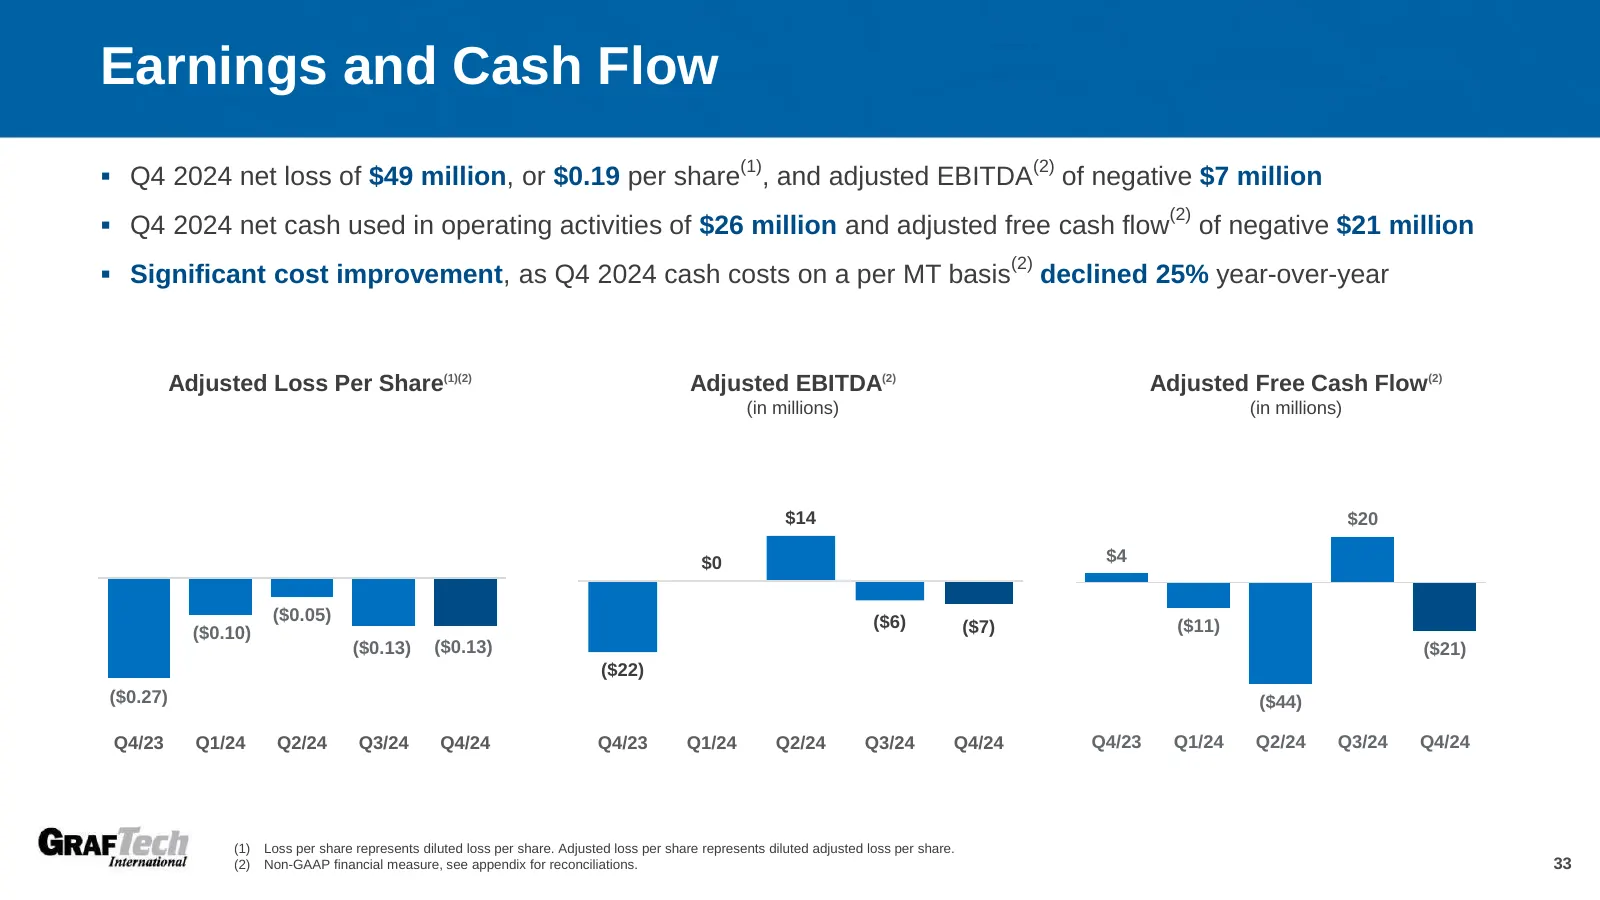
Slide 33: Earnings and Cash Flow
Earnings and Cash Flow (1) (2) ▪ Q4 2024 net loss of $49 million, or $0.19 per share , and adjusted EBITDA of negative $7 million (2) ▪ Q4 2024 net cash used in operating activities of $26 million and adjusted free cash flow of negative $21 million (2) ▪ Significant cost improvement, as Q4 2024 cash
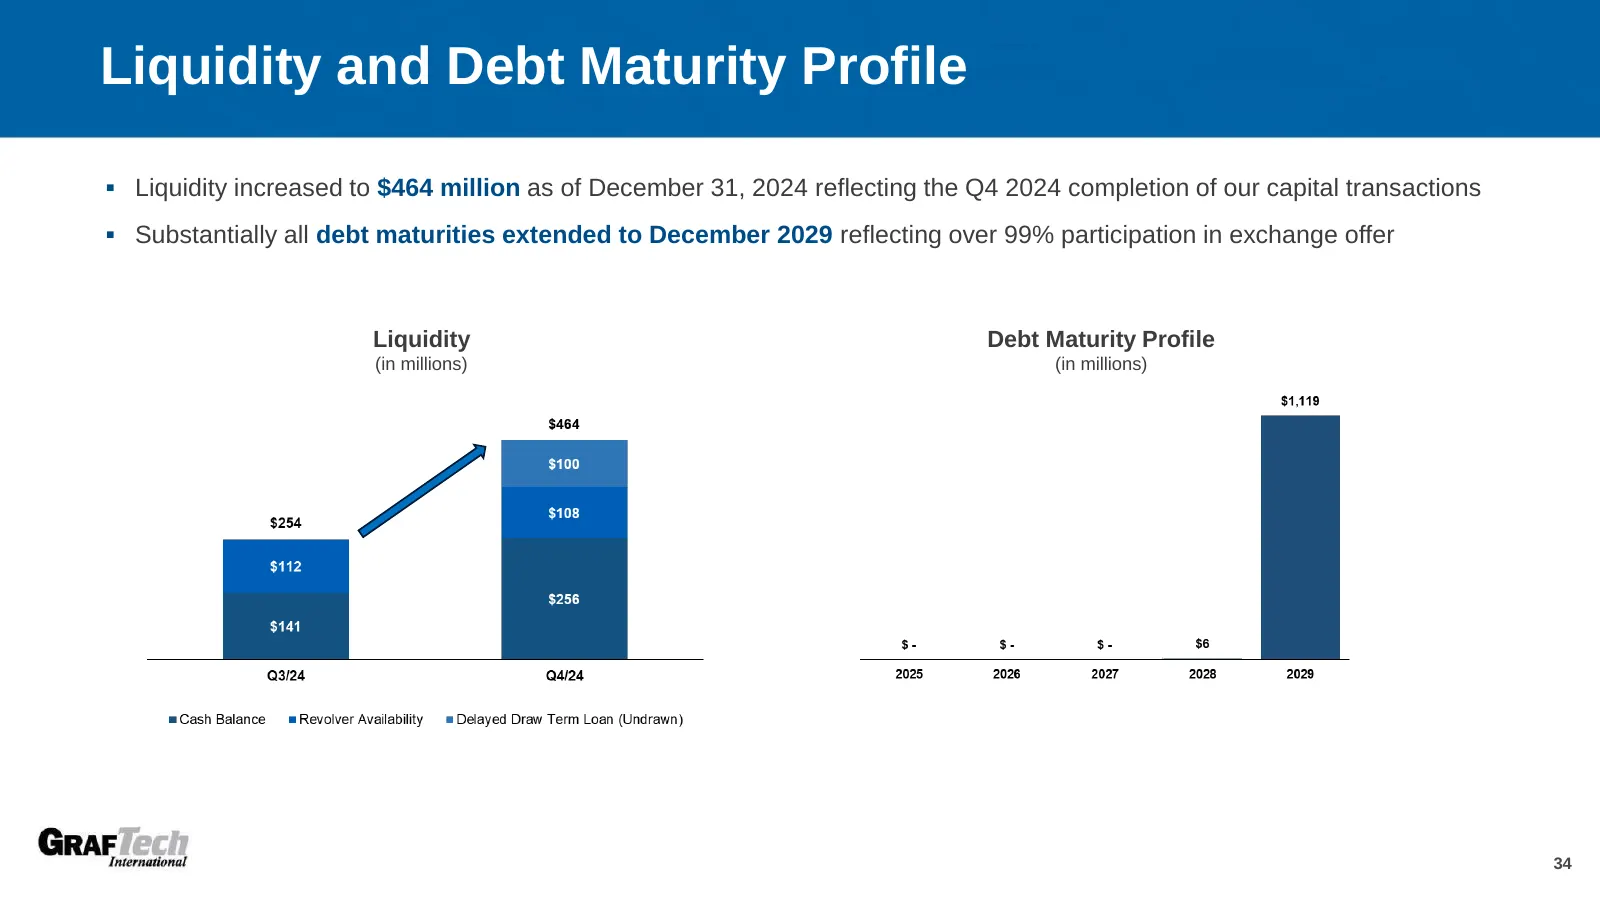
Slide 34: Liquidity and Debt Maturity Profile
Liquidity and Debt Maturity Profile ▪ Liquidity increased to $464 million as of December 31, 2024 reflecting the Q4 2024 completion of our capital transactions ▪ Substantially all debt maturities extended to December 2029 reflecting over 99% participation in exchange offer Liquidity Debt Maturity Pr
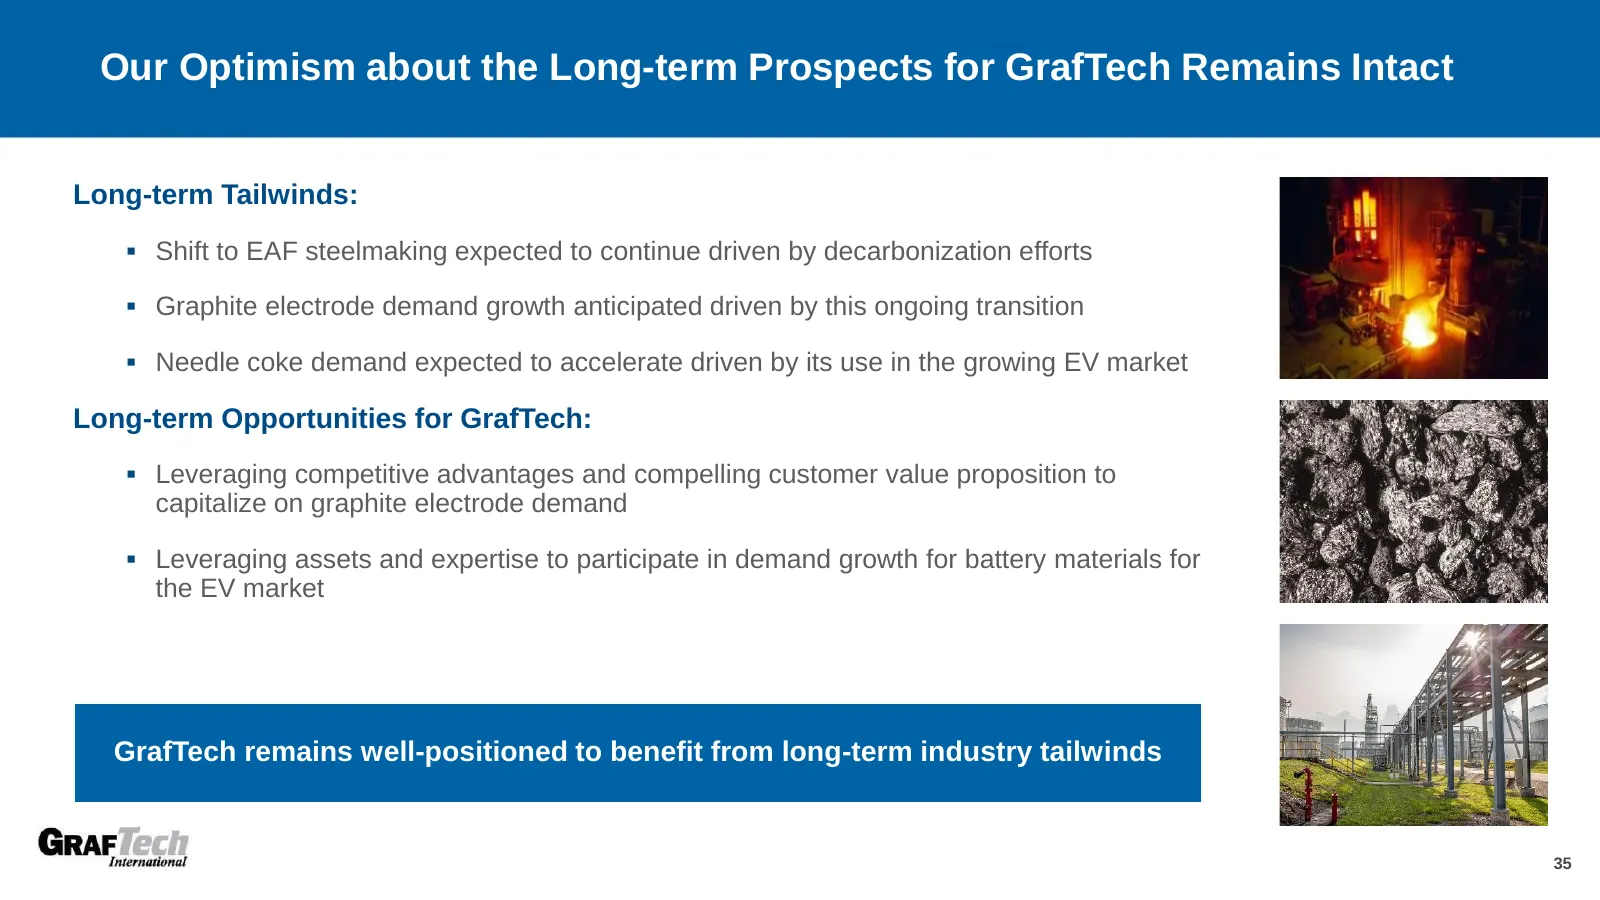
Slide 35: Our Optimism about the Long-term Prospects for GrafTech Remains Intact
Our Optimism about the Long-term Prospects for GrafTech Remains Intact Long-term Tailwinds: ▪ Shift to EAF steelmaking expected to continue driven by decarbonization efforts ▪ Graphite electrode demand growth anticipated driven by this ongoing transition ▪ Needle coke demand expected to accelerate d

Slide 36: Appendix
GrarF lec! 36
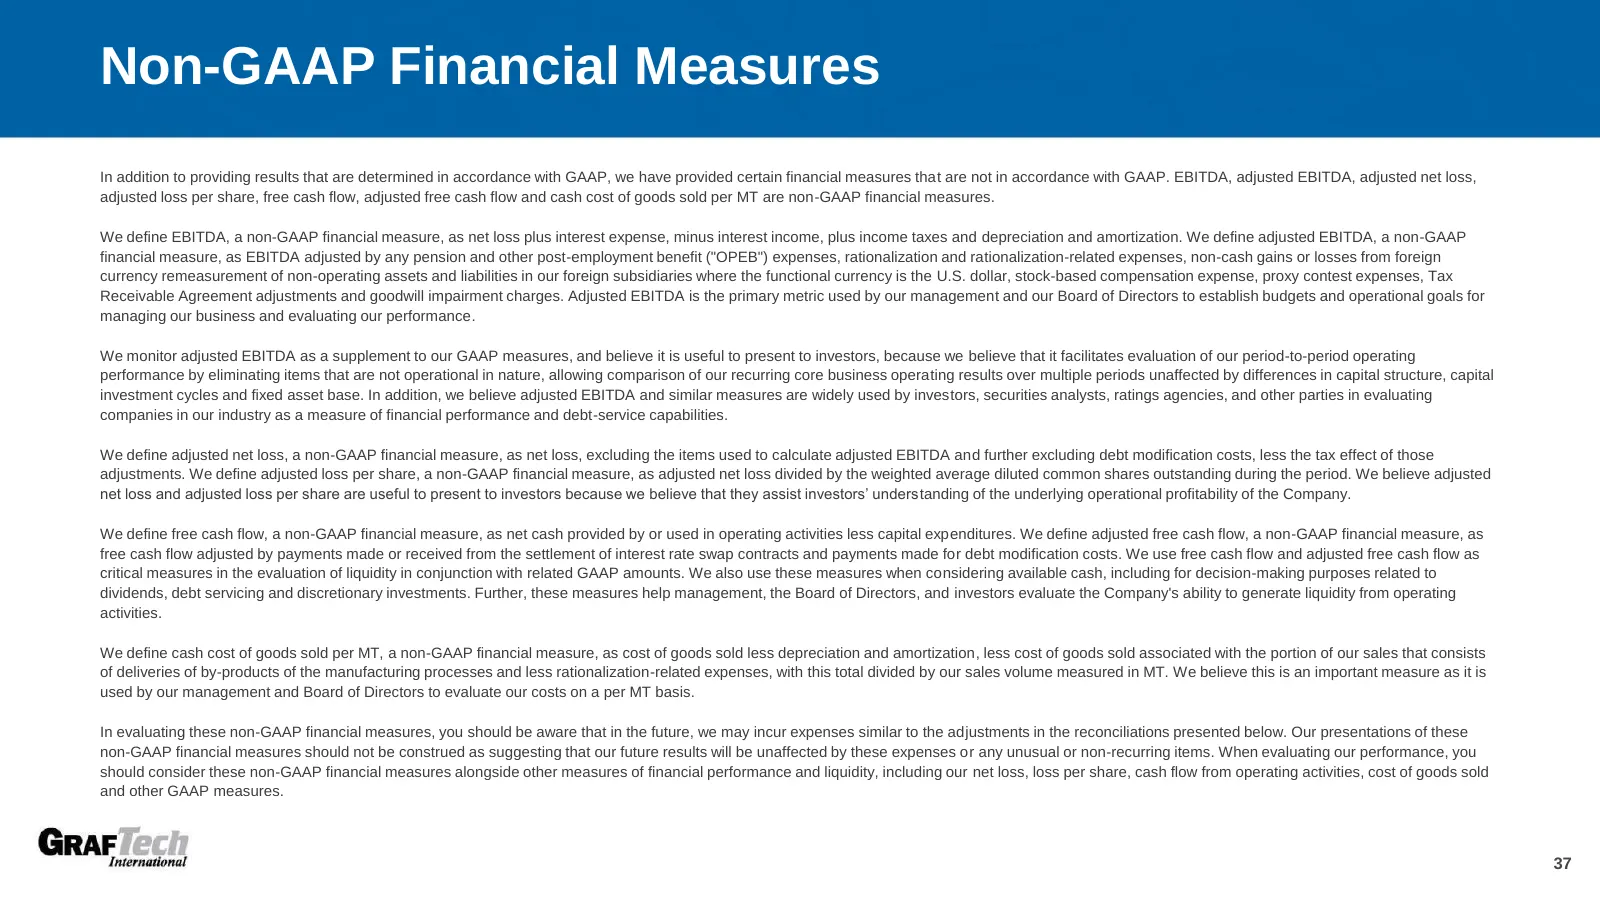
Slide 37: Non-GAAP Financial Measures
Non-GAAP Financial Measures In addition to providing results that are determined in accordance with GAAP, we have provided certain financial measures that are not in accordance with GAAP. EBITDA, adjusted EBITDA, adjusted net loss, adjusted loss per share, free cash flow, adjusted free cash flow and
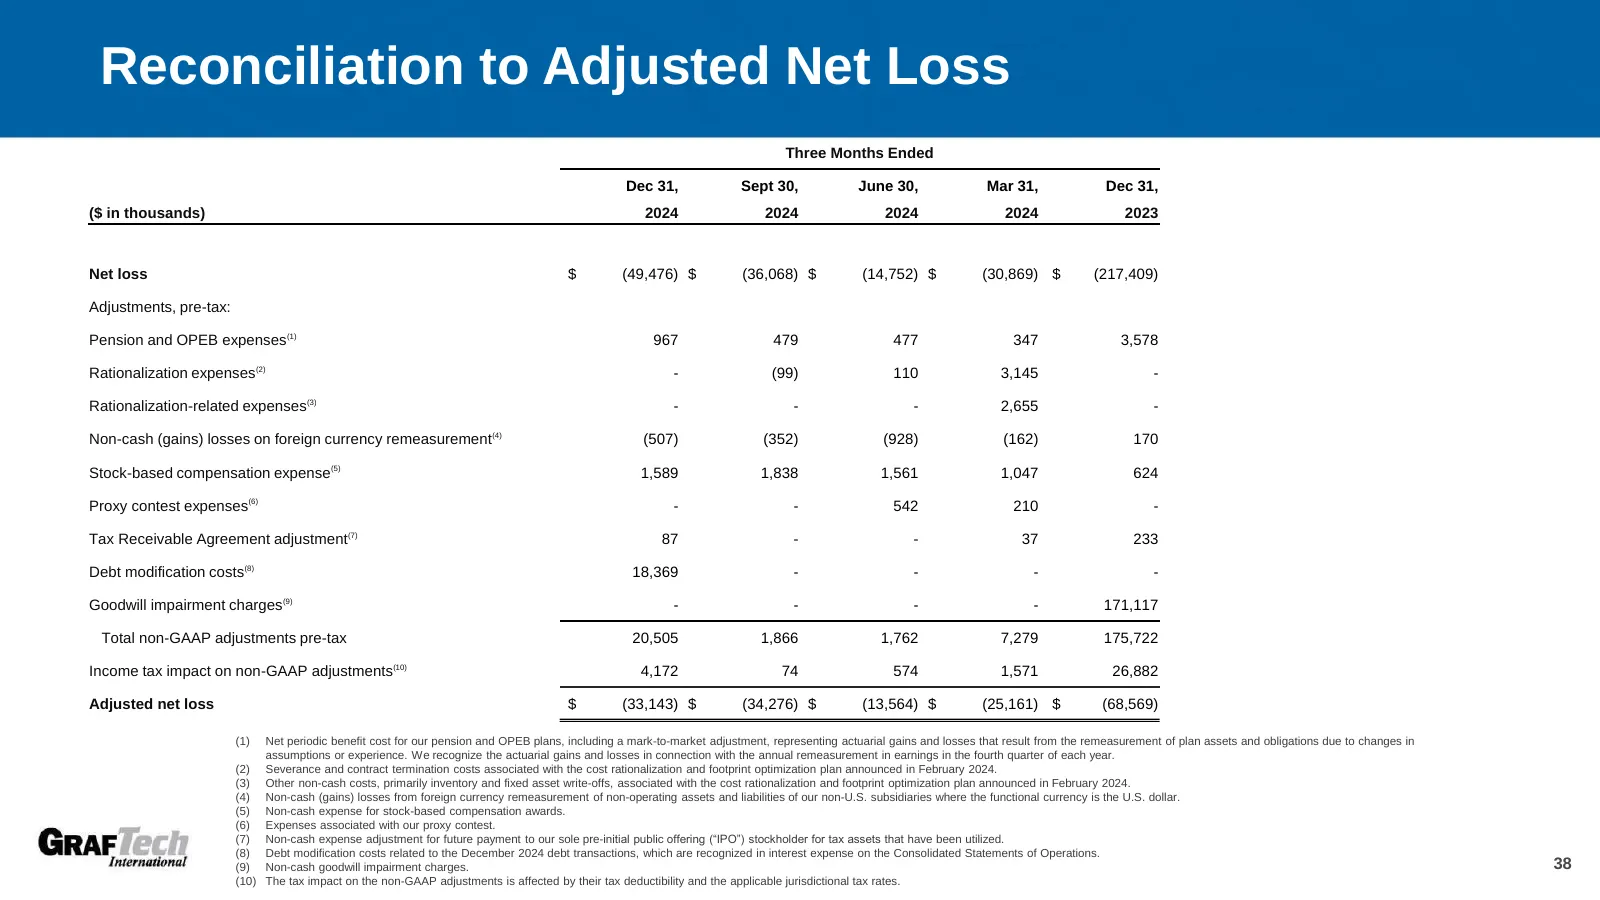
Slide 38: Reconciliation to Adjusted Net Loss
Reconciliation to Adjusted Net Loss Three Months Ended Dec 31, Sept 30, June 30, Mar 31, Dec 31, ($ in thousands) 2024 2024 2024 2024 2023 Net loss $ (49,476) $ (36,068) $ (14,752) $ (30,869) $ (217,409) Adjustments, pre-tax: Pension and OPEB expenses(1) 967 479 477 347 3,578 Rationalization expense
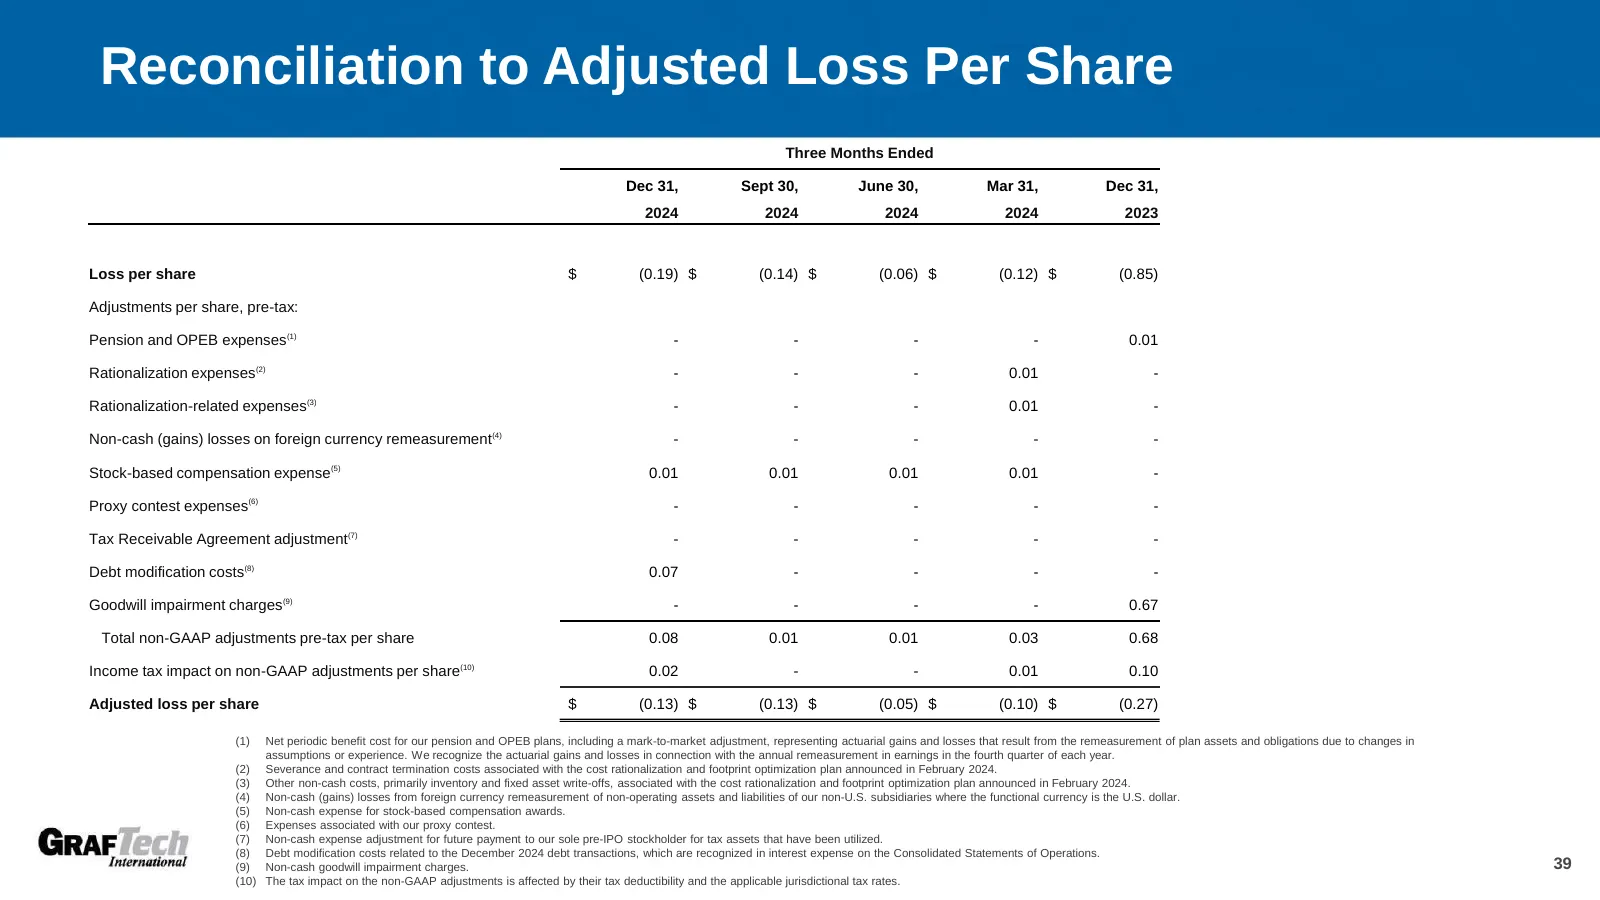
Slide 39: Reconciliation to Adjusted Loss Per Share
Reconciliation to Adjusted Loss Per Share Three Months Ended Dec 31, Sept 30, June 30, Mar 31, Dec 31, 2024 2024 2024 2024 2023 Loss per share $ (0.19) $ (0.14) $ (0.06) $ (0.12) $ (0.85) Adjustments per share, pre-tax: Pension and OPEB expenses(1) - - - - 0.01 Rationalization expenses(2) - - - 0.01
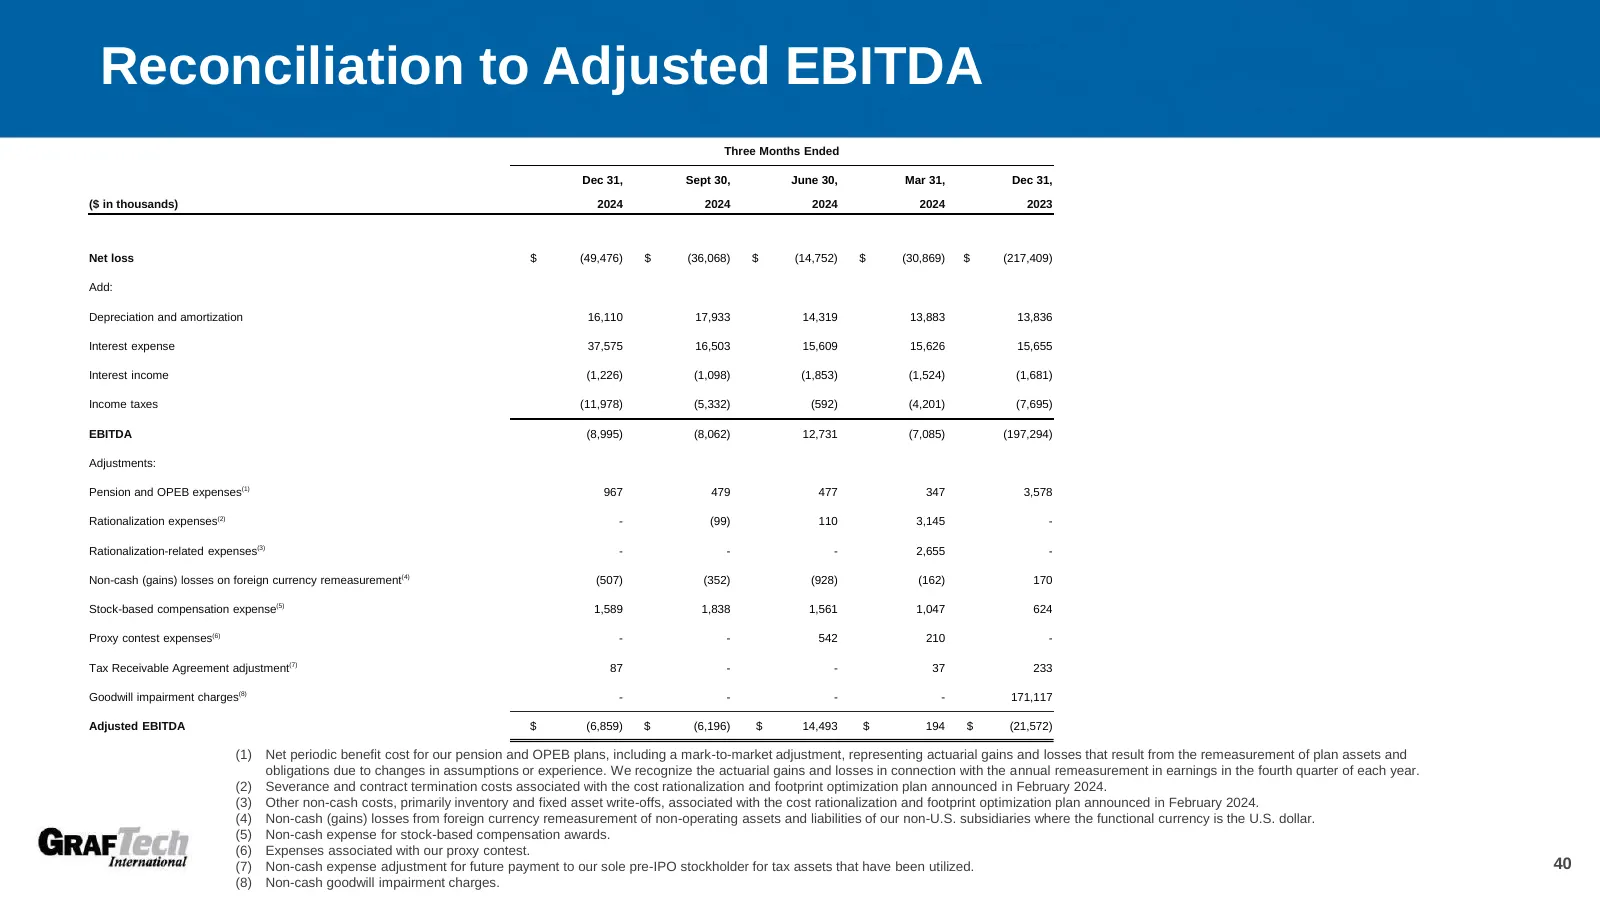
Slide 40: Reconciliation to Adjusted EBITDA
Reconciliation to Adjusted EBITDA Three Months Ended Dec 31, Sept 30, June 30, Mar 31, Dec 31, ($ in thousands) 2024 2024 2024 2024 2023 Net loss $ (49,476) $ (36,068) $ (14,752) $ (30,869) $ (217,409) Add: Depreciation and amortization 16,110 17,933 14,319 13,883 13,836 Interest expense 37,575 16,5
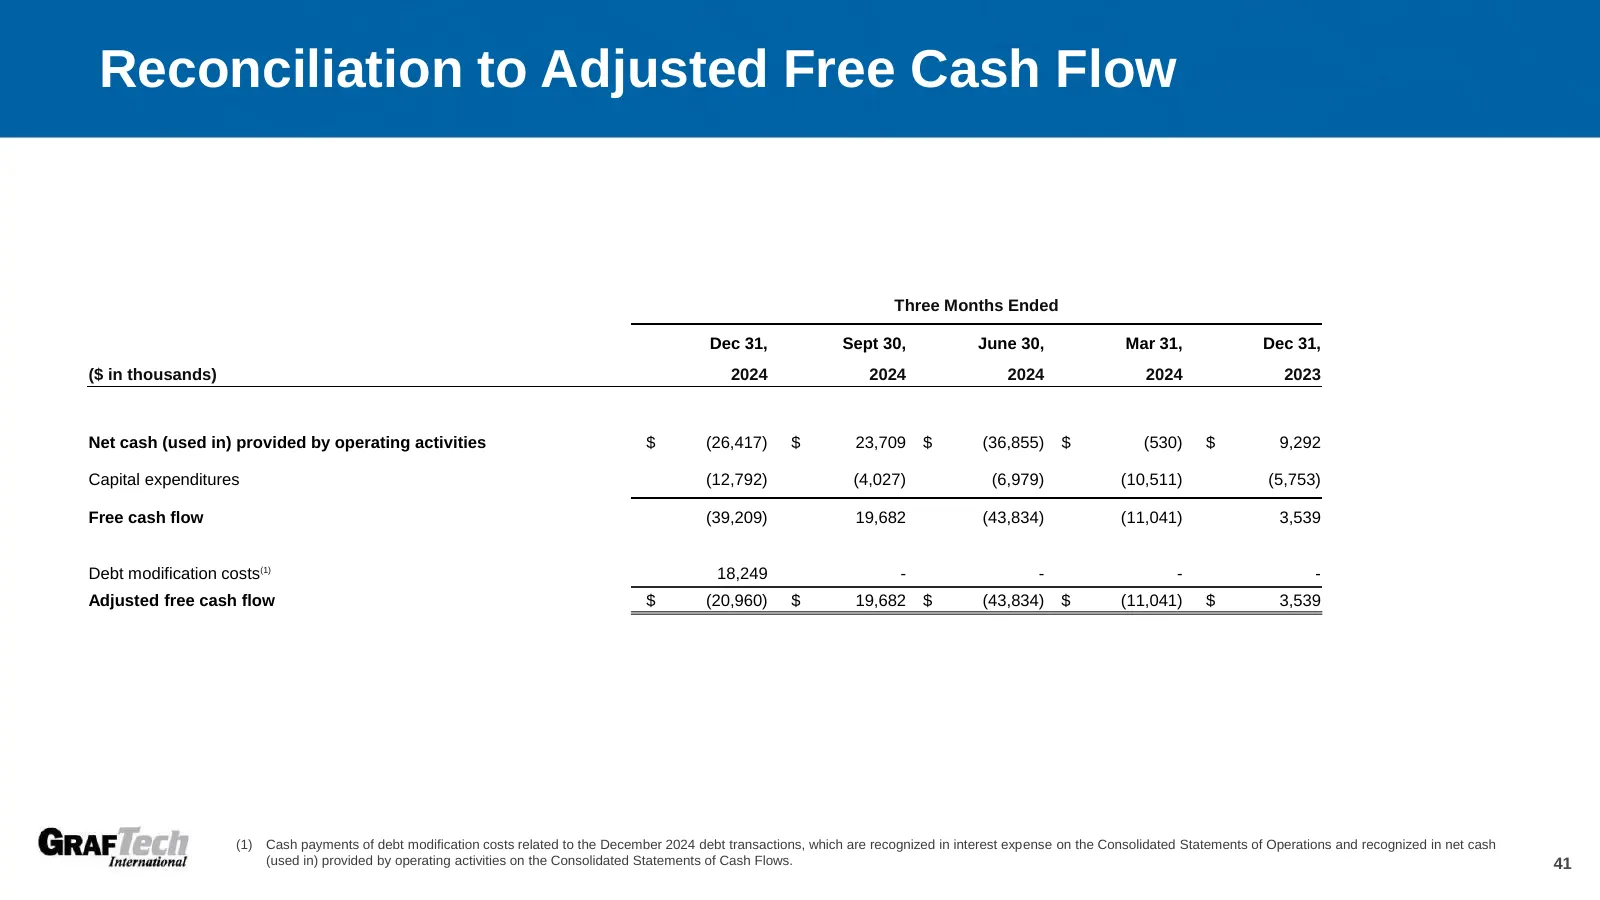
Slide 41: Reconciliation to Adjusted Free Cash Flow
Reconciliation to Adjusted Free Cash Flow Three Months Ended Dec 31, Sept 30, June 30, Mar 31, Dec 31, ($ in thousands) 2024 2024 2024 2024 2023 Net cash (used in) provided by operating activities $ (26,417) $ 23,709 $ (36,855) $ (530) $ 9,292 Capital expenditures (12,792) (4,027) (6,979) (10,511) (
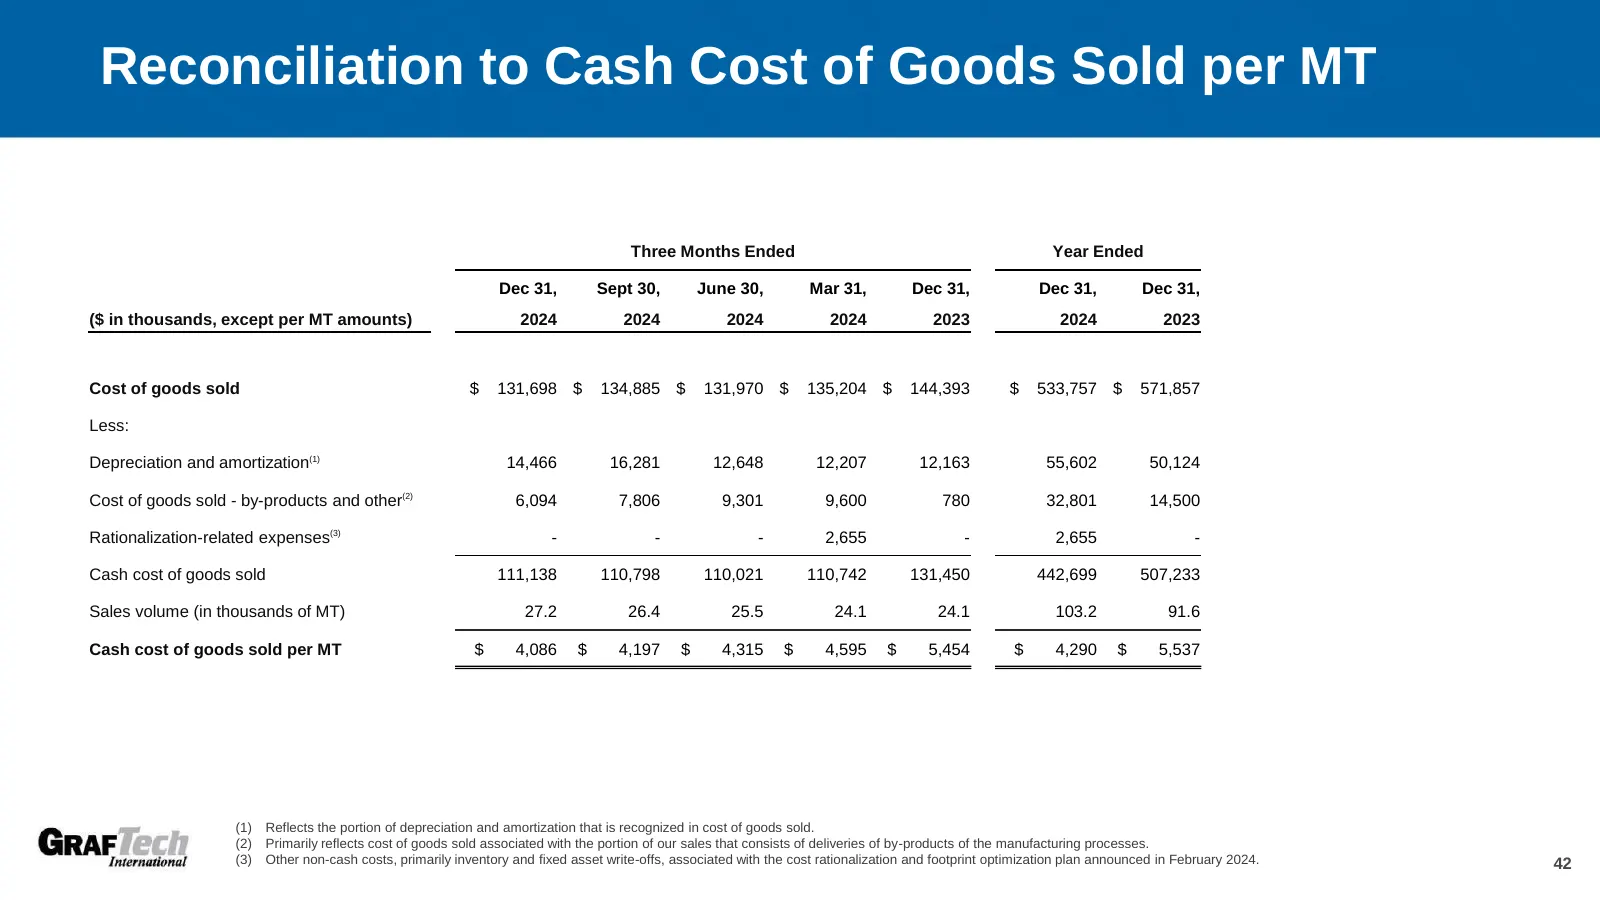
Slide 42: Reconciliation to Cash Cost of Goods Sold per MT
Reconciliation to Cash Cost of Goods Sold per MT Three Months Ended Year Ended Dec 31, Sept 30, June 30, Mar 31, Dec 31, Dec 31, Dec 31, ($ in thousands, except per MT amounts) 2024 2024 2024 2024 2023 2024 2023 Cost of goods sold $ 131,698 $ 134,885 $ 131,970 $ 135,204 $ 144,393 $ 533,757 $ 571,857
Slide 43: GrafTech International Ltd. Contact
Ticker: EAF (NYSE) GrafTech International Ltd. Website: www.graftech.com 982 Keynote Circle Contact: Michael Dillon Brooklyn Heights, Ohio 44131 Email: investor.relations@graftech.com Phone: 1.216.676.2000
Source: Internet Archive copy of s202.q4cdn.com
More decks from GrafTech International Ltd.
 Q3 2026 Earnings Presentation20 slides · Oct 23, 2026
 Q2 2026 Earnings Presentation20 slides · Jul 24, 2026
 Q1 2026 Earnings Presentation20 slides · May 1, 2026
 Q4 2025 Earnings Presentation23 slides · Feb 6, 2026
 Q3 2025 Earnings Presentation22 slides · Oct 24, 2025
 Q2 2025 Earnings Presentation20 slides · Jul 25, 2025