Rexel SA · EURONEXT:RXL
Rexel SA — FY2013 Earnings Presentation
54 slides from Rexel SA's earnings presentation, Feb 13, 2014
Slide 1: Q4 & Full-Year 2013 Results
Q4 & FULL-YEAR 2013 RESULTS February 13, 2014 Consolidated financial statements as of December 31, 2013 were authorized for issue by the Management Board on February 6, 2014 and reviewed by the Supervisory Board meeting held on February 12, 2014. They have been audited by statutory auditors
Slide 2: Results at a Glance
RESULTS AT A GLANCE RexeL as a world of energy
Slide 3: Q4 2013 highlights
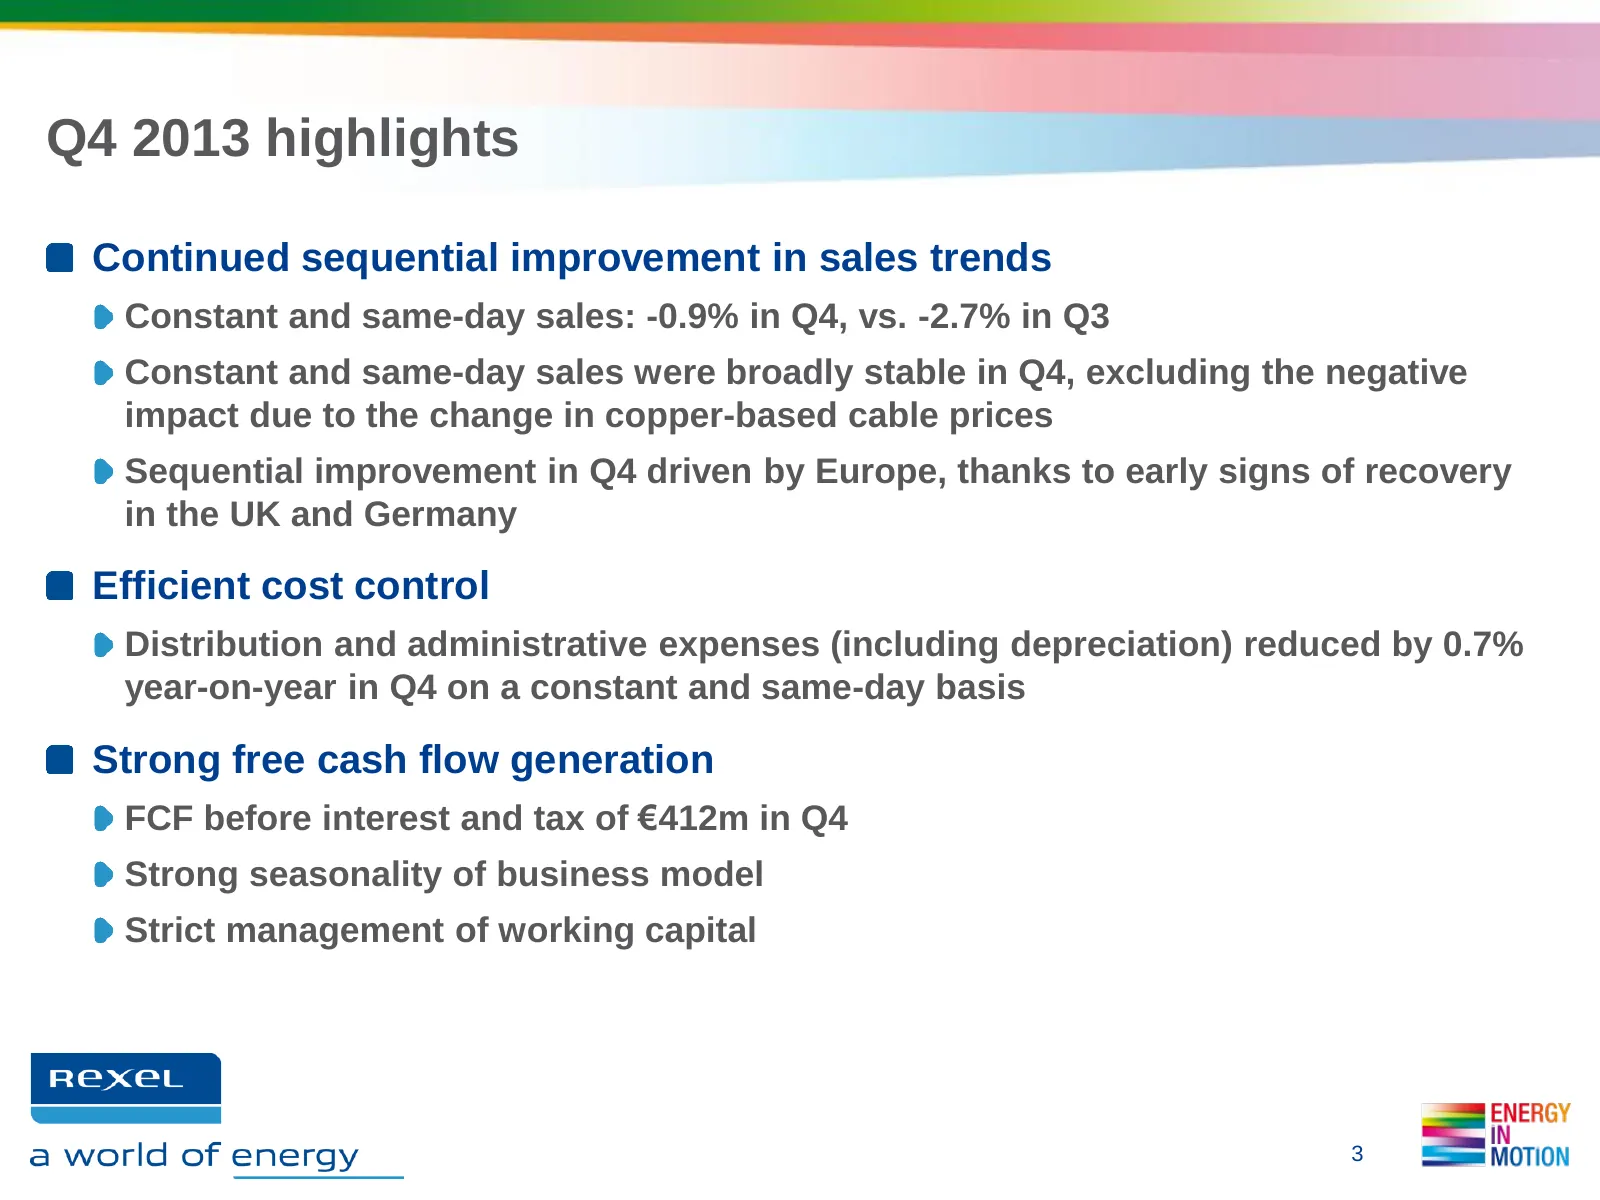
Q4 2013 highlights Continued sequential improvement in sales trends Constant and same-day sales: -0.9% in Q4, vs. -2.7% in Q3 Constant and same-day sales were broadly stable in Q4, excluding the negative impact due to the change in copper-based cable prices Sequential improvement in Q4 driven by Eur
Slide 4: FY 2013: Rexel confirmed the resilience of its business model
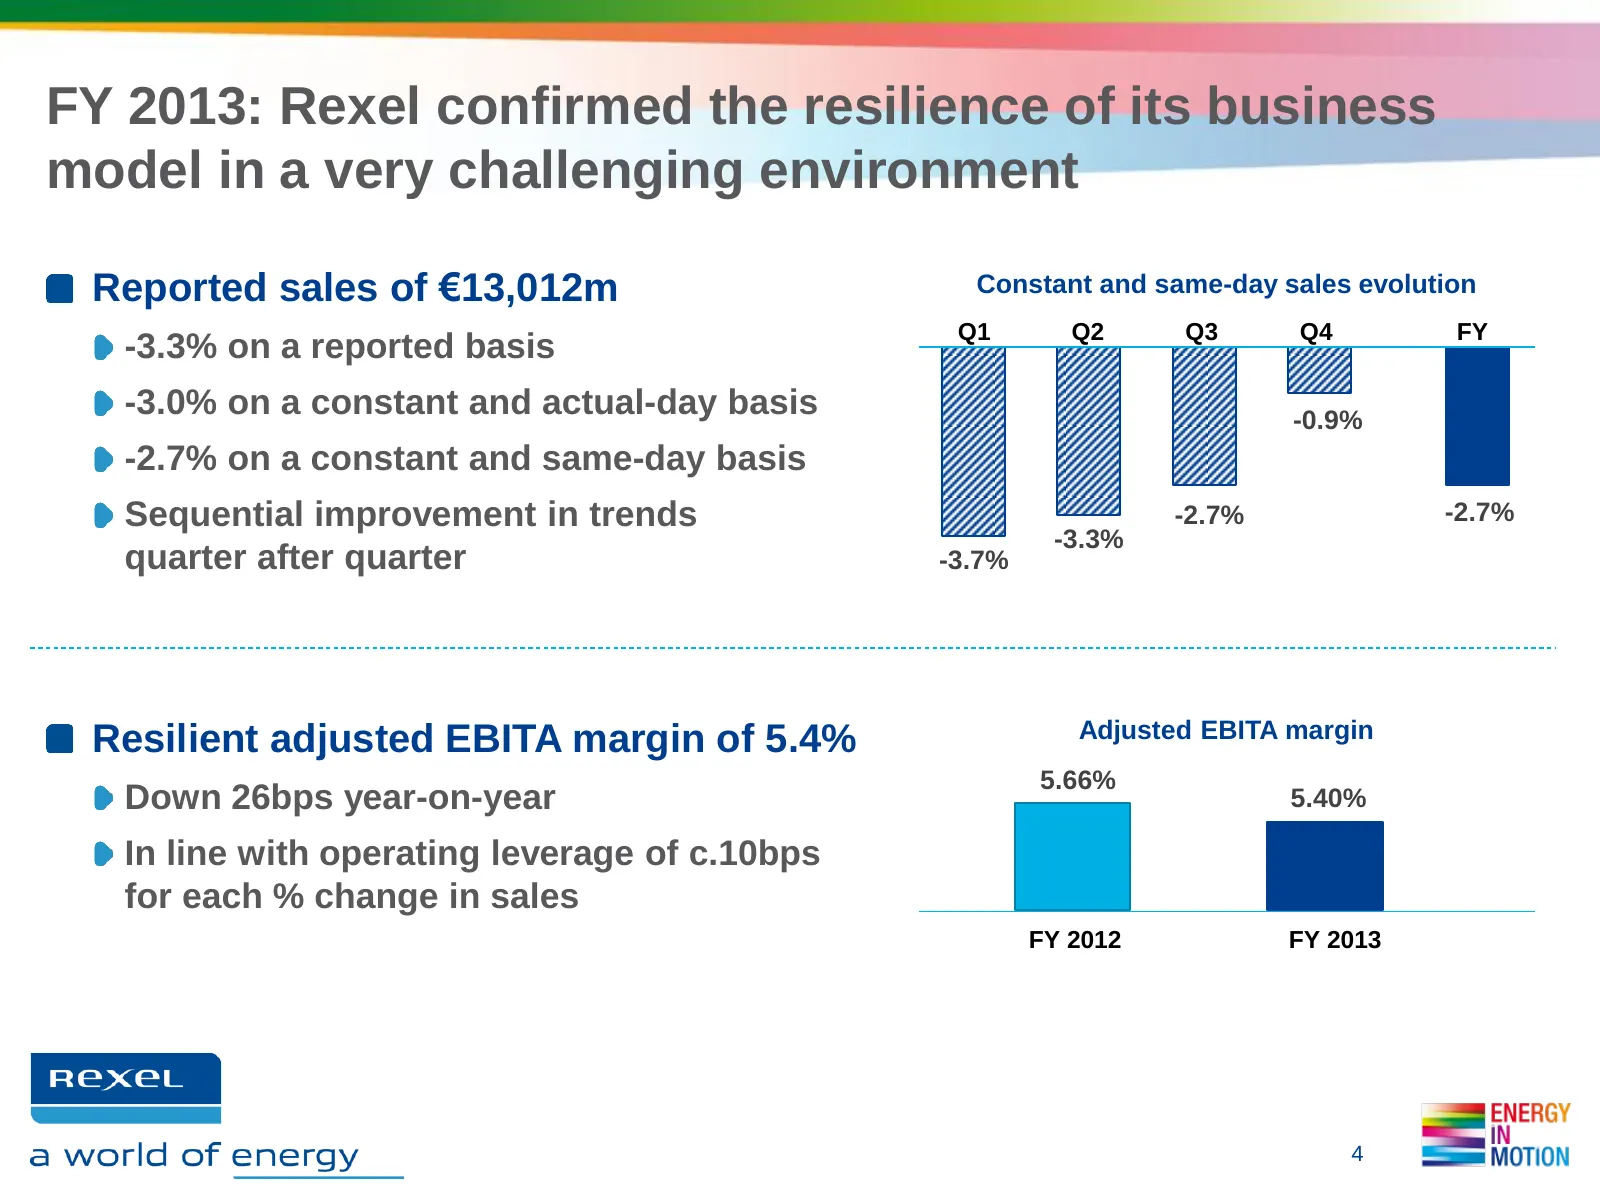
FY 2013: Rexel confirmed the resilience of its business model in a very challenging environment Reported sales of €13,012m Constant and same-day sales evolution Q1 Q2 Q3 Q4 FY -3.3% on a reported basis -3.0% on a constant and actual-day basis -0.9% -2.7% on a constant and same-day basis Sequential i
Slide 5: FY 2013: solid free cash flow and significantly reduced debt
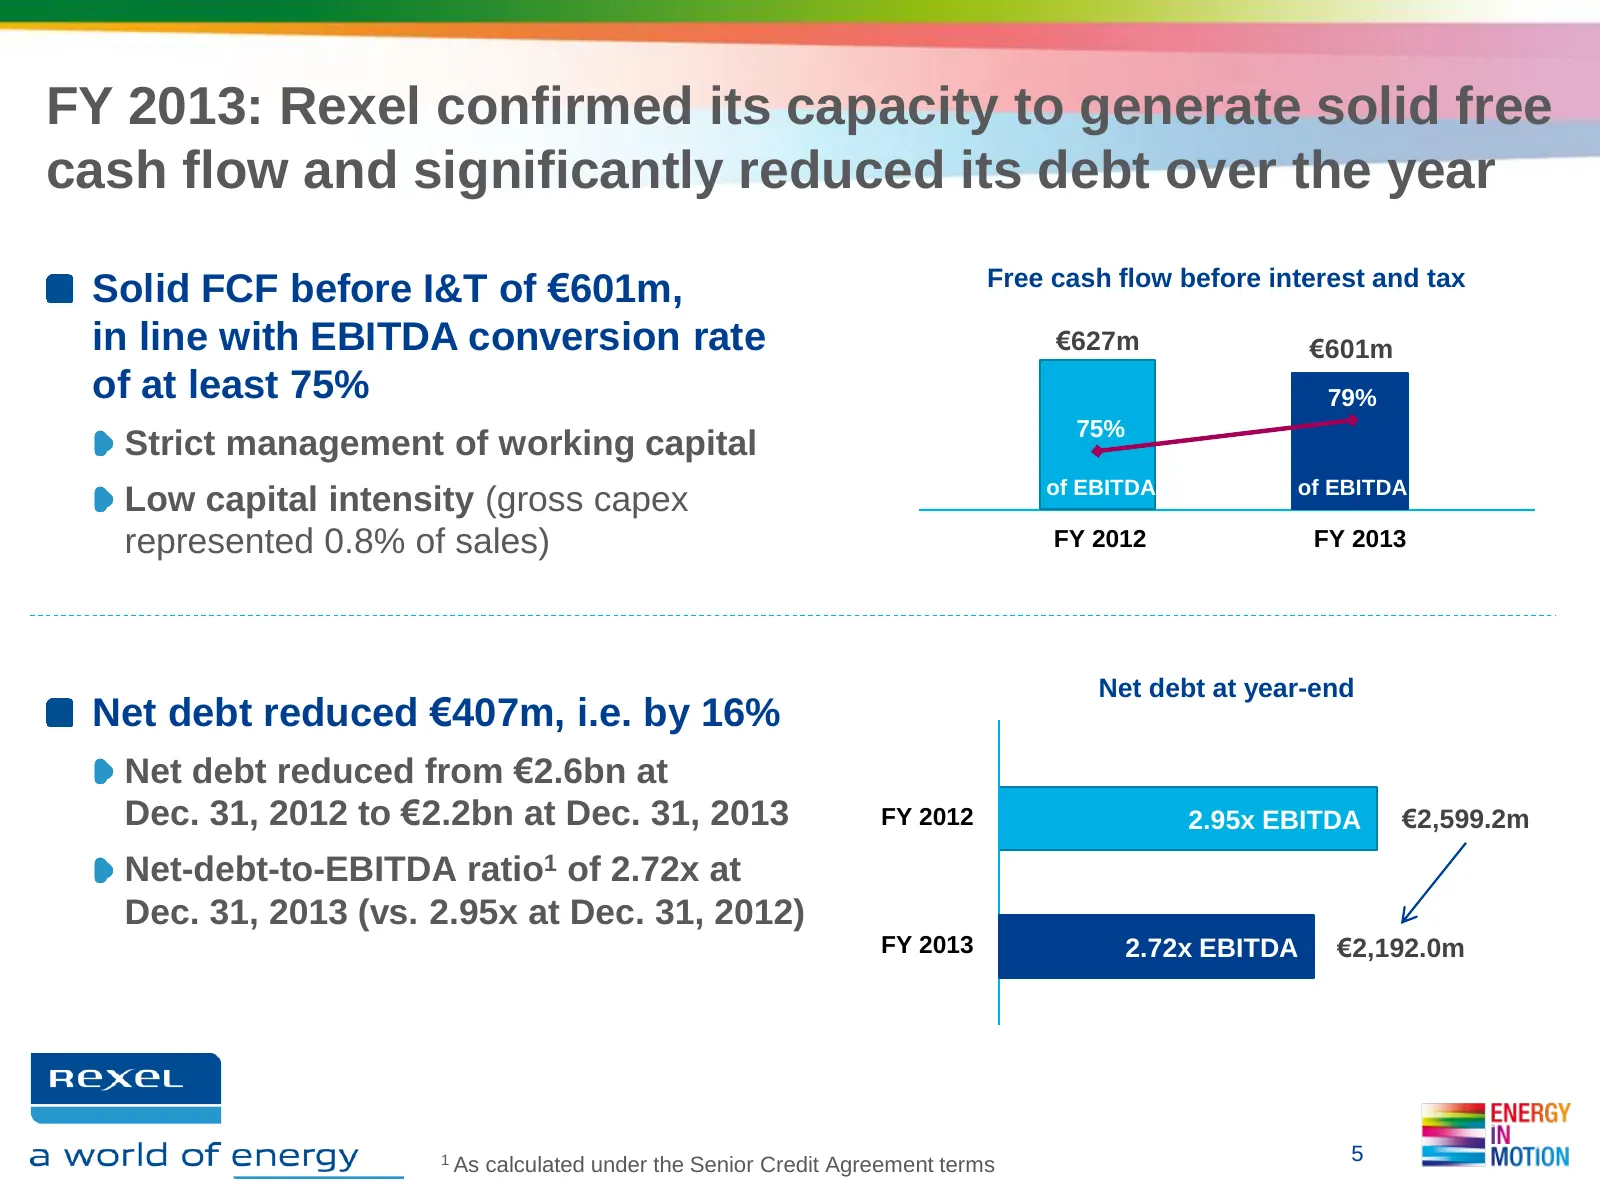
FY 2013: Rexel confirmed its capacity to generate solid free cash flow and significantly reduced its debt over the year Solid FCF before I&T of €601m, Free cash flow before interest and tax in line with EBITDA conversion rate €627m €601m of at least 75% 79% 75% Strict management of working capital o
Slide 6: FY 2013: High-growth initiatives outperformed the market
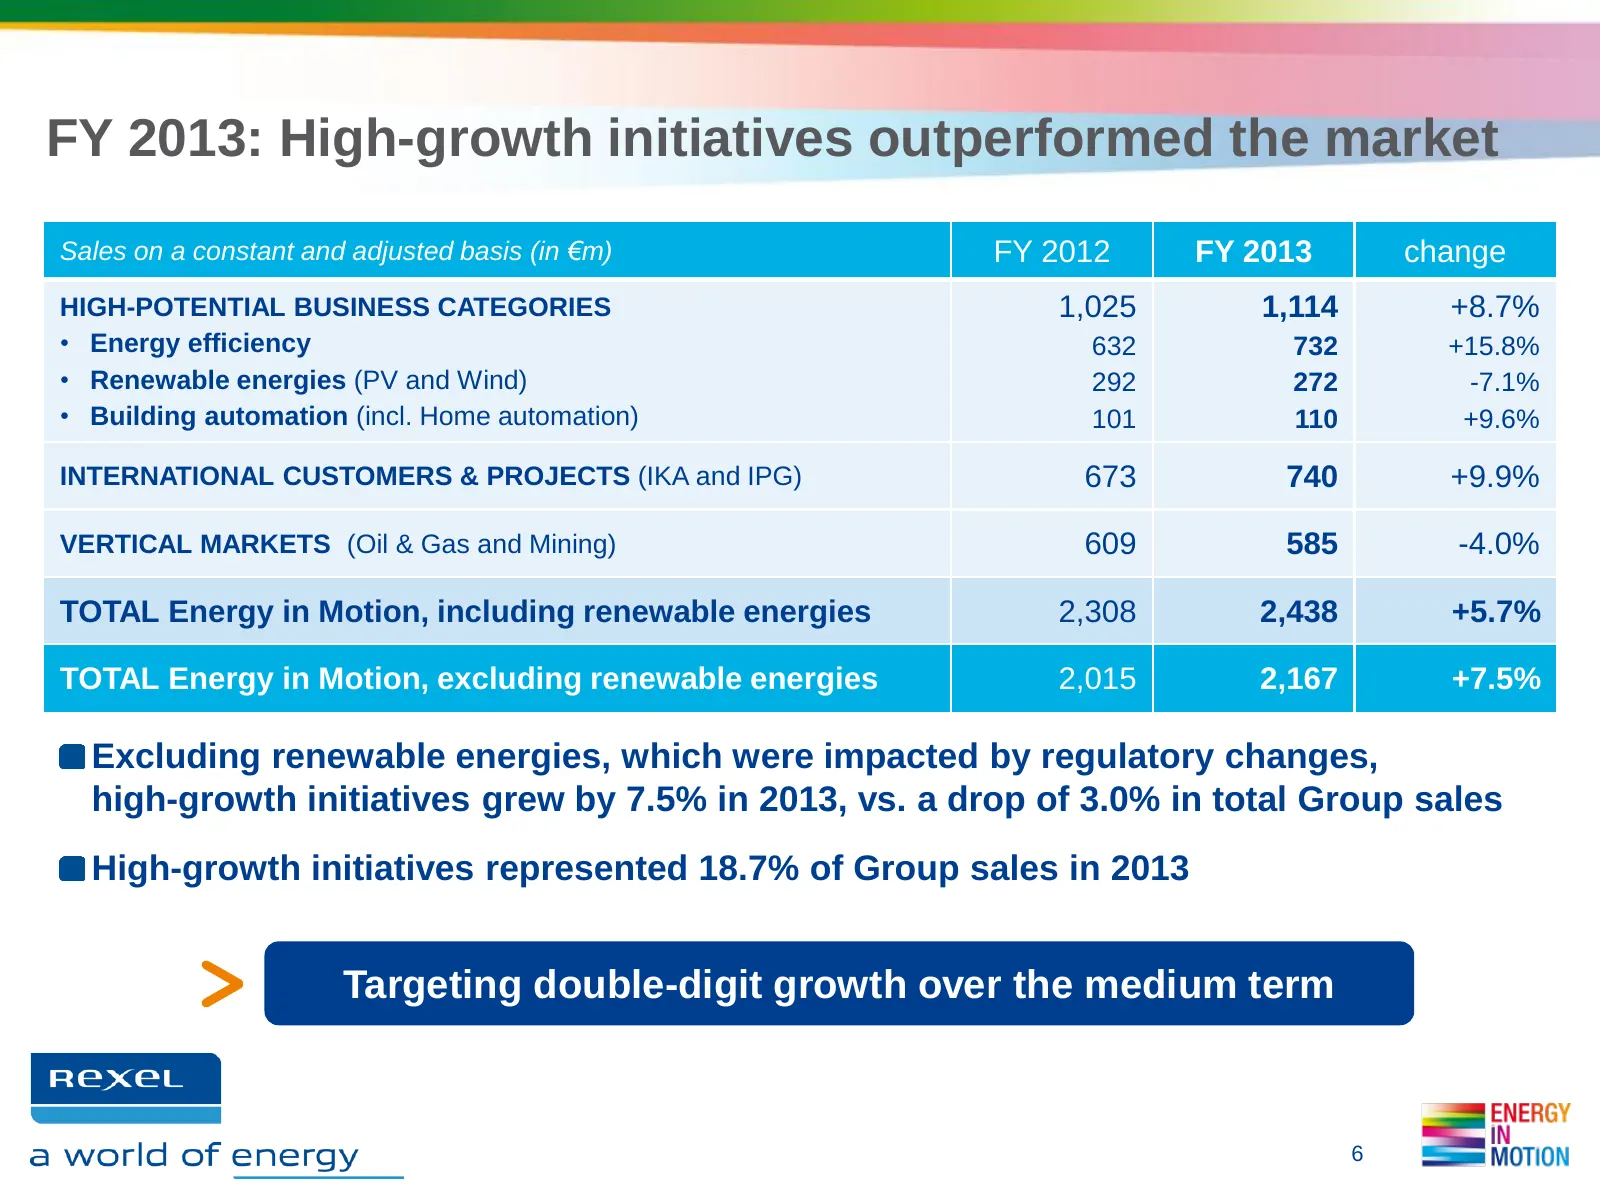
FY 2013: High-growth initiatives outperformed the market Sales on a constant and adjusted basis (in €m) FY 2012 FY 2013 change HIGH-POTENTIAL BUSINESS CATEGORIES 1,025 1,114 +8.7% • Energy efficiency 632 732 +15.8% • Renewable energies (PV and Wind) 292 272 -7.1% • Building automation (incl. Home au

Slide 7: Review by Geography
REVIEW BY GEOGRAPHY RexeL as a world of energy
Slide 8: Europe (55% of sales): resilient performance
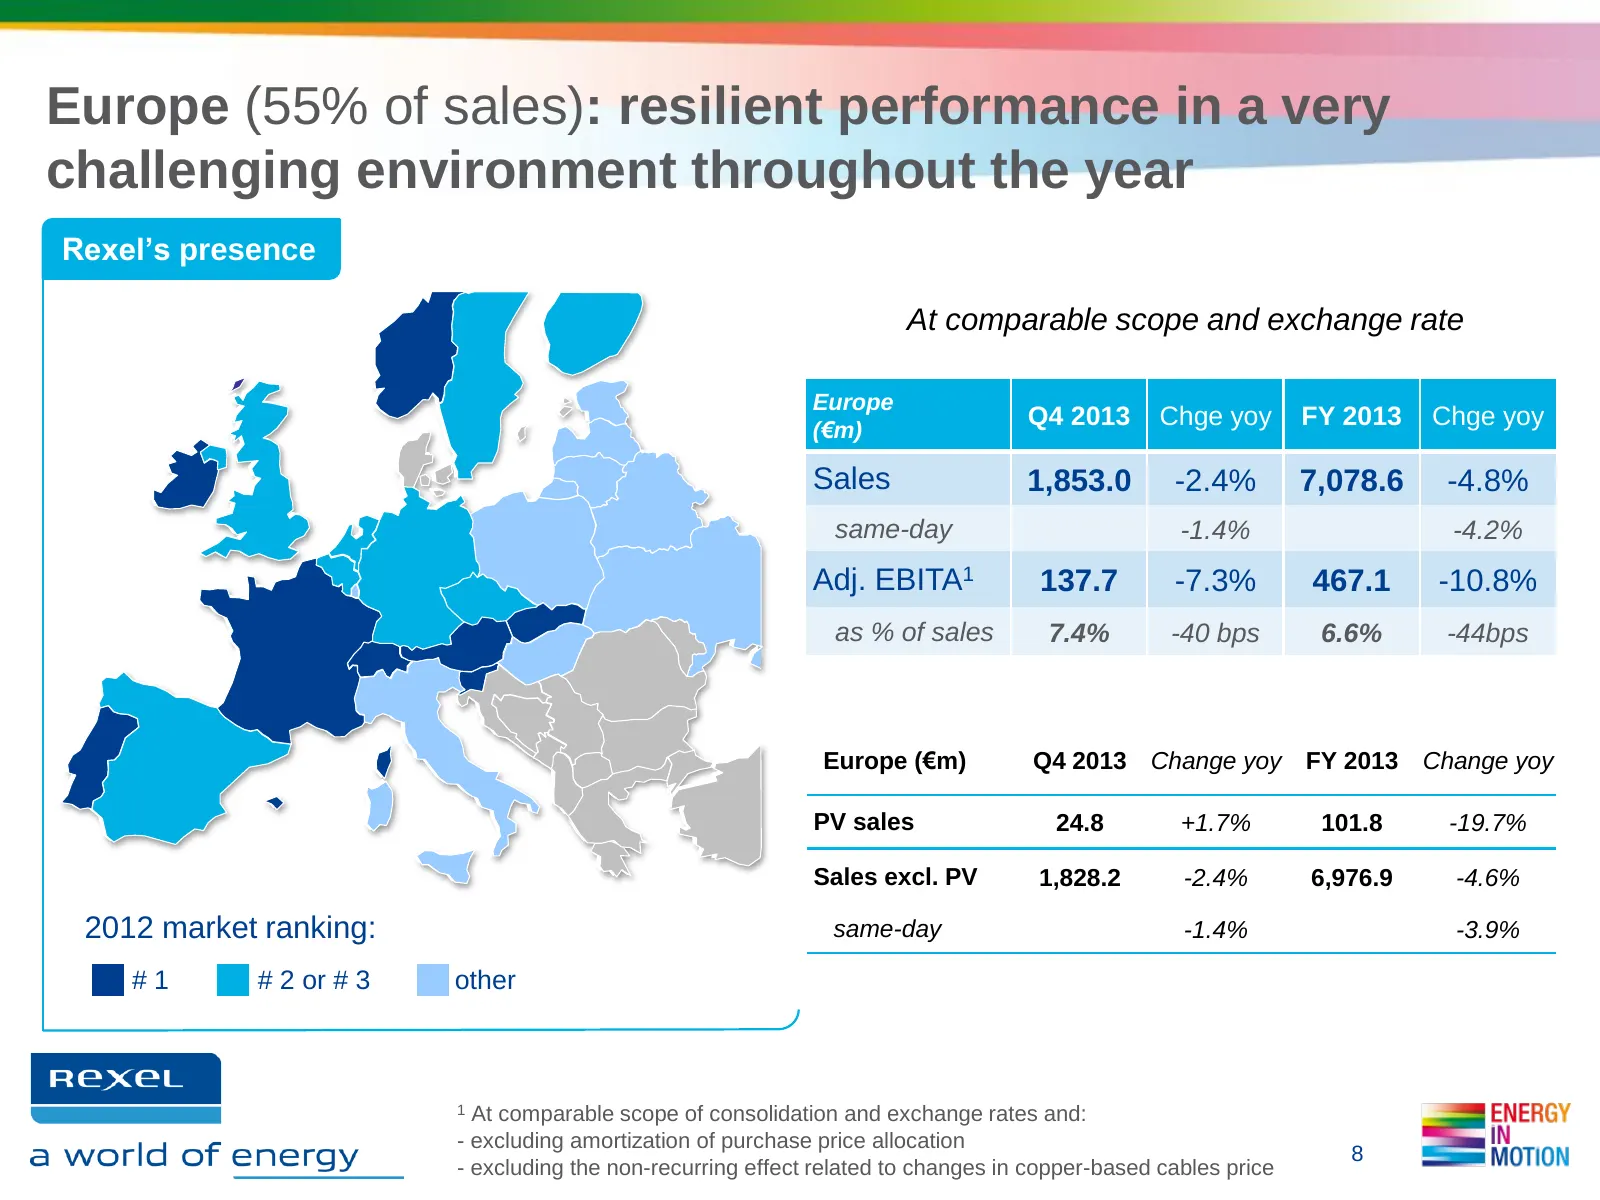
Europe (55% of sales): resilient performance in a very challenging environment throughout the year Rexel’s presence At comparable scope and exchange rate Europe (€m) Q4 2013 Chge yoy FY 2013 Chge yoy Sales 1,853.0 -2.4% 7,078.6 -4.8% same-day -1.4% -4.2% Adj. EBITA1 137.7 -7.3% 467.1 -10.8% as % of
Slide 9: Europe: Q4 2013 business highlights
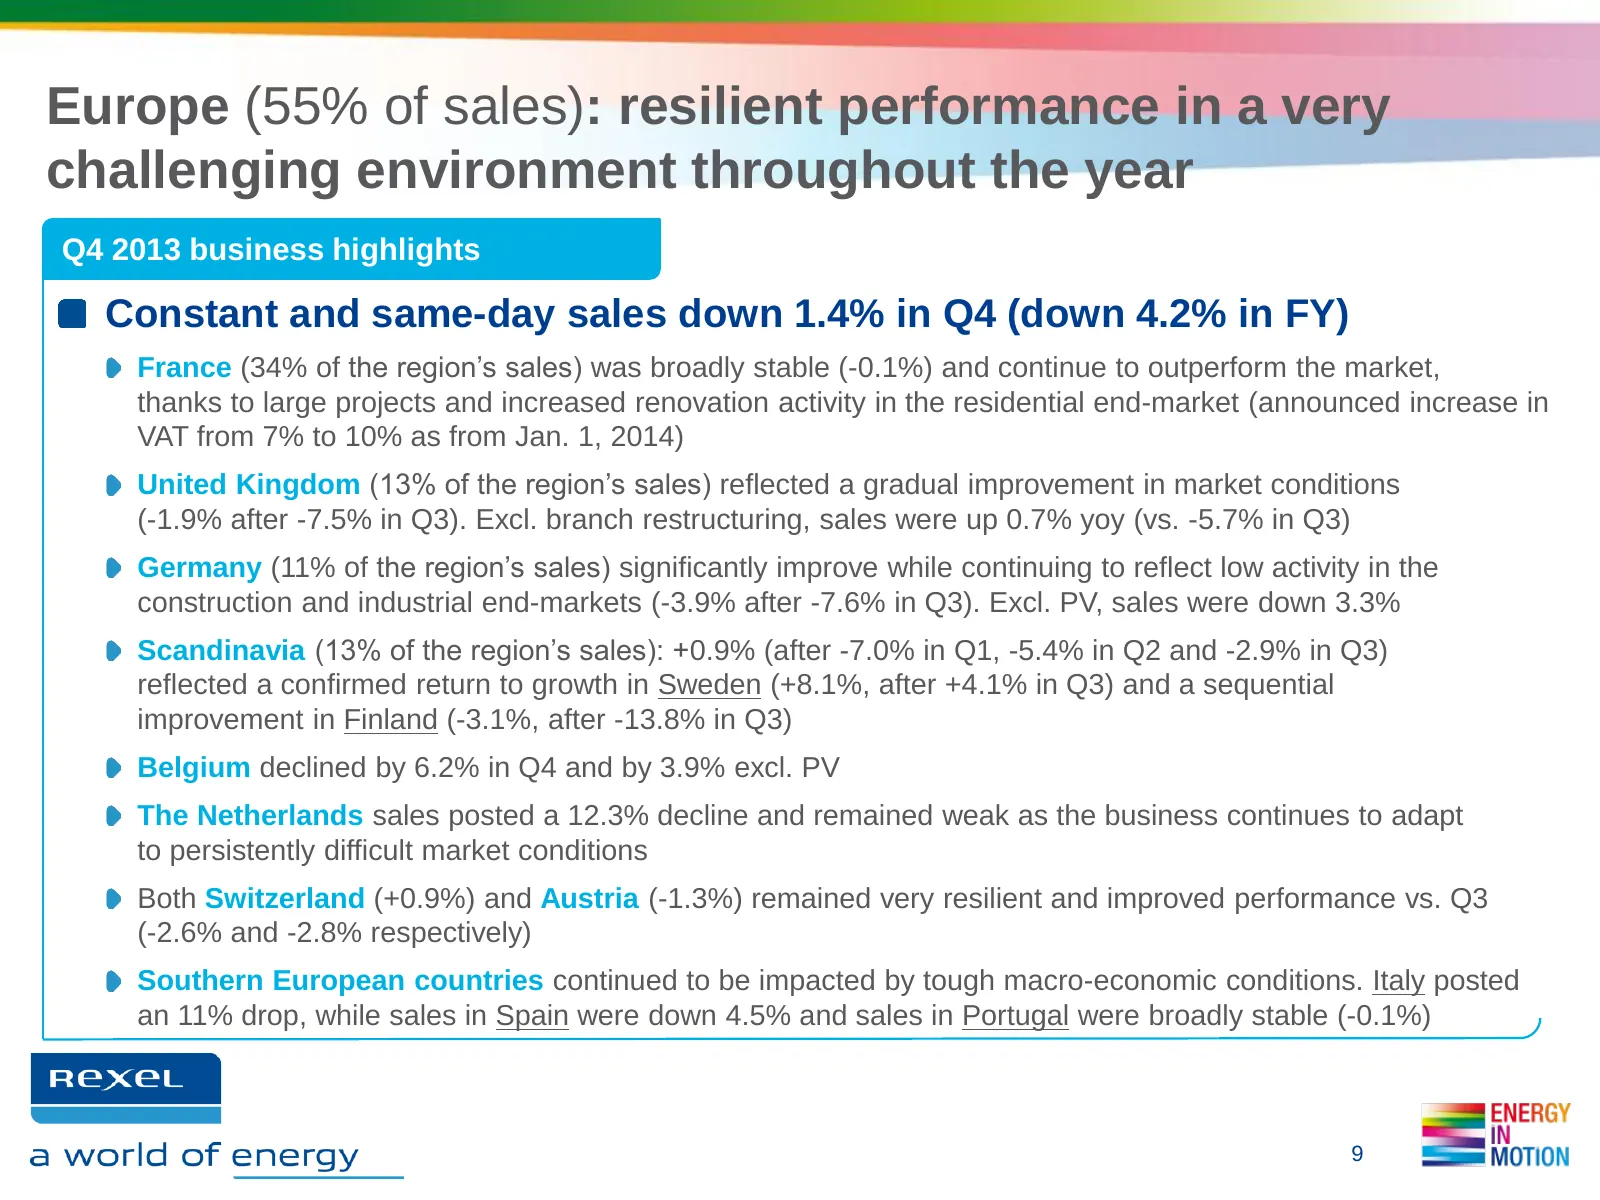
Europe (55% of sales): resilient performance in a very challenging environment throughout the year Q4 2013 business highlights Constant and same-day sales down 1.4% in Q4 (down 4.2% in FY) France (34% of the region’s sales) was broadly stable (-0.1%) and continue to outperform the market, thanks to
Slide 10: North America (34% of sales): improved performance
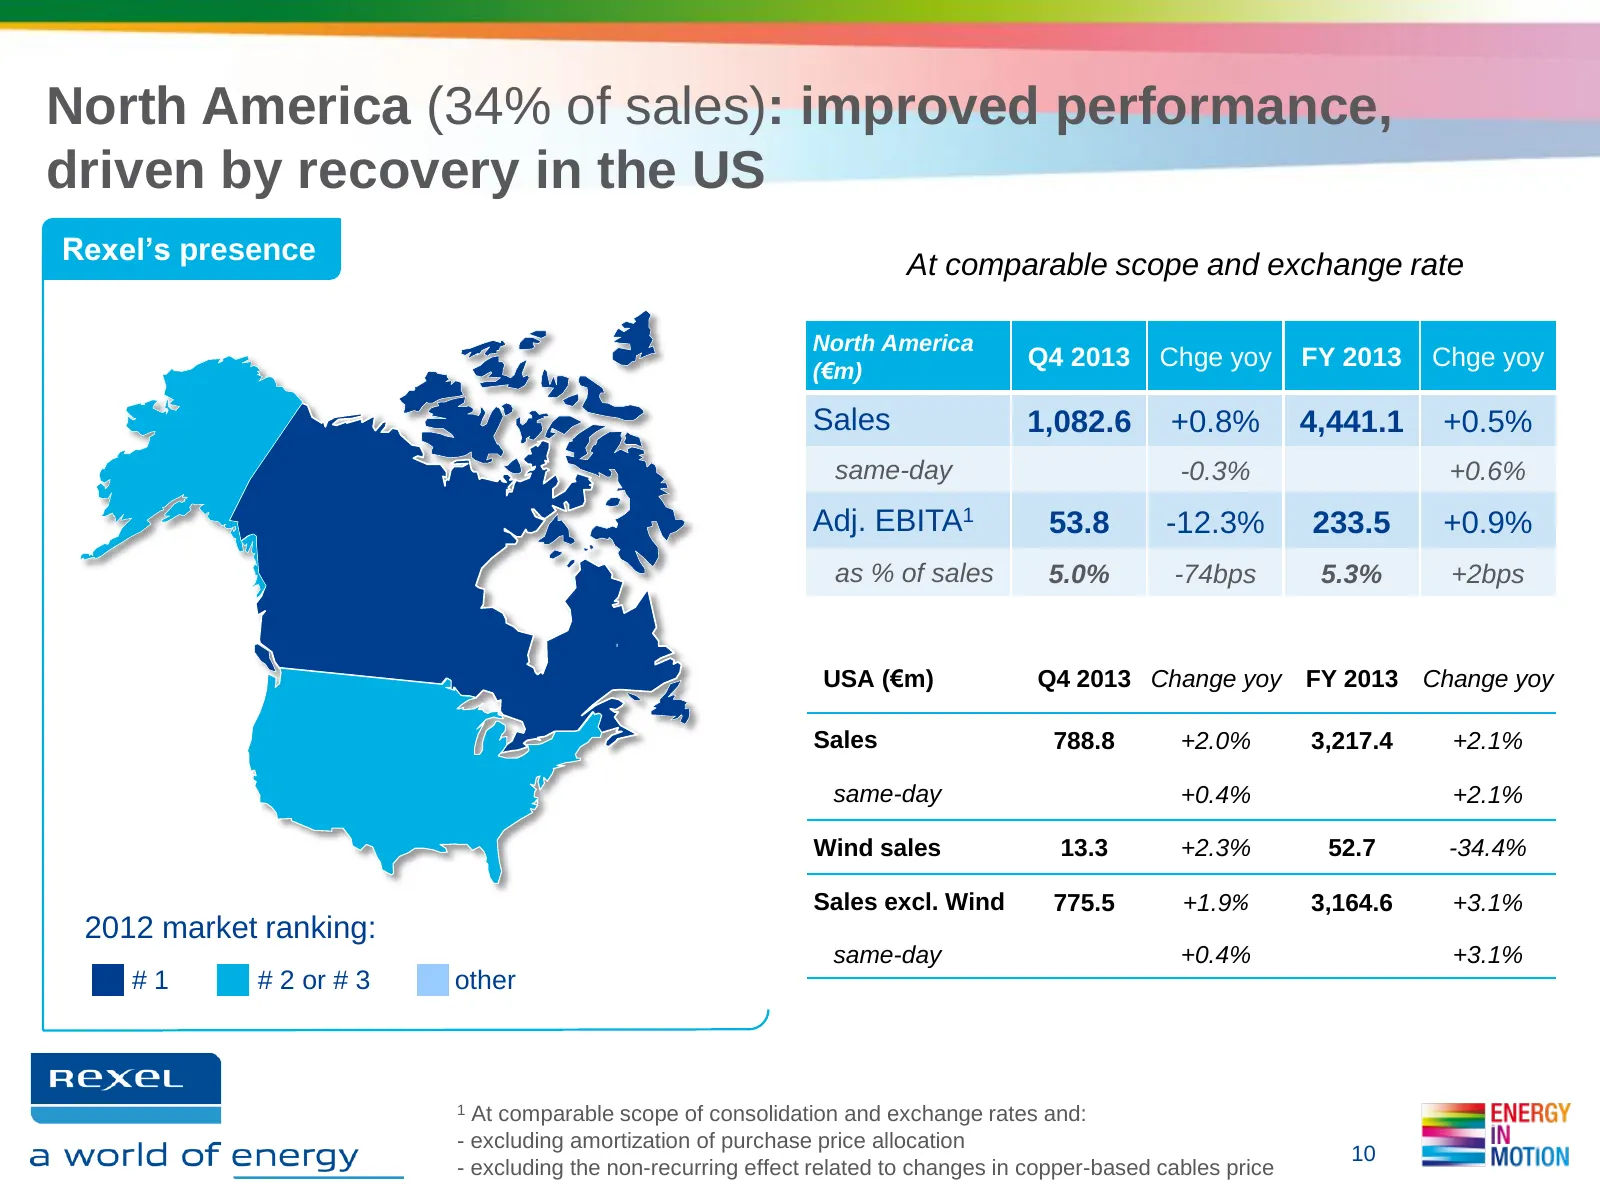
North America (34% of sales): improved performance, driven by recovery in the US Rexel’s presence At comparable scope and exchange rate North America (€m) Q4 2013 Chge yoy FY 2013 Chge yoy Sales 1,082.6 +0.8% 4,441.1 +0.5% same-day -0.3% +0.6% Adj. EBITA1 53.8 -12.3% 233.5 +0.9% as % of sales 5.0% -
Slide 11: North America: Q4 2013 business highlights
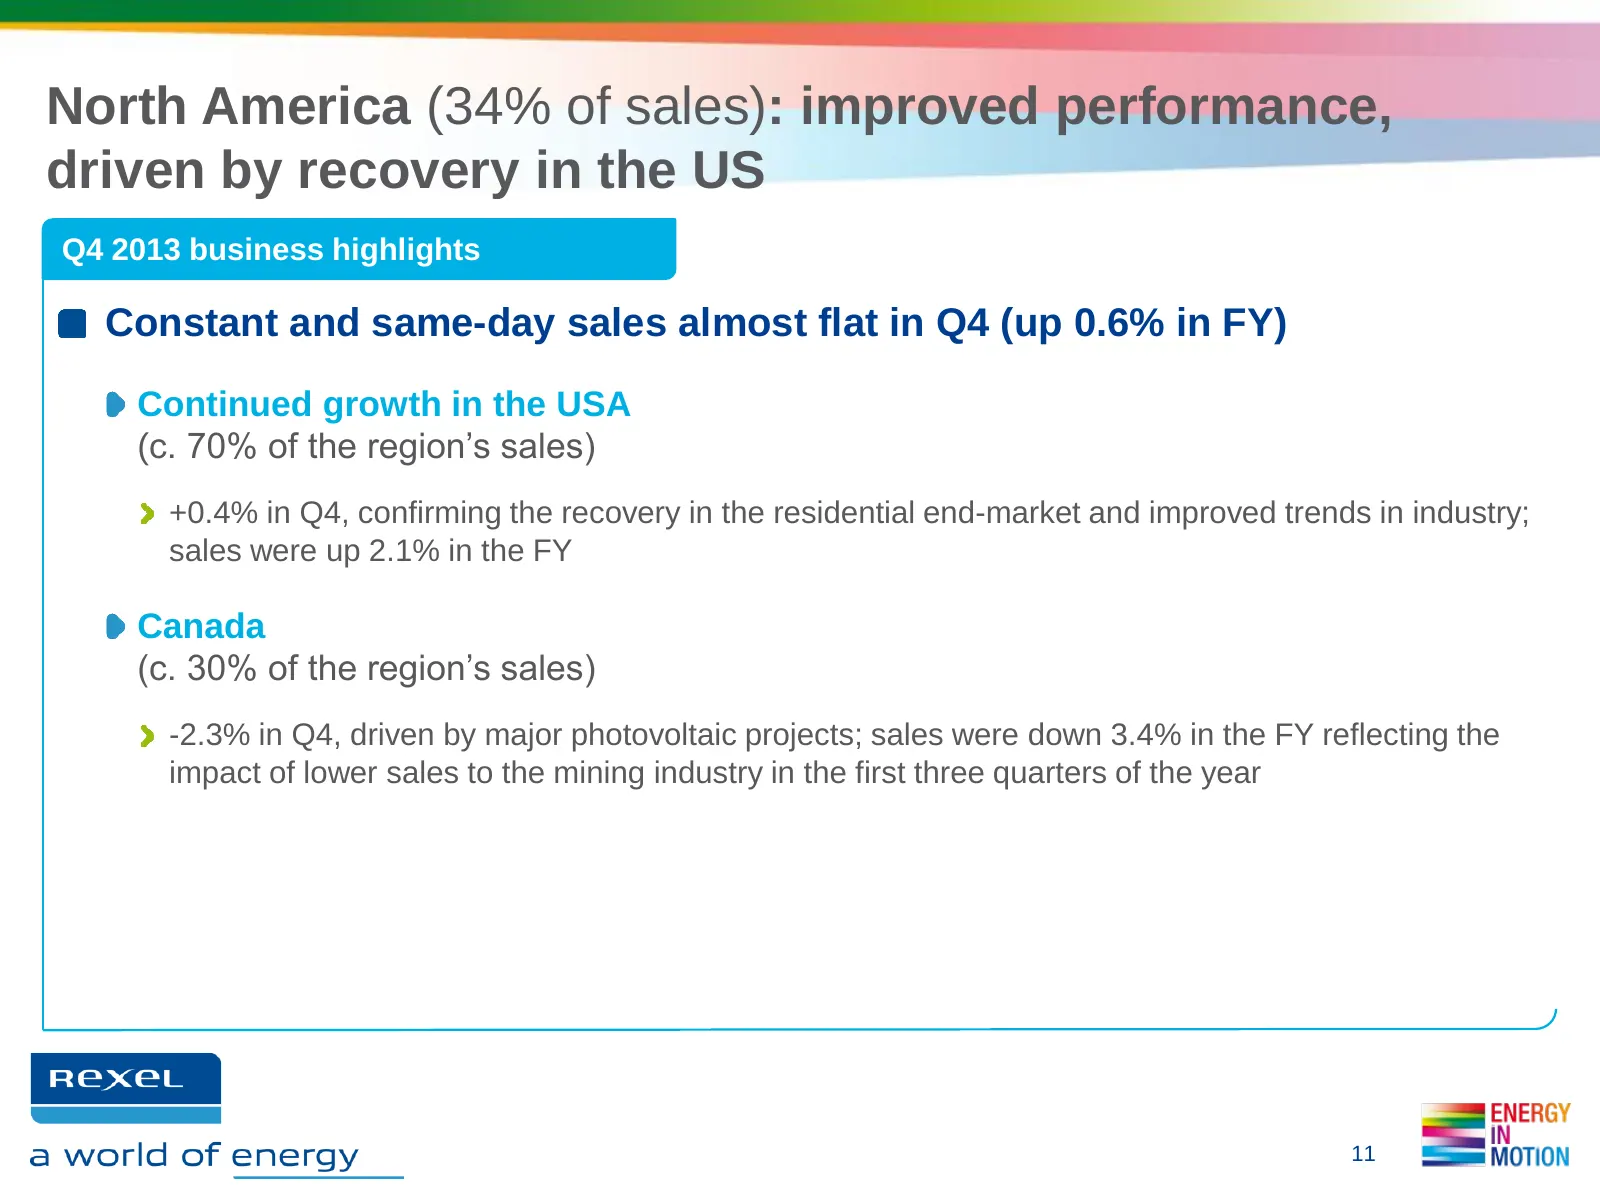
North America (34% of sales): improved performance, driven by recovery in the US Q4 2013 business highlights Constant and same-day sales almost flat in Q4 (up 0.6% in FY) Continued growth in the USA (c. 70% of the region’s sales) +0.4% in Q4, confirming the recovery in the residential end-market and
Slide 12: Asia-Pacific (9% of sales): growth in Asia
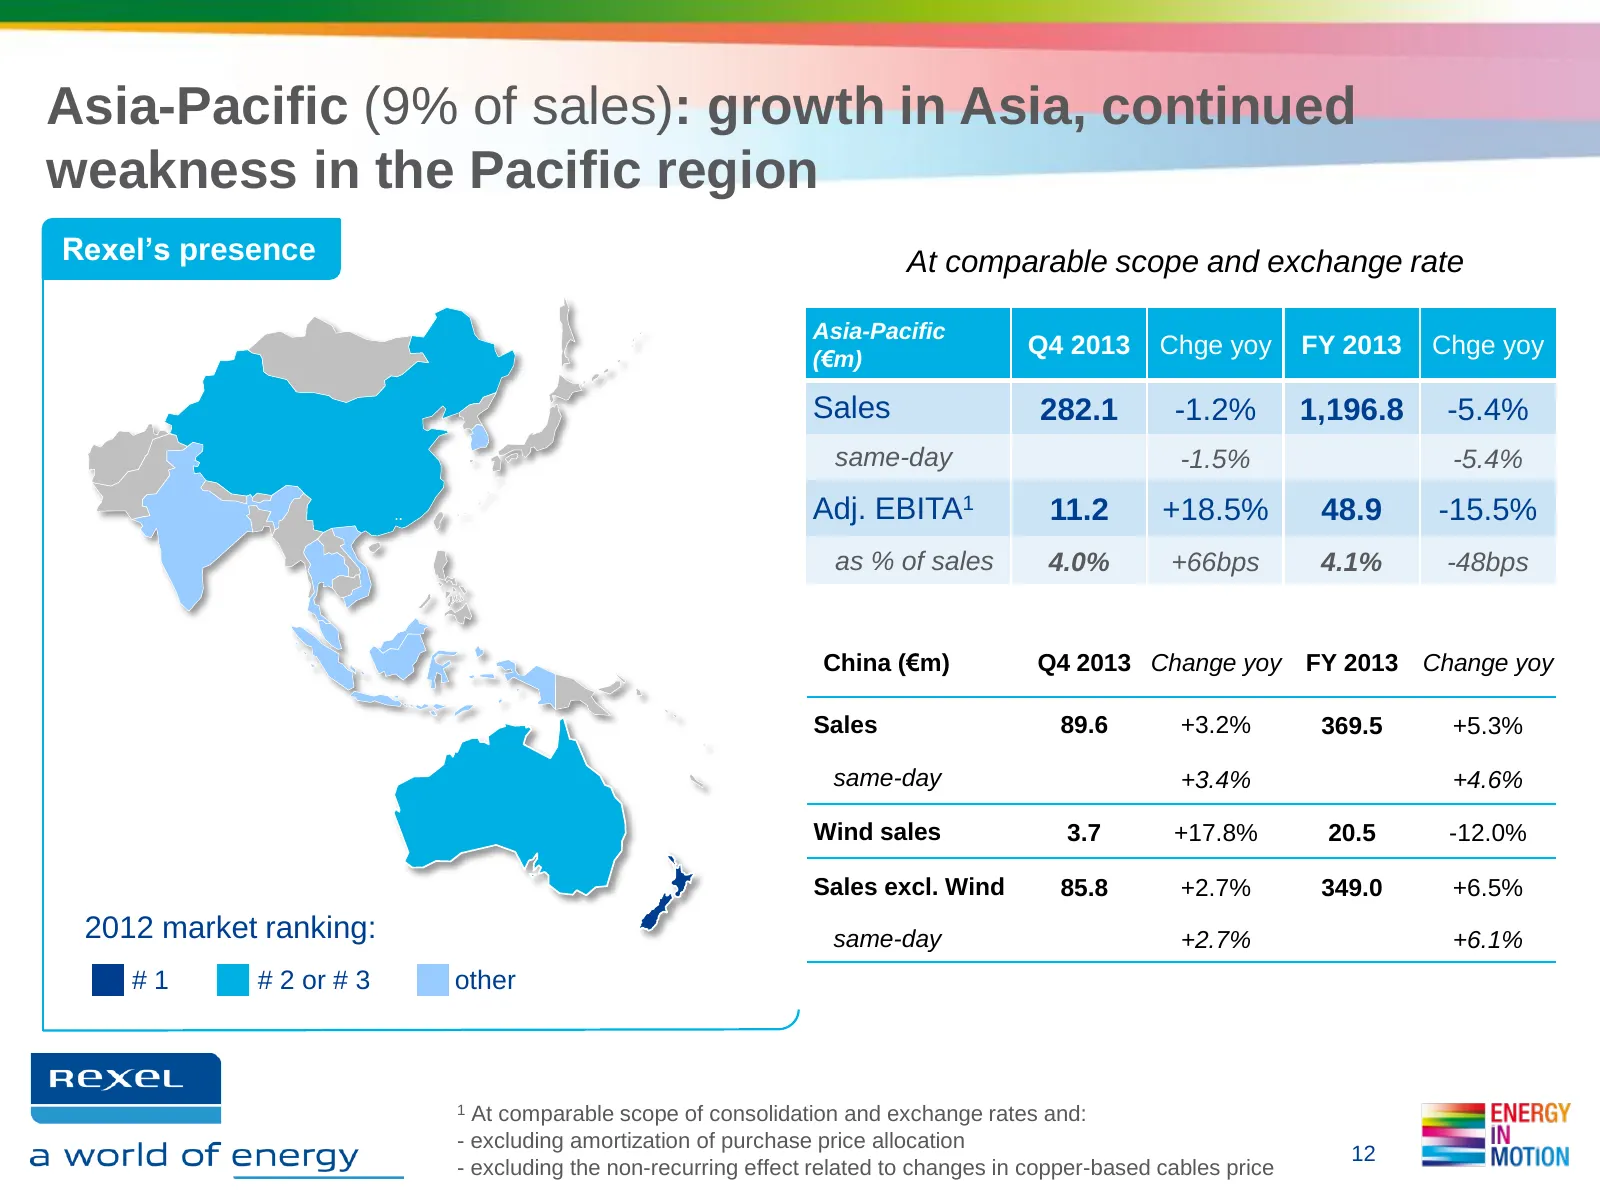
Asia-Pacific (9% of sales): growth in Asia, continued weakness in the Pacific region Rexel’s presence At comparable scope and exchange rate Asia-Pacific (€m) Q4 2013 Chge yoy FY 2013 Chge yoy Sales 282.1 -1.2% 1,196.8 -5.4% same-day -1.5% -5.4% Adj. EBITA1 11.2 +18.5% 48.9 -15.5% as % of sales 4.0%
Slide 13: Asia-Pacific: Q4 2013 business highlights
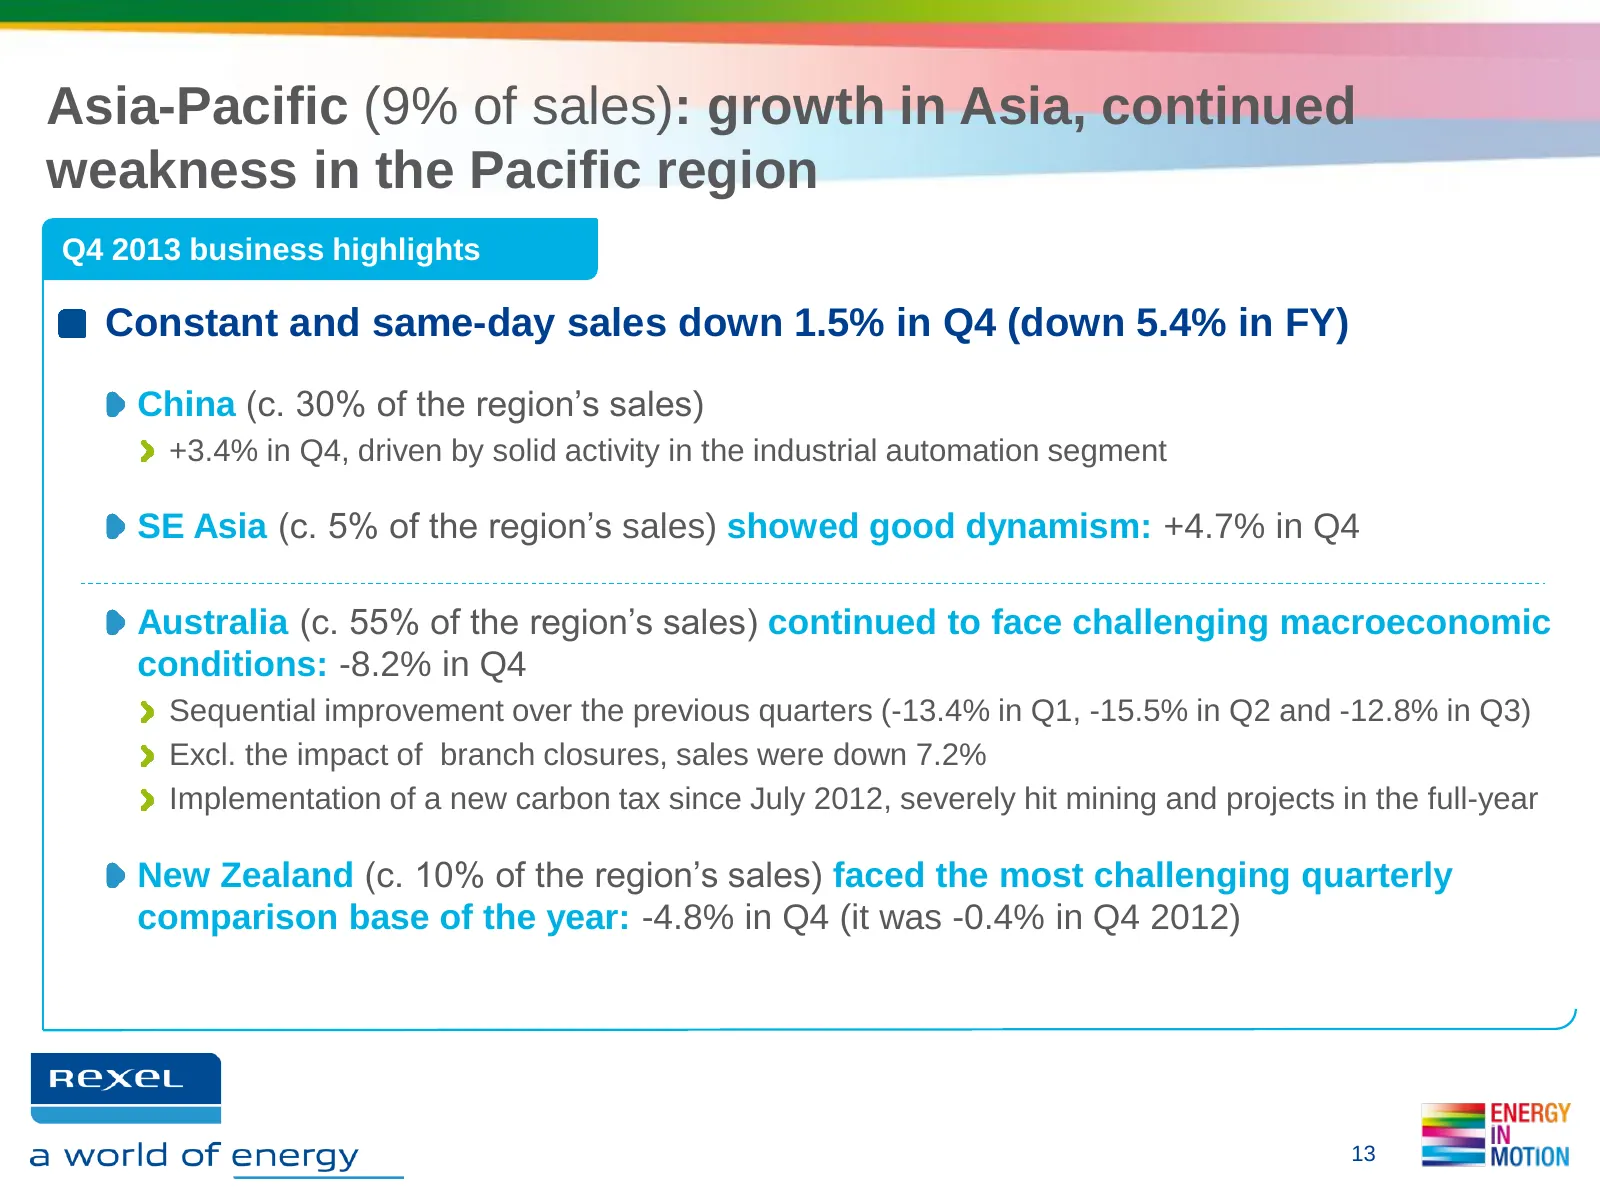
Asia-Pacific (9% of sales): growth in Asia, continued weakness in the Pacific region Q4 2013 business highlights Constant and same-day sales down 1.5% in Q4 (down 5.4% in FY) China (c. 30% of the region’s sales) +3.4% in Q4, driven by solid activity in the industrial automation segment SE Asia (c. 5
Slide 14: Latin America (2% of sales)
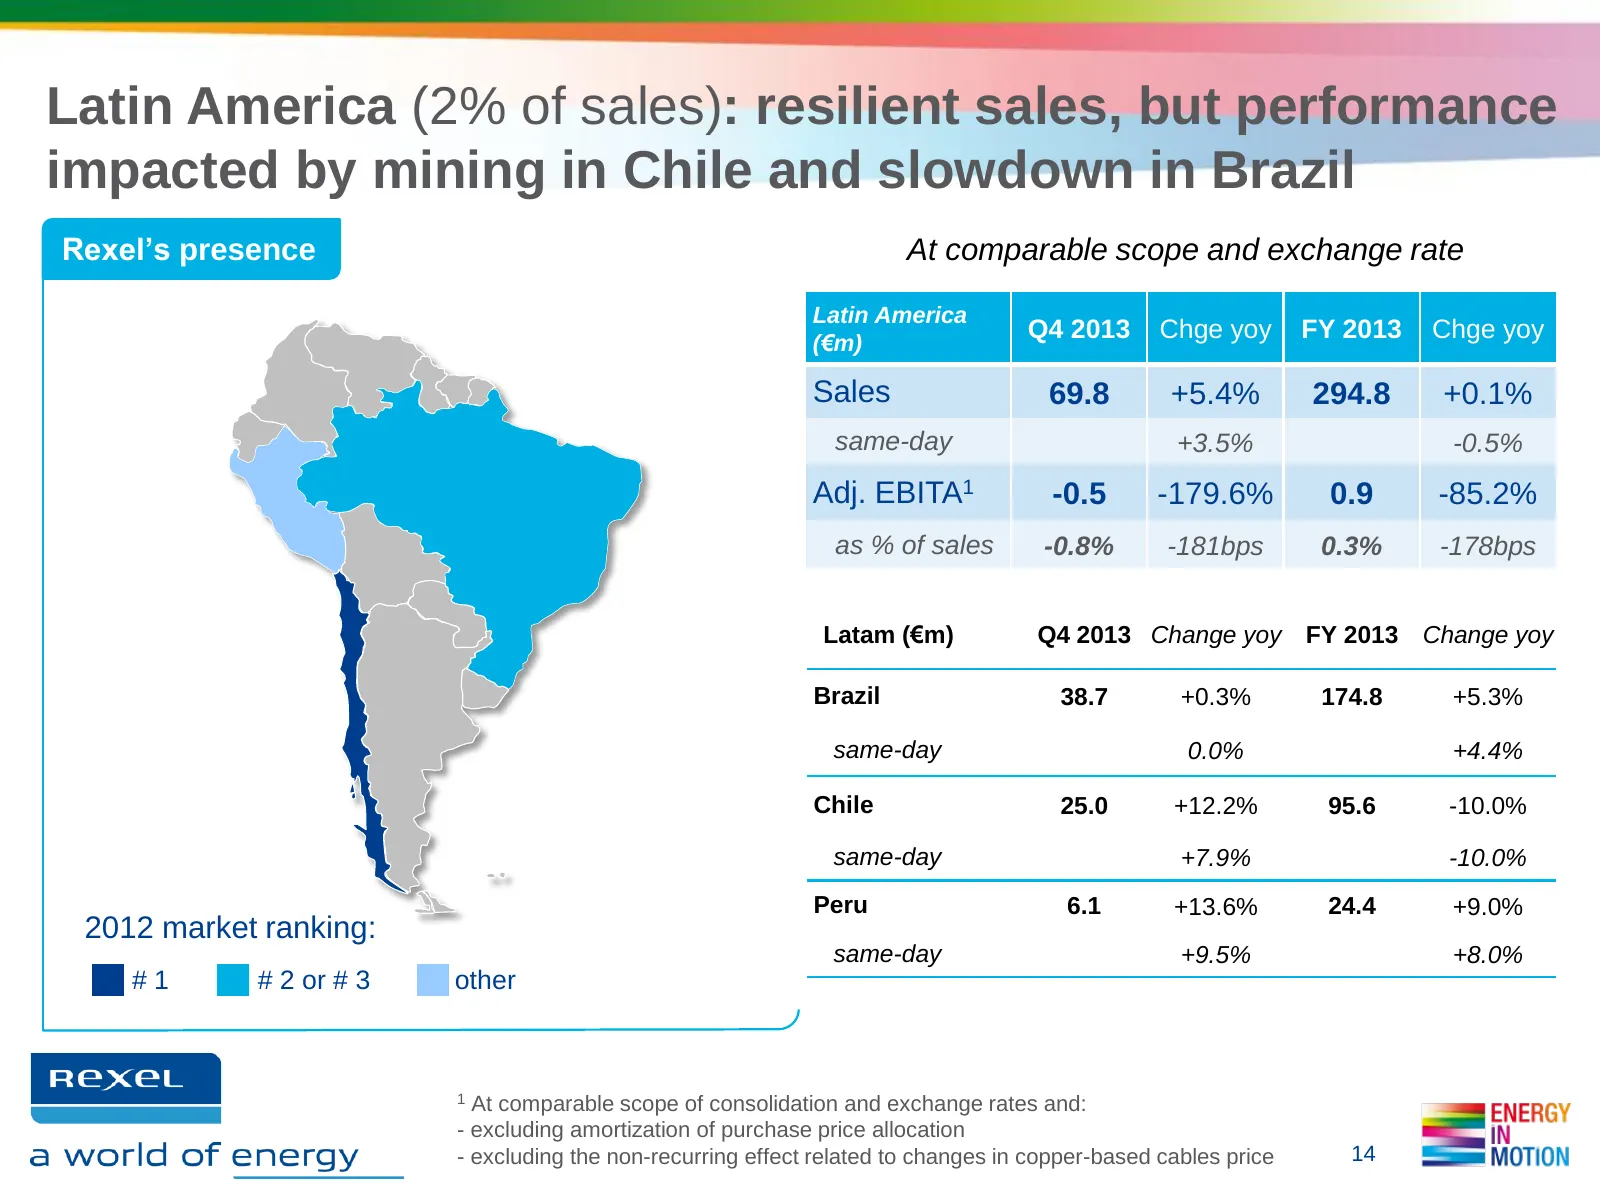
Latin America (2% of sales): resilient sales, but performance impacted by mining in Chile and slowdown in Brazil Rexel’s presence At comparable scope and exchange rate Latin America (€m) Q4 2013 Chge yoy FY 2013 Chge yoy Sales 69.8 +5.4% 294.8 +0.1% same-day +3.5% -0.5% Adj. EBITA1 -0.5 -179.6% 0.9
Slide 15: Latin America: Q4 2013 business highlights
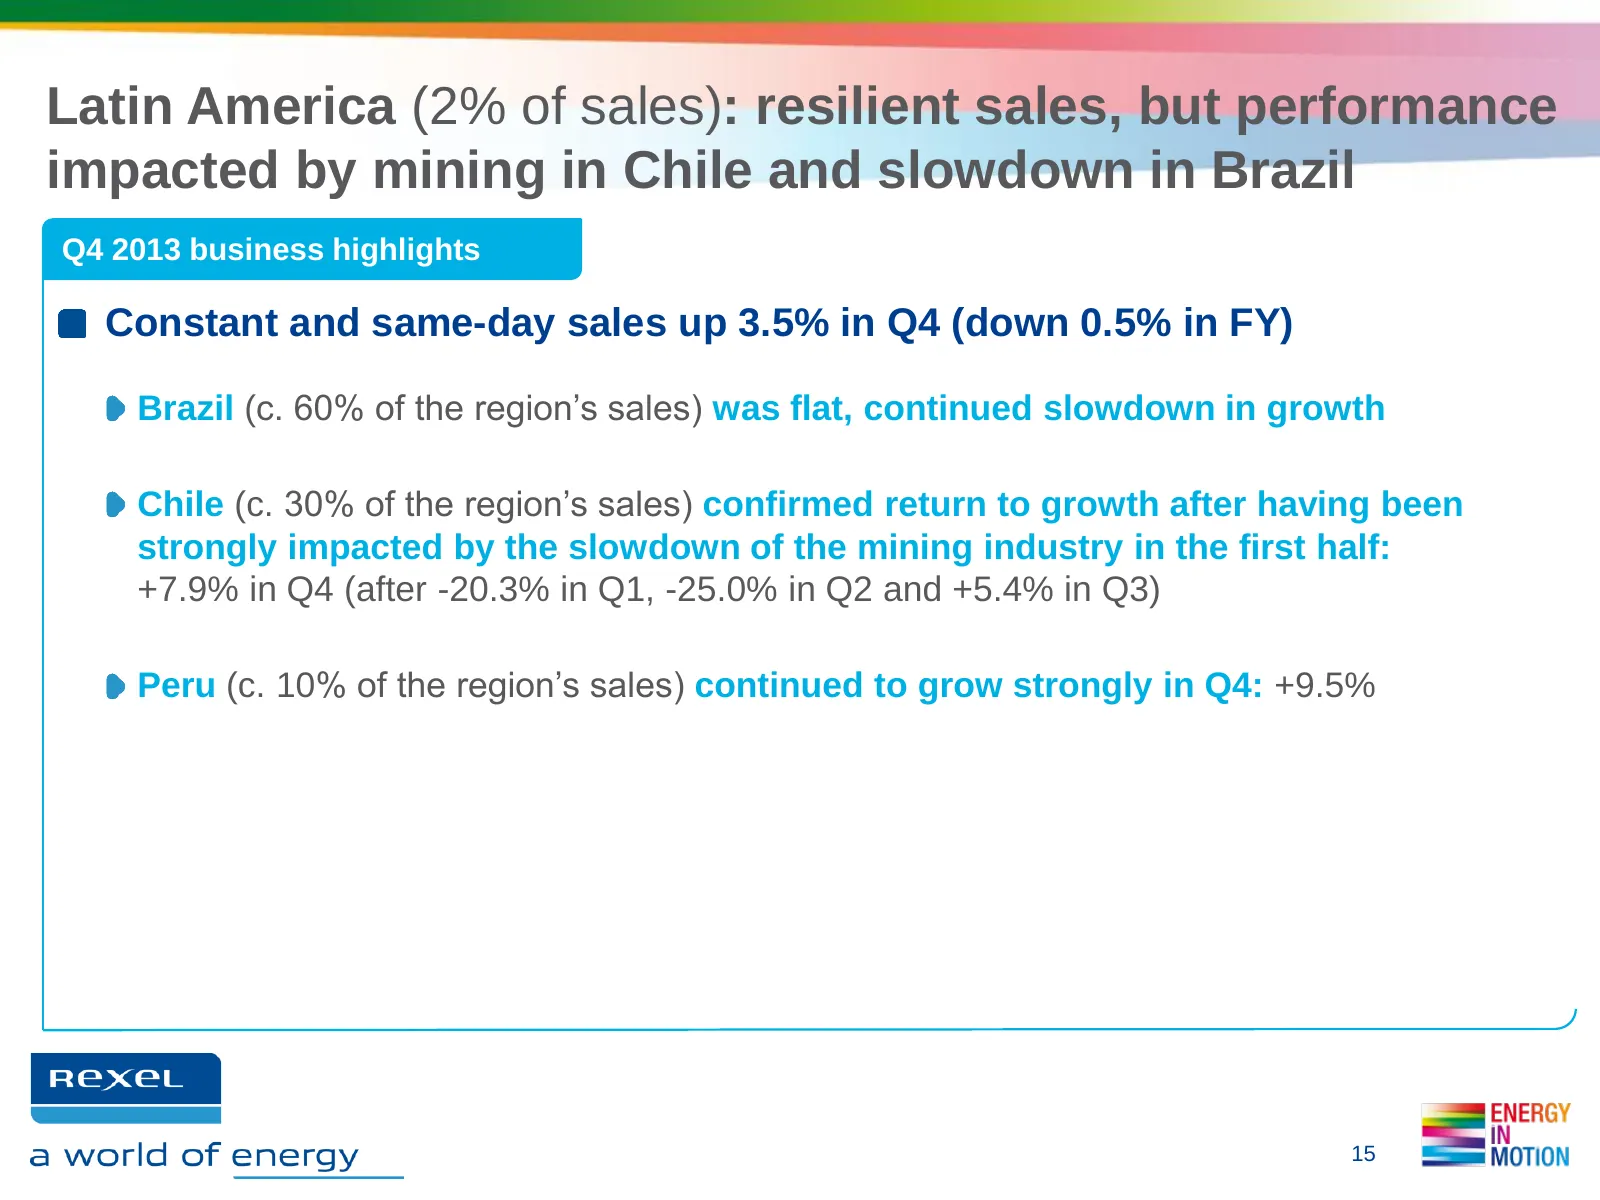
Latin America (2% of sales): resilient sales, but performance impacted by mining in Chile and slowdown in Brazil Q4 2013 business highlights Constant and same-day sales up 3.5% in Q4 (down 0.5% in FY) Brazil (c. 60% of the region’s sales) was flat, continued slowdown in growth Chile (c. 30% of the r
Slide 16: Financial Review
FINANCIAL REVIEW RexeL as a world of energy
Slide 17: Reported sales down 3.3% in the full-year
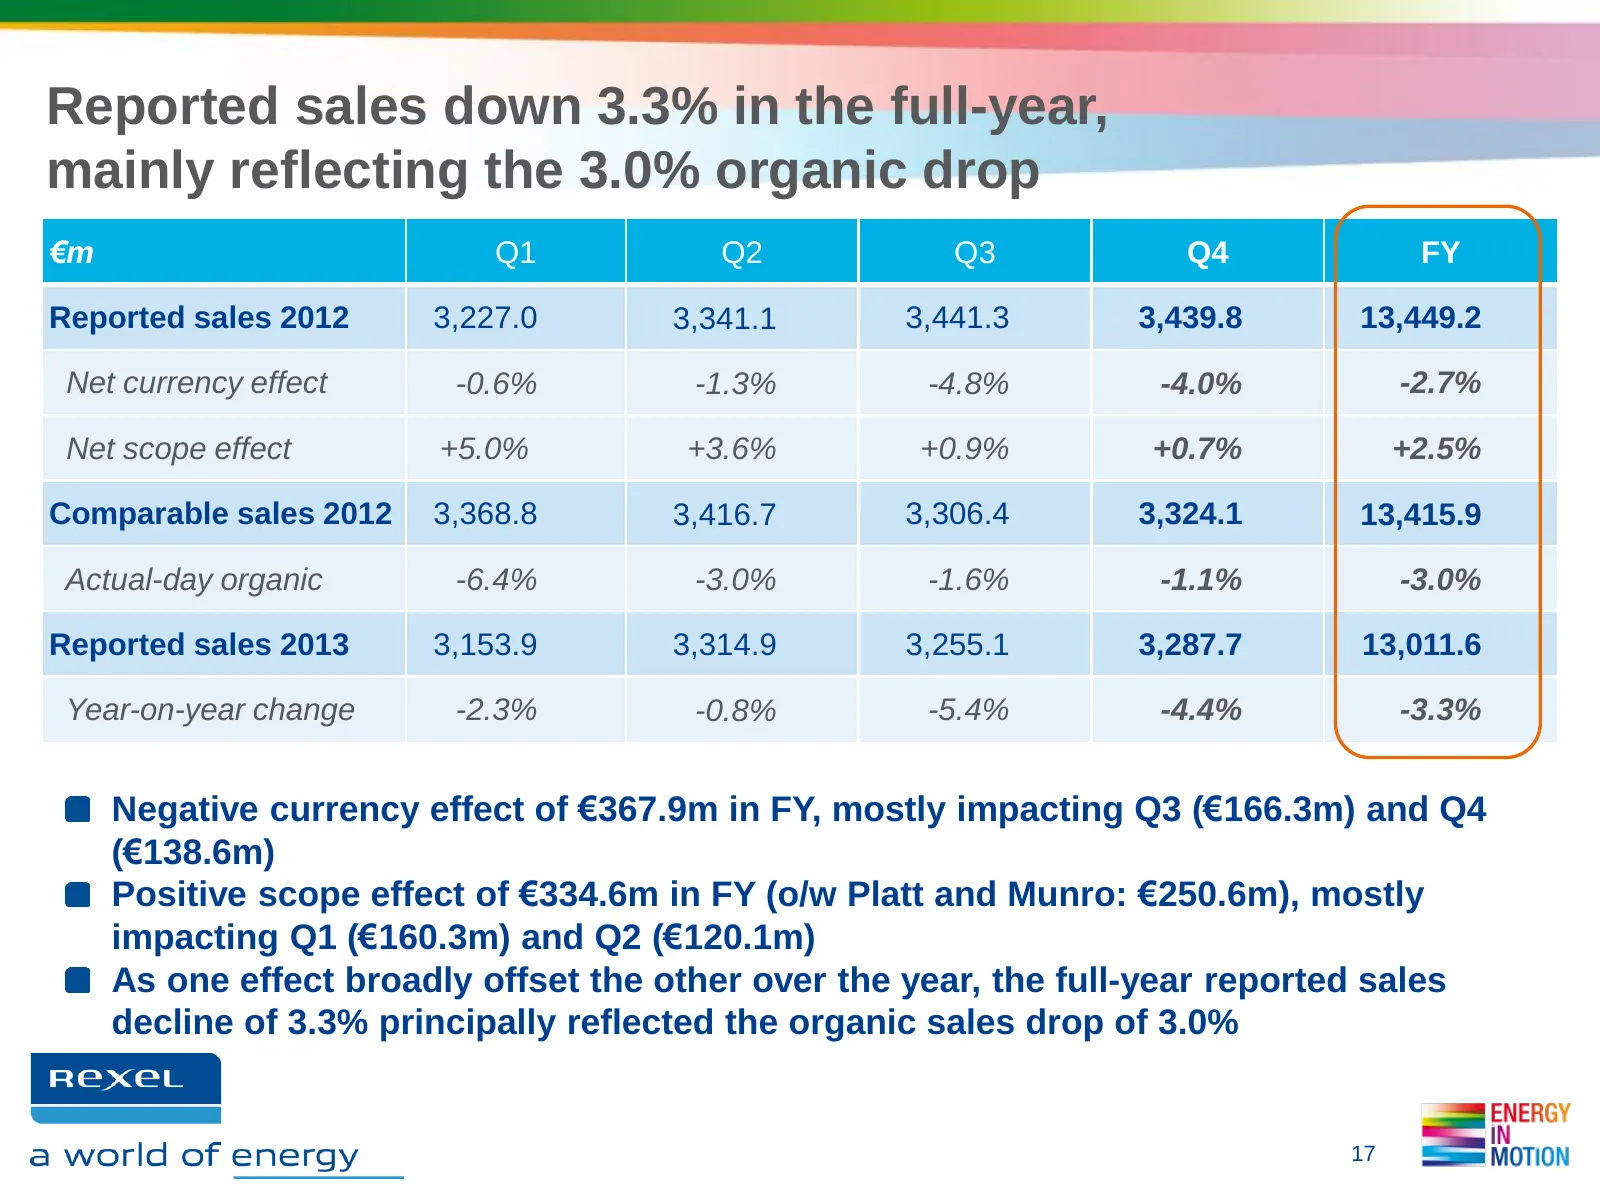
Reported sales down 3.3% in the full-year, mainly reflecting the 3.0% organic drop €m Q1 Q2 Q3 Q4 FY Reported sales 2012 3,227.0 3,341.1 3,441.3 3,439.8 13,449.2 Net currency effect -0.6% -1.3% -4.8% -4.0% -2.7% Net scope effect +5.0% +3.6% +0.9% +0.7% +2.5% Comparable sales 2012 3,368.8 3,416.7 3,3
Slide 18: Sequential improvement in organic sales trends
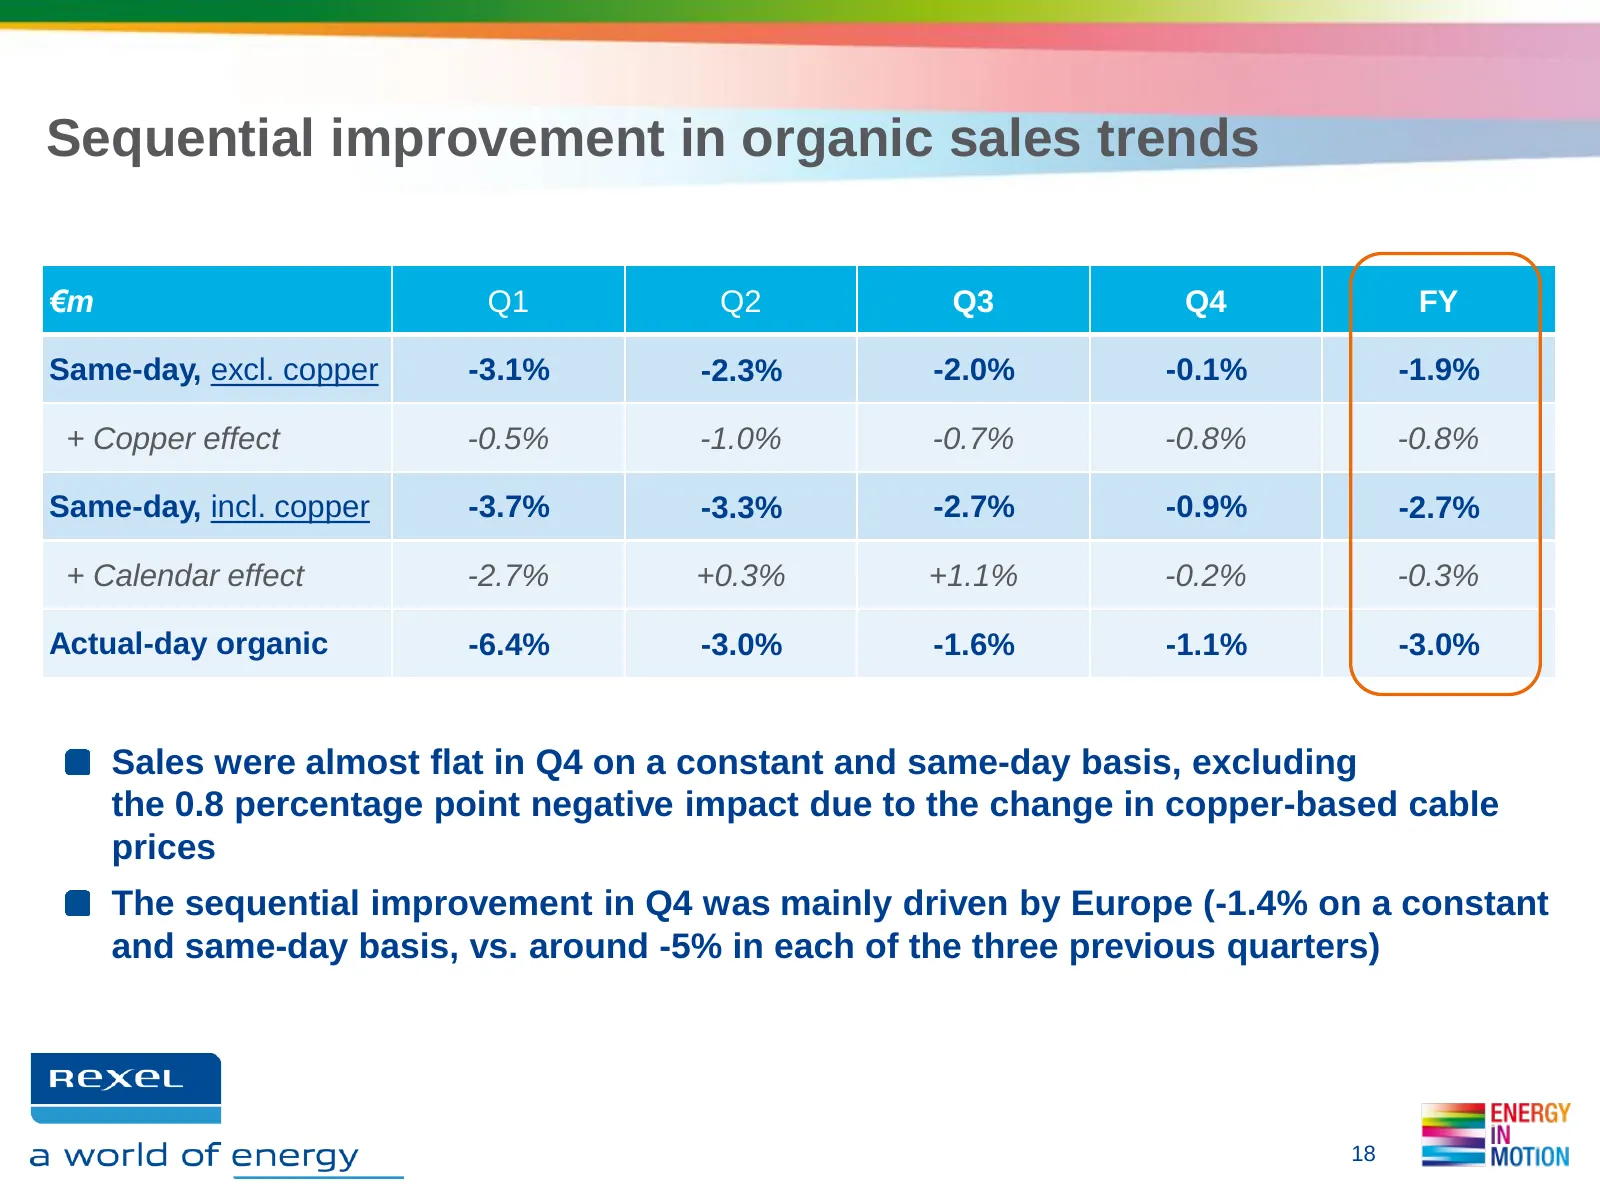
Sequential improvement in organic sales trends €m Q1 Q2 Q3 Q4 FY Same-day, excl. copper -3.1% -2.3% -2.0% -0.1% -1.9% + Copper effect -0.5% -1.0% -0.7% -0.8% -0.8% Same-day, incl. copper -3.7% -3.3% -2.7% -0.9% -2.7% + Calendar effect -2.7% +0.3% +1.1% -0.2% -0.3% Actual-day organic -6.4% -3.0% -1.6
Slide 19: Ongoing gross margin discipline
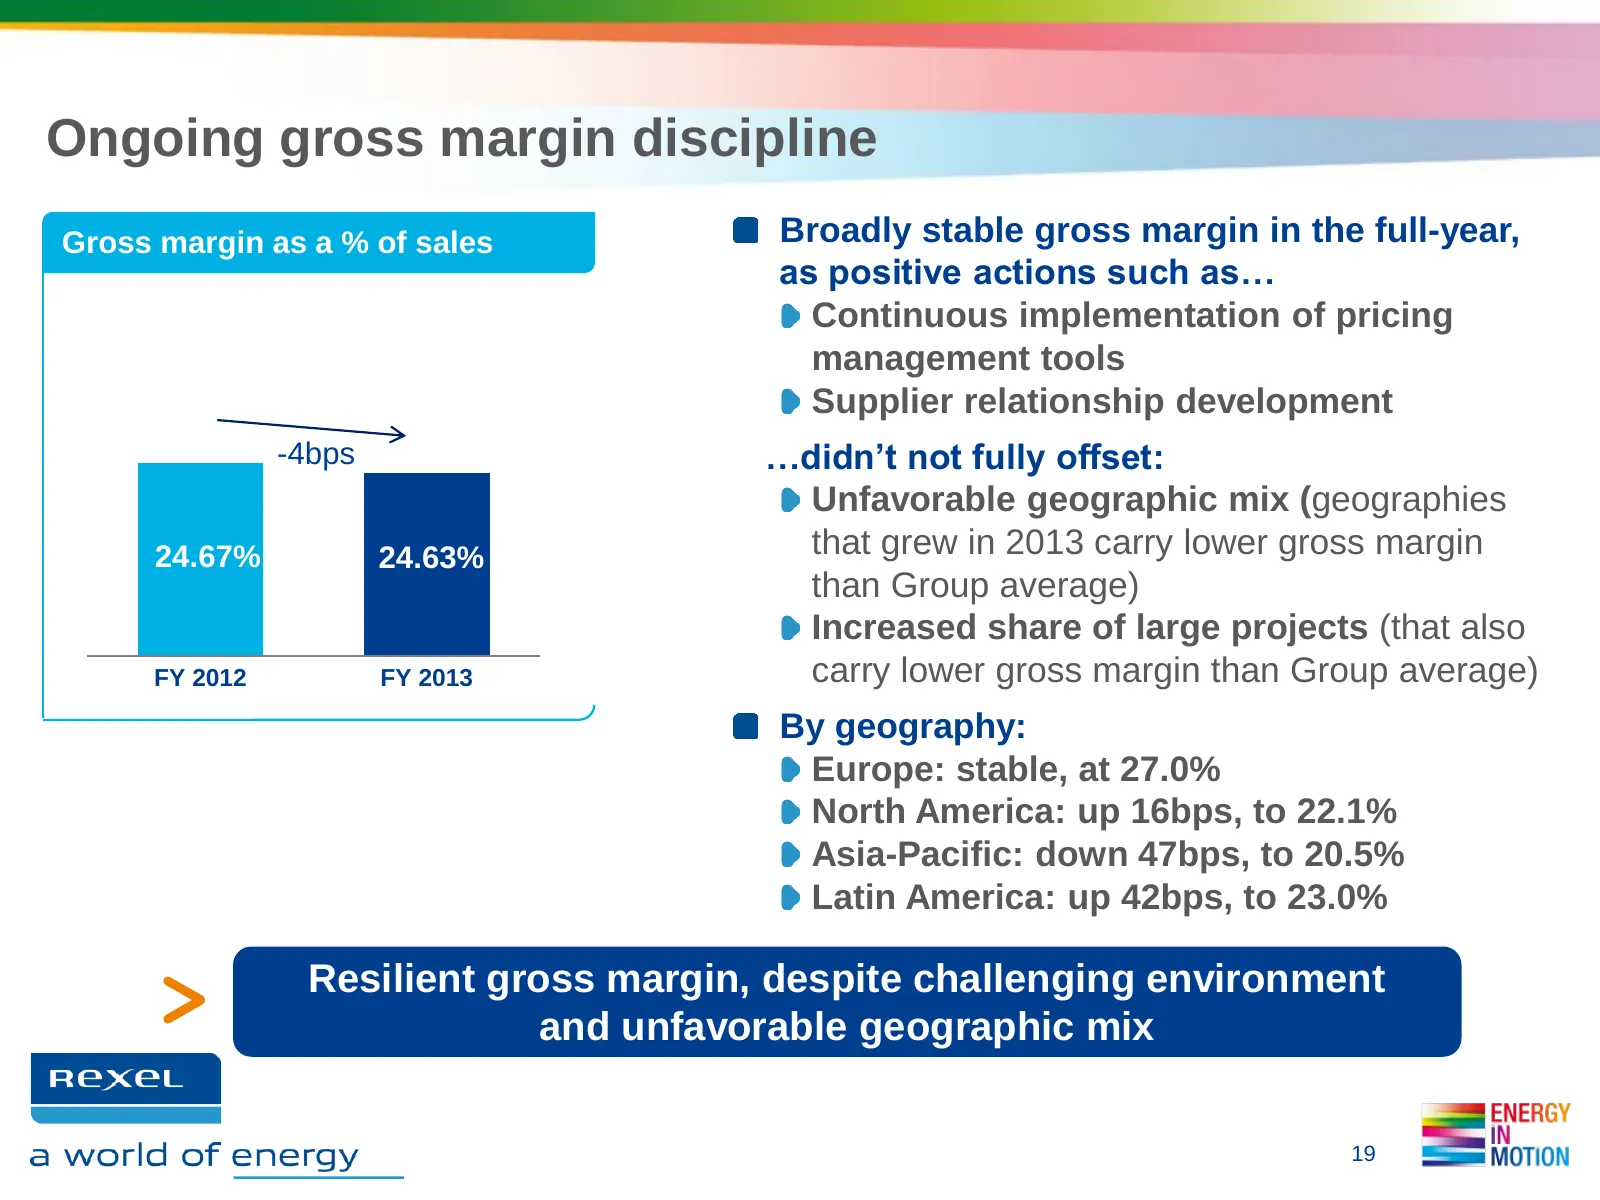
Ongoing gross margin discipline Gross margin as a % of sales Broadly stable gross margin in the full-year, as positive actions such as… Continuous implementation of pricing management tools Supplier relationship development -4bps …didn’t not fully offset: Unfavorable geographic mix (geographies 24.6
Slide 20: Resilient profitability in line with operating leverage
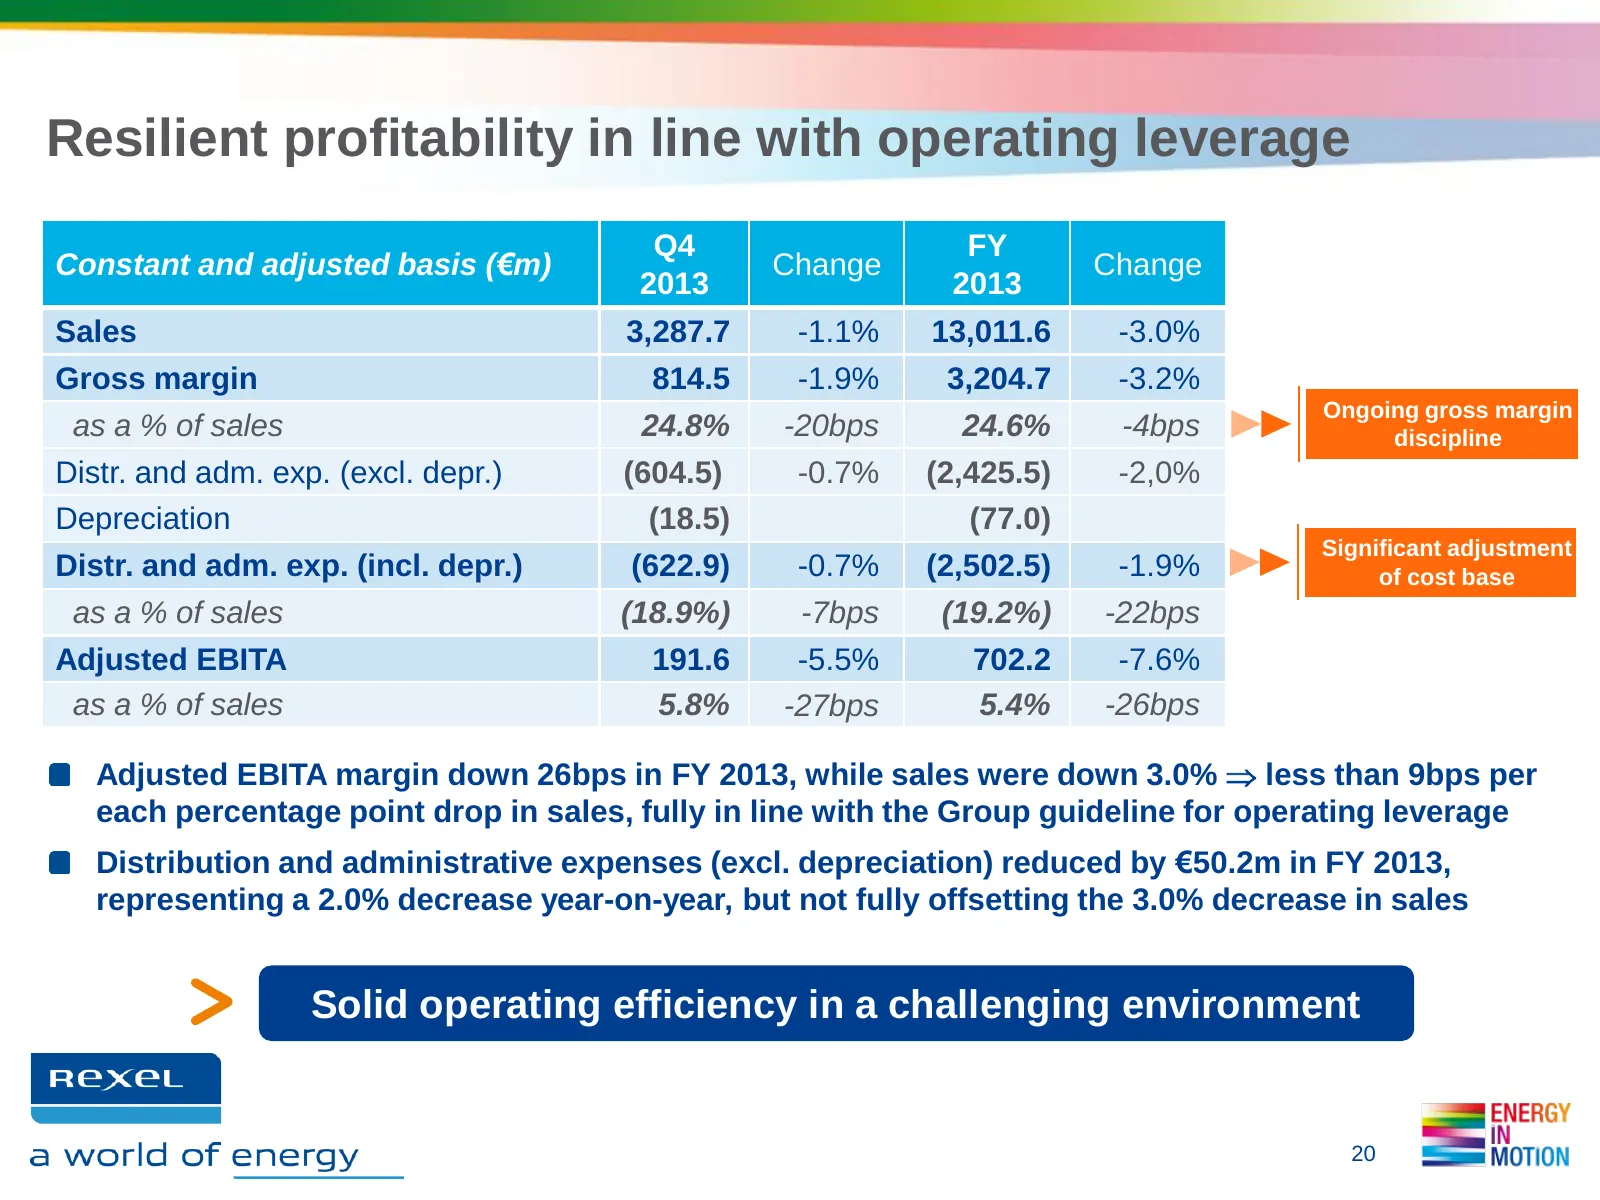
Resilient profitability in line with operating leverage Q4 FY Constant and adjusted basis (€m) Change Change 2013 2013 Sales 3,287.7 -1.1% 13,011.6 -3.0% Gross margin 814.5 -1.9% 3,204.7 -3.2% Ongoing gross margin as a % of sales 24.8% -20bps 24.6% -4bps discipline Distr. and adm. exp. (excl. depr.)
Slide 21: In 2013, we significantly adjusted our cost base
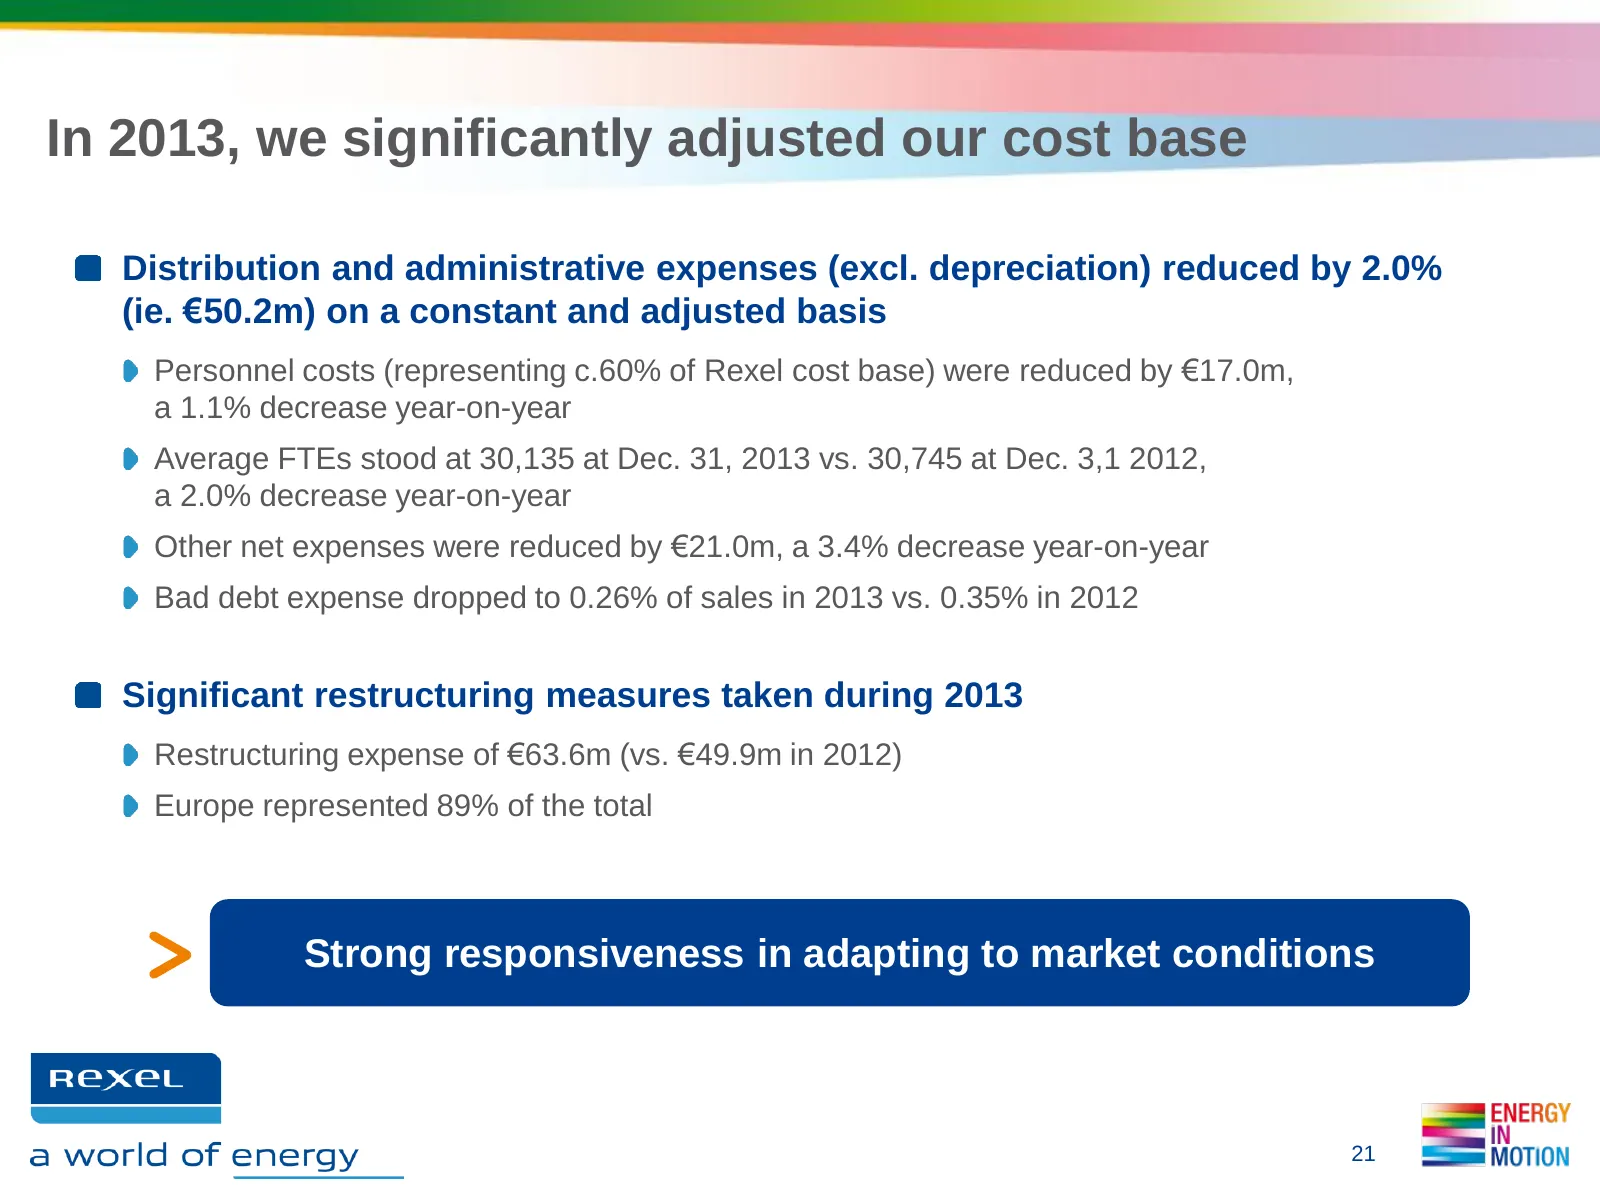
In 2013, we significantly adjusted our cost base Distribution and administrative expenses (excl. depreciation) reduced by 2.0% (ie. €50.2m) on a constant and adjusted basis Personnel costs (representing c.60% of Rexel cost base) were reduced by €17.0m, a 1.1% decrease year-on-year Average FTEs stood
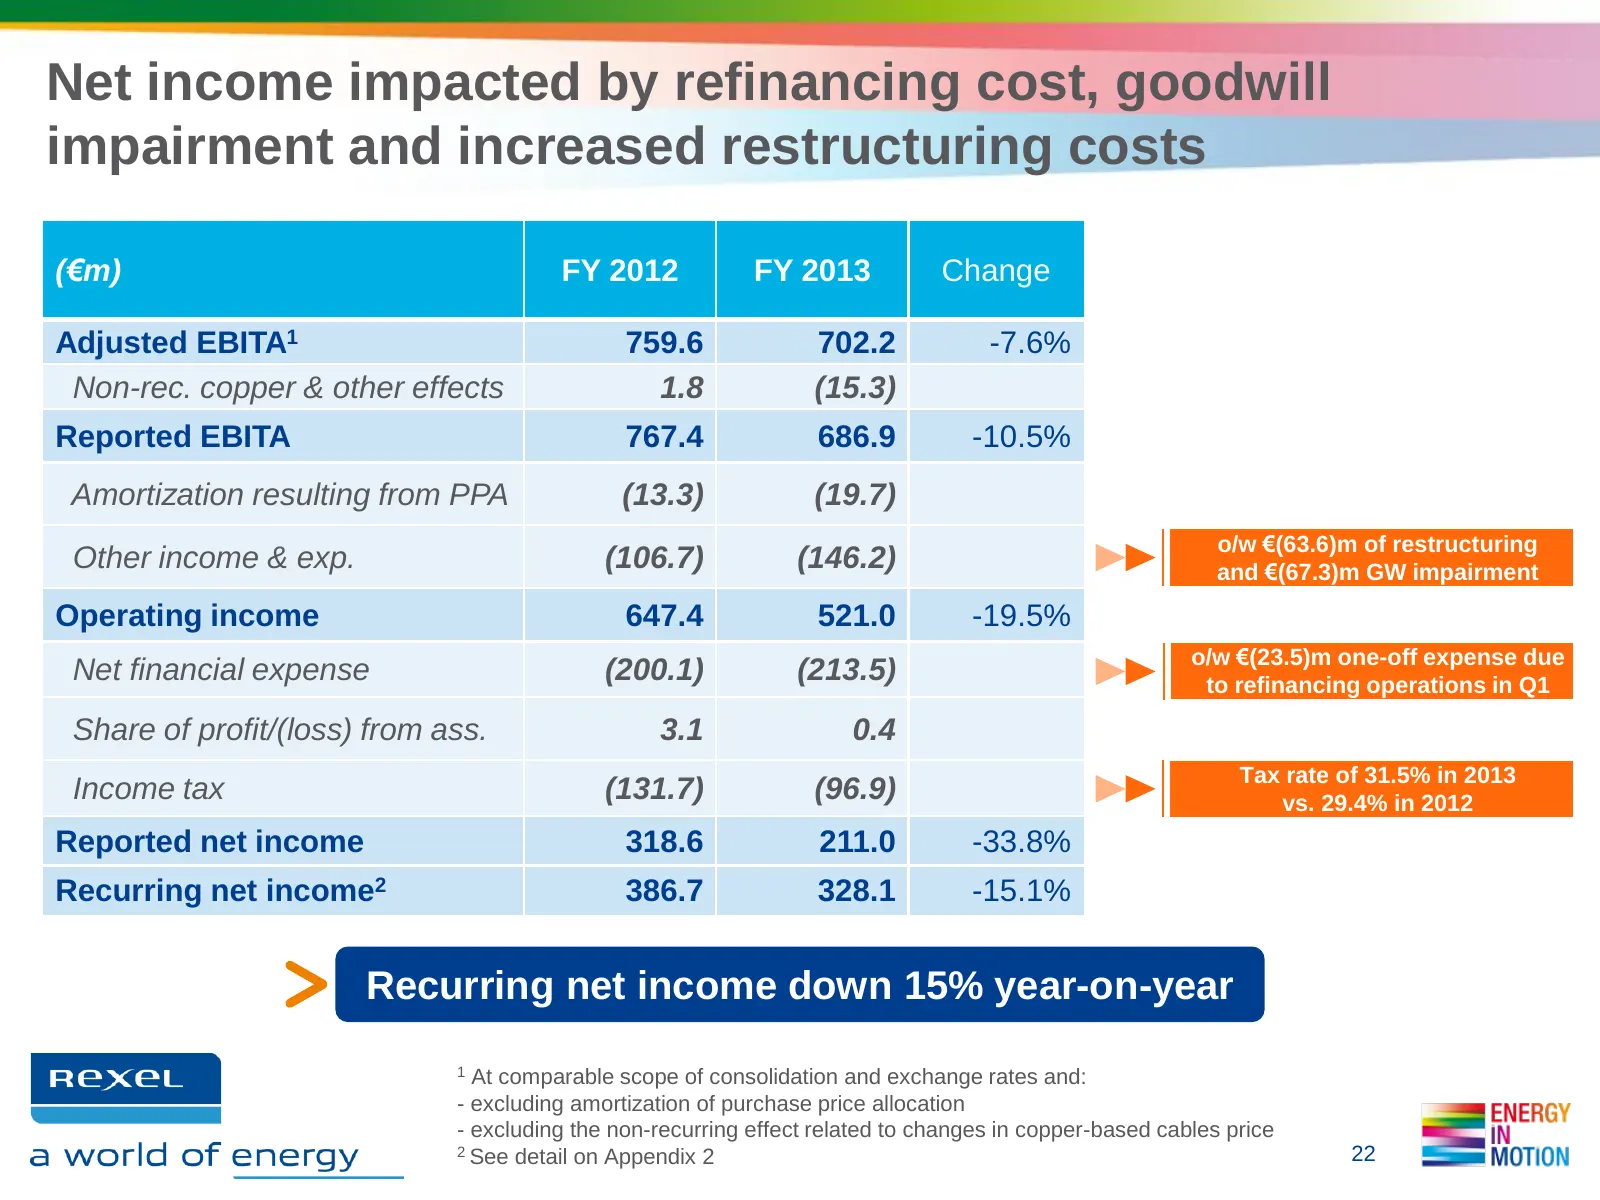
Slide 22: Net income impacted by refinancing cost, goodwill impairment and restructuring
Net income impacted by refinancing cost, goodwill impairment and increased restructuring costs (€m) FY 2012 FY 2013 Change Adjusted EBITA1 759.6 702.2 -7.6% Non-rec. copper & other effects 1.8 (15.3) Reported EBITA 767.4 686.9 -10.5% Amortization resulting from PPA (13.3) (19.7) o/w €(63.6)m of rest
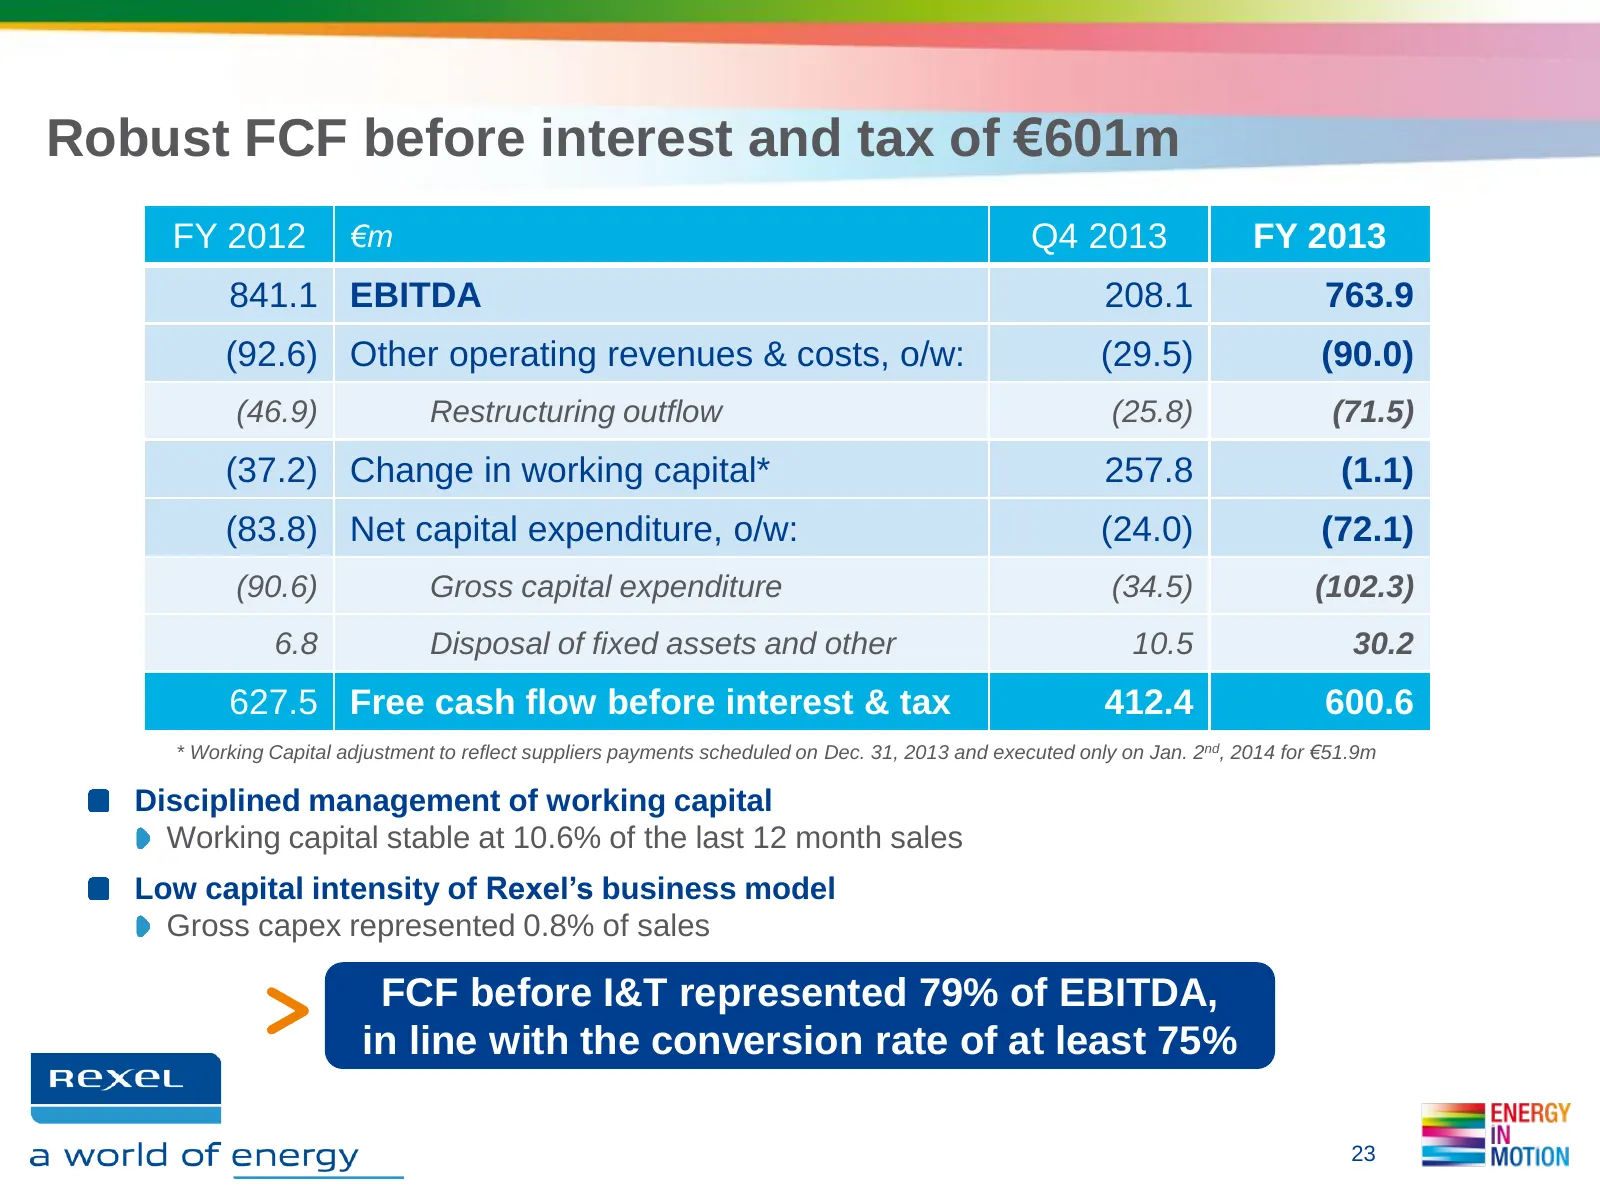
Slide 23: Robust FCF before interest and tax of €601m
Robust FCF before interest and tax of €601m FY 2012 €m Q4 2013 FY 2013 841.1 EBITDA 208.1 763.9 (92.6) Other operating revenues & costs, o/w: (29.5) (90.0) (46.9) Restructuring outflow (25.8) (71.5) (37.2) Change in working capital* 257.8 (1.1) (83.8) Net capital expenditure, o/w: (24.0) (72.1) (90.
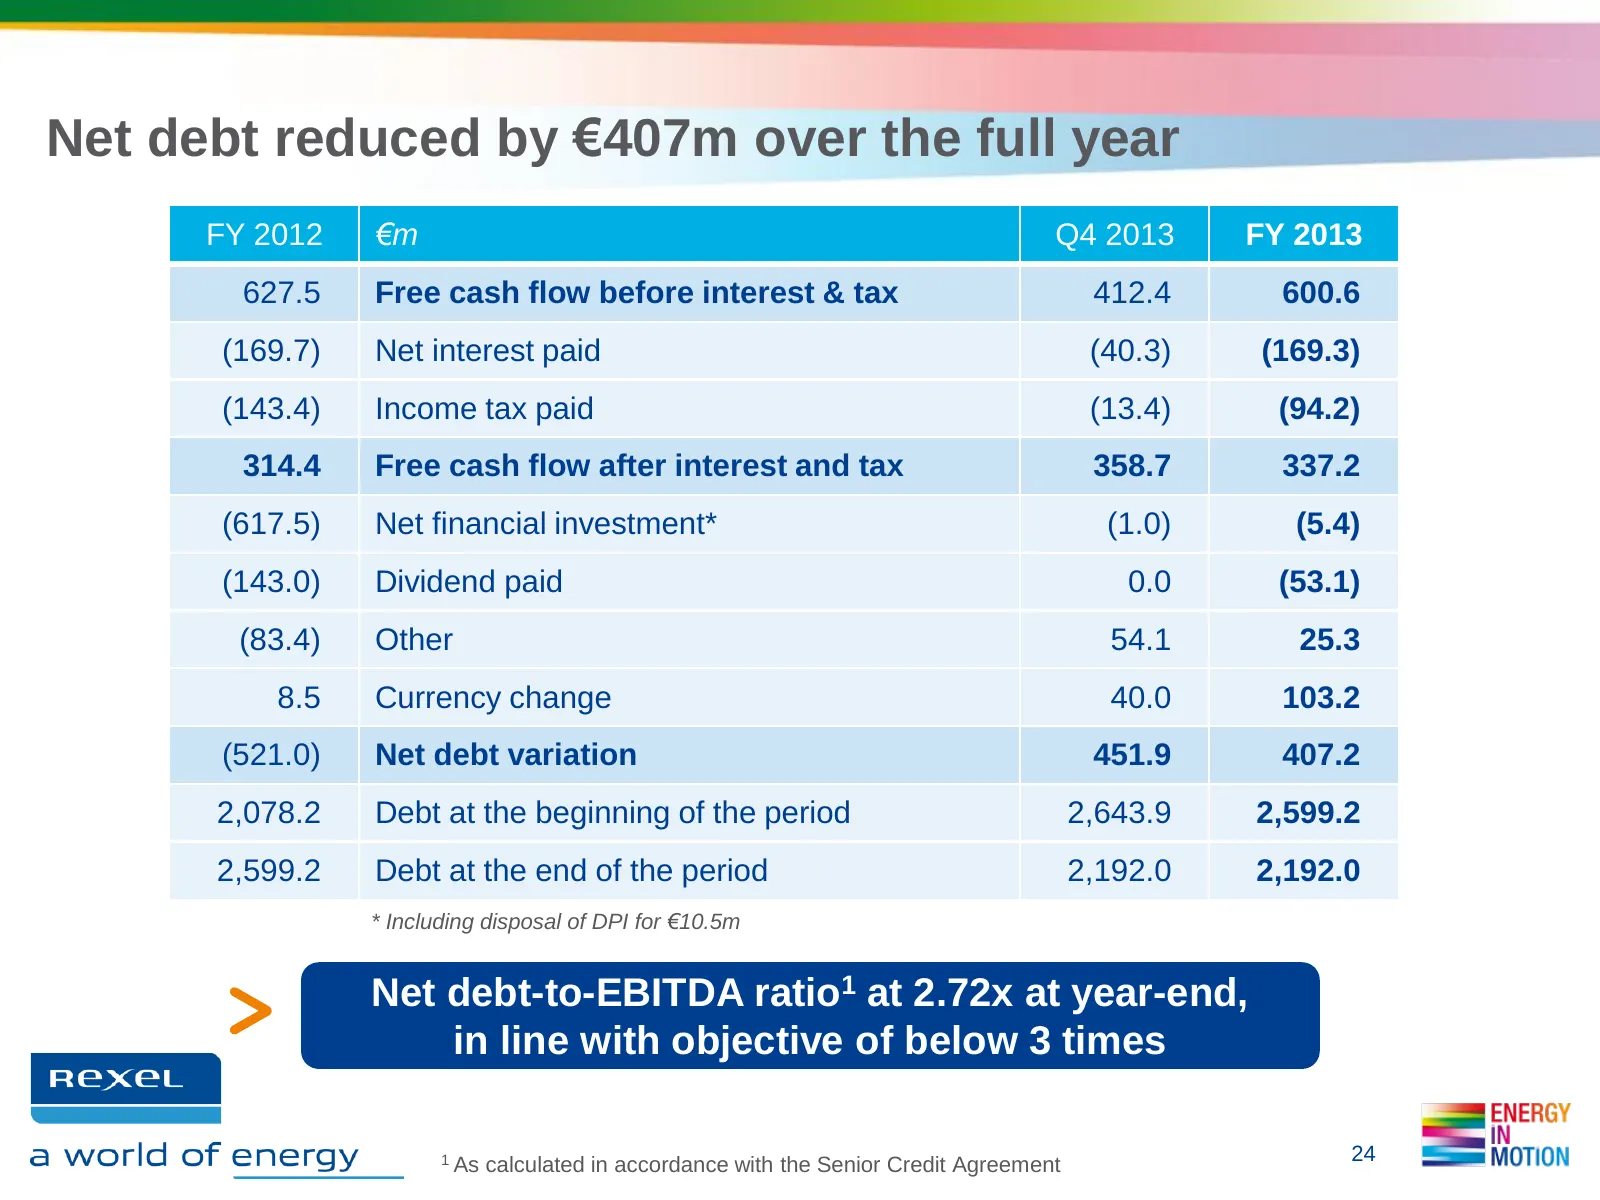
Slide 24: Net debt reduced by €407m over the full year
Net debt reduced by €407m over the full year FY 2012 €m Q4 2013 FY 2013 627.5 Free cash flow before interest & tax 412.4 600.6 (169.7) Net interest paid (40.3) (169.3) (143.4) Income tax paid (13.4) (94.2) 314.4 Free cash flow after interest and tax 358.7 337.2 (617.5) Net financial investment* (1.0
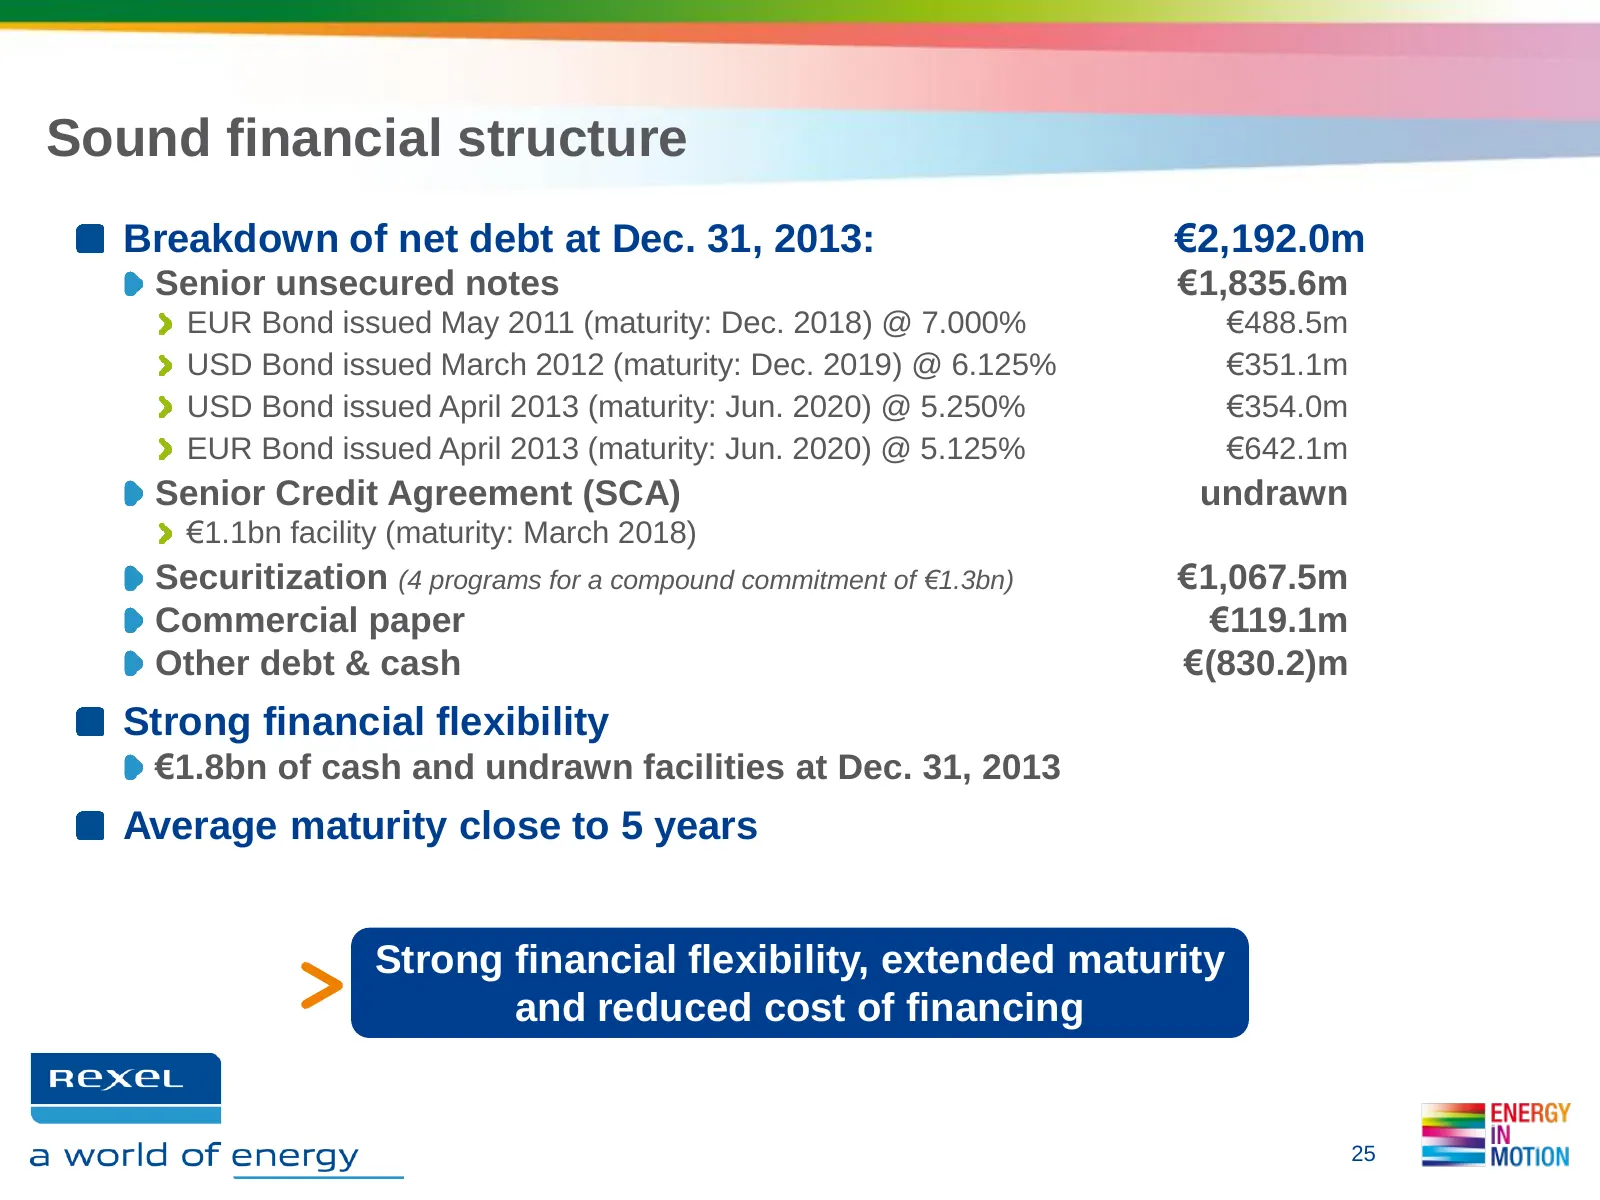
Slide 25: Sound financial structure
Sound financial structure Breakdown of net debt at Dec. 31, 2013: €2,192.0m Senior unsecured notes €1,835.6m EUR Bond issued May 2011 (maturity: Dec. 2018) @ 7.000% €488.5m USD Bond issued March 2012 (maturity: Dec. 2019) @ 6.125% €351.1m USD Bond issued April 2013 (maturity: Jun. 2020) @ 5.250% €35
Slide 26: In 2013, Rexel significantly reduced cost of financing
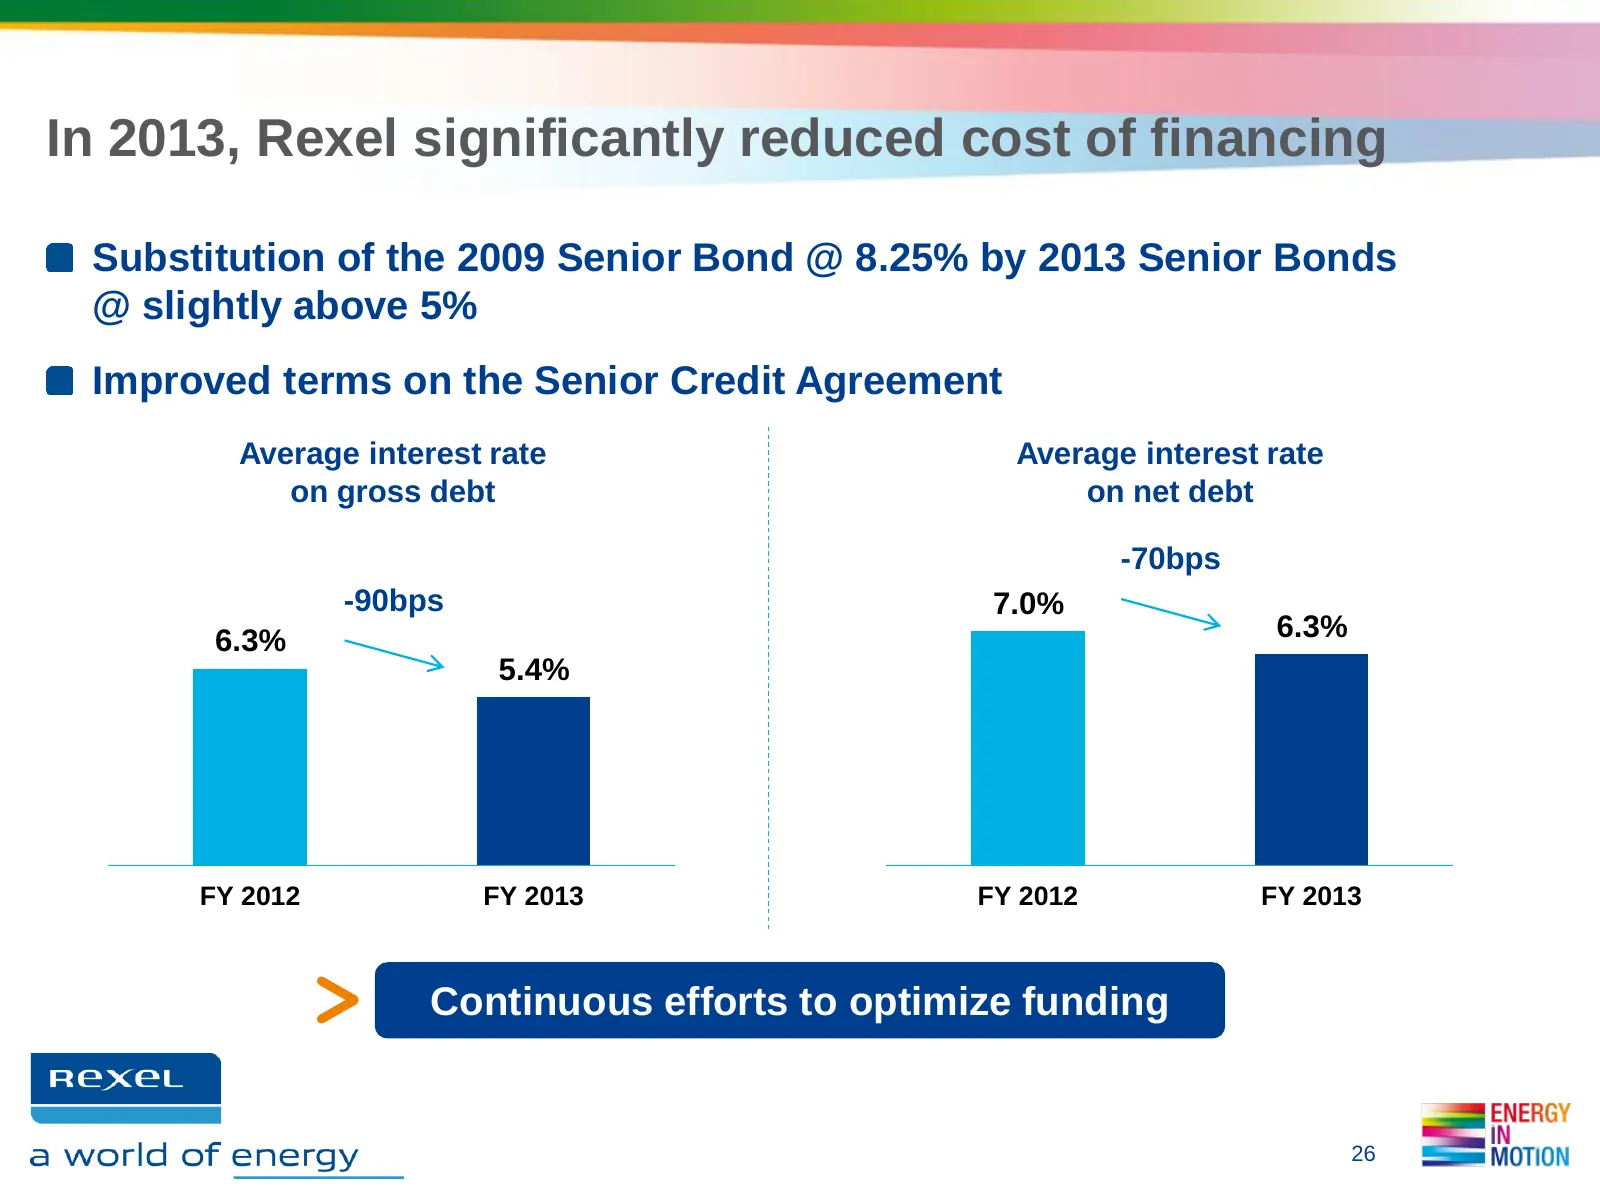
In 2013, Rexel significantly reduced cost of financing Substitution of the 2009 Senior Bond @ 8.25% by 2013 Senior Bonds @ slightly above 5% Improved terms on the Senior Credit Agreement Average interest rate Average interest rate on gross debt on net debt -70bps -90bps 7.0% 6.3% 6.3% 5.4% FY 2012 F
Slide 27: Stable proposed dividend of €0.75 per share
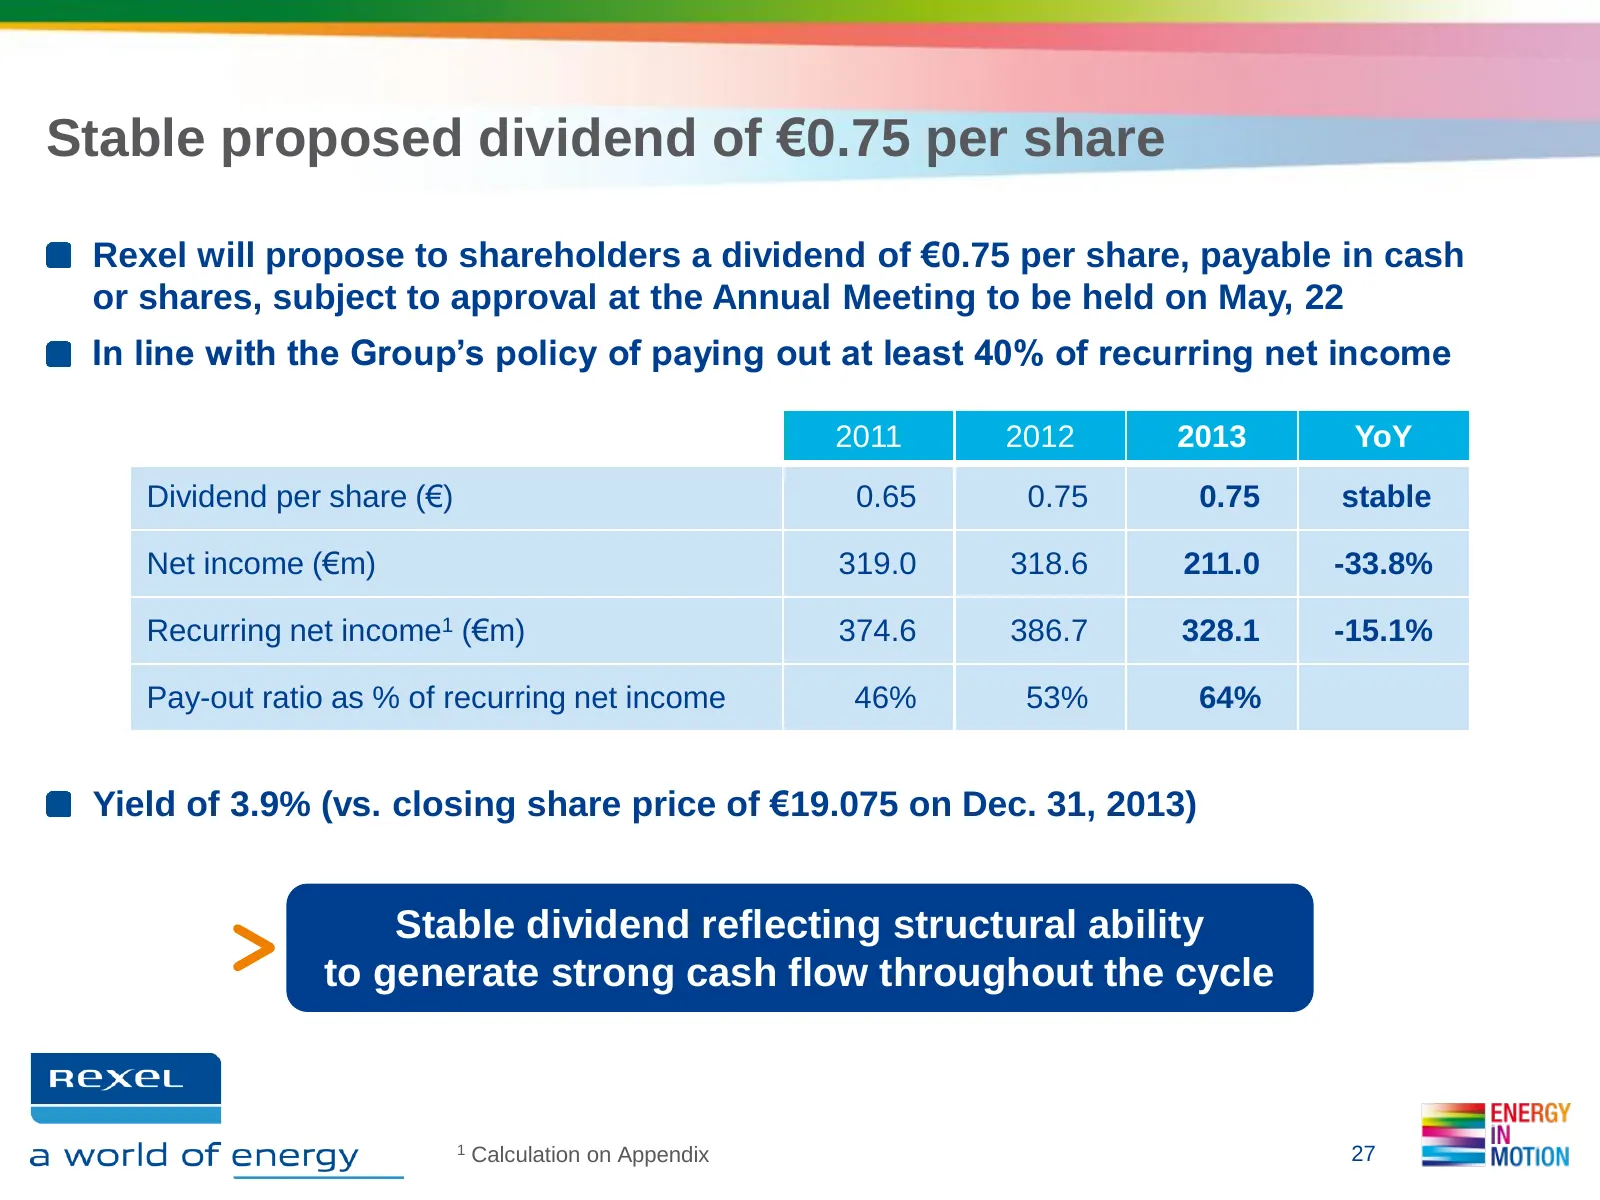
Stable proposed dividend of €0.75 per share Rexel will propose to shareholders a dividend of €0.75 per share, payable in cash or shares, subject to approval at the Annual Meeting to be held on May, 22 In line with the Group’s policy of paying out at least 40% of recurring net income 2011 2012 2013 Y

Slide 28: Outlook
OUTLOOK RexeL as a world of energy ENERGY IN MOTION
Slide 29: 2014 outlook
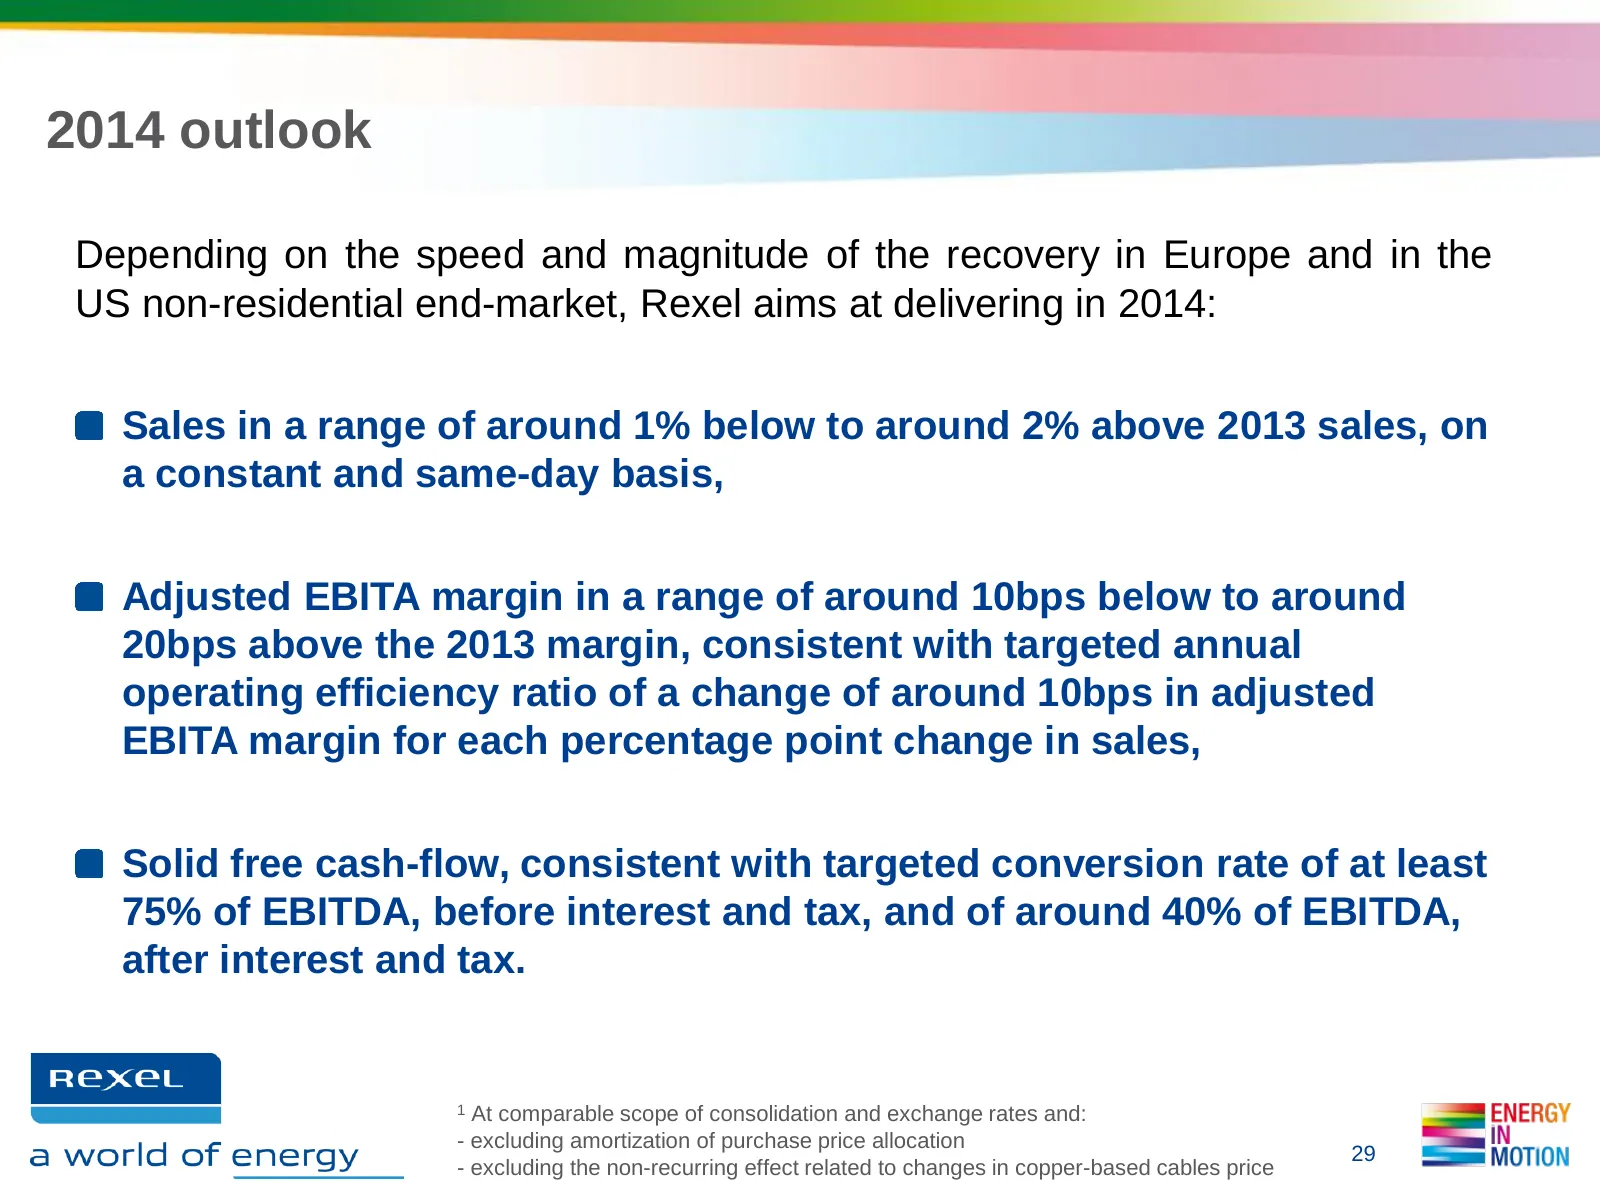
2014 outlook Depending on the speed and magnitude of the recovery in Europe and in the US non-residential end-market, Rexel aims at delivering in 2014: Sales in a range of around 1% below to around 2% above 2013 sales, on a constant and same-day basis, Adjusted EBITA margin in a range of around 10bp
Slide 30: Four business imperatives from the last Investor Day
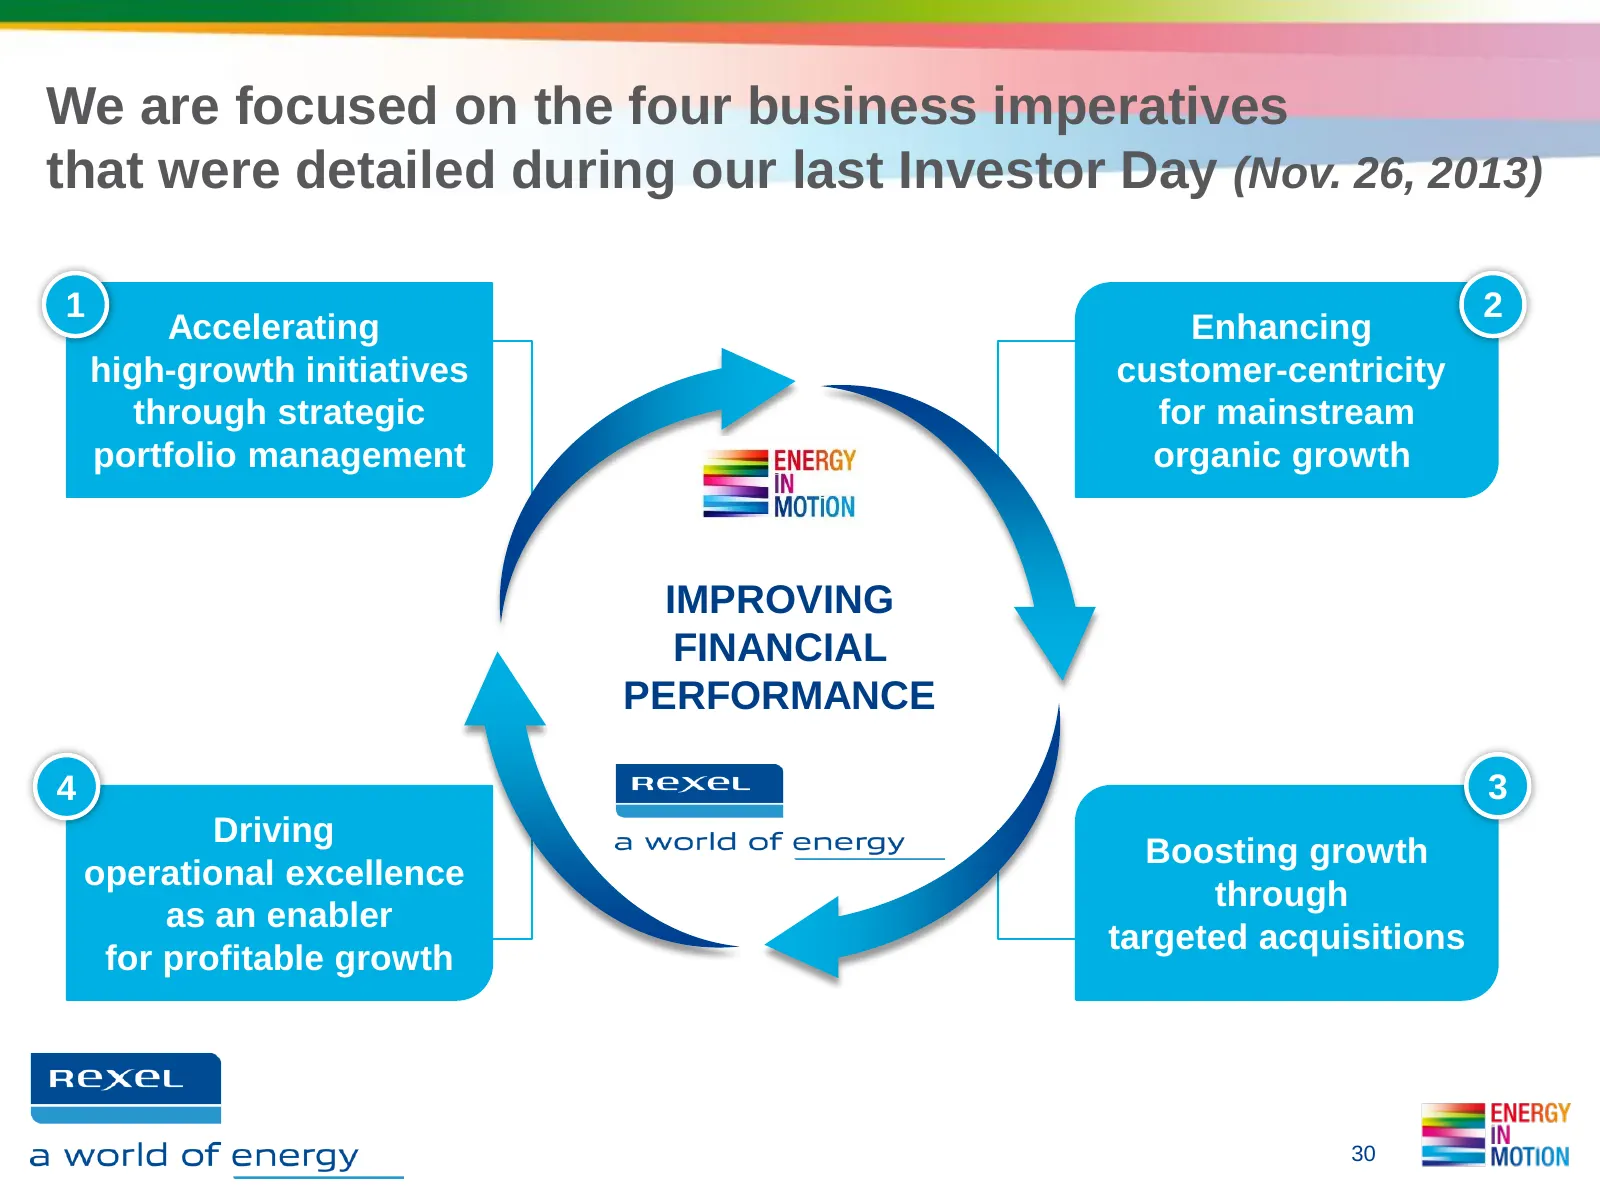
We are focused on the four business imperatives that were detailed during our last Investor Day (Nov. 26, 2013) 1 2 Accelerating Enhancing high-growth initiatives customer-centricity through strategic for mainstream portfolio management organic growth IMPROVING FINANCIAL PERFORMANCE 4 3 Driving Boos
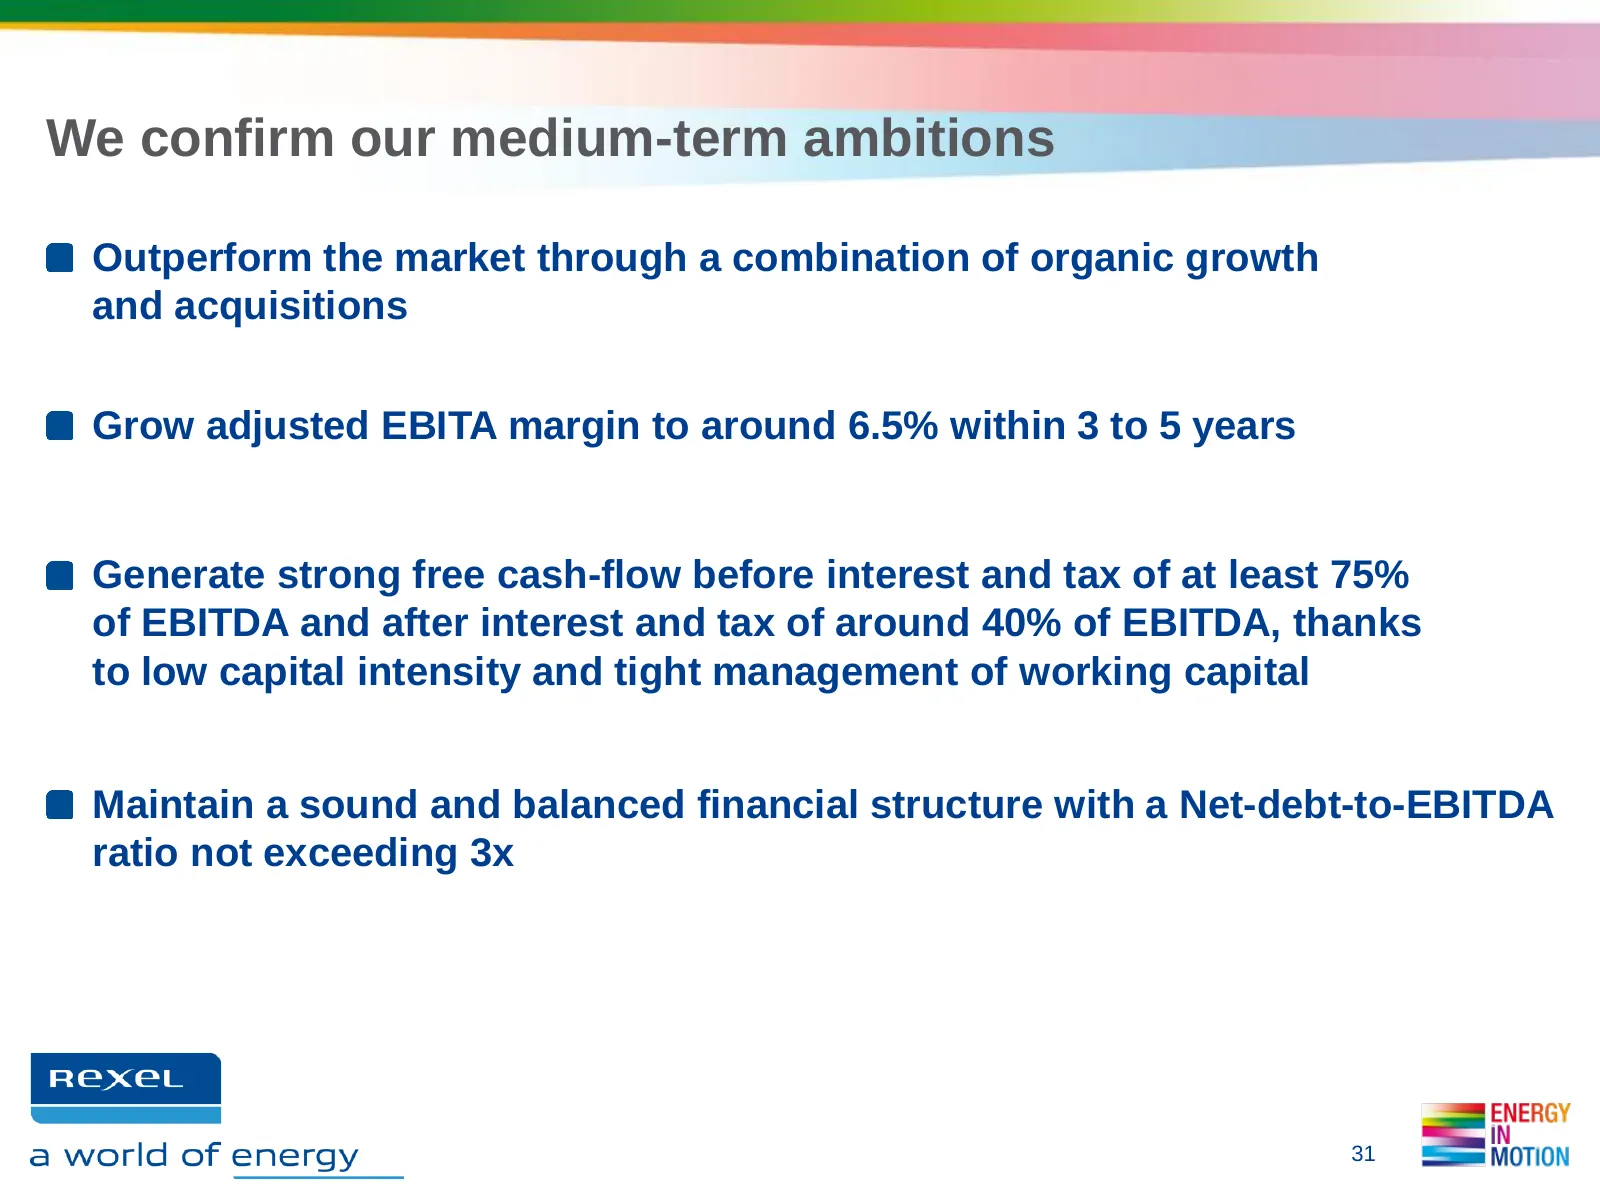
Slide 31: We confirm our medium-term ambitions
We confirm our medium-term ambitions Outperform the market through a combination of organic growth and acquisitions Grow adjusted EBITA margin to around 6.5% within 3 to 5 years Generate strong free cash-flow before interest and tax of at least 75% of EBITDA and after interest and tax of around 40%
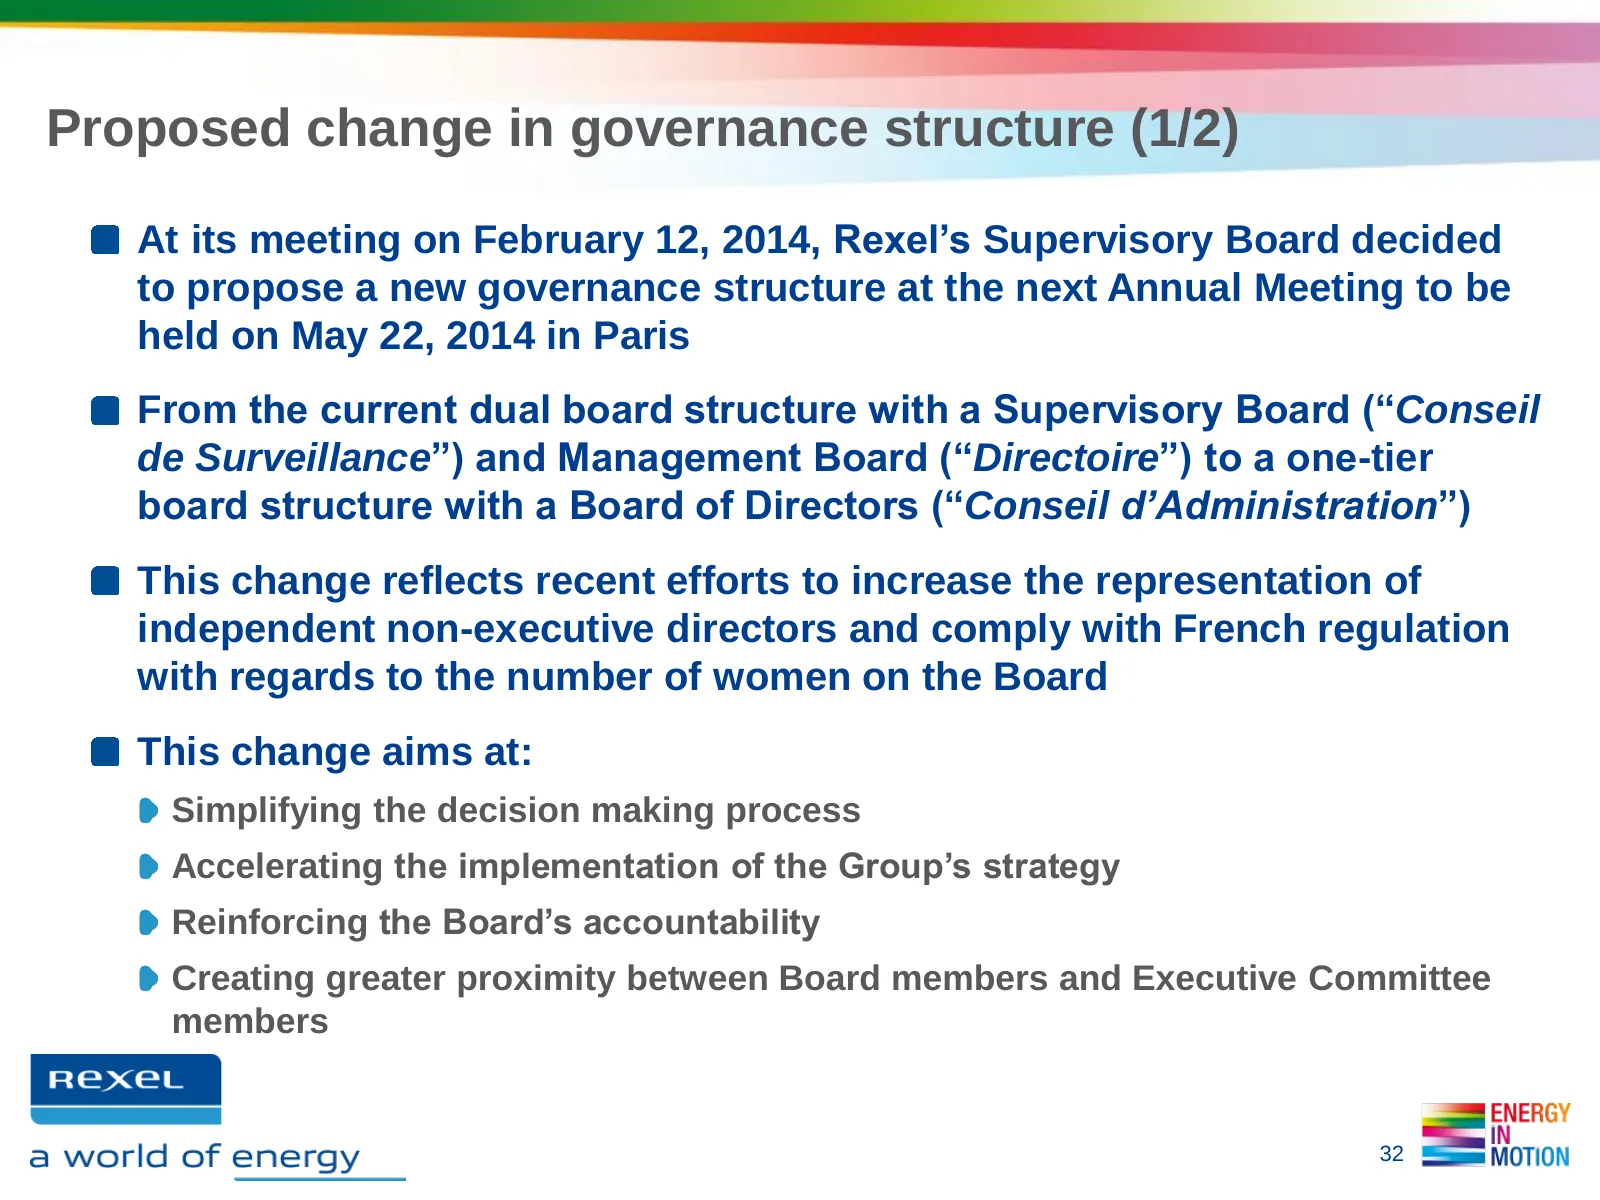
Slide 32: Proposed change in governance structure (1/2)
Proposed change in governance structure (1/2) At its meeting on February 12, 2014, Rexel’s Supervisory Board decided to propose a new governance structure at the next Annual Meeting to be held on May 22, 2014 in Paris From the current dual board structure with a Supervisory Board (“Conseil de Survei
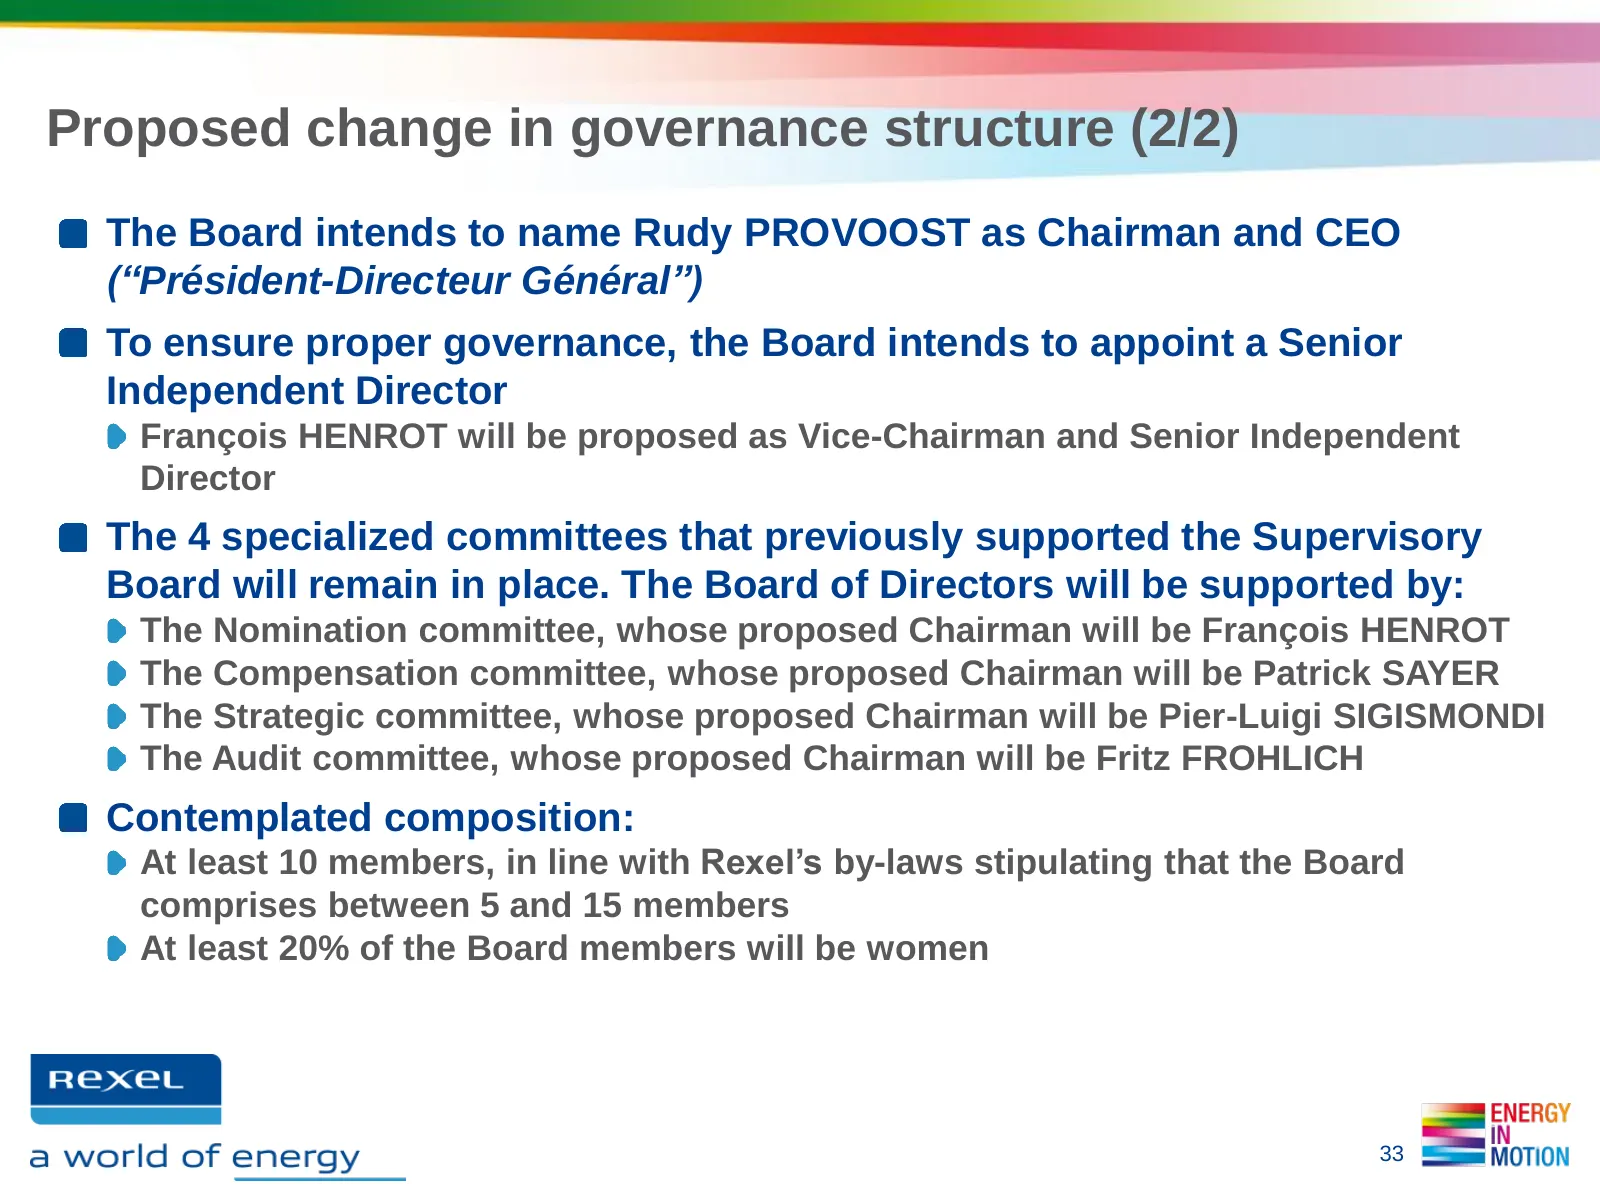
Slide 33: Proposed change in governance structure (2/2)
Proposed change in governance structure (2/2) The Board intends to name Rudy PROVOOST as Chairman and CEO (“Président-Directeur Général”) To ensure proper governance, the Board intends to appoint a Senior Independent Director François HENROT will be proposed as Vice-Chairman and Senior Independent D

Slide 34: Appendices
APPENDICES RexeL as a world of energy
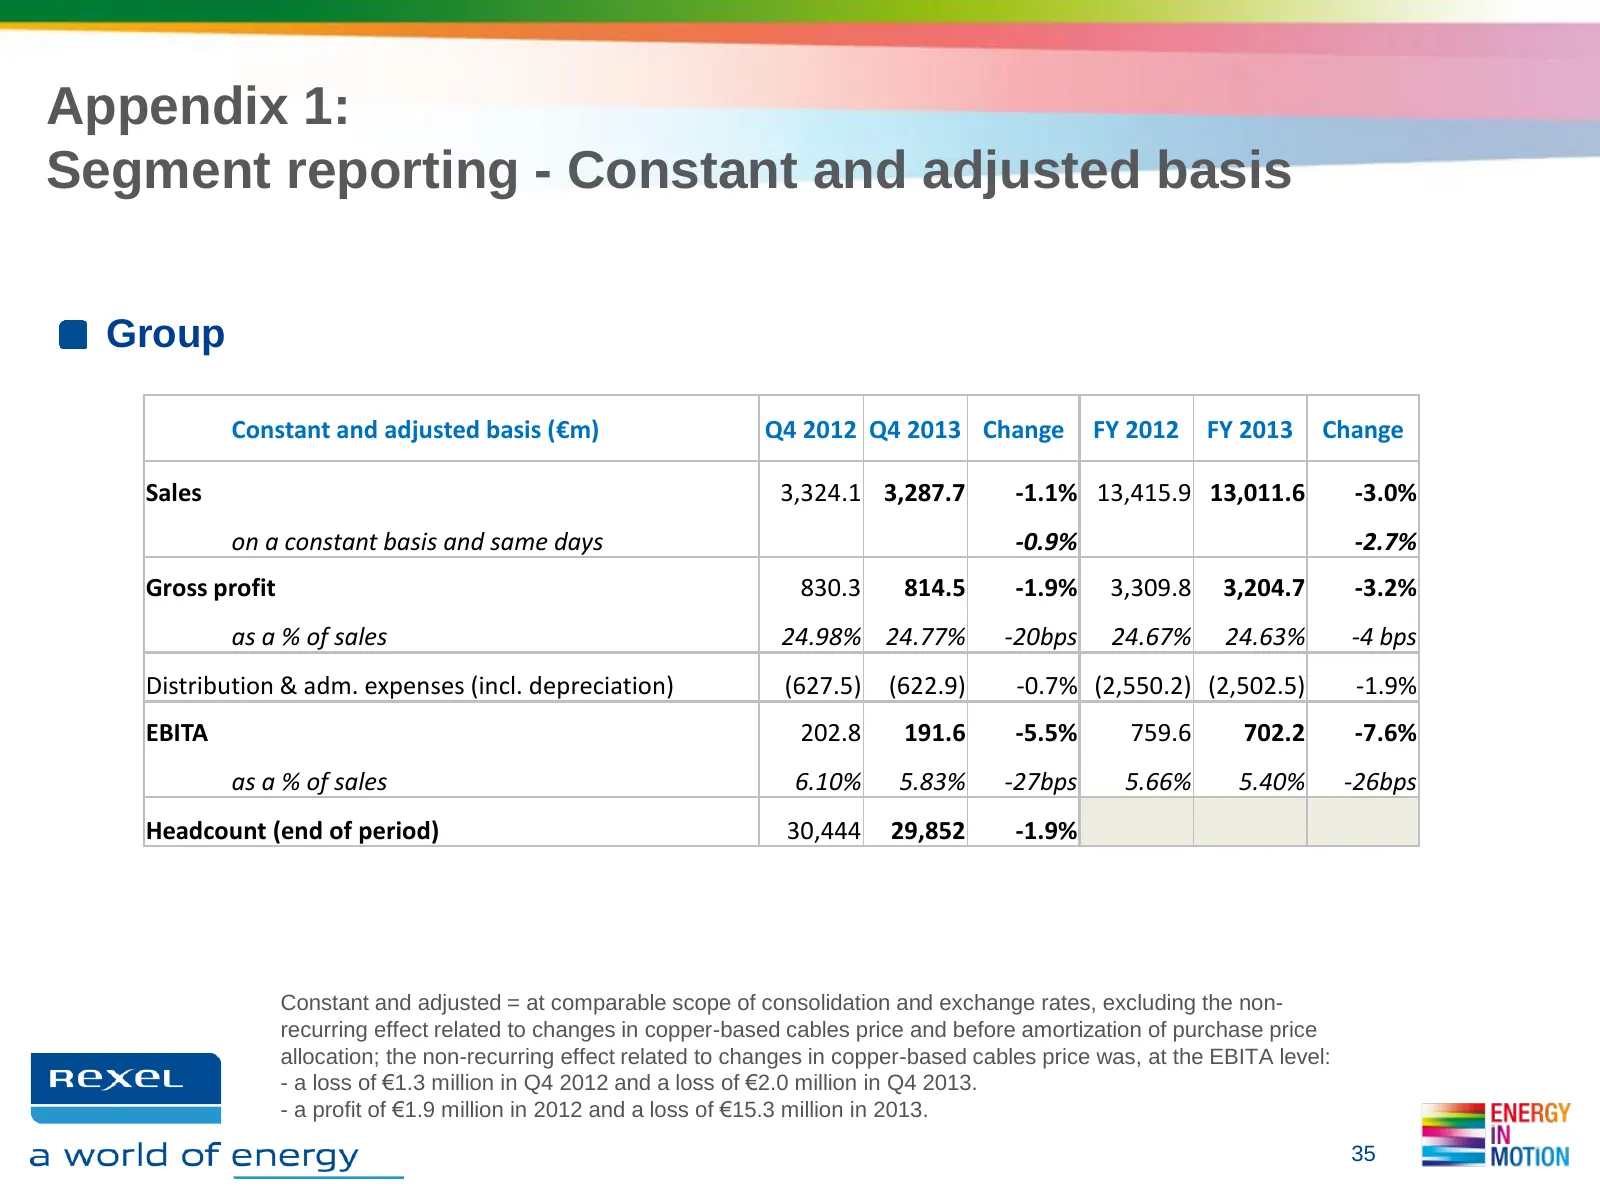
Slide 35: Appendix 1: Segment reporting - Group
Appendix 1: Segment reporting - Constant and adjusted basis Group Constant and adjusted basis (€m) Q4 2012 Q4 2013 Change FY 2012 FY 2013 Change Sales 3,324.1 3,287.7 -1.1% 13,415.9 13,011.6 -3.0% on a constant basis and same days -0.9% -2.7% Gross profit 830.3 814.5 -1.9% 3,309.8 3,204.7 -3.2% as a
Slide 36: Appendix 1: Segment reporting - Europe
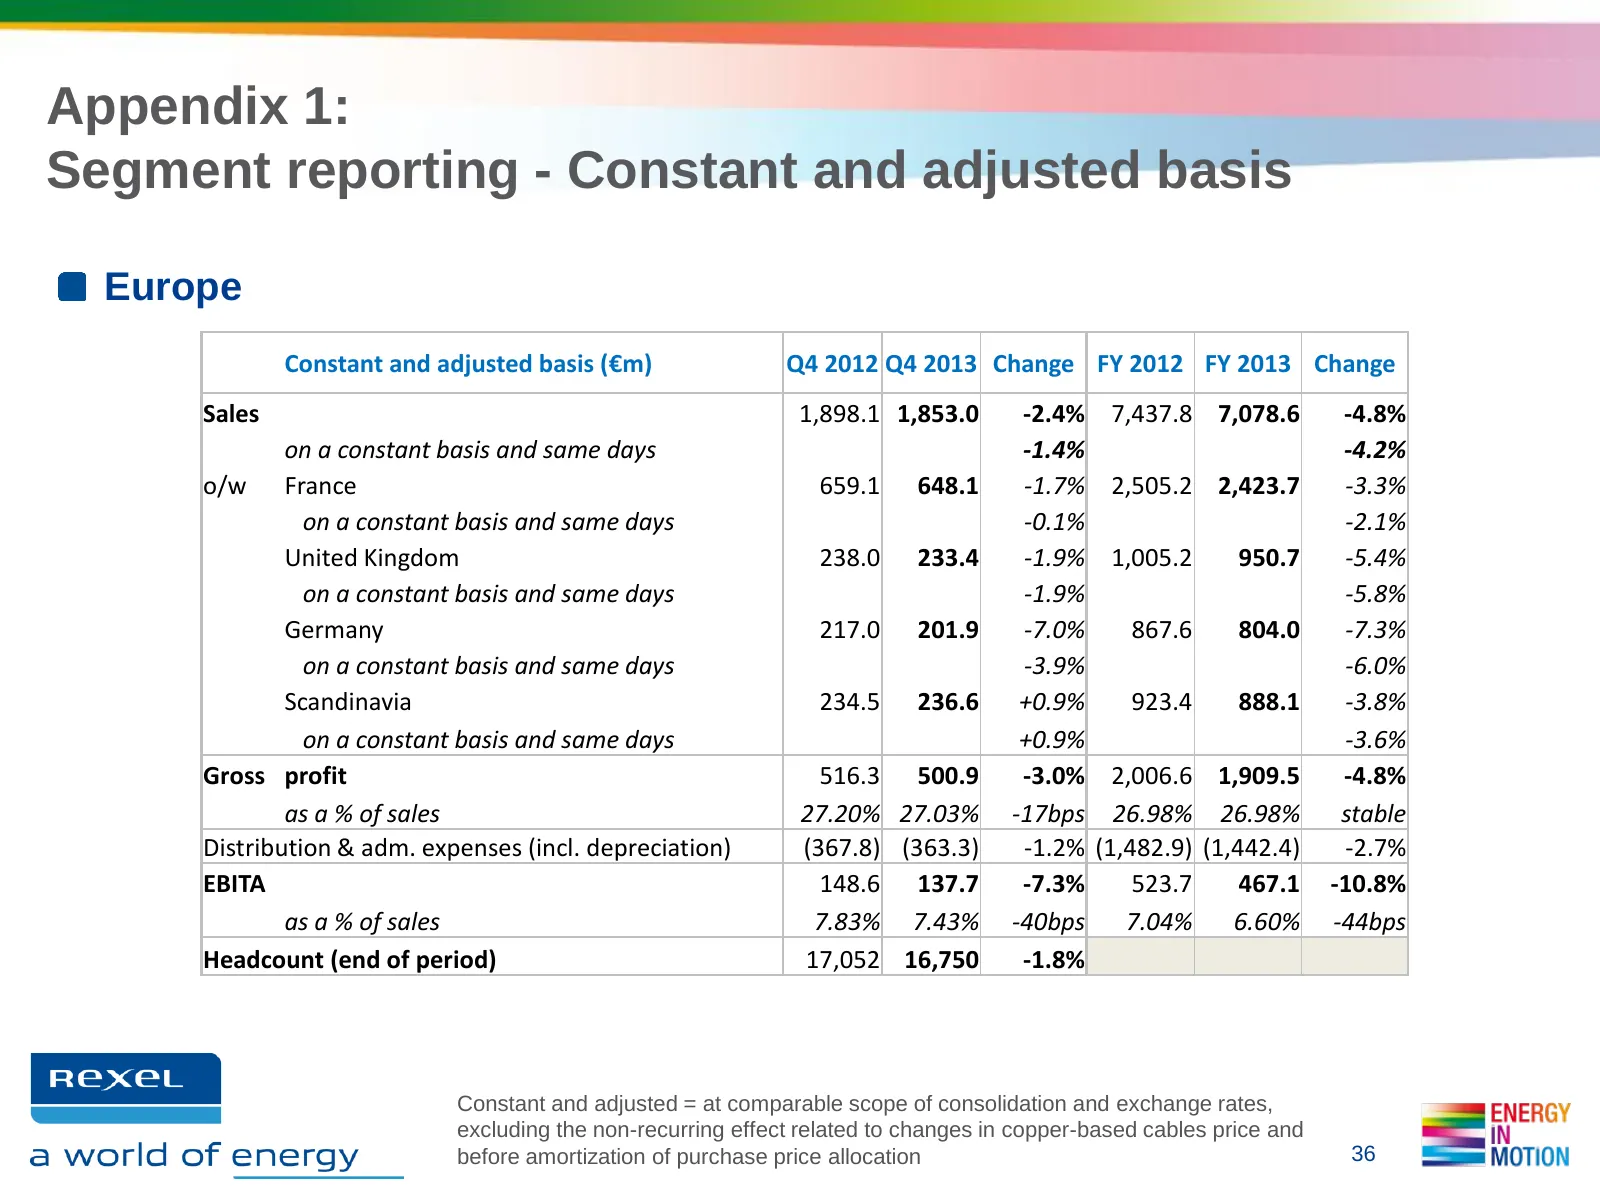
Appendix 1: Segment reporting - Constant and adjusted basis Europe Constant and adjusted basis (€m) Q4 2012 Q4 2013 Change FY 2012 FY 2013 Change Sales 1,898.1 1,853.0 -2.4% 7,437.8 7,078.6 -4.8% on a constant basis and same days -1.4% -4.2% o/w France 659.1 648.1 -1.7% 2,505.2 2,423.7 -3.3% on a co
Slide 37: Appendix 1: Segment reporting - North America
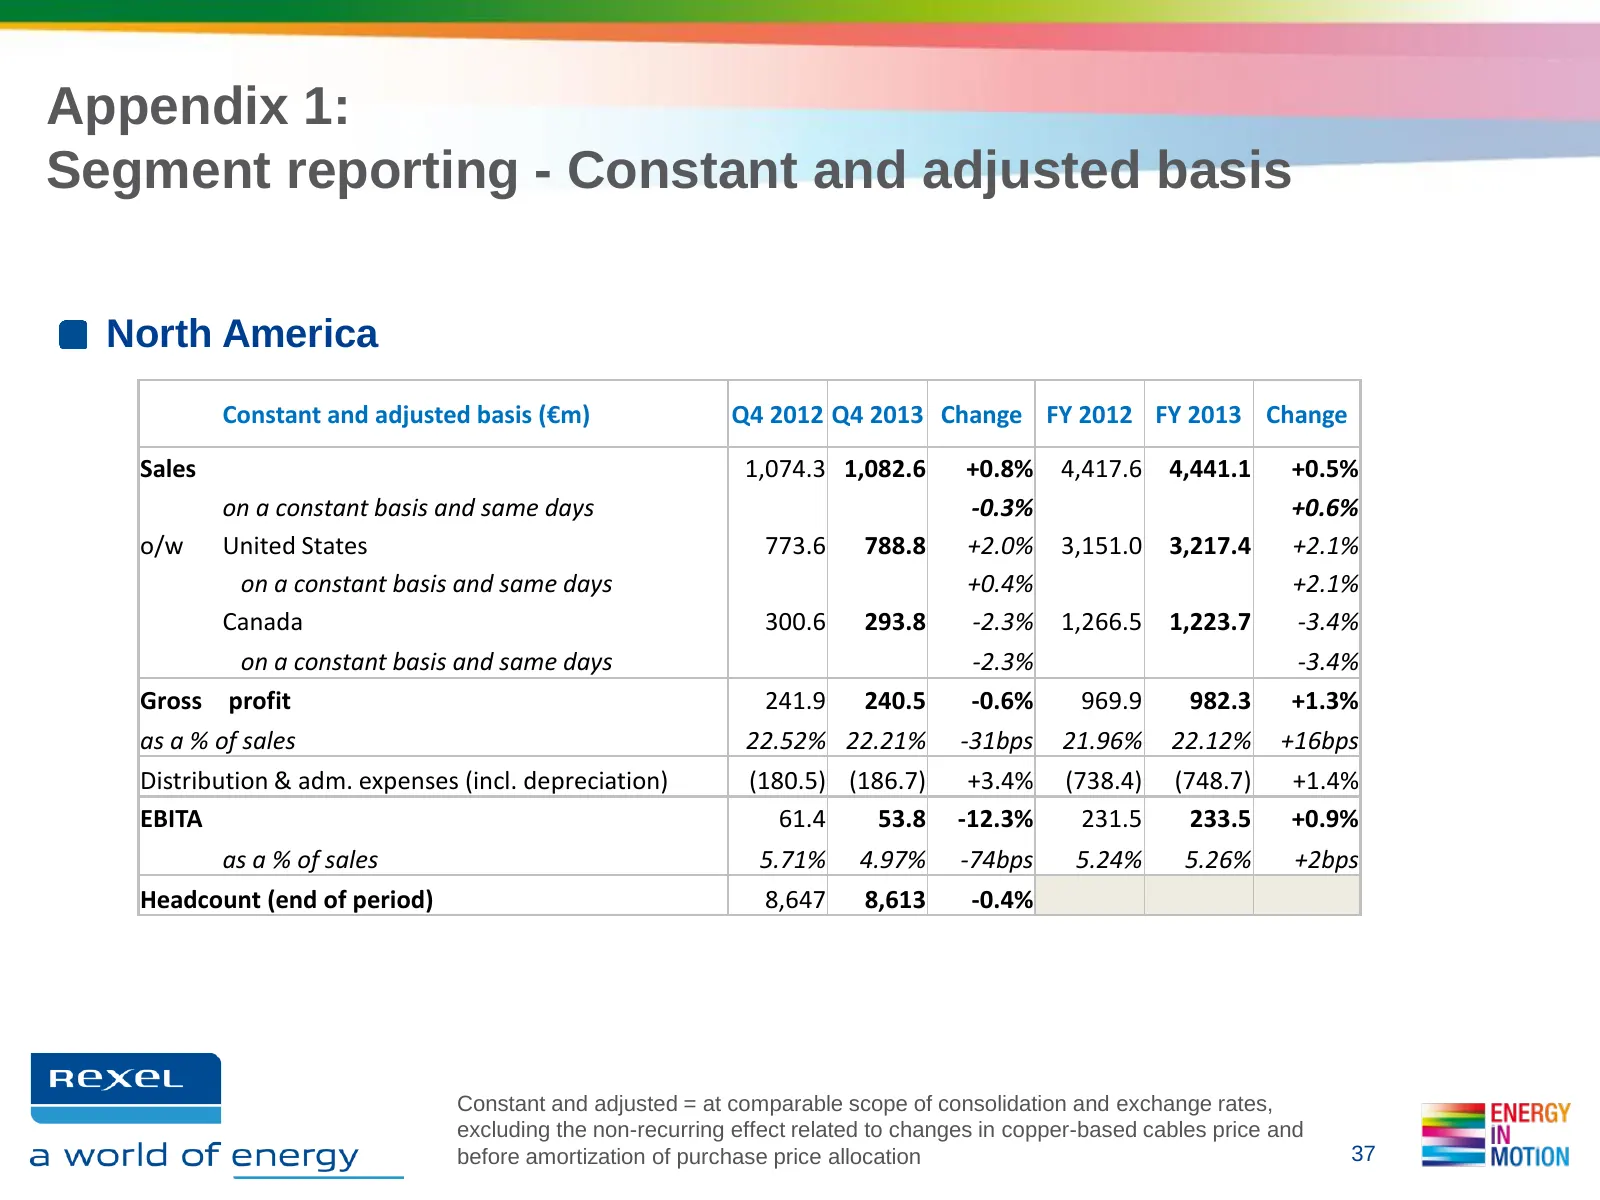
Appendix 1: Segment reporting - Constant and adjusted basis North America Constant and adjusted basis (€m) Q4 2012 Q4 2013 Change FY 2012 FY 2013 Change Sales 1,074.3 1,082.6 +0.8% 4,417.6 4,441.1 +0.5% on a constant basis and same days -0.3% +0.6% o/w United States 773.6 788.8 +2.0% 3,151.0 3,217.4
Slide 38: Appendix 1: Segment reporting - Asia-Pacific
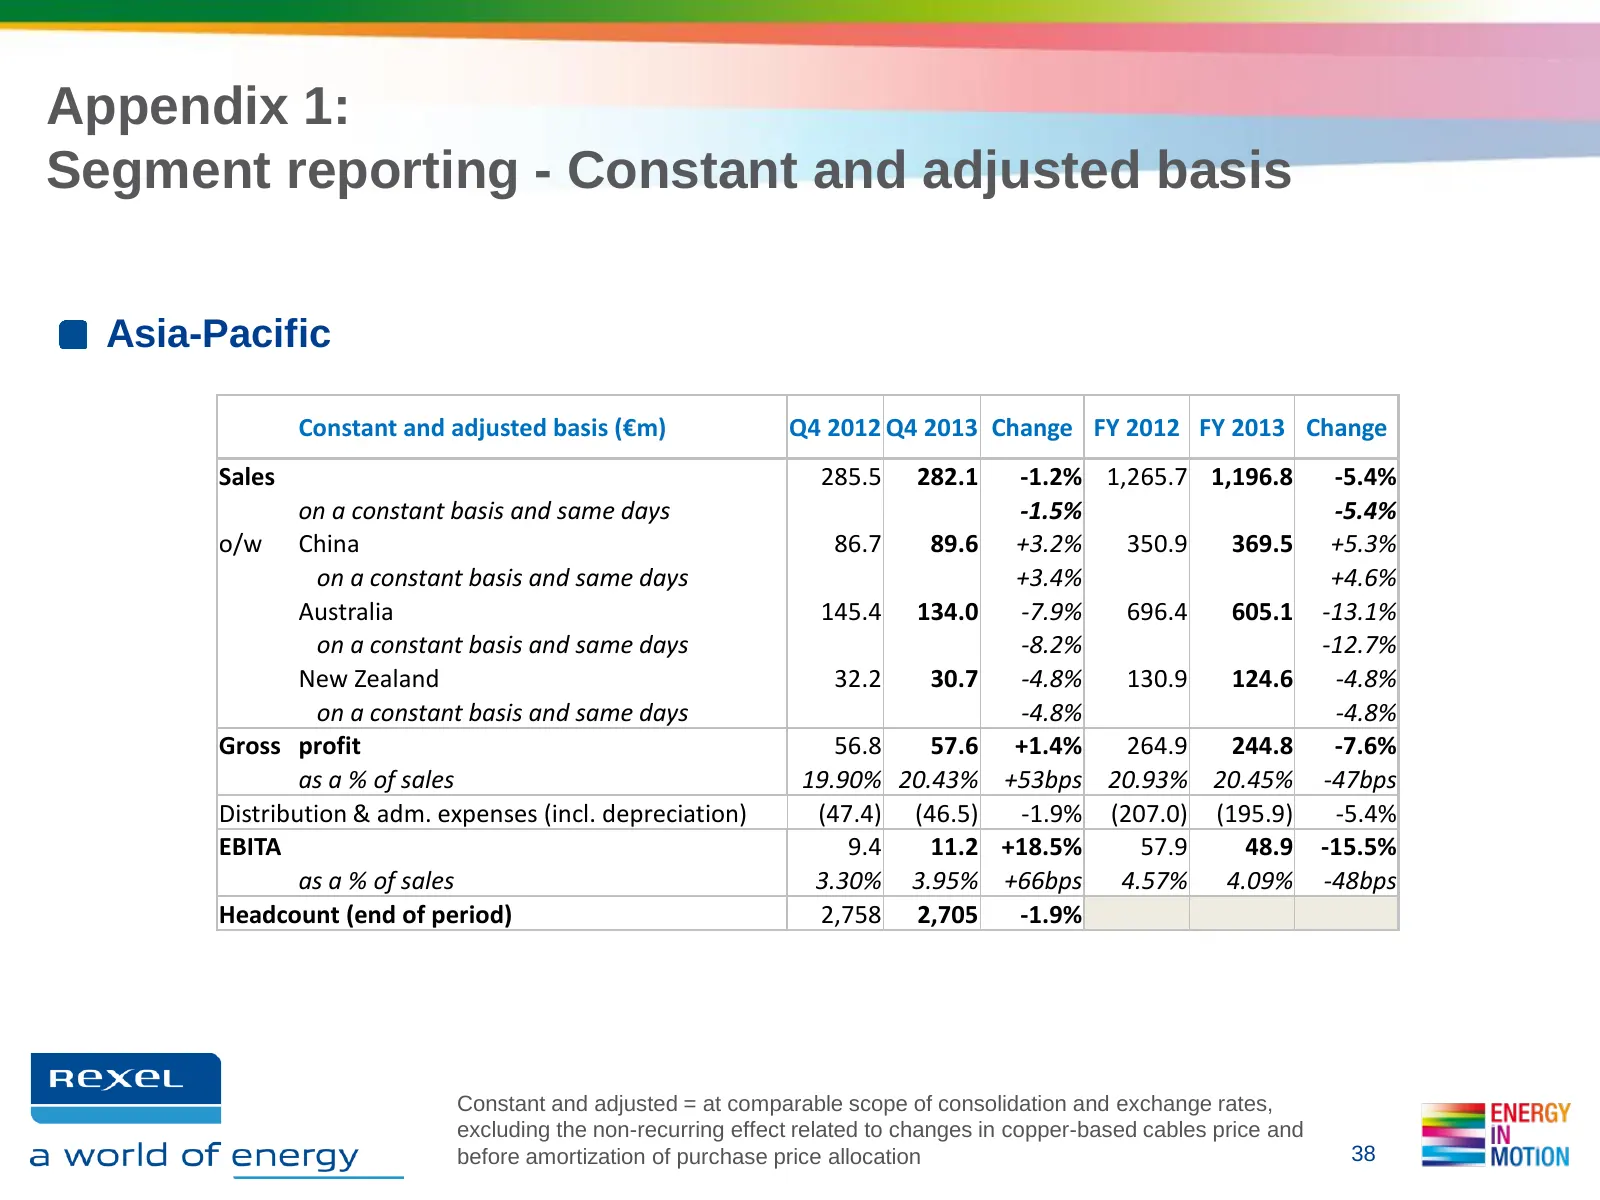
Appendix 1: Segment reporting - Constant and adjusted basis Asia-Pacific Constant and adjusted basis (€m) Q4 2012 Q4 2013 Change FY 2012 FY 2013 Change Sales 285.5 282.1 -1.2% 1,265.7 1,196.8 -5.4% on a constant basis and same days -1.5% -5.4% o/w China 86.7 89.6 +3.2% 350.9 369.5 +5.3% on a constan
Slide 39: Appendix 1: Segment reporting - Latin America
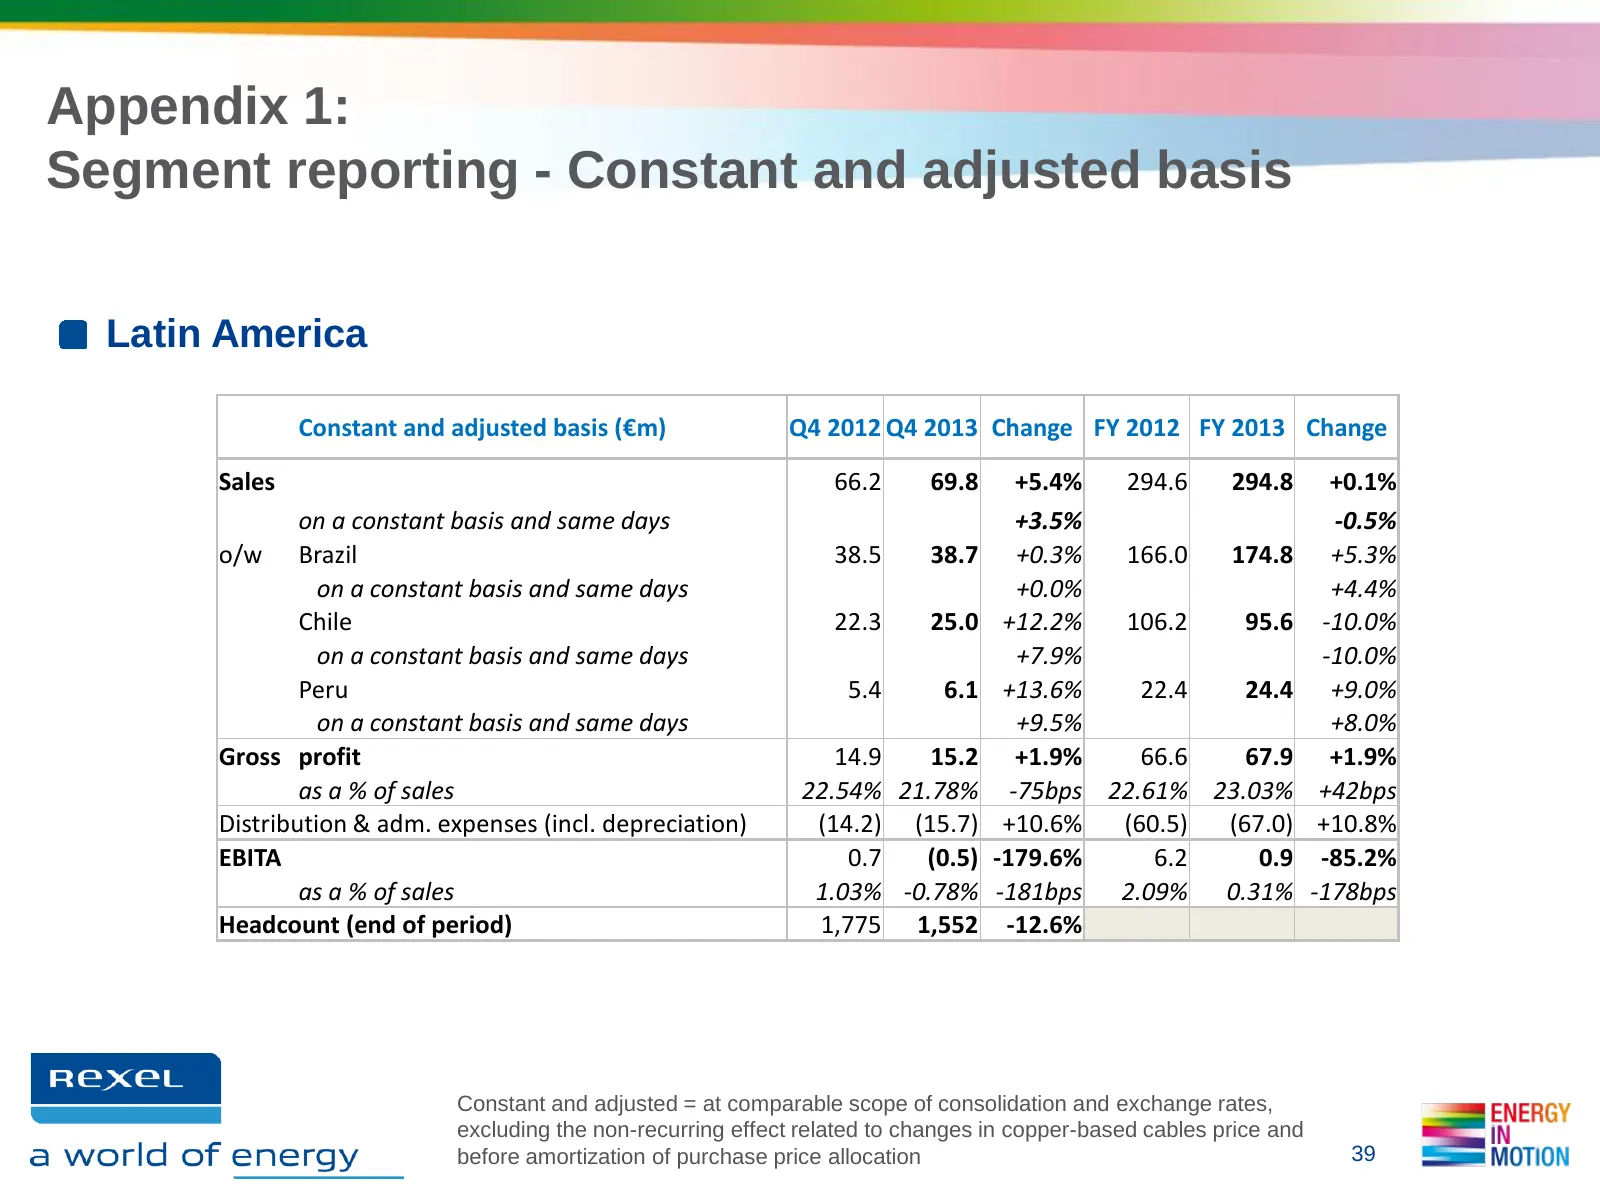
Appendix 1: Segment reporting - Constant and adjusted basis Latin America Constant and adjusted basis (€m) Q4 2012 Q4 2013 Change FY 2012 FY 2013 Change Sales 66.2 69.8+5.4% 294.6 294.8 +0.1% on a constant basis and same days +3.5% -0.5% o/w Brazil 38.5 38.7 +0.3% 166.0 174.8 +5.3% on a constant bas
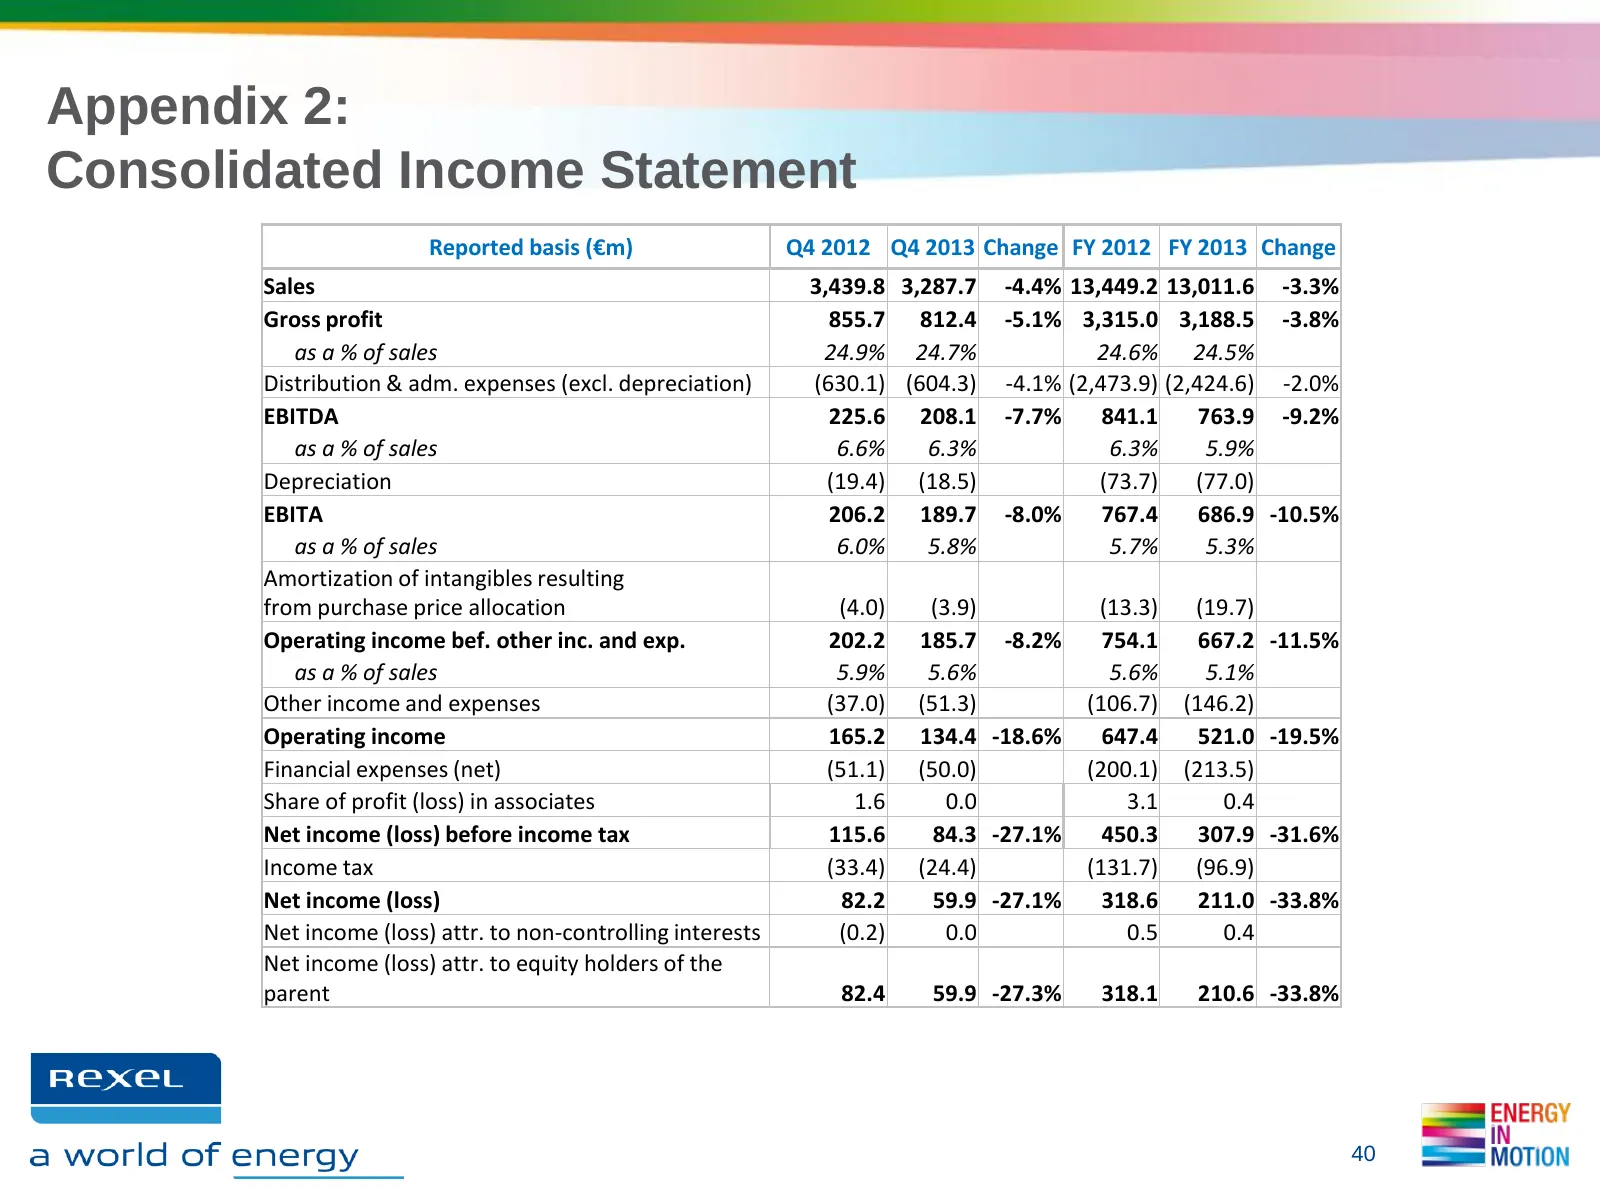
Slide 40: Appendix 2: Consolidated Income Statement
Appendix 2: Consolidated Income Statement Reported basis (€m) Q4 2012 Q4 2013 Change FY 2012 FY 2013 Change Sales 3,439.8 3,287.7 -4.4% 13,449.2 13,011.6 -3.3% Gross profit 855.7 812.4 -5.1% 3,315.0 3,188.5 -3.8% as a % of sales 24.9% 24.7% 24.6% 24.5% Distribution & adm. expenses (excl. depreciatio
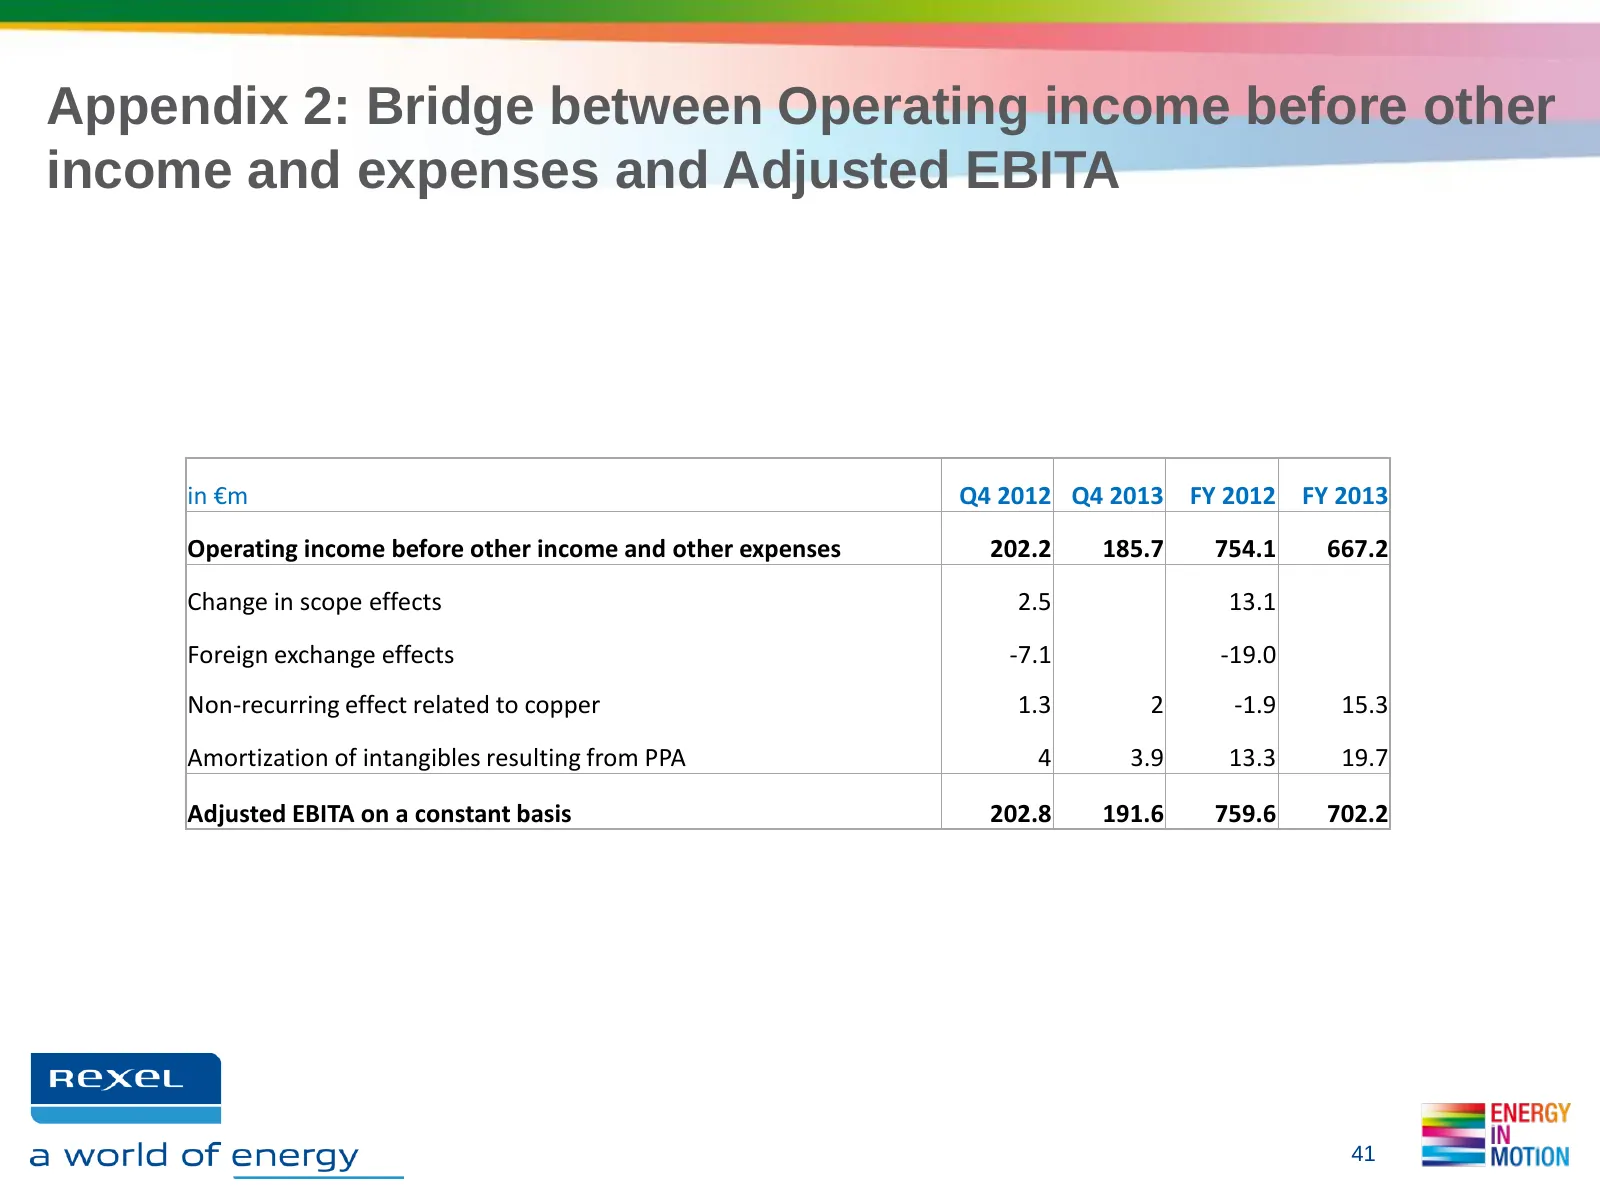
Slide 41: Appendix 2: Bridge between operating income and Adjusted EBITA
Appendix 2: Bridge between Operating income before other income and expenses and Adjusted EBITA in €m Q4 2012 Q4 2013 FY 2012 FY 2013 Operating income before other income and other expenses 202.2 185.7 754.1 667.2 Change in scope effects 2.5 13.1 Foreign exchange effects -7.1 -19.0 Non-recurring eff
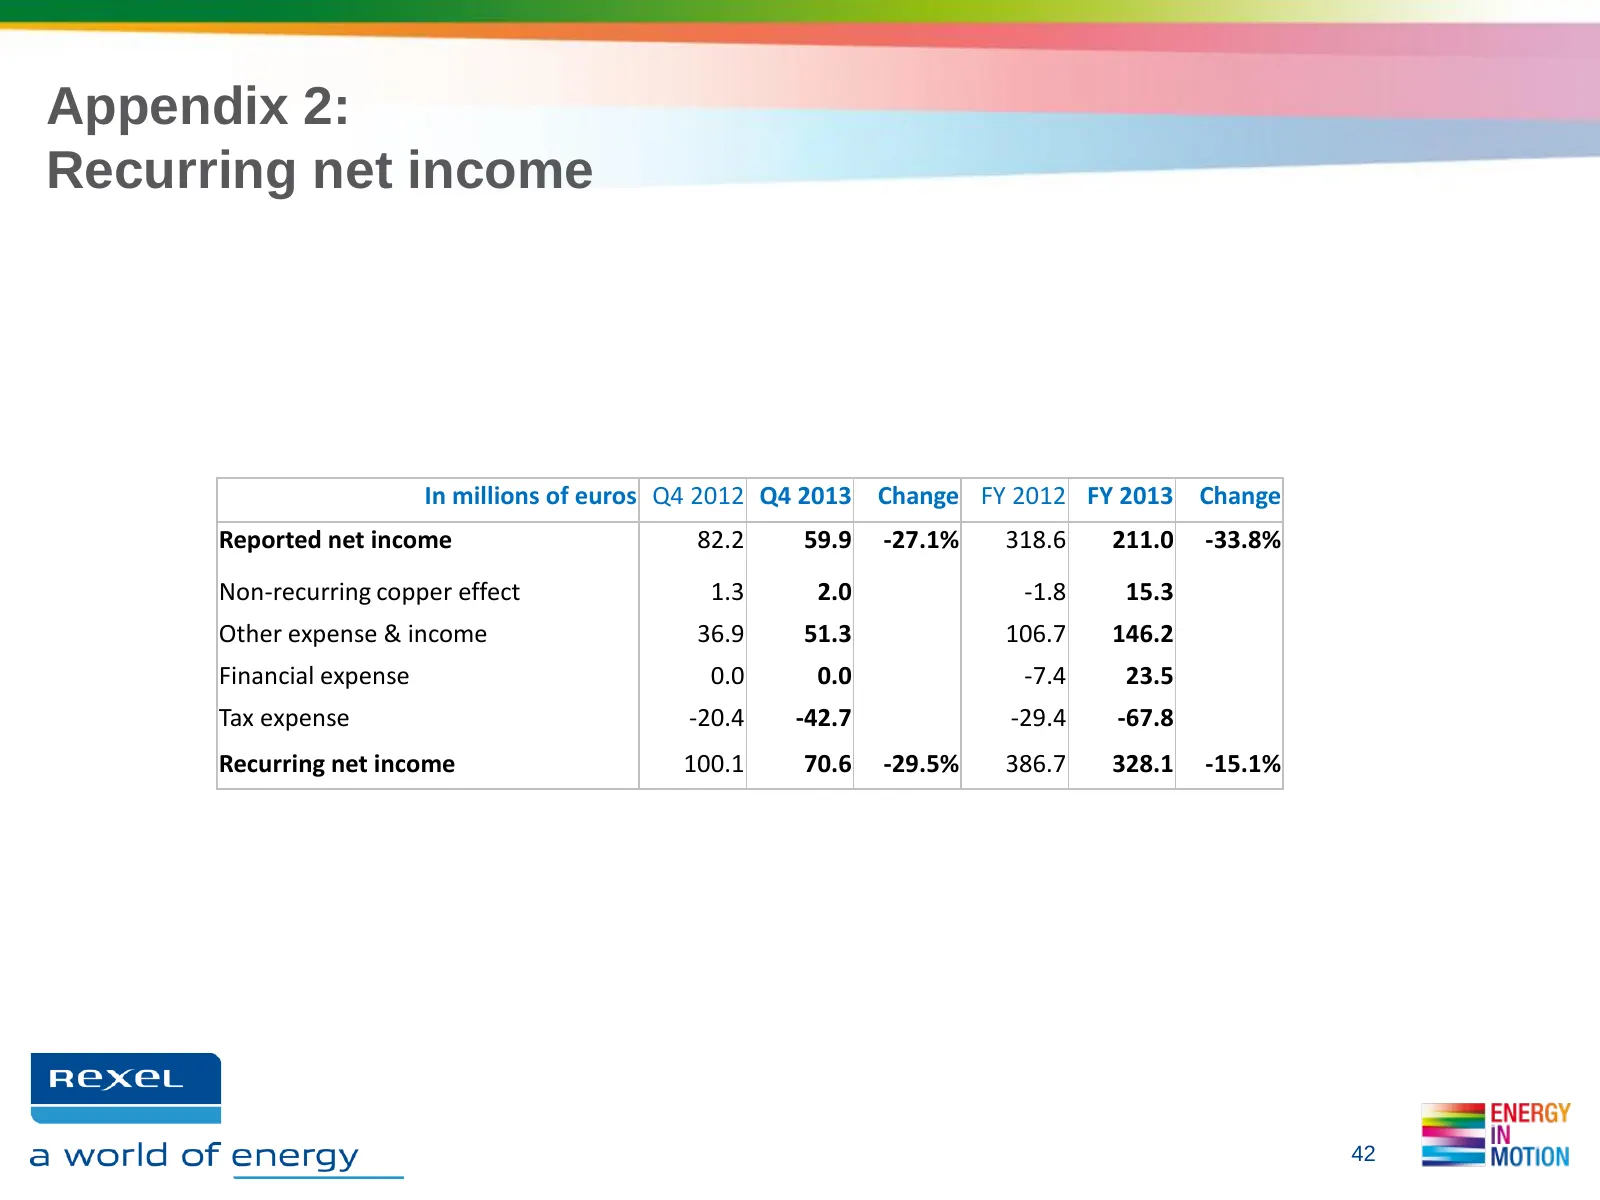
Slide 42: Appendix 2: Recurring net income
Appendix 2: Recurring net income In millions of euros Q4 2012 Q4 2013 Change FY 2012 FY 2013 Change Reported net income 82.2 59.9 -27.1% 318.6 211.0 -33.8% Non-recurring copper effect 1.3 2.0 -1.8 15.3 Other expense & income 36.9 51.3 106.7 146.2 Financial expense 0.0 0.0 -7.4 23.5 Tax expense -20.4
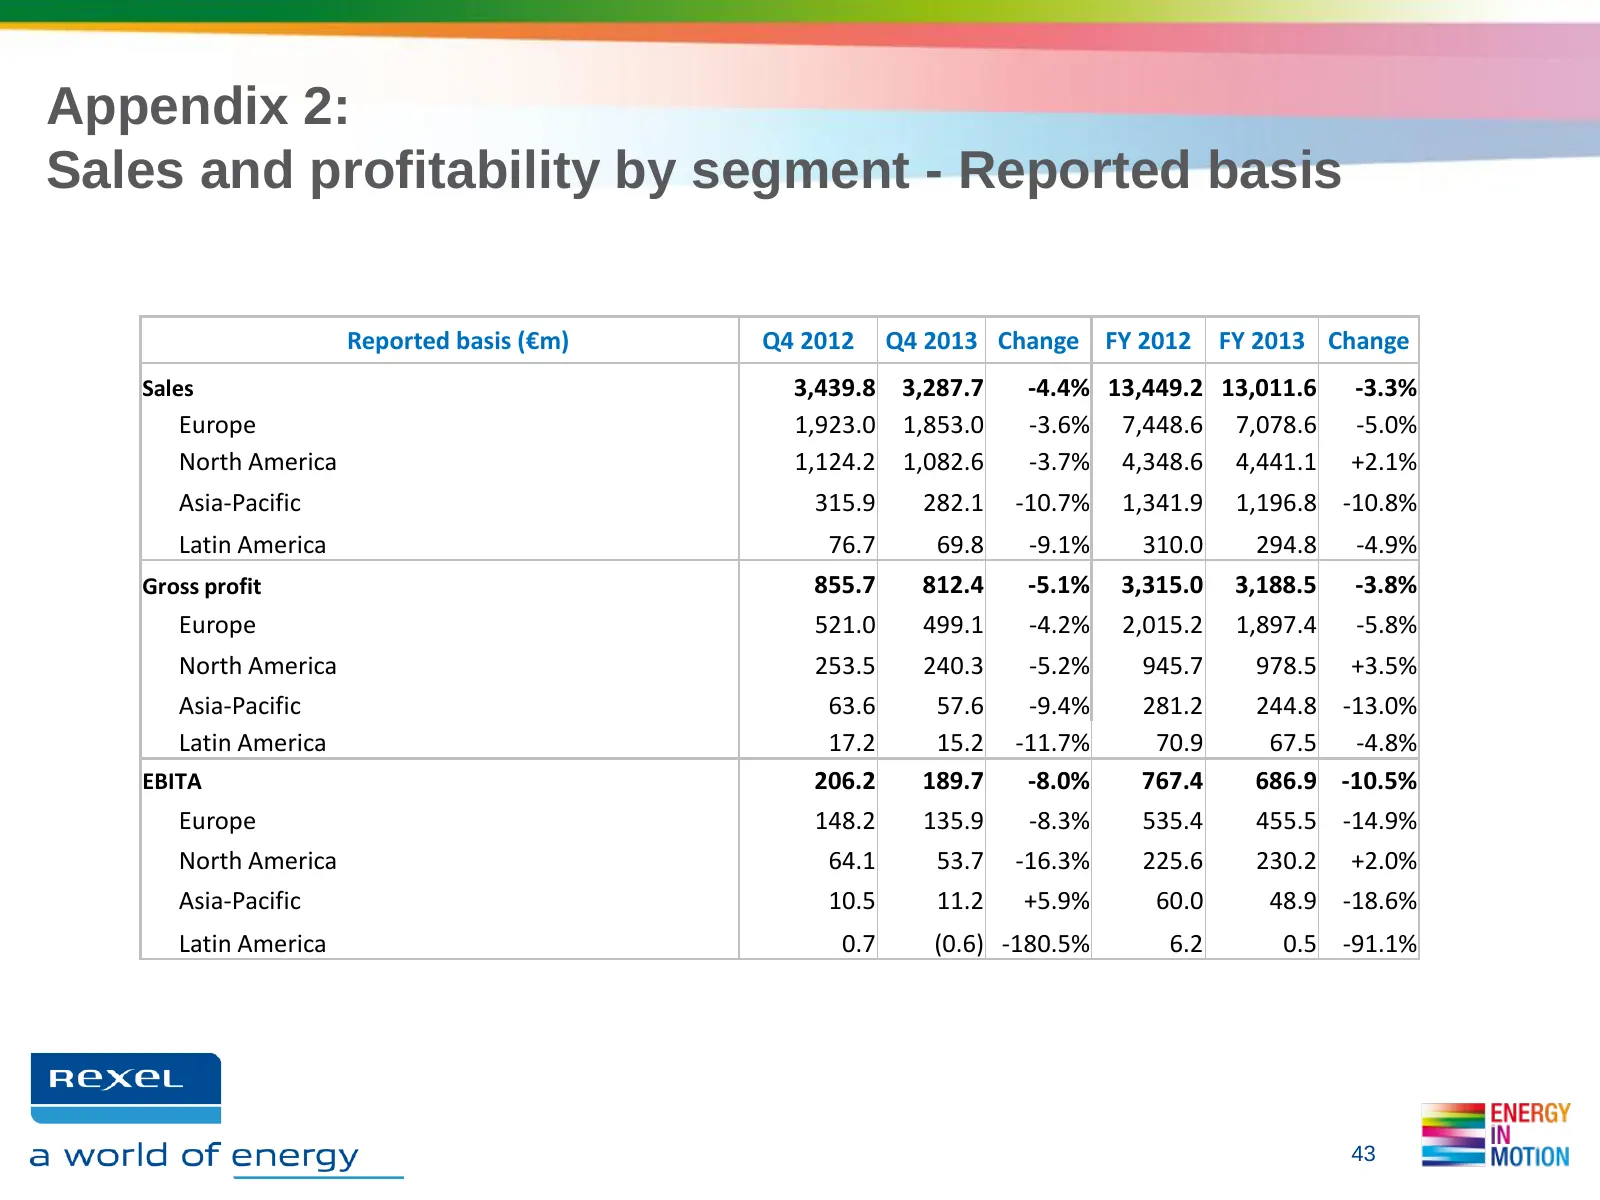
Slide 43: Appendix 2: Sales and profitability by segment - Reported basis
Appendix 2: Sales and profitability by segment - Reported basis Reported basis (€m) Q4 2012 Q4 2013 Change FY 2012 FY 2013 Change Sales 3,439.8 3,287.7 -4.4% 13,449.2 13,011.6 -3.3% Europe 1,923.0 1,853.0 -3.6% 7,448.6 7,078.6 -5.0% North America 1,124.2 1,082.6 -3.7% 4,348.6 4,441.1 +2.1% Asia-Paci
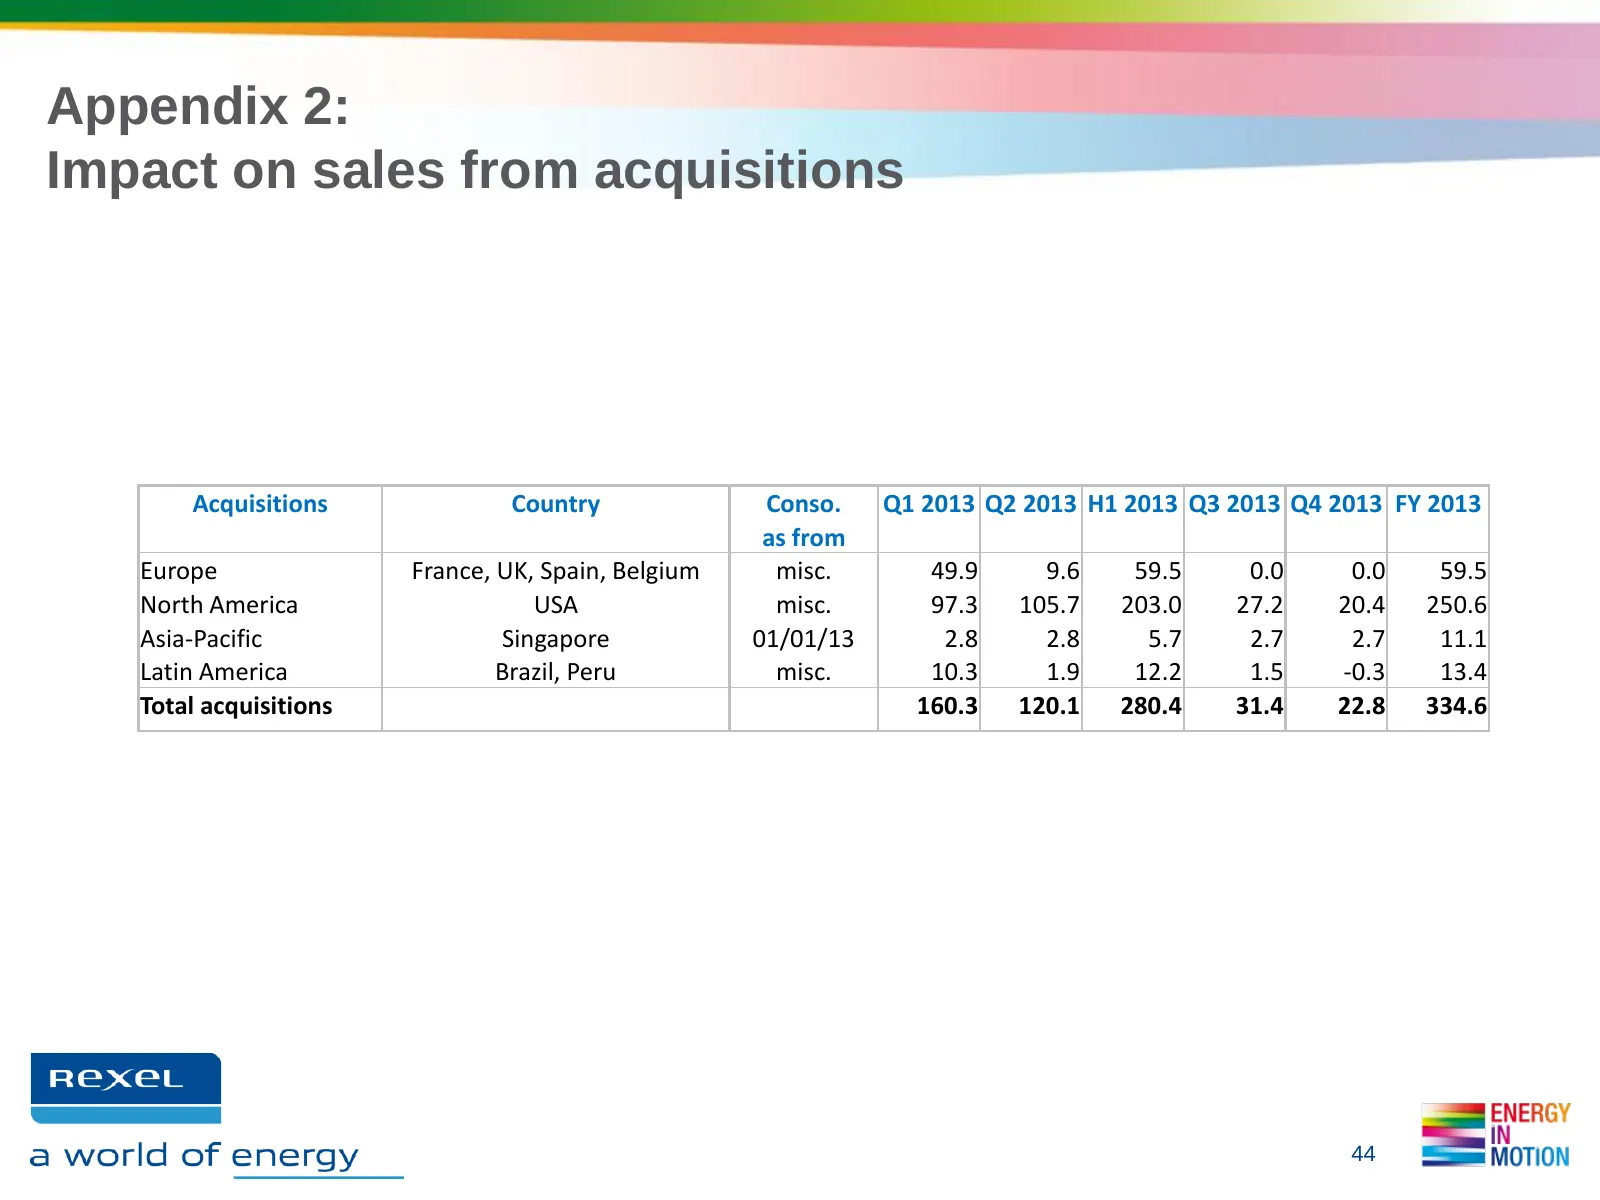
Slide 44: Appendix 2: Impact on sales from acquisitions
Appendix 2: Impact on sales from acquisitions Acquisitions Country Conso. Q1 2013 Q2 2013 H1 2013 Q3 2013 Q4 2013 FY 2013 as from Europe France, UK, Spain, Belgium misc. 49.9 9.6 59.5 0.0 0.0 59.5 North America USA misc. 97.3 105.7 203.0 27.2 20.4 250.6 Asia-Pacific Singapore 01/01/13 2.8 2.8 5.7 2.
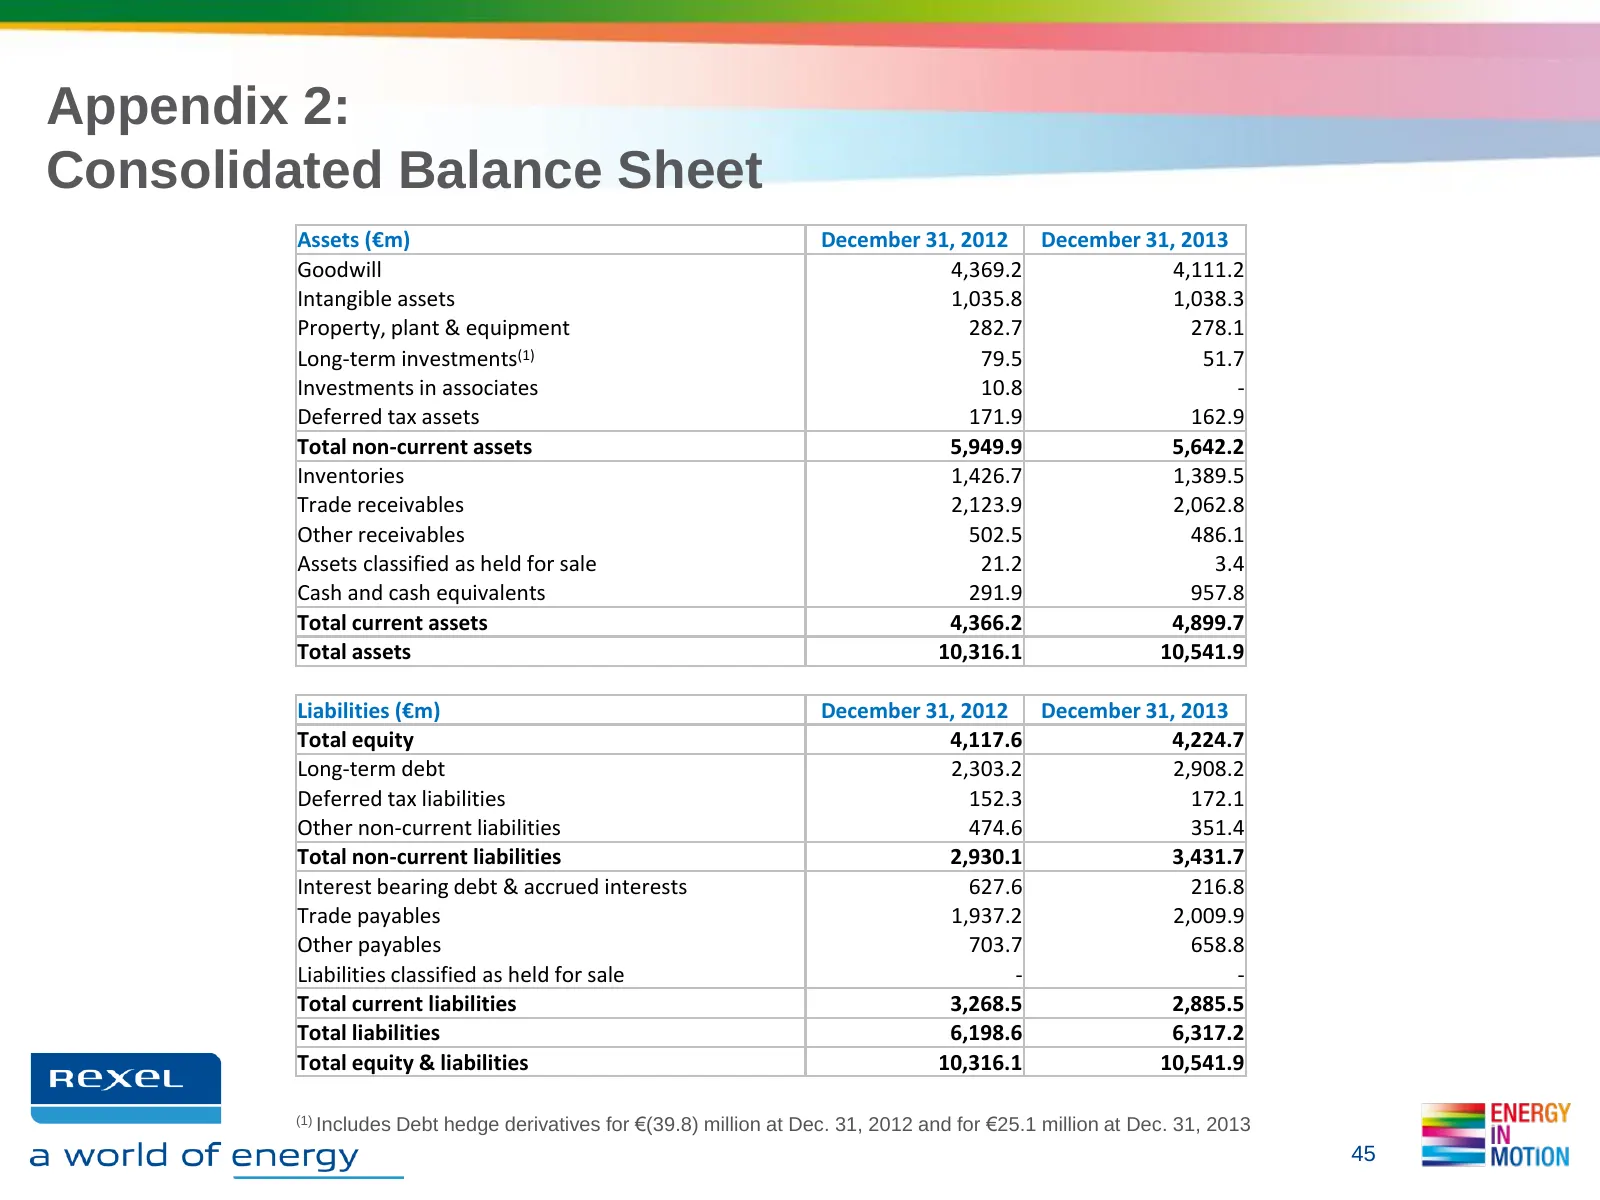
Slide 45: Appendix 2: Consolidated Balance Sheet
Appendix 2: Consolidated Balance Sheet Assets (€m) December 31, 2012 December 31, 2013 Goodwill 4,369.2 4,111.2 Intangible assets 1,035.8 1,038.3 Property, plant & equipment 282.7 278.1 Long-term investments(1) 79.5 51.7 Investments in associates 10.8 - Deferred tax assets 171.9 162.9 Total non-curr
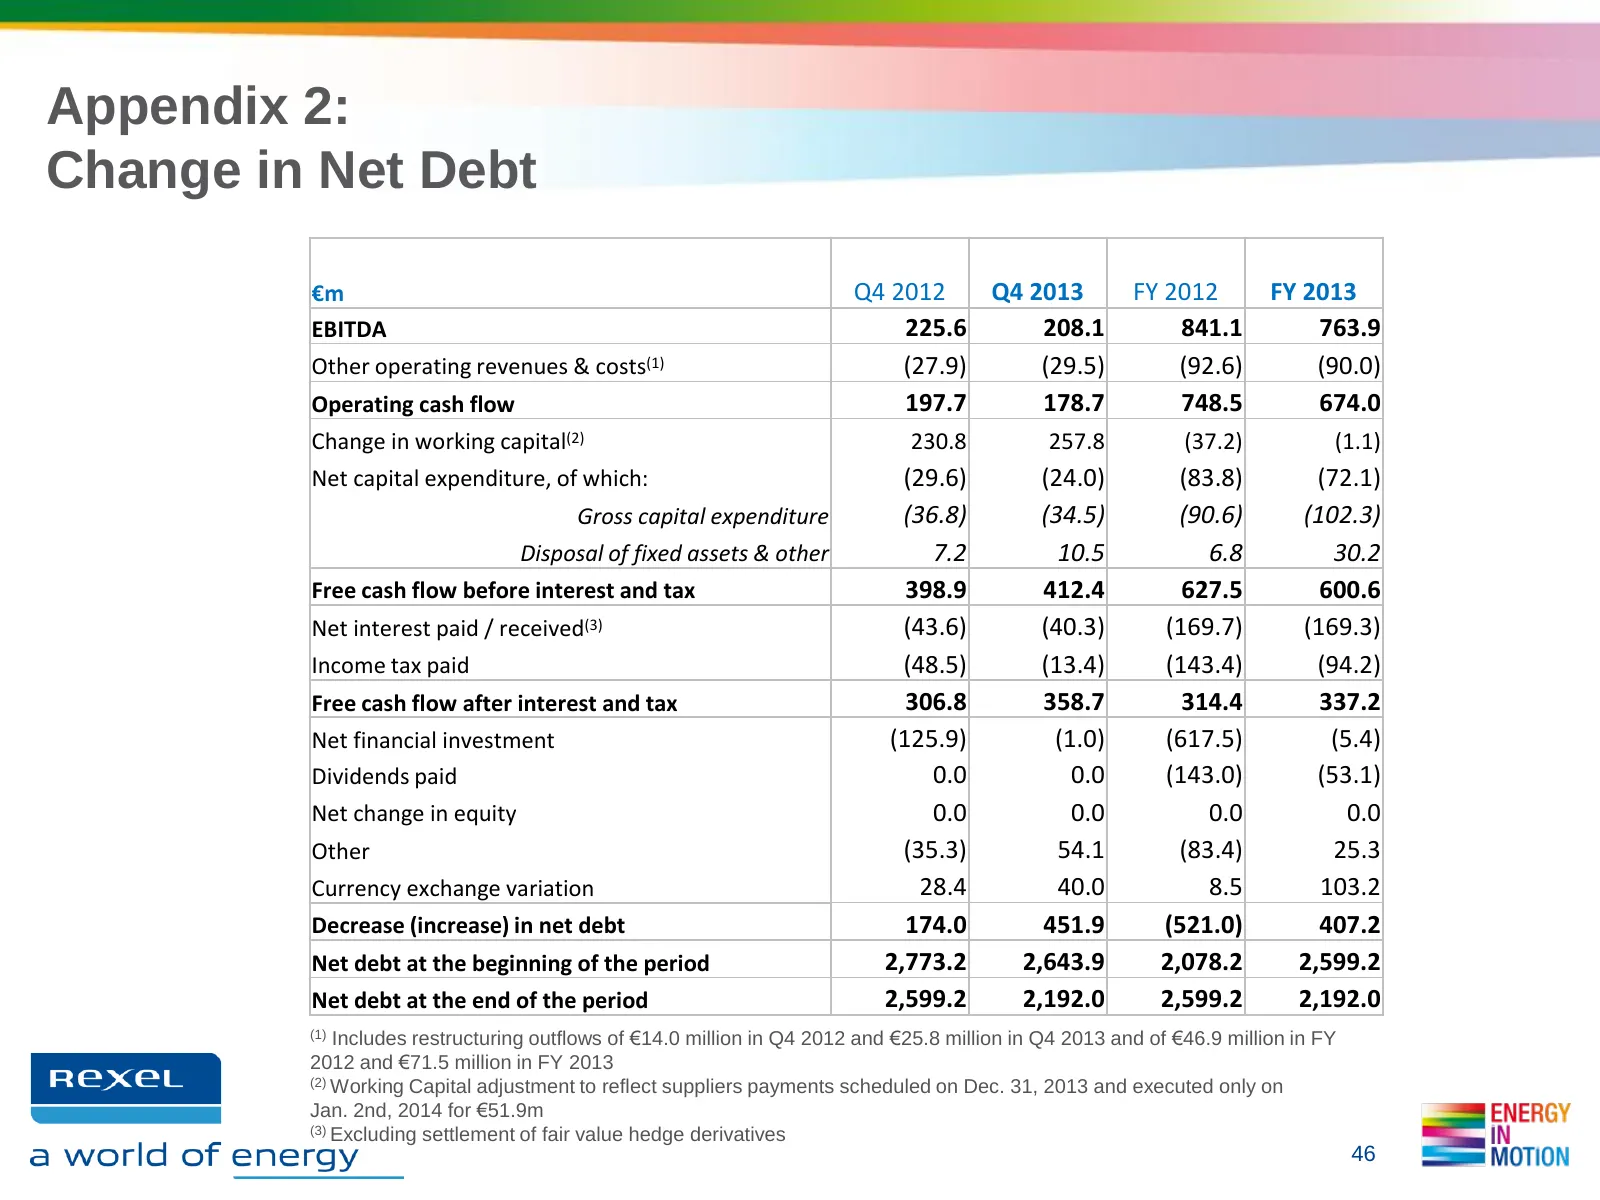
Slide 46: Appendix 2: Change in Net Debt
Appendix 2: Change in Net Debt €m Q4 2012 Q4 2013 FY 2012 FY 2013 EBITDA 225.6 208.1 841.1 763.9 Other operating revenues & costs(1) (27.9) (29.5) (92.6) (90.0) Operating cash flow 197.7 178.7 748.5 674.0 Change in working capital(2) 230.8 257.8 (37.2) (1.1) Net capital expenditure, of which: (29.6)
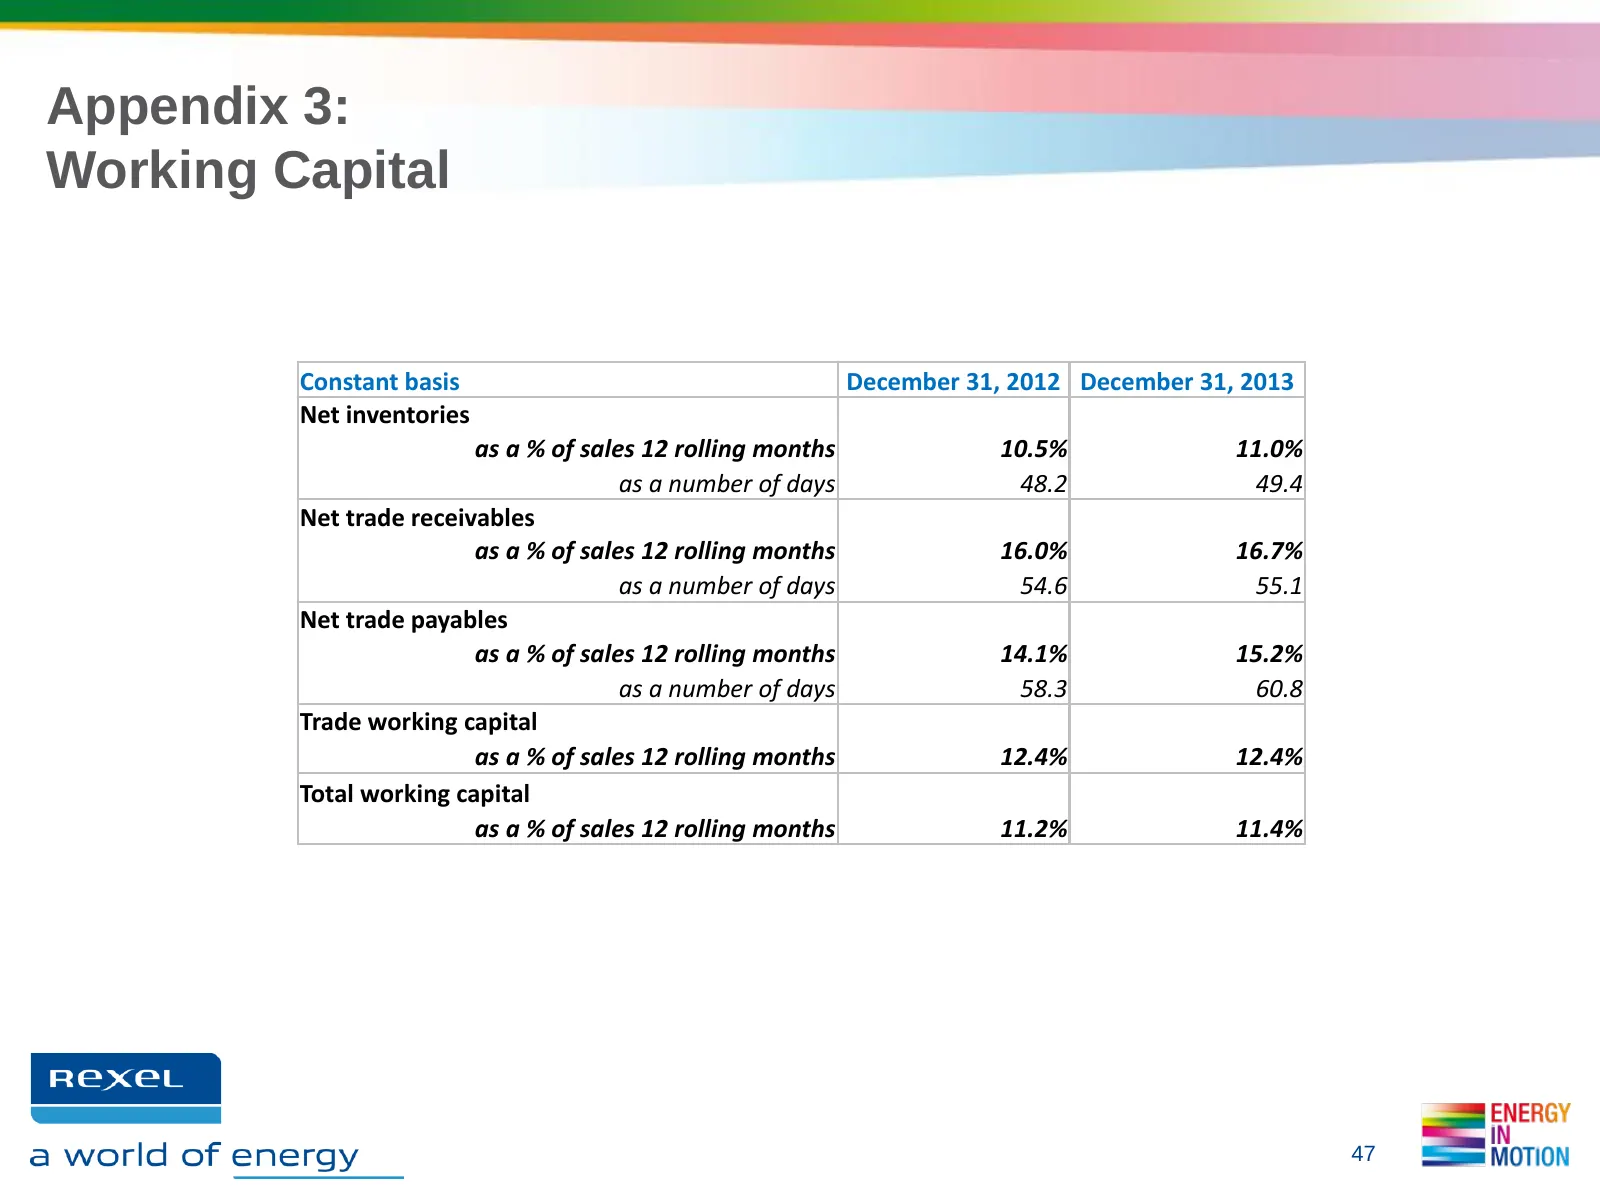
Slide 47: Appendix 3: Working Capital
Appendix 3: Working Capital Constant basis December 31, 2012 December 31, 2013 Net inventories as a % of sales 12 rolling months 10.5% 11.0% as a number of days 48.2 49.4 Net trade receivables as a % of sales 12 rolling months 16.0% 16.7% as a number of days 54.6 55.1 Net trade payables as a % of sa
Slide 48: Appendix 4: Headcount & Branch Evolution
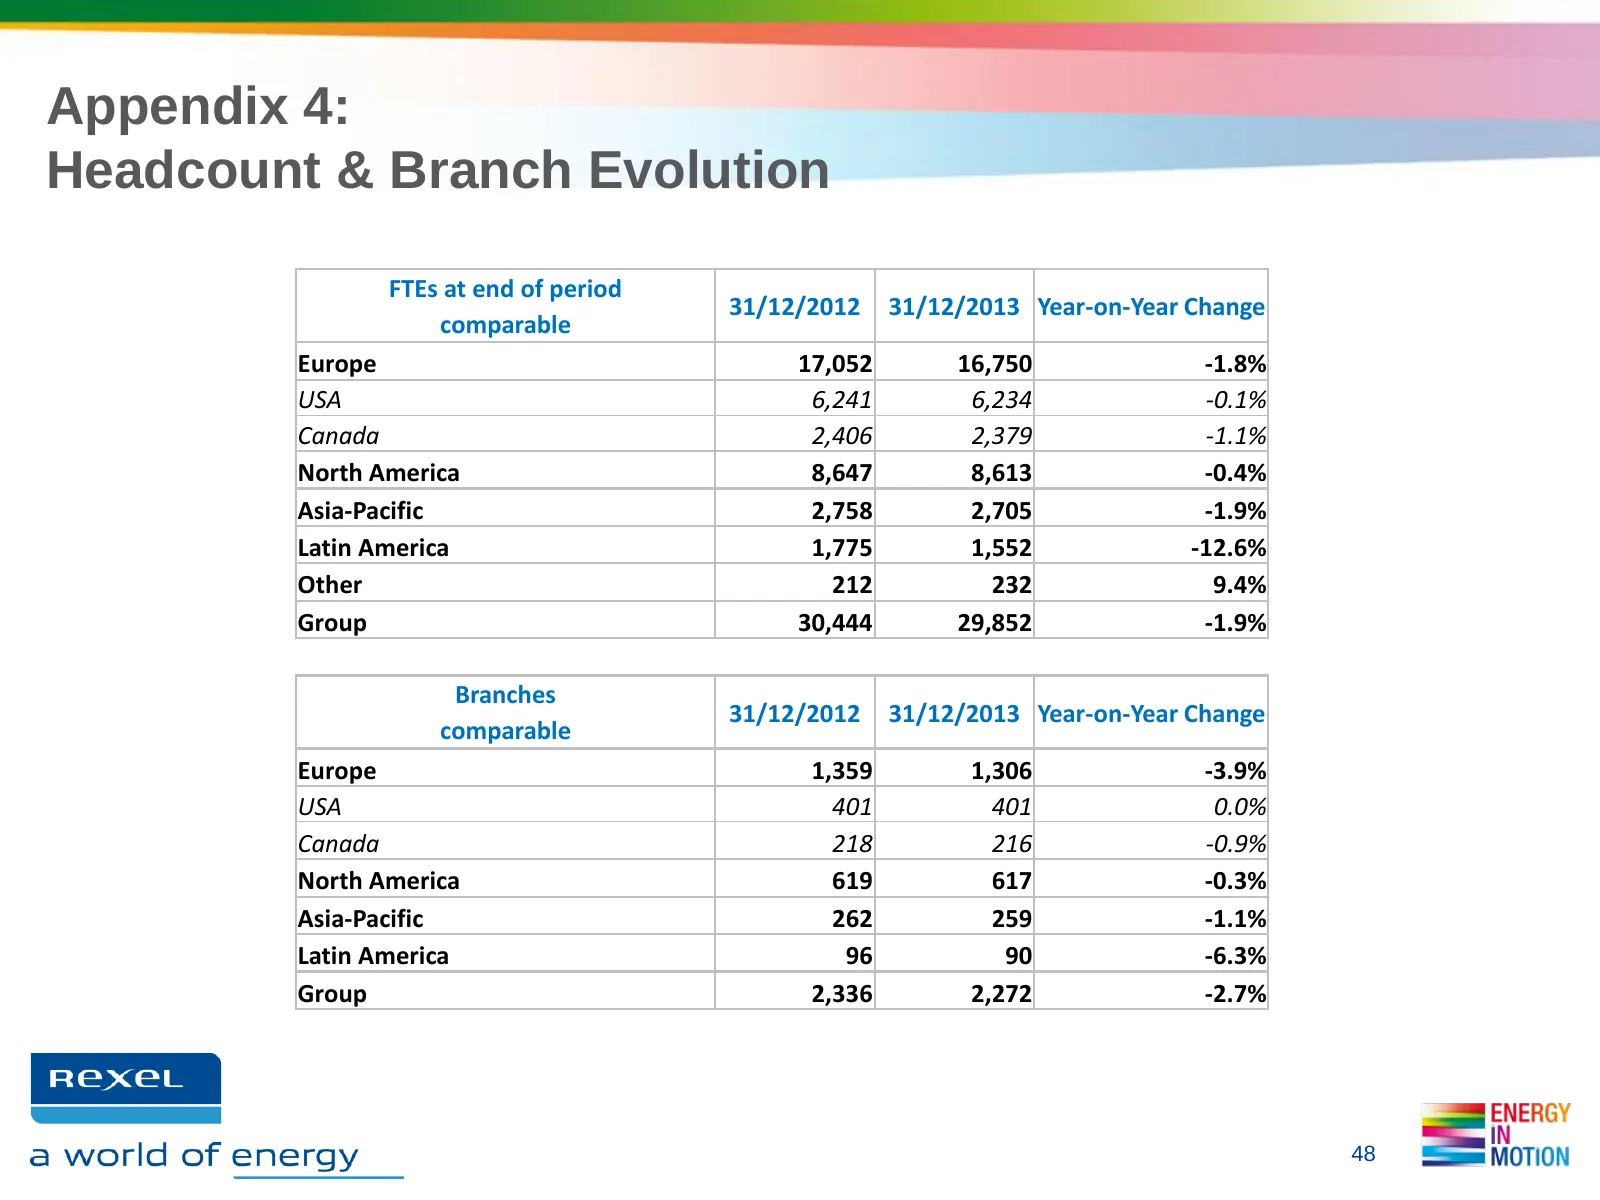
Appendix 4: Headcount & Branch Evolution FTEs at end of period 31/12/2012 31/12/2013 Year-on-Year Change comparable Europe 17,052 16,750 -1.8% USA 6,241 6,234 -0.1% Canada 2,406 2,379 -1.1% North America 8,647 8,613 -0.4% Asia-Pacific 2,758 2,705 -1.9% Latin America 1,775 1,552 -12.6% Other 212 232
Slide 49: Appendix 5: Calendar, scope and change effects on sales
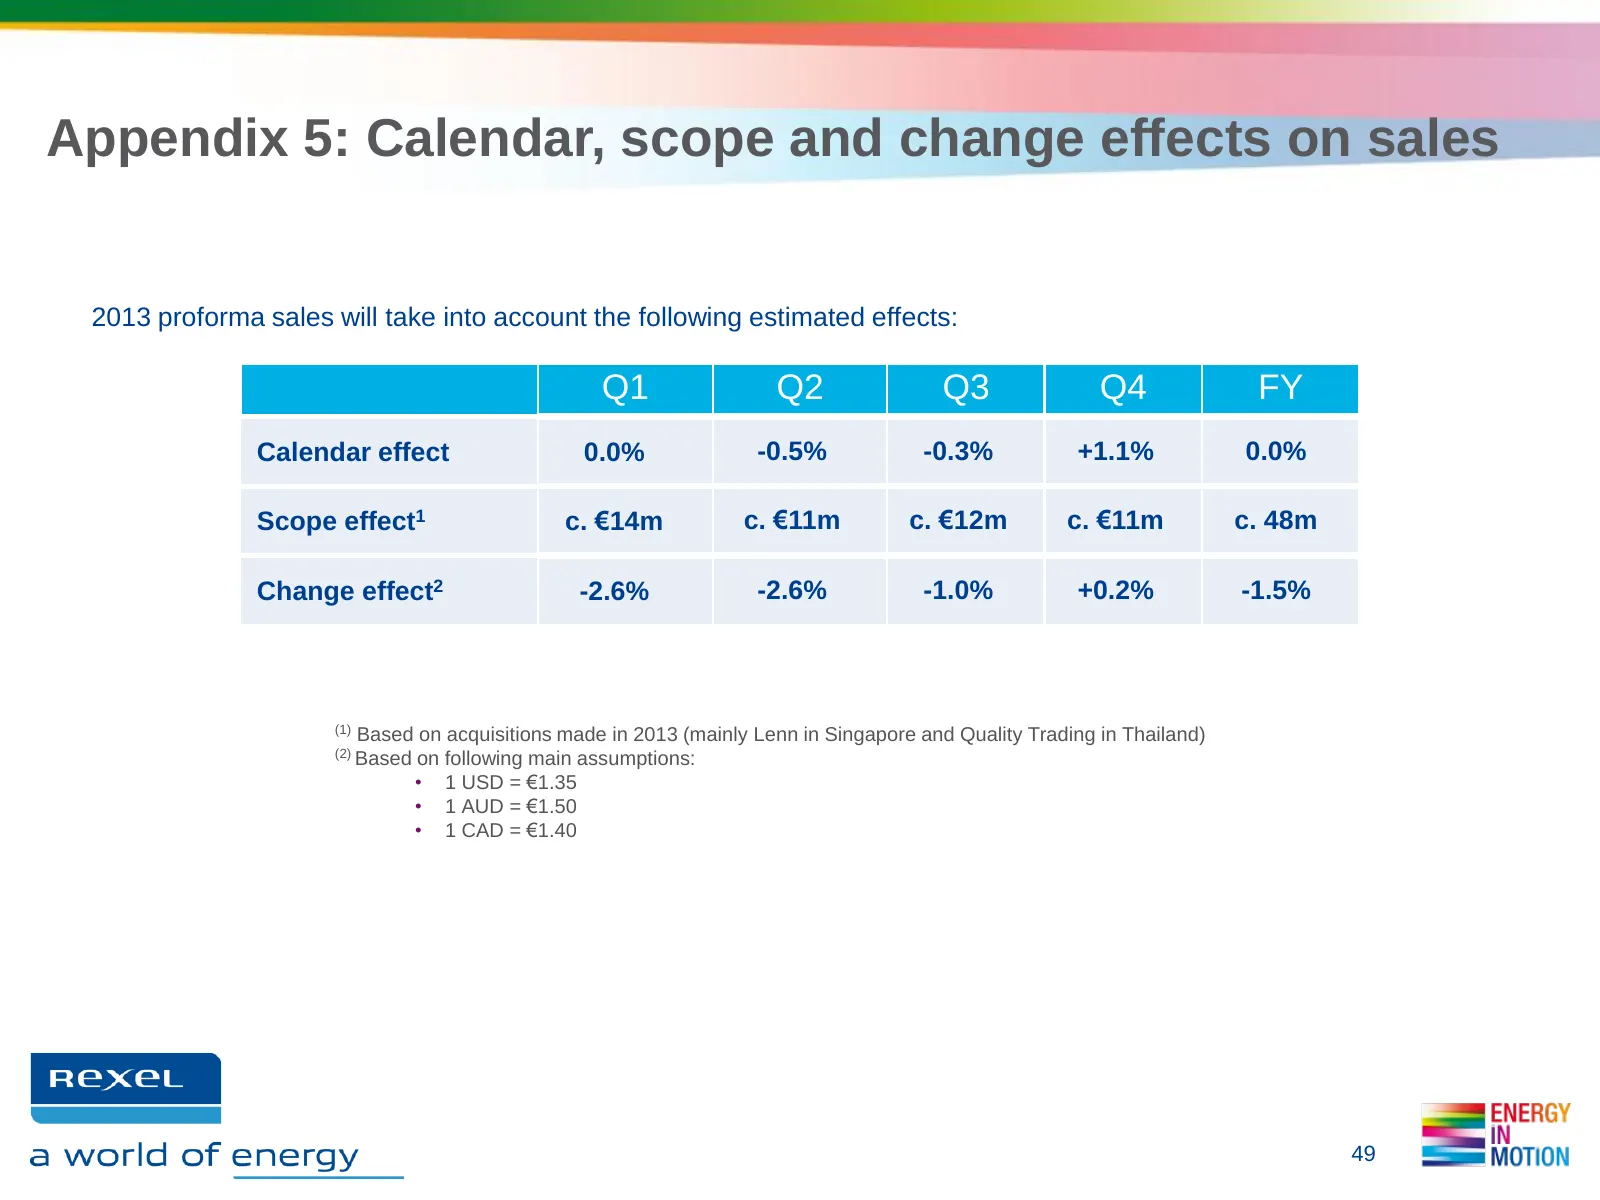
Appendix 5: Calendar, scope and change effects on sales 2013 proforma sales will take into account the following estimated effects: Q1 Q2 Q3 Q4 FY Calendar effect 0.0% -0.5% -0.3% +1.1% 0.0% Scope effect1 c. €14m c. €11m c. €12m c. €11m c. 48m Change effect2 -2.6% -2.6% -1.0% +0.2% -1.5% (1) Based o
Slide 50: Appendix 6: Changes due to the enforcement of IFRIC 21
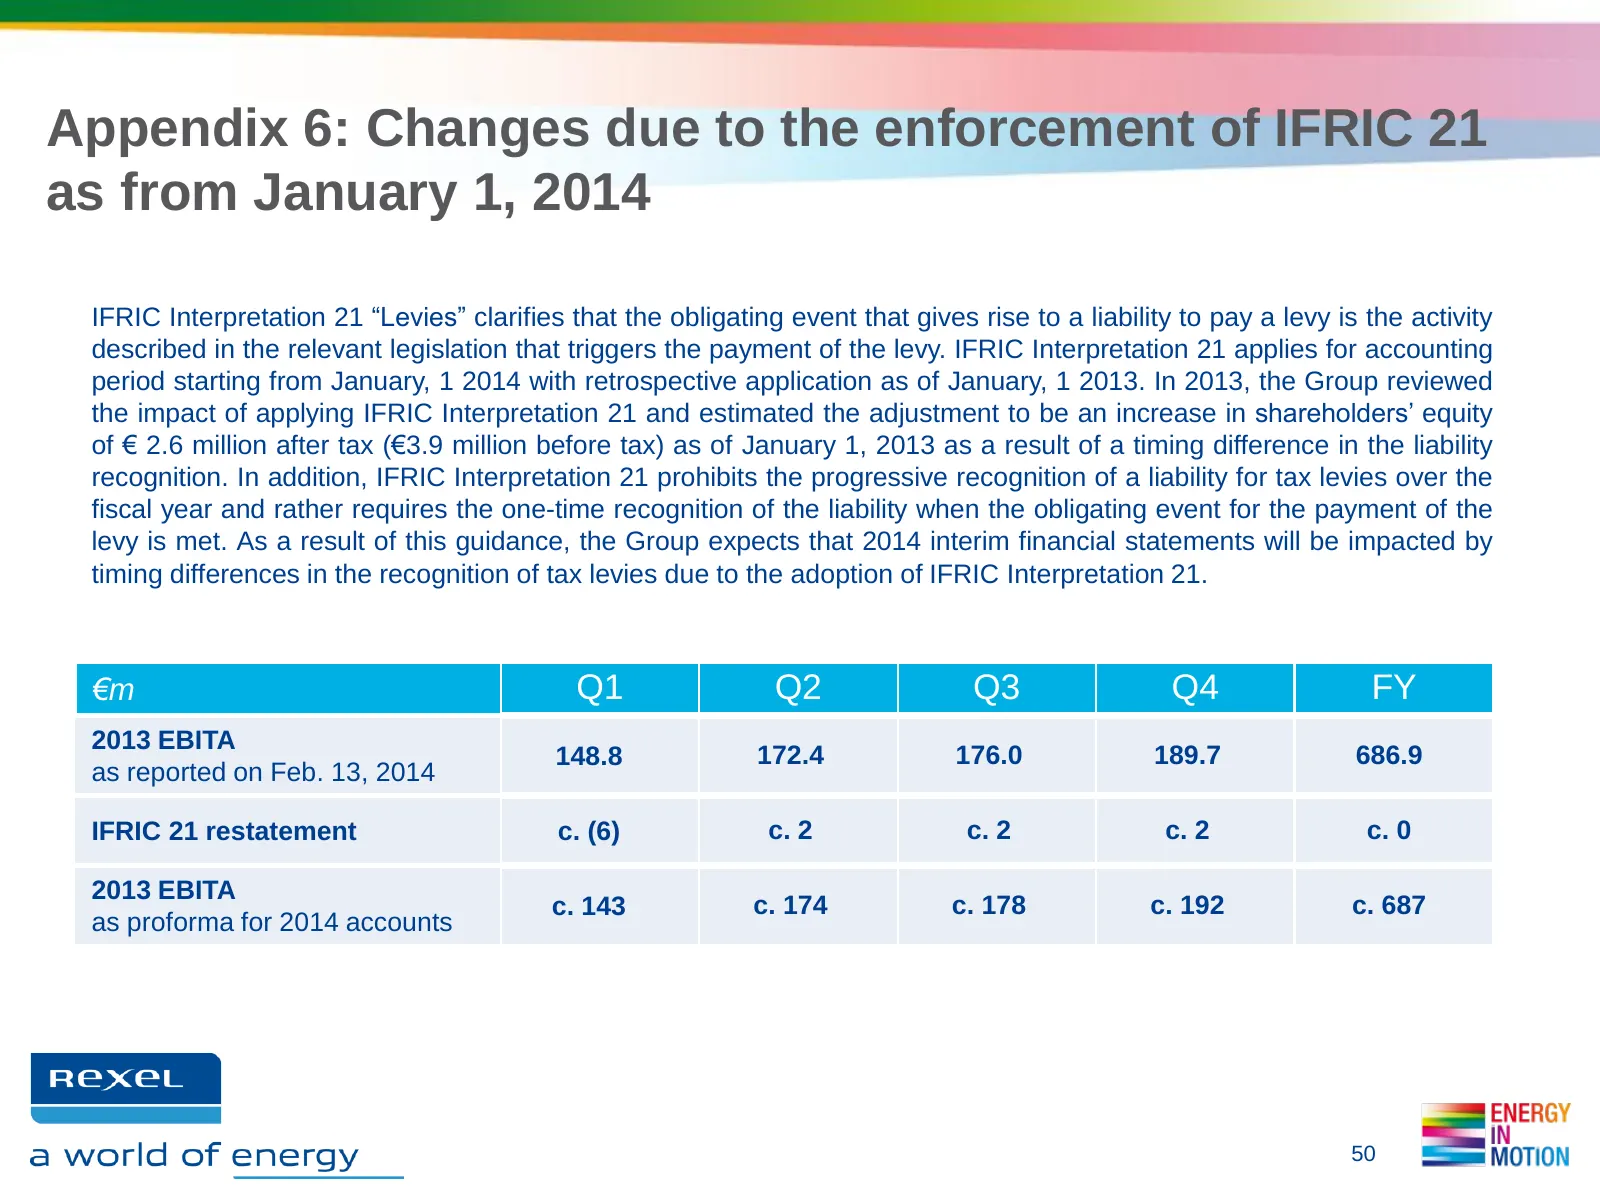
Appendix 6: Changes due to the enforcement of IFRIC 21 as from January 1, 2014 IFRIC Interpretation 21 “Levies” clarifies that the obligating event that gives rise to a liability to pay a levy is the activity described in the relevant legislation that triggers the payment of the levy. IFRIC Interpre
Slide 51: Appendix 7: PV, Wind and Mining sales in 2013
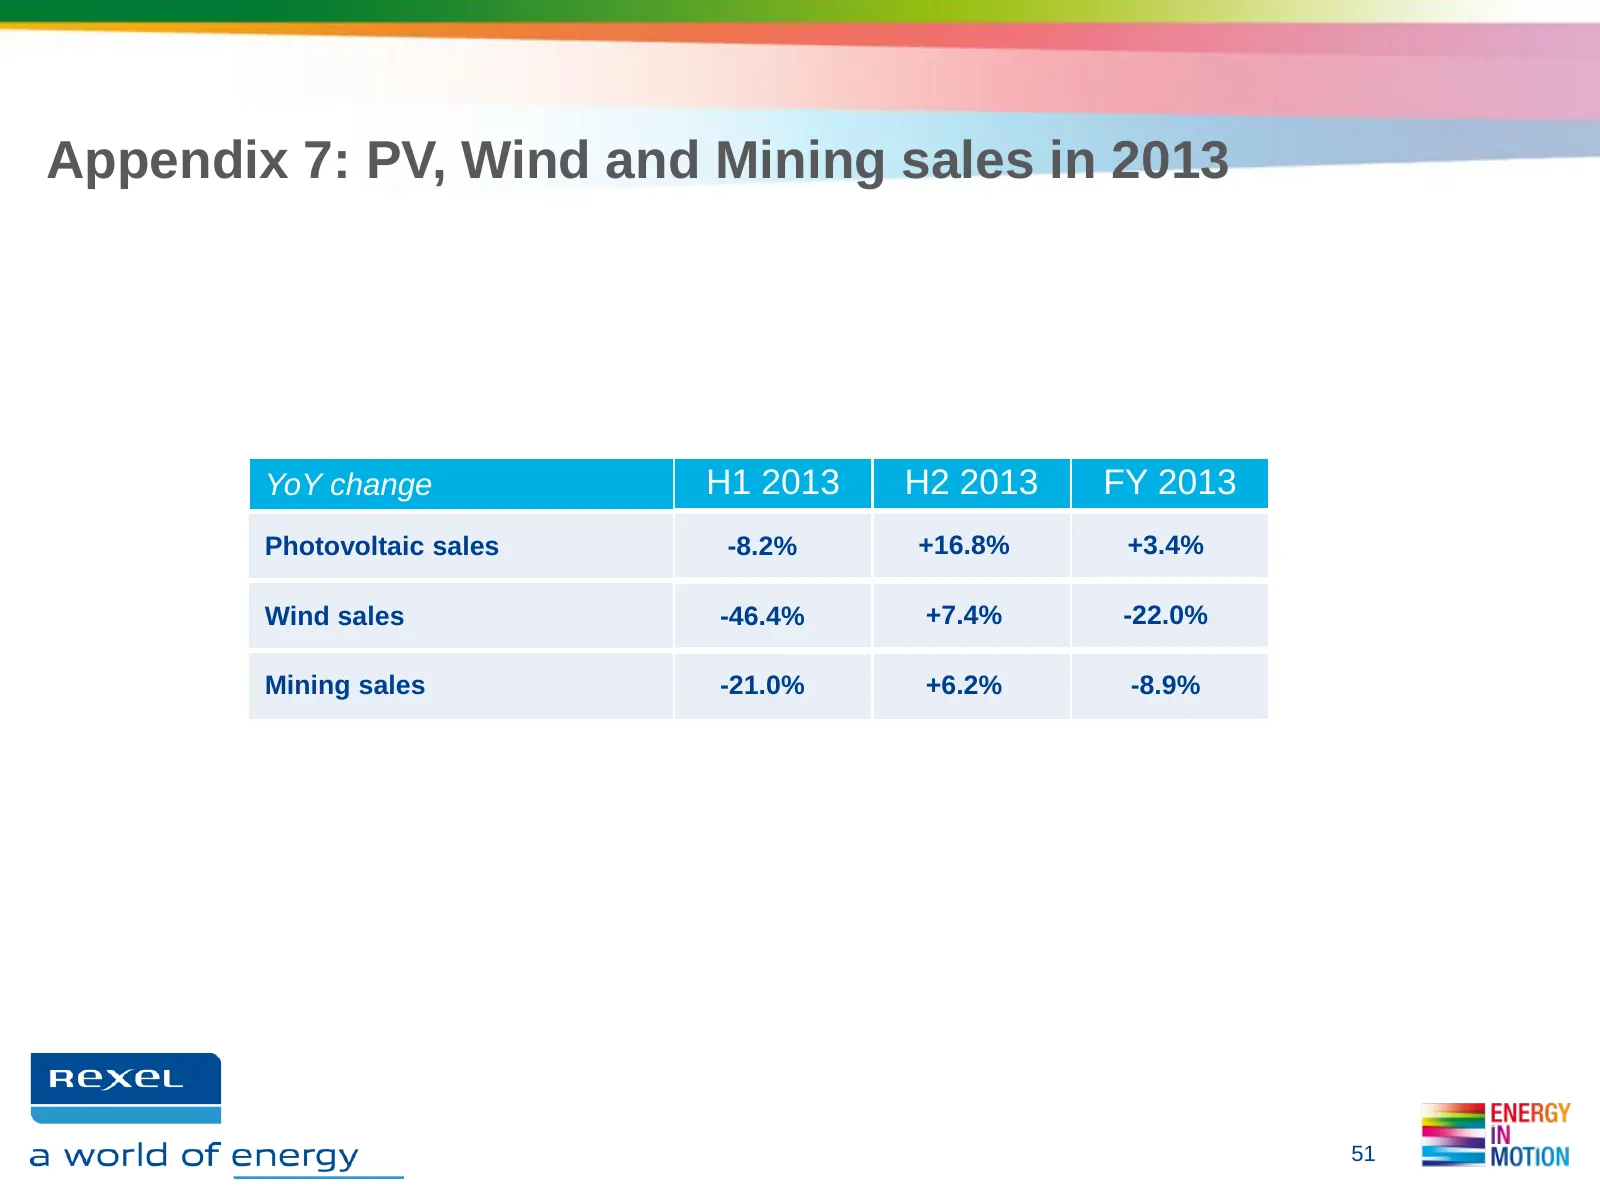
Appendix 7: PV, Wind and Mining sales in 2013 YoY change H1 2013 H2 2013 FY 2013 Photovoltaic sales -8.2% +16.8% +3.4% Wind sales -46.4% +7.4% -22.0% Mining sales -21.0% +6.2% -8.9% 51
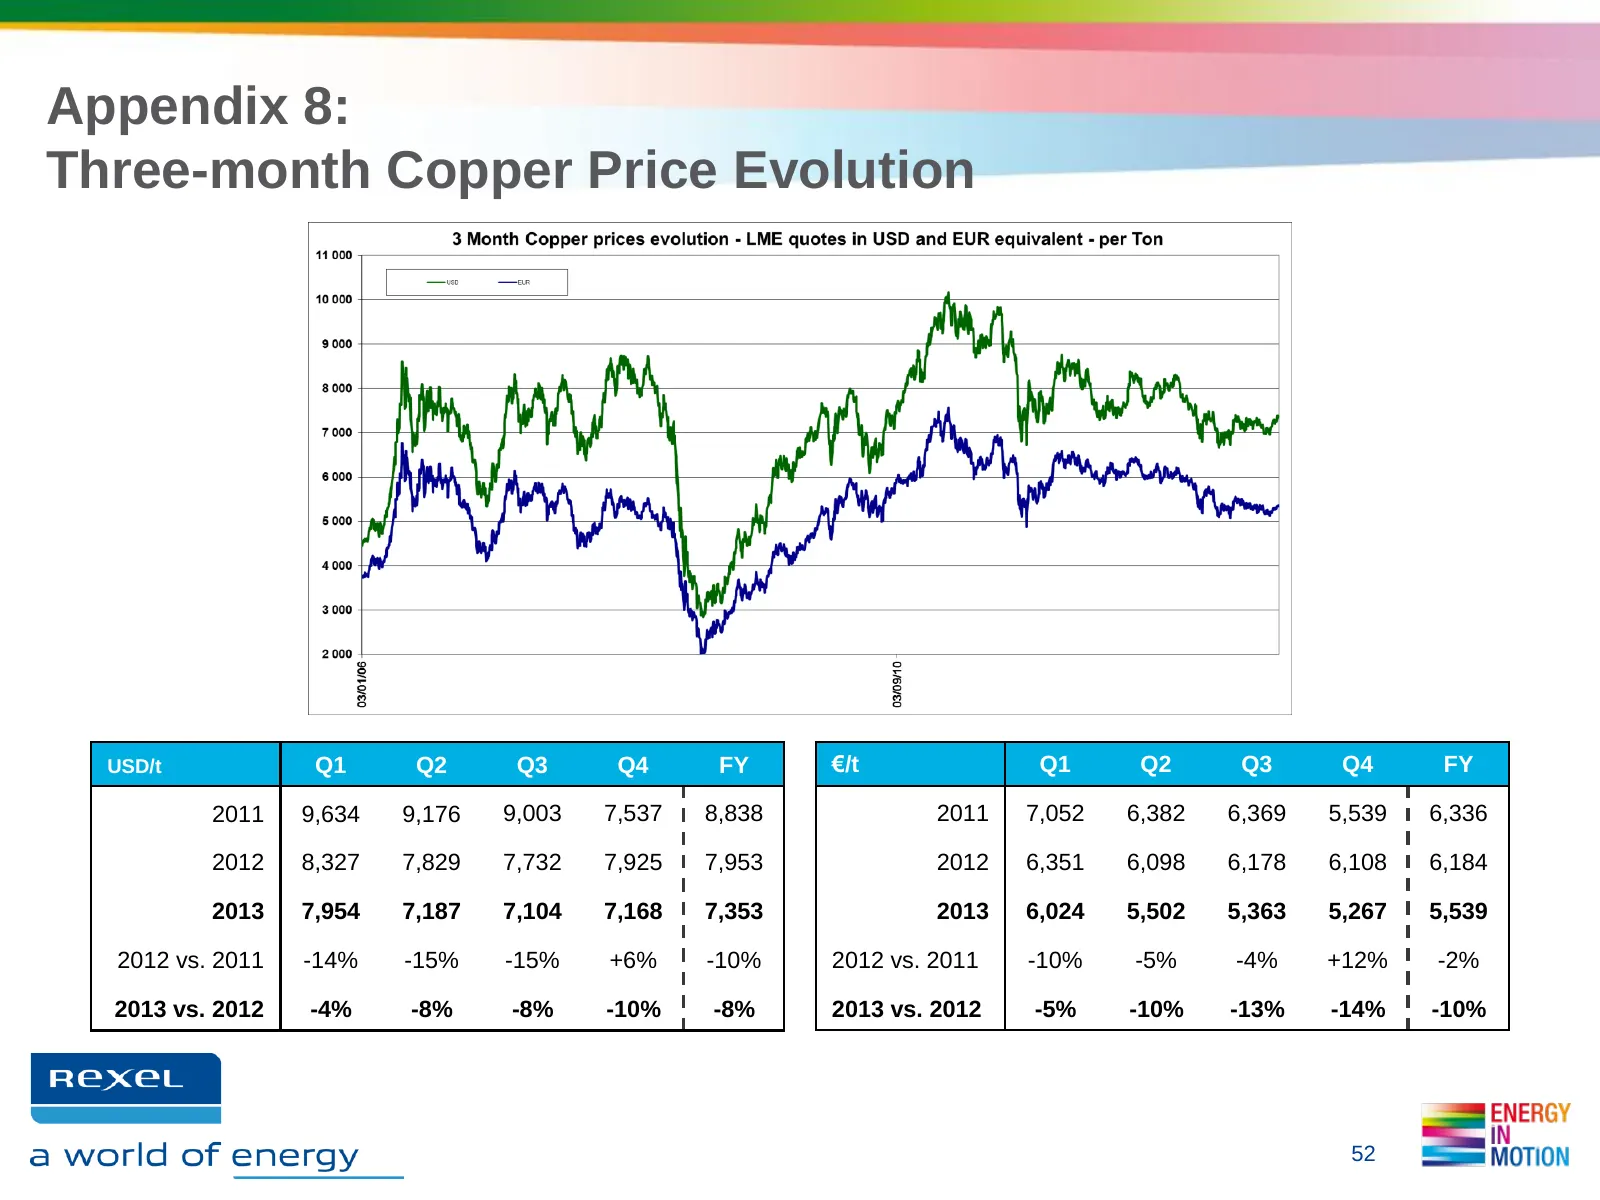
Slide 52: Appendix 8: Three-month Copper Price Evolution
Appendix 8: Three-month Copper Price Evolution USD/t Q1 Q2 Q3 Q4 FY €/t Q1 Q2 Q3 Q4 FY 2011 9,634 9,176 9,003 7,537 8,838 2011 7,052 6,382 6,369 5,539 6,336 2012 8,327 7,829 7,732 7,925 7,953 2012 6,351 6,098 6,178 6,108 6,184 2013 7,954 7,187 7,104 7,168 7,353 2013 6,024 5,502 5,363 5,267 5,539 201
Slide 53: Financial Calendar and contacts
Financial Calendar and contacts Financial Calendar Contacts • April 30, 2014 • Investors & Analysts Q1 results Marc MAILLET Tel: +33 1 42 85 76 12 • May 22, 2014 Email: marc.maillet@rexel.com AGM Florence MEILHAC • July 30, 2014 Tel: +33 1 42 85 57 61 Q2 and H1 results Email: florence.meilhac@rexel.
Slide 54: Disclaimer
Disclaimer The Group is exposed to fluctuations in copper prices in connection with its distribution of cable products. Cables accounted for approximately 15% of the Group's sales, and copper accounts for approximately 60% of the composition of cables. This exposure is indirect since cable prices al
Source: Internet Archive copy of rexel.com
More decks from Rexel SA
 Q3 2026 Earnings Presentation13 slides · Oct 22, 2026
 Q2 2026 Earnings Presentation24 slides · Jul 27, 2026
 FY 2025 Earnings Presentation31 slides · Feb 11, 2026
 Q3 2025 Earnings Presentation15 slides · Oct 15, 2025
 Q2 2025 Earnings Presentation20 slides · Jul 28, 2025
 Q1 2025 Earnings Presentation16 slides · Apr 29, 2025