Bryn Mawr Bank — Investor Presentation (February 2017)
24 slides from Bryn Mawr Bank's investor presentation, Feb 3, 2017
Slide 1: Bryn Mawr Bank Corporation
BMBC BRYN MAWR BANK CORPORATION February 2017 NASDAQ: BMTC
Slide 2: Safe Harbor
Safe Harbor This presentation contains statements which, to the extent that they are not recitations of historical fact may constitute forward- looking statements for purposes of the Securities Act of 1933, as amended, and the Securities Exchange Act of 1934, as amended. Please see the section title
Slide 3: Bryn Mawr Trust - Overview
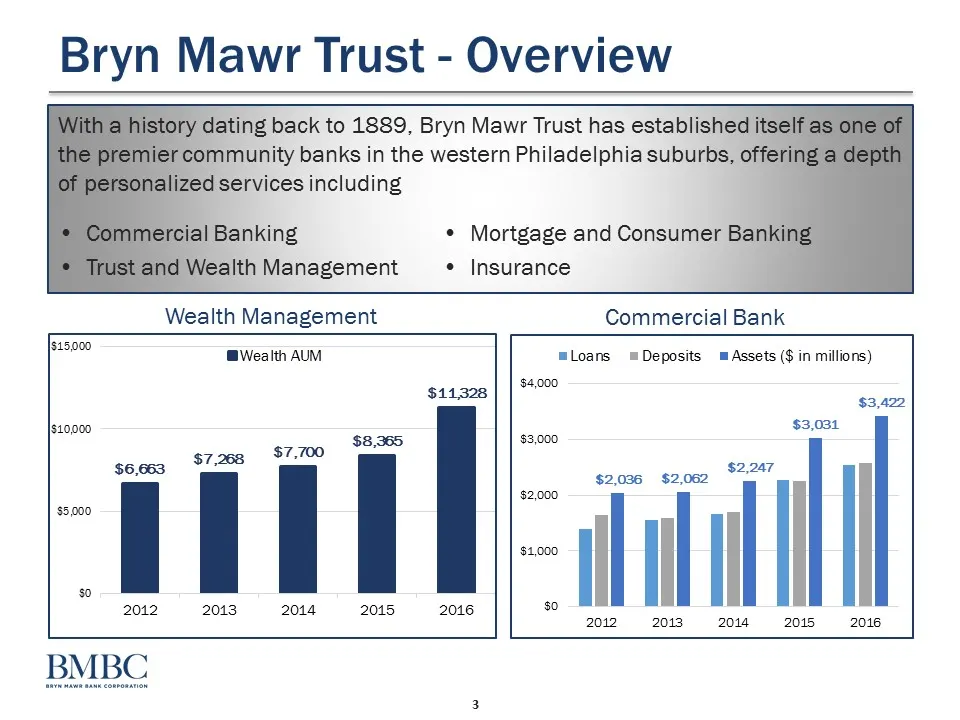
Bryn Mawr Trust - Overview ervices including inking Ith Management ¢ Mortgage and Consumer ting back to 1889, Bryn Mawr Trust has establish munity banks in the western Philadelphia suburbs, o ¢ Insurance Wealth Management Commercial Bank [s15000 |s10000 $5,000 $0 $6,663 2012 Wealth AUM $7,268 2013 $
Slide 4: Strategic Objectives
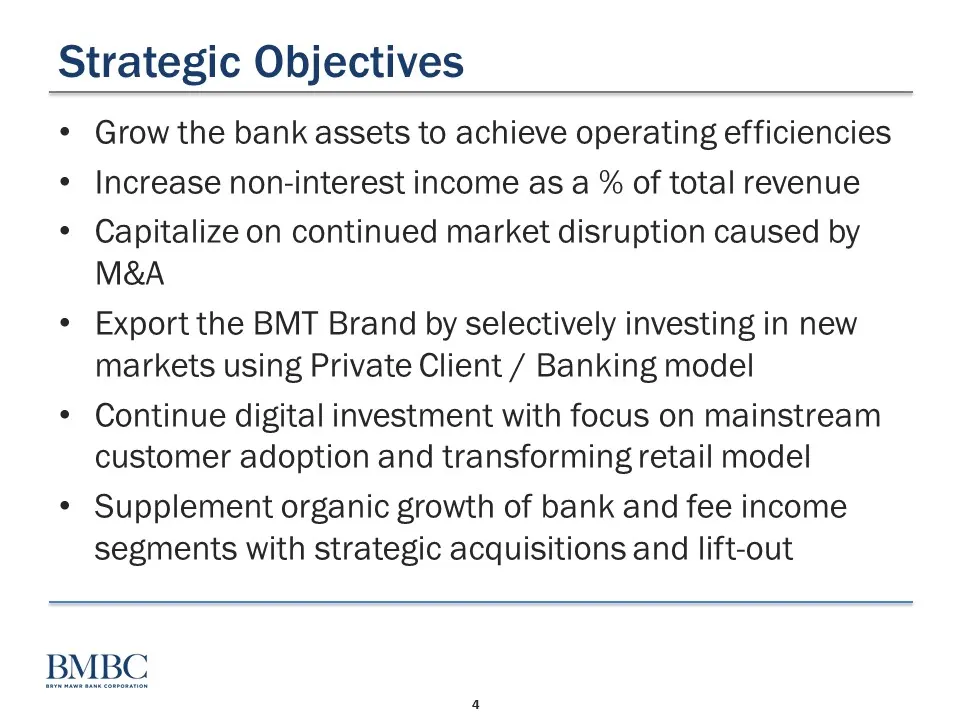
Strategic Objectives * Grow the bank assets to achieve operating efficiencies ¢ Increase non-interest income as a % of total revenue * Capitalize on continued market disruption caused by M&A ¢ Export the BMT Brand by selectively investing in new markets using Private Client / Banking model * Continu
Slide 5: Relationship Based Sales Approach
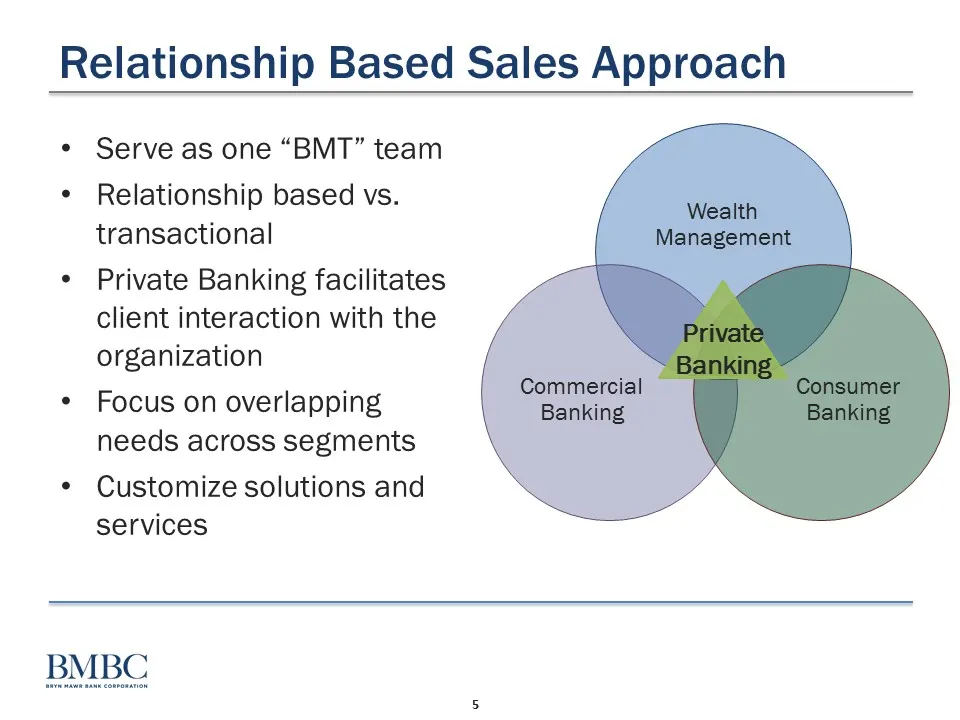
Relationship Based Sales Approach * Serve as one “BMT” team * Relationship based vs. transactional * Private Banking facilitates client interaction with the organization * Focus on overlapping needs across segments * Customize solutions and services
Slide 6: Technology Strategy - Objectives
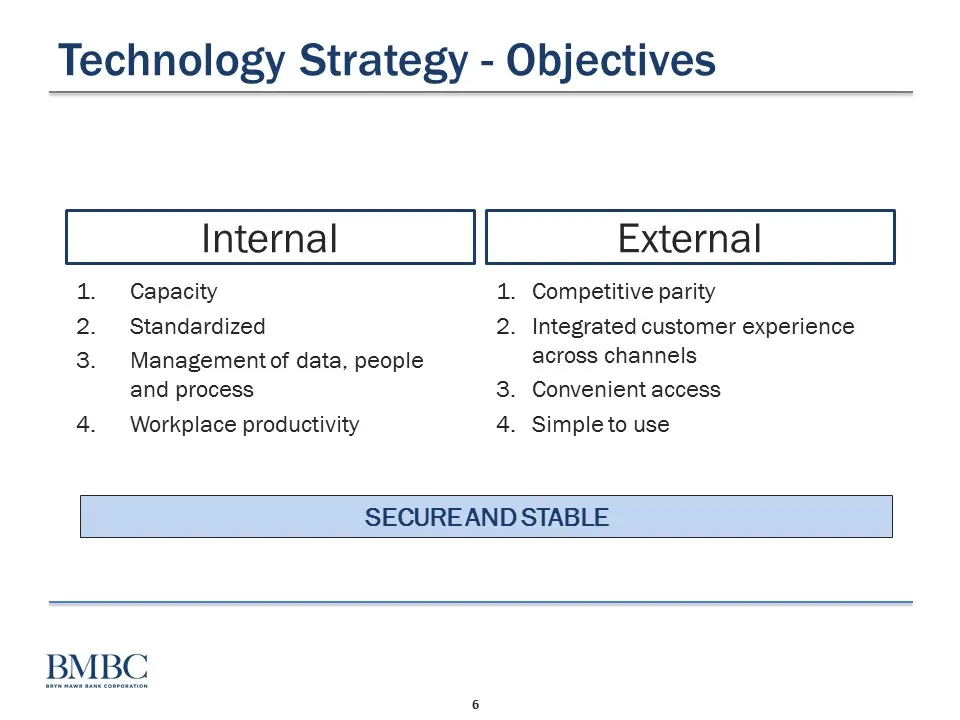
Technology Strategy - Objectives Internal External 1. Capacity 1. Competitive parity 2. Standardized 2. Integrated customer experience 3. Managementof data, people across channels and process 3. Convenient access 4. Workplace productivity 4. Simpleto use SECUREAND STABLE
Slide 7: Technology Investment Time Line
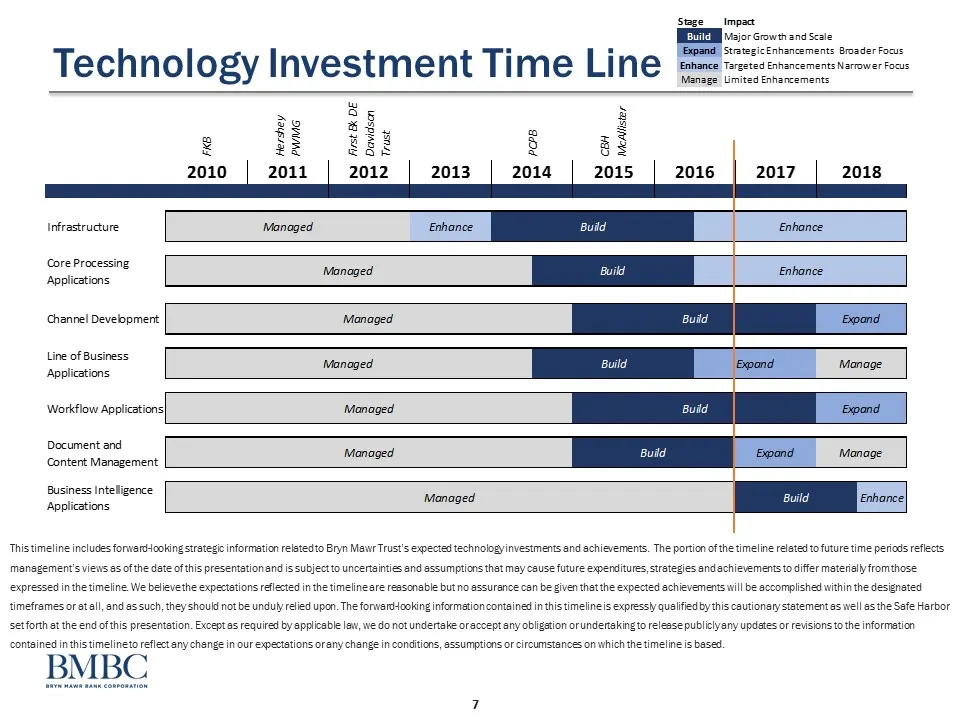
Stage impact ERT visor crowtnand scale ‘Strategic Enhancements Broader Forus Technology Investment Time Line see -ess2re or Manage Limited Enhancements Trust PPB cH Medlister 8 S xe S x 8 2 i y 8 2 is] x 8 2 ind y 8 2 5 x 8 2 a x 8 2 a 2017 2018 Infrastructure Managed Enhance Core Processing Managed
Slide 8: Recap of Full Year 2016
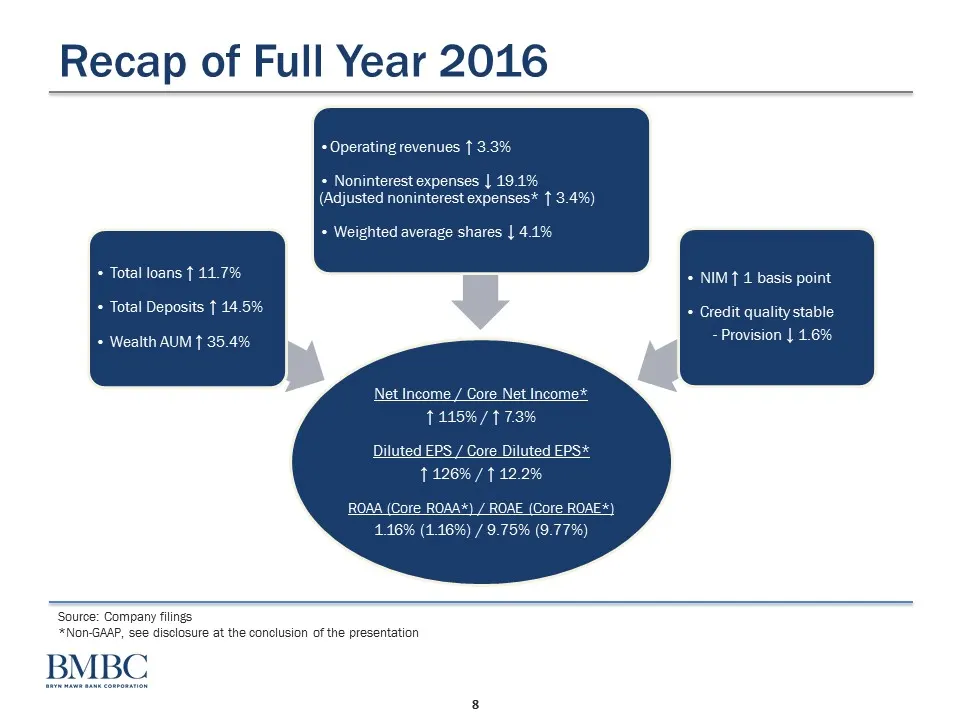
Recap of Full Year 2016 Dperating revenues f 3 + Noninterest expenses | 19 (Adjusted noninterest expenses* 1 3.4%) + Weighted average shares | 4.1% + Total loans f 41 + Total Deposits f 14.5% + Wealth AUM f 35.4' Net Income / Gore Net Income* ieee + NIM 4 basis point + Credit quality stable - Provis
Slide 9: 4Q 2016 Performance
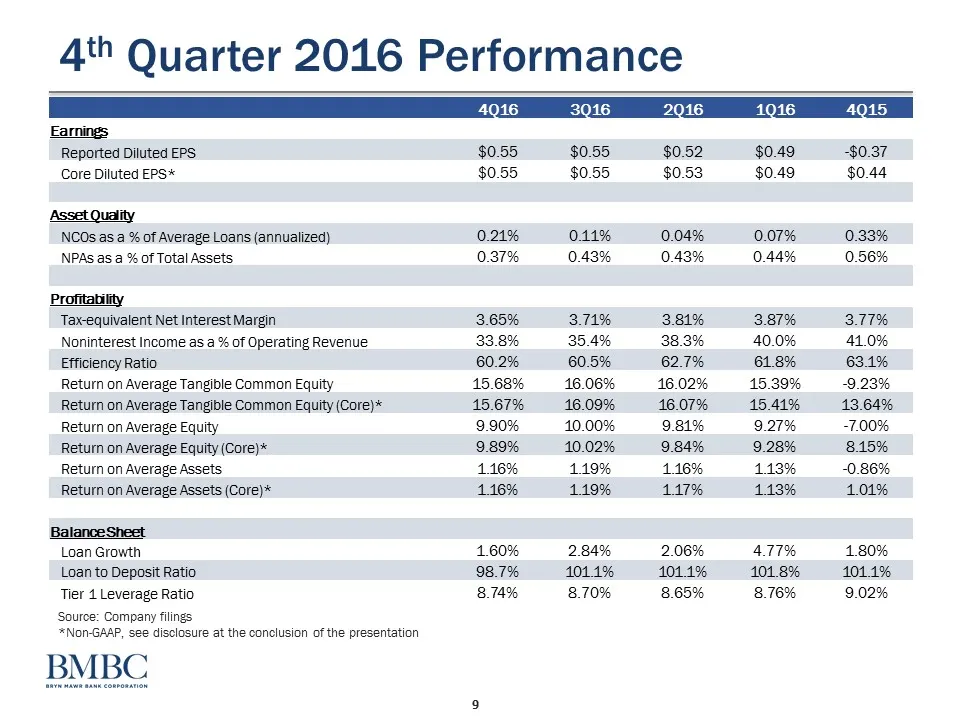
4“ Quarter 2016 Performance Earnings Reported Diluted EPS Core Diluted EPS* Asset Quality NCOs as a % of Average Loans (annualized) NPAs as a % of Total Assets Profitability Tax-equivalent Net Interest Margin Noninterest Income as a % of Operating Revenue Efficiency Ratio Return on Average Tangible
Slide 10: Quarterly Net Interest Margin (tax-equivalent)
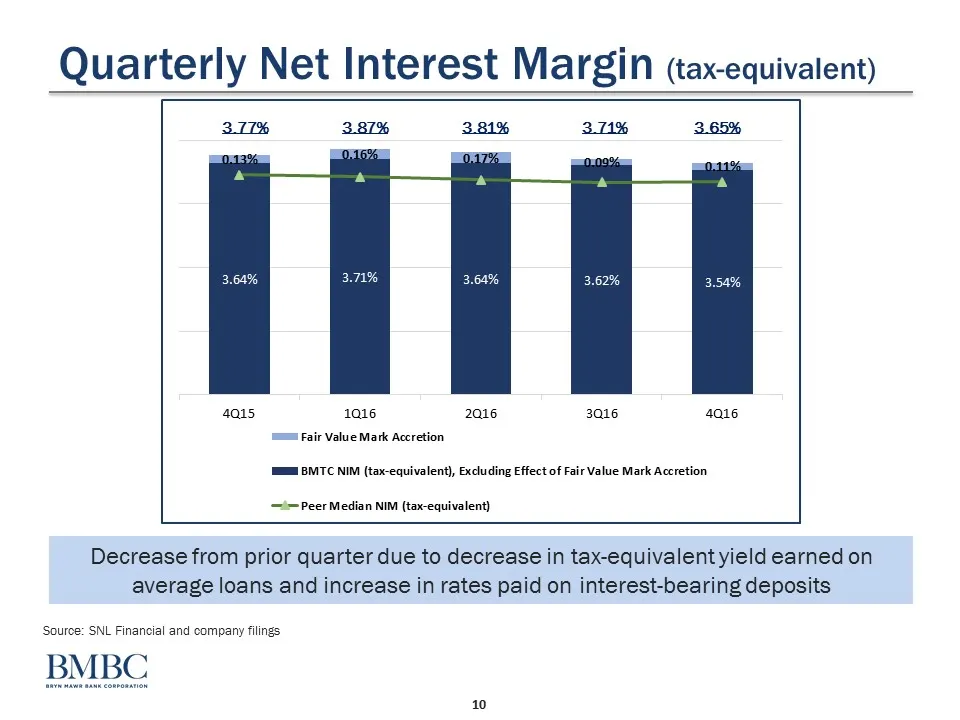
Quarterly Net Interest Margin (tax-equivalent) 3.87% 3.81% 3.65% 1016 2016 4ai6 ss Fair Value Mark Accretion mE EMTC NIM (tax-equivalent), Excluding Effect of Fair Value Mark Accretion ais 3016 = Peer Median NIM (tax-equivalent) Decrease from prior quarter due to decrease in tax-equivalent yield ear
Slide 11: Asset Quality Metrics
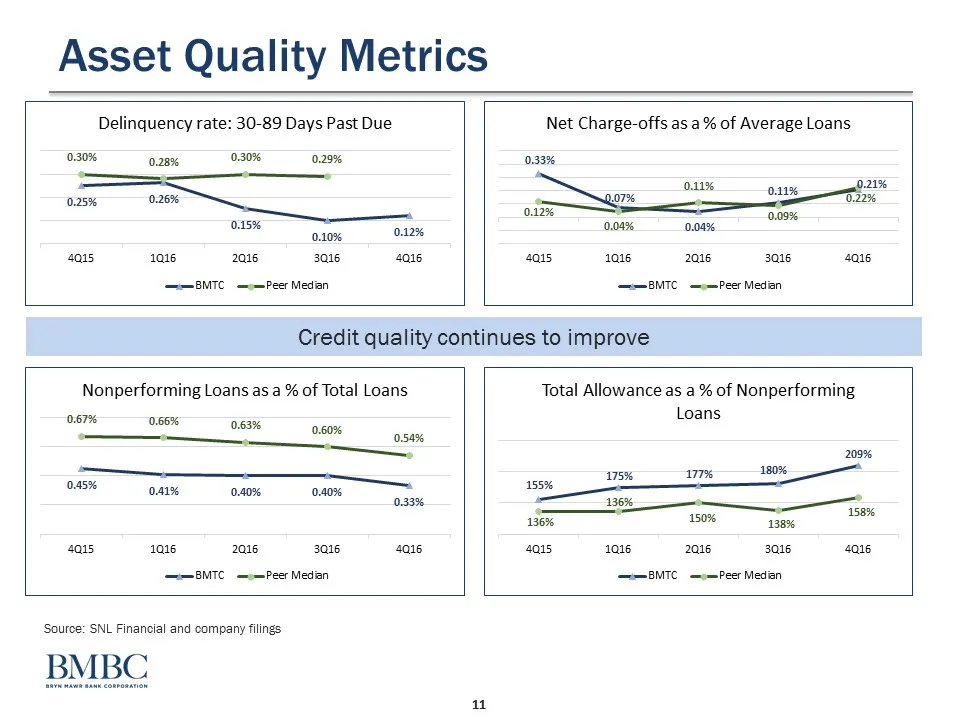
Asset Quality Metrics Delinquency rate: 30-89 Days Past Due 0.30% ame 0.30% 0.29% 025% 0.26% 015% OAK: 0.12% 4015 1016 2016 3016 4016 = EMTC Peer Median Net Charge-offs as a % of Average Loans 033% 011% 121% 107% boo 720% 0.0% na 0.04% 0.04% 40s 1016 2016 3016 ais ——8MTC meePeer Median Credit qualit
Slide 12: Non-interest Income
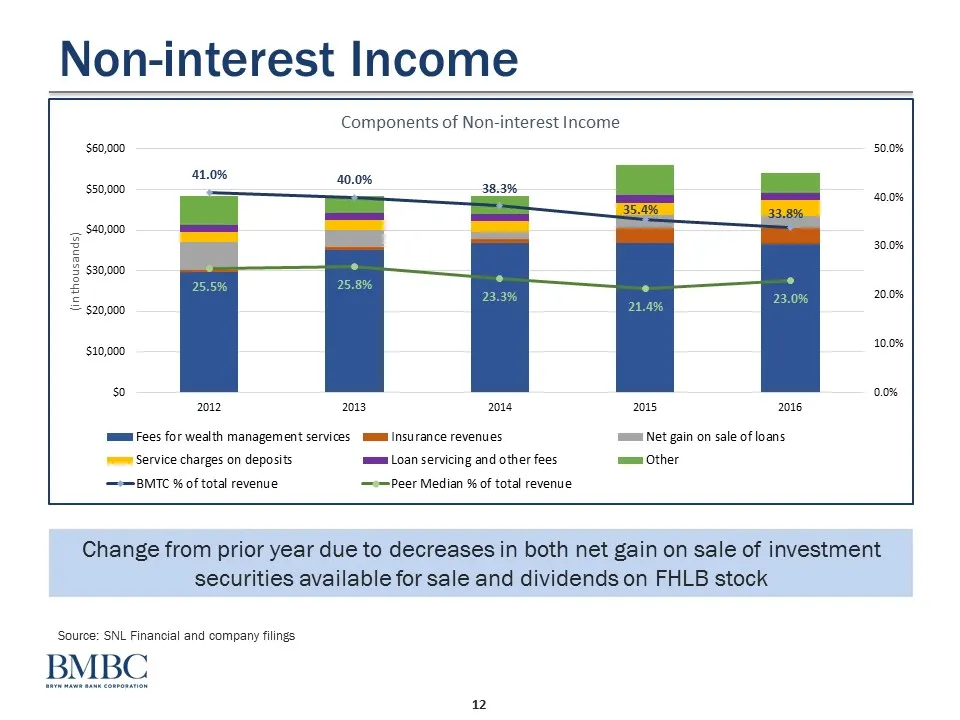
Non-interest Income $60,000 41.0% {inthousands) g 3 2012 ‘ems Service charges on deposits ——BMITC % of total revenue mm Fees for wealth management services mmm Insurance revenues Components of Non-interest Income 38.3% 2013 2018 2015 2016 ‘mmm Net gain on sale of loans ‘mmm Loan servicing and other
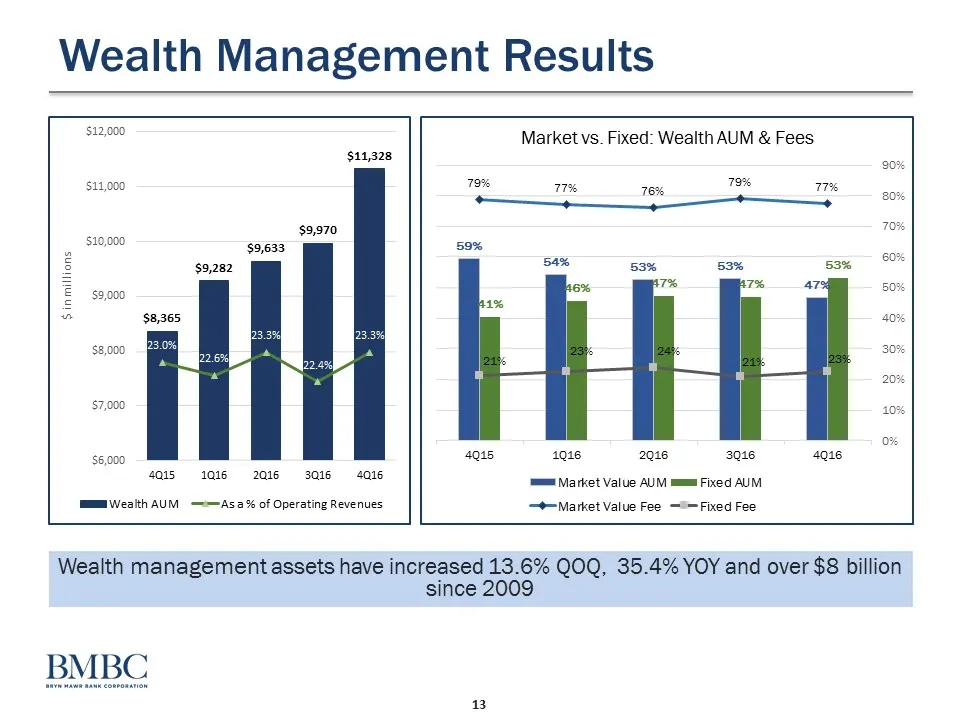
Slide 13: Wealth Management Results
Wealth Management Results $12,000 $11,328 $11,000 $10,000 $3,000 $inmillions $8,000 $7,000 $6,000 4015 1016-2016 ©3016 40 MME Wealth AUM —=—As.a% of Operating Revenues Market vs. Fixed: Wealth AUM & Fees 79% 1% 6% 79% 7% = + $e ~ 59% te 53% 53% 53% sie 7% 7% ar’ 1% agis 1916 2916 sq16 agie mmm Marke
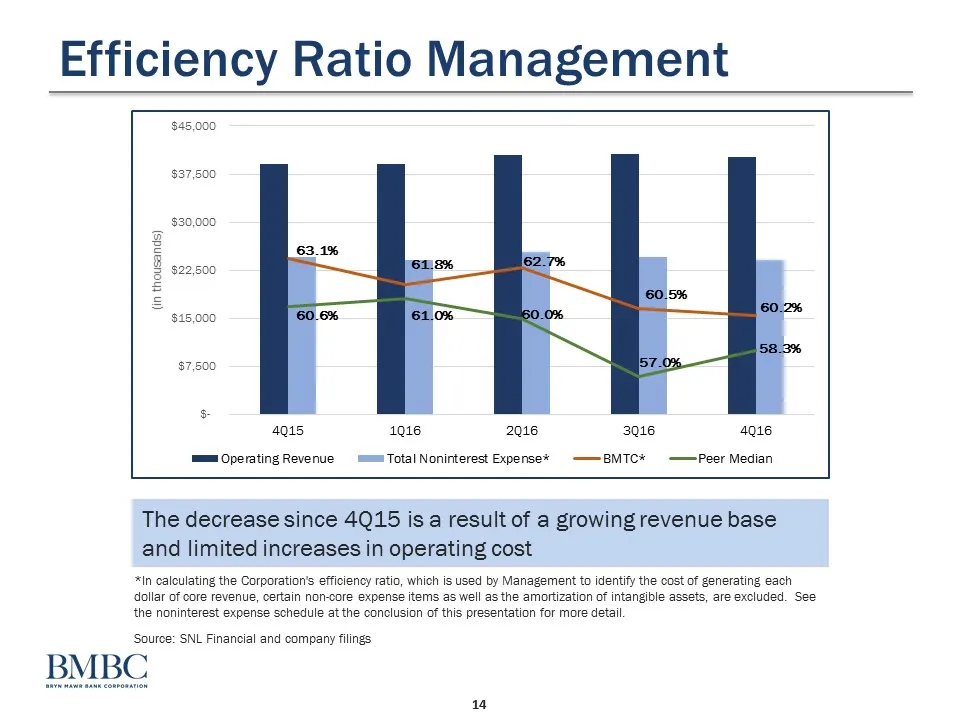
Slide 14: Efficiency Ratio Management
Efficiency Ratio Management $45,000 $37,500 4g18 1916 2916 3016 4gis mmm OperatingRevenue =m Total Noninterest Expense*¥ ——EMTC* ——Peer Median The decrease since 4Q15 is a result of a growing revenue base and limited increases in operating cost In calculating the Corporation's efficiency ratio, whic
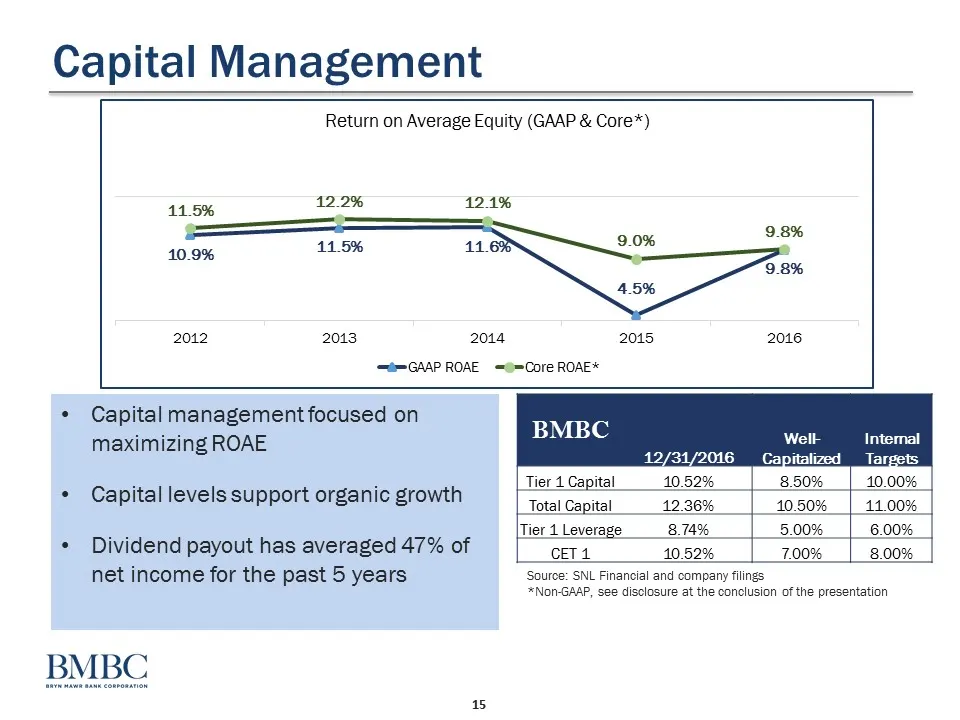
Slide 15: Capital Management
Capital Management Return on Average Equity (GAAP & Core*) 2012 2013 2014 2015 2016 O=GAAP ROAE ==Core ROAE* * Capital management focused on pen BMBC maximizing ROAE 5 : | Tier 4 Capital 10.52% | __8.50% _|_ 10.00% Capital levels support organic growth | Total Capital 12.36% | 10.50% | 11.00% a3 \Ti
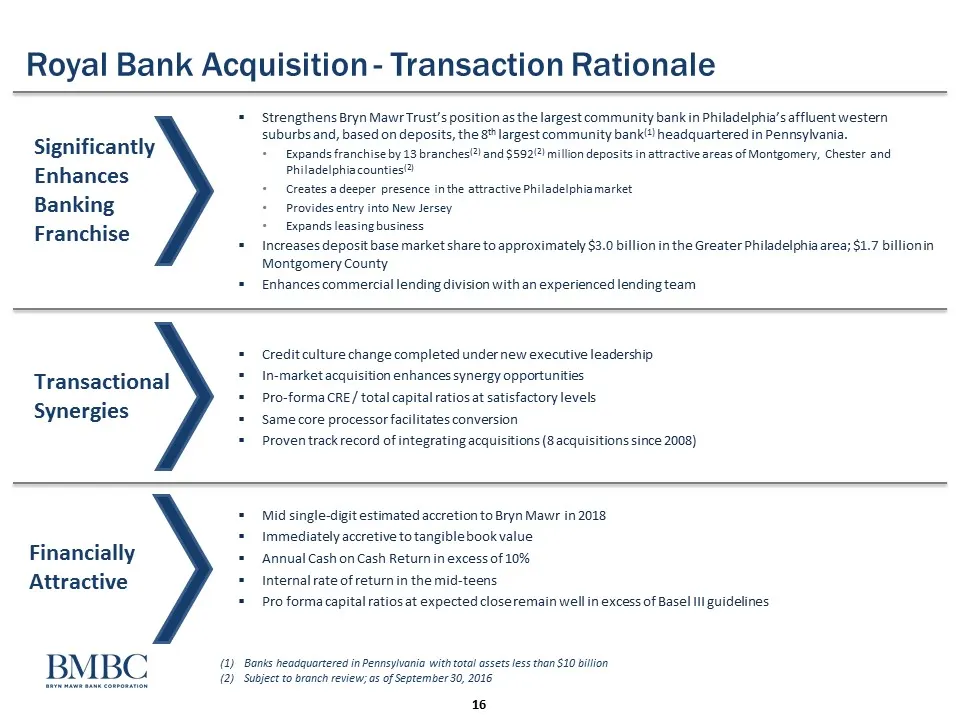
Slide 16: Royal Bank Acquisition - Transaction Rationale
Royal Bank Acquisition - Transaction Rationale + Strengthens Bryn Mawr Trust's position as the largest community bank in Philadelphia's affluent western suburbs and, based on deposits, the 8 largest community bank!!! headquartered in Pennsylvania. Significantly + Expands franchise by 13 branches and
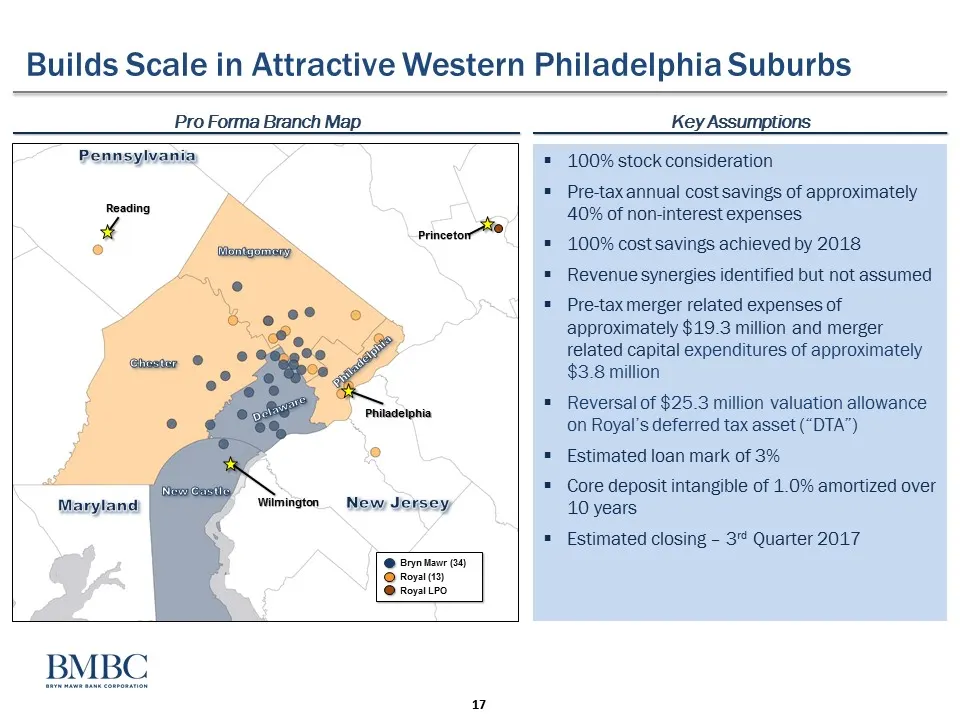
Slide 17: Builds Scale in Attractive Western Philadelphia Suburbs
Builds Scale in Attractive Western Philadelphia Suburbs Pro Forma Branch Map. Key Assumptions Pennsylvania Reading Ea Wilmington _ New Jersey \ pincer @ Bynttawr Ga) Q Foyai(t3) @ Royal Po BMBC 7 100% stock consideration Pre-tax annual cost savings of approximately 40% of non-interest expenses 100%
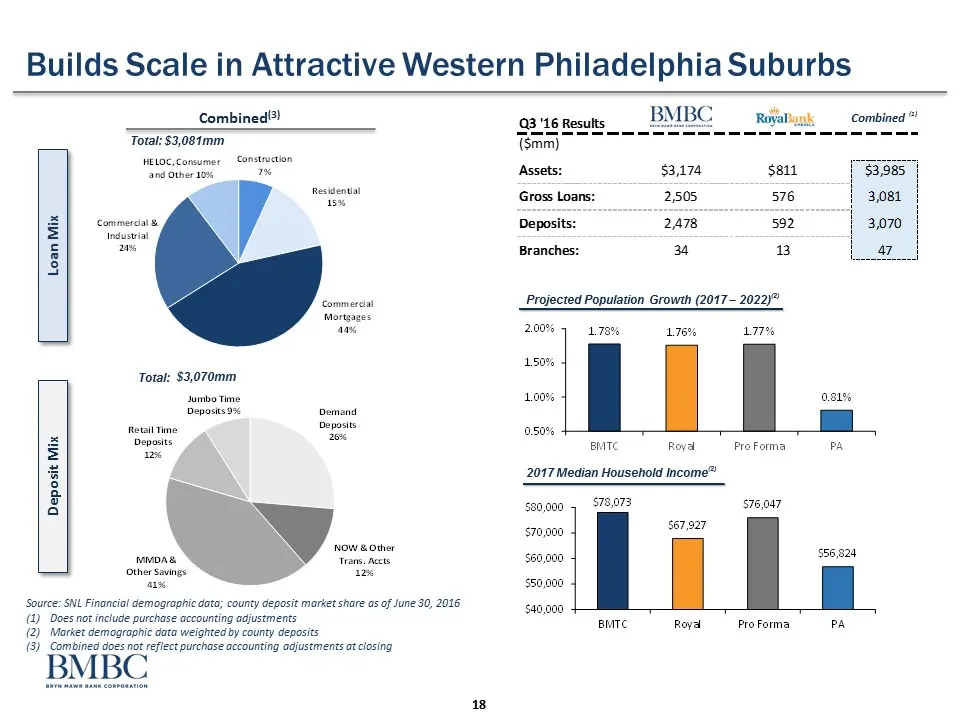
Slide 18: Builds Scale in Attractive Western Philadelphia Suburbs
Builds Scale in Attractive Western Philadelphia Suburbs Combined!) BMBC 7 Total: $3,081mm ‘and Other 10% 1% i | Residential i i 1 Commercial & Deposits: 2A78 592 | 3,070 | = Indust : ' 5 ai Branches: a4 B Lat § tonne Projected Population Growth (2017 2022)" Moruases re 1 LIT Total: $3,070mm Jumbo Ti
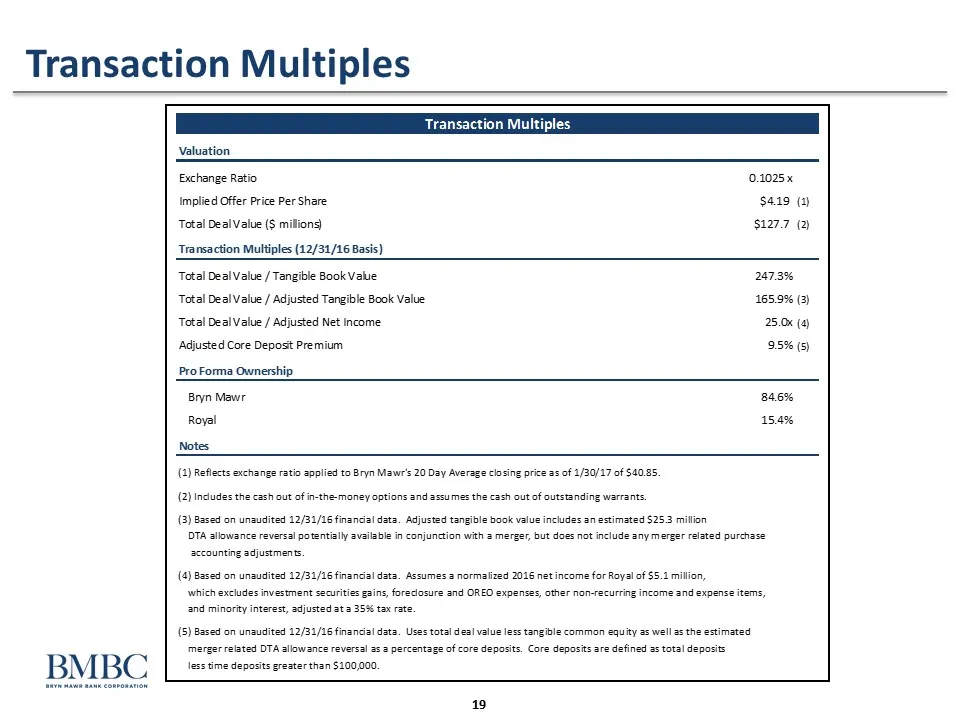
Slide 19: Transaction Multiples
Transaction Multiples Transaction Multiples Valuation Exchange Ratio 0.1025 x Implied Offer Price Per Share $419 (2) Total Deal Value ($ mi ne) $127.7 (2 Transaction Multiples (12/34/16 Basis) Total Deal Value / Tangible Book Value 247.3% Total Deal Value / Adjusted Tangible Book Value 165.9% (3) To
Slide 20: Forward Looking Statements and Safe Harbor
Forward Looking Statements and Safe Harbor ‘This presentation obriains statements which, tothe ecentihat they are not rectations of historical act may constitute forwardloo}ing statements for purposes ofthe Seourties tof 4933, as amended, and the Securties Exchange Actof 1934, 9s amended. Such fonva
Slide 21: Peer Companies
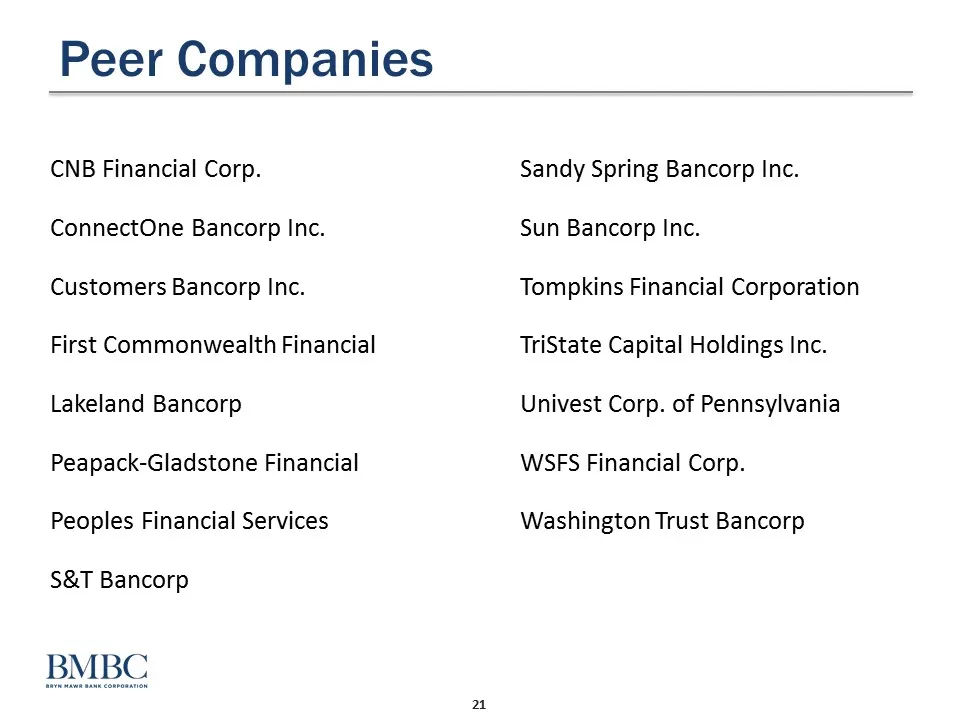
Peer Companies CNB Financial Corp. ConnectOne Bancorp Inc. Customers Bancorp Inc. First Commonwealth Financial Lakeland Bancorp Peapack-Gladstone Financial Peoples Financial Services S&T Bancorp BMBC 21 Sandy Spring Bancorp Inc. Sun Bancorp Inc. Tompkins Financial Corporation TriState Capital Holdin
Slide 22: Non GAAP Measures
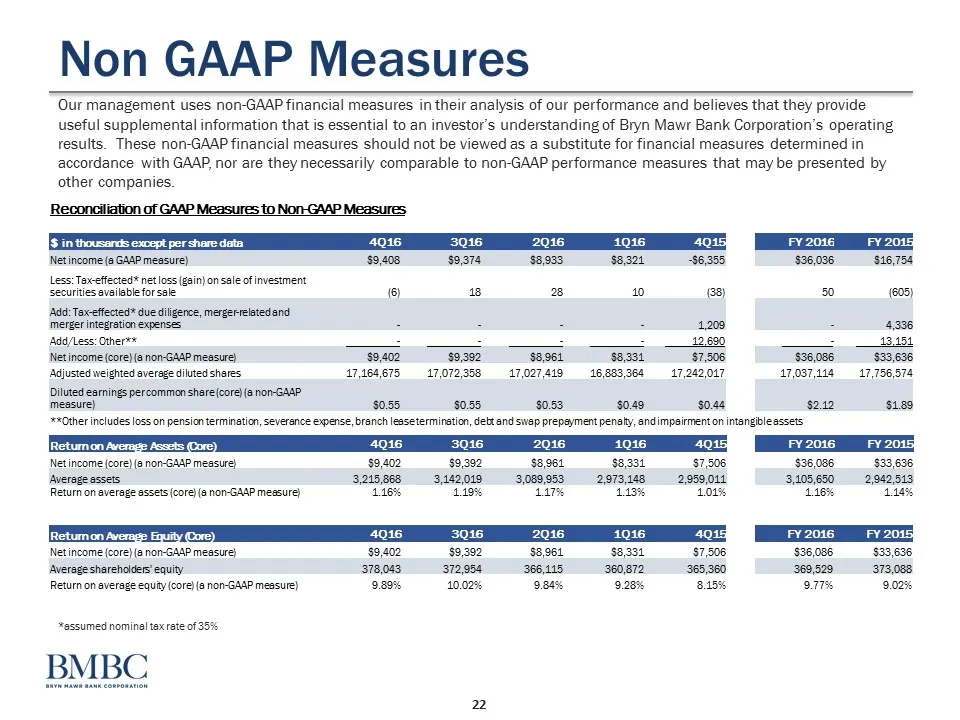
Non GAAP Measures Our management uses non-GAAP financial measures in their analysis of our performance and believes that they provide useful supplemental information that is essential to an investor's understanding of Bryn Mawr Bank Corporation's operating results. These non-GAAP financial measures
Slide 23: Non GAAP Measures
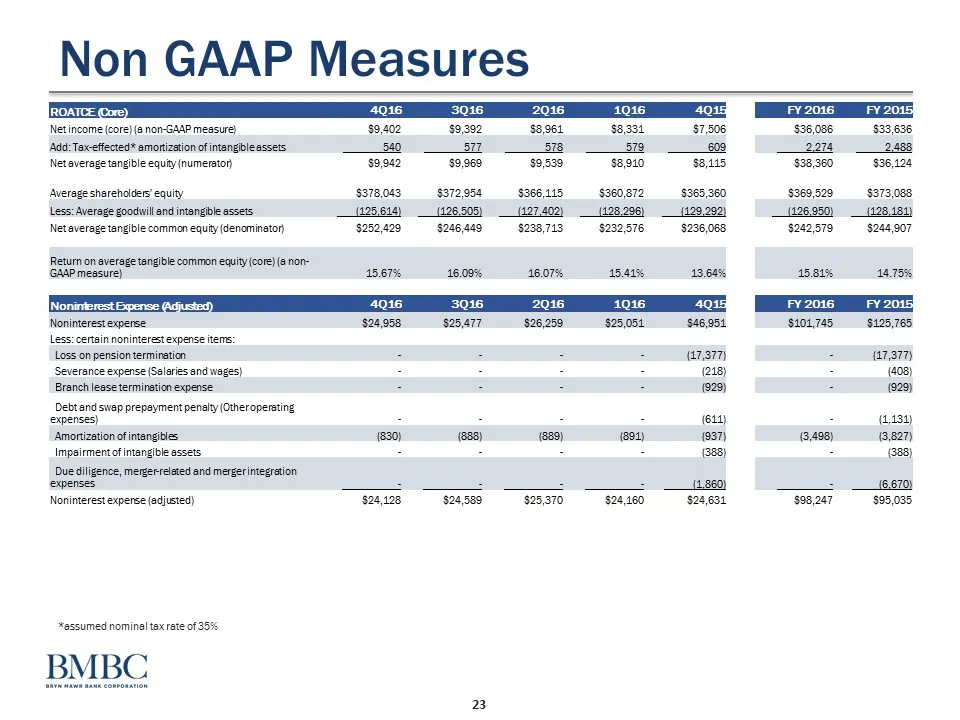
Non GAAP Measures ROATCE 4016 Er 2016 1016 FY2016 _FY203 Net income (core) (s non-GAAP messure) $9,402 $9,392 $8,961 $3,331 $6086 $33,636, ‘Add: Tax-effected* amonization of intangblesssets 540 ot 518 519 2274 2488 Netaverage tangible equty (numerator) $9,942 $9,969 $9,539 $8,910 $38,360 $36,124 Ave
Slide 24: Non GAAP Measures
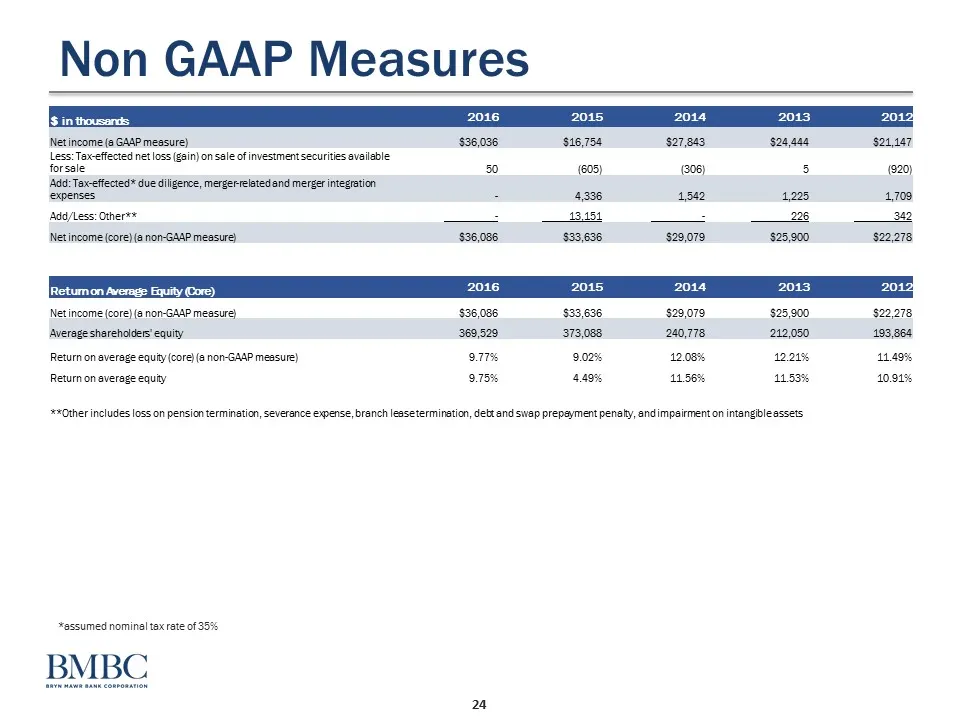
Non GAAP Measures '$ in thousands 2016 2015 2014 2013 2017) Netincome(a GAAP measure) $96,038 $16,754 $27,843, $24,488 $24,187 Less: Taceffected net loss (gain) on sale of investment securities avaliable forsale 30 (608) (306) 5 (920) |Add: Taxeffected due diligence, mergertelatedand merger integrat
Source: SEC EDGAR · 8-K filed Feb 3, 2017
More decks from Bryn Mawr Bank Corporation
 Merger or Acquisition (March 2021)20 slides · Mar 10, 2021
 Q4 2020 Earnings Presentation16 slides · Jan 22, 2021
 Q3 2020 Earnings Presentation14 slides · Oct 23, 2020
 Investor Presentation (September 2020)17 slides · Sep 21, 2020
 Q2 2020 Earnings Presentation14 slides · Jul 21, 2020
 Q1 2020 Earnings Presentation13 slides · Apr 21, 2020