Bryn Mawr Bank — Q1 2020 Earnings Presentation
13 slides from Bryn Mawr Bank's earnings presentation, Apr 21, 2020
Slide 1: First Quarter 2020 Earnings Review
First Quarter 2020 Earnings Review Frank Leto Mike Harrington Liam Brickley President and Chief Financial Officer Chief Credit Officer Chief Executive Officer
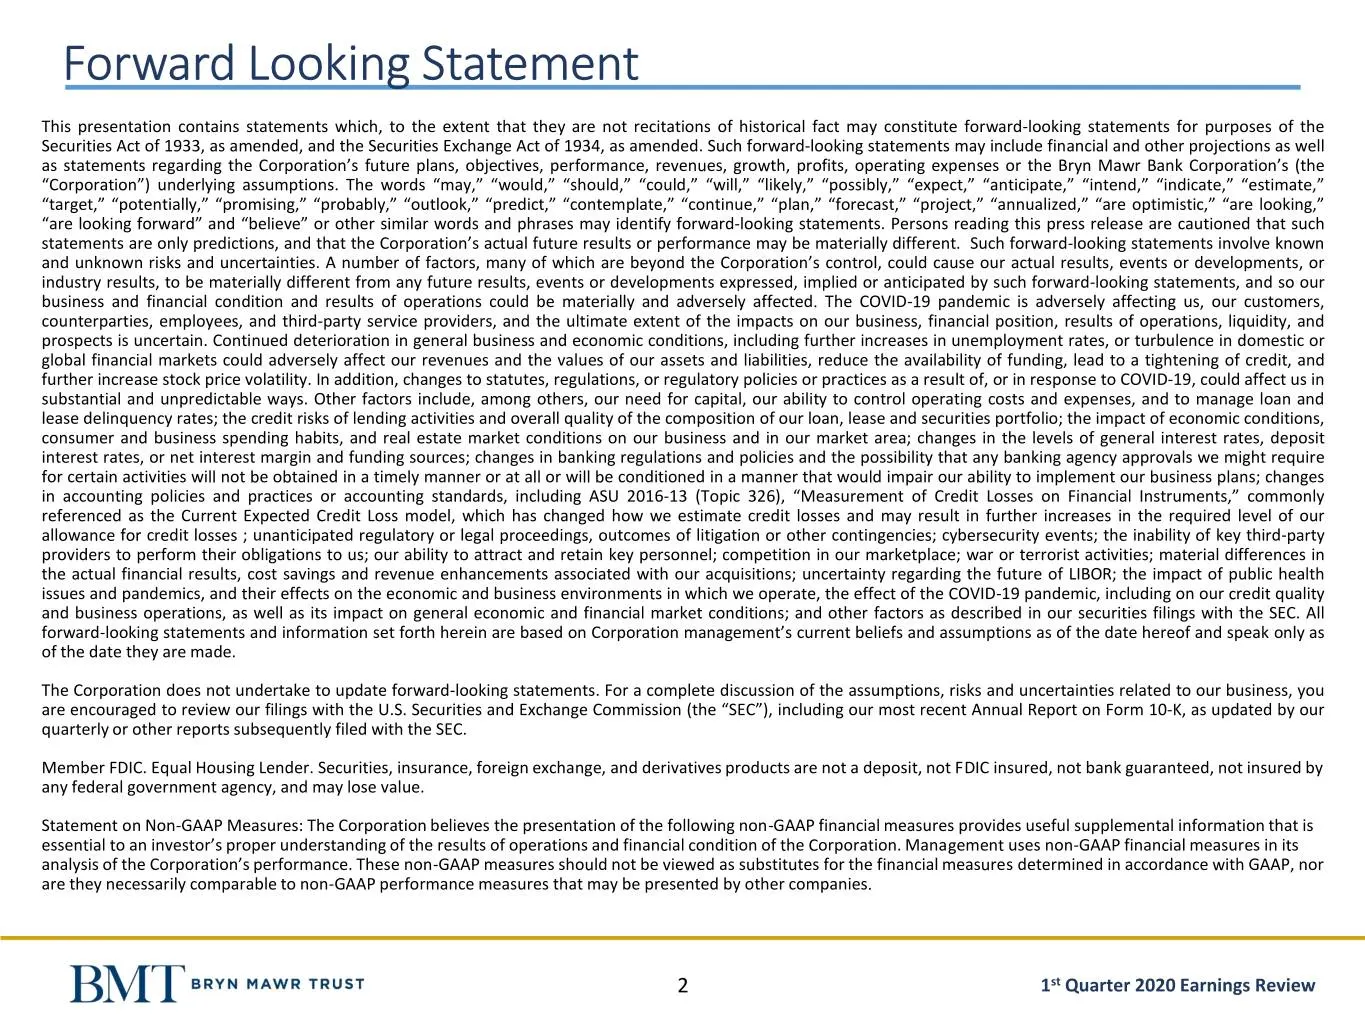
Slide 2: Forward Looking Statement
Forward Looking Statement This presentation contains statements which, to the extent that they are not recitations of historical fact may constitute forward-looking statements for purposes of the Securities Act of 1933, as amended, and the Securities Exchange Act of 1934, as amended. Such forward-lo
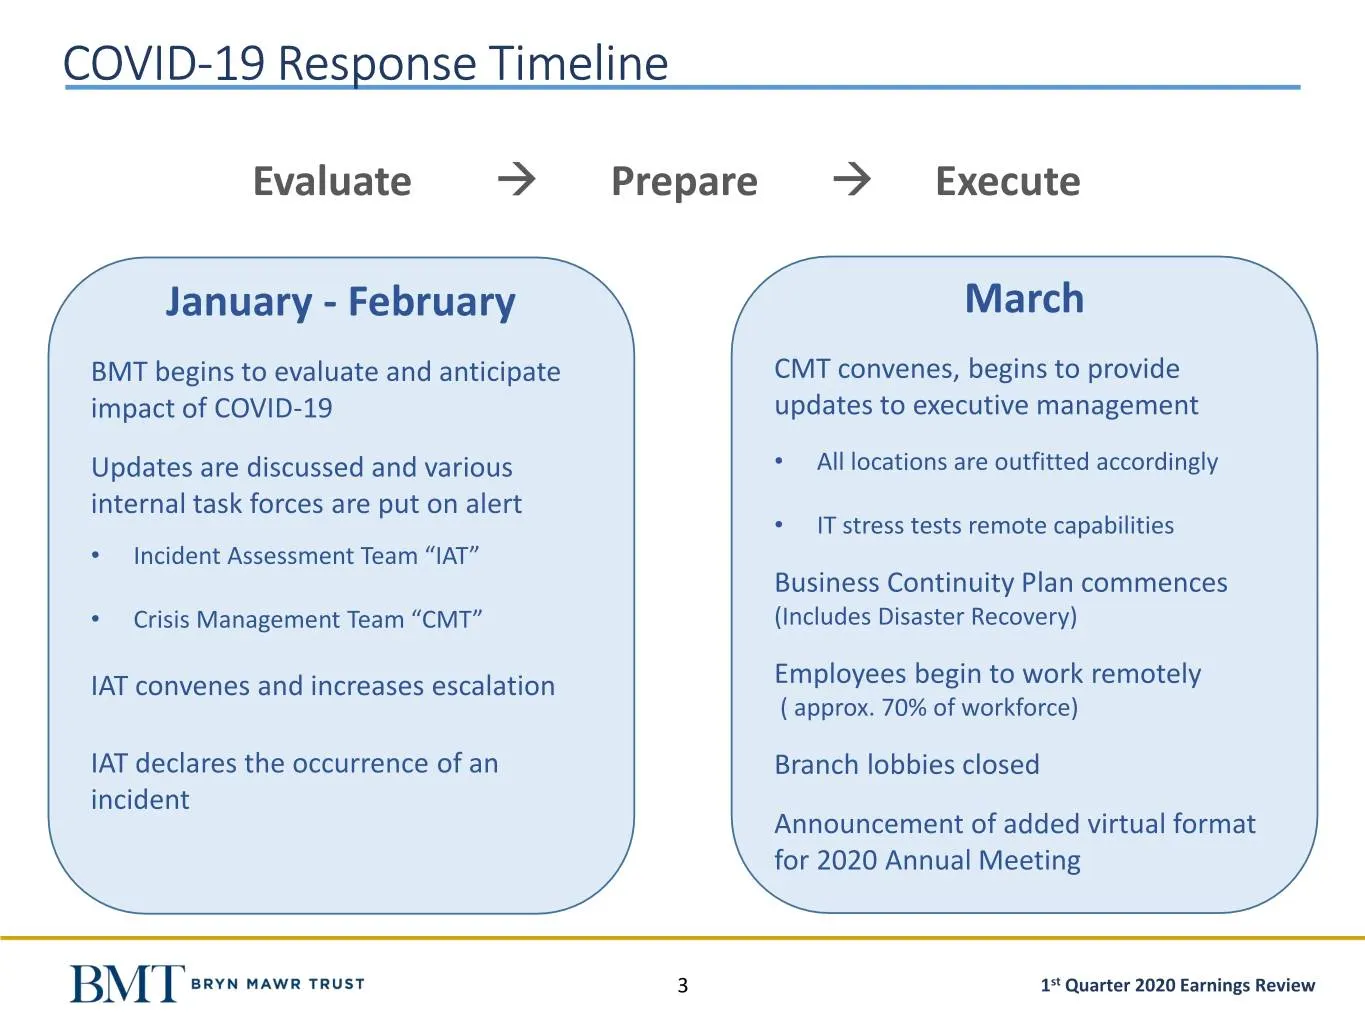
Slide 3: COVID-19 Response Timeline
COVID-19 Response Timeline Evaluate → Prepare → Execute January - February March BMT begins to evaluate and anticipate CMT convenes, begins to provide impact of COVID-19 updates to executive management Updates are discussed and various • All locations are outfitted accordingly internal task forces a
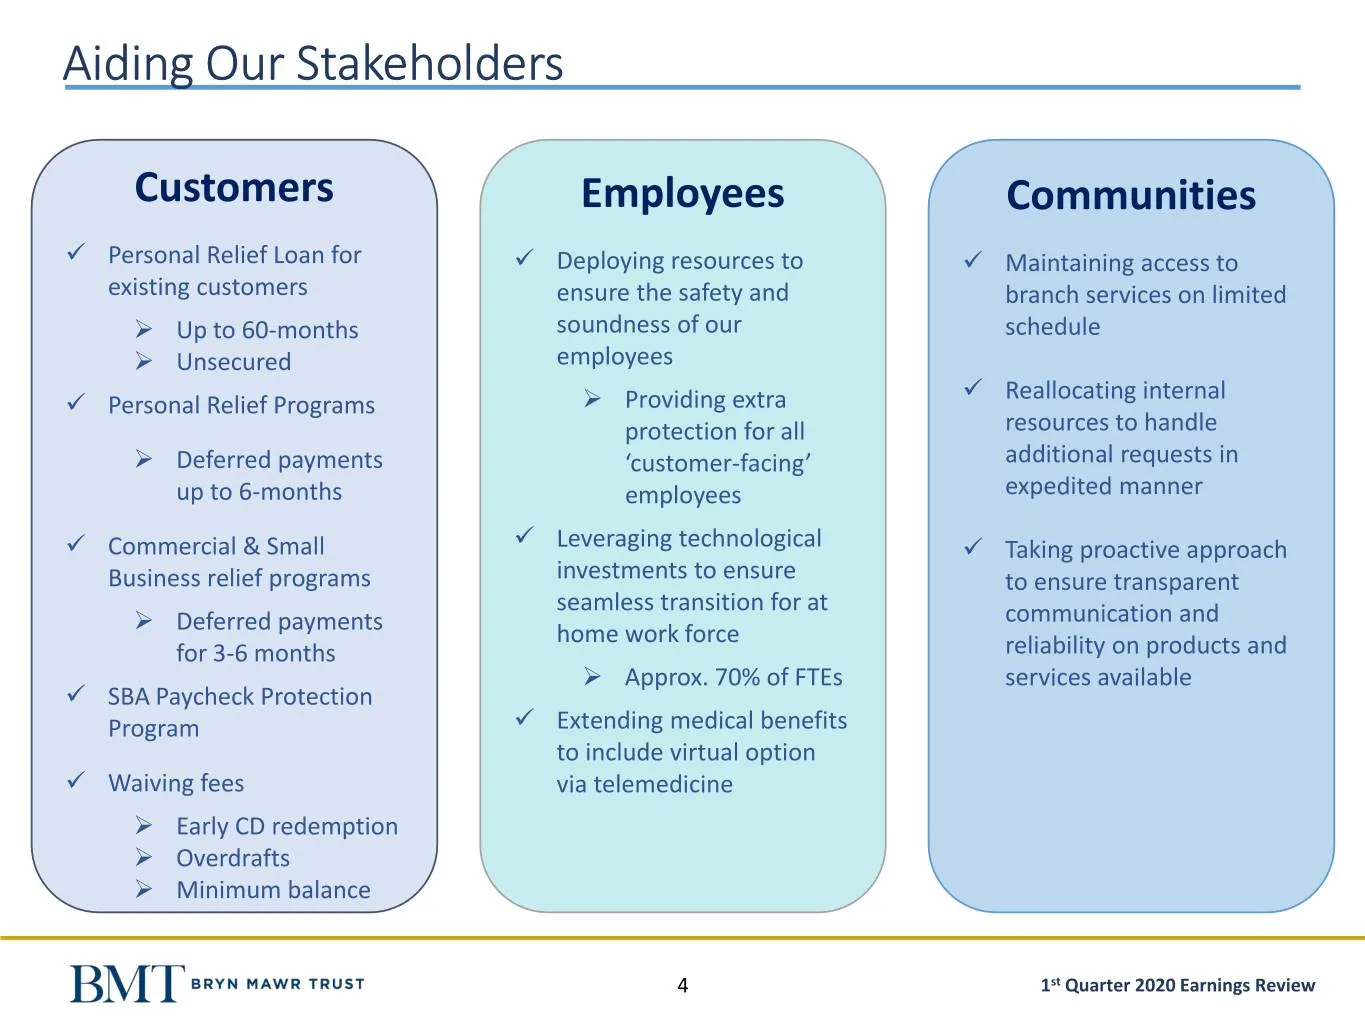
Slide 4: Aiding Our Stakeholders
Aiding Our Stakeholders Customers Employees Communities ✓ Personal Relief Loan for ✓ Deploying resources to ✓ Maintaining access to existing customers ensure the safety and branch services on limited ➢ Up to 60-months soundness of our schedule ➢ Unsecured employees ✓ Reallocating internal ✓ Personal
Slide 5: Identifying Top Risk Areas
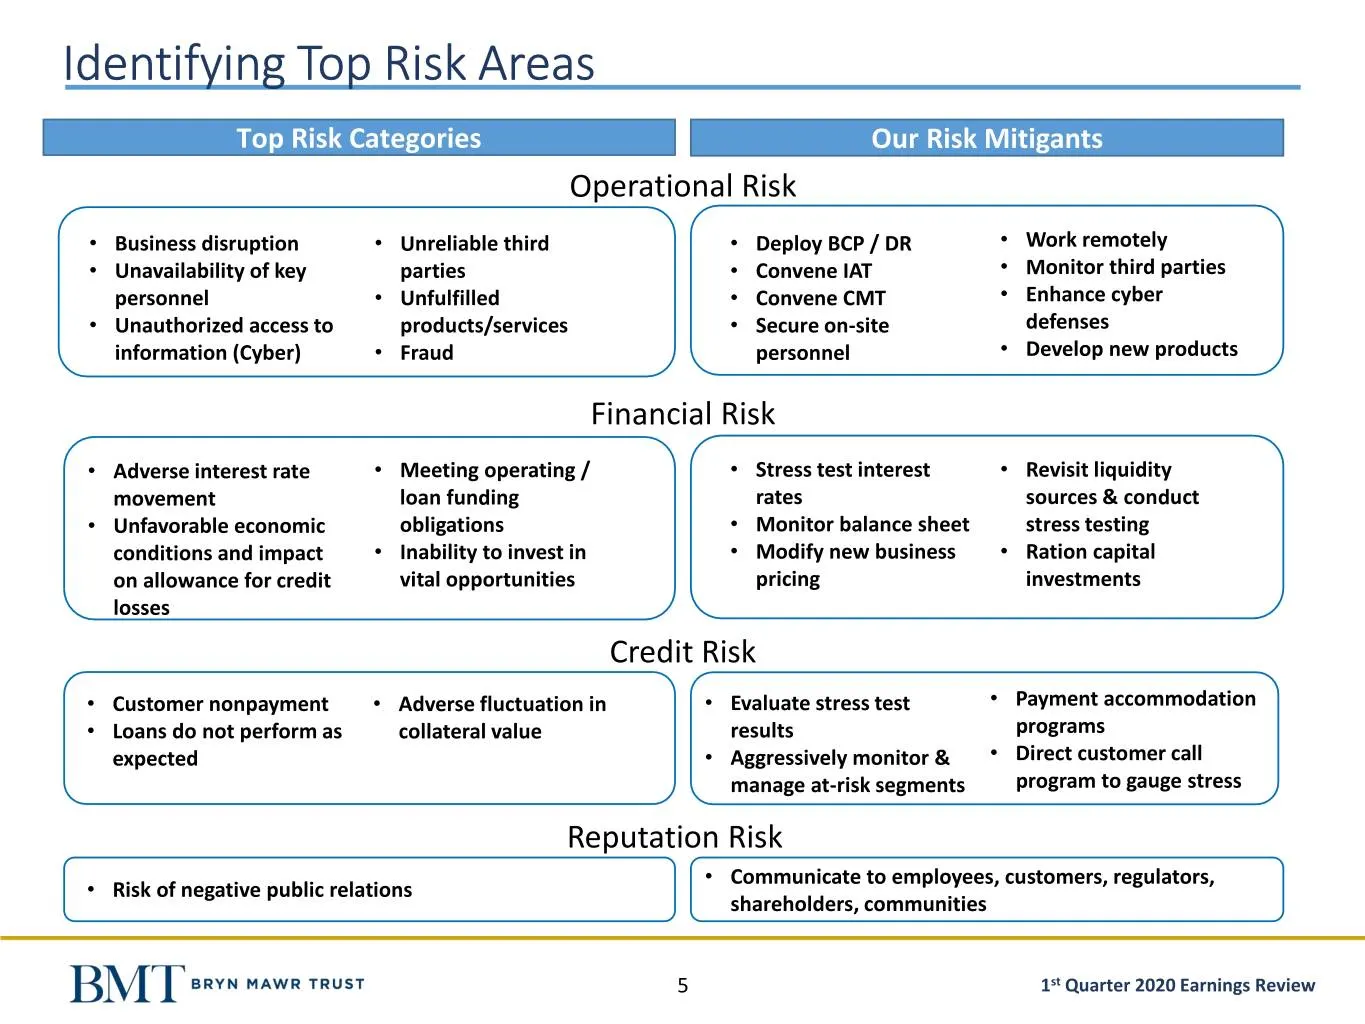
Identifying Top Risk Areas Top Risk Categories Our Risk Mitigants Operational Risk • Business disruption • Unreliable third • Deploy BCP / DR • Work remotely • Unavailability of key parties • Convene IAT • Monitor third parties personnel • Unfulfilled • Convene CMT • Enhance cyber • Unauthorized acc
Slide 6: 1st Quarter 2020 Results
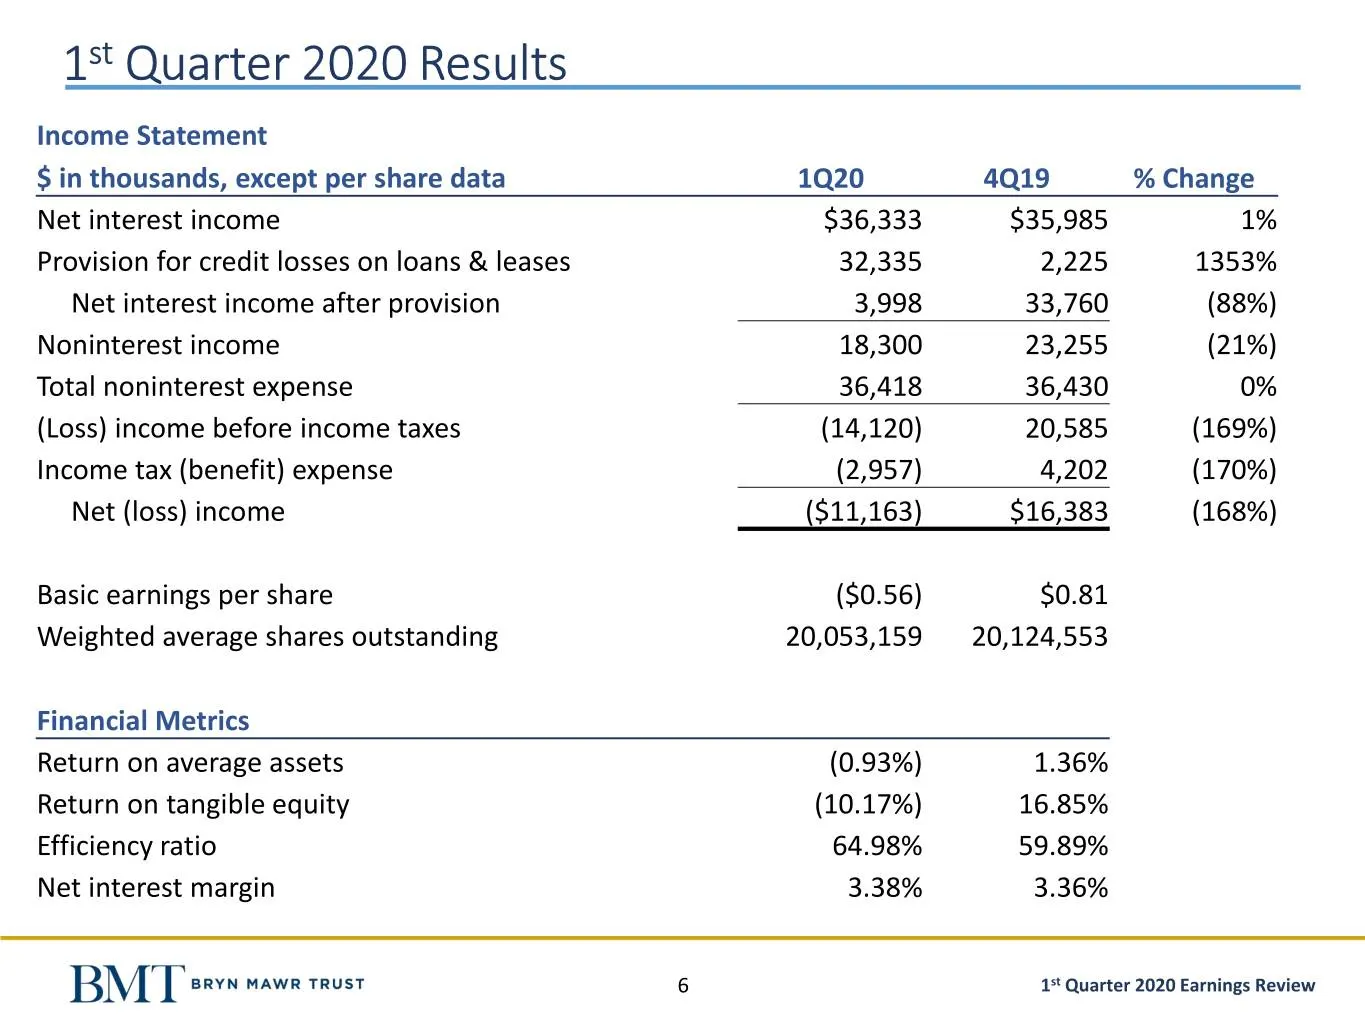
1st Quarter 2020 Results Income Statement $ in thousands, except per share data 1Q20 4Q19 % Change Net interest income $36,333 $35,985 1% Provision for credit losses on loans & leases 32,335 2,225 1353% Net interest income after provision 3,998 33,760 (88%) Noninterest income 18,300 23,255 (21%) Tot
Slide 7: Balance Sheet - Liquidity - Capital
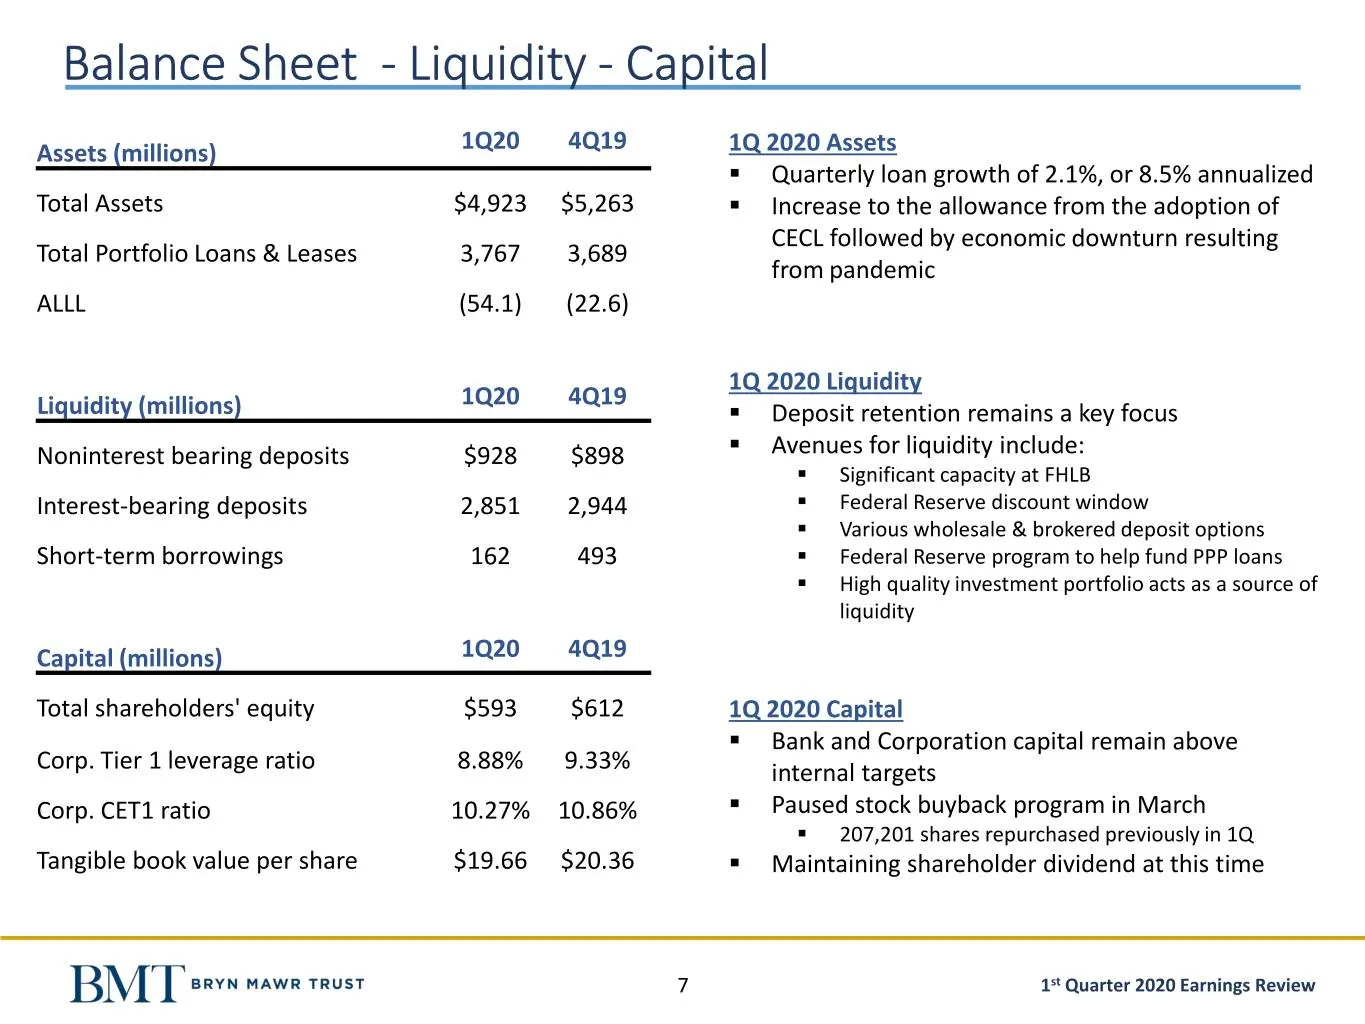
Balance Sheet - Liquidity - Capital Assets (millions) 1Q20 4Q19 1Q 2020 Assets ▪ Quarterly loan growth of 2.1%, or 8.5% annualized Total Assets $4,923 $5,263 ▪ Increase to the allowance from the adoption of CECL followed by economic downturn resulting Total Portfolio Loans & Leases 3,767 3,689 from
Slide 8: Asset Quality
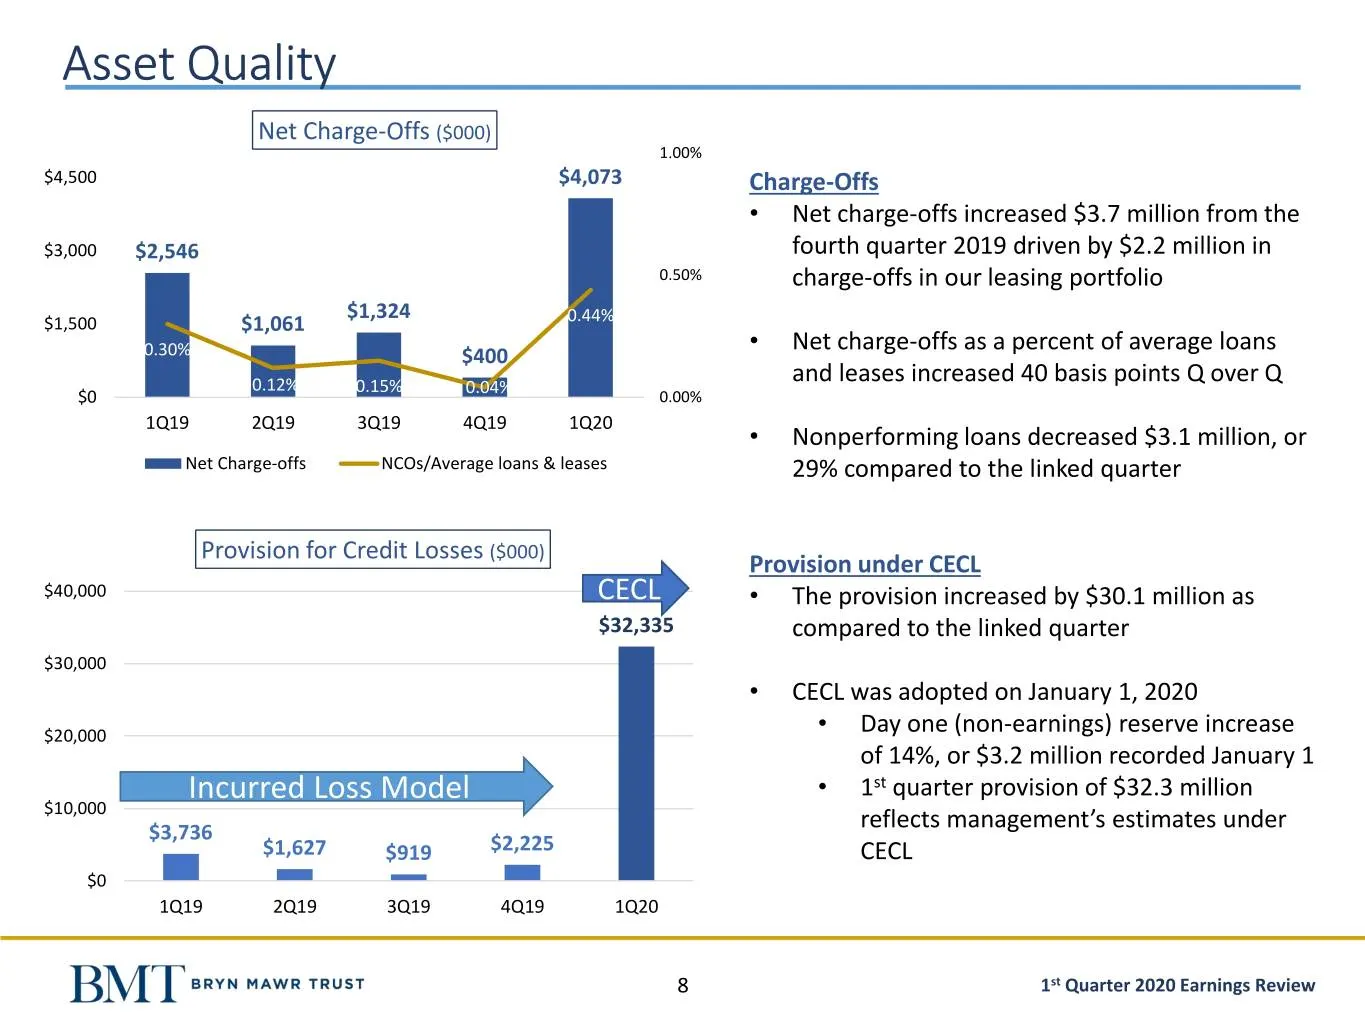
Asset Quality Net Charge-Offs ($000) 1.00% $4,500 $4,073 Charge-Offs • Net charge-offs increased $3.7 million from the $3,000 $2,546 fourth quarter 2019 driven by $2.2 million in 0.50% charge-offs in our leasing portfolio $1,324 $1,500 $1,061 0.44% Net charge-offs as a percent of average loans 0.30%
Slide 9: CECL Implementation and 1st Quarter Increase
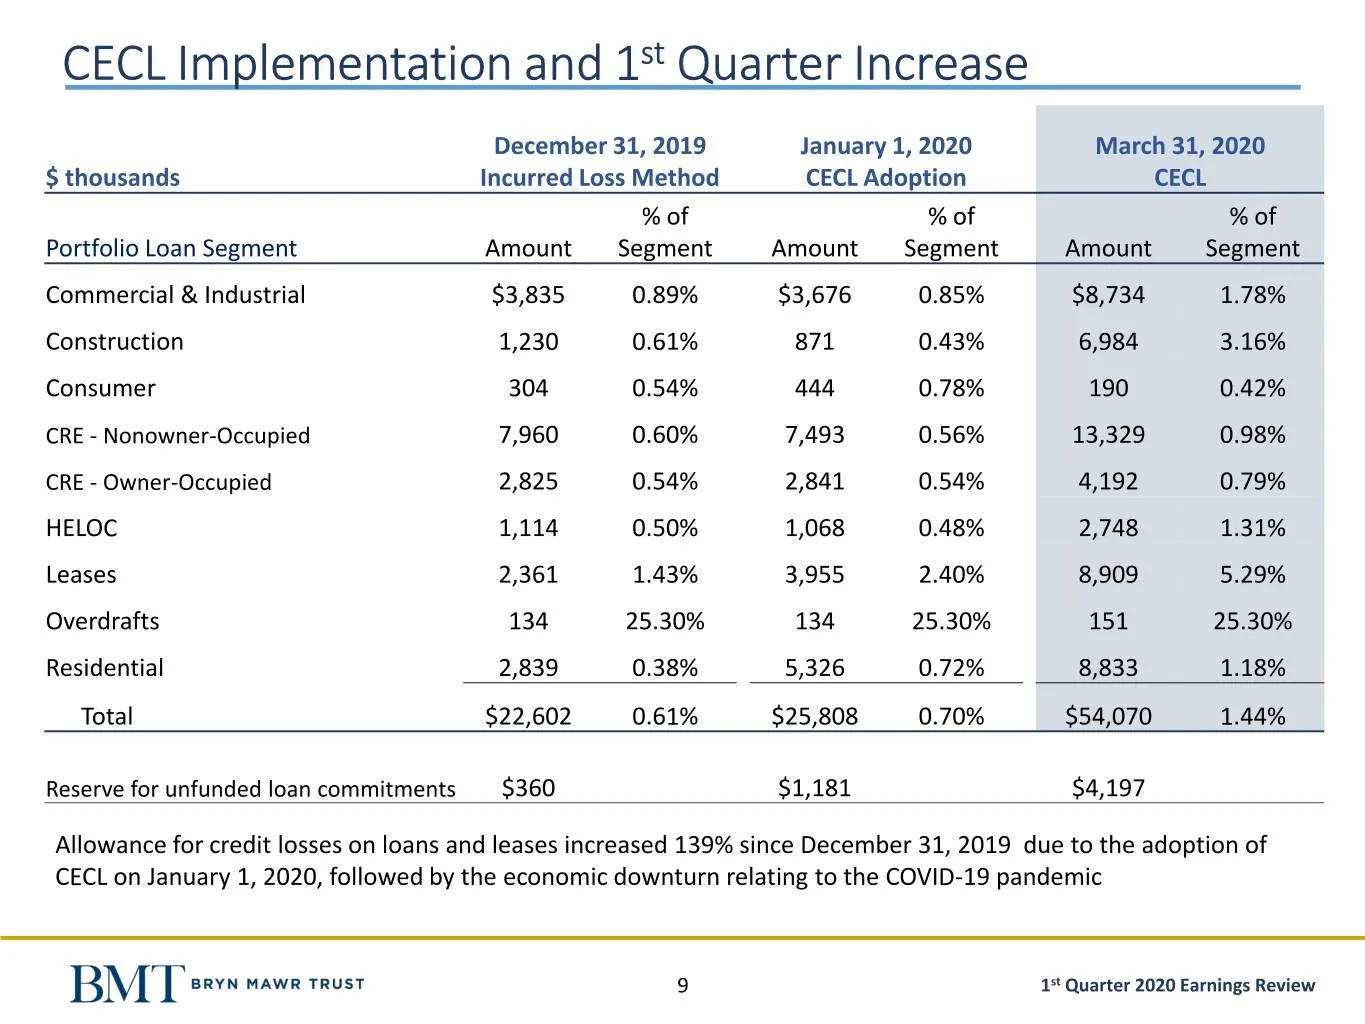
CECL Implementation and 1st Quarter Increase December 31, 2019 January 1, 2020 March 31, 2020 $ thousands Incurred Loss Method CECL Adoption CECL % of % of % of Portfolio Loan Segment Amount Segment Amount Segment Amount Segment Commercial & Industrial $3,835 0.89% $3,676 0.85% $8,734 1.78% Construc
Slide 10: Loan Portfolio Segments
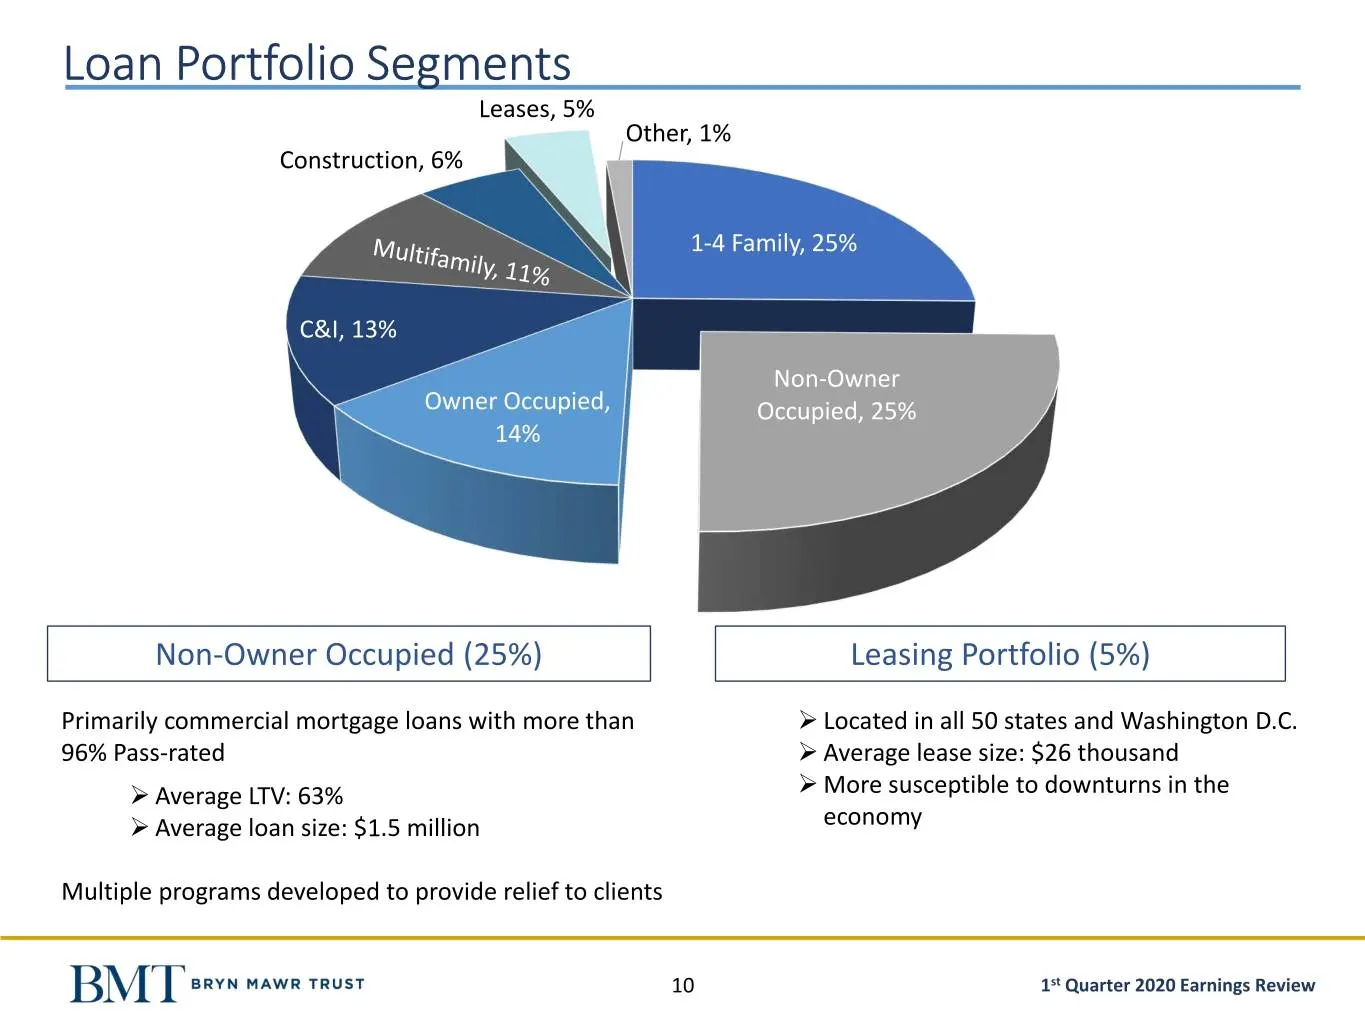
Loan Portfolio Segments Leases, 5% Other, 1% Construction, 6% 1-4 Family, 25% C&I, 13% Non-Owner Owner Occupied, Occupied, 25% 14% Non-Owner Occupied (25%) Leasing Portfolio (5%) Primarily commercial mortgage loans with more than ➢ Located in all 50 states and Washington D.C. 96% Pass-rated ➢ Averag
Slide 11: BMT Loan Assistance Programs
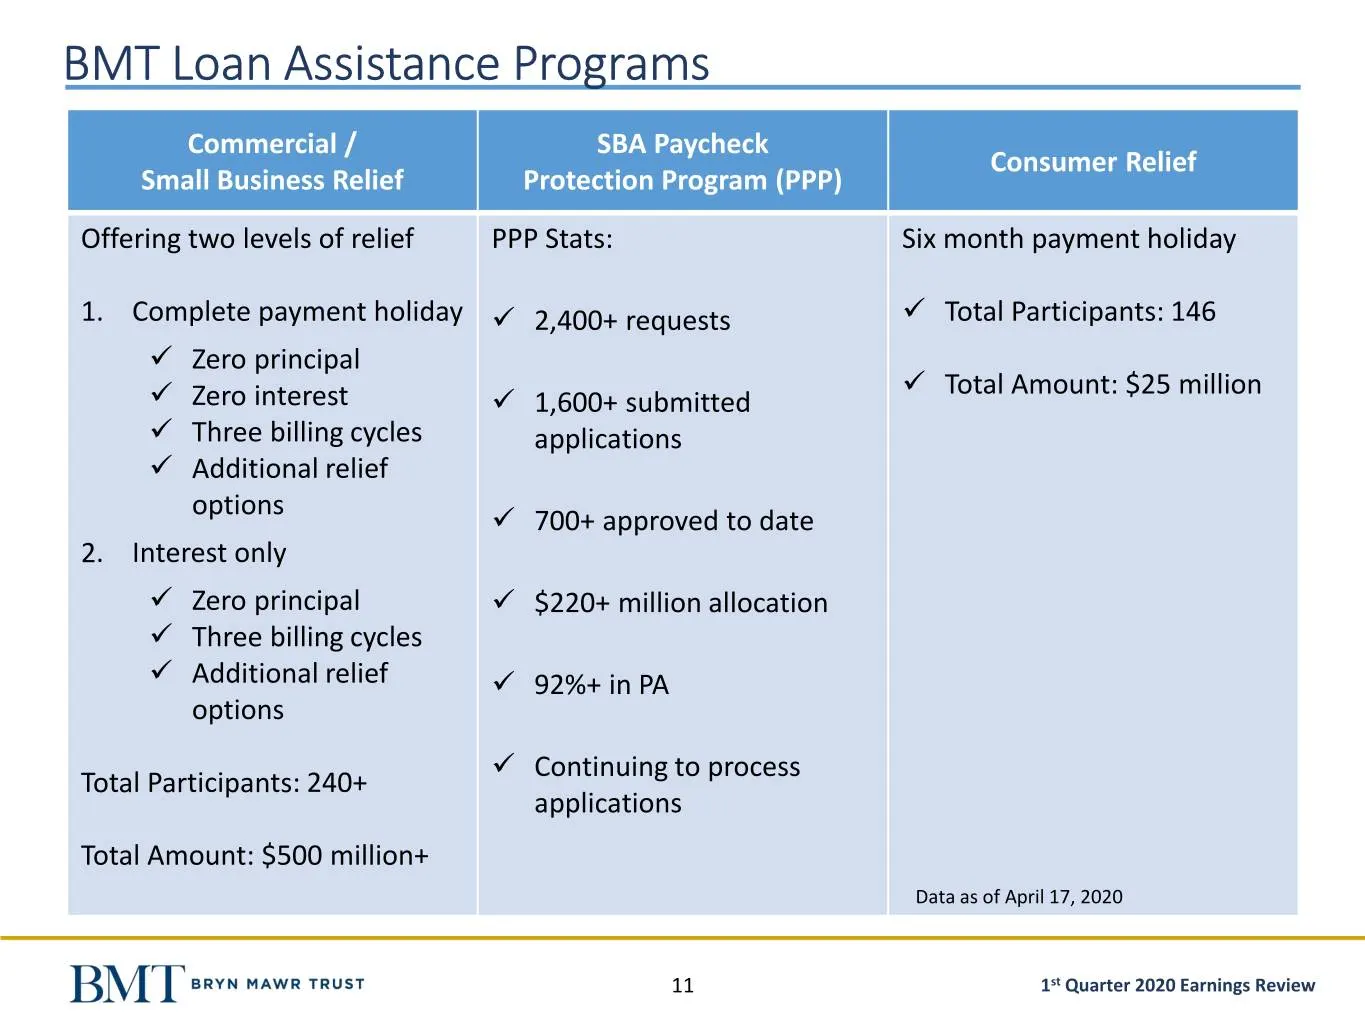
BMT Loan Assistance Programs Commercial / SBA Paycheck Consumer Relief Small Business Relief Protection Program (PPP) Offering two levels of relief PPP Stats: Six month payment holiday 1. Complete payment holiday ✓ 2,400+ requests ✓ Total Participants: 146 ✓ Zero principal ✓ Total Amount: $25 millio
Slide 12: Specialized Sector Exposures
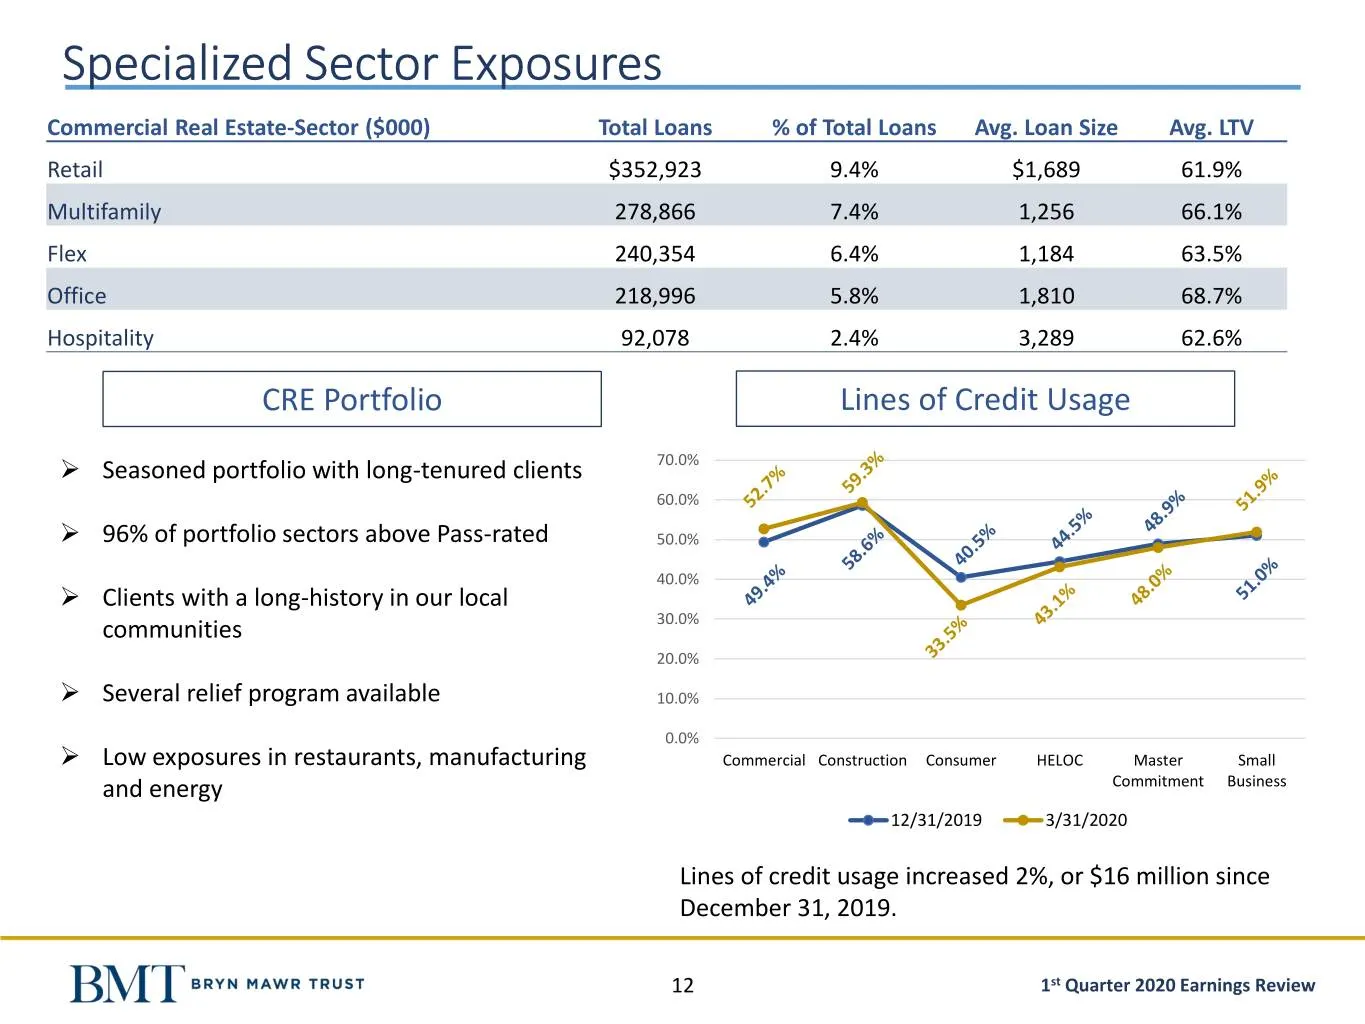
Specialized Sector Exposures Commercial Real Estate-Sector ($000) Total Loans % of Total Loans Avg. Loan Size Avg. LTV Retail $352,923 9.4% $1,689 61.9% Multifamily 278,866 7.4% 1,256 66.1% Flex 240,354 6.4% 1,184 63.5% Office 218,996 5.8% 1,810 68.7% Hospitality 92,078 2.4% 3,289 62.6% CRE Portfoli
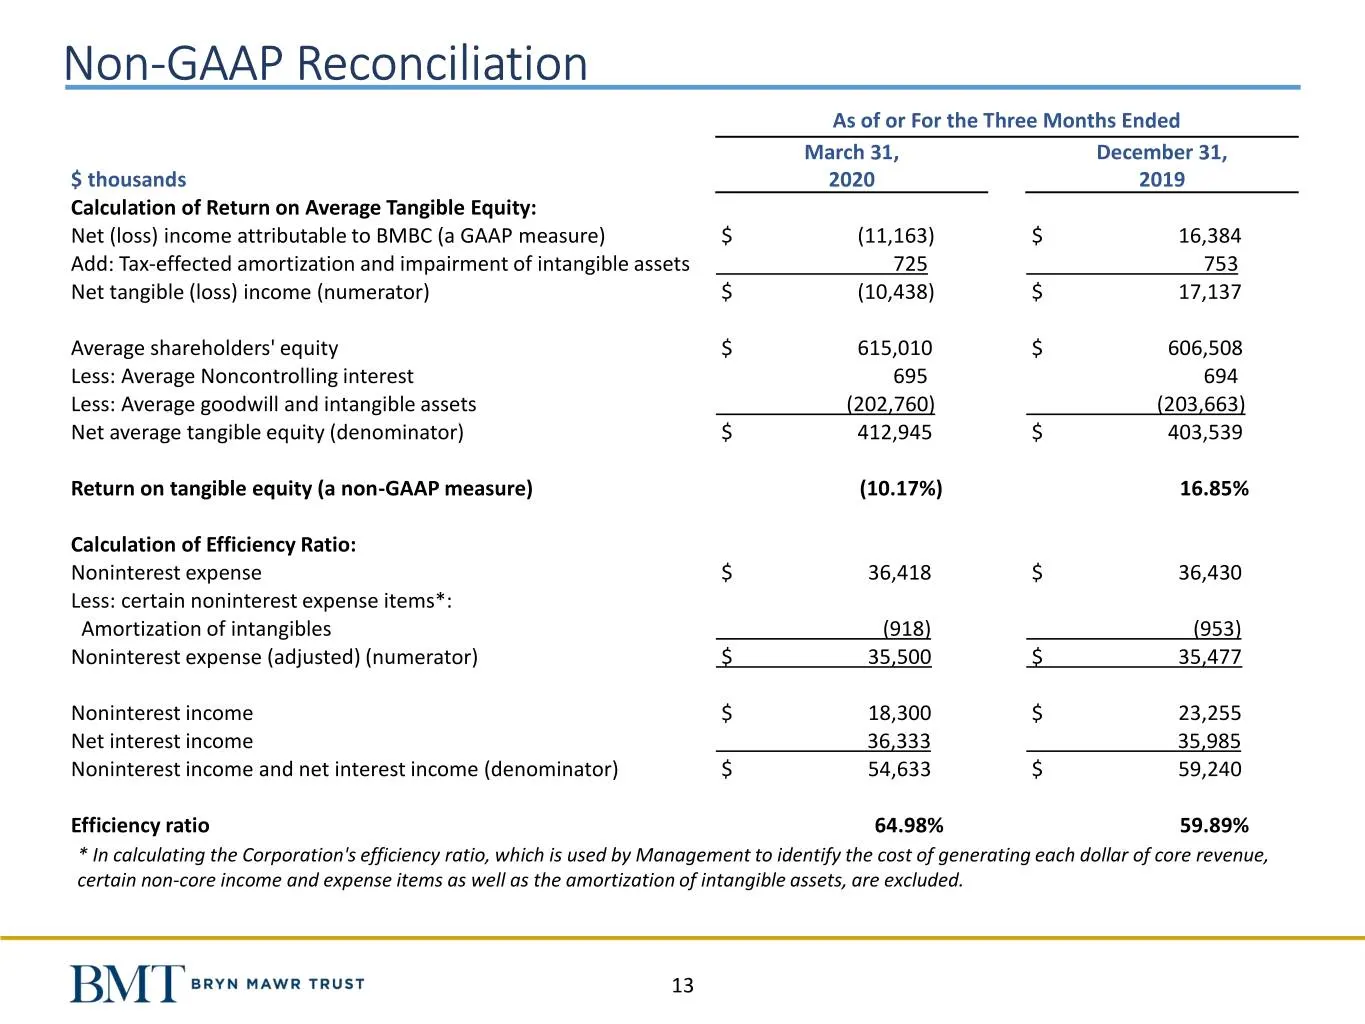
Slide 13: Non-GAAP Reconciliation
Non-GAAP Reconciliation As of or For the Three Months Ended March 31, December 31, $ thousands 2020 2019 Calculation of Return on Average Tangible Equity: Net (loss) income attributable to BMBC (a GAAP measure) $ (11,163) $ 16,384 Add: Tax-effected amortization and impairment of intangible assets 72
Source: SEC EDGAR · 8-K filed Apr 21, 2020
More decks from Bryn Mawr Bank Corporation
 Merger or Acquisition (March 2021)20 slides · Mar 10, 2021
 Q4 2020 Earnings Presentation16 slides · Jan 22, 2021
 Q3 2020 Earnings Presentation14 slides · Oct 23, 2020
 Investor Presentation (September 2020)17 slides · Sep 21, 2020
 Q2 2020 Earnings Presentation14 slides · Jul 21, 2020
 Q4 2019 Earnings Presentation36 slides · Feb 12, 2020