Nexi S.p.A. · MIL:NEXI
Nexi — FY2019 Earnings Presentation
28 slides from Nexi's earnings presentation, Feb 12, 2020
Slide 1: FY 2019 Preliminary Results
nexi FY 2019 Preliminary Results February 12th, 2020 1
Slide 2: Disclaimer
Disclaimer This Presentation may contain written and oral “forward-looking statements”, which includes all statements that do not relate solely to historical or current facts and which are therefore inherently uncertain. All forward-looking statements rely on a number of assumptions, expectations,
Slide 3: Executive Summary
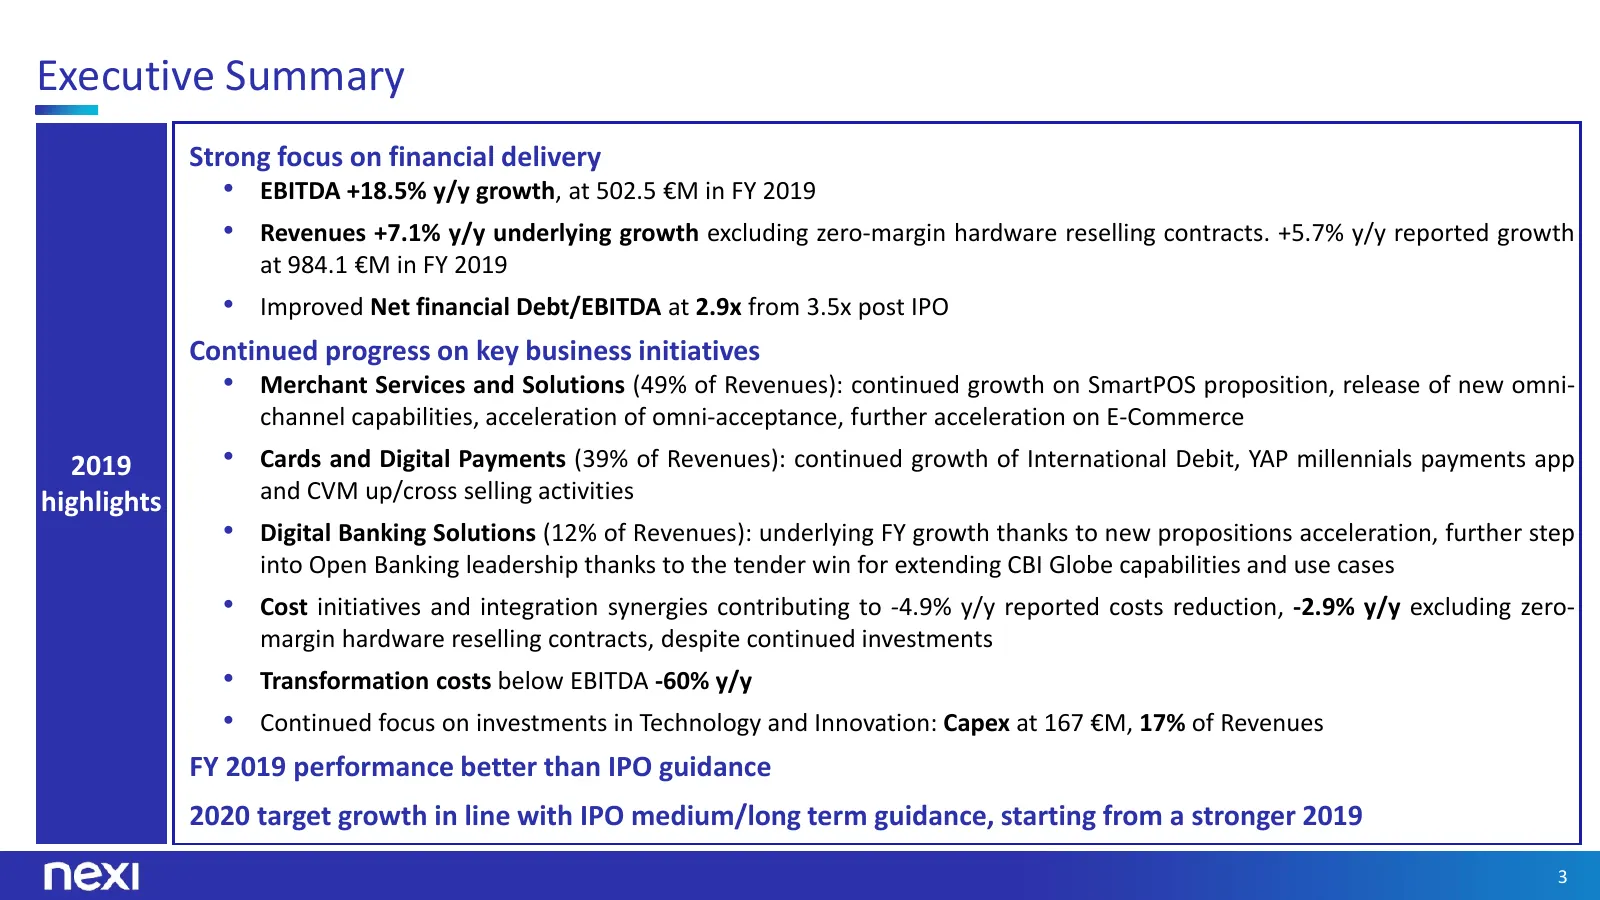
Executive Summary Strong focus on financial delivery • EBITDA +18.5% y/y growth, at 502.5 €M in FY 2019 • Revenues +7.1% y/y underlying growth excluding zero-margin hardware reselling contracts. +5.7% y/y reported growth at 984.1 €M in FY 2019 • Improved Net financial Debt/EBITDA at 2.9x from 3.5x p
Slide 4: Healthy Revenue growth and strong EBITDA performance
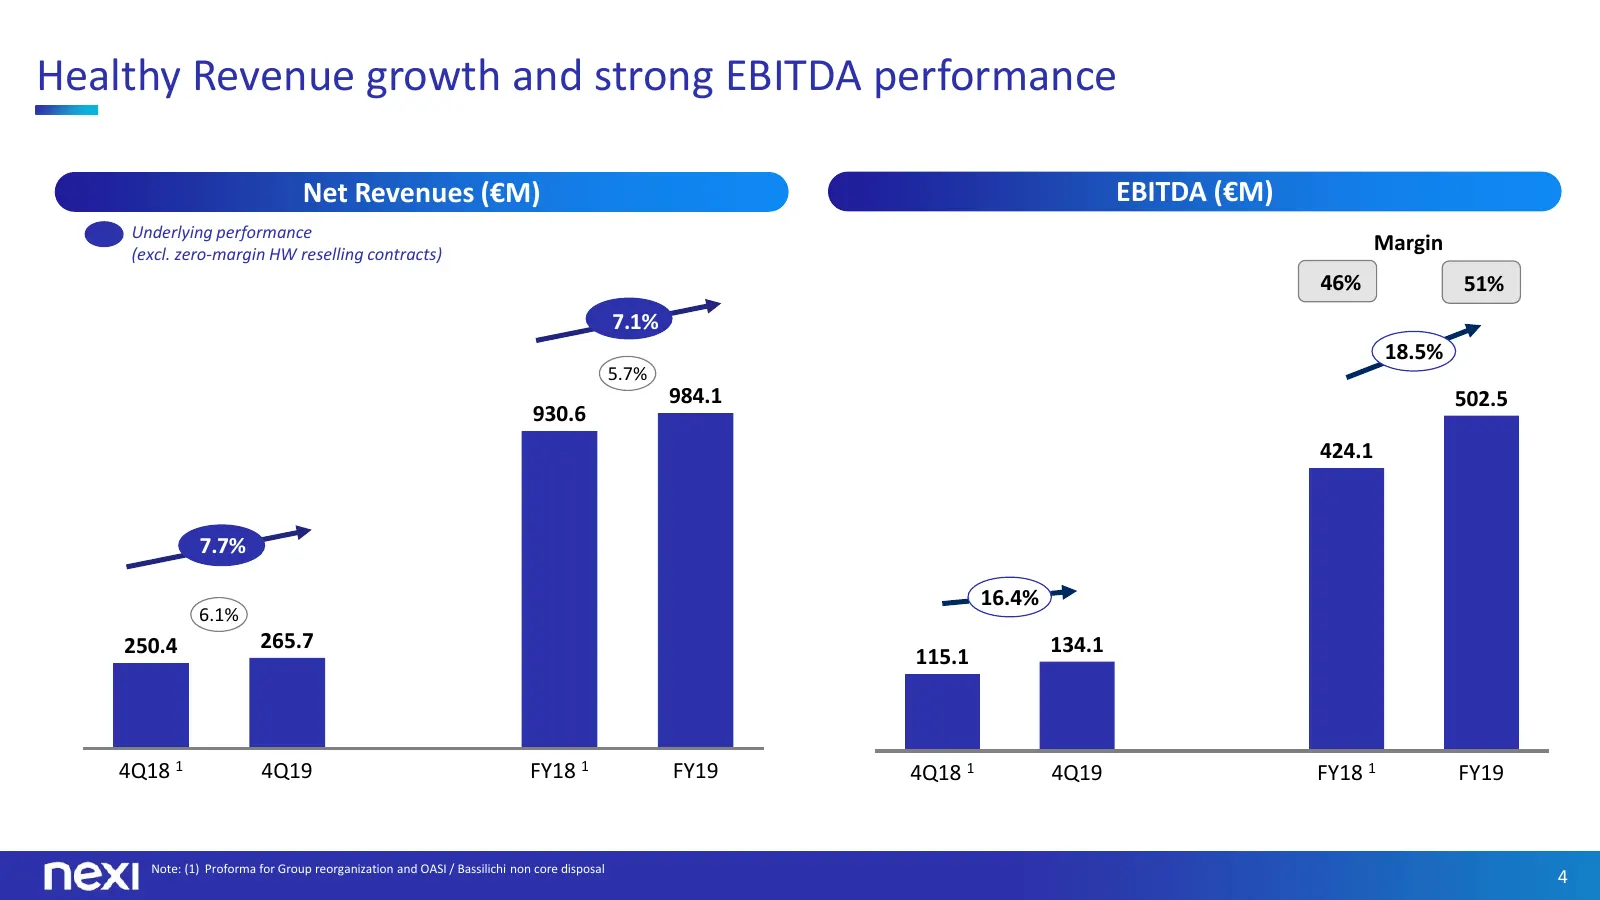
Healthy Revenue growth and strong EBITDA performance Net Revenues (€M) EBITDA (€M) Underlying performance (excl. zero-margin HW reselling contracts) Margin 46% 51% 7.1% 18.5% 5.7% 984.1 502.5 930.6 424.1 7.7% 16.4% 6.1% 250.4 265.7 134.1 115.1 4Q18 1 4Q19 FY18 1 FY19 4Q18 1 4Q19 FY18 1 FY19 Note: (1
Slide 5: Merchant Services & Solutions: continued strong growth
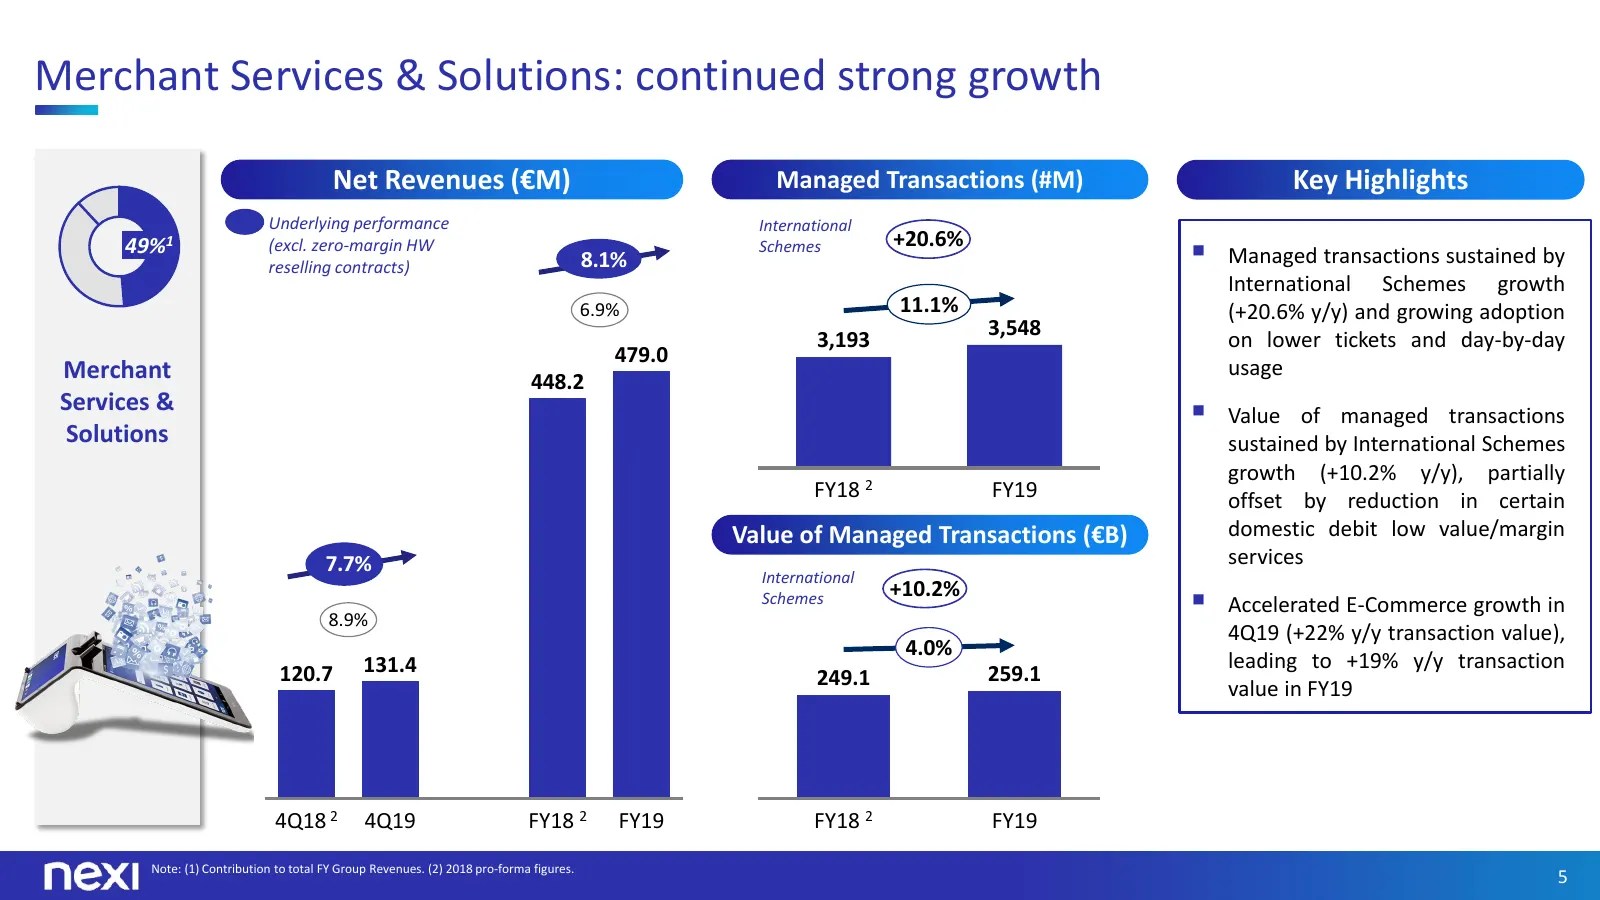
Merchant Services & Solutions: continued strong growth Net Revenues (€M) Managed Transactions (#M) Key Highlights Underlying performance International +20.6% 49%1 (excl. zero-margin HW reselling contracts) 8.1% Schemes Managed transactions sustained by International Schemes growth 6.9% 11.1% (+20.
Slide 6: Merchant Services & Solutions: key business update
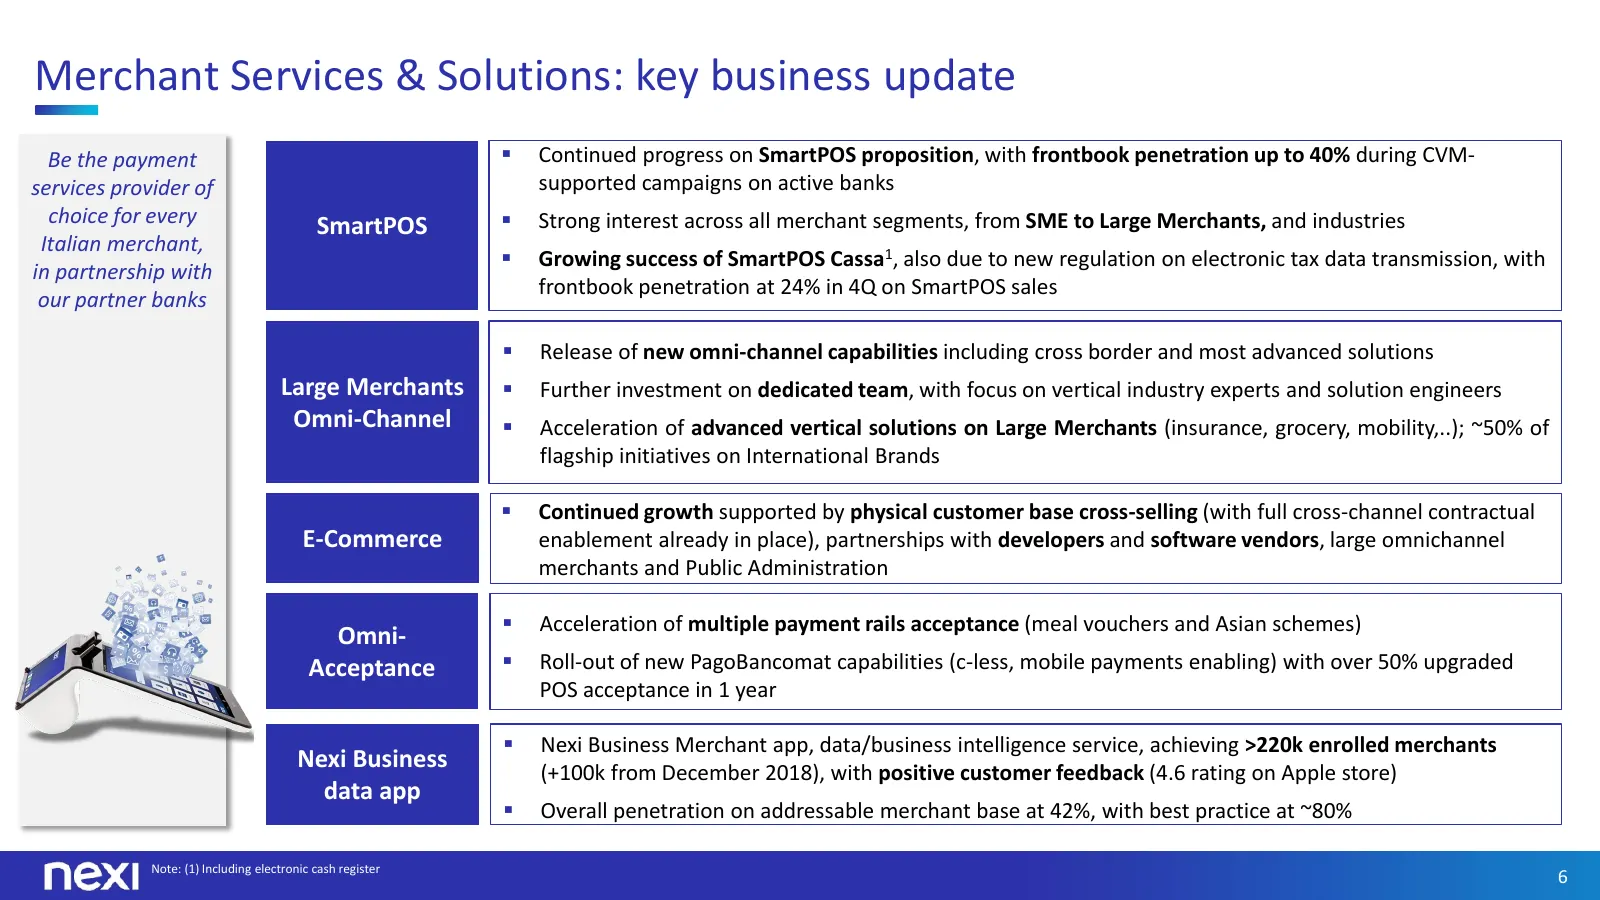
Merchant Services & Solutions: key business update Be the payment Continued progress on SmartPOS proposition, with frontbook penetration up to 40% during CVM- services provider of supported campaigns on active banks choice for every SmartPOS Strong interest across all merchant segments, from SME
Slide 7: Cards & Digital Payments: continued strong growth
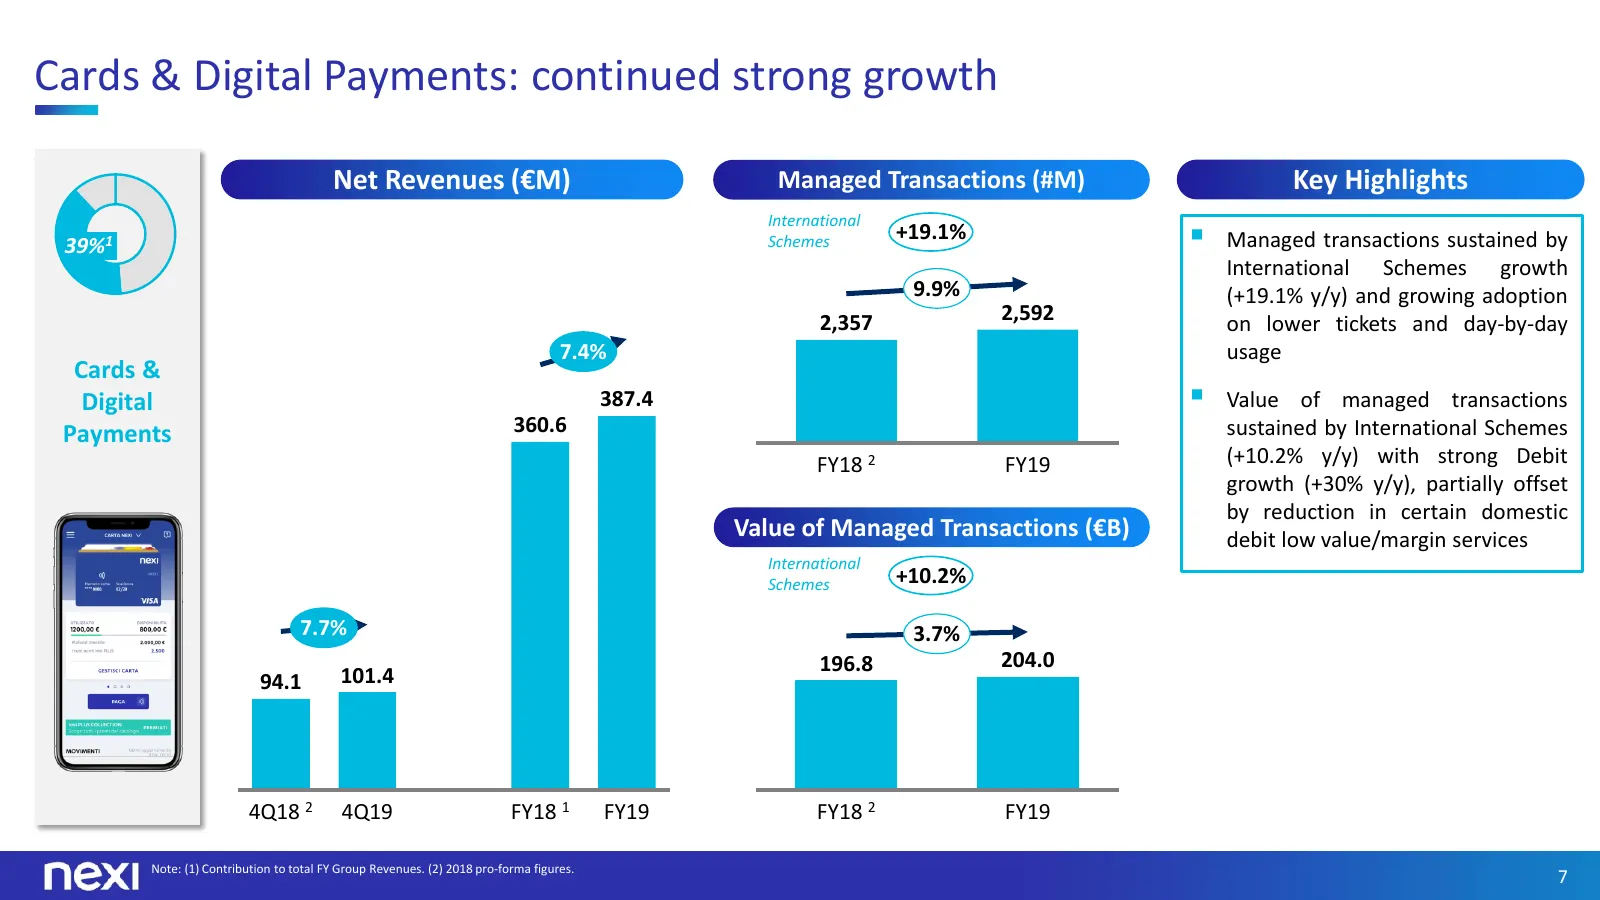
Cards & Digital Payments: continued strong growth Net Revenues (€M) Managed Transactions (#M) Key Highlights International 39%1 Schemes +19.1% Managed transactions sustained by International Schemes growth 9.9% (+19.1% y/y) and growing adoption 2,357 2,592 on lower tickets and day-by-day 7.4% usag
Slide 8: Cards & Digital Payments: key business update
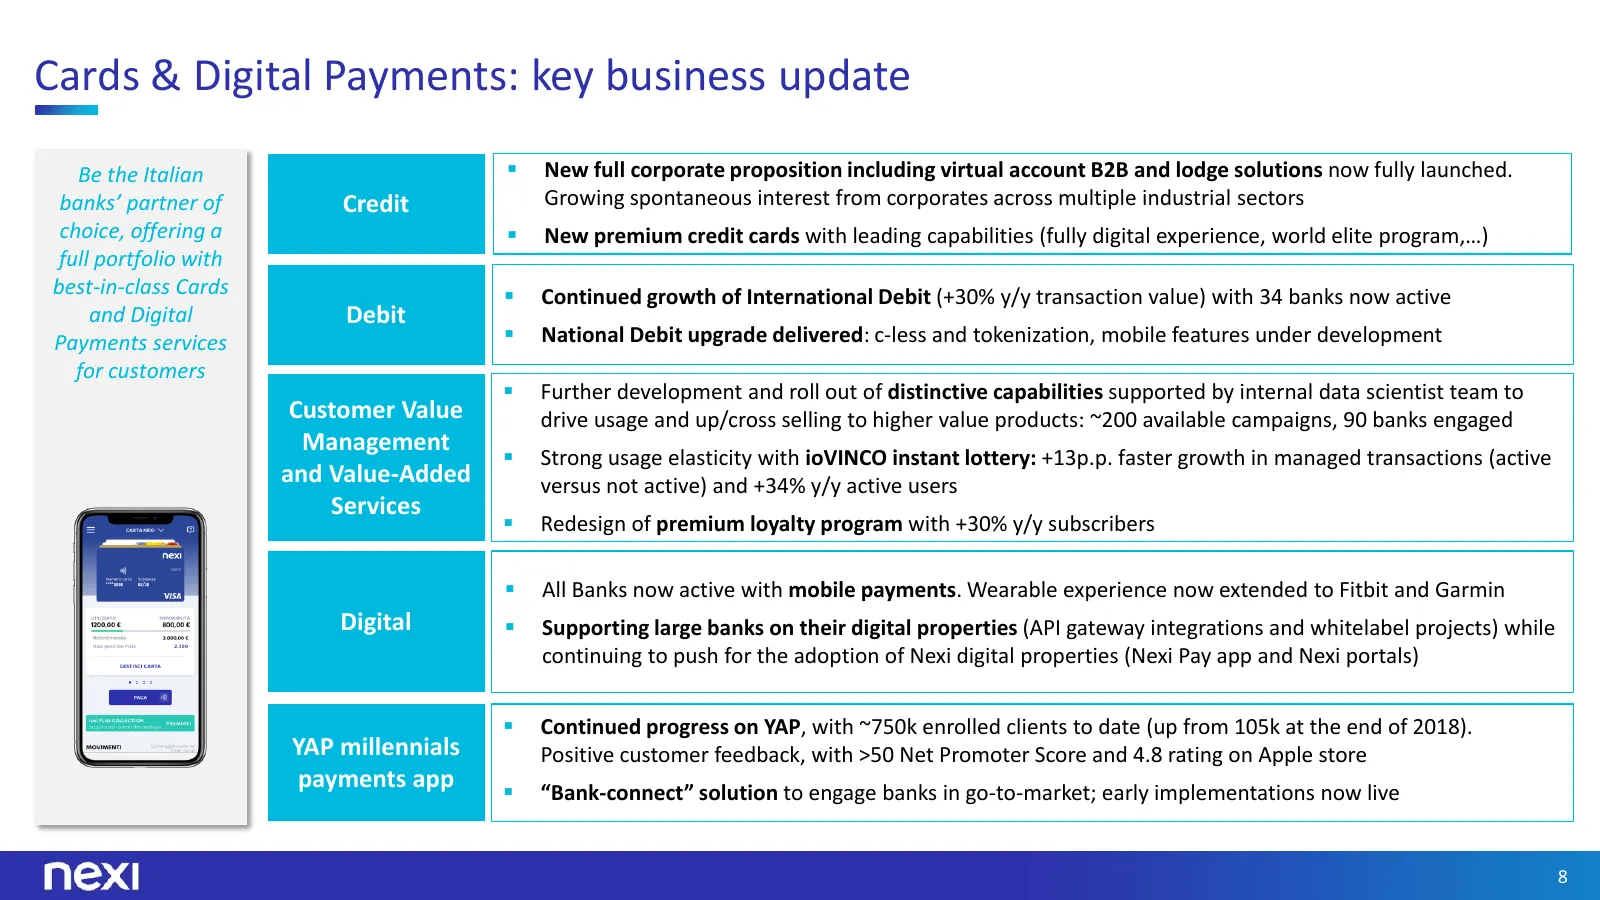
Cards & Digital Payments: key business update Be the Italian New full corporate proposition including virtual account B2B and lodge solutions now fully launched. banks’ partner of Credit Growing spontaneous interest from corporates across multiple industrial sectors choice, offering a New premiu
Slide 9: Digital Banking Solutions: accelerated underlying performance
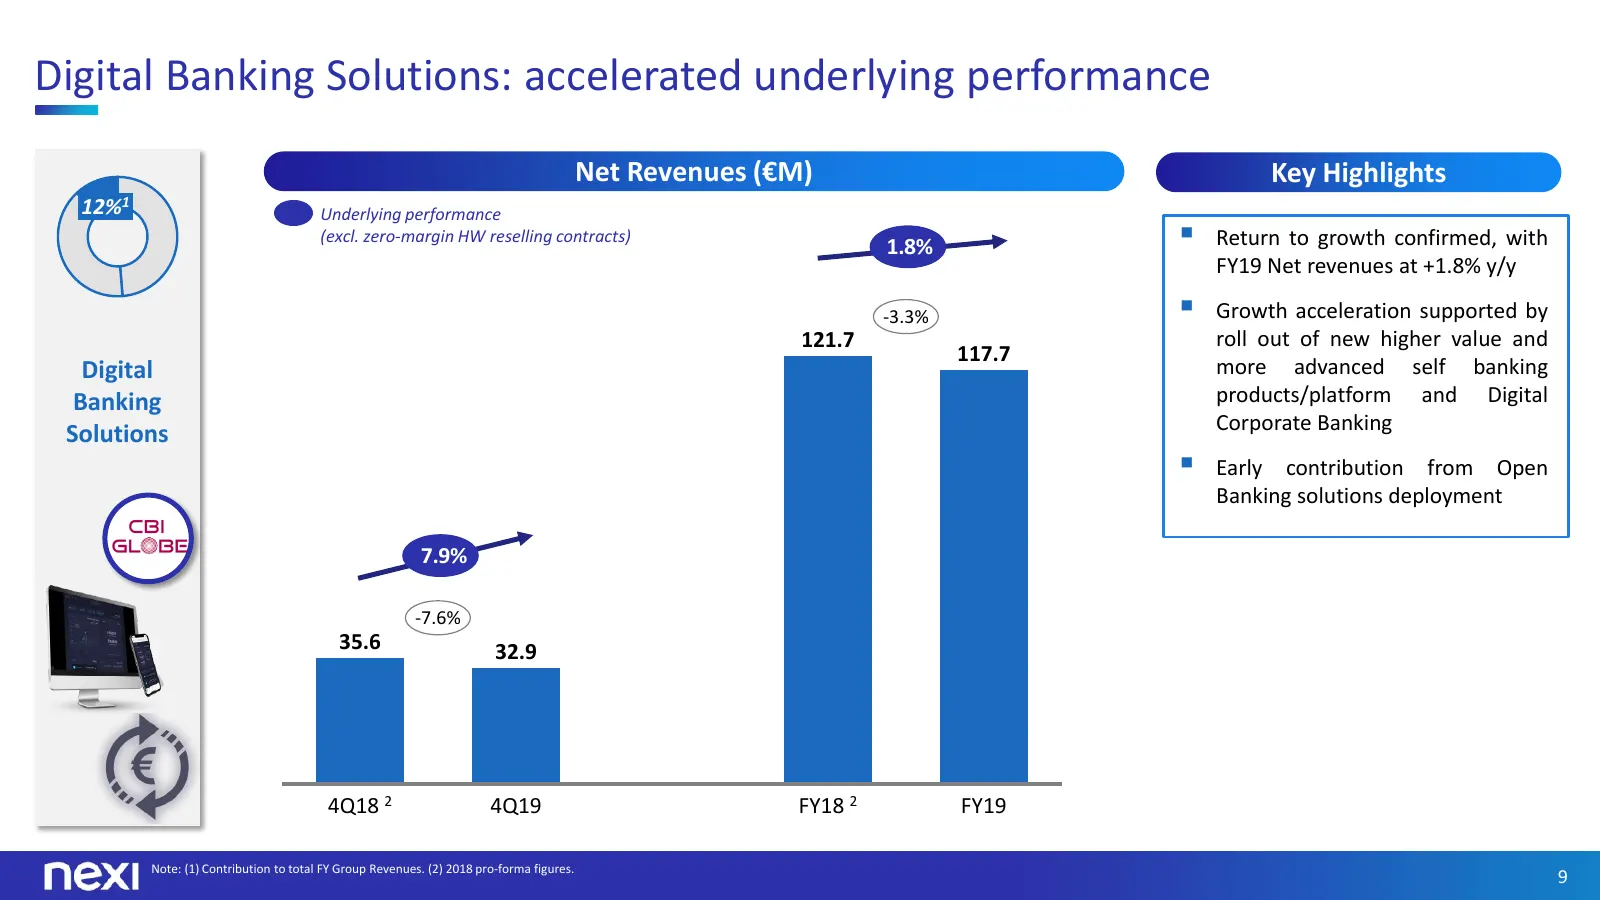
Digital Banking Solutions: accelerated underlying performance Net Revenues (€M) Key Highlights 12%1 Underlying performance (excl. zero-margin HW reselling contracts) 1.8% Return to growth confirmed, with FY19 Net revenues at +1.8% y/y -3.3% Growth acceleration supported by 121.7 roll out of new
Slide 10: Digital Banking Solutions: key business update
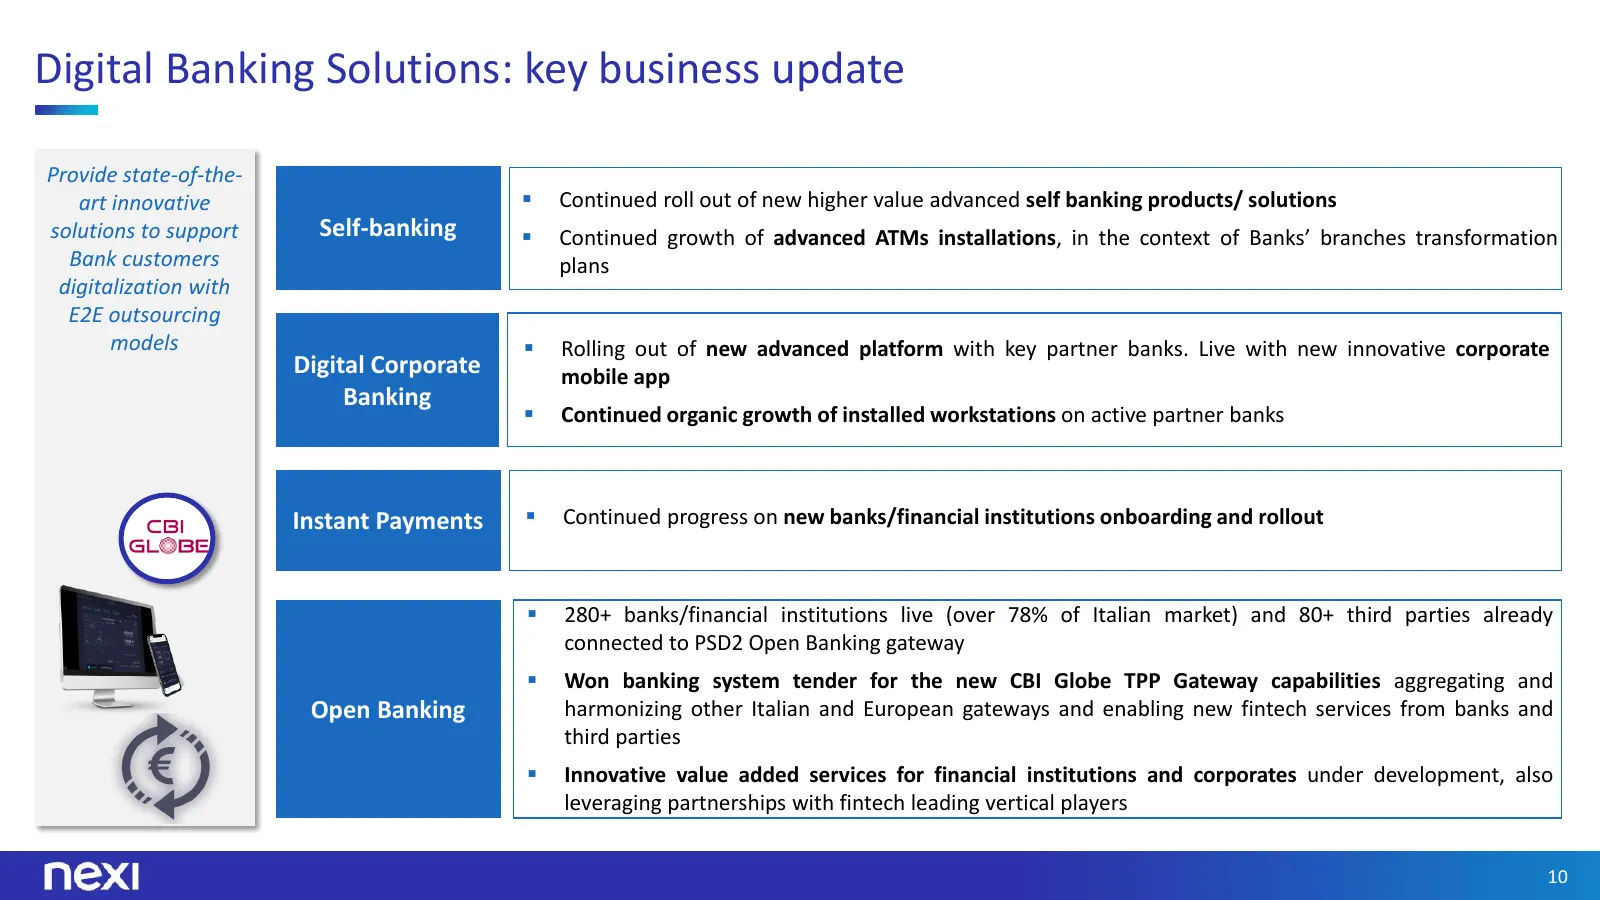
Digital Banking Solutions: key business update Provide state-of-the- art innovative Continued roll out of new higher value advanced self banking products/ solutions solutions to support Self-banking Continued growth of advanced ATMs installations, in the context of Banks’ branches transformation
Slide 11: Costs: strong reduction despite continuous investment in development initiatives
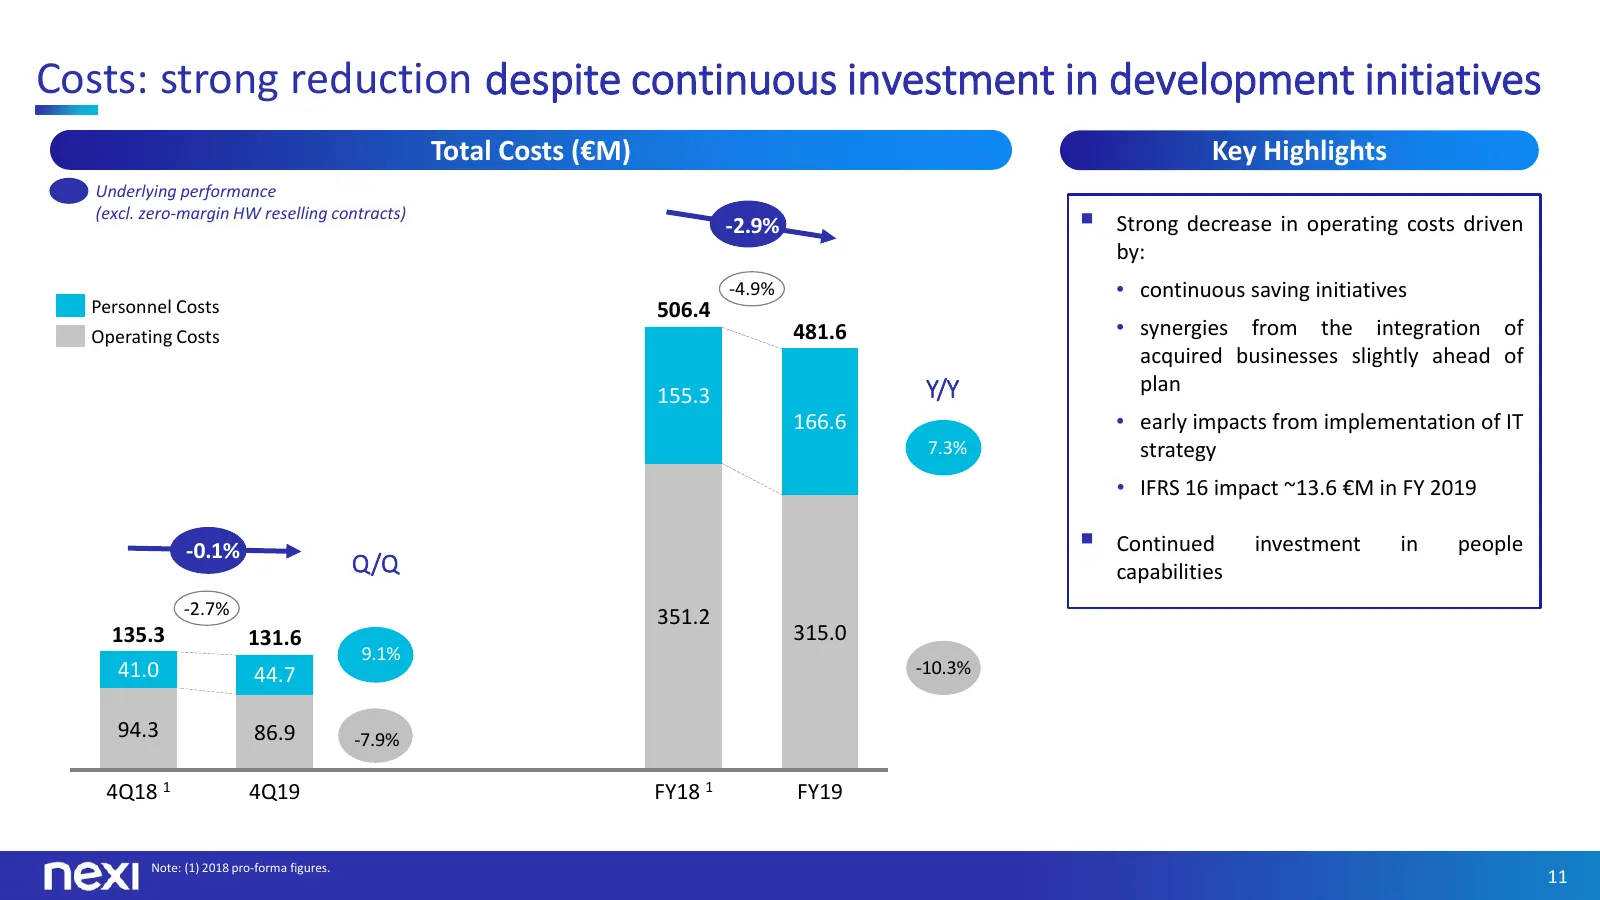
Costs: strong reduction despite continuous investment in development initiatives Total Costs (€M) Key Highlights Underlying performance (excl. zero-margin HW reselling contracts) -2.9% Strong decrease in operating costs driven by: -4.9% • continuous saving initiatives Personnel Costs 506.4 Operati
Slide 12: Continued investments to support quality, innovation and IT transformation
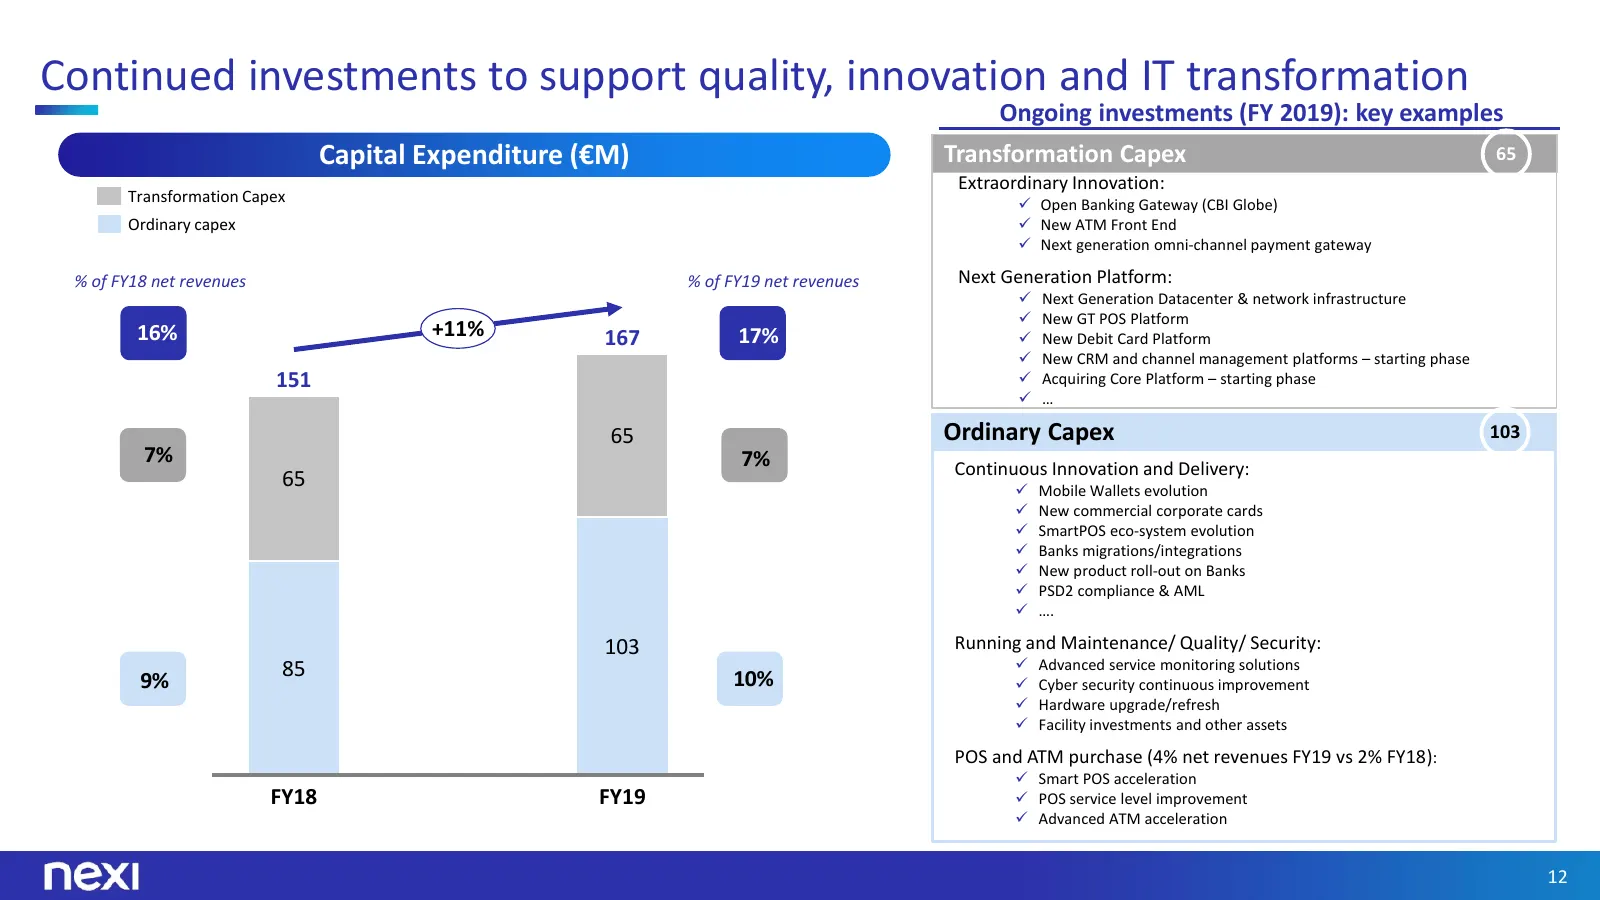
Continued investments to support quality, innovation and IT transformation Ongoing investments (FY 2019): key examples Capital Expenditure (€M) Transformation Capex 65 Extraordinary Innovation: Transformation Capex Open Banking Gateway (CBI Globe) Ordinary capex New ATM Front End Next generati
Slide 13: IT strategy progressing in line with plan
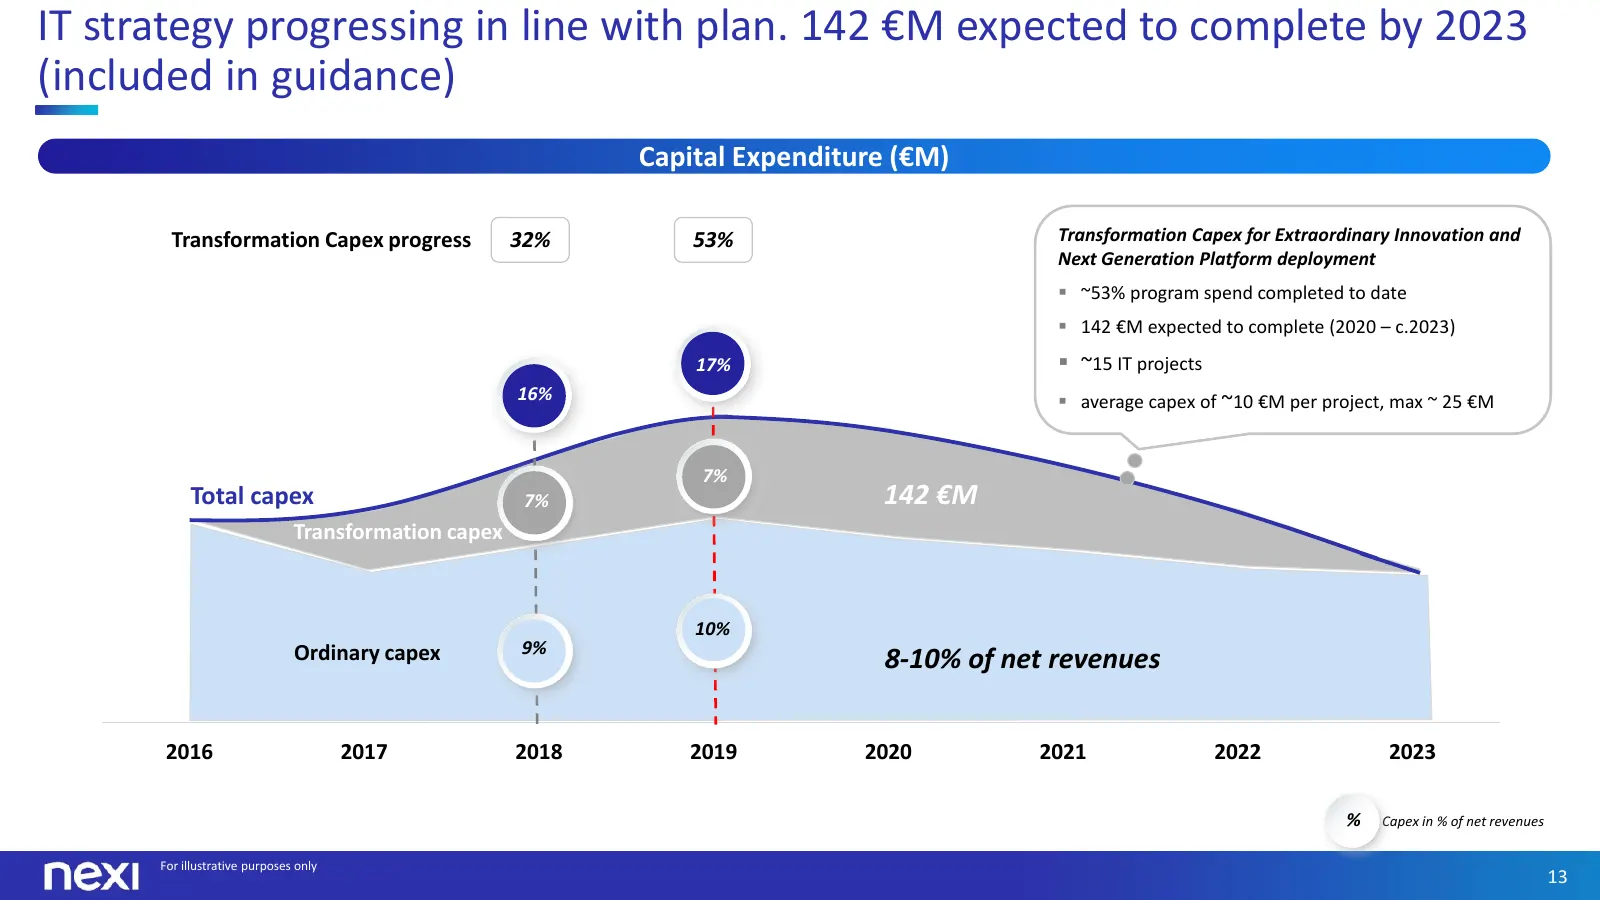
IT strategy progressing in line with plan. 142 €M expected to complete by 2023 (included in guidance) Capital Expenditure (€M) Transformation Capex progress 32% 53% Transformation Capex for Extraordinary Innovation and Next Generation Platform deployment ~53% program spend completed to date 142
Slide 14: FY 2019 Transformation Costs in line with guidance
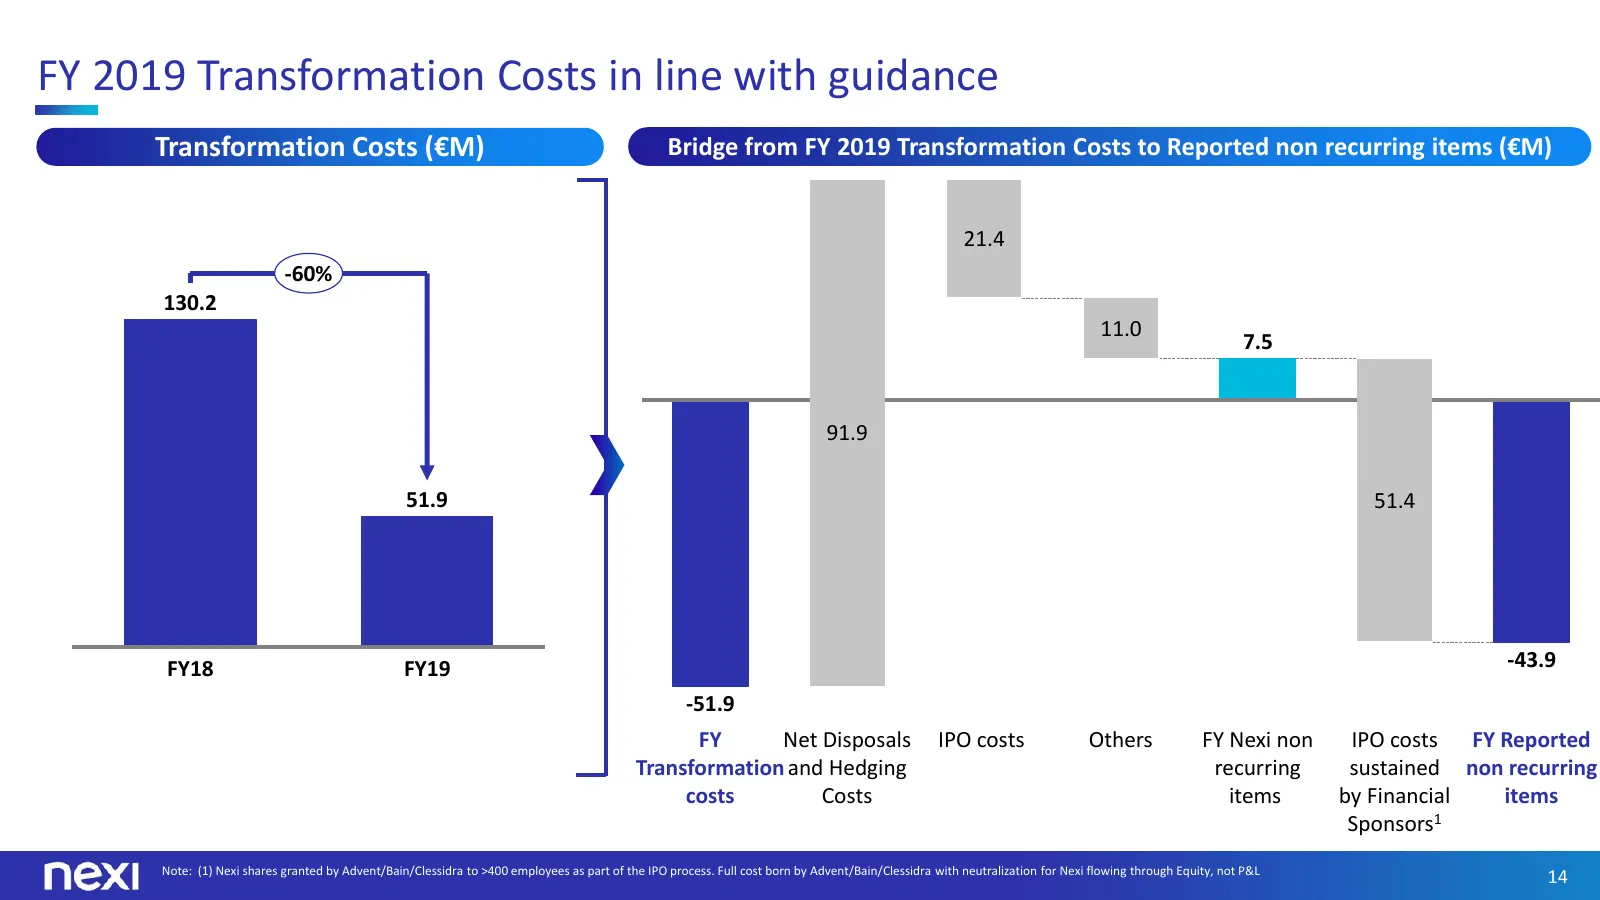
FY 2019 Transformation Costs in line with guidance Transformation Costs (€M) Bridge from FY 2019 Transformation Costs to Reported non recurring items (€M) 21.4 -60% 130.2 11.0 7.5 91.9 51.9 51.4 FY18 FY19 -43.9 -51.9 FY Net Disposals IPO costs Others FY Nexi non IPO costs FY Reported Transformation
Slide 15: Cost of debt reduced to 1.9% from 3.8% post reorganization
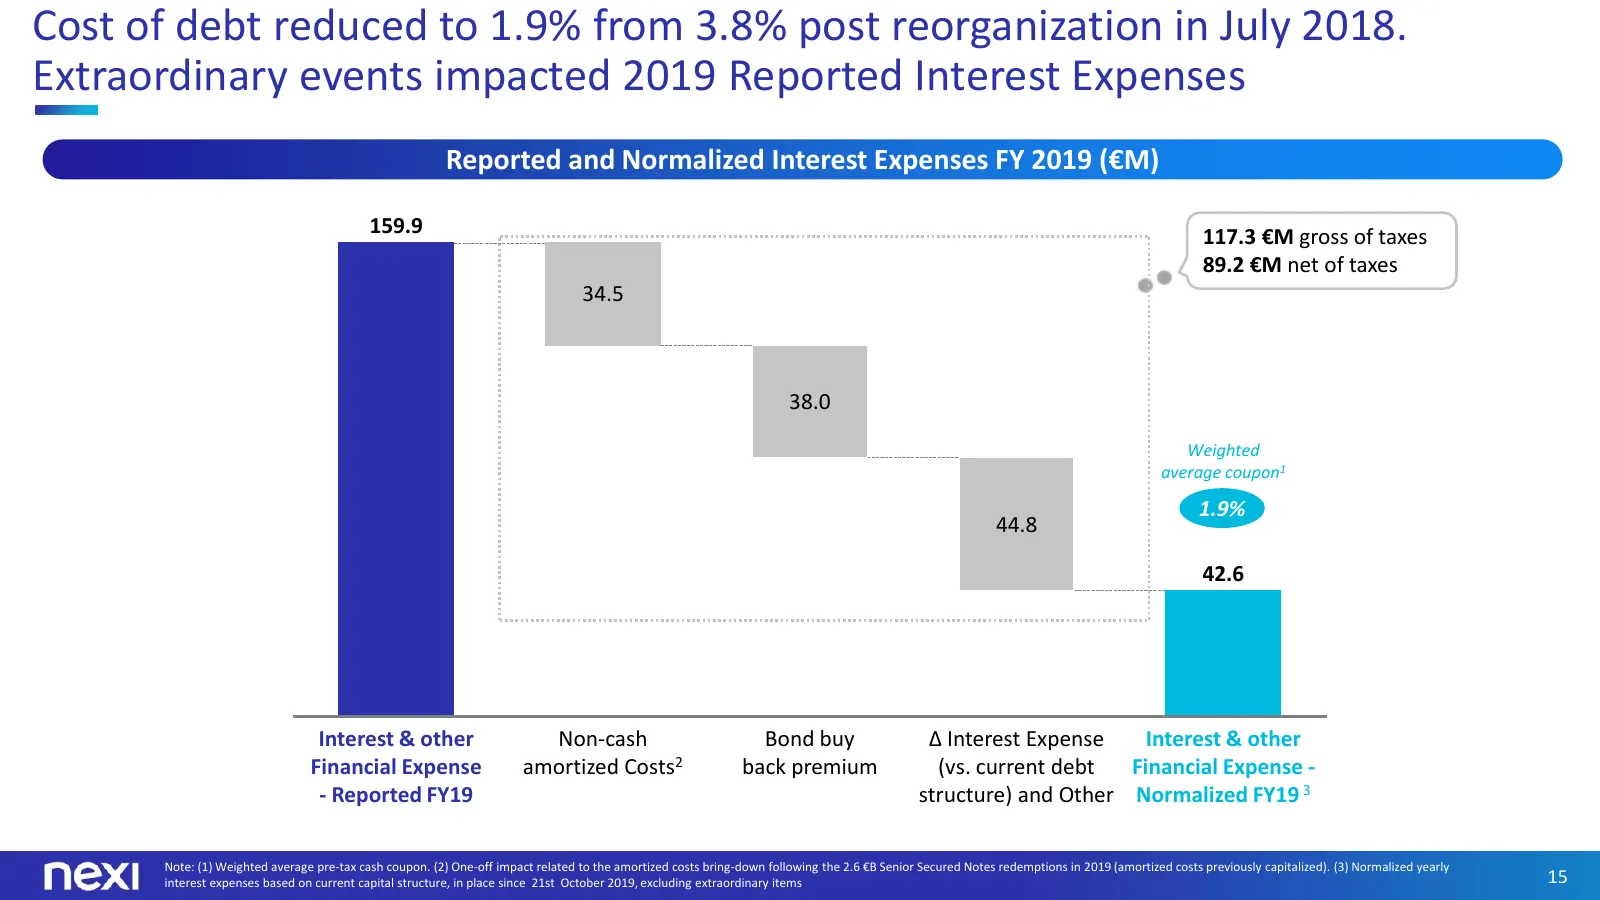
Cost of debt reduced to 1.9% from 3.8% post reorganization in July 2018. Extraordinary events impacted 2019 Reported Interest Expenses Reported and Normalized Interest Expenses FY 2019 (€M) 159.9 117.3 €M gross of taxes 89.2 €M net of taxes 34.5 38.0 Weighted average coupon1 1.9% 44.8 42.6 Interest
Slide 16: Normalized Net Profit growing 19% Y/Y
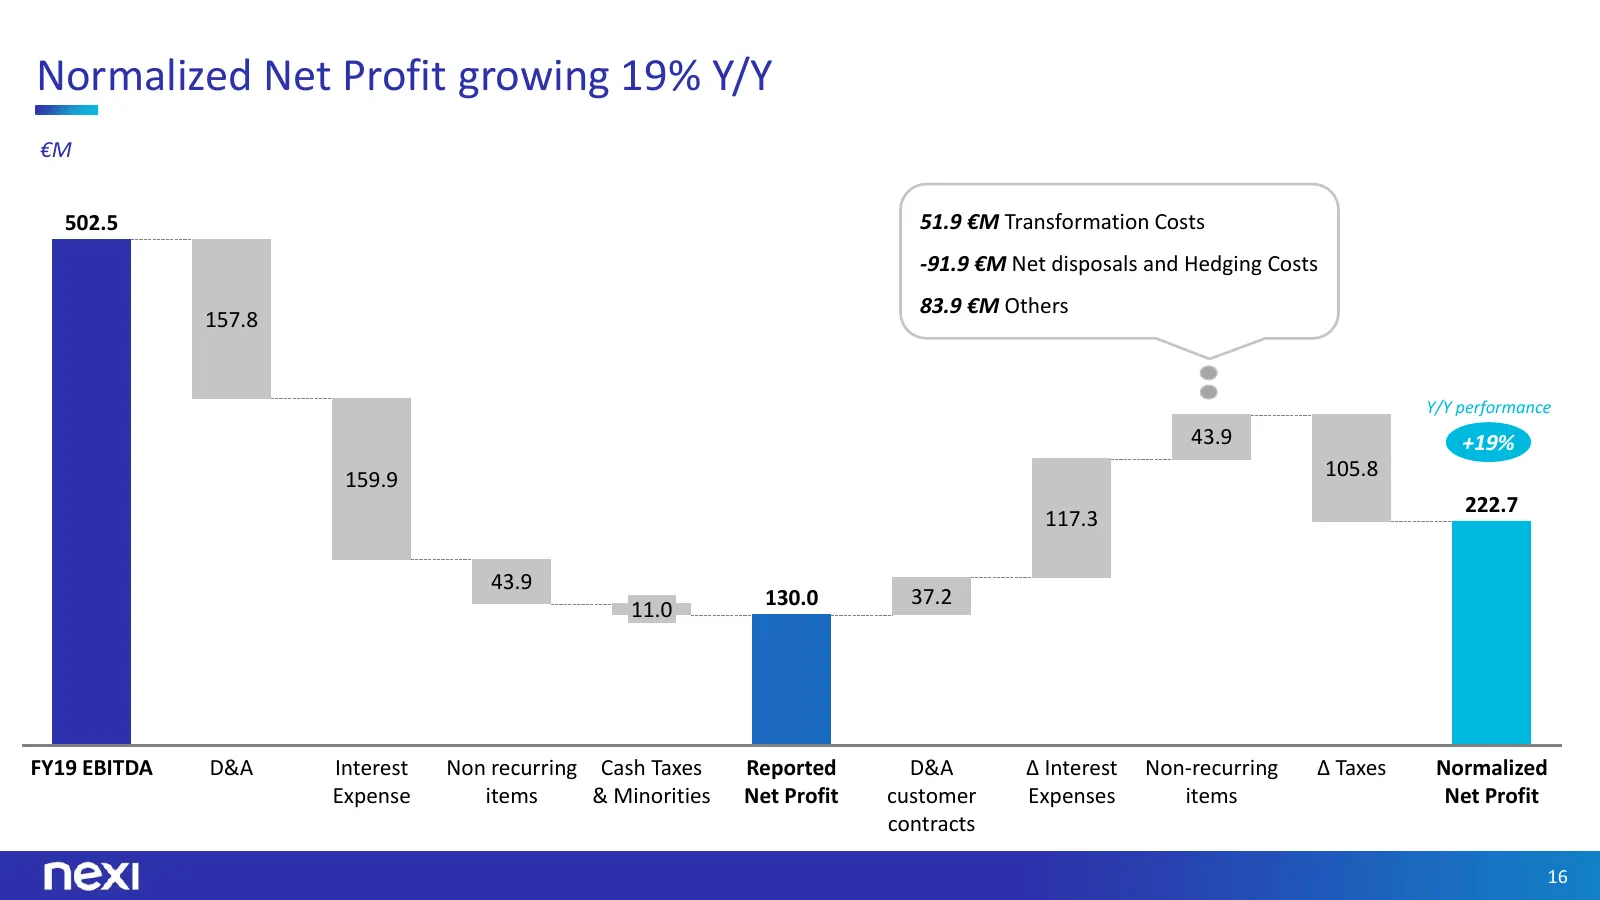
Normalized Net Profit growing 19% Y/Y €M 502.5 51.9 €M Transformation Costs -91.9 €M Net disposals and Hedging Costs 83.9 €M Others 157.8 Y/Y performance 43.9 +19% 159.9 105.8 222.7 117.3 43.9 130.0 37.2 11.0 FY19 EBITDA D&A Interest Non recurring Cash Taxes Reported D&A Δ Interest Non-recurring Δ T
Slide 17: Cash Flow conversion increased to 77% vs 74% in FY 2018
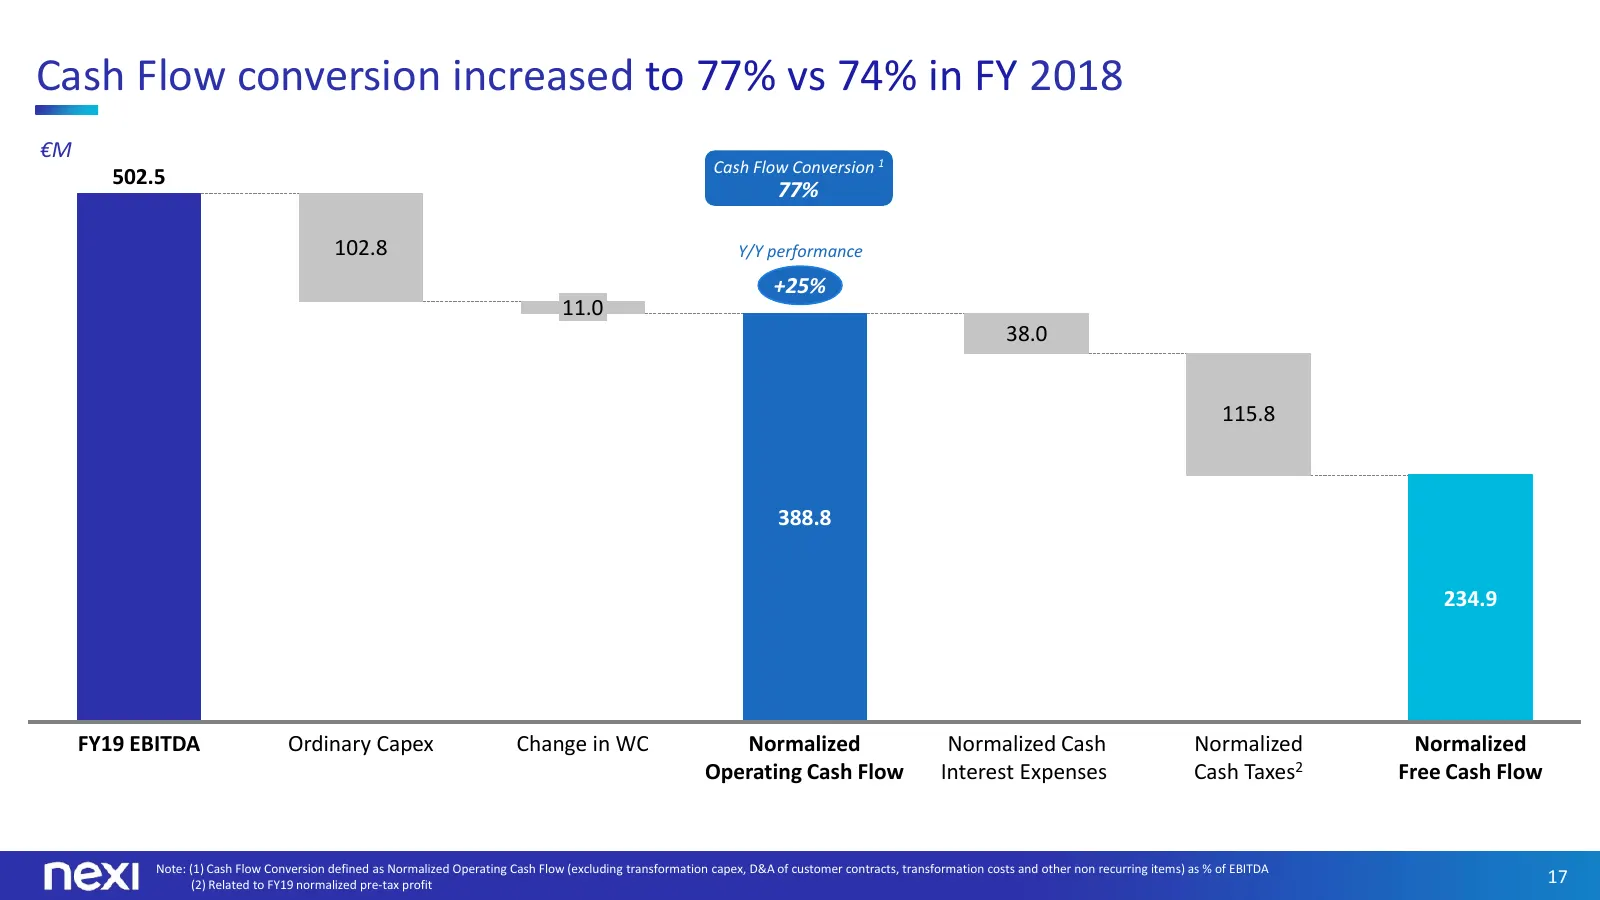
Cash Flow conversion increased to 77% vs 74% in FY 2018 €M Cash Flow Conversion 1 502.5 77% 102.8 Y/Y performance +25% 11.0 38.0 115.8 388.8 234.9 FY19 EBITDA Ordinary Capex Change in WC Normalized Normalized Cash Normalized Normalized Operating Cash Flow Interest Expenses Cash Taxes2 Free Cash Flow
Slide 18: Net Financial Debt / EBITDA at 2.9x at year-end
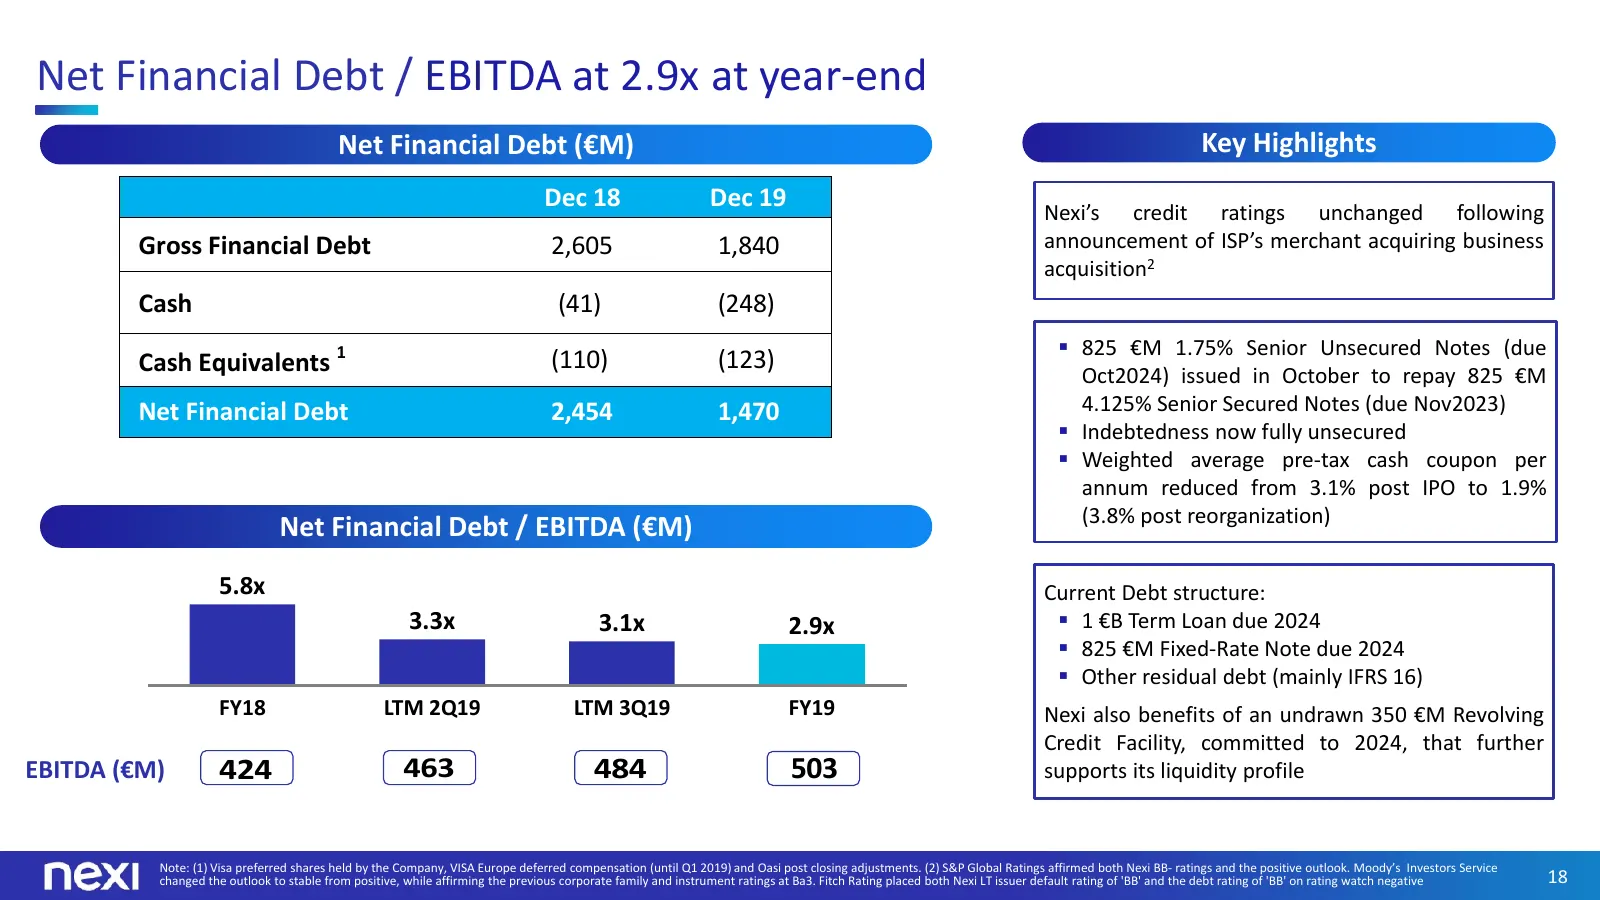
Net Financial Debt / EBITDA at 2.9x at year-end Net Financial Debt (€M) Key Highlights Dec 18 Dec 19 Nexi’s credit ratings unchanged following Gross Financial Debt 2,605 1,840 announcement of ISP’s merchant acquiring business acquisition2 Cash (41) (248) 825 €M 1.75% Senior Unsecured Notes (due Ca
Slide 19: Government initiatives to support digital payments
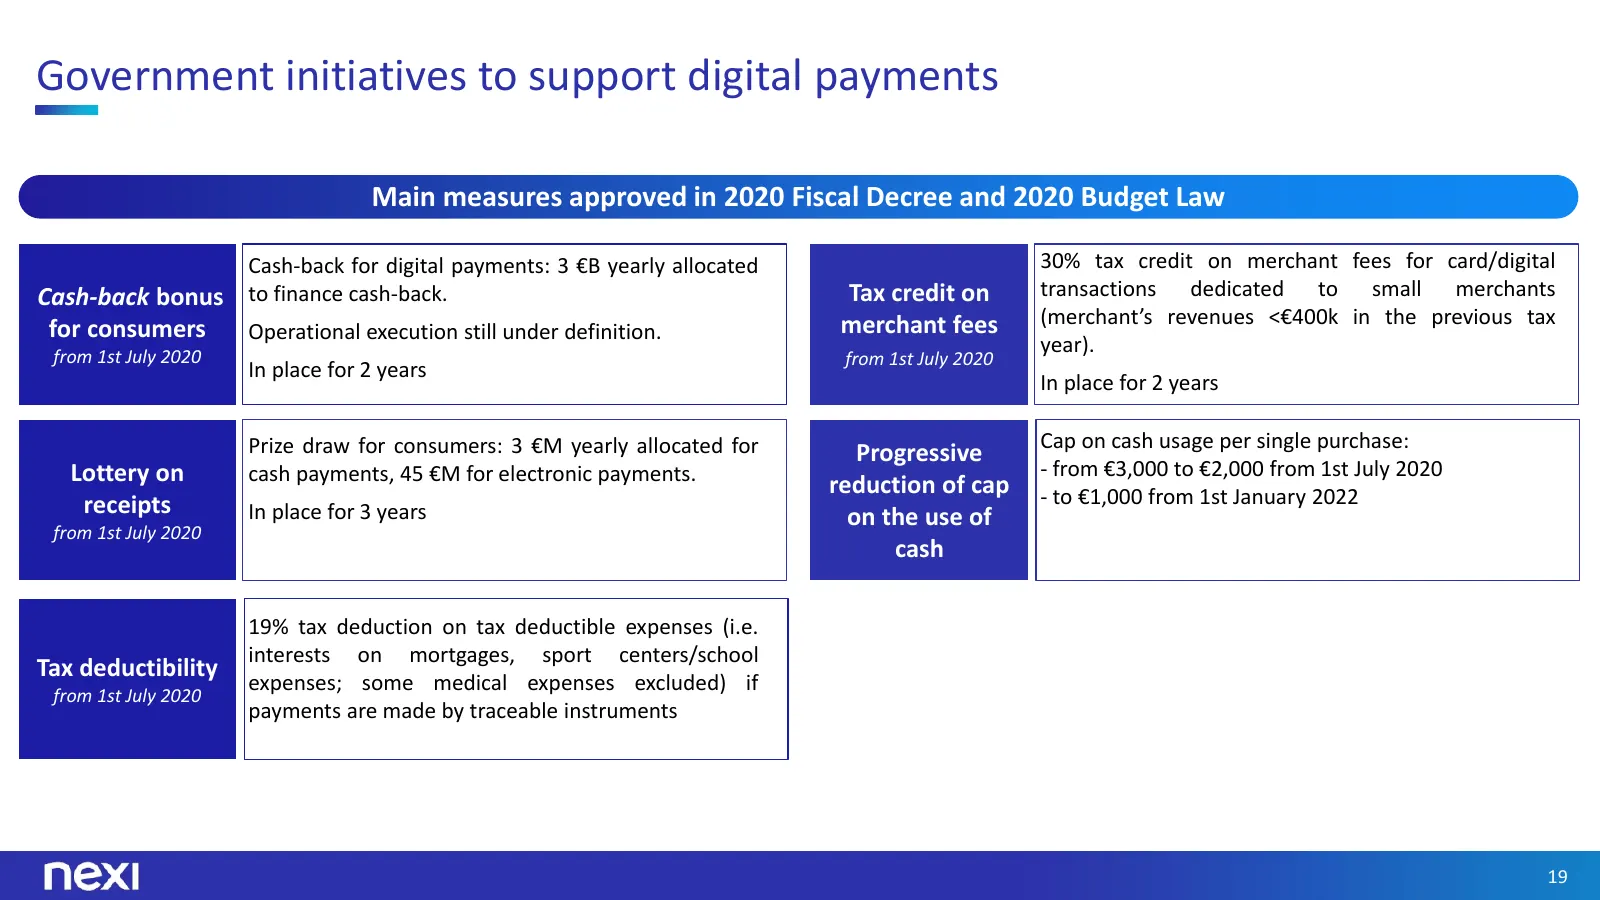
Government initiatives to support digital payments Main measures approved in 2020 Fiscal Decree and 2020 Budget Law Cash-back for digital payments: 3 €B yearly allocated 30% tax credit on merchant fees for card/digital Cash-back bonus to finance cash-back. Tax credit on transactions dedicated to sma
Slide 20: Acquisition of ISP's Merchant Acquiring
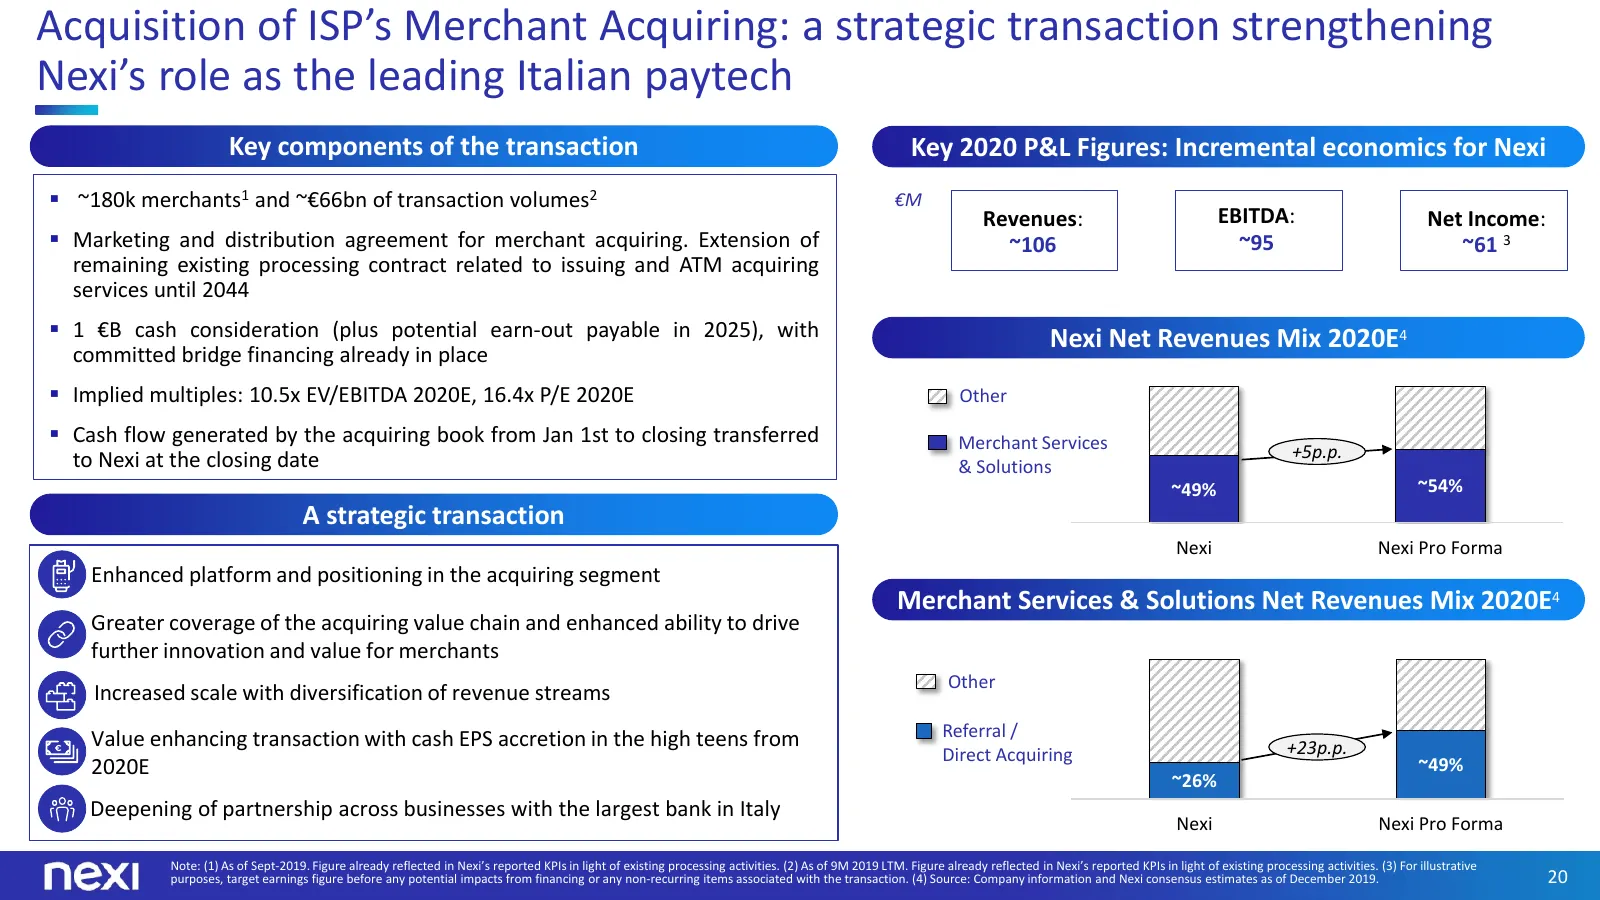
Acquisition of ISP’s Merchant Acquiring: a strategic transaction strengthening Nexi’s role as the leading Italian paytech Key components of the transaction Key 2020 P&L Figures: Incremental economics for Nexi ~180k merchants1 and ~€66bn of transaction volumes2 €M Revenues: EBITDA: Net Income: Ma
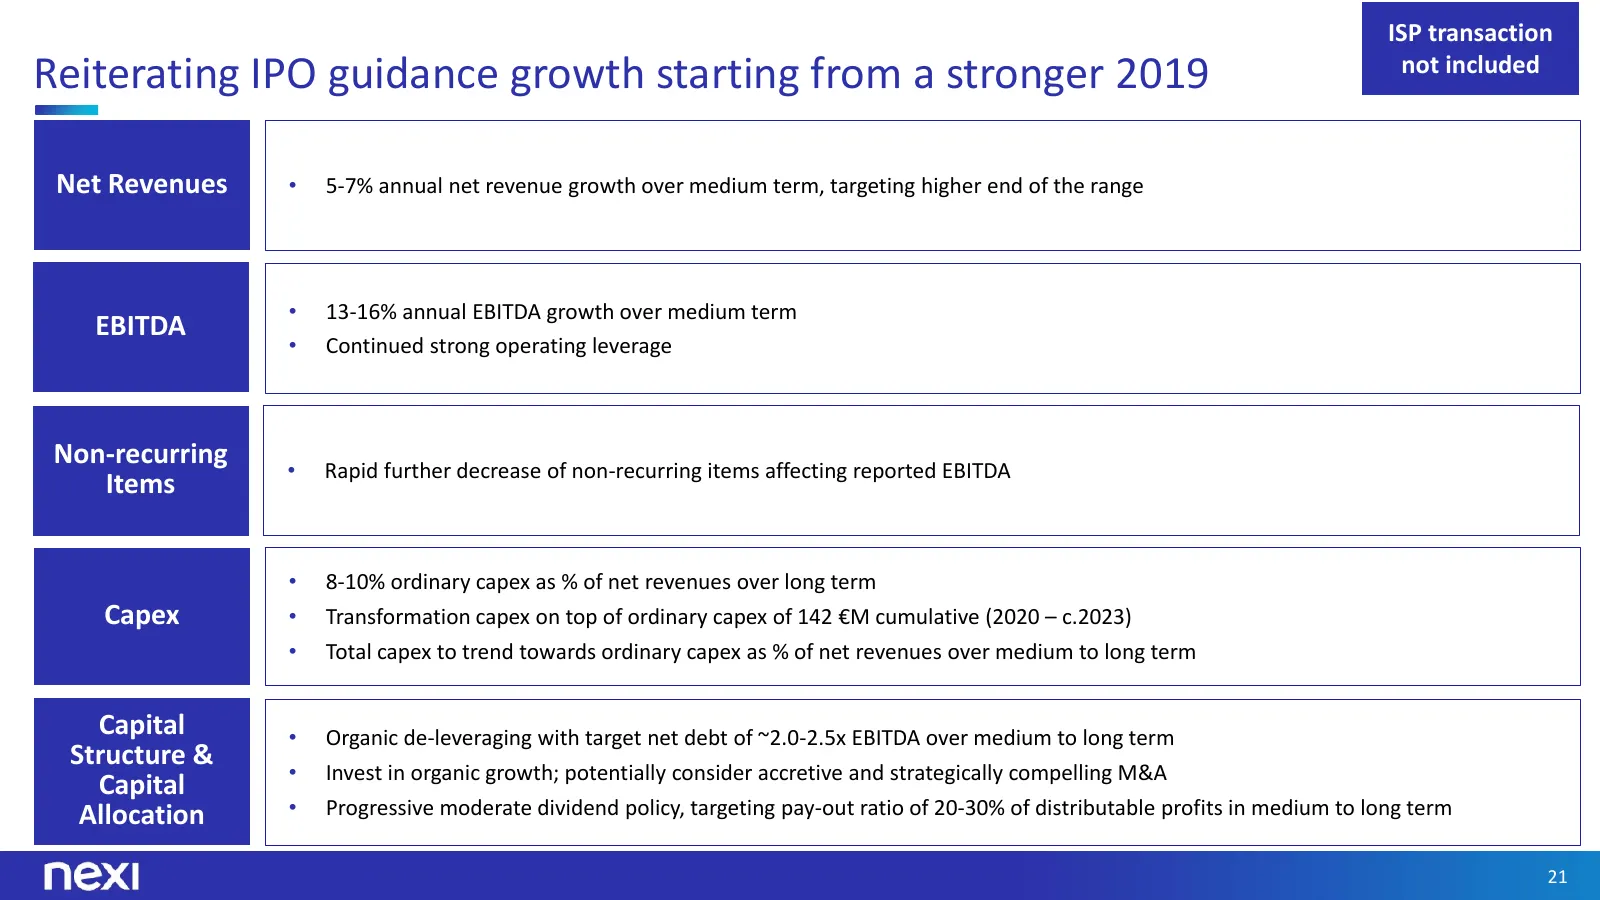
Slide 21: Reiterating IPO guidance growth starting from a stronger 2019
ISP transaction not included Reiterating IPO guidance growth starting from a stronger 2019 Net Revenues • 5-7% annual net revenue growth over medium term, targeting higher end of the range • 13-16% annual EBITDA growth over medium term EBITDA • Continued strong operating leverage Non-recurring • Rap
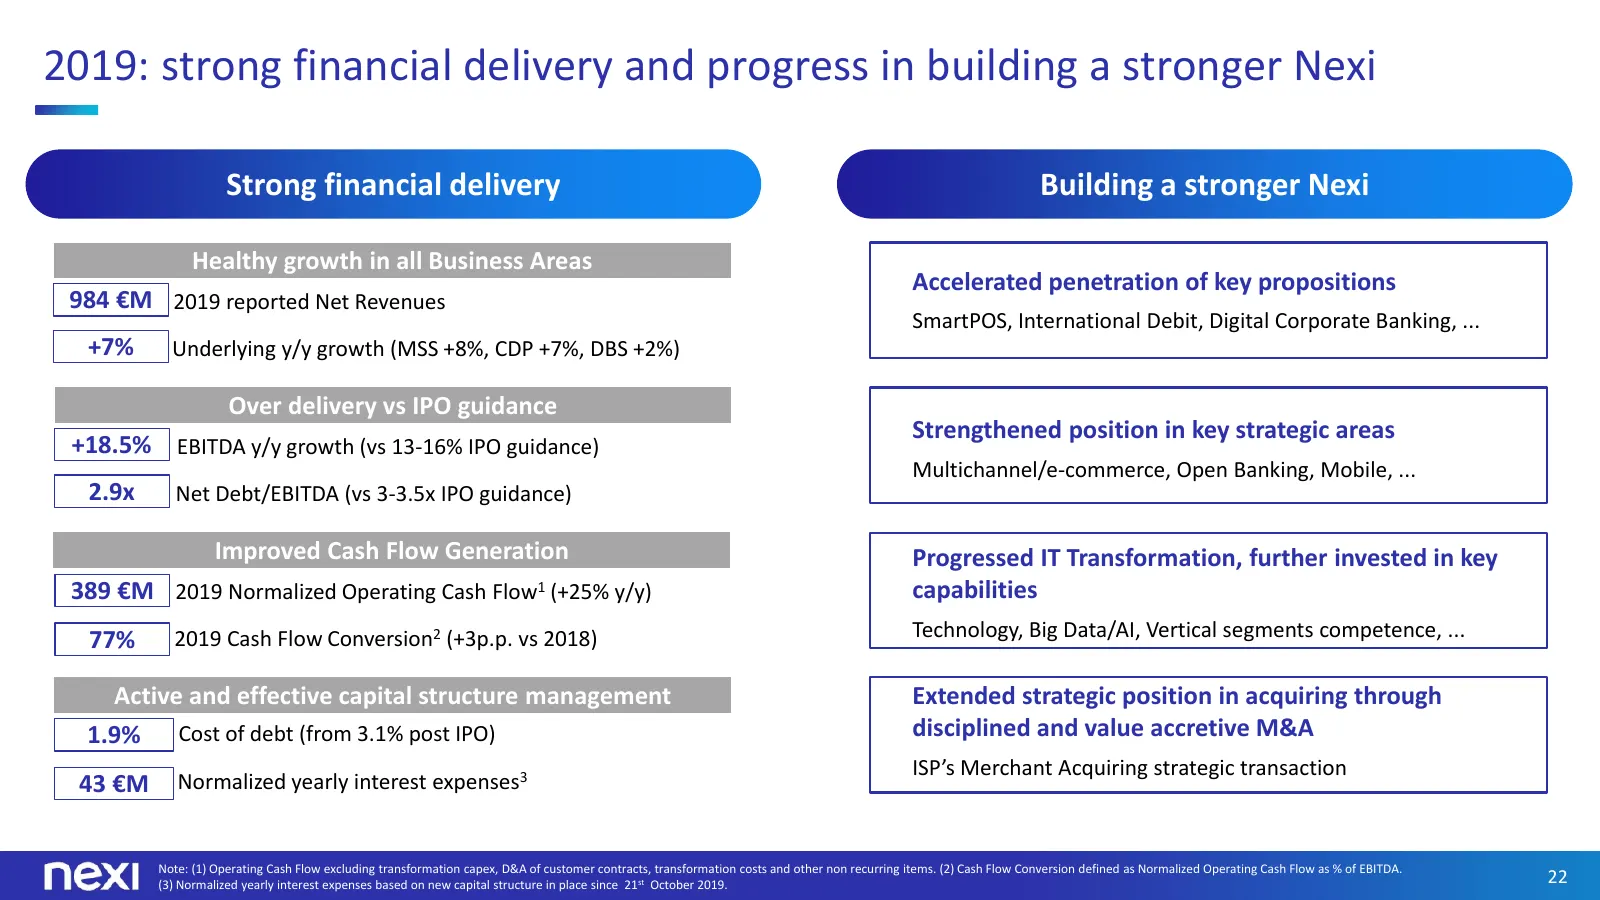
Slide 22: 2019: strong financial delivery and progress in building a stronger Nexi
2019: strong financial delivery and progress in building a stronger Nexi Strong financial delivery Building a stronger Nexi Healthy growth in all Business Areas Accelerated penetration of key propositions 984 €M 2019 reported Net Revenues SmartPOS, International Debit, Digital Corporate Banking, ...

Slide 23: Q&A
Q&A 23

Slide 24: Annex
Annex 24
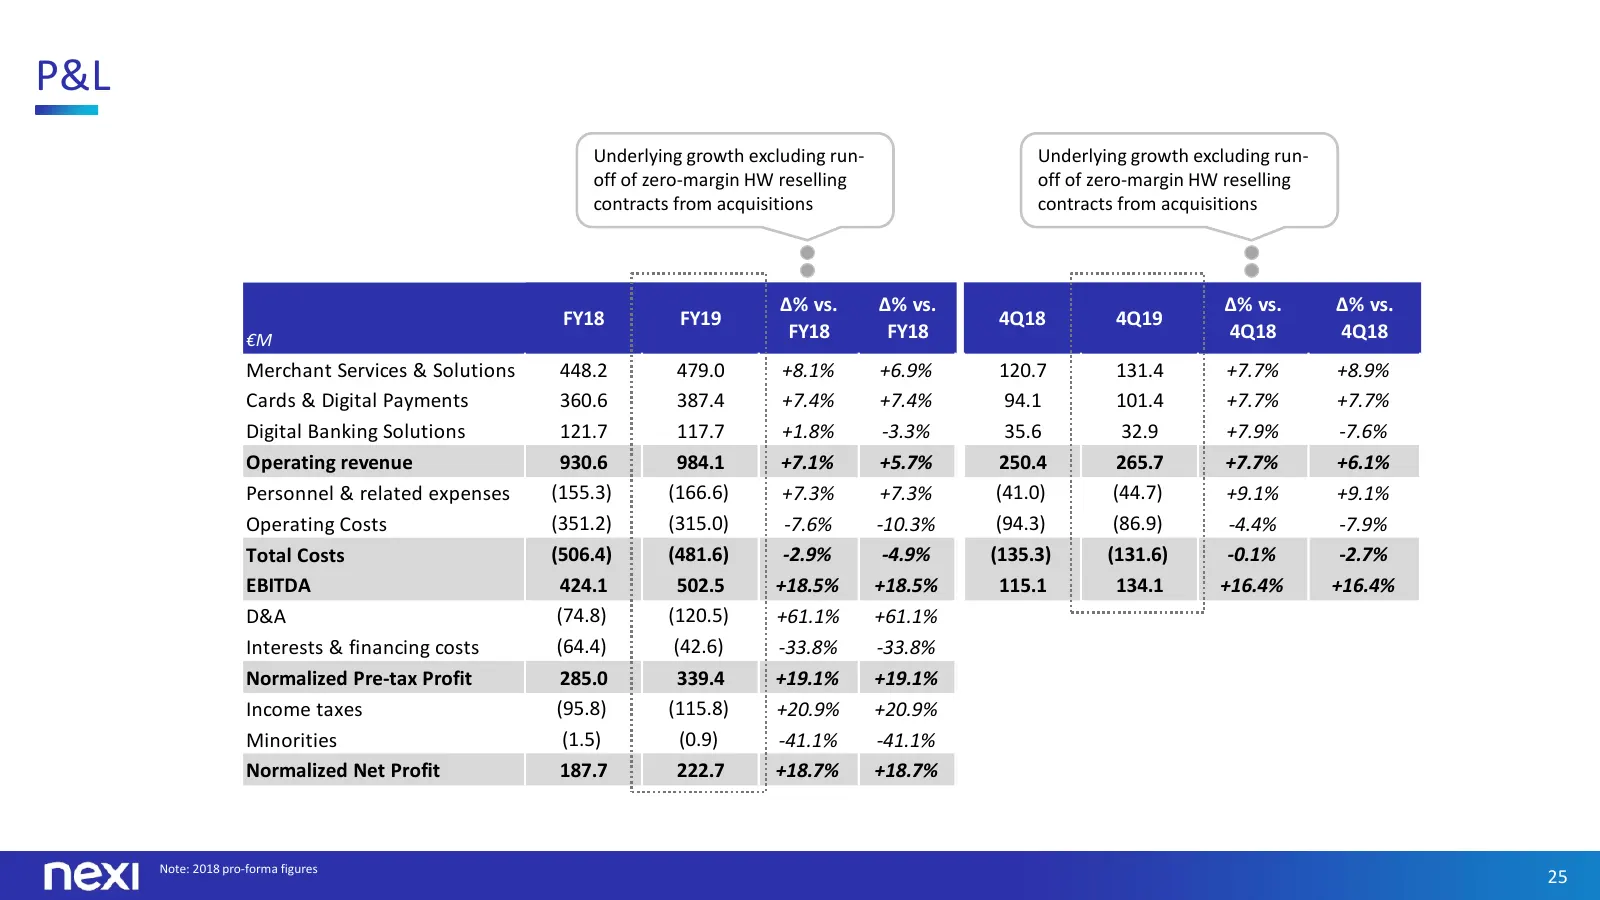
Slide 25: P&L
P&L Underlying growth excluding run- Underlying growth excluding run- off of zero-margin HW reselling off of zero-margin HW reselling contracts from acquisitions contracts from acquisitions Δ% vs. Δ% vs. Δ% vs. Δ% vs. FY18 FY19 4Q18 4Q19 €M FY18 FY18 4Q18 4Q18 Merchant Services & Solutions 448.2 479
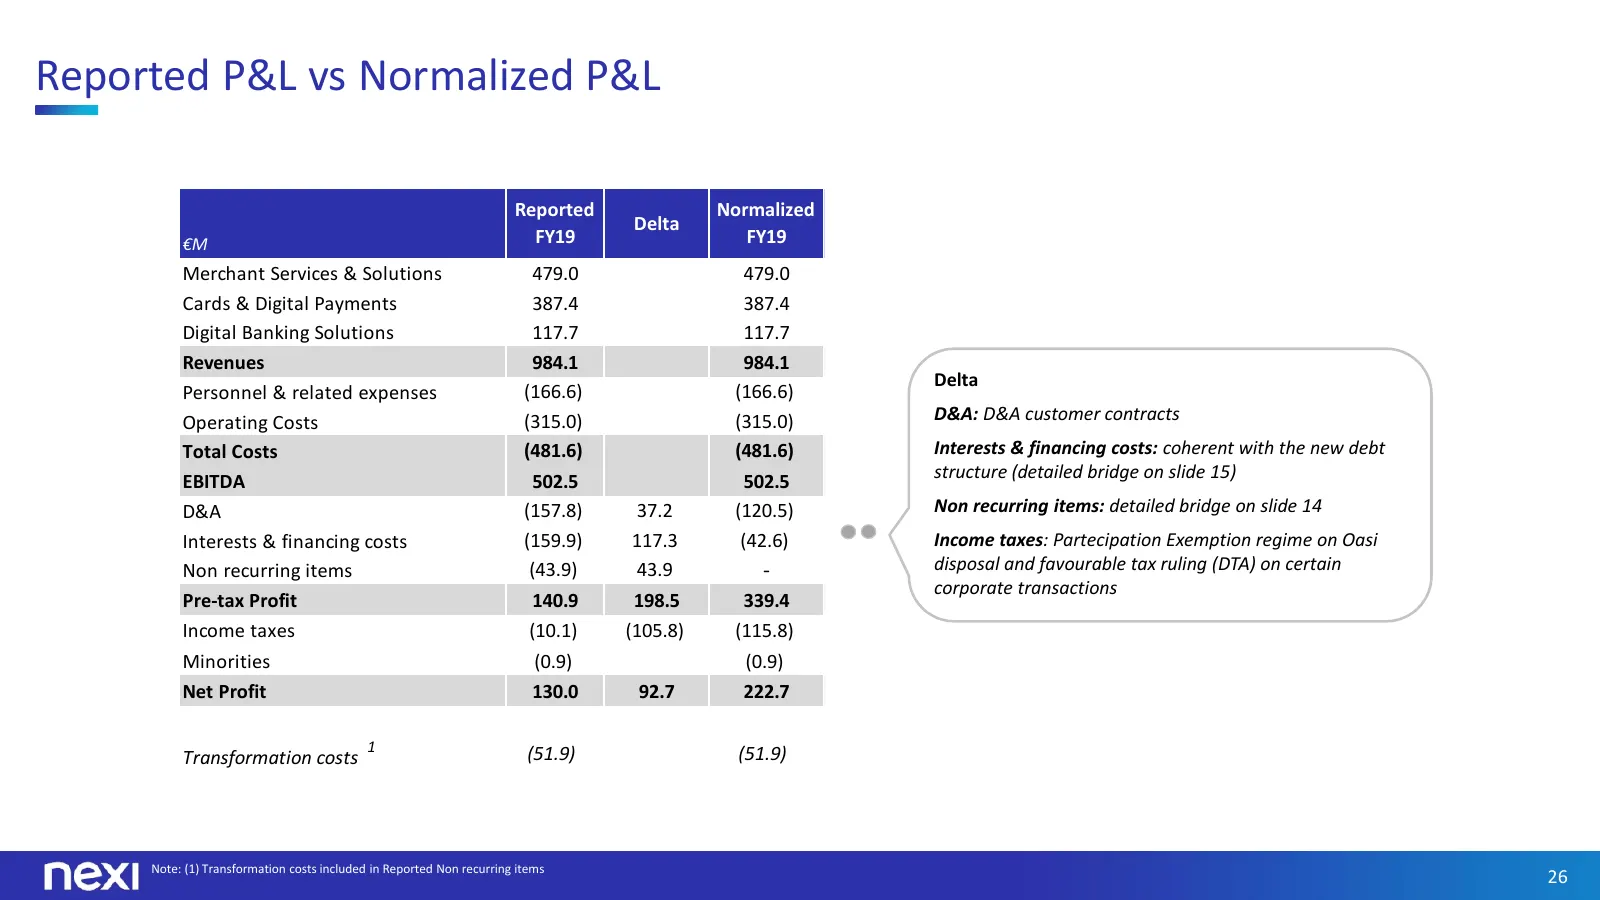
Slide 26: Reported P&L vs Normalized P&L
Reported P&L vs Normalized P&L Reported Normalized Delta €M FY19 FY19 Merchant Services & Solutions 479.0 479.0 Cards & Digital Payments 387.4 387.4 Digital Banking Solutions 117.7 117.7 Revenues 984.1 984.1 Delta Personnel & related expenses (166.6) (166.6) Operating Costs (315.0) (315.0) D&A: D&A
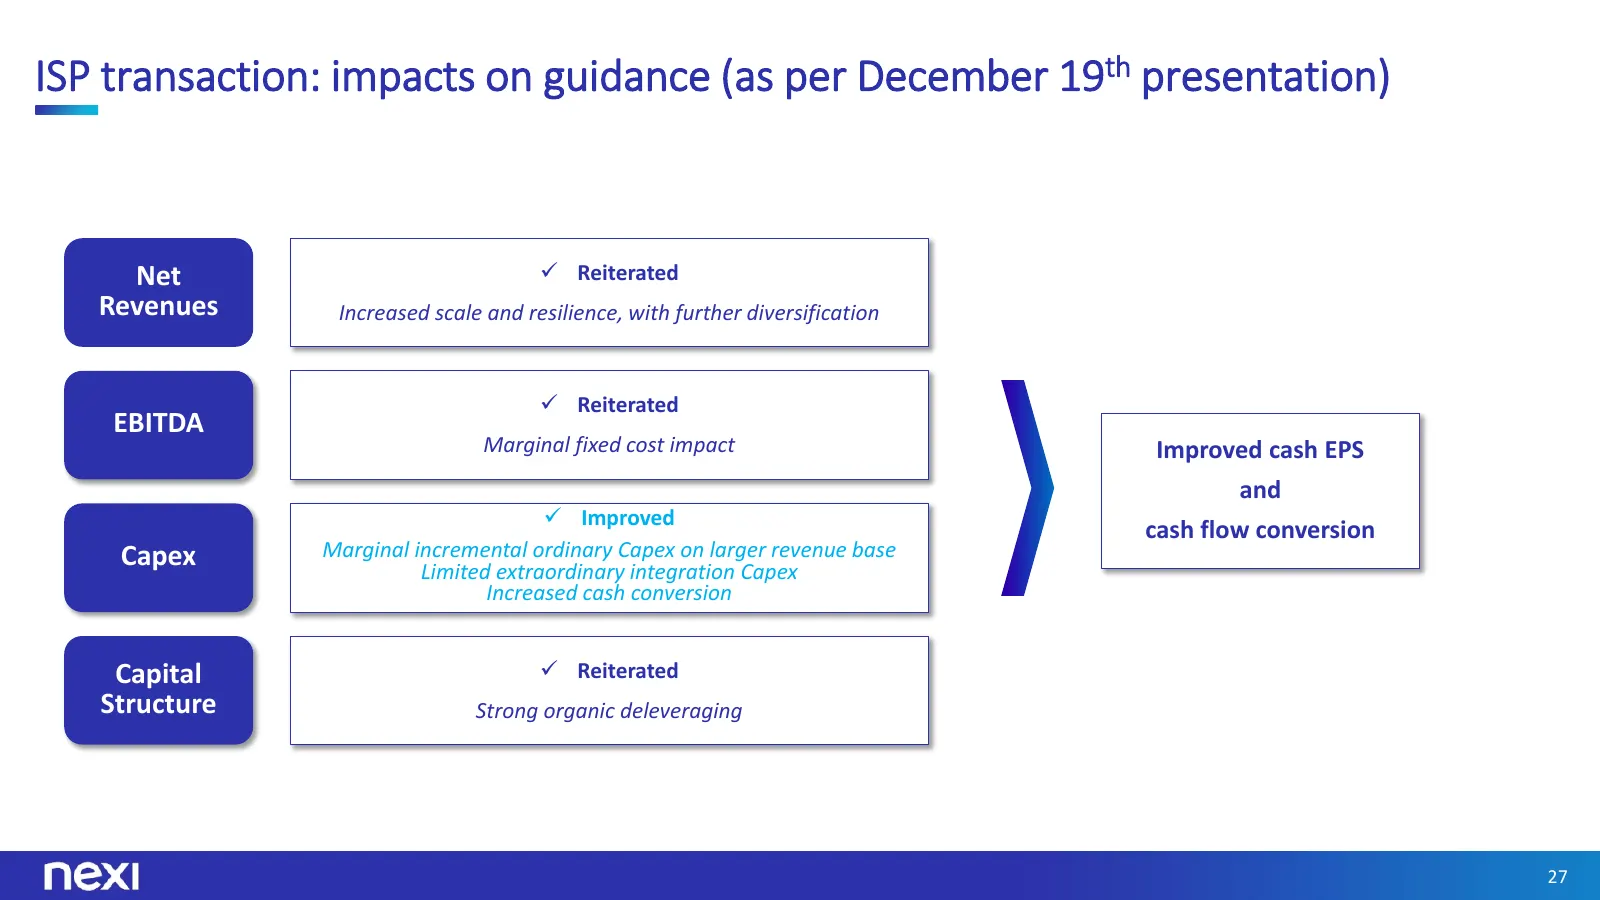
Slide 27: ISP transaction: impacts on guidance
ISP transaction: impacts on guidance (as per December 19th presentation) Net Reiterated Revenues Increased scale and resilience, with further diversification Reiterated EBITDA Marginal fixed cost impact Improved cash EPS and Improved cash flow conversion Capex Marginal incremental ordinary Cap

Slide 28: Investor Relations
Investor Relations investor.relations@nexi.it Stefania Mantegazza stefania.mantegazza@nexi.it 28
Source: Internet Archive copy of nexi.it
More decks from Nexi S.p.A.
 9M 2026 Earnings Presentation18 slides · Nov 5, 2026
 H1 2026 Earnings Presentation23 slides · Jul 29, 2026
 Q1 2026 Earnings Presentation19 slides · May 7, 2026
 9M25 Earnings Presentation21 slides · Nov 5, 2025
 1H25 Earnings Presentation25 slides · Jul 31, 2025
 Q1 2025 Earnings Presentation24 slides · May 8, 2025