Nexi S.p.A. · MIL:NEXI
Nexi — 9M 2026 Earnings Presentation
18 slides from Nexi's earnings presentation, Nov 5, 2026
Slide 1: 9M26 Results Presentation
This content is classified as Internal Title 9M26 Results Presentation November 5th, 2026
Slide 2: Disclaimer
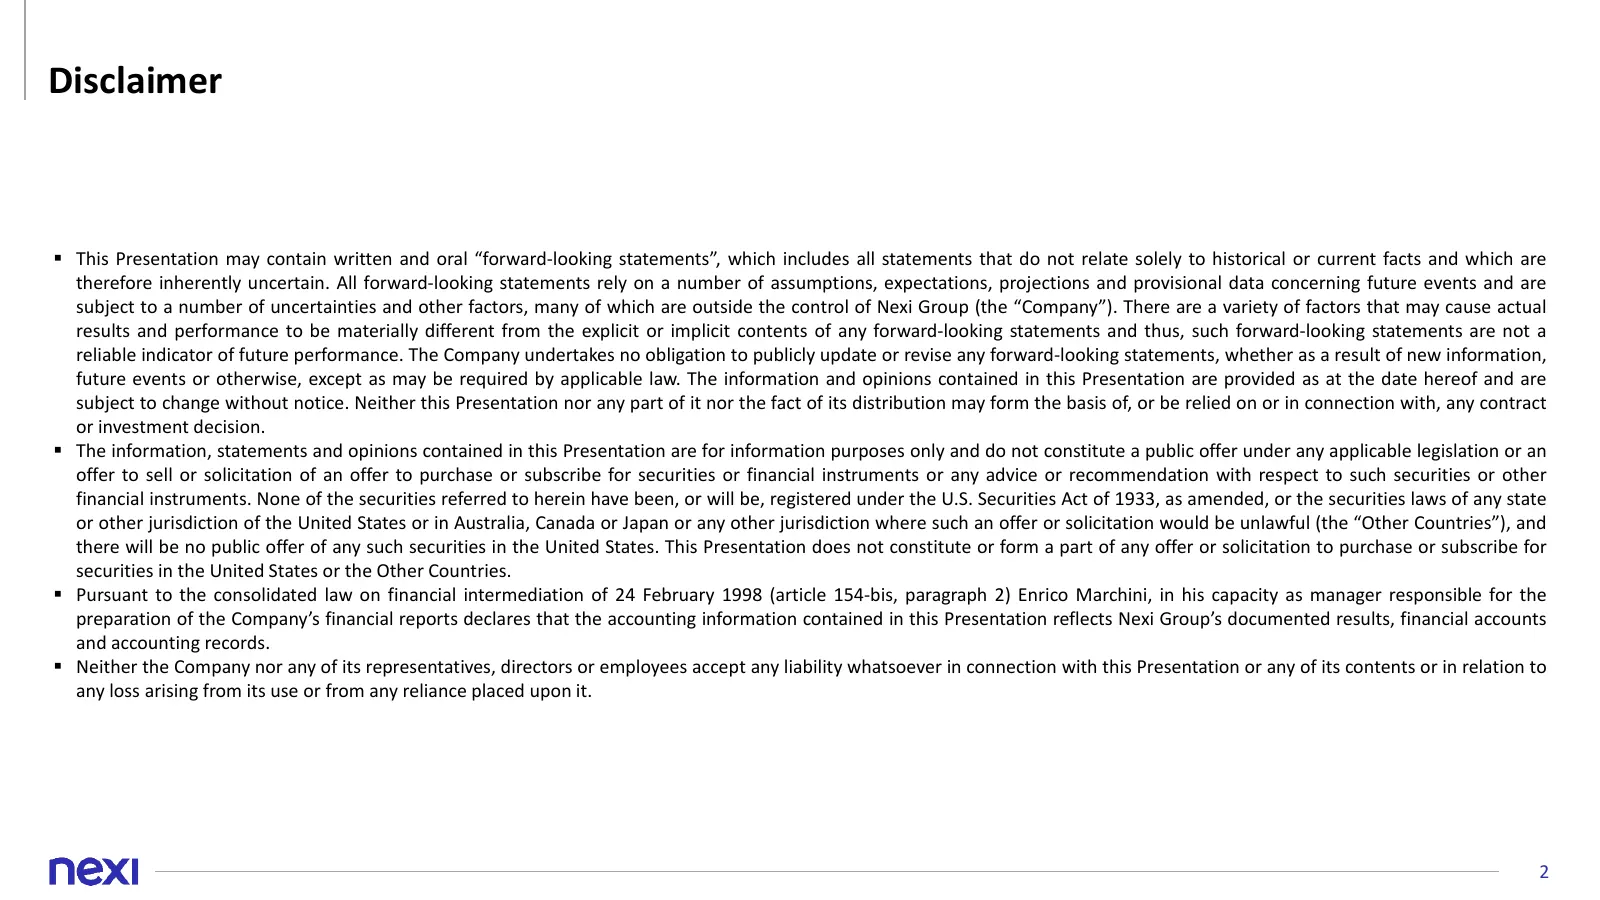
This content is classified as Internal Disclaimer ▪ This Presentation may contain written and oral “forward-looking statements”, which includes all statements that do not relate solely to historical or current facts and which are therefore inherently uncertain. All forward-looking statements rely on
Slide 3: 9M26 Key highlights
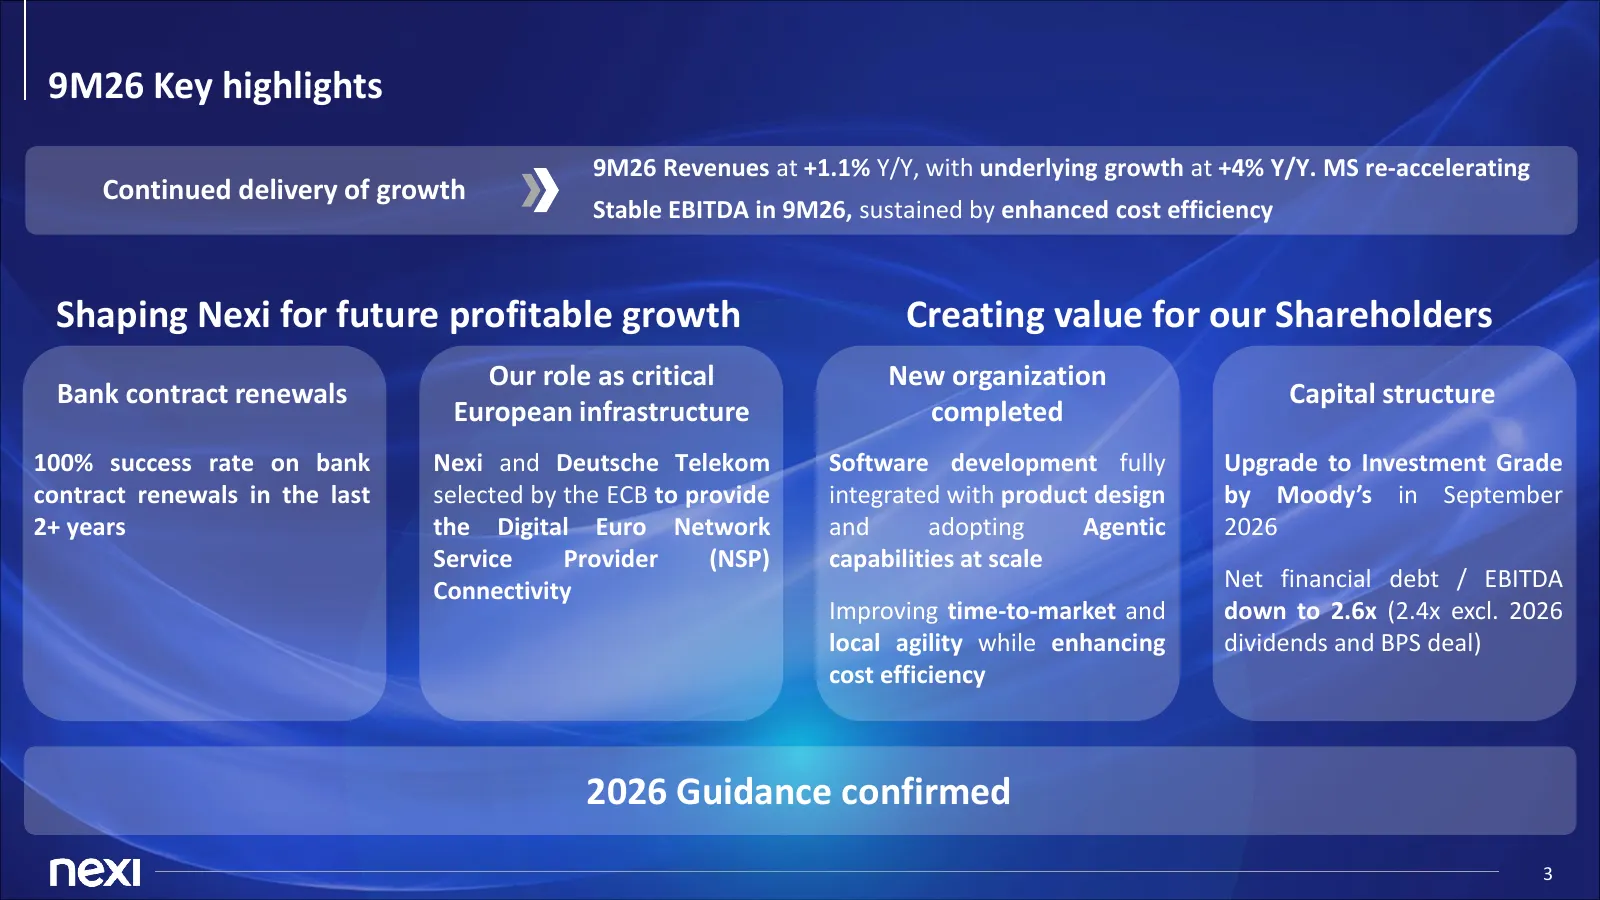
This content is classified as Internal 9M26 Key highlights 9M26 Revenues at +1.1% Y/Y, with underlying growth at +4% Y/Y. MS re-accelerating Continued delivery of growth Stable EBITDA in 9M26, sustained by enhanced cost efficiency Shaping Nexi for future profitable growth Creating value for our Shar
Slide 4: Focus on 9M26 results
This content is classified as Internal Focus on 9M26 results
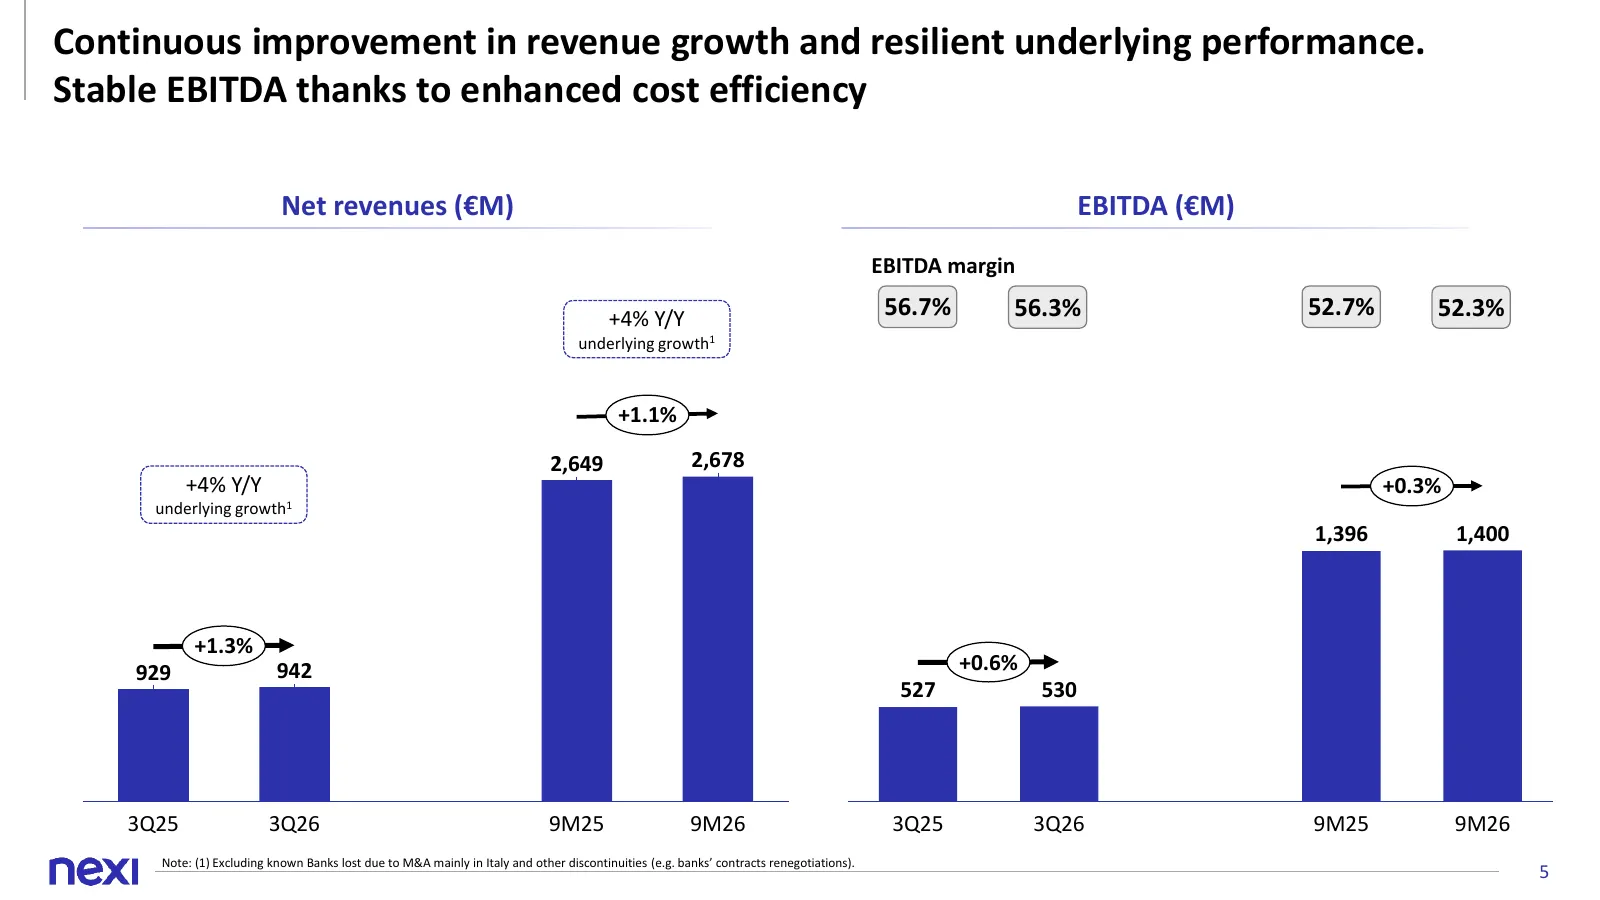
Slide 5: Continuous improvement in revenue growth and resilient underlying performance
This content is classified as Internal Continuous improvement in revenue growth and resilient underlying performance. Stable EBITDA thanks to enhanced cost efficiency Net revenues (€M) EBITDA (€M) EBITDA margin +4% Y/Y 56.7% 56.3% 52.7% 52.3% underlying growth1 +1.1% 2,649 2,678 +4% Y/Y +0.3% underl
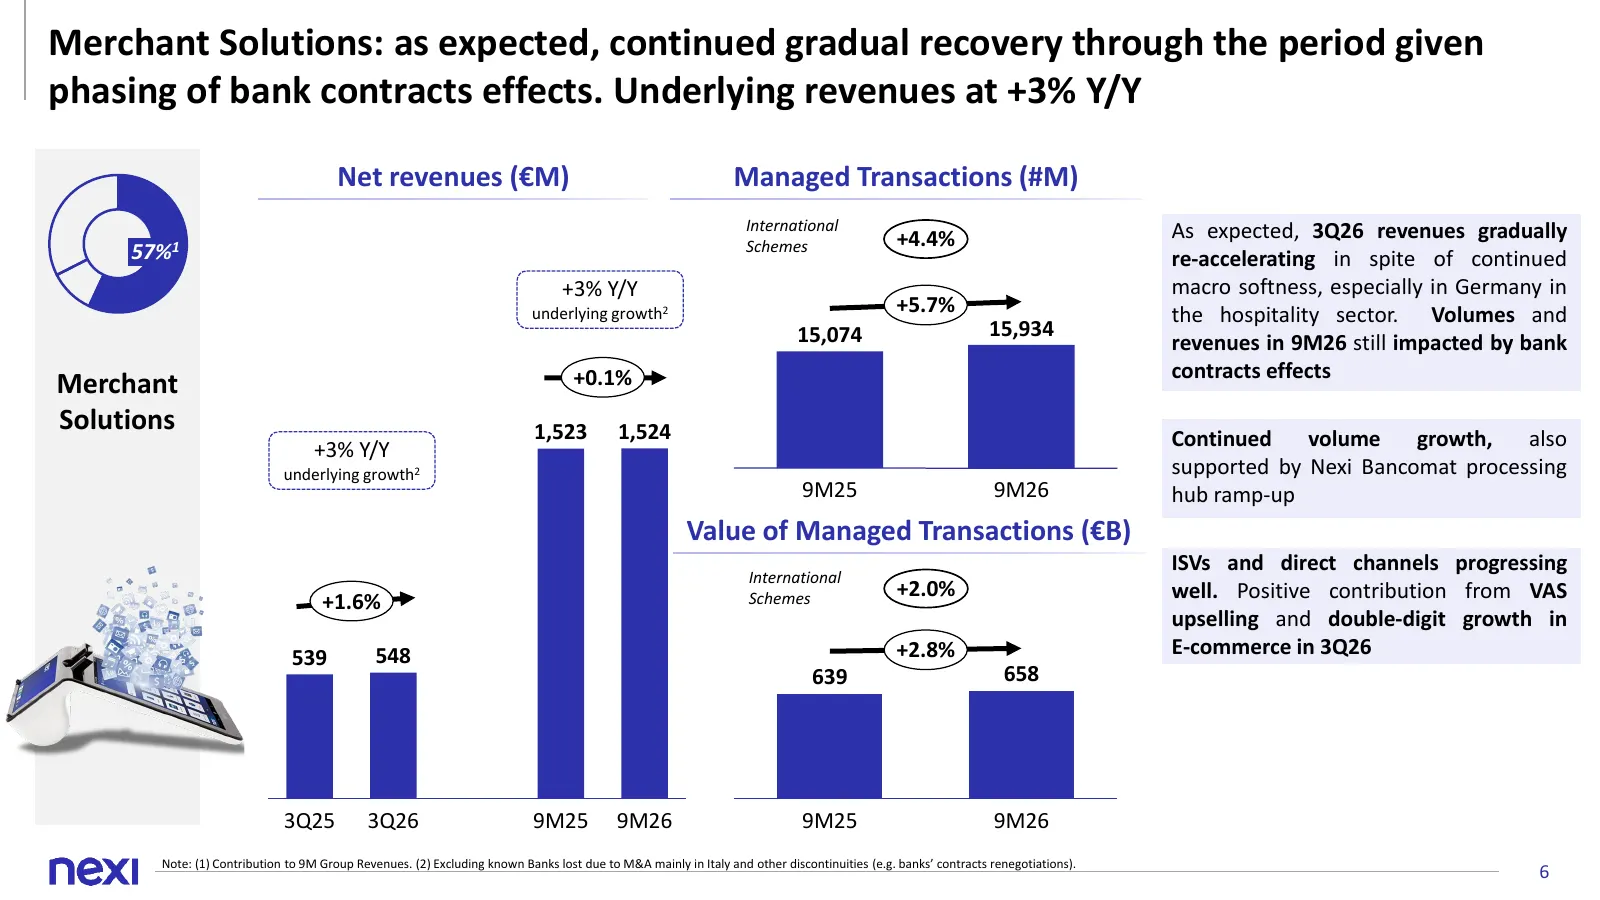
Slide 6: Merchant Solutions: continued gradual recovery through the period
This content is classified as Internal Merchant Solutions: as expected, continued gradual recovery through the period given phasing of bank contracts effects. Underlying revenues at +3% Y/Y Net revenues (€M) Managed Transactions (#M) International As expected, 3Q26 revenues gradually Schemes +4.4% 5
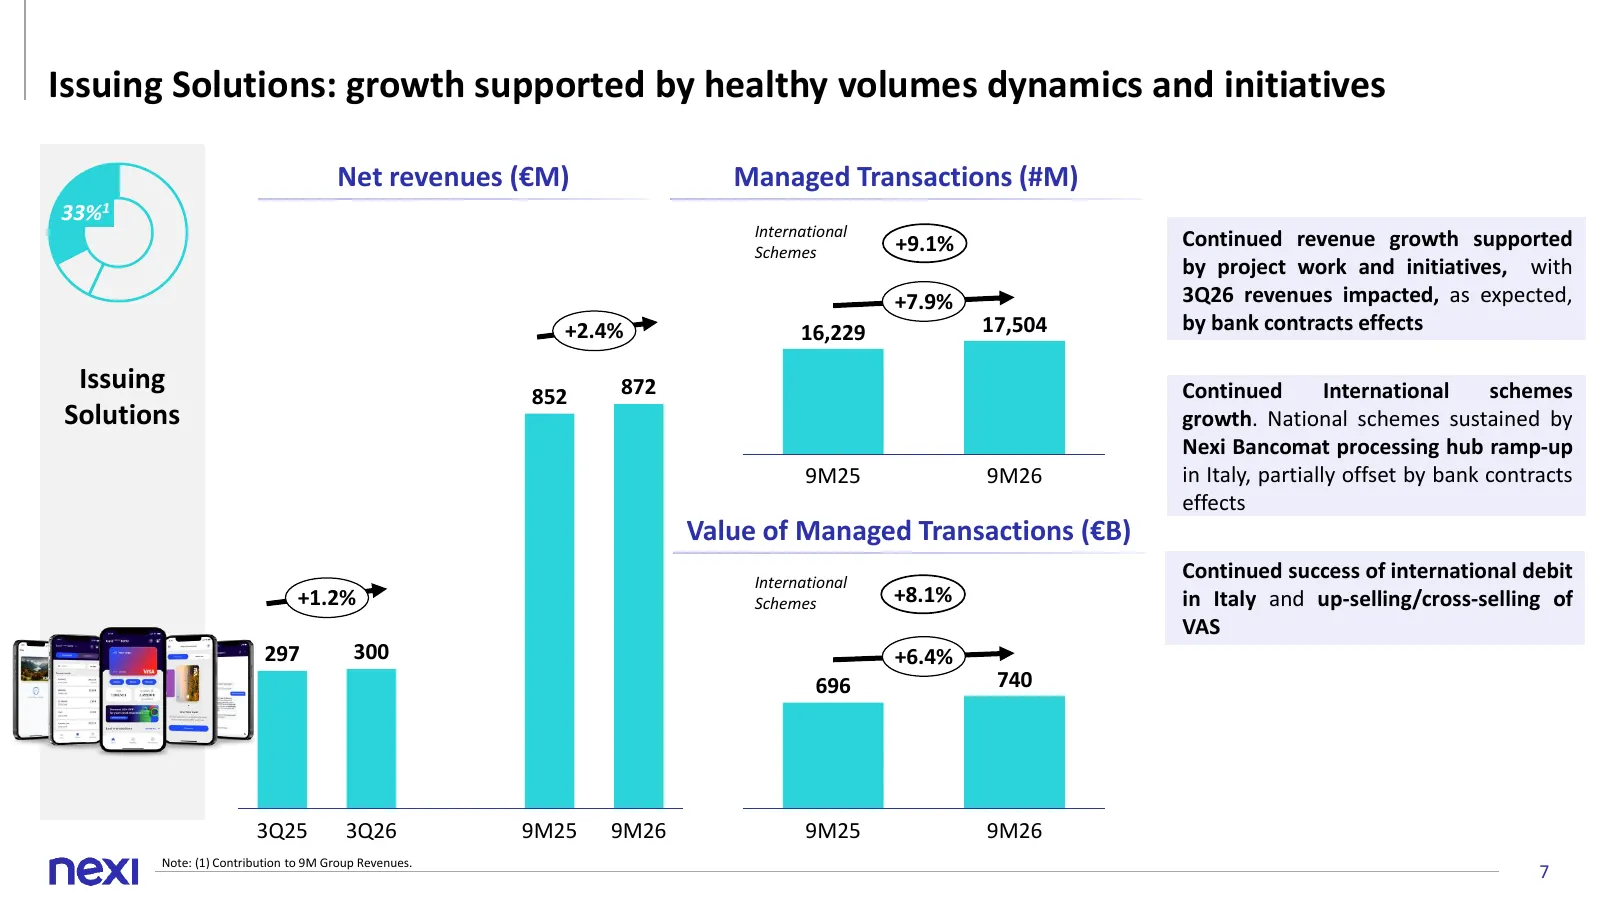
Slide 7: Issuing Solutions: growth supported by healthy volumes dynamics and initiatives
This content is classified as Internal Issuing Solutions: growth supported by healthy volumes dynamics and initiatives Net revenues (€M) Managed Transactions (#M) 33%1 International +9.1% Continued revenue growth supported Schemes by project work and initiatives, with +7.9% 3Q26 revenues impacted, a
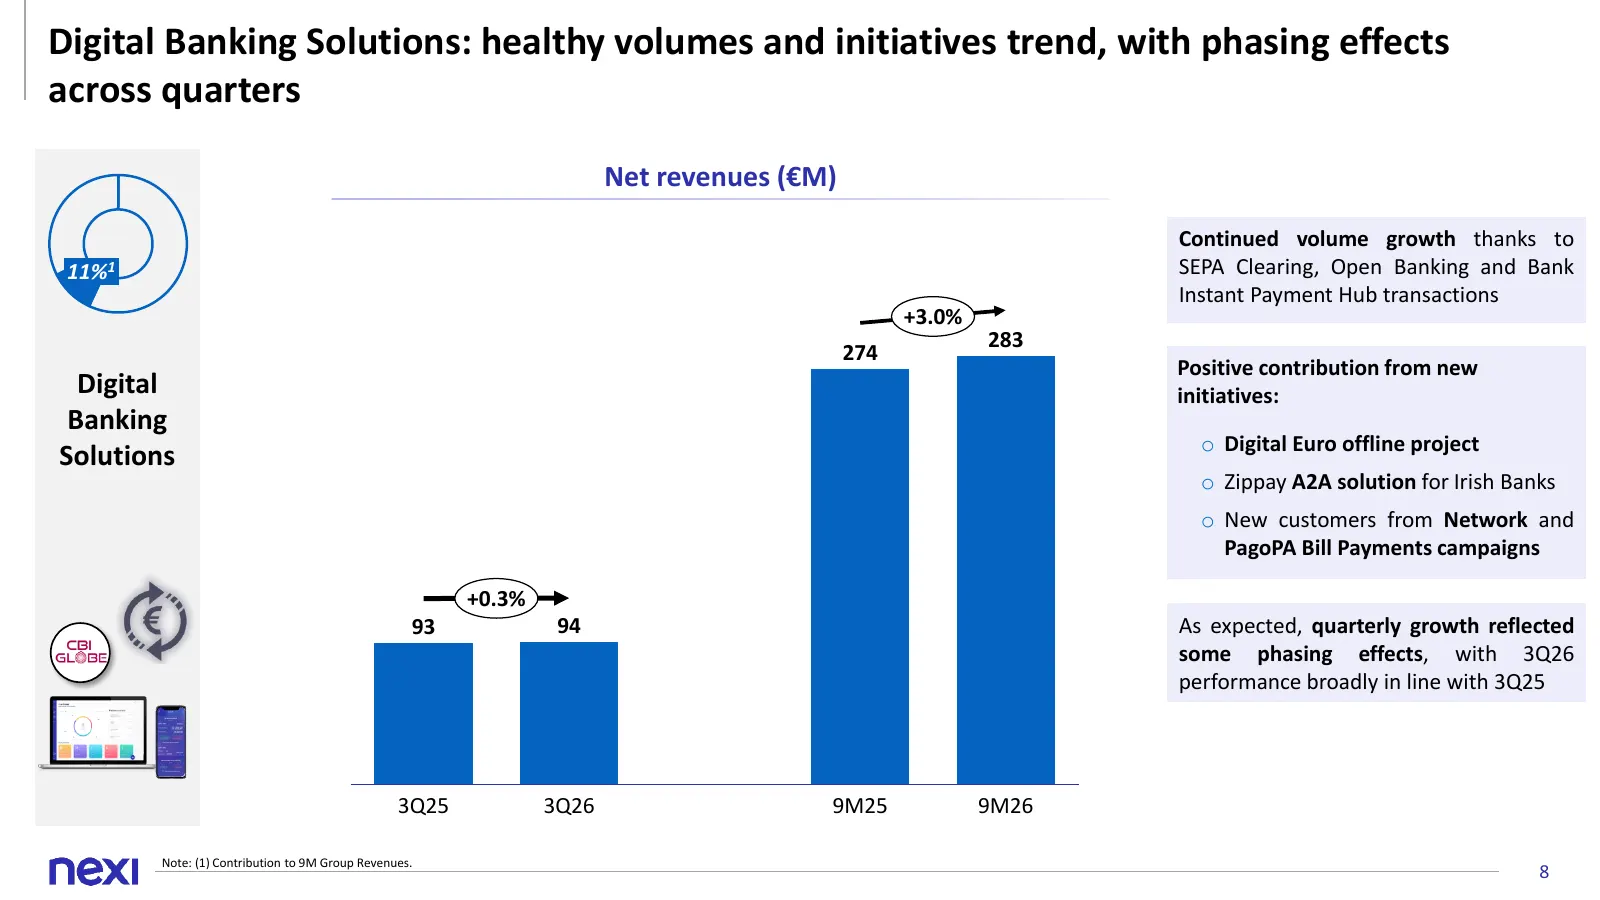
Slide 8: Digital Banking Solutions: healthy volumes and initiatives trend
This content is classified as Internal Digital Banking Solutions: healthy volumes and initiatives trend, with phasing effects across quarters Net revenues (€M) Continued volume growth thanks to 11%1 SEPA Clearing, Open Banking and Bank Instant Payment Hub transactions +3.0% 283 274 Positive contribu
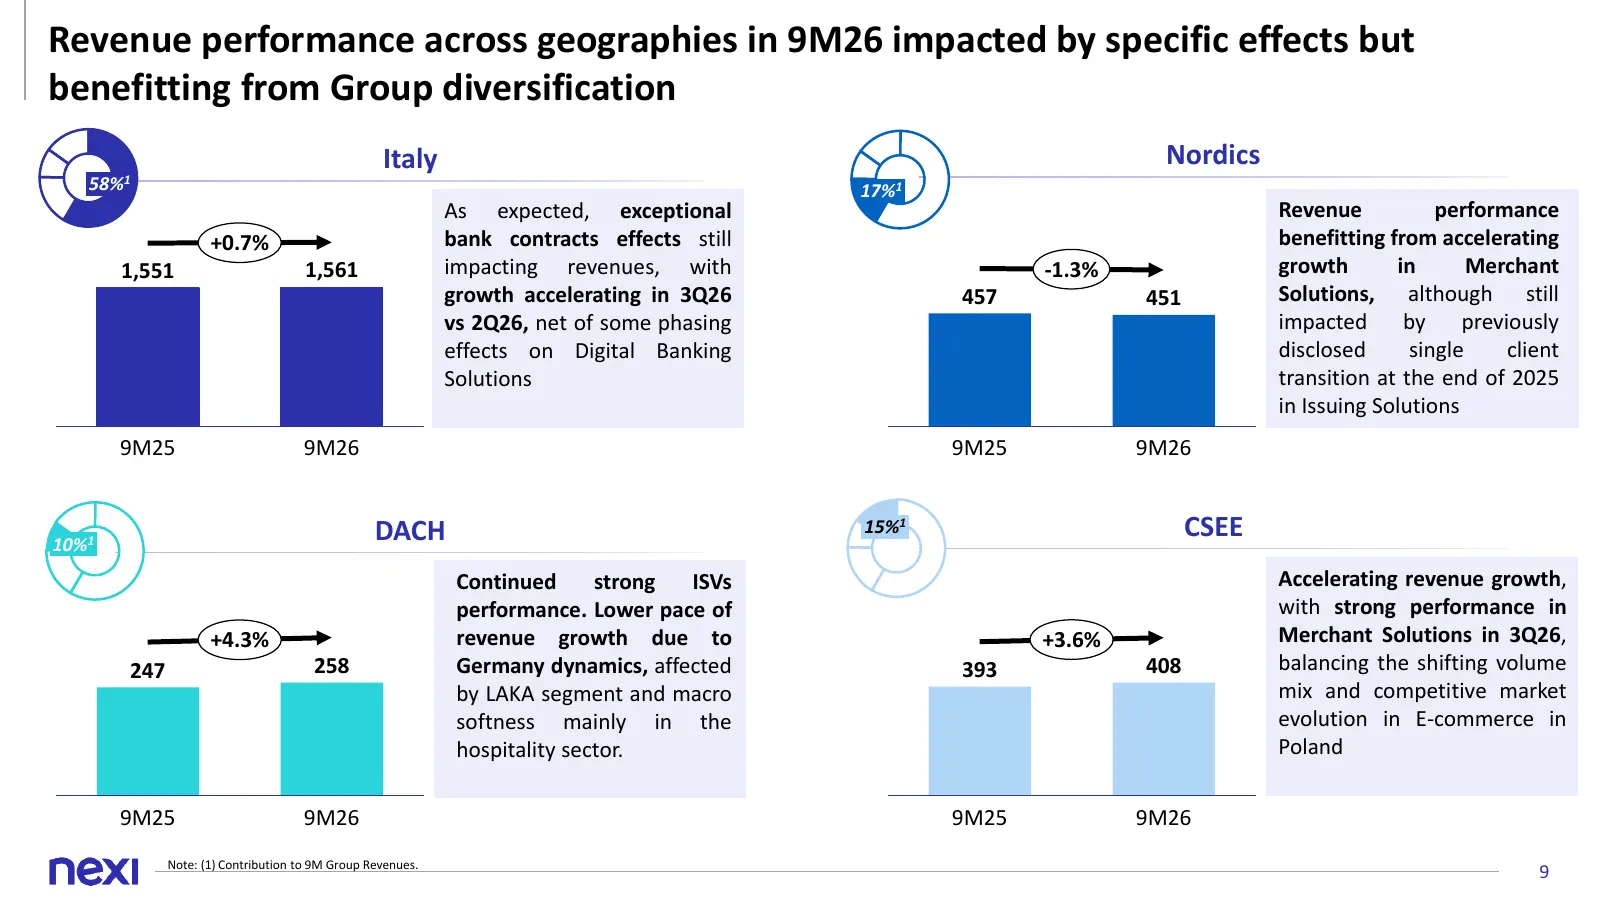
Slide 9: Revenue performance across geographies in 9M26
This content is classified as Internal Revenue performance across geographies in 9M26 impacted by specific effects but benefitting from Group diversification Italy Nordics 58%1 17%1 As expected, exceptional Revenue performance +0.7% bank contracts effects still benefitting from accelerating 1,551 1,
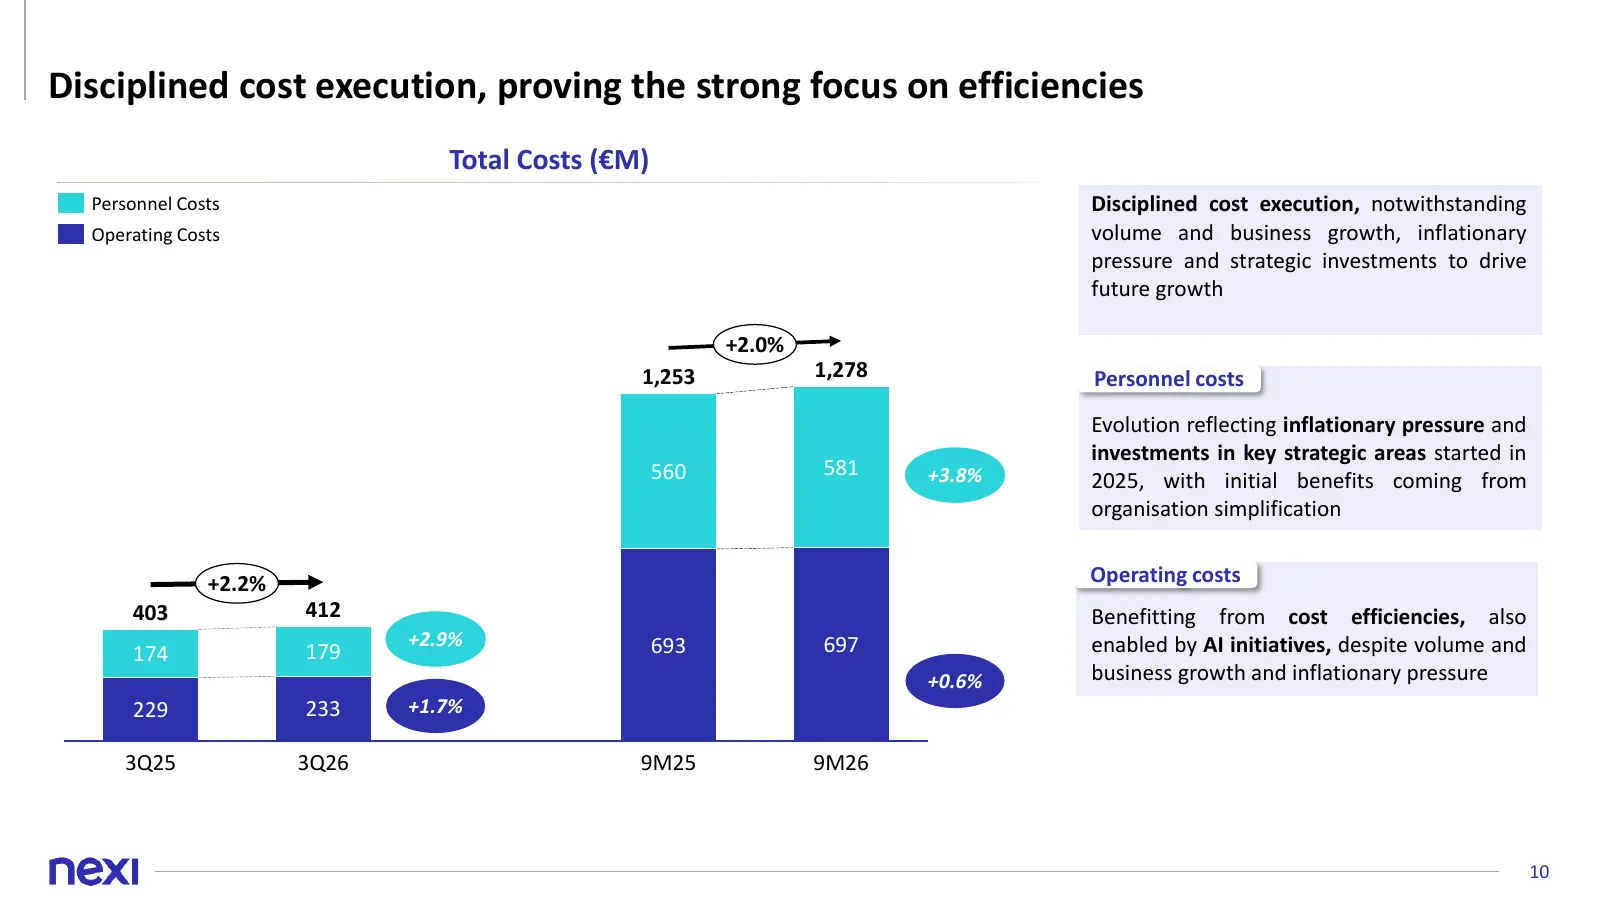
Slide 10: Disciplined cost execution, proving the strong focus on efficiencies
This content is classified as Internal Disciplined cost execution, proving the strong focus on efficiencies Total Costs (€M) Personnel Costs Disciplined cost execution, notwithstanding Operating Costs volume and business growth, inflationary pressure and strategic investments to drive future growth
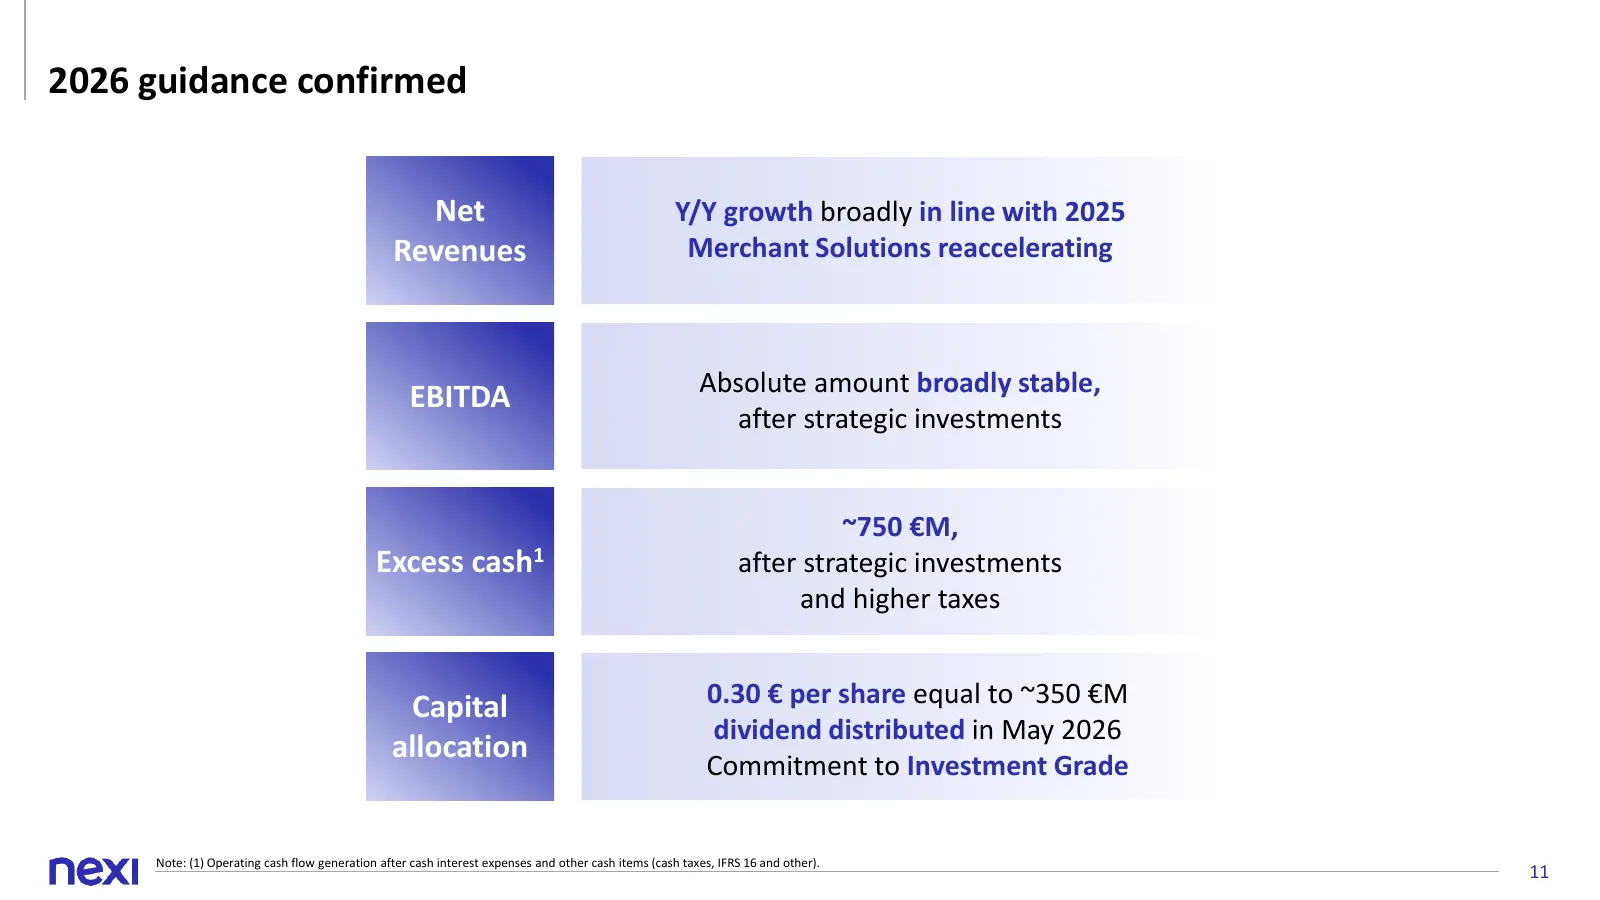
Slide 11: 2026 guidance confirmed
This content is classified as Internal 2026 guidance confirmed Net Y/Y growth broadly in line with 2025 Revenues Merchant Solutions reaccelerating Absolute amount broadly stable, EBITDA after strategic investments ~750 €M, Excess cash1 after strategic investments and higher taxes Capital 0.30 € per

Slide 12: Q&A
This content is classified as Internal Q&A
Slide 13: Annex
This content is classified as Internal Annex
Slide 14: Group P&L
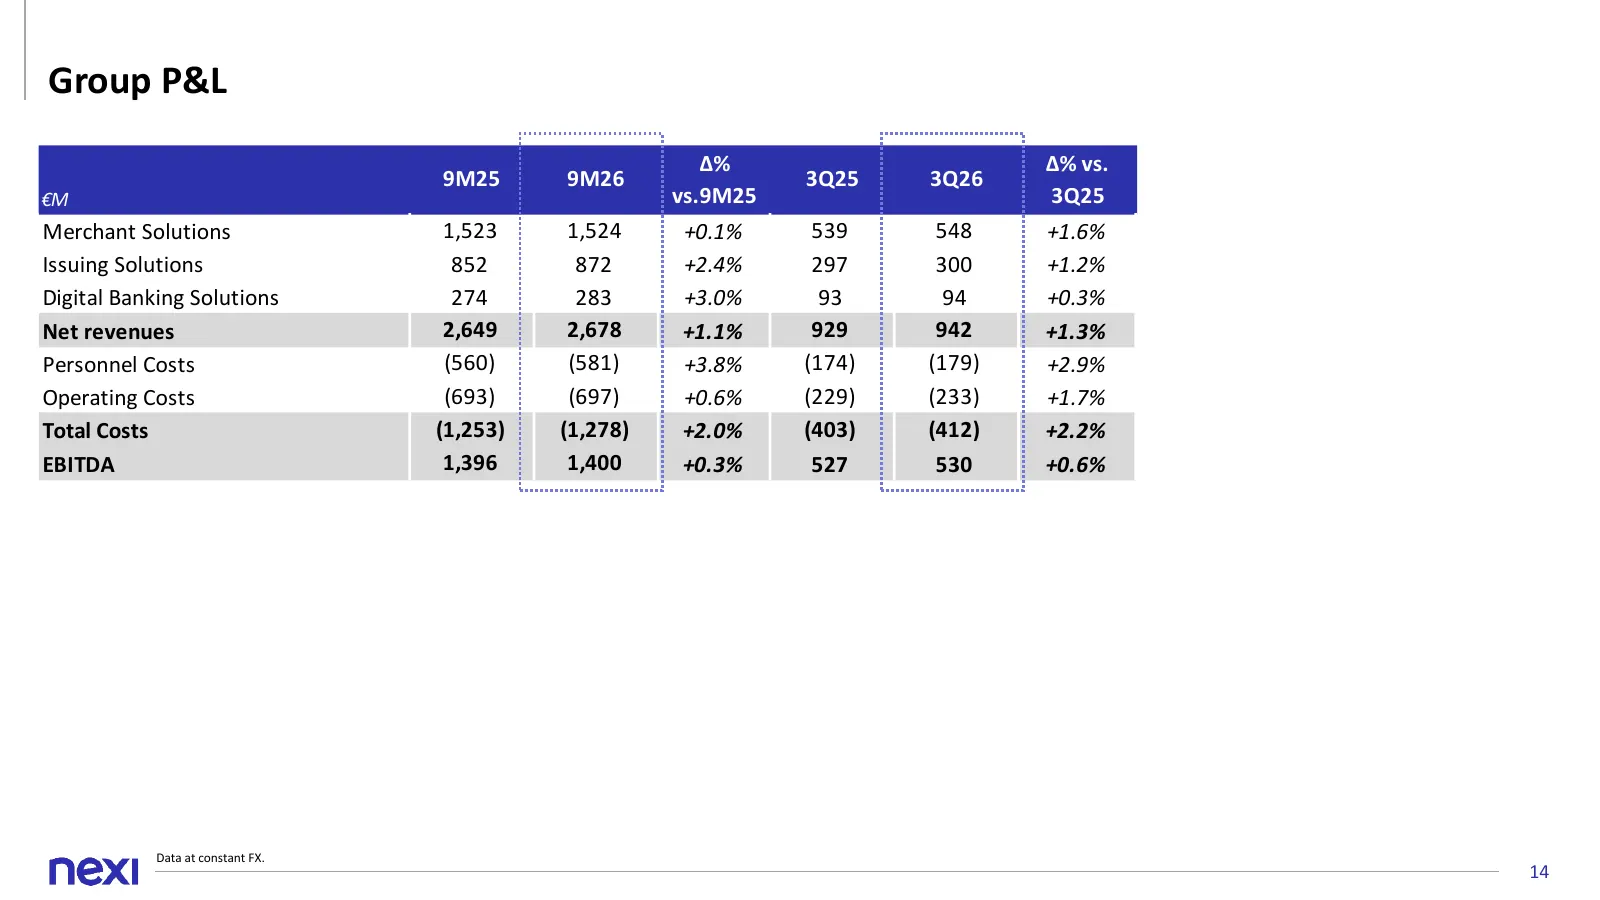
This content is classified as Internal Group P&L Δ% Δ% vs. 9M25 9M26 3Q25 3Q26 €M vs.9M25 3Q25 Merchant Solutions 1,523 1,524 +0.1% 539 548 +1.6% Issuing Solutions 852 872 +2.4% 297 300 +1.2% Digital Banking Solutions 274 283 +3.0% 93 94 +0.3% Net revenues 2,649 2,678 +1.1% 929 942 +1.3% Personnel C
Slide 15: Well diversified revenue base by business and geography
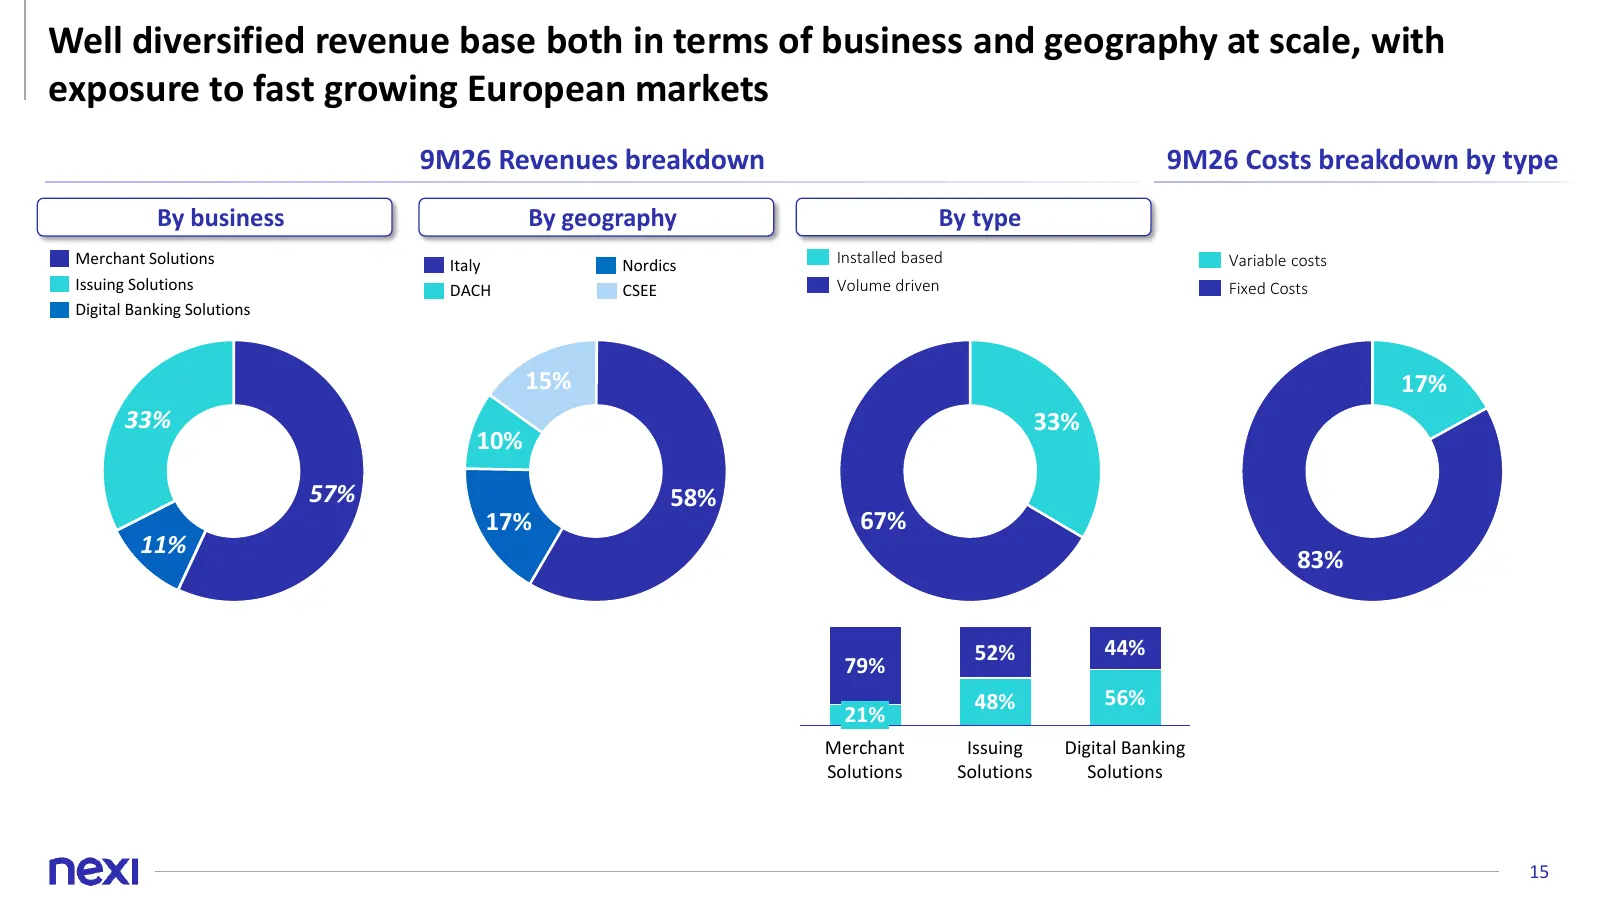
This content is classified as Internal Well diversified revenue base both in terms of business and geography at scale, with exposure to fast growing European markets 9M26 Revenues breakdown 9M26 Costs breakdown by type By business By geography By type Merchant Solutions Italy Nordics Installed based
Slide 16: Net Financial Debt / EBITDA down at 2.6x
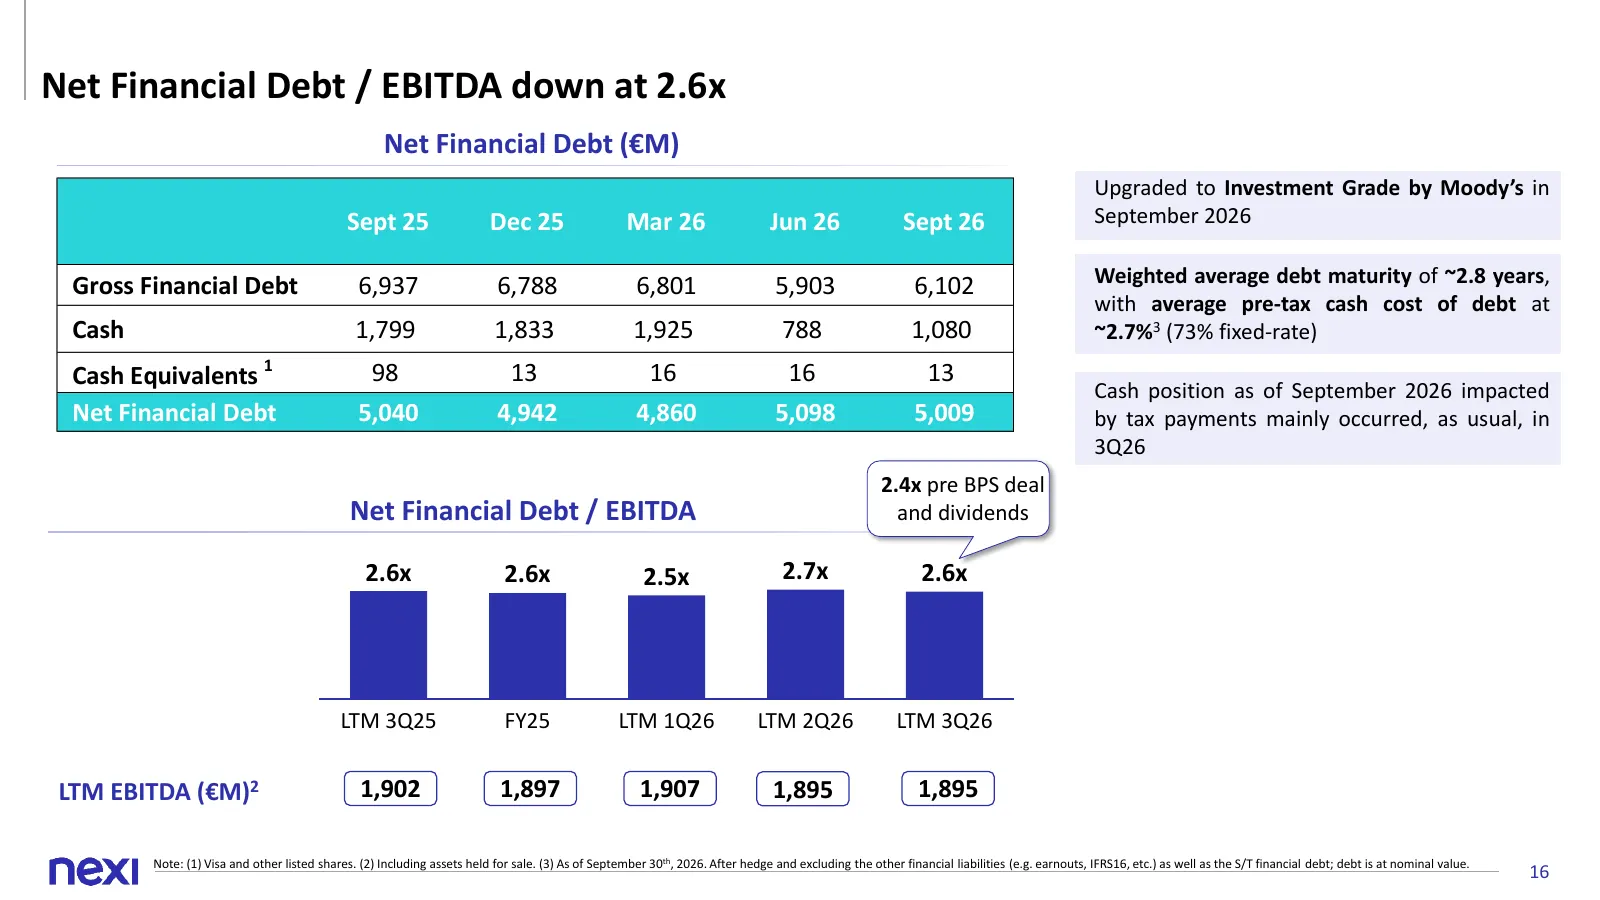
This content is classified as Internal Net Financial Debt / EBITDA down at 2.6x Net Financial Debt (€M) Upgraded to Investment Grade by Moody’s in Sept 25 Dec 25 Mar 26 Jun 26 Sept 26 September 2026 Gross Financial Debt 6,937 6,788 6,801 5,903 6,102 Weighted average debt maturity of ~2.8 years, with
Slide 17: Debt maturities as of 9M26
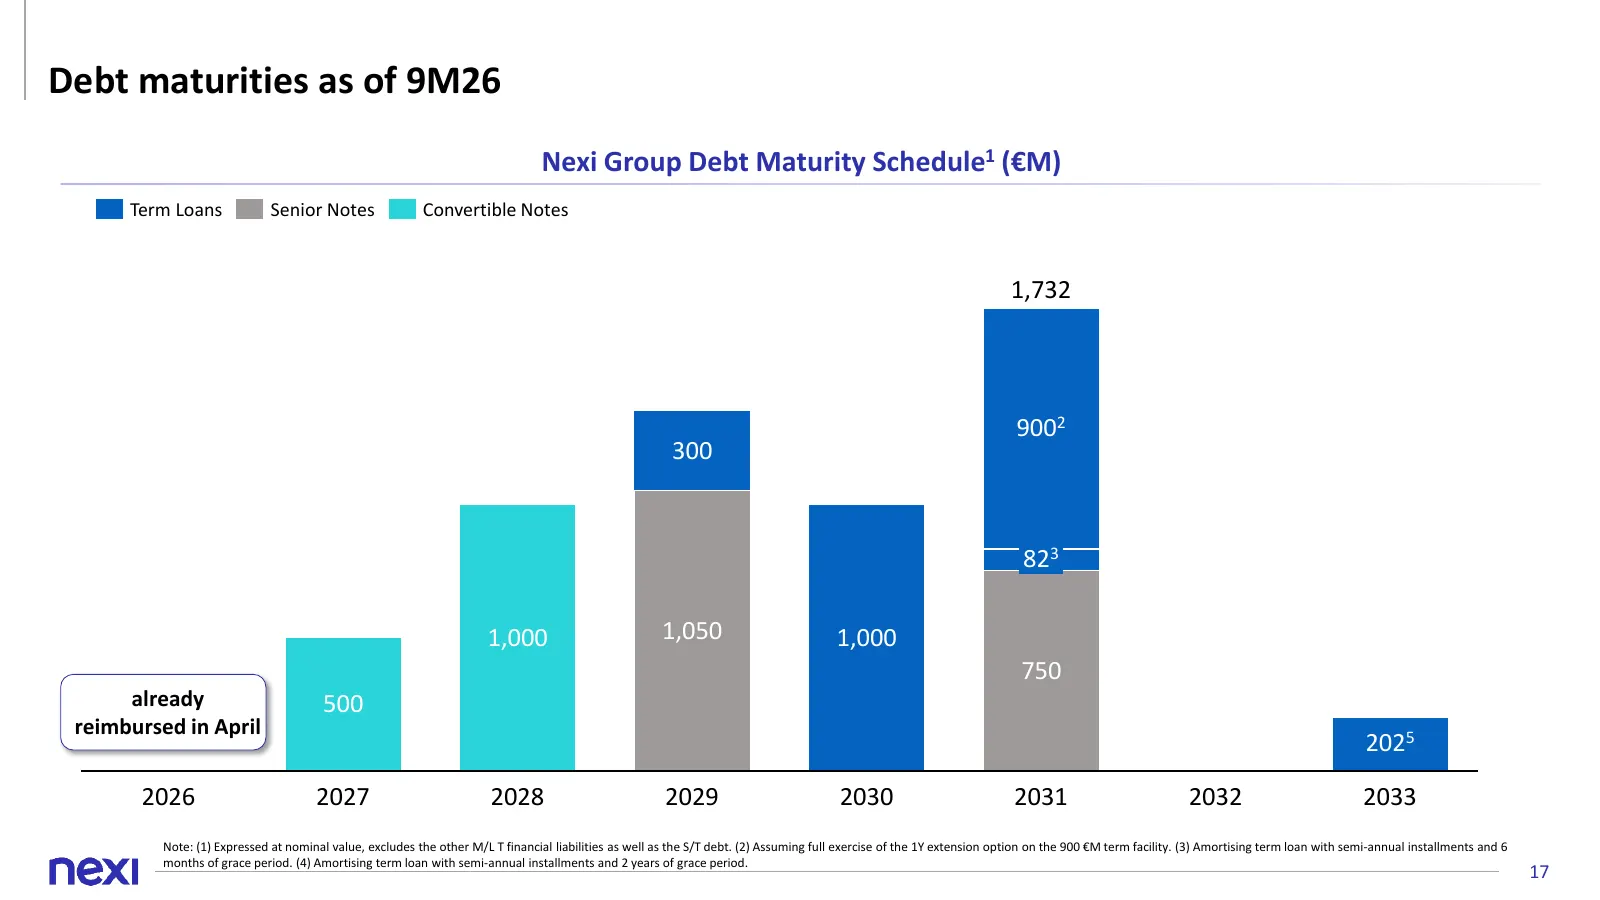
This content is classified as Internal Debt maturities as of 9M26 Nexi Group Debt Maturity Schedule1 (€M) Term Loans Senior Notes Convertible Notes 1,732 9002 300 823 1,000 1,050 1,000 750 already 500 reimbursed in April 2025 2026 2027 2028 2029 2030 2031 2032 2033 Note: (1) Expressed at nominal val

Slide 18: Investor Relations
This content is classified as Internal Investor Relations investor.relations@nexigroup.com Stefania Mantegazza stefania.mantegazza@nexigroup.com
Source: 6ix earnings call
More decks from Nexi S.p.A.
 H1 2026 Earnings Presentation23 slides · Jul 29, 2026
 Q1 2026 Earnings Presentation19 slides · May 7, 2026
 9M25 Earnings Presentation21 slides · Nov 5, 2025
 1H25 Earnings Presentation25 slides · Jul 31, 2025
 Q1 2025 Earnings Presentation24 slides · May 8, 2025
 FY2024 Earnings Presentation31 slides · Feb 28, 2025