Bridge Capital — Shareholder Meeting (May 2010)
35 slides from Bridge Capital's shareholder meeting presentation, May 20, 2010

Slide 1: Annual Shareholders Meeting
CAPITAL HOLDINGS Annual Shareholders Meeting May 20, 2010 Daniel P. Myers Allan C. Kramer, M.D. BRIDGE CAPITAL HOLDINGS President Chairman NASDAQ: BENK Chief Executive Officer BRIDGECAPITALHOLDINGS.COM
Slide 2: Forward Looking Statements
Forward Looking Statements Certain matters discussed herein constitute forward-looking statements within the meaning of the Private Securities Litigation Reform Act of 1995, and are subject to the safe harbors created by that Act. Forward-looking statements describe future plans, strategies, and exp

Slide 3: Chairman's Comments
CAPITAL HOLDINGS | CHAIRMAN’S ‘i COMMENTS BRIDGE CAPITAL HOLDINGS Allan C. Kramer, M.D. Chairman
Slide 4: Board of Directors
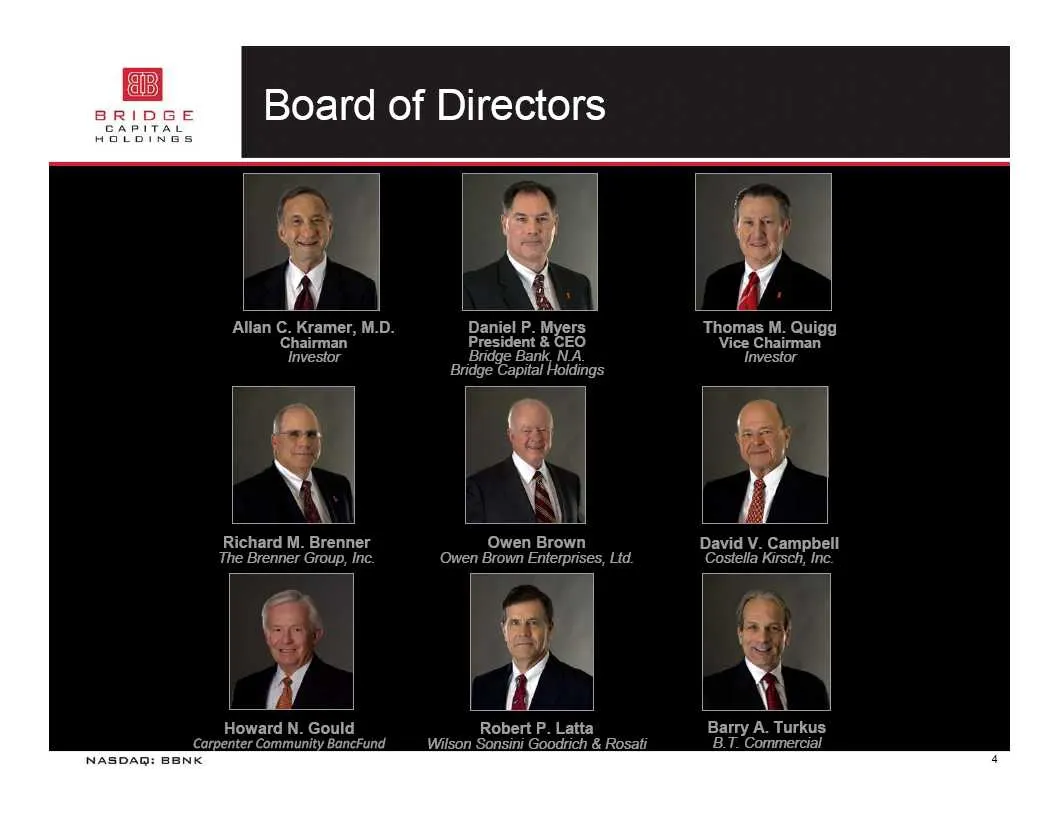
Allan C. Kramer, M.D Daniel P. Myers Thomas M. Quigg Chairman President & CEO Vice Chairman Investor B al A. Investor ‘i ‘oo Richard M. Brenner Owen Brown David V. Campbell The Brenner Group, Inc. Owen Brown Enterprises, Ltd. Costella Kirsch, Inc Howard N. Gould Robert P. Latta Barry A. Turkus Carpe
Slide 5: Shareholder Briefing
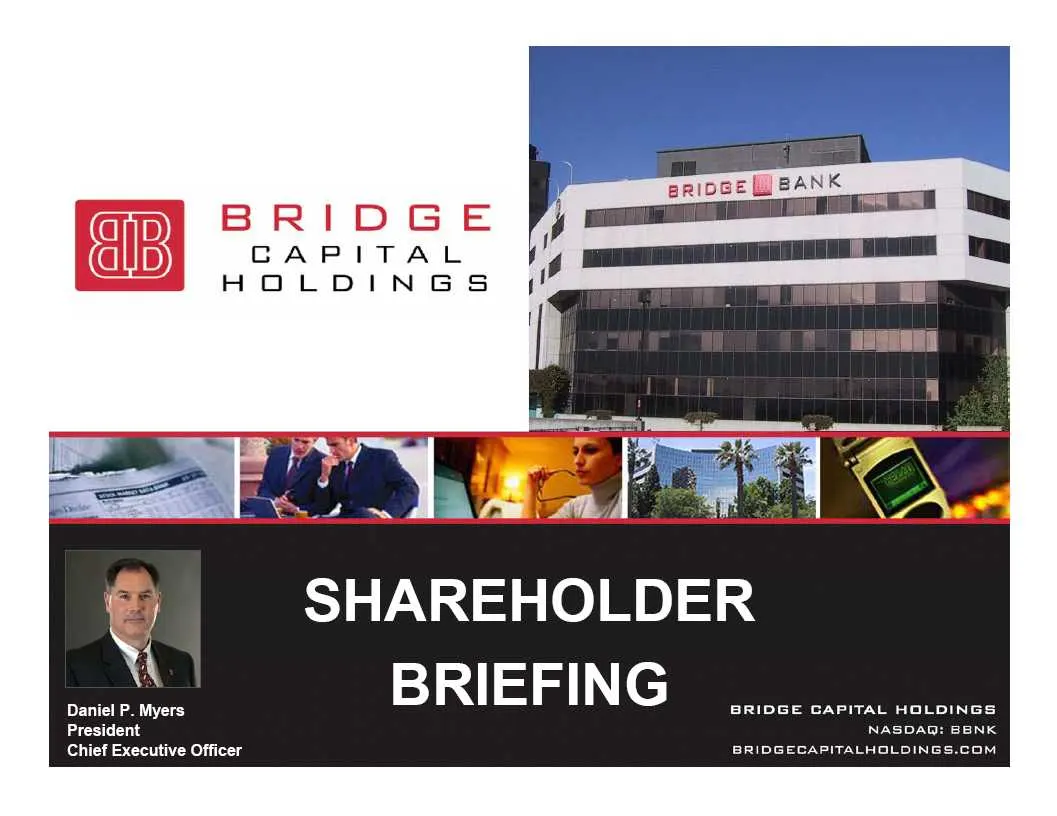
7 erioGe BANK DGE f iy 1 ms LV L INGS |! @ SHAREHOLDER X BRIEFING Daniel P. Myers BRIDGE CAPITAL HOLDINGS President K Chief Executive Officer
Slide 6: The Environment
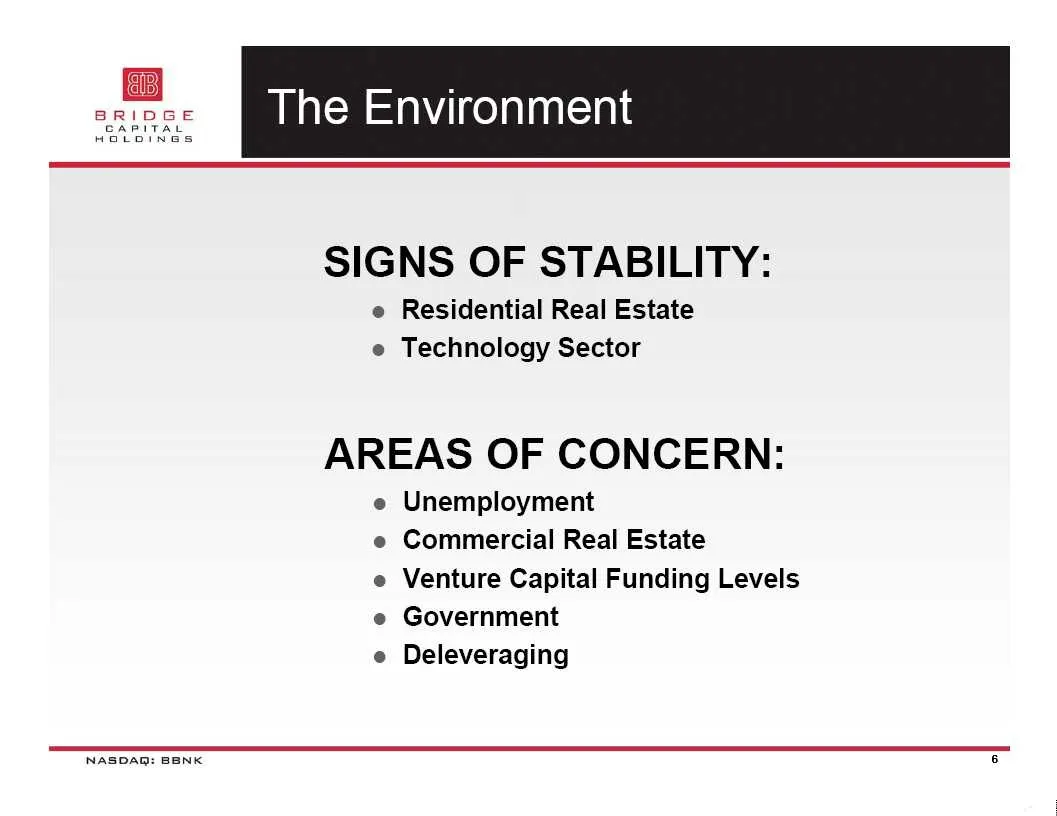
NASDAQ: BENK The Environment SIGNS OF STABILITY: e Residential Real Estate e Technology Sector AREAS OF CONCERN: e Unemployment Commercial Real Estate Venture Capital Funding Levels Government e e e e Deleveraging
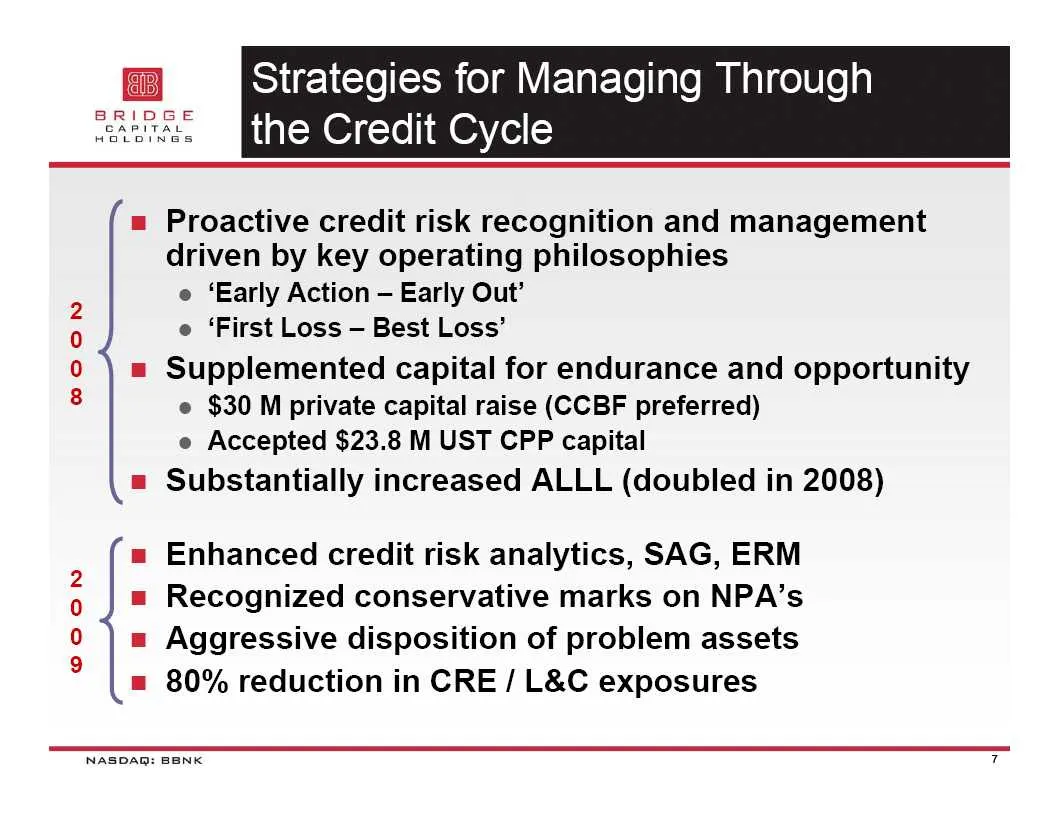
Slide 7: Proactive credit risk management and capital
ewoon o©oOon = Proactive credit risk recognition and management driven by key operating philosophies e ‘Early Action — Early Out’ e ‘First Loss — Best Loss’ = Supplemented capital for endurance and opportunity e $30 M private capital raise (CCBF preferred) e Accepted $23.8 M UST CPP capital Substant
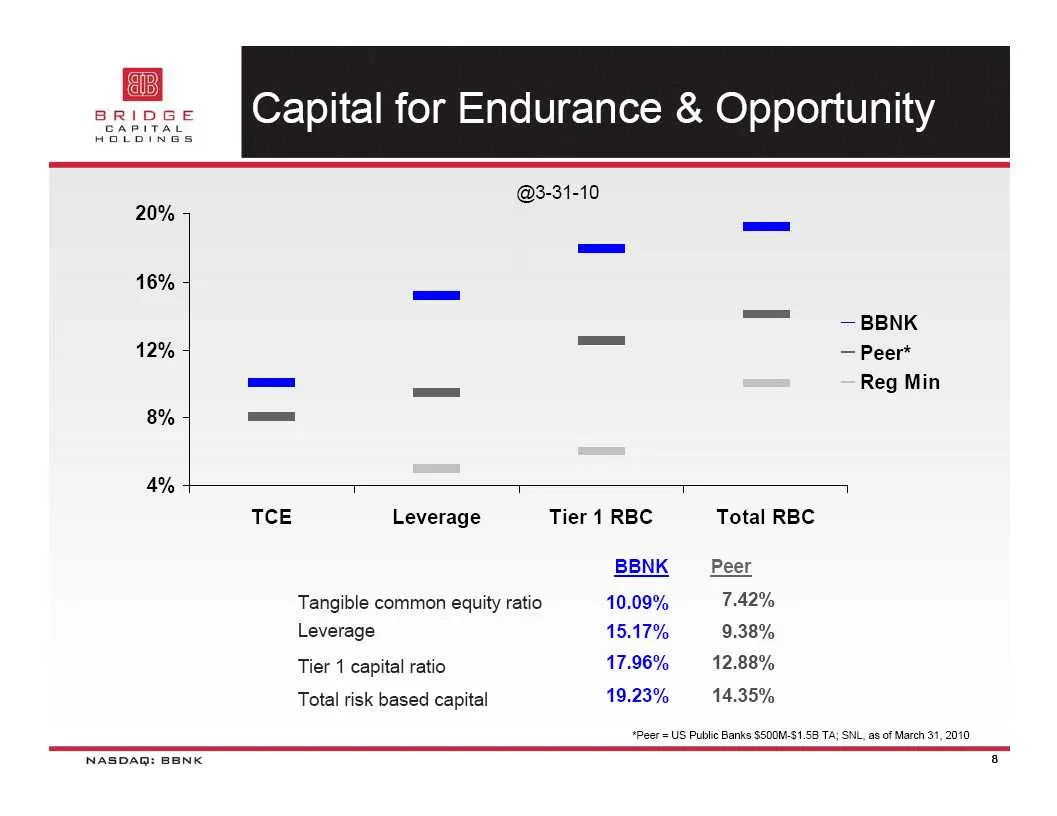
Slide 8: Capital ratios versus peers
@3-31-10 20% — = 16% = — BBNK 12% = —Peer* — — Reg Min 8% — A% + T T T 1 TCE Leverage Tier 1 RBC Total RBC BBNK Peer Tangible common equity ratio 10.09% TA2% Leverage 15.17% 9.38% Tier 1 capital ratio 17.96% 12.88% Total risk based capital 19.23% 14.35% *Peer = US Public Banks $S00M-S1.58 TA; SNL, a
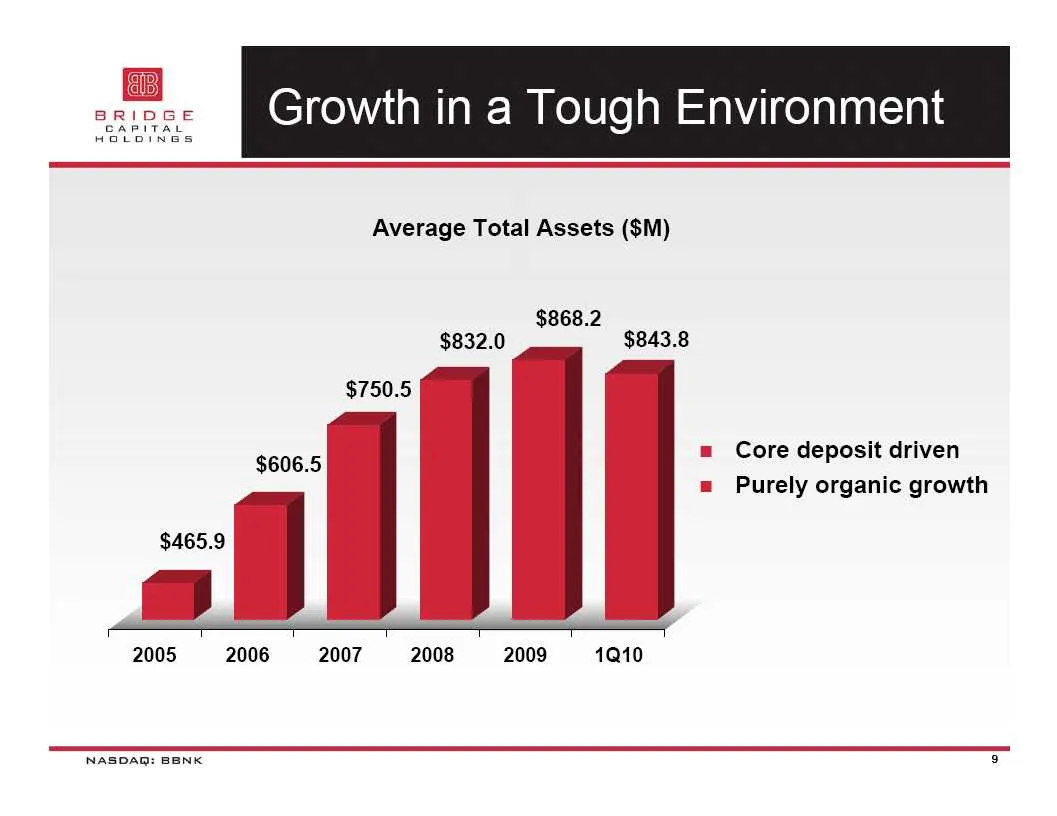
Slide 9: Growth in a Tough Environment
Growth in a Tough Environment Average Total Assets ($M) $868.2 $832.0 $843.8 = Core deposit driven = Purely organic growth 2005 2006 2007 2008 2009 1Q10 NASDAQ: BENK @
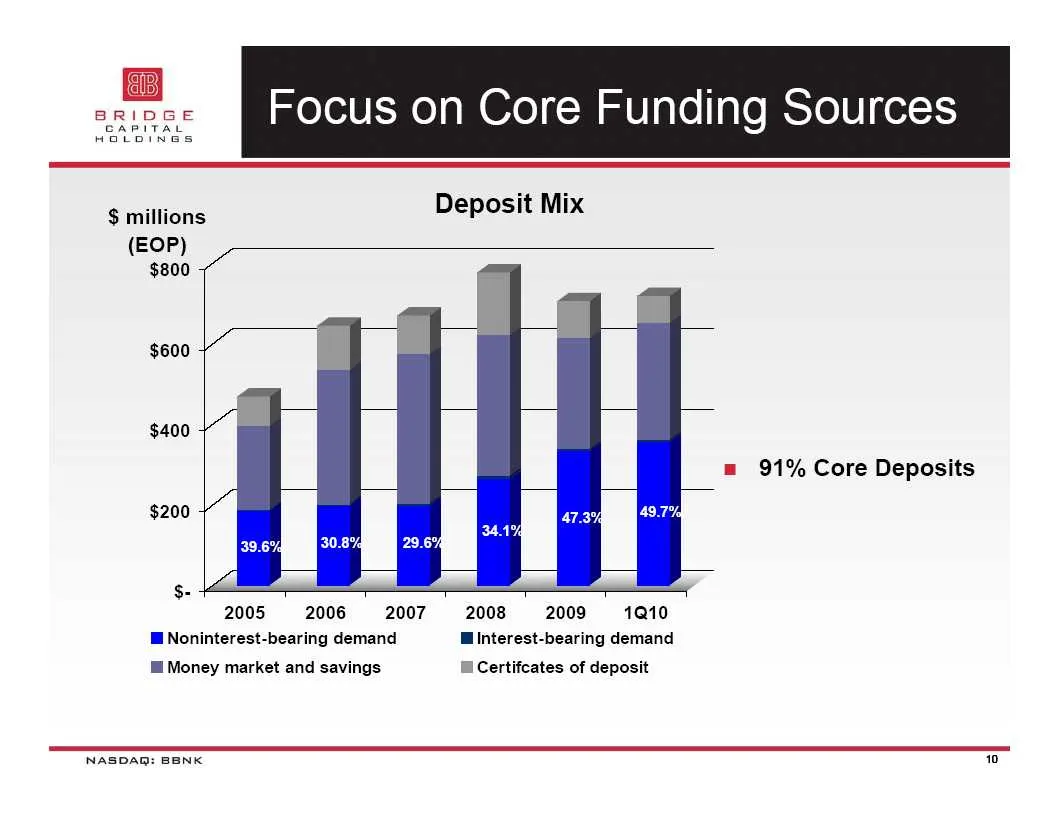
Slide 10: Deposit growth and mix
$ millions (EOP) $800 $600 $400 $200 $- MNoninterest-bearing demand li Money market and savings ea _. 2005 2006 2007 2008 2009 1Q10 interest-bearing demand Certifcates of deposit = 91% Core Deposits
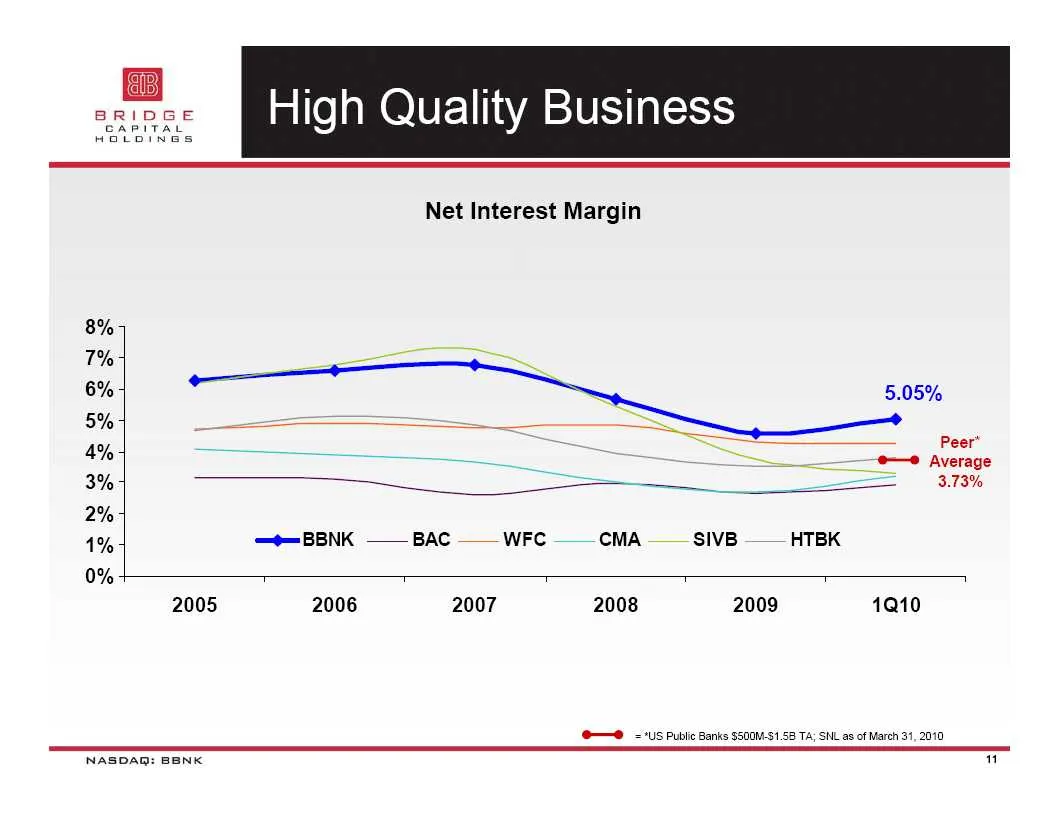
Slide 11: Performance versus peers
8% T% 6% 5.05% 5% Peer® 4% = _ —*—* Average 3% SSS SS ee SS 2% 1% —e—BBNK BAC WFC CMA SIVB HTBK 0% + 2005 2006 2007 2008 2009 1Q10 lic Banks SS00M-S1.58 TA; SNL as of Mareh 31, 2010 NASDAQ: BENK TT
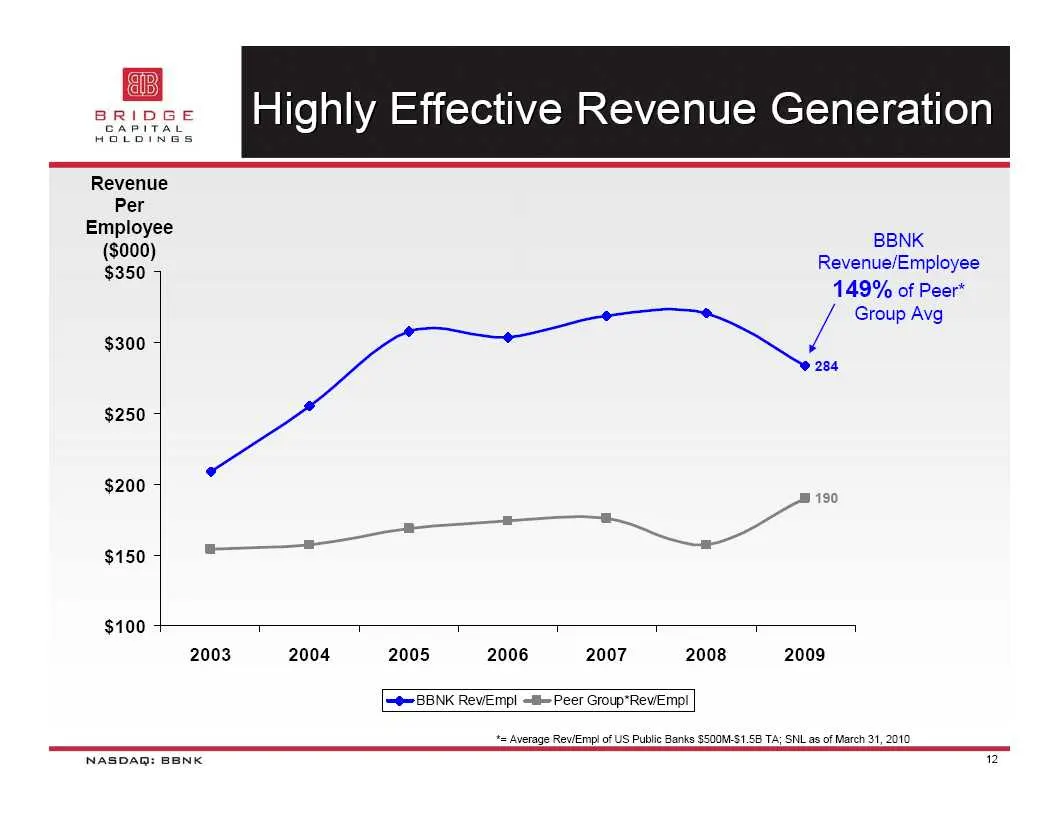
Slide 12: Highly Effective Revenue Generation
Highly Effective Revenue Generation Revenue Per Employee ($000) BBNK $350 7 Revenue/Employee 149% of Peer* / Group Avg $300 5 284 $250 5 On oN 190 $150 5 $100 T T T T : T 1 2003 2004 2005 2006 2007 2008 2009 [=e=BBNK RevEmpl == Peer Group*RevEmp! += Average ReviEmp! of US Public Banks SSO0M-S1.5B TA
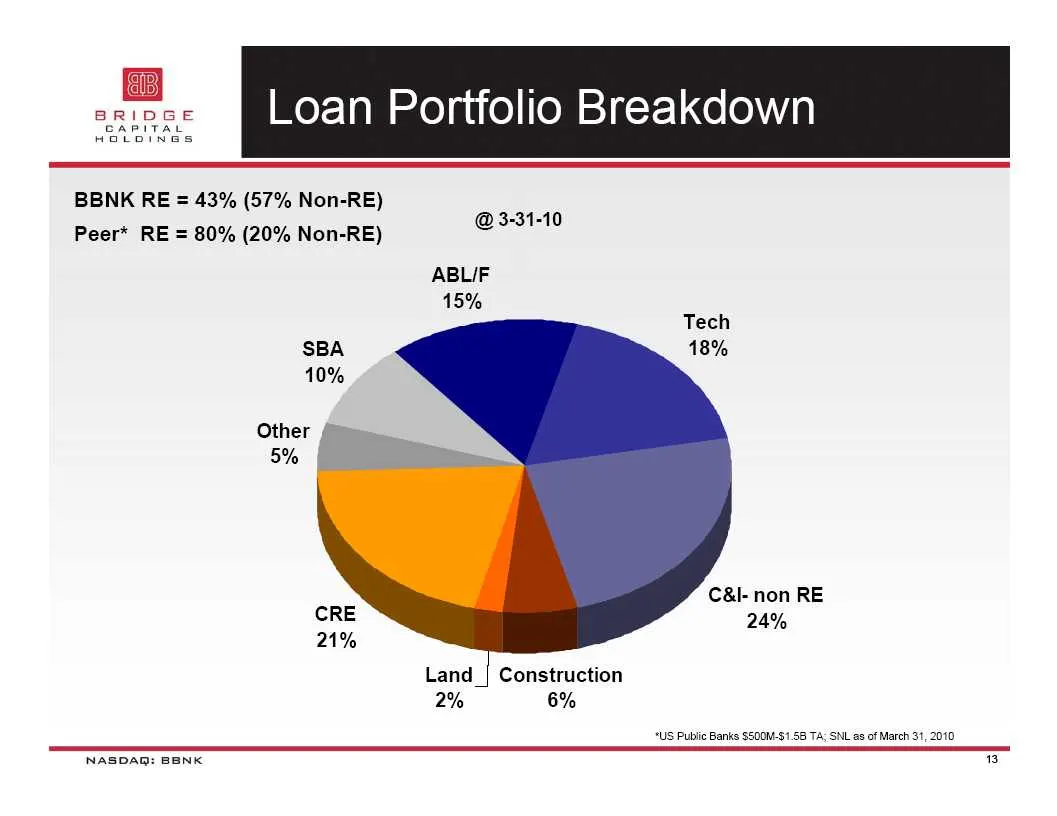
Slide 13: Loan Portfolio Breakdown
Loan Portfolio Breakdown BBNK RE = 43% (57% Non-RE) 3-31-10 Peer* RE = 80% (20% Non-RE) @ ABLIF 15% Other (© 5% C&l-non RE 24% Land_| Construction 2% 6% *US Public Banks SS00W-$1.58 TA; SNL 2s of March 31, 2010 NASDAQ: BENK 13
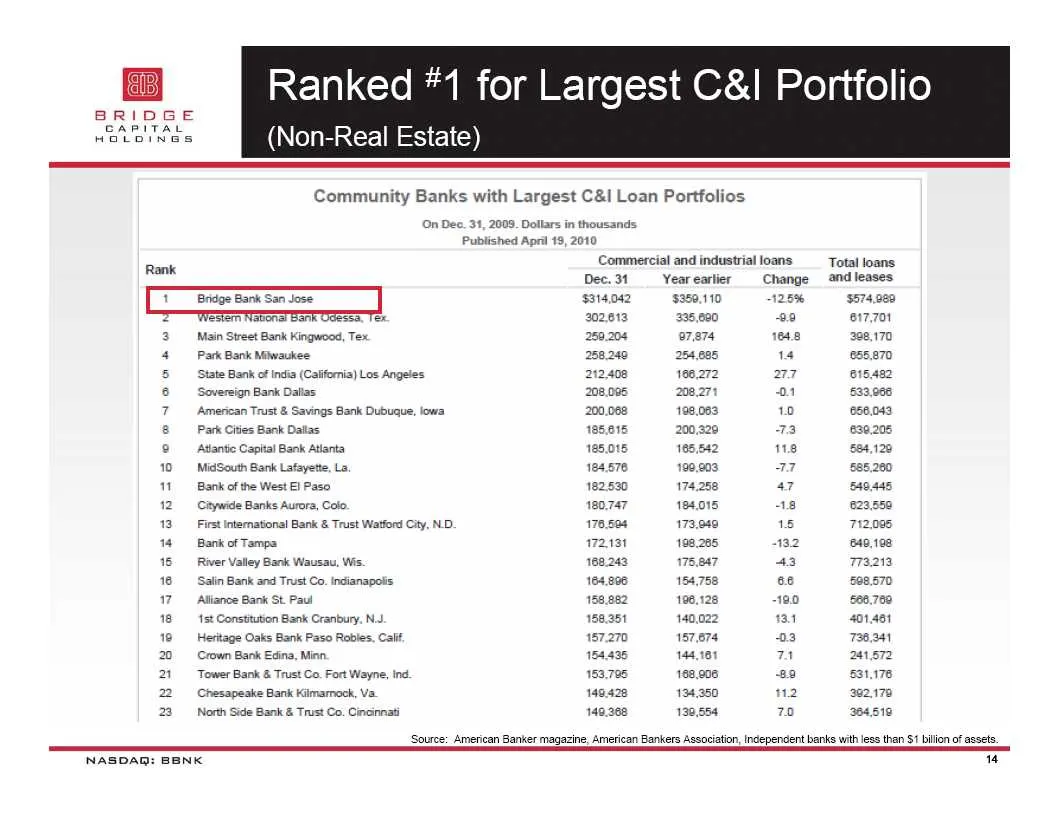
Slide 14: Ranked #1 for Largest C&I Portfolio
Ranked #1 for Largest C&l Portfolio (Non-Real Estate) Community Banks with Largest C&l Loan Portfolios On Dec. 31, 2009. Dollars in thousands Published April 19, 2010 = Commercial and industrial loans Total loans Dec. 31 Yearearlier Change _ and leases $314,042 $359,110 “125% $574,089 Nester Nston 3
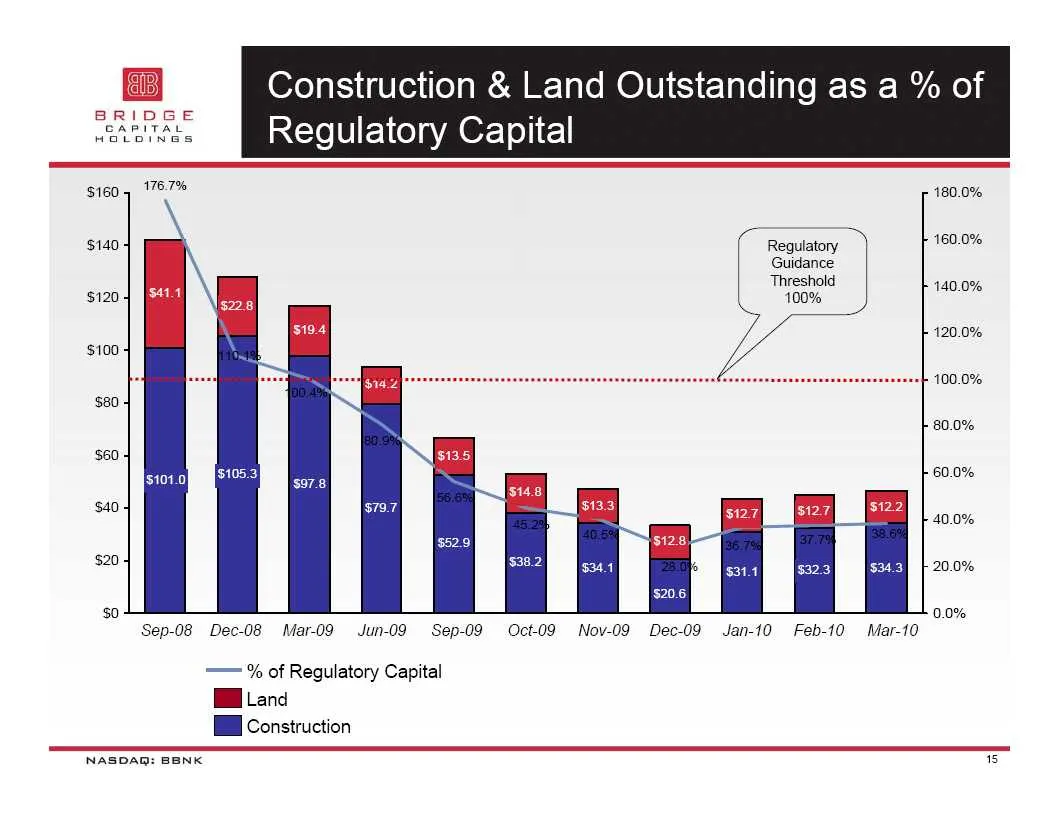
Slide 15: Construction & Land as % of Regulatory Capital
$160 $140 $120 $100 $80 $60 $40 $20 $0 Construction & Land Outstanding as a % of Regulatory Capital 176.7% Regulatory Guidance Threshold 100% Sep-08 Dec-08 Mar-09 Jun-09 Sep-09 ——= % of Regulatory Capital Ml Land Hl Construction Oct-09 Nov-09 Dec-09 Jan-10 Feb-10 Mar-10
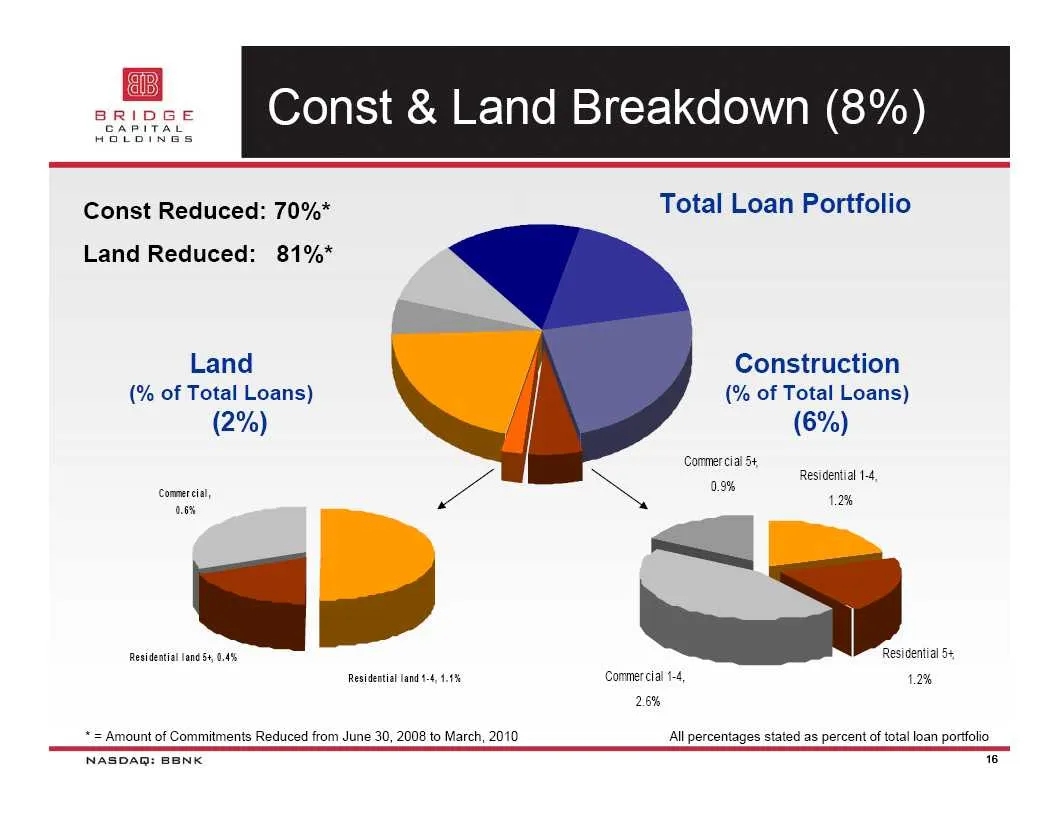
Slide 16: Construction and Land Reduction
Const Reduced: 70%* Total Loan Portfolio Land Reduced: 81%* Land (% of Total Loans) (2%) Construction (% of Total Loans) (6%) Commer cial 5+ Residential 1-4 09% 0.6% 1.2% exiestal land, 04% Residential §+ Residential land 14, 4.1% Commer cial 1-4 12% 26% * = Amount of Commitments Reduced from June 3
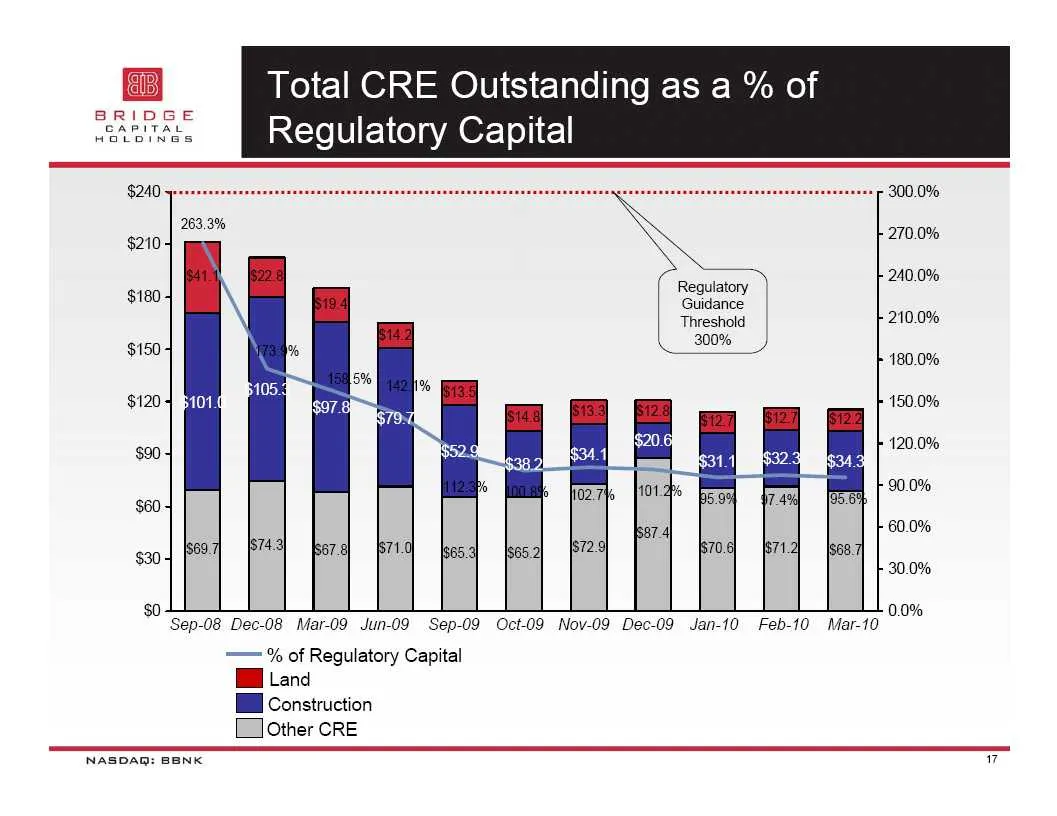
Slide 17: Total CRE Outstanding as % of Regulatory Capital
Total CRE Outstanding as a % of Regulatory Capital Regulatory ) Guidance Threshold 300.0% 270.0% 240.0% 210.0% F 180.0% F 150.0% F 120.0% 90.0% 60.0% 30.0% 0.0% === % of Regulatory Capital WB Land Hi construction Other CRE NASDAQ: BENK $0 Sep-08 Dec-08 Mar-09 Jun-09 Sep-09 Oct-09 Nov-09 Dec-09 Jan-1
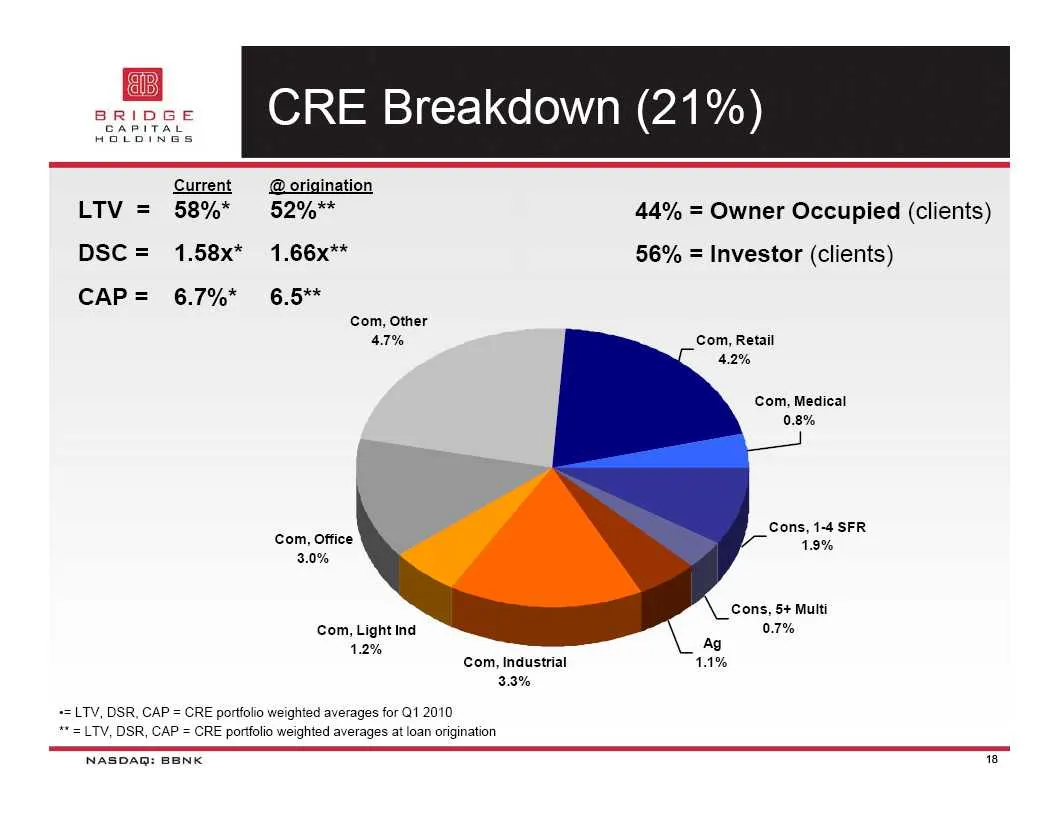
Slide 18: CRE Breakdown
gaa CRE Breakdown (21%) SUA RITA Current @origination LTV = 58%* 52%** 44% = Owner Occupied (clients) DSC= 1.58x* 1.66x** 56% = Investor (clients) CAP= 6.7%* 6.5** Com, Other 47% Com, Retail 4.2% ‘Com, Medical 0.8% Cons, 1-4 SFR Com, Office tau 3.0% Cons, 5+ Multi Com, Light Ind 0.7% 1.2% Ag Com, In
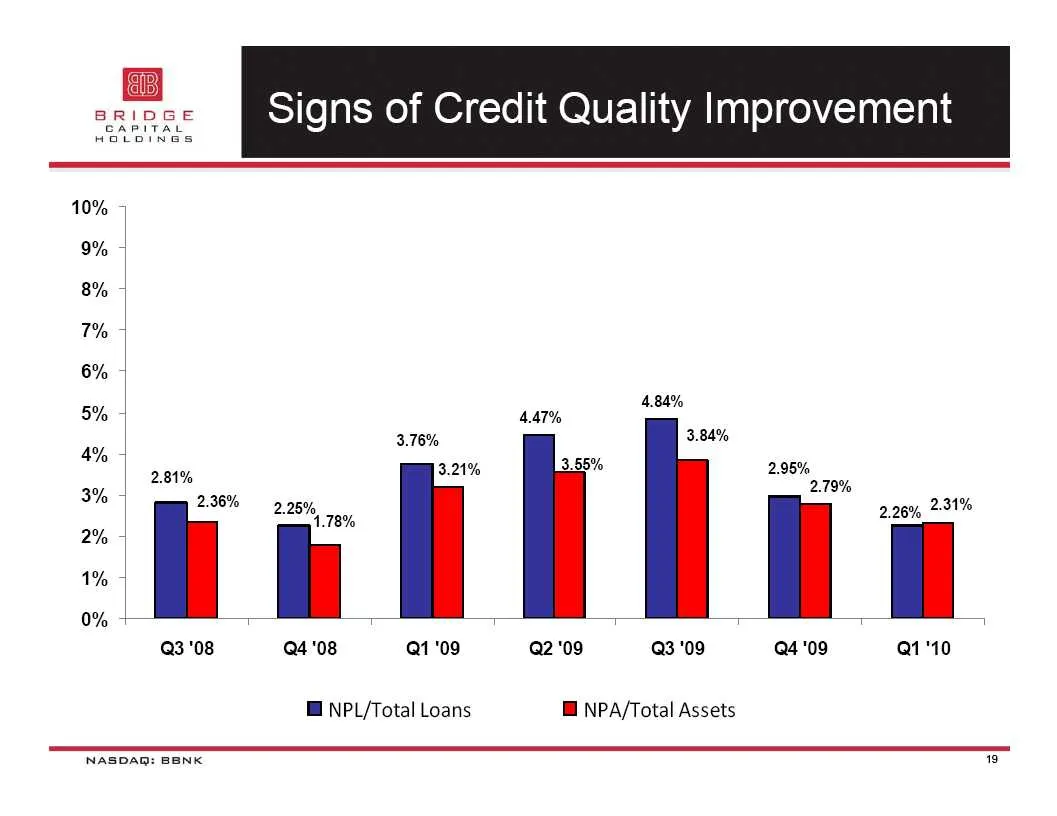
Slide 19: Signs of Credit Quality Improvement
Signs of Credit Quality Improvement 4.84% 4.AT% 3.76% 3.84% o 3.21% 3.55% 2.95% 2.81% _ i % o% op, 2-31% il [H il fl Q3'08 Q4'08 Q1'09 Q2'09 Q3 '09 Q4'09 Qi'10 H NPL/Total Loans NASDAQ: BENK Hf NPA/Total Assets ry
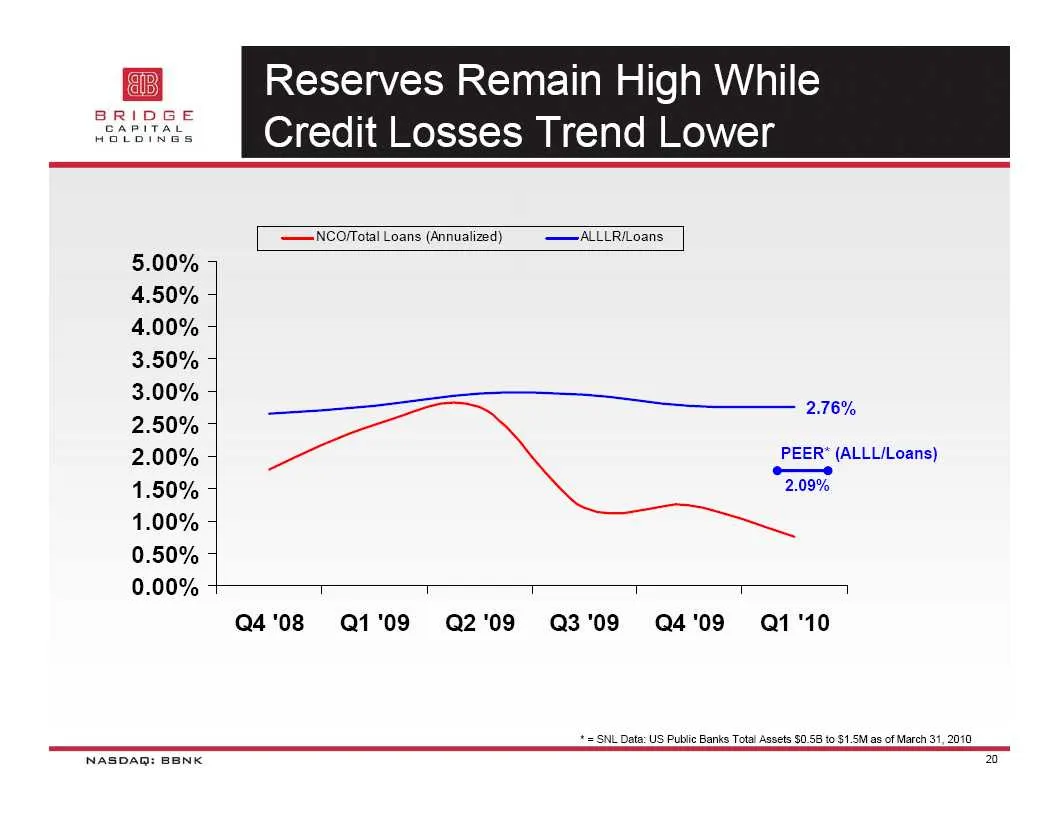
Slide 20: Reserves Remain High While Credit Losses Trend Lower
Reserves Remain High While Credit Losses Trend Lower —NCOfTotal Loans (Annualized) —ALLLRiLoans, 3.00%) ee’ 2.00% 5 PEER’ (ALLL/Loans) 1.50% 5 2.09% Q4'08 Q1'09) Q2'09 Q3'09 Q4'09 Qi'10 += SNL Data: US Public Banks Total Assets $0 58 to $1.5M as of March 31,2070 NASDAQ: BENK 20
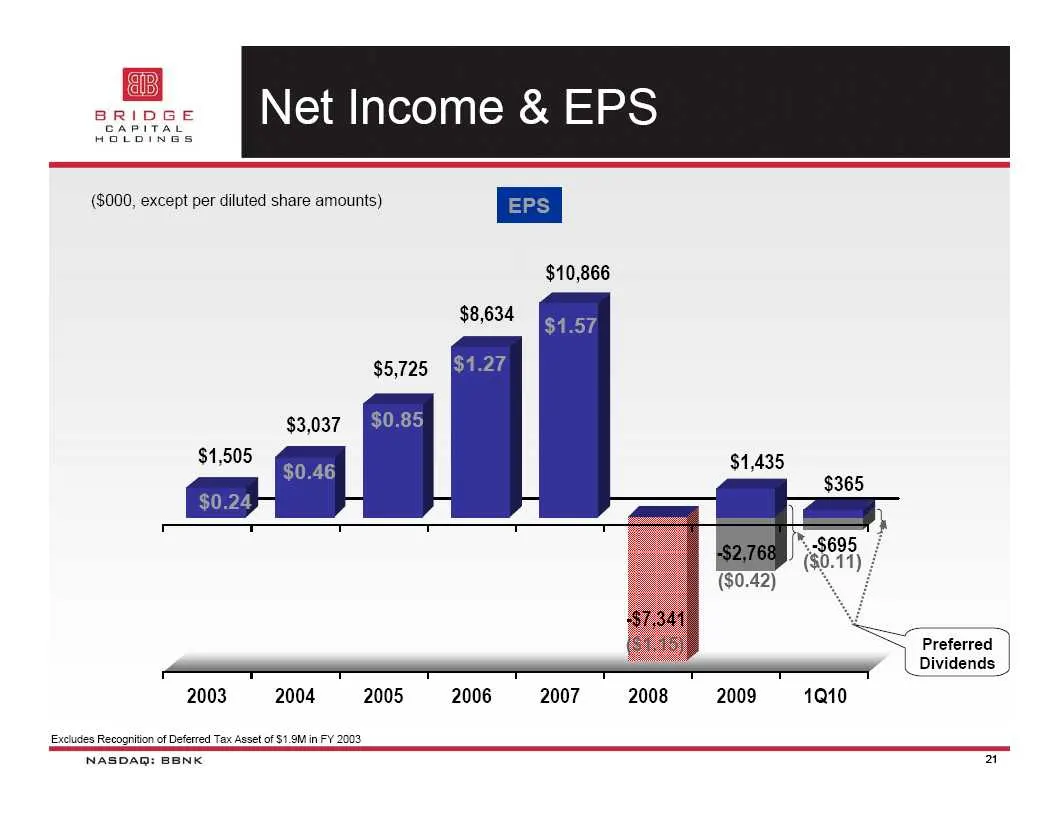
Slide 21: Net income and preferred dividends
$10,866 ($0.42) \" Preferred Dividends 2003 2004 2005 2006 2007 2008 2009 1010 Excludes Recognition of Deferred Tax Asset of $1.9M in FY 2002 NASDAQ: BENK 21
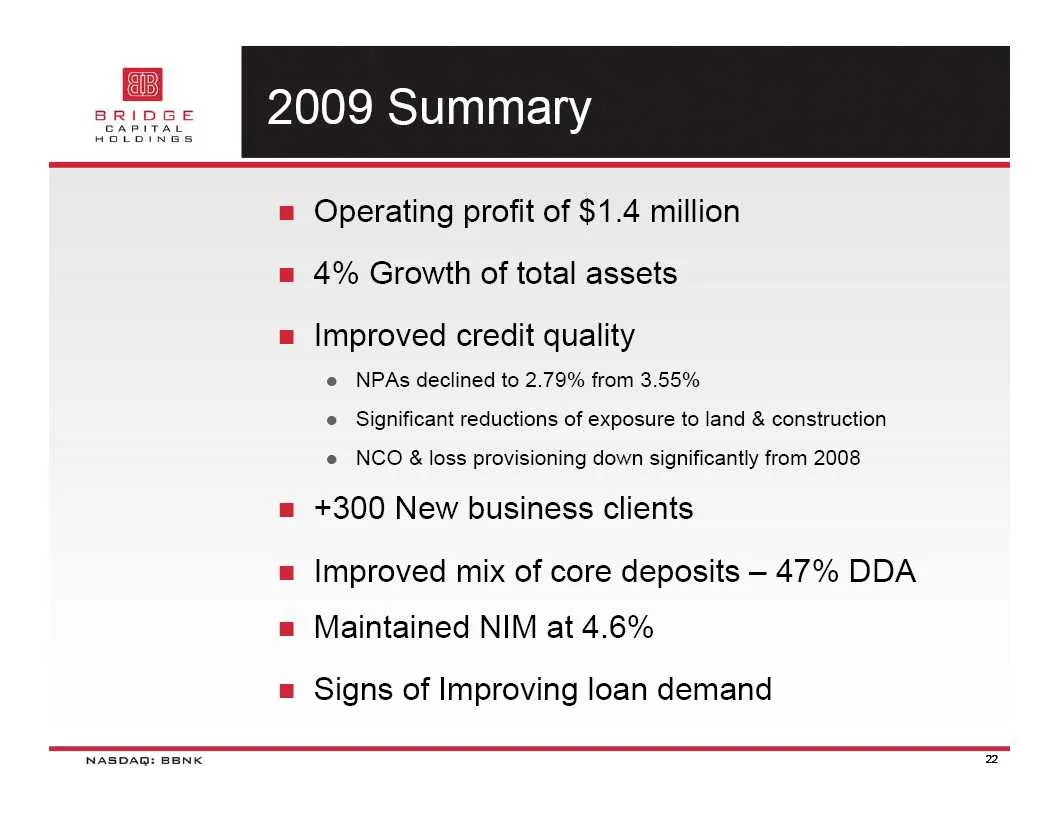
Slide 22: 2009 Summary
2009 Summary = Operating profit of $1.4 million = 4% Growth of total assets = Improved credit quality e NPAs declined to 2.79% from 3.55% e Significant reductions of exposure to land & construction e NCO & loss provisioning down significantly from 2008 = +300 New business clients = Improved mix of c
Slide 23: Operating profit of $0.4 million
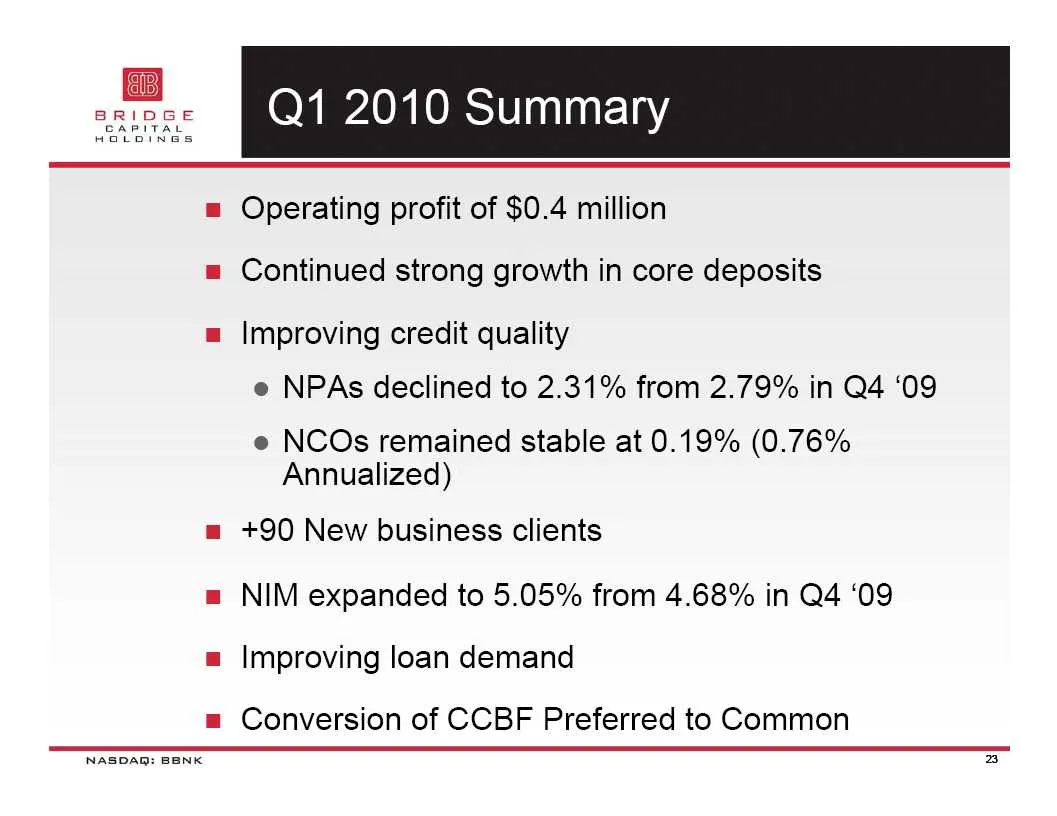
NASDAQ: BENK Operating profit of $0.4 million Continued strong growth in core deposits Improving credit quality e NPAs declined to 2.31% from 2.79% in Q4 ‘09 e NCOs remained stable at 0.19% (0.76% Annualized) +90 New business clients NIM expanded to 5.05% from 4.68% in Q4 ‘09 Improving loan demand C
Slide 24: BBNK stock price chart
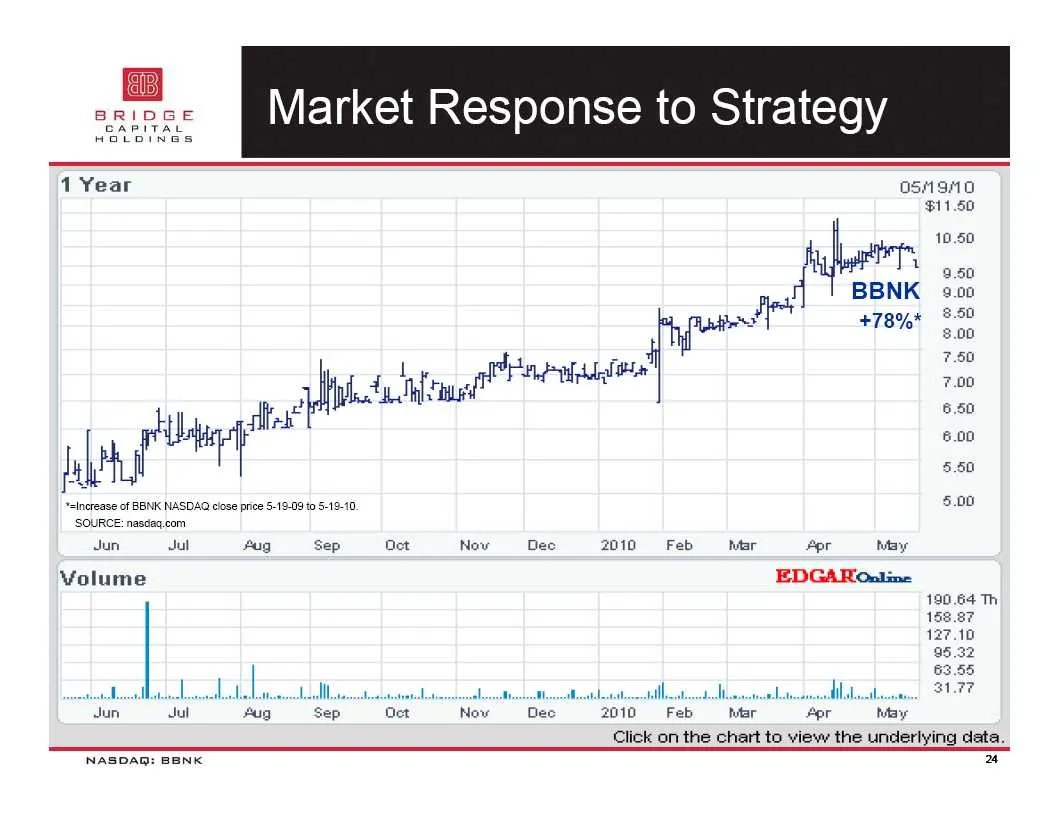
ae i a eg "sIncrease of BBNK NASDAQ close price $-19.09 to 5-19.10. ‘SOURCE: nasdag.cam Jun Jul fug Sep Det Now Volume | ee Jun Jul NASDAQ: BENK Dec pi eal 2010 Feb el +78%" Mer 054910 $11.60 10.50 hh Ff a BBNK 6.50 6.00 $50 5.00 Por hiay EDGAROsiine 190.64 Th Click on the chart to view the underlyi
Slide 25: hori Edwards
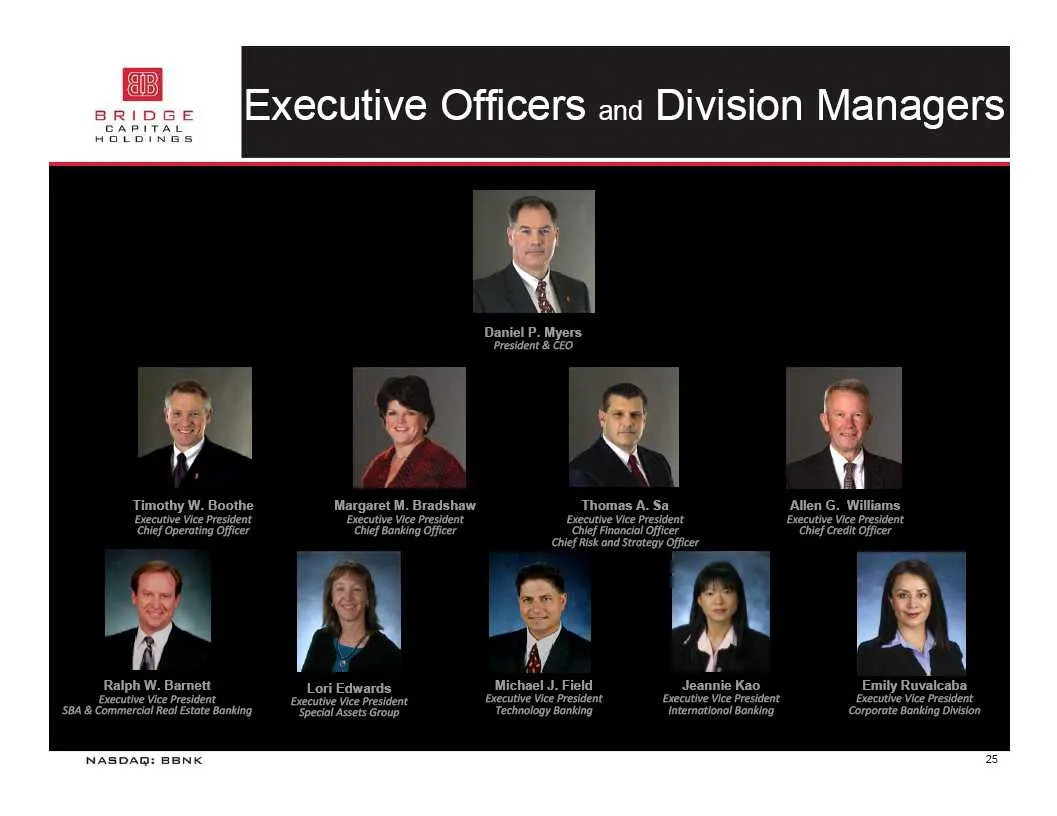
ps hori Edwards NASDAQ: BENK
Slide 26: Why Are We Different?
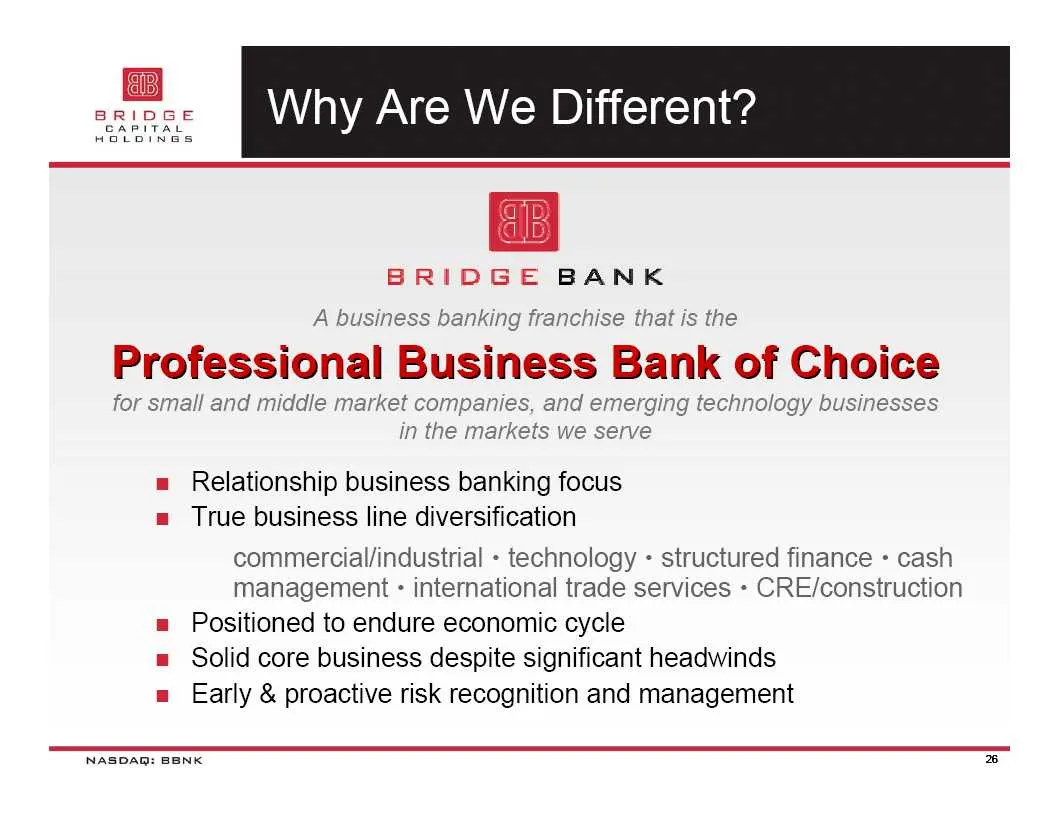
Why Are We Different? BRIDGE BANK A business banking franchise that is the Professional Business Bank of Choice for small and middle market companies, and emerging technology businesses in the markets we serve = Relationship business banking focus = True business line diversification commercial/indu
Slide 27: Effective Value Proposition
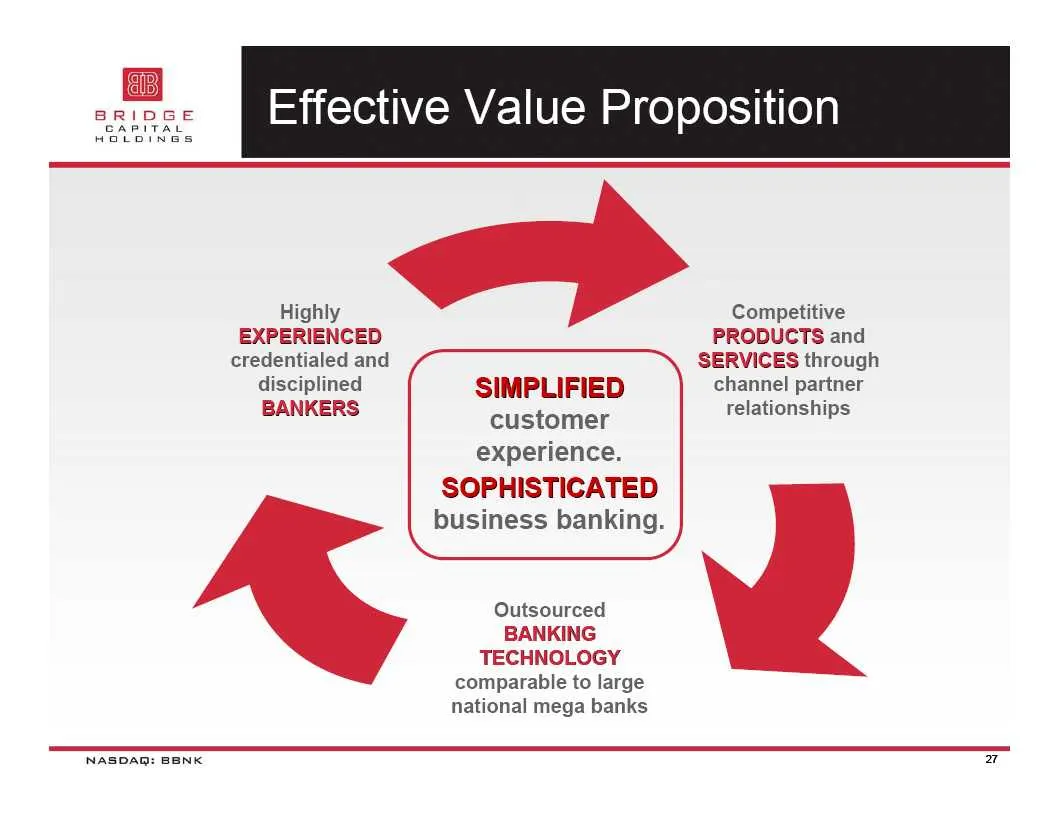
Effective Value Proposition Highly Competitive EXPERIENCED PRODUCTS and credentialed and SERVICES through disciplined SIMPLIFIED channel partner BANKERS customer relationships experience. SOPHISTICATED business banking. Outsourced BANKING TECHNOLOGY comparable to large national mega banks NASDAQ: BE
Slide 28: Bridge Bank Franchise
Bridge Bank Franchise Funding-driven approach to building the business Experienced management team Disciplined execution of our business plan e No subprime, GSE, CDO, SIV exposure e Reduced exposure to CRE, construction and land Full range of corporate banking products delivered through experienced
Slide 29: Core Market
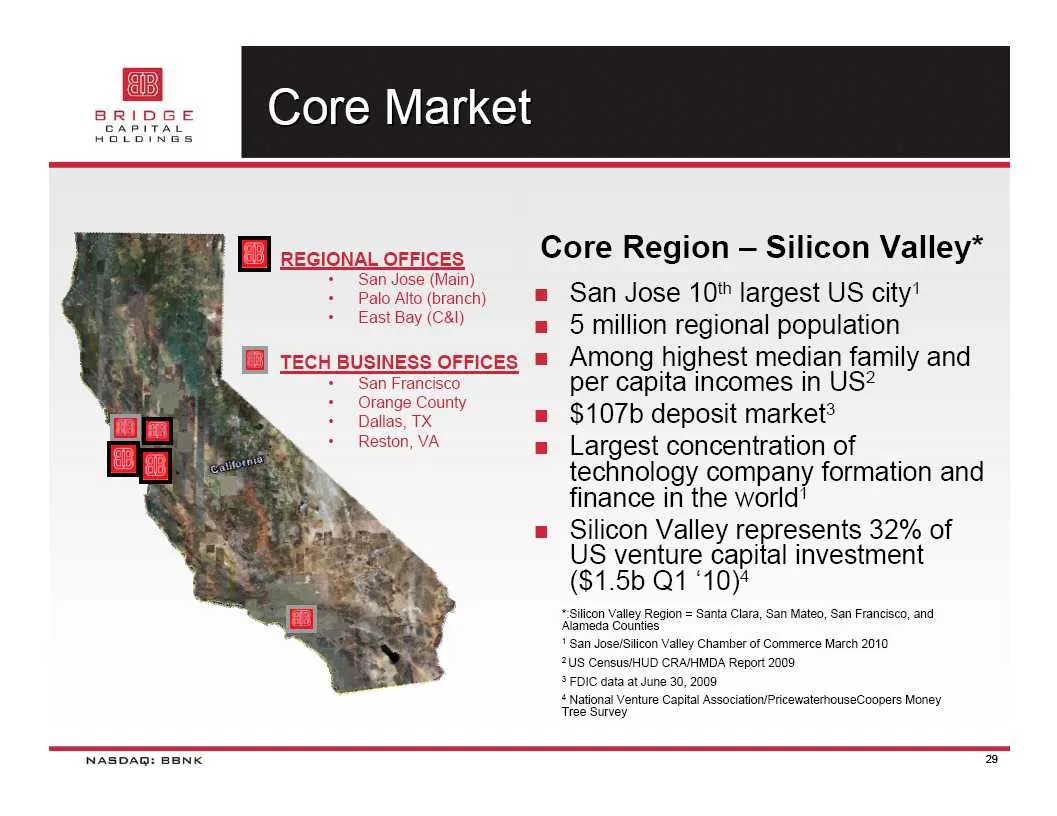
Core Market EB recioat orrices Core Region — Silicon Valley* San Jose (Main) Palo Alto (branch) @ San Jose 10" largest US city! Rest Hey (C8) = 5million regional population (© tech Business oFFiIces ™ Among highest median family and ~~ "s San Francisco per capita incomes in US? eee = $107b deposit m
Slide 30: Significant Market Opportunity
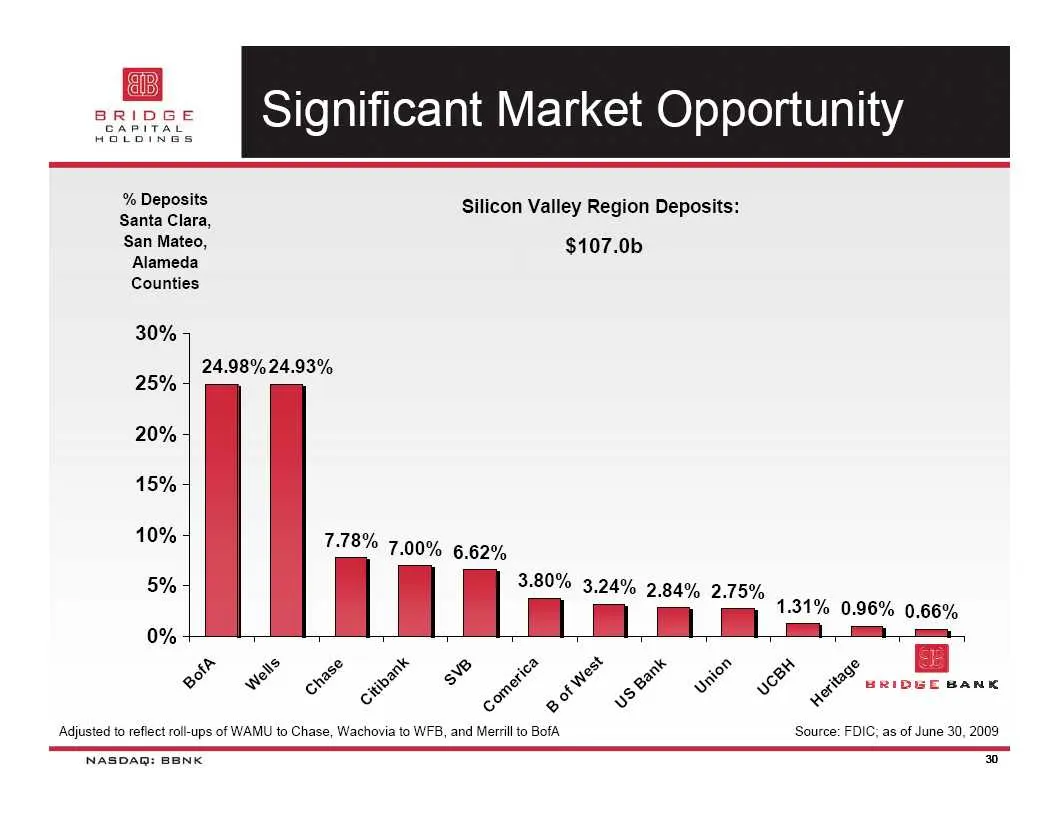
Significant Market Opportunity % Deposits Silicon Valley Region Deposits: Santa Clara, San Mateo, $107.0b Alameda Counties 30% 4 24.98% 24.93% 5% + 0% + 15% | 10% 5 7.78% 7.00% 6.62% 5% 4 a i | 3.80% 3.24% BBN 215% 4 aaa 0.96% 0.66% . |_| mn ee s ” = Re os ay e RO ee s e 3 a Fe F BRIDGE BANK oe Ss e
Slide 31: Positioned to Benefit From Potential Tailwinds
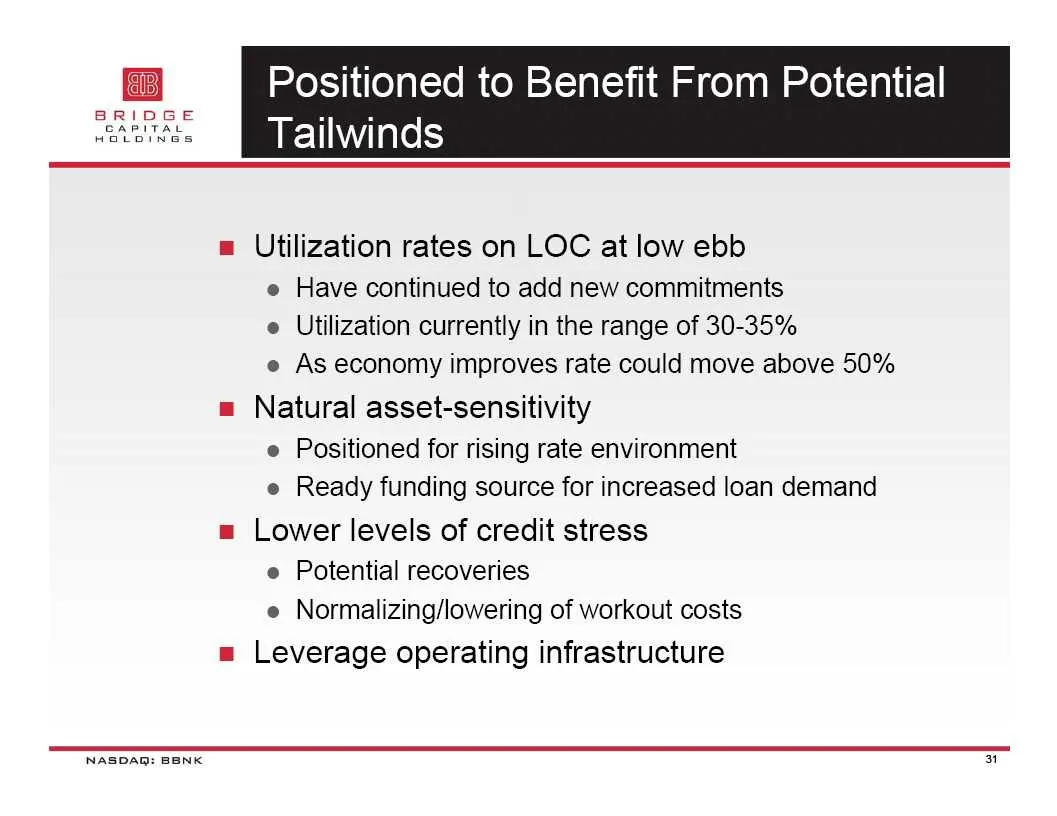
Positioned to Benefit From Potential Tailwinds = Utilization rates on LOC at low ebb e Have continued to add new commitments e Utilization currently in the range of 30-35% e As economy improves rate could move above 50% = Natural asset-sensitivity e Positioned for rising rate environment e Ready fun
Slide 32: Go-Forward Strategy
7 BENK “ Go-Forward Strategy = Attract new business relationships = Acquire primary DDA deposit balances = Issue new credit commitments = Fund loans as clients draw down commitments = Maintain asset quality u Leverage existing infrastructure
Slide 33: Investment Summary
Investment Summary = Improving fundamentals provide strong foundation for increasing profitability e Growing core deposit franchise e Increasing loan demand e Improved operating leverage e Expanding net interest margin = Improving credit quality with minimal exposure to CRE = Strong capital position
Slide 34: Bridge Bank technology upgrades
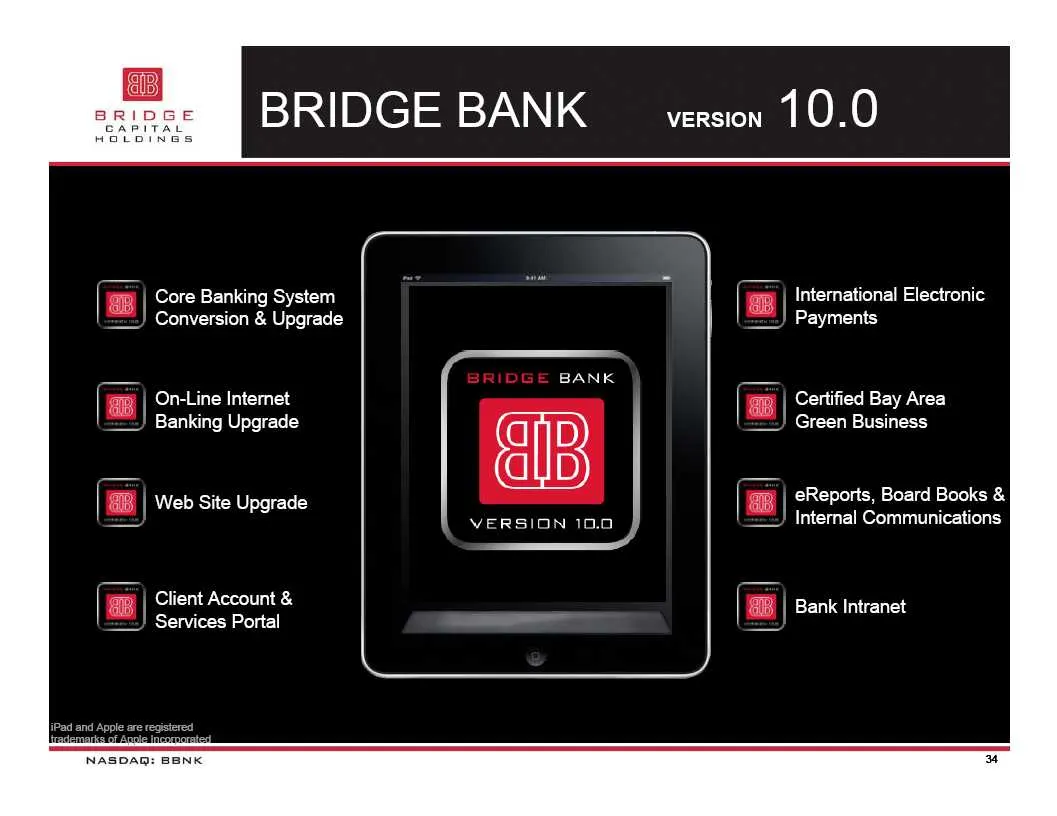
BRIDGE BANK Core Banking System Conversion & Upgrade On-Line Internet Banking Upgrade fi | Web Site Upgrade = | Client Account & Services Portal VERSION 10.0 VERSION 1 0 . 0 International Electronic ~.) Payments Certified Bay Area Green Business eReports, Board Books & Internal Communications } | Ba

Slide 35: Patel Foundation
Patel Foundation NASDAQ: BENK 35
Source: SEC EDGAR · 8-K filed May 20, 2010
More decks from Bridge Capital Holdings
 Merger or Acquisition (March 2015)11 slides · Mar 9, 2015
 Q4 2014 Earnings Presentation22 slides · Feb 4, 2015
 Q2 2014 Earnings Presentation23 slides · Jul 29, 2014
 Shareholder Meeting (May 2014)19 slides · May 28, 2014
 Q1 2014 Earnings Presentation23 slides · May 13, 2014
 Q4 2013 Earnings Presentation24 slides · Feb 5, 2014