Bridge Capital — Shareholder Meeting (May 2014)
19 slides from Bridge Capital's shareholder meeting presentation, May 28, 2014
Slide 1: 14th Annual Shareholders' Meeting
May 28, 2014 14 th Annual Shareholders’ Meeting Daniel P. Myers President Chief Executive Officer Allan C. Kramer, M.D. Chairman NASDAQ: BBNK www.bridgecapitalholdings.com
Slide 2: Forward Looking Statements
2 Certain matters discussed herein constitute forward - looking statements within the meaning of the Private Securities Litigation Reform Act of 1995 , and are subject to the safe harbors created by that Act . Forward - looking statements describe future plans, strategies, and expectations, and are
Slide 3: Chairman's Comments
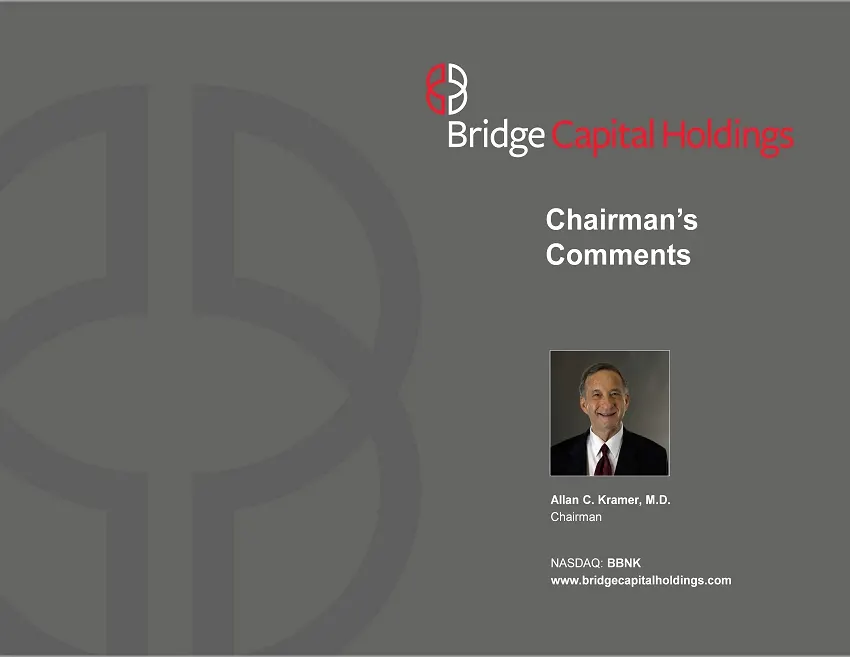
Chairman’s Comments Allan C. Kramer, M.D. Chairman NASDAQ: BBNK www.bridgecapitalholdings.com
Slide 4: Board of Directors
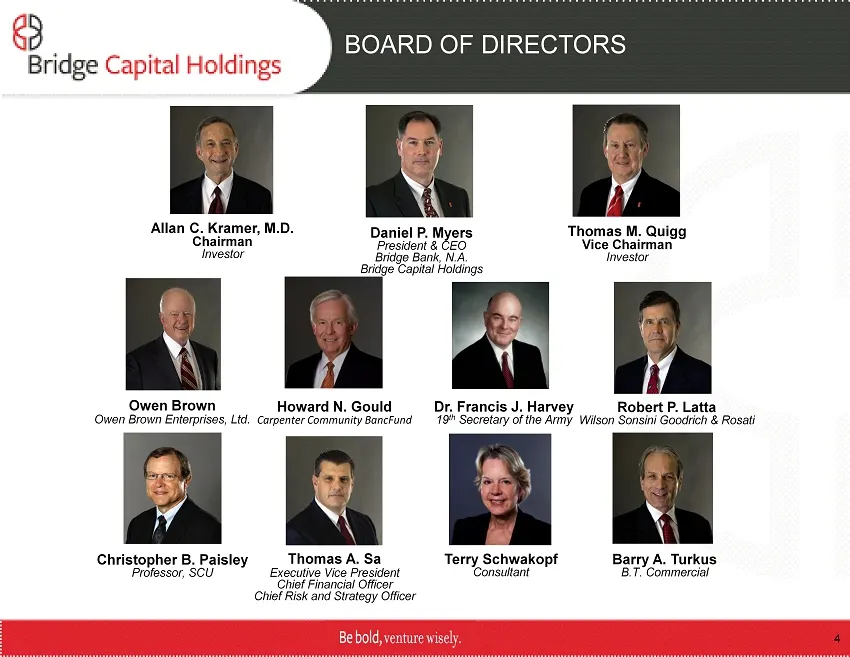
4 Allan C. Kramer, M.D. Chairman Investor Thomas M. Quigg Vice Chairman Investor Daniel P. Myers President & CEO Bridge Bank, N.A. Bridge Capital Holdings Dr. Francis J. Harvey 19 th Secretary of the Army Owen Brown Owen Brown Enterprises, Ltd . Robert P. Latta Wilson Sonsini Goodrich & Rosati Howar
Slide 5: Shareholder briefing
Shareholder briefing Daniel P. Myers President Chief Executive Officer NASDAQ: BBNK www.bridgecapitalholdings.com
Slide 6: S&P Market View
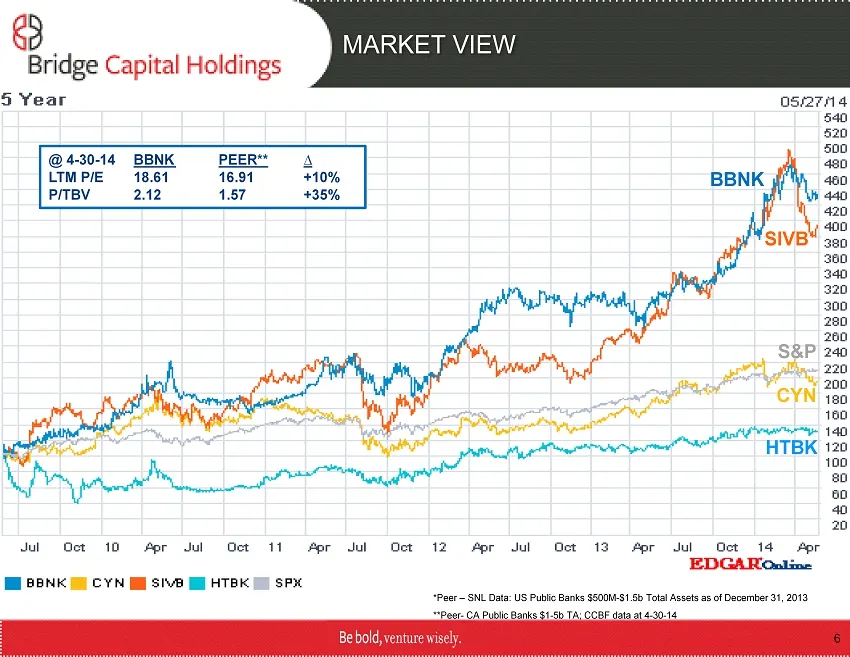
* Peer – SNL Data: US Public Banks $500M - $1.5b Total Assets as of December 31, 2013 **Peer - CA Public Banks $1 - 5b TA; CCBF data at 4 - 30 - 14 6 BBNK SIVB HTBK CYN S&P MARKET VIEW @ 4 - 30 - 14 BBNK PEER** ∆ LTM P/E 18.61 16.91 +10% P/TBV 2.12 1.57 +35%
Slide 7: Bridge Bank Franchise
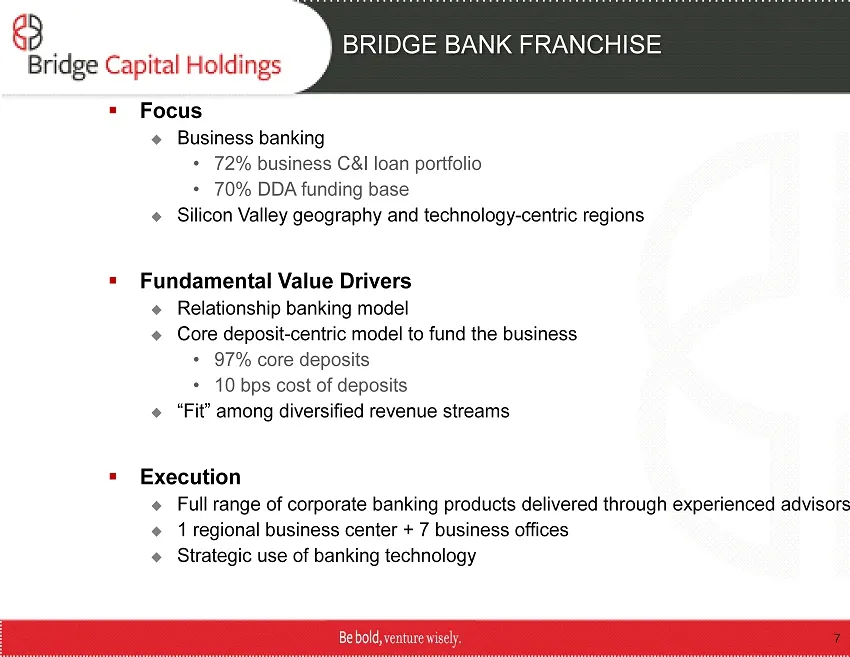
BRIDGE BANK FRANCHISE ▪ Focus Business banking • 72% business C&I loan portfolio • 70% DDA funding base Silicon Valley geography and technology - centric regions ▪ Fundamental Value Drivers Relationship banking model Core deposit - centric model to fund the business • 97% core deposits • 10
Slide 8: Strong Emerging Brand
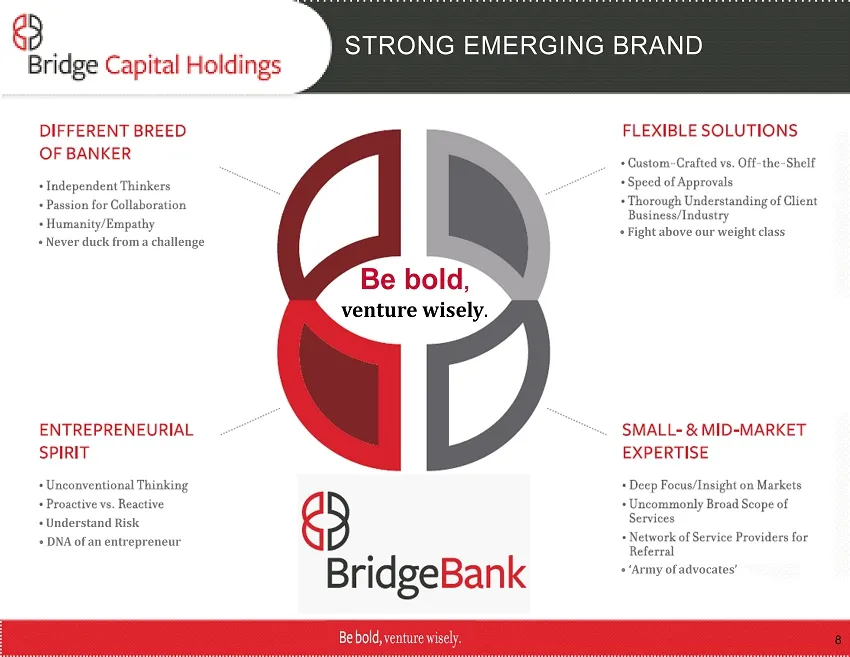
Be bold , venture wisely . STRONG EMERGING BRAND 8 Understand Risk • DNA of an entrepreneur • Never duck from a challenge • Fight above our weight class • ‘Army of advocates’
Slide 9: Core Market: National Innovation Sector
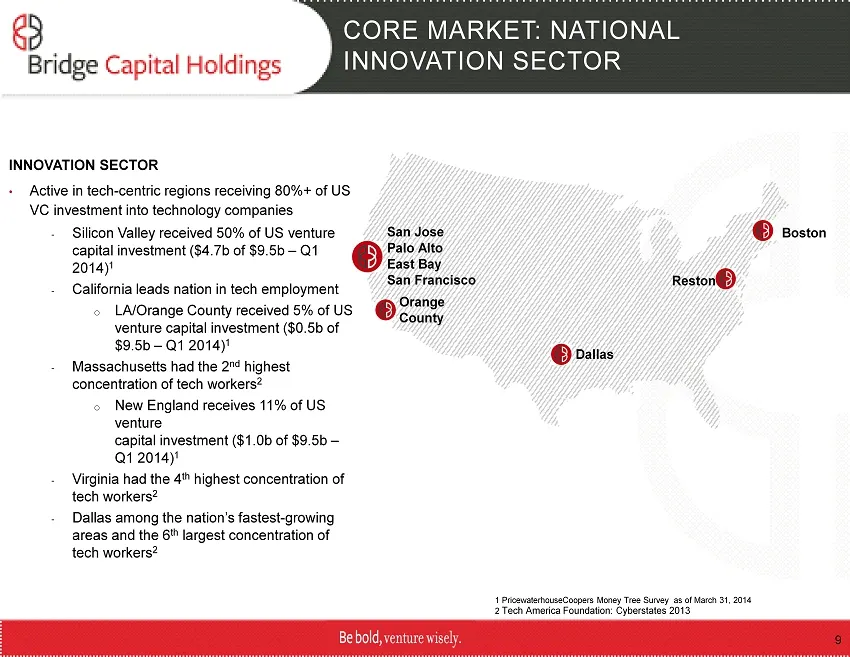
CORE MARKET: NATIONAL INNOVATION SECTOR INNOVATION SECTOR • Active in tech - centric regions receiving 80%+ of US VC investment into technology companies - Silicon Valley received 50% of US venture capital investment ($4.7b of $9.5b – Q1 2014) 1 - California leads nation in tech employment o LA/Oran
Slide 10: Expanding Market Sense
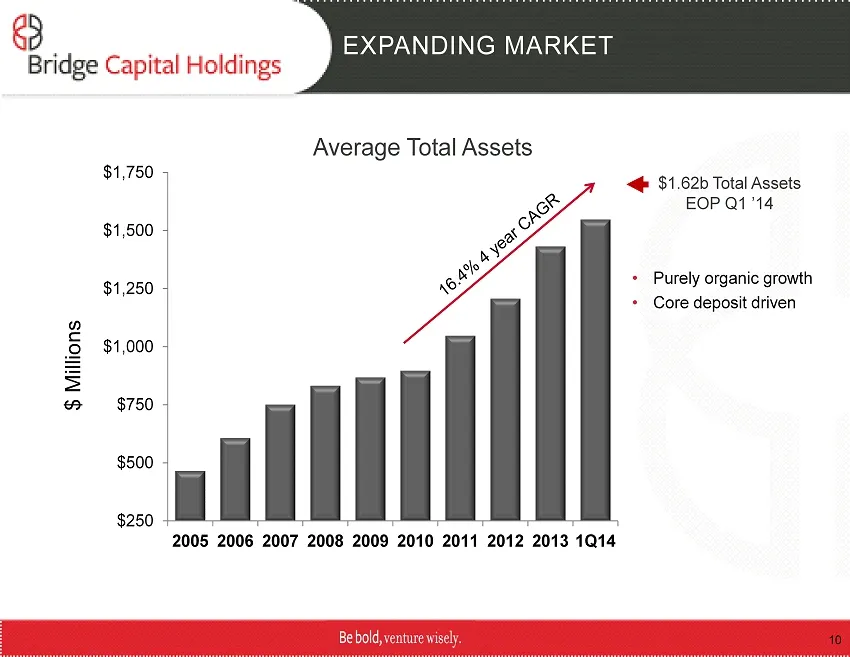
EXPANDING MARKET SENCE $250 $500 $750 $1,000 $1,250 $1,500 $1,750 2005 2006 2007 2008 2009 2010 2011 2012 2013 1Q14 $ Millions Average Total Assets • Purely organic growth • Core deposit driven $ 1.62b Total Assets EOP Q1 ’14 10
Slide 11: Focus on Core Deposits
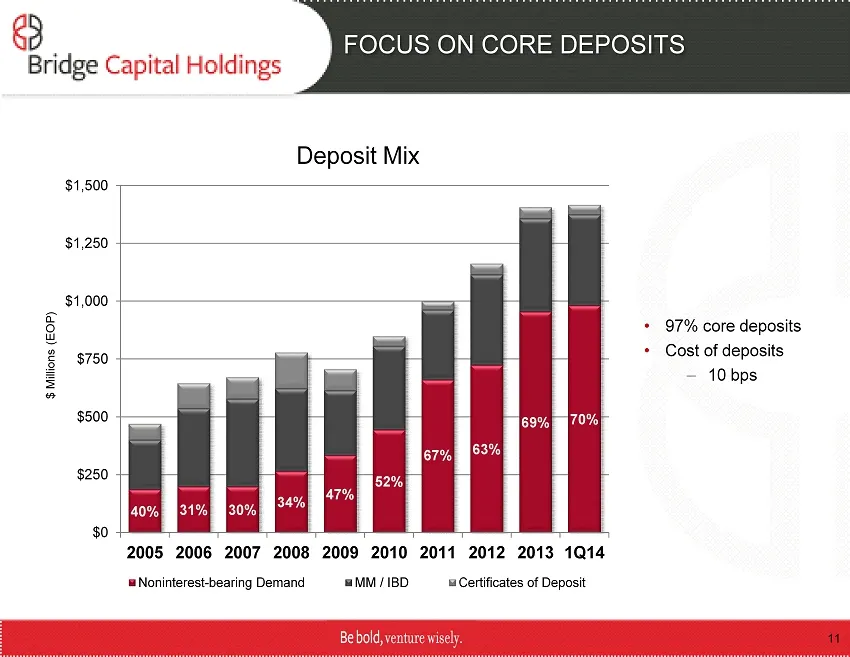
FOCUS ON CORE DEPOSITS 40% 31% 30% 34% 47% 52% 67% 63% 69% 70% $0 $250 $500 $750 $1,000 $1,250 $1,500 2005 2006 2007 2008 2009 2010 2011 2012 2013 1Q14 $ Millions (EOP) Deposit Mix Noninterest-bearing Demand MM / IBD Certificates of Deposit • 97% core deposits • Cost of deposits – 10 bps 11
Slide 12: True Business Focus
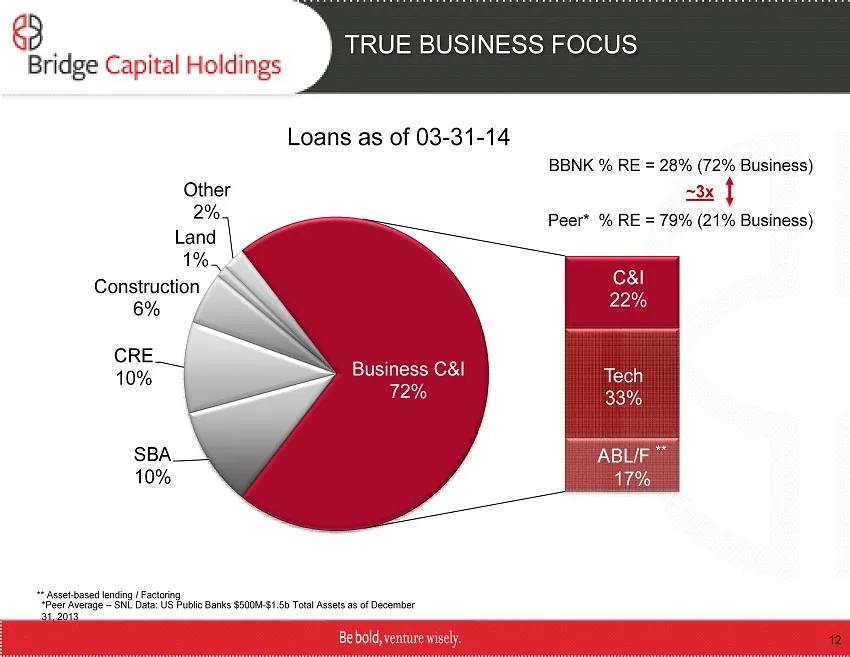
TRUE BUSINESS FOCUS S BA 10% CRE 10% Construction 6% Land 1% Other 2% C&I 22% Tech 33% ABL/F ** 17% Business C&I 72% Loans as of 03 - 31 - 14 BBNK % RE = 28% (72% Business) Peer* % RE = 79% (21% Business) ~3x 12 * Peer Average – SNL Data: US Public Banks $500M - $1.5b Total Assets as of December 31,
Slide 13: Net Interest Margin: High Value Business
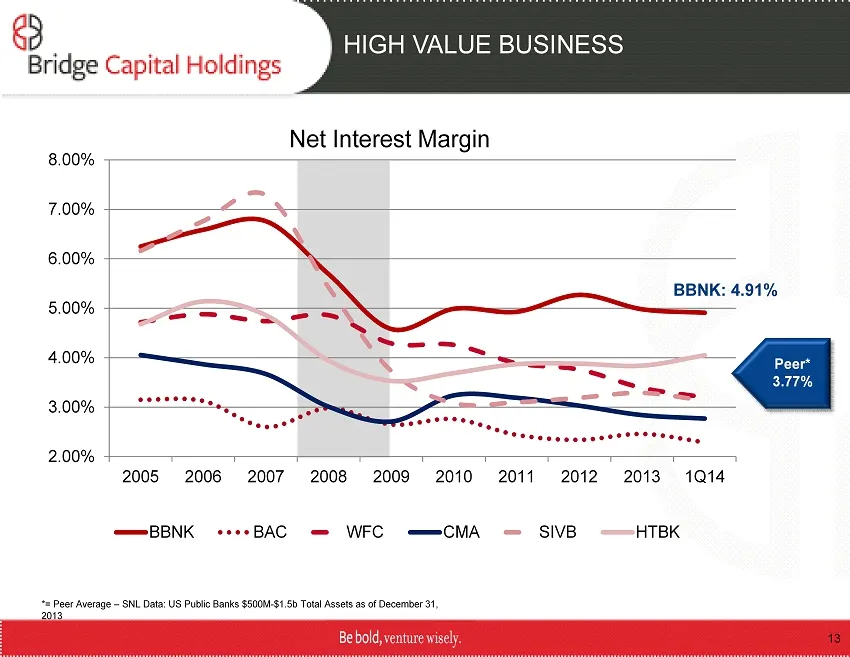
2.00% 3.00% 4.00% 5.00% 6.00% 7.00% 8.00% 2005 2006 2007 2008 2009 2010 2011 2012 2013 1Q14 Net Interest Margin BBNK BAC WFC CMA SIVB HTBK HIGH VALUE BUSINESS BBNK: 4.91% *= Peer Average – SNL Data: US Public Banks $500M - $1.5b Total Assets as of December 31, 2013 Peer* 3.77% 13
Slide 14: Q1 2014 Summary
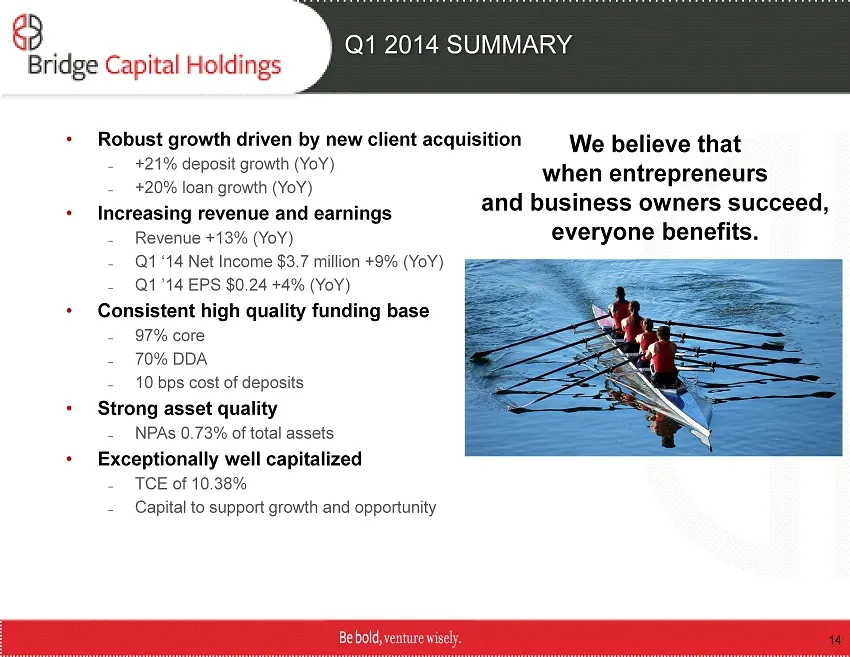
Q1 2014 SUMMARY • Robust growth driven by new client acquisition – +21% deposit growth (YoY) – +20% loan growth (YoY) • Increasing revenue and earnings – Revenue +13% (YoY) – Q1 ‘14 Net Income $ 3.7 million +9% (YoY) – Q1 ’14 EPS $0.24 +4% (YoY) • Consistent high quality funding base – 97% core – 70
Slide 15: Earnings ($000)
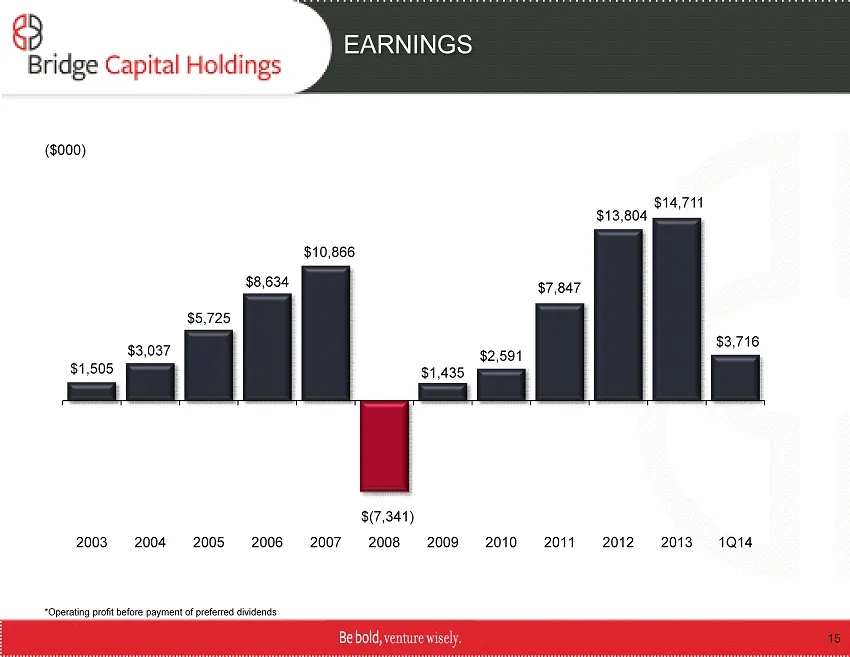
$(7,341) $1,505 $3,037 $5,725 $8,634 $10,866 $ 1,435 $2,591 $ 7,847 $13,804 $14,711 $3,716 2003 2004 2005 2006 2007 2008 2009 2010 2011 2012 2013 1Q14 EARNINGS ($000) *Operating profit before payment of preferred dividends 15
Slide 16: Capital for Growth and Opportunity
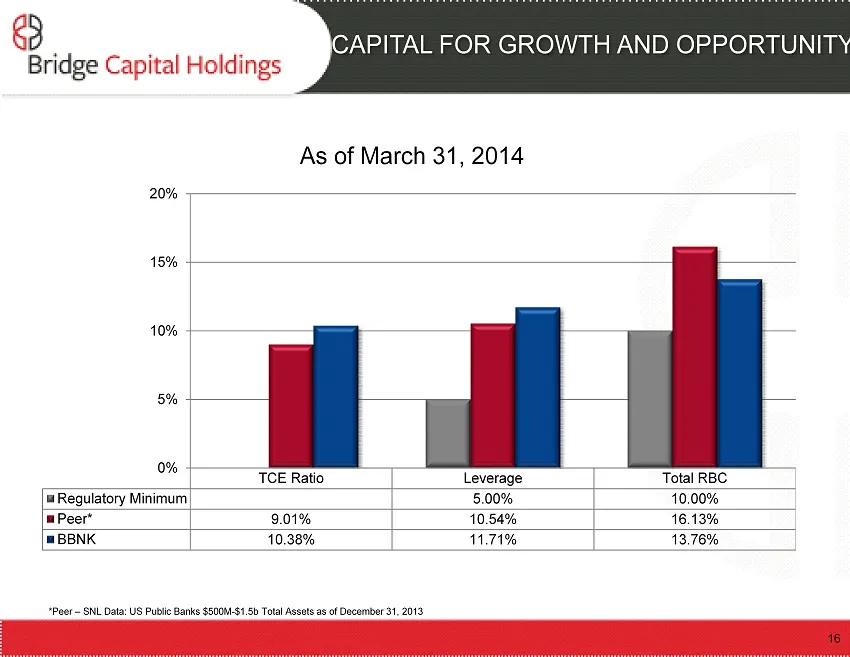
CAPITAL FOR GROWTH AND OPPORTUNITY * Peer – SNL Data: US Public Banks $500M - $1.5b Total Assets as of December 31, 2013 TCE Ratio Leverage Total RBC Regulatory Minimum 5.00% 10.00% Peer* 9.01% 10.54% 16.13% BBNK 10.38% 11.71% 13.76% 0% 5% 10% 15% 20% As of March 31, 2014 16
Slide 17: Financial Highlights
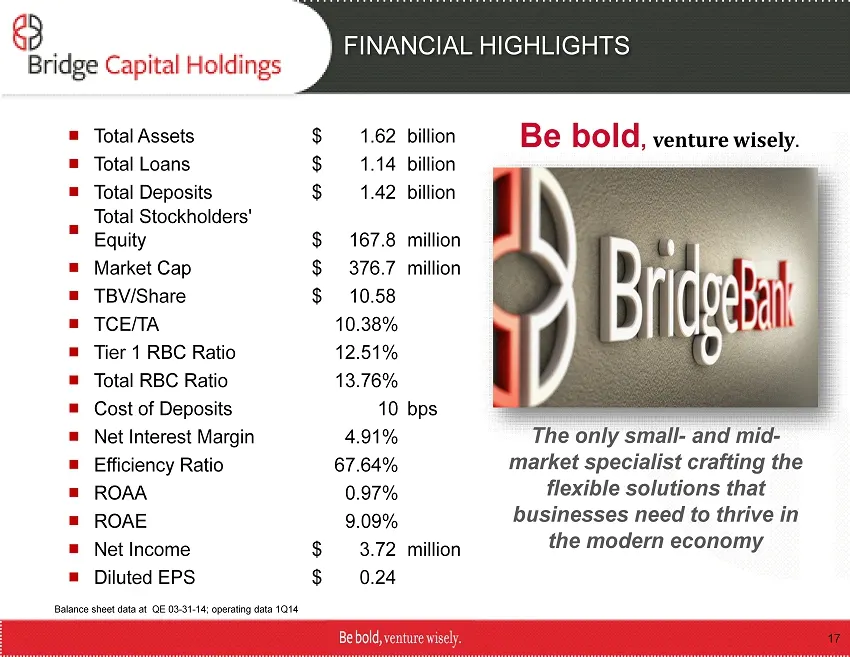
FINANCIAL HIGHLIGHTS Balance sheet data at QE 03 - 31 - 14; operating data 1Q14 The only small - and mid - market specialist crafting the flexible solutions that businesses need to thrive in the modern economy Be bold , venture wisely . 17 ■ Total Assets $ 1.62 billion ■ Total Loans $ 1.14 b illion
Slide 18: S&P Market View
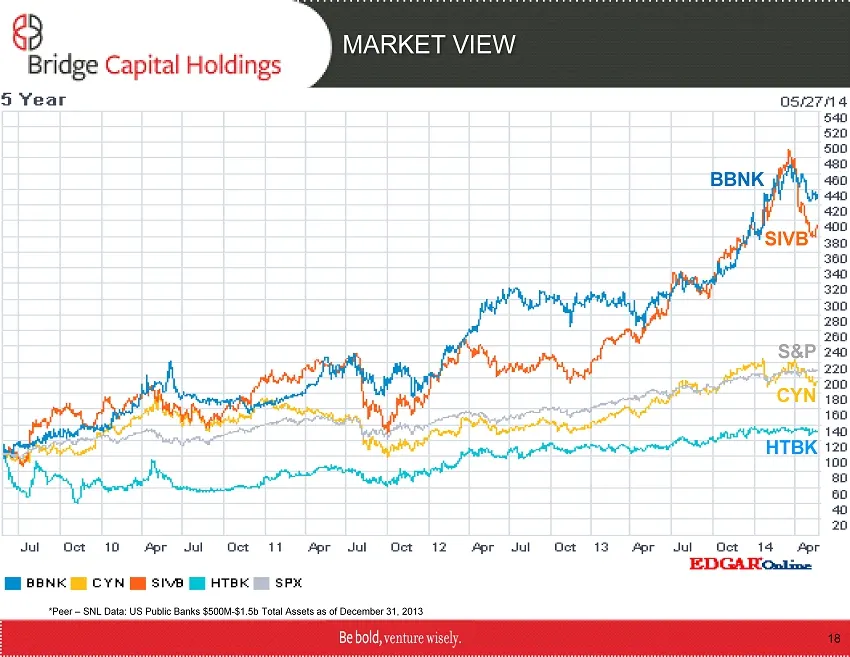
* Peer – SNL Data: US Public Banks $500M - $1.5b Total Assets as of December 31, 2013 18 BBNK SIVB HTBK CYN S&P MARKET VIEW
Slide 19: Contact Information
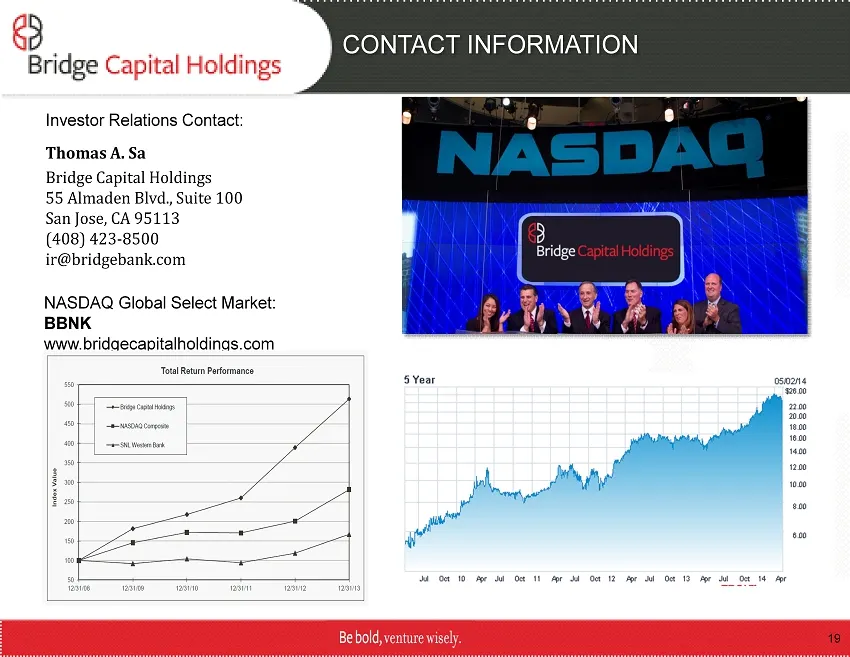
CONTACT INFORMATION Investor Relations Contact: Thomas A. Sa Bridge Capital Holdings 55 Almaden Blvd., Suite 100 San Jose, CA 95113 (408) 423 - 8500 ir@bridgebank.com 19 NASDAQ Global Select Market: BBNK www.bridgecapitalholdings.com
Source: SEC EDGAR · 8-K filed May 28, 2014
More decks from Bridge Capital Holdings
 Merger or Acquisition (March 2015)11 slides · Mar 9, 2015
 Q4 2014 Earnings Presentation22 slides · Feb 4, 2015
 Q2 2014 Earnings Presentation23 slides · Jul 29, 2014
 Q1 2014 Earnings Presentation23 slides · May 13, 2014
 Q4 2013 Earnings Presentation24 slides · Feb 5, 2014
 Q2 2013 Earnings Presentation23 slides · Jul 30, 2013