Celsia SA ESP · BVC:CELSIA
Celsia SA ESP — Q1 2017 Earnings Presentation
9 slides from Celsia SA ESP's earnings presentation, May 2017
Slide 1: Quarterly results 1Q 2017
\\/ Quarterly results CELSIA 1GR201.7
Slide 2: Relevant updates
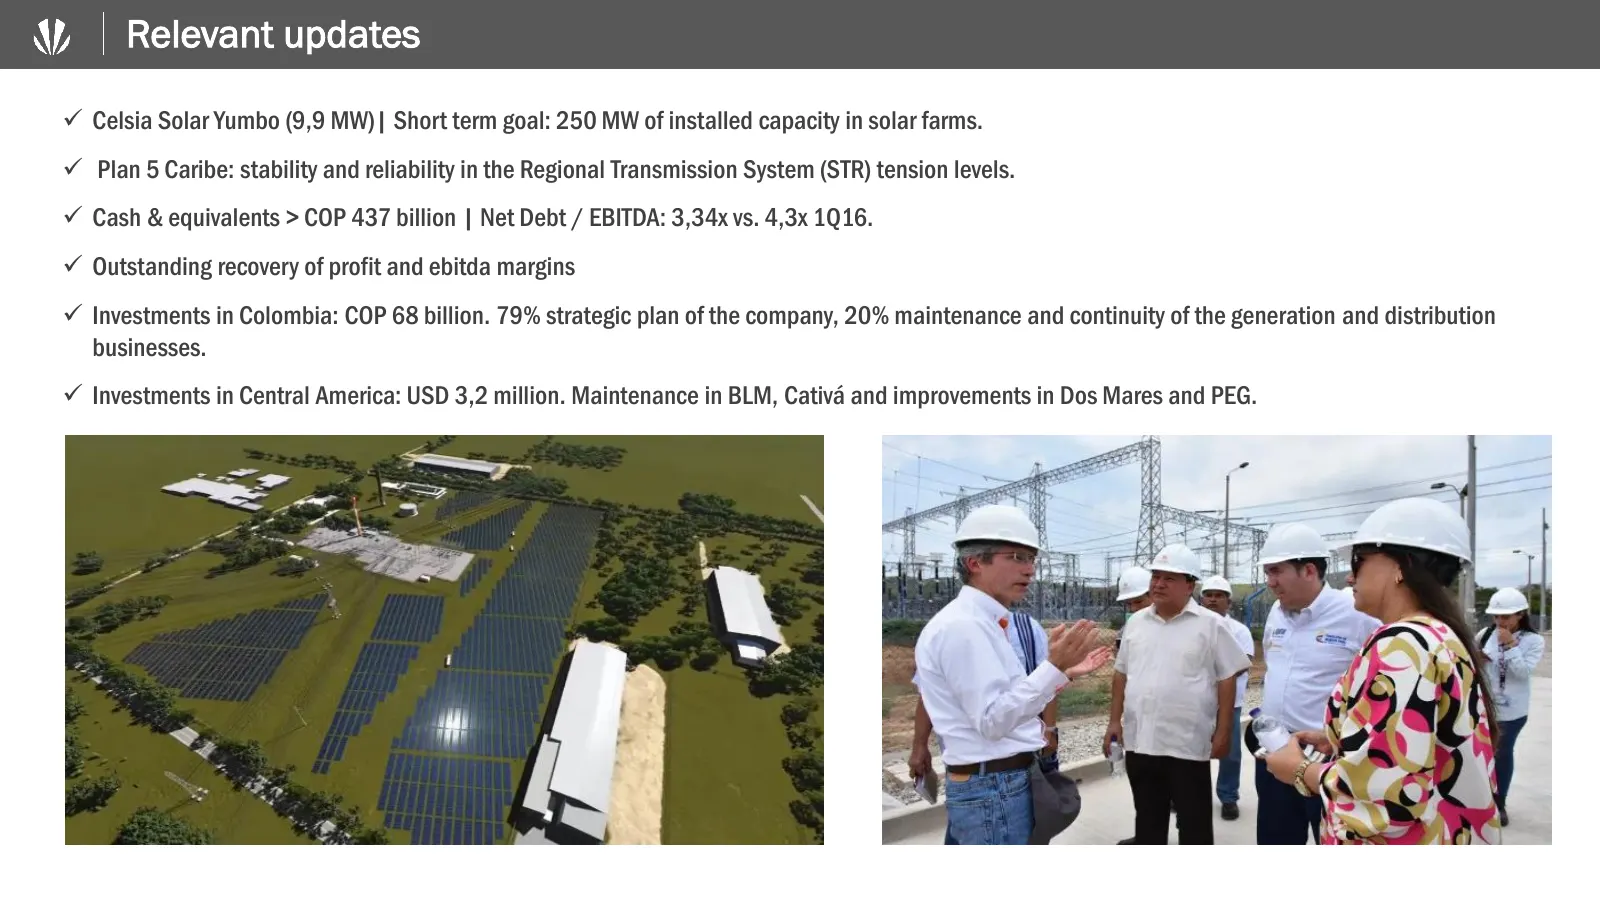
Relevant updates Celsia Solar Yumbo (9,9 MW)| Short term goal: 250 MW of installed capacity in solar farms. Plan 5 Caribe: stability and reliability in the Regional Transmission System (STR) tension levels. Cash & equivalents > COP 437 billion | Net Debt / EBITDA: 3,34x vs. 4,3x 1Q16. Outsta
Slide 3: The electric market
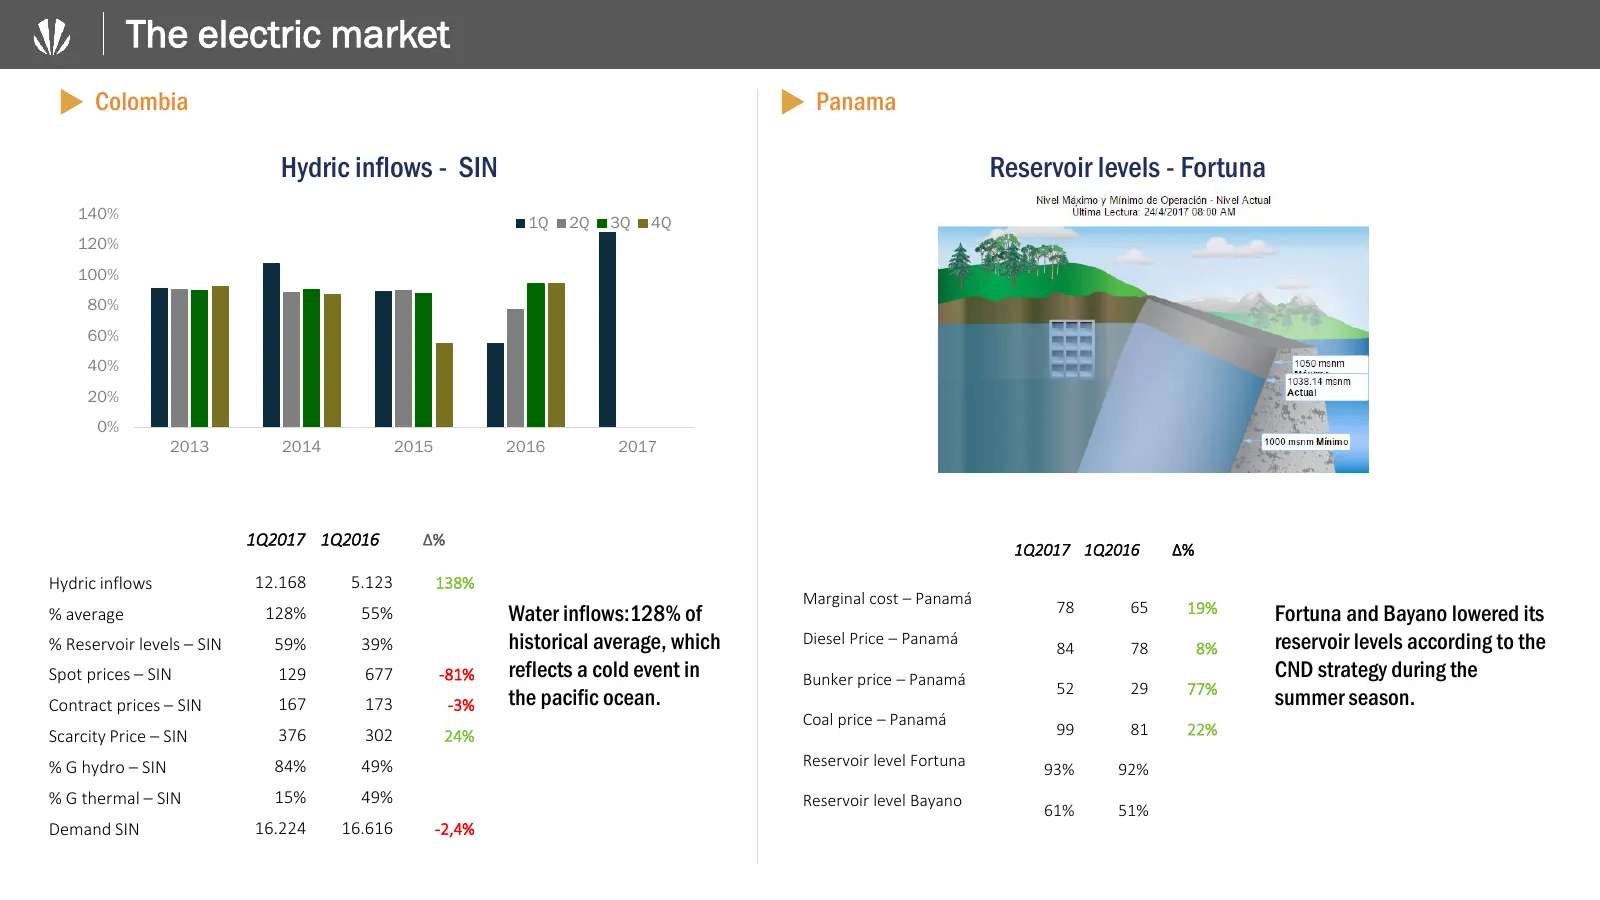
The electric market Colombia Panama Hydric inflows - SIN Reservoir levels - Fortuna 140% 1Q 2Q 3Q 4Q 120% 100% 80% 60% 40% 20% 0% 2013 2014 2015 2016 2017 1Q2017 1Q2016 ∆% 1Q2017 1Q2016 ∆% Hydric inflows 12.168 5.123 138% Marginal cost – Panamá % average 128% 55% Water inflows:128% of 78 65 19% Fort
Slide 4: Financial results
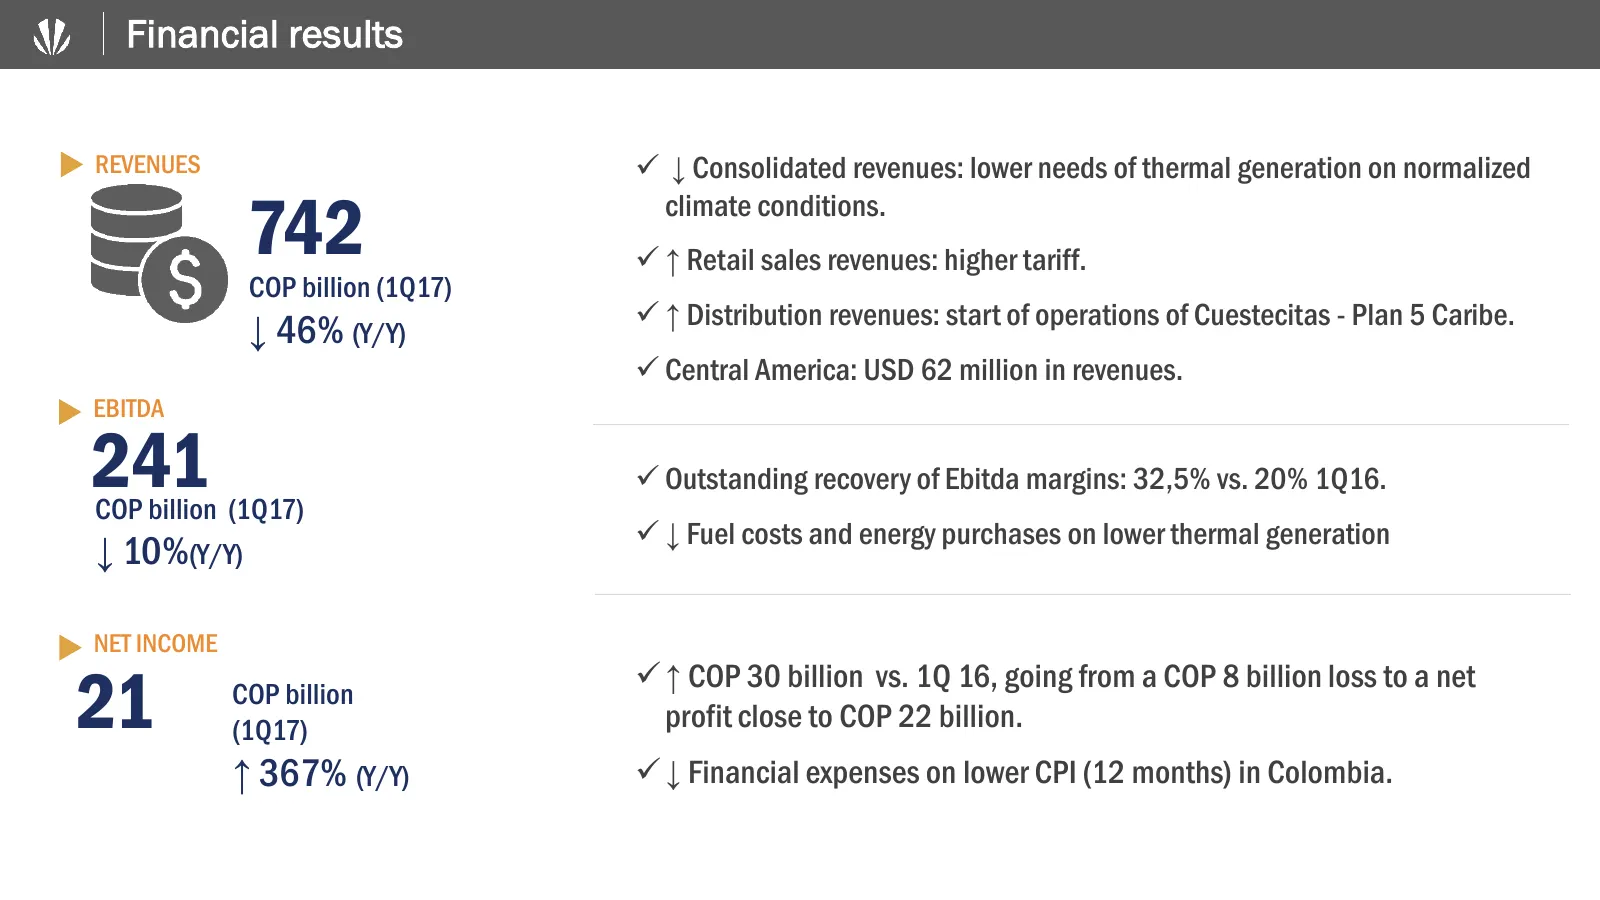
Financial results REVENUES ↓ Consolidated revenues: lower needs of thermal generation on normalized 742 climate conditions. ↑ Retail sales revenues: higher tariff. COP billion (1Q17) ↑ Distribution revenues: start of operations of Cuestecitas - Plan 5 Caribe. ↓ 46% (Y/Y) Central America: USD
Slide 5: Central America – operational figures
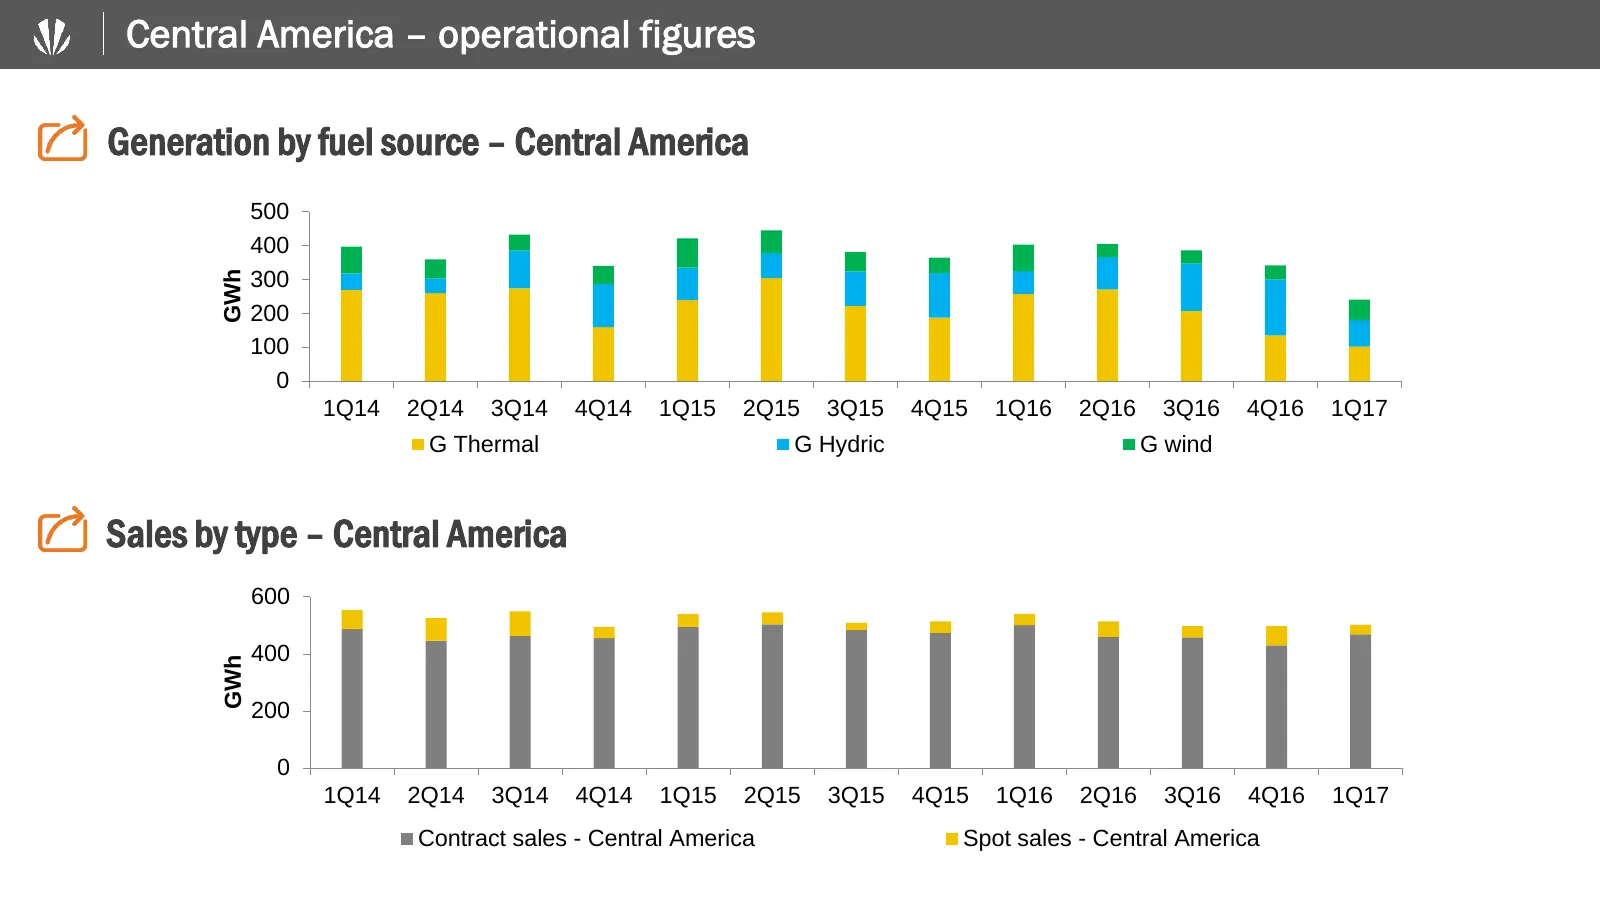
Central America – operational figures Generation by fuel source – Central America 500 400 GWh 300 200 100 0 1Q14 2Q14 3Q14 4Q14 1Q15 2Q15 3Q15 4Q15 1Q16 2Q16 3Q16 4Q16 1Q17 G Thermal G Hydric G wind Sales by type – Central America 600 400 GWh 200 0 1Q14 2Q14 3Q14 4Q14 1Q15 2Q15 3Q15 4Q15 1Q16 2Q16 3
Slide 6: Colombia – operational figures
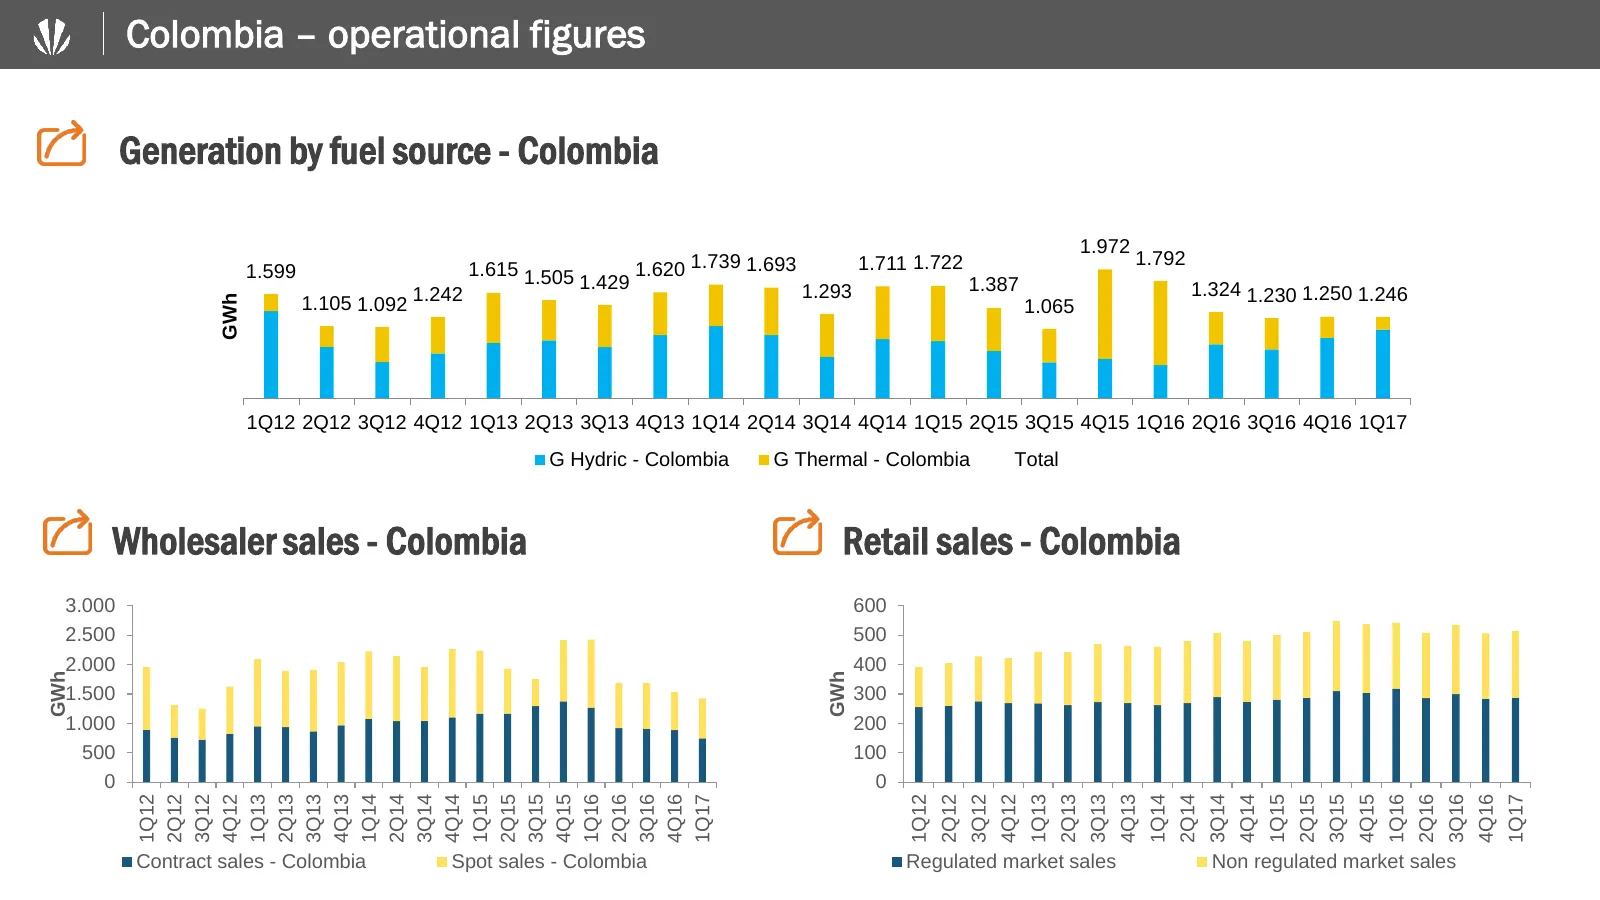
Colombia – operational figures Generation by fuel source - Colombia 1.972 1.792 1.599 1.615 1.505 1.620 1.739 1.693 1.711 1.722 1.429 1.293 1.387 1.324 1.230 1.250 1.246 1.105 1.092 1.242 GWh 1.065 1Q12 2Q12 3Q12 4Q12 1Q13 2Q13 3Q13 4Q13 1Q14 2Q14 3Q14 4Q14 1Q15 2Q15 3Q15 4Q15 1Q16 2Q16 3Q16 4Q16 1Q
Slide 7: Financial results: Revenues and Ebitda
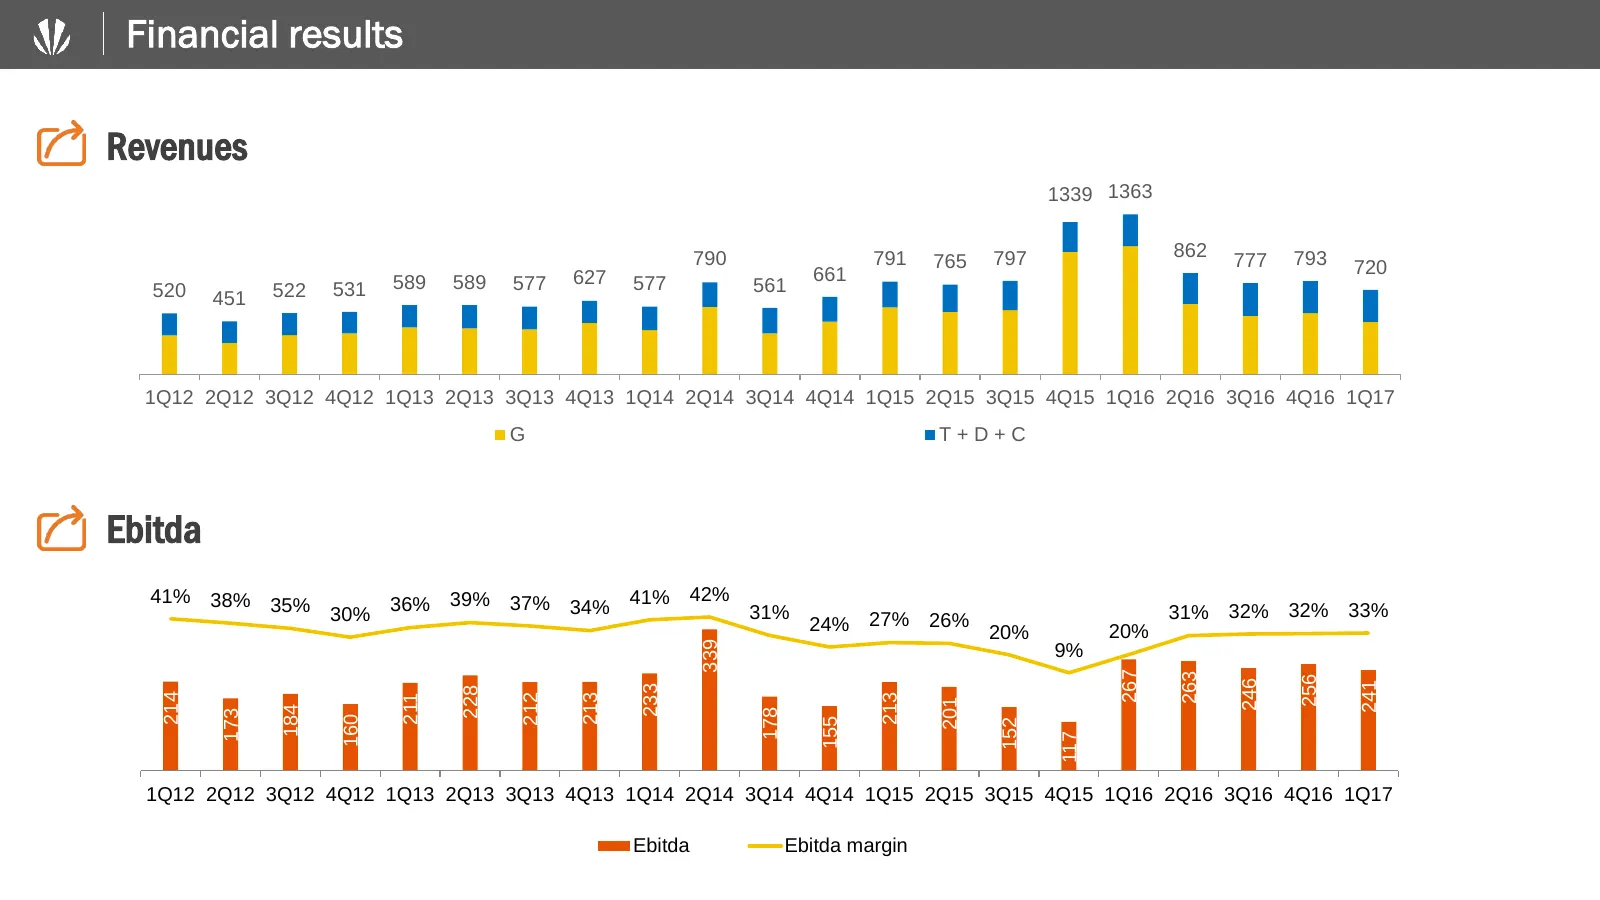
Financial results Revenues 1339 1363 790 791 797 862 777 793 765 720 589 589 577 627 577 661 520 522 531 561 451 1Q12 2Q12 3Q12 4Q12 1Q13 2Q13 3Q13 4Q13 1Q14 2Q14 3Q14 4Q14 1Q15 2Q15 3Q15 4Q15 1Q16 2Q16 3Q16 4Q16 1Q17 G T+D+C Ebitda 400.000 41% 38% 35% 39% 37% 34% 41% 42% 50% 30% 36% 31% 24% 27% 26%
Slide 8: Thank you
Thank you, inversionistas@celsia.com
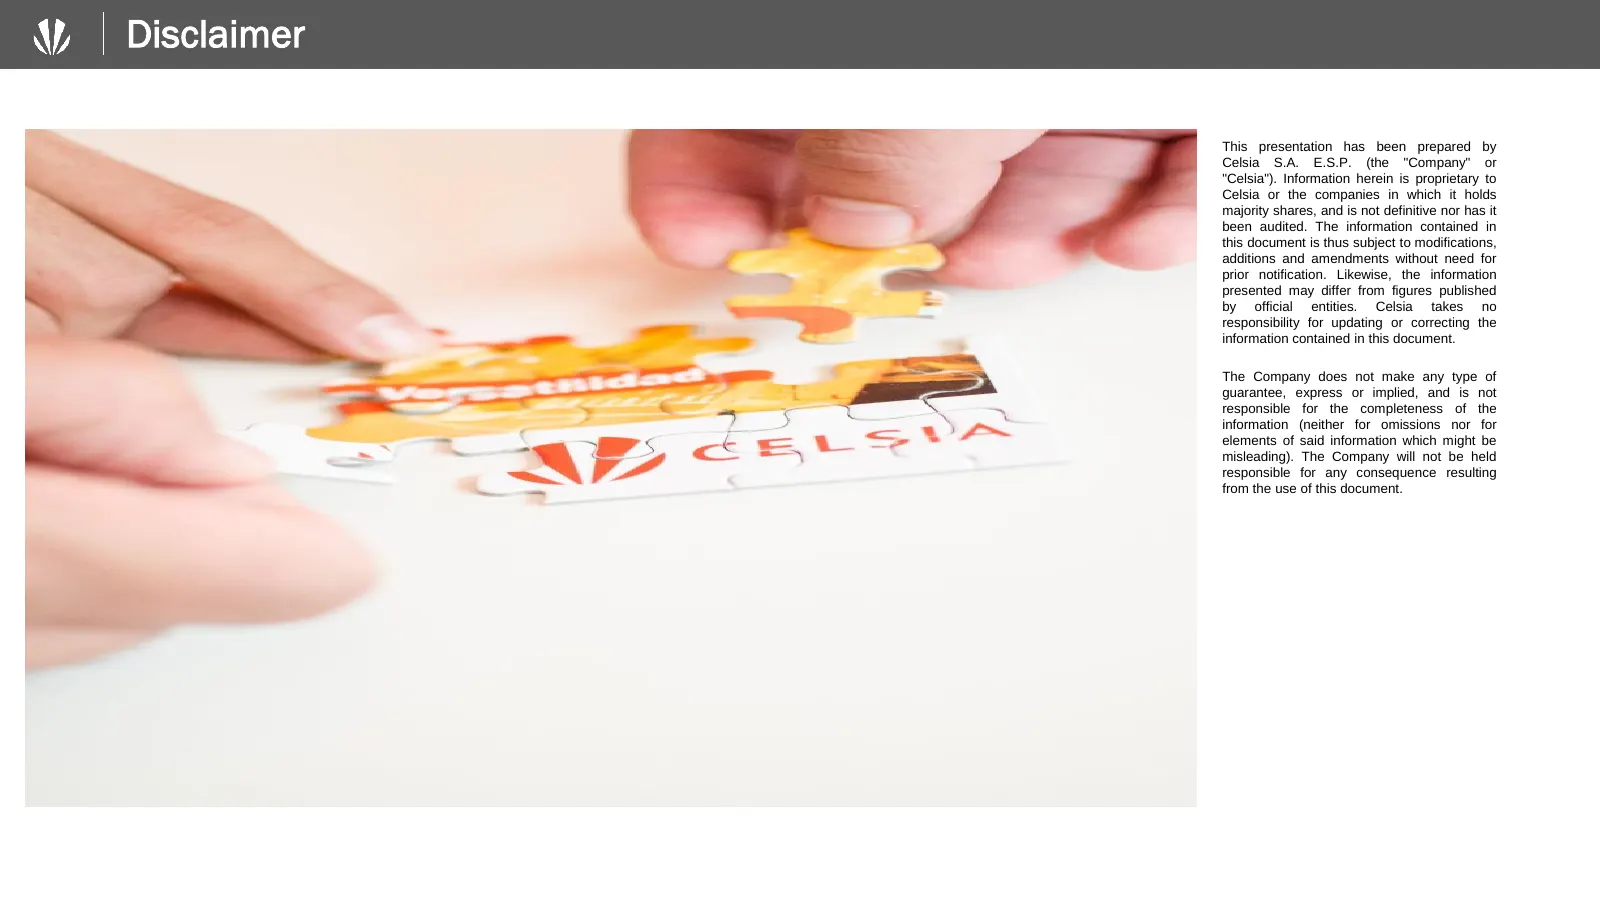
Slide 9: Disclaimer
Disclaimer This presentation has been prepared by Celsia S.A. E.S.P. (the "Company" or "Celsia"). Information herein is proprietary to Celsia or the companies in which it holds majority shares, and is not definitive nor has it been audited. The information contained in this document is thus subject
Source: Internet Archive copy of celsia.com
More decks from Celsia SA ESP
 Q3 2026 Earnings Presentation15 slides · November 2026
 Celsia — Investor Presentation (June 2026)26 slides · June 2026
 Celsia — Investor Presentation (June 2026)26 slides · June 2026
 Q4 2025 Earnings Presentation28 slides · February 2026
 Q2 2026 Earnings Presentation16 slides · 2026
 Investor Day (October 2025)46 slides · October 2025