Duke Realty — Citigroup Global Real Estate CEO Conference 2019
47 slides from Duke Realty's conference presentation, Mar 4, 2019

Slide 1: Citigroup Global Real Estate CEO Conference
CITIGROUP GLOBAL REAL ESTATE CEO CONFERENCE MARCH 4-5, 2019 " Dukereatty
Slide 2: Forward-Looking Statement
Forward-Looking Statement This slide presentation contains statements that constitute “forward-looking statements” within the meaning of the Securities Act of 1933 and the Securities Exchange Act of 1934 as amended by the Private Securities Litigation Reform Act of 1995. These forward-looking statem
Slide 3: Contents
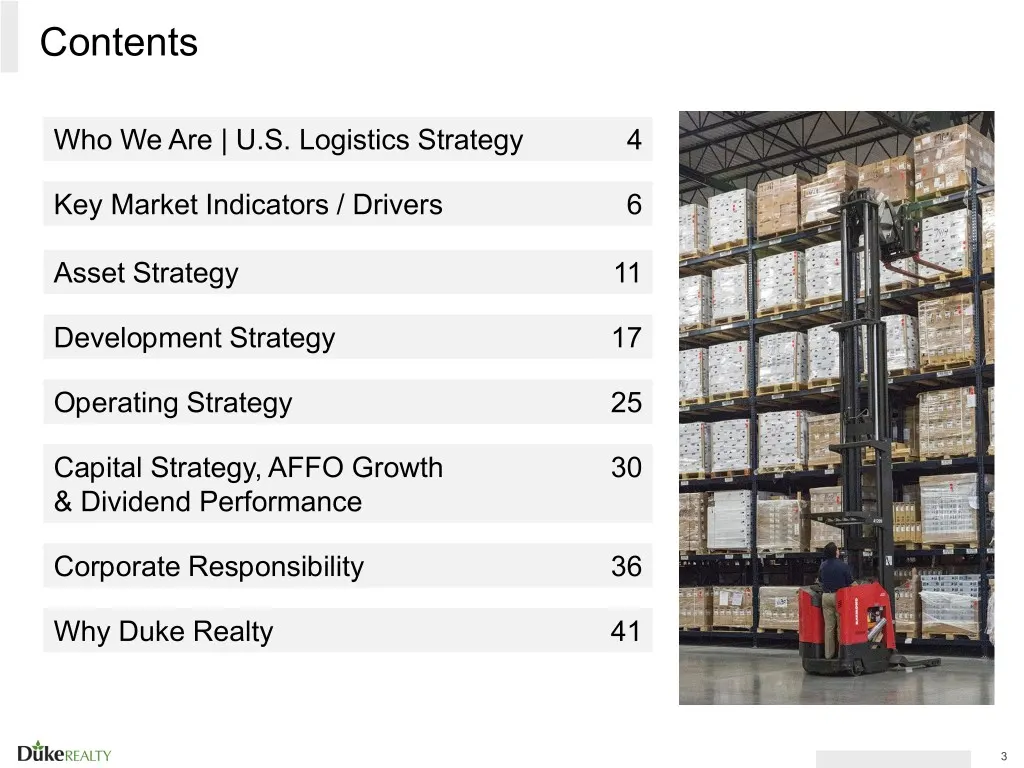
Contents Who We Are | U.S. Logistics Strategy 4 Key Market Indicators / Drivers 6 Asset Strategy 11 Development Strategy 17 Operating Strategy 25 Capital Strategy, AFFO Growth 30 & Dividend Performance Corporate Responsibility 36 Why Duke Realty 41 ” Diikereacty
Slide 4: The Leading Domestic-Only Logistics REIT
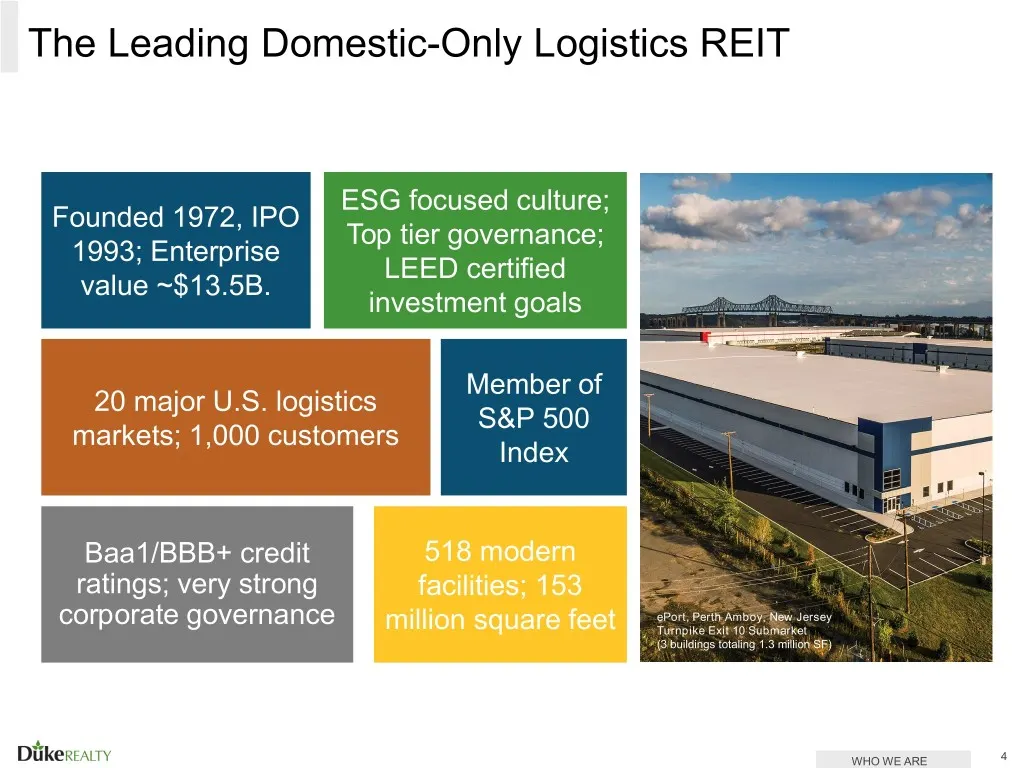
The Leading Domestic-Only Logistics REIT ESG focused culture; Top tier governance; LEED certified investment goals Founded 1972, IPO 1993; Enterprise value ~$13.5B. Member of S&P 500 Index Baa1/BBB¢+ credit ratings; very strong corporate governance ” Diikereacty WHO WE ARE
Slide 5: Duke Realty is the only REIT that Checks All The Boxes
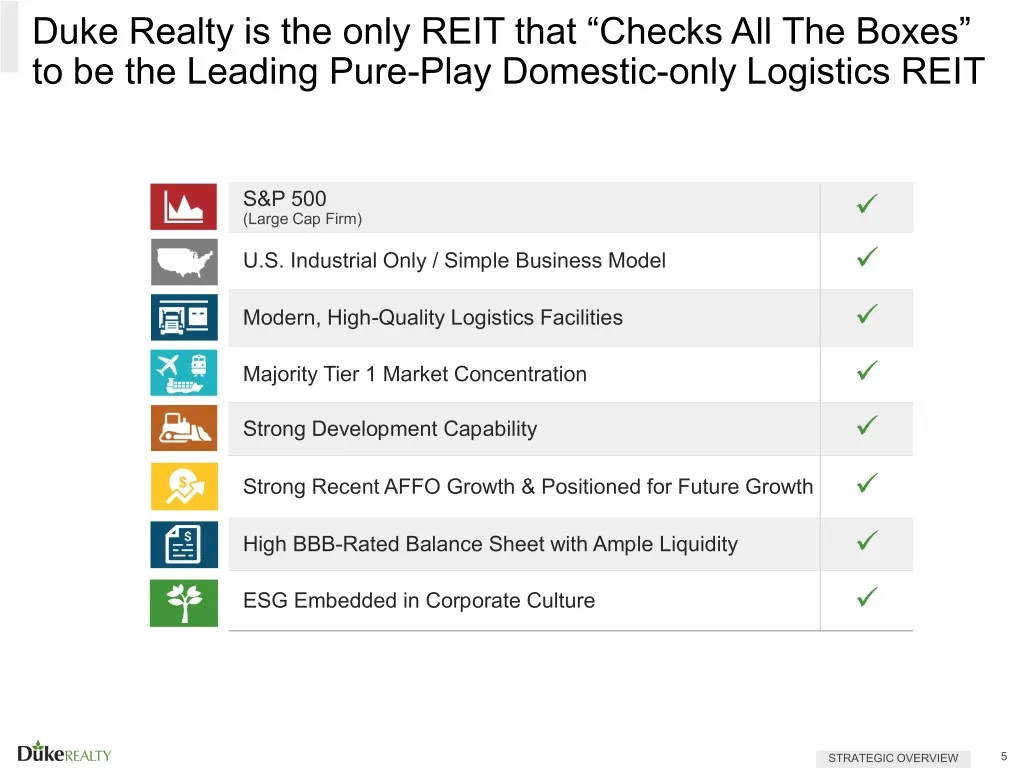
Duke Realty is the only REIT that “Checks All The Boxes” to be the Leading Pure-Play Domestic-only Logistics REIT S&P 500 (Large Cap Firm) U.S. Industrial Only / Simple Business Model Modern, High-Quality Logistics Facilities Majority Tier 1 Market Concentration Strong Development Capability Strong
Slide 6: Market Fundamentals
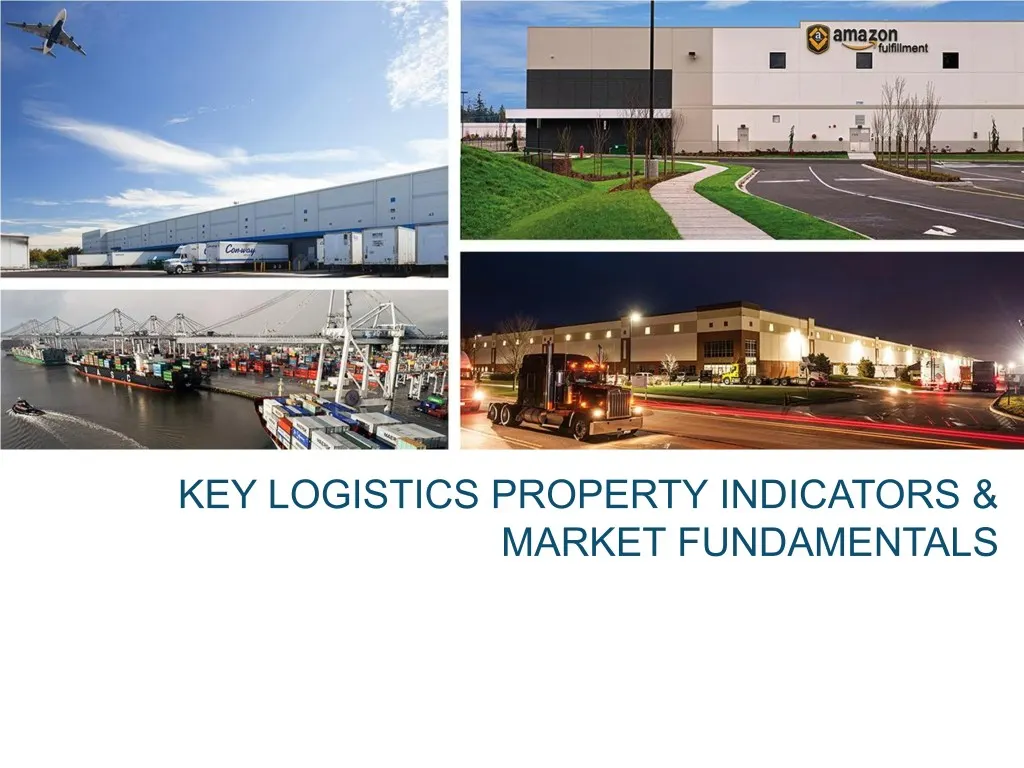
MARKET FUNDAMENTALS
Slide 7: Demand: Macroeconomic Indicators / Drivers
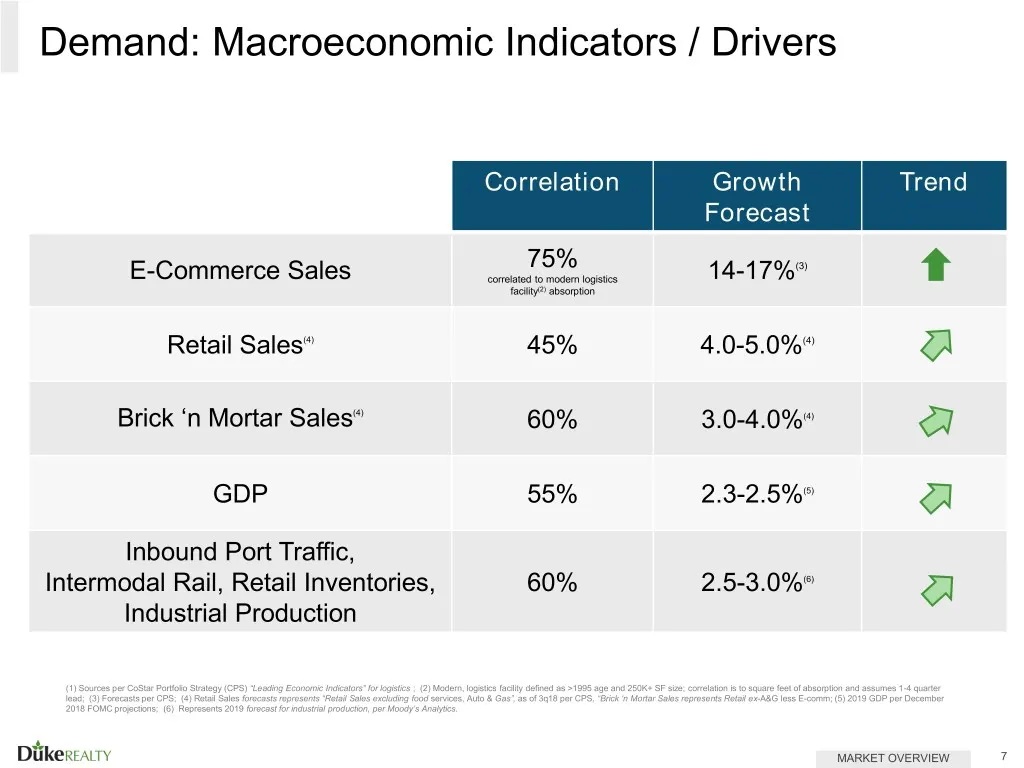
Demand: Macroeconomic Indicators / Drivers Correlation Growth Trend Forecast 75% E-Commerce Sales errant ie ee 14-17%" t facility? absorption Retail Sales” 45% 4.0-5.0%" Za Brick ‘n Mortar Sales” 60% 3.0-4.0%" @ GDP 55% 2.3-2.5%" A Inbound Port Traffic, Intermodal Rail, Retail Inventories, 60% 2.5-3
Slide 8: Demand: E-Commerce Penetration and Growth Rate
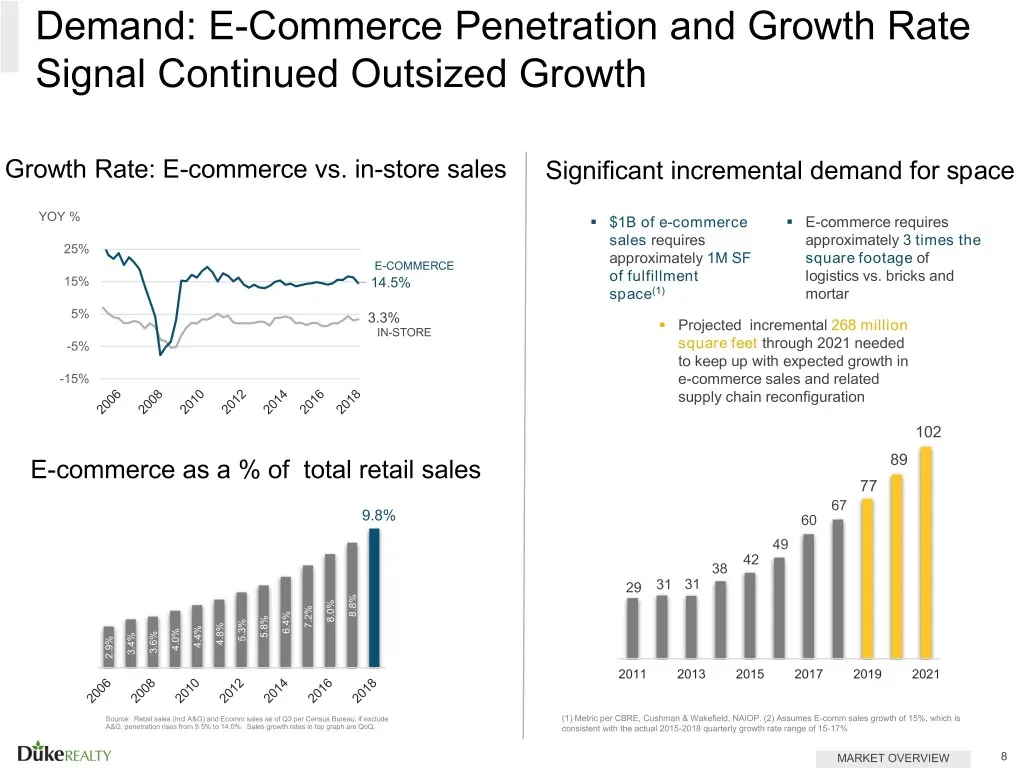
Demand: E-Commerce Penetration and Growth Rate Signal Continued Outsized Growth Growth Rate: E-commerce vs. in-store sales — Significant incremental demand for space YOY % = $1B ofe-commerce = E-commerce requires * sales requires approximately 3 times the ‘ceemacRee approximately 1M SF square footag
Slide 9: Evolution of Amazon Distribution Network Growth
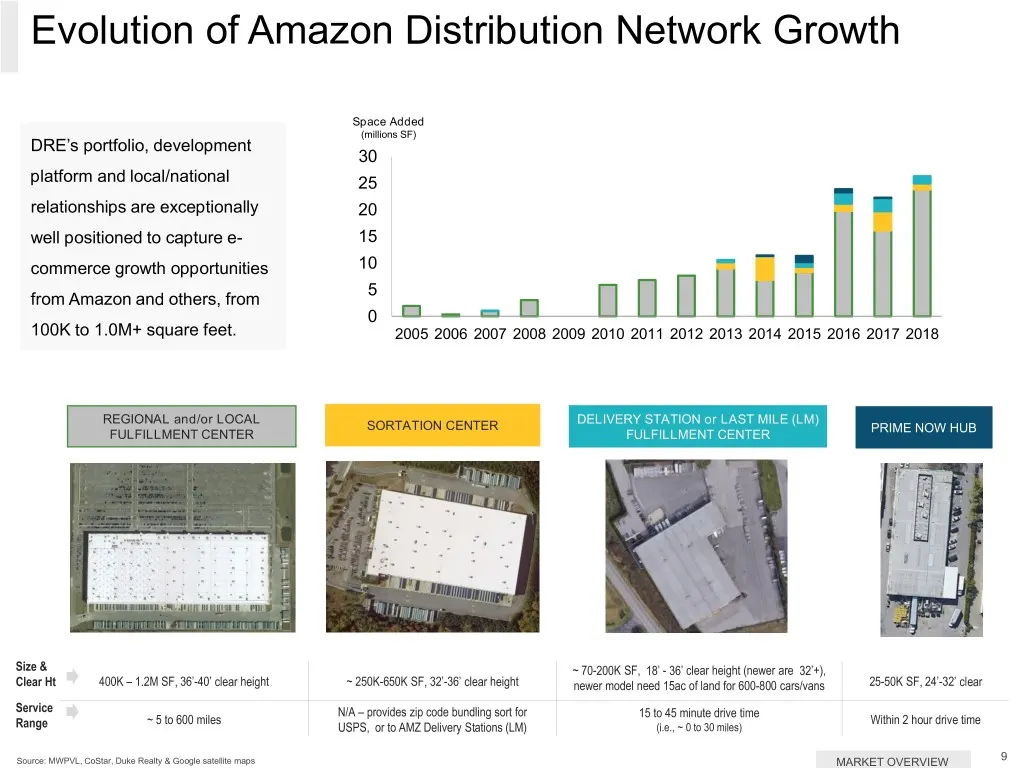
Evolution of Amazon Distribution Network Growth Space Added DRE's portfolio, development oo ad platform and local/national 25 relationships are exceptionally 20 well positioned to capture e- 15 commerce growth opportunities 10 fl i from Amazon and others, from i aaa | i} a | i Mt : 100K to 1.0M+ squ
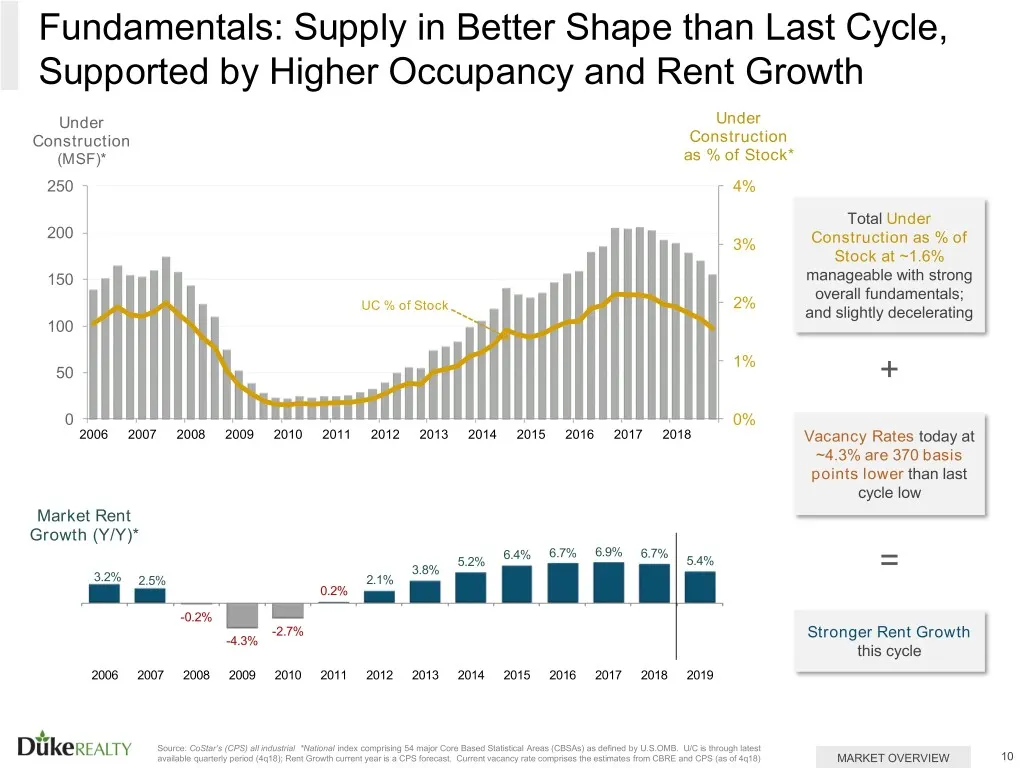
Slide 10: Fundamentals: Supply in Better Shape than Last Cycle
Fundamentals: Supply in Better Shape than Last Cycle, Supported by Higher Occupancy and Rent Growth Under Under Construction Construction (MSE)* as % of Stock* 250 4% 200 3% 150 | UC % of Stock, 2% 100 | = 50 1% 0 0% 2012 2013 2014 2015 «2016 «2017 2018 2006 2007 2008 ©2009 2010 2011 Market Rent Gro
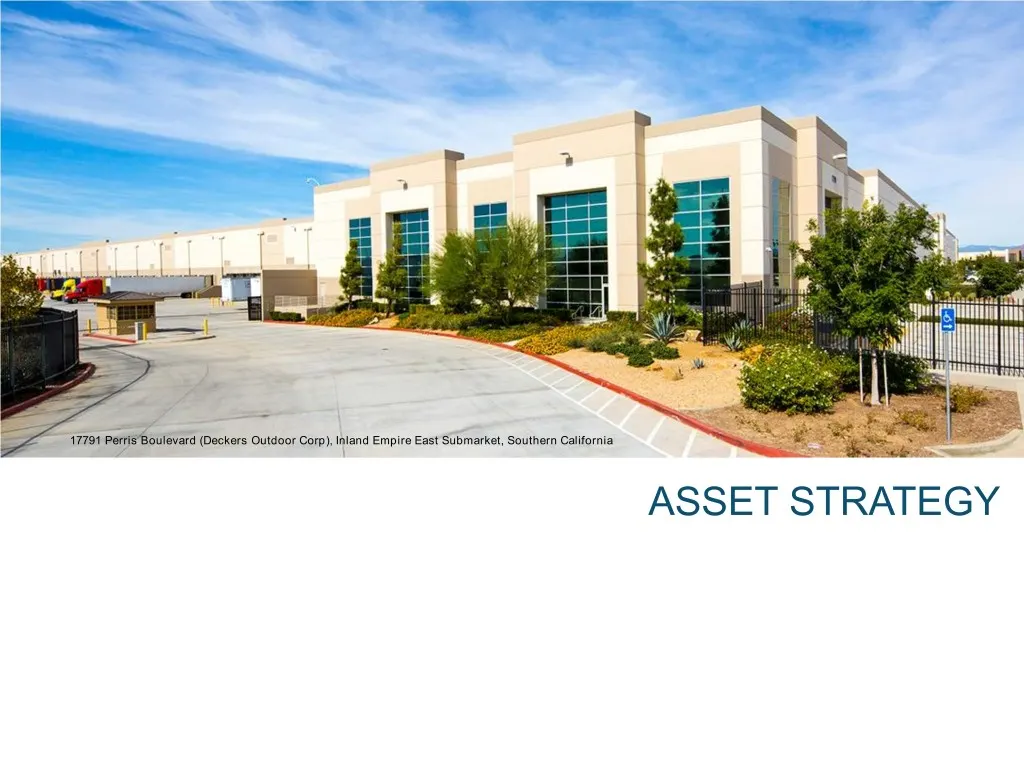
Slide 11: Asset Strategy
i “ ASSET STRATEGY
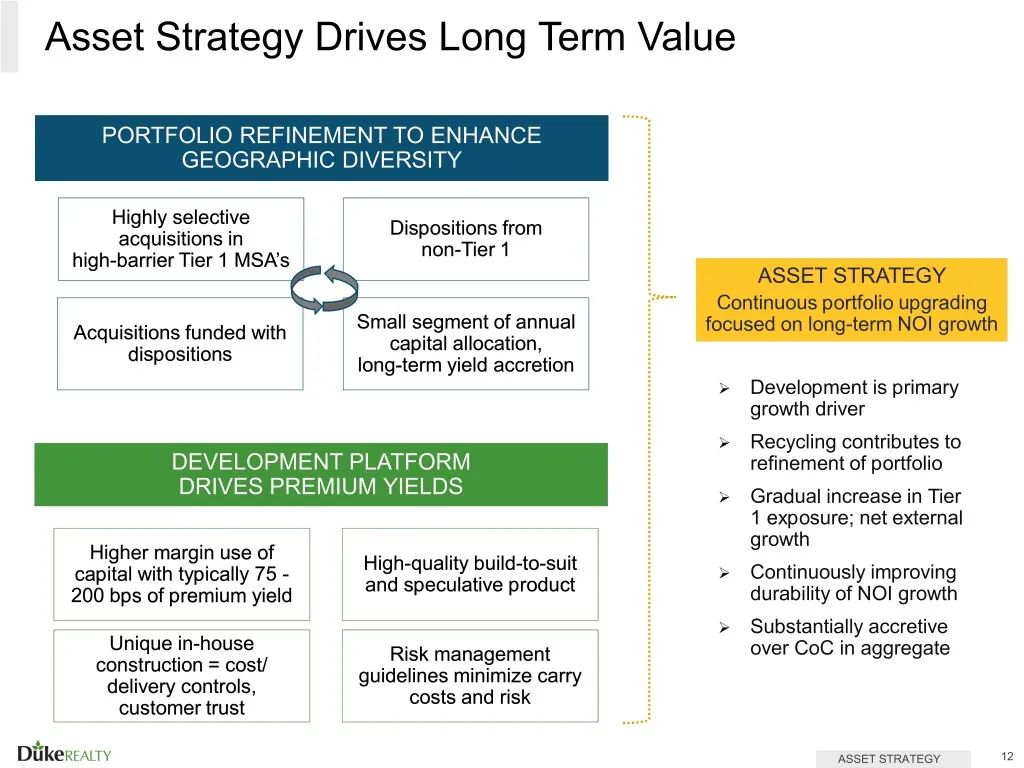
Slide 12: Asset Strategy Drives Long Term Value
Asset Strategy Drives Long Term Value PORTFOLIO REFINEMENT TO ENHANCE GEOGRAPHIC DIVERSITY Highly selective acquisitions in high-barrier Tier 1 MSA's Dispositions from non-Tier 1 Small segment of annual capital allocation, long-term yield accretion DEVELOPMENT PLATFORM DRIVES PREMIUM YIELDS Higher m
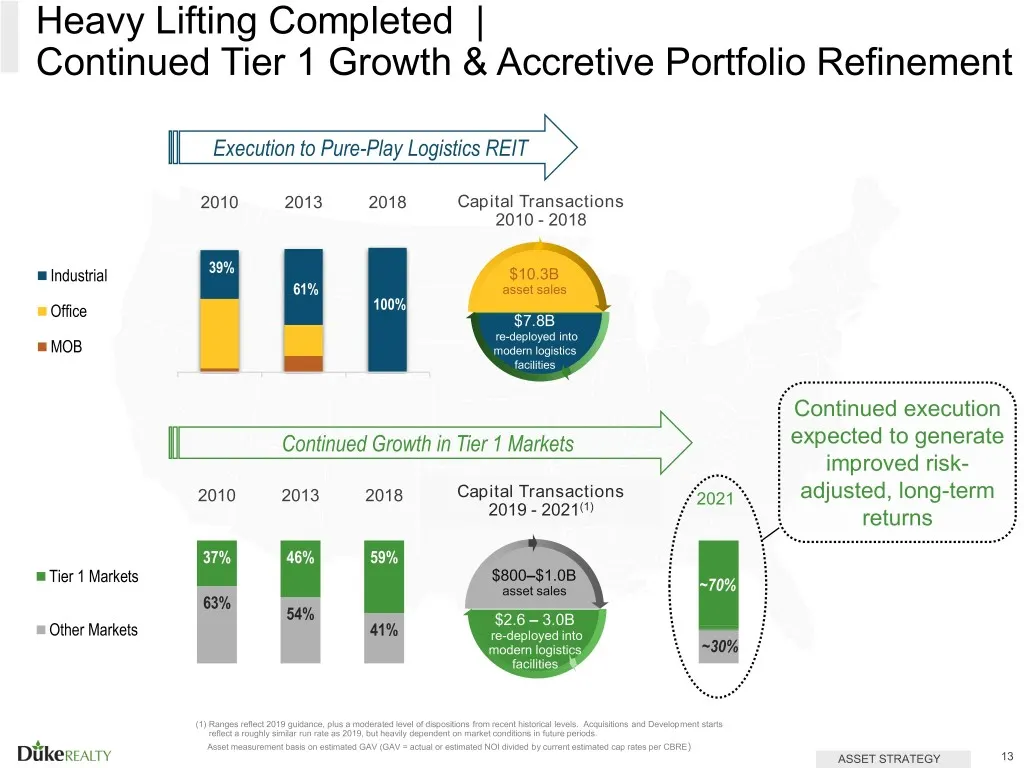
Slide 13: Heavy Lifting Completed
Heavy Lifting Completed | Continued Tier 1 Growth & Accretive Portfolio Refinement ‘m= Industrial © Office = MOB = Tier 1 Markets = Other Markets Diikegeacty Execution to Pure-Play Logistics REIT 2010 20132018 Capital Transactions 2010 - 2018 61% E ey Continued execution Continued Growth in Tier 1 M
Slide 14: Geographical Diversification into Tier Markets
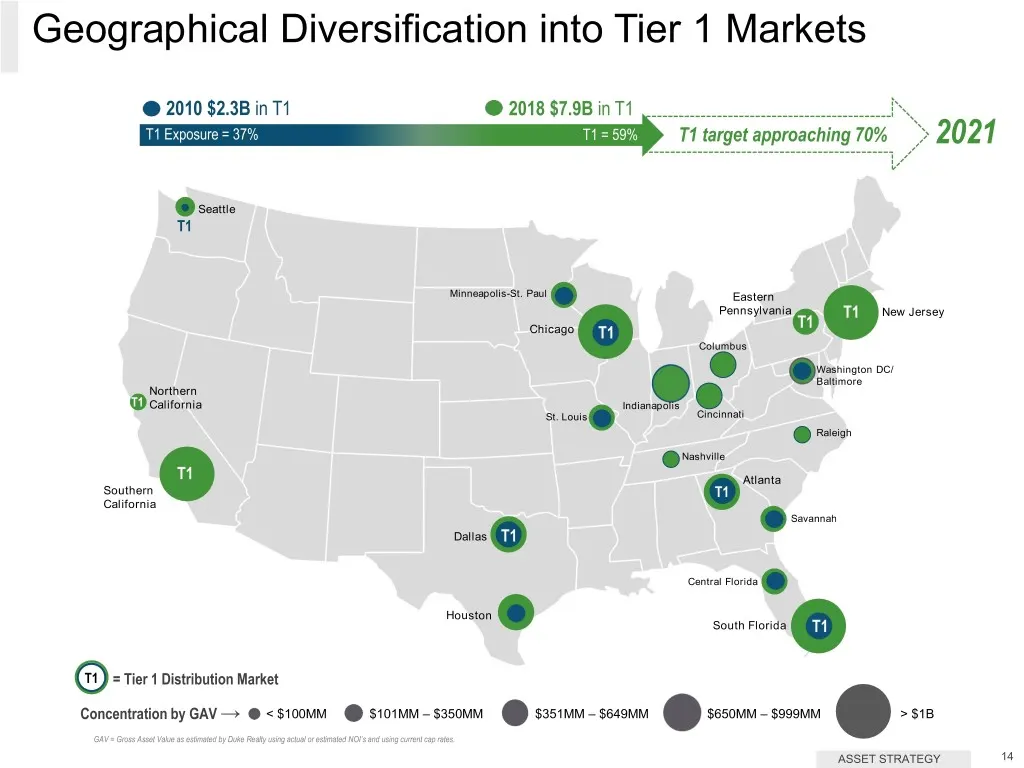
Geographical Diversification into Tier 1 Markets @ 2010 $2.3B in T1 > @ seattio M1 Northern Deaitornia Southern California ® = Tier 1 Distribution Market @ 2018 $7.9B in T1 T1 target approaching 70% Columbus ty) cing rene nl Now Jersey chicago @ Washington Dc Baltimore une @ st Loui spats Gincinnat)
Slide 15: Industrial Best-in-Class Portfolio
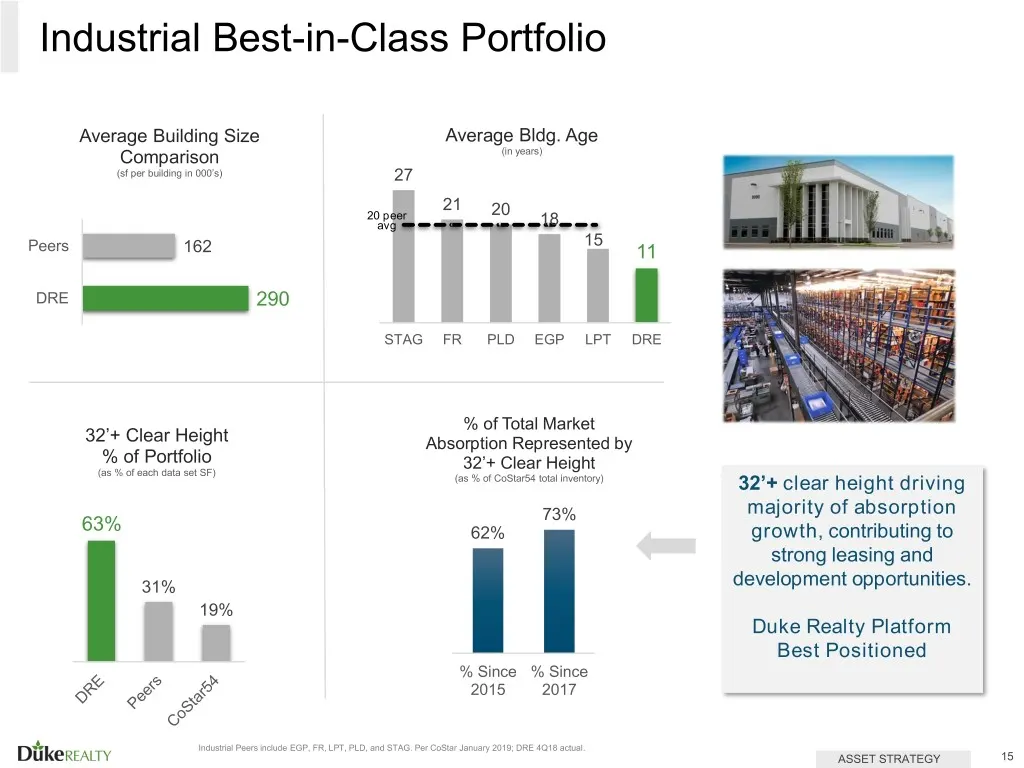
Industrial Best-in-Class Portfolio Average Building Size Comparison (i per butting in 00's) Peers (IS 162 ore ES 200 32'+ Clear Height % of Portfolio (8 % of each data set SF) 63% Diikercatty Average Bldg. Age (in years) 27 a ae | } l | [ STAG FR PLD EGP LPT DRE % of Total Market Absorption Represen
Slide 16: Modern, Big Box Facilities Producing Strong Rent Growth
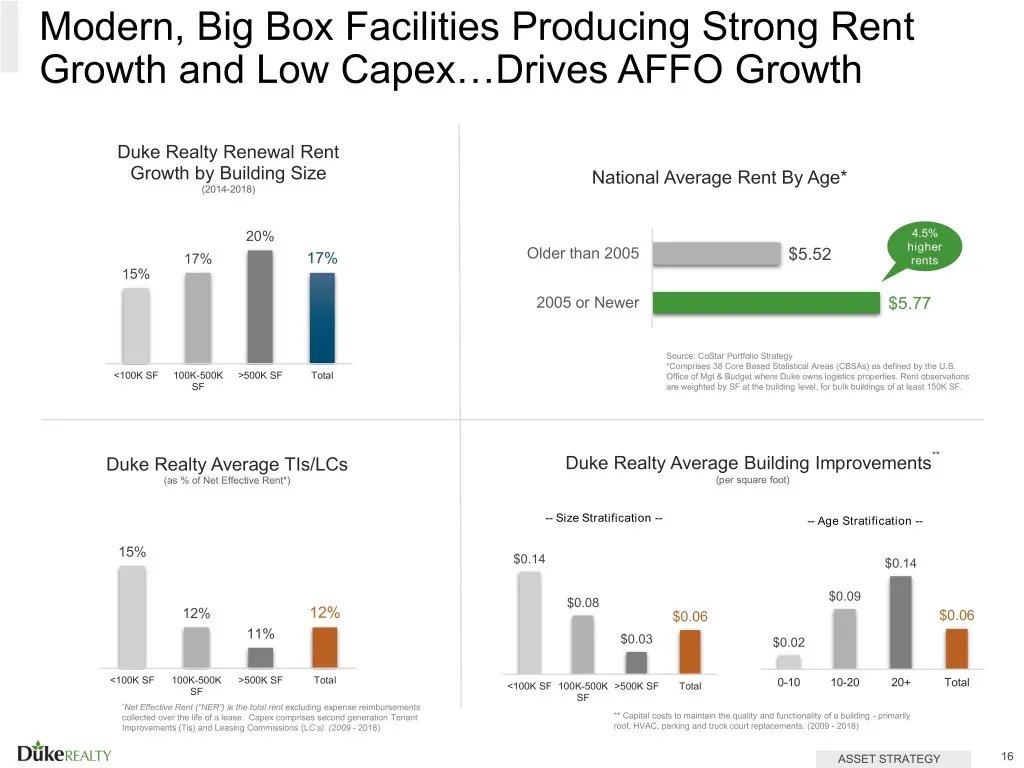
Modern, Big Box Facilities Producing Strong Rent Growth and Low Capex...Drives AFFO Growth Duke Realty Renewal Rent Growth by Building Size 2014-2018) 20% 17% 17% 15% <100K SF 100K-500K >500K SF Total ‘SF Duke Realty Average Tls/LCs (as % of Nt Effective Rent") 15% 12% 12% 11% <100K SF 100K-500K >50
Slide 17: Development Strategy & Performance
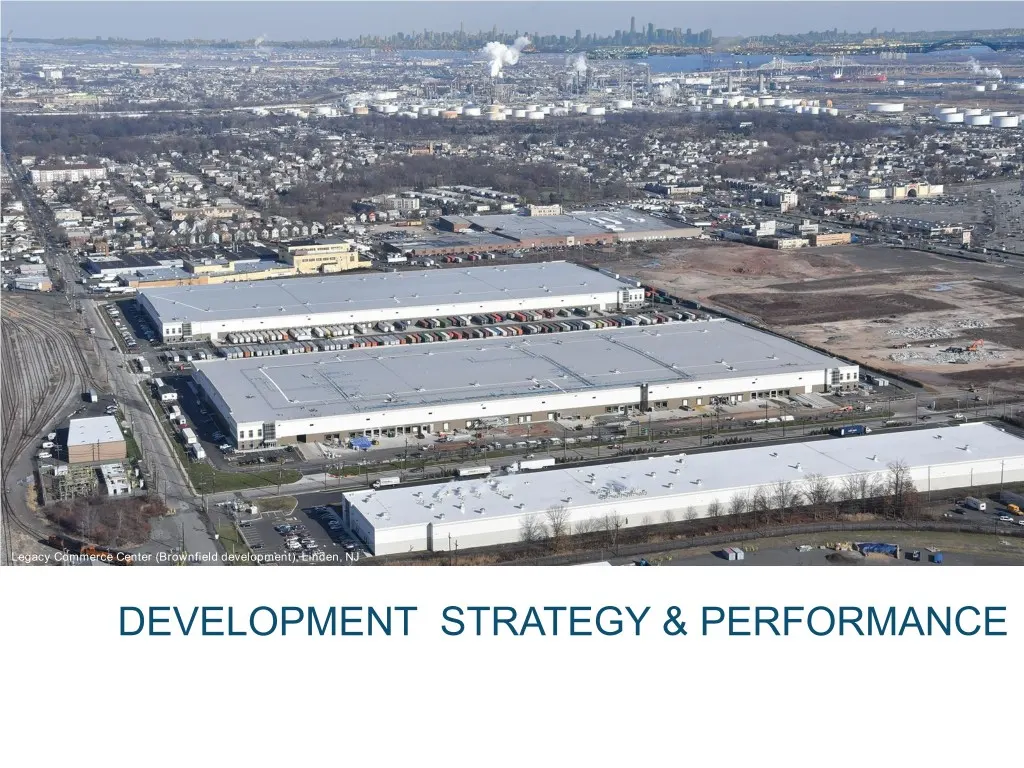
Legacy’ Ctimmerce Ceater (Brownfield devela DEVELOPMENT STRATEGY & PERFORMANCE
Slide 18: Development Strategic Advantages
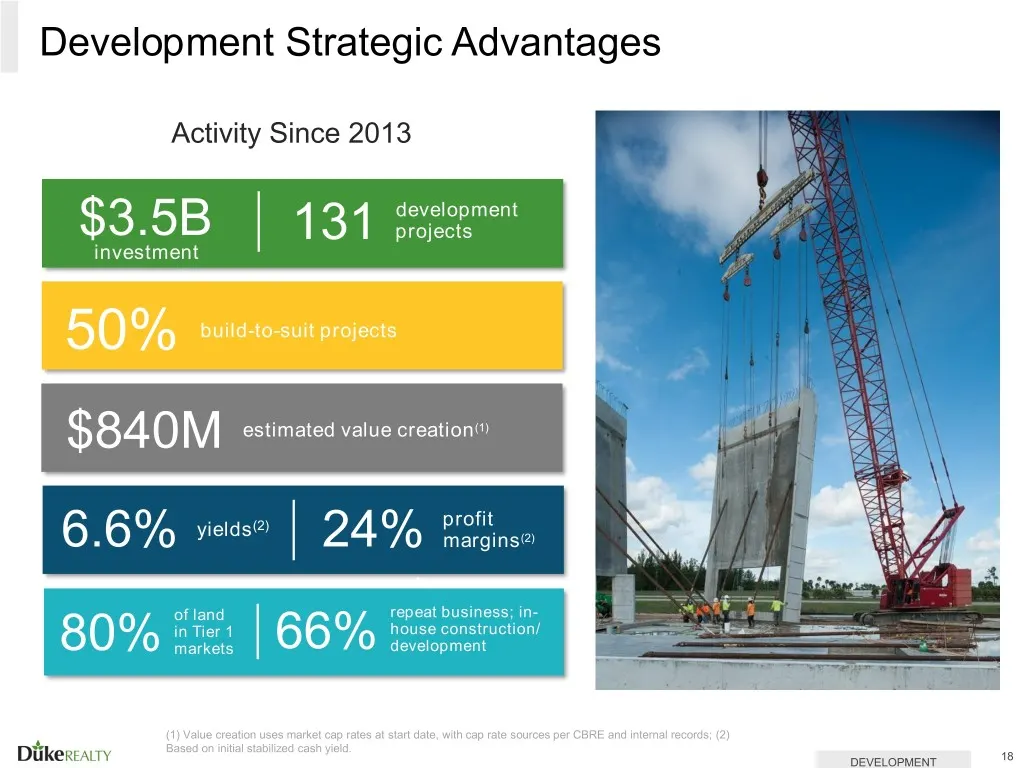
Development Strategic Advantages Activity Since 2013 $3.5B | 131 sau" investment estimated value creation”) 0, rofit yields) | 24% merinees ” Diikereacty Fe DEVELOPMENT 8
Slide 19: Recent Build-to-Suit Development Deliveries
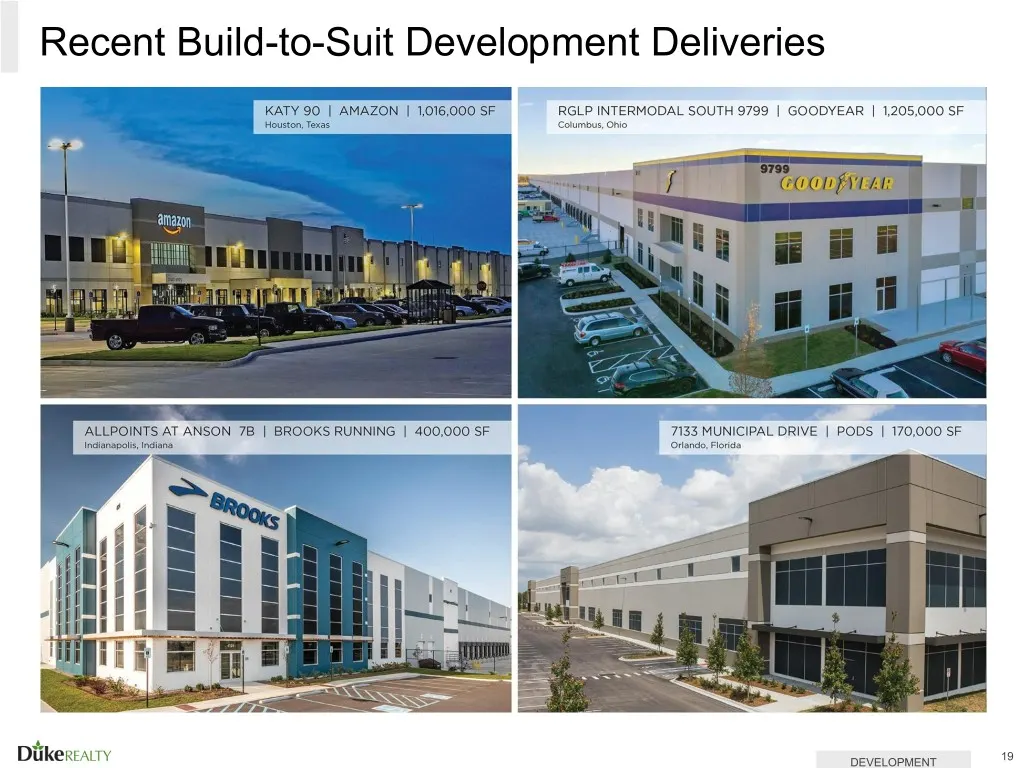
Recent Build-to-Suit Development Deliveries KATY 90 | AMAZON | 1,016,000 SF RGLP INTERMODAL SOUTH 9799 | GOODYEAR | 1,205,000 SF Houston, Texas Columbus, rio i " Diikereatty DEVELOPMENT 19
Slide 20: Select Recent Development Activity
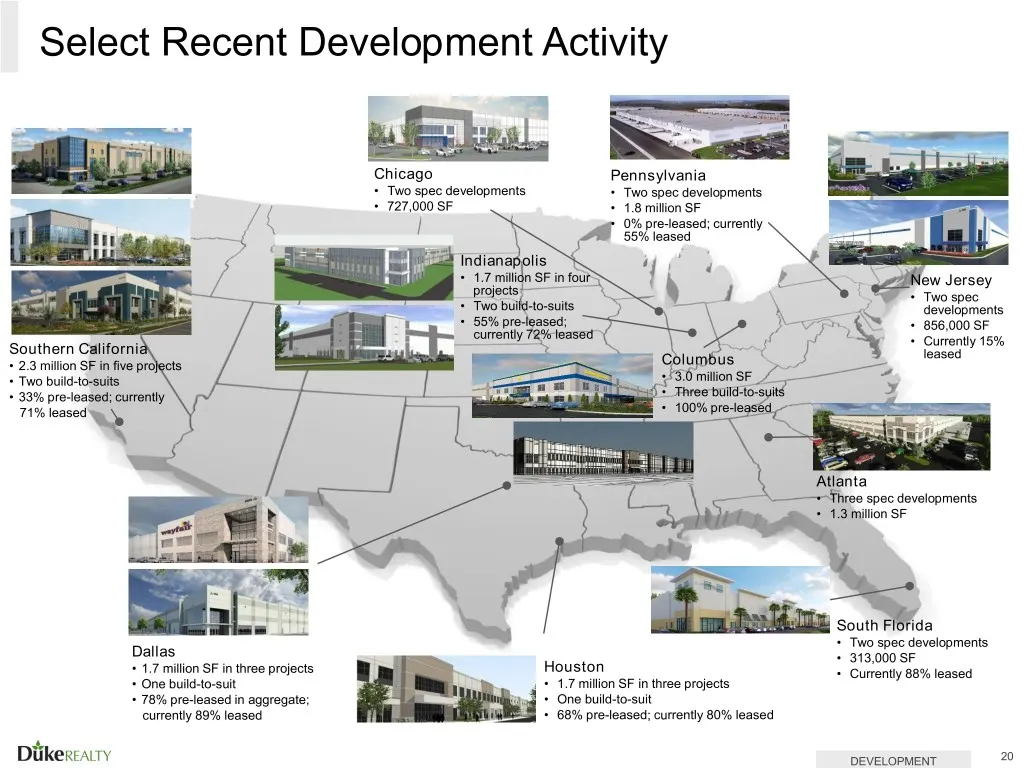
Select Recent Development Activity Chicago Pennsylvania + Two spec developments + Two spec developments Wi + 727,000 SF + 1.8 million SF | 0% pre-leased; currently 55% leased Indianapolis + Two spec developments + 95% pre-leased; —— + 856,000 SF »_ currently 7296 leased + Currently 15% Southern Cali
Slide 21: Speculative Development: Proven Execution
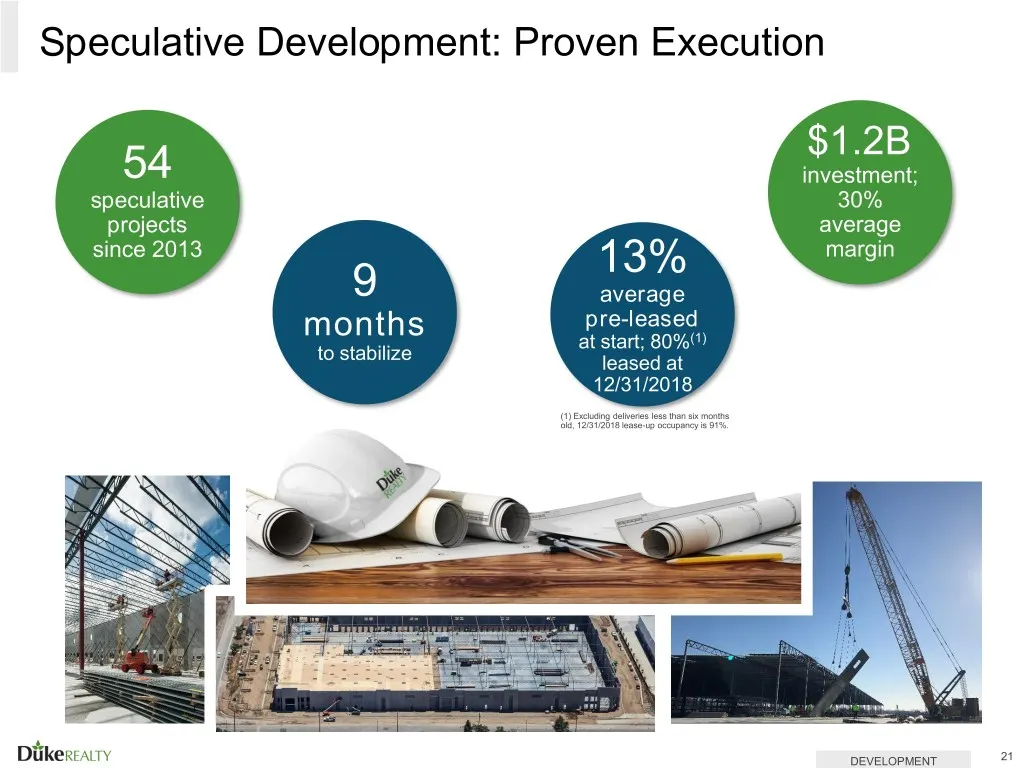
Speculative Development: Proven Execution 54 eee speculative 30% projects average since 2013 1 3% margin “ average months pre-leased to stabilize eierOWA9 leased at 12/31/2018, Diikegeacty DEVELOPMENT
Slide 22: Infill Redevelopment — Core Expertise
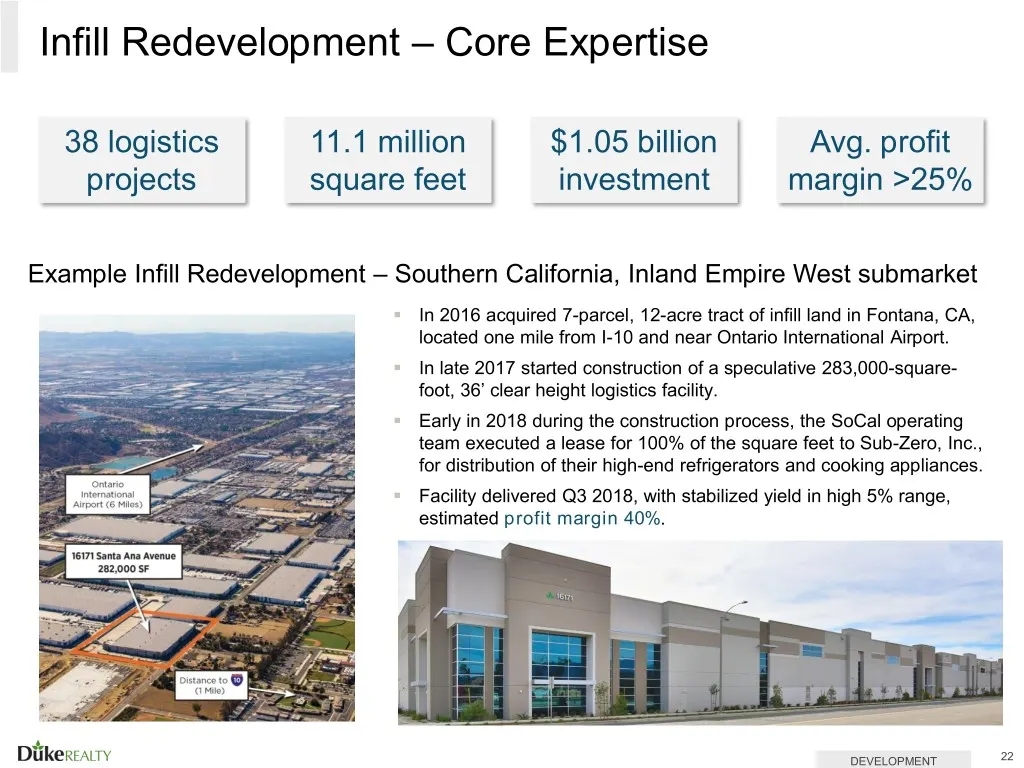
Infill Redevelopment — Core Expertise 38 logistics 11.1 million $1.05 billion Avg. profit projects square feet investment margin >25% Example Infill Redevelopment — Southern California, Inland Empire West submarket In 2016 acquired 7-parcel, 12-acre tract of infill land in Fontana, CA, located one m
Slide 23: In-fill Redevelopments — Northern New Jersey
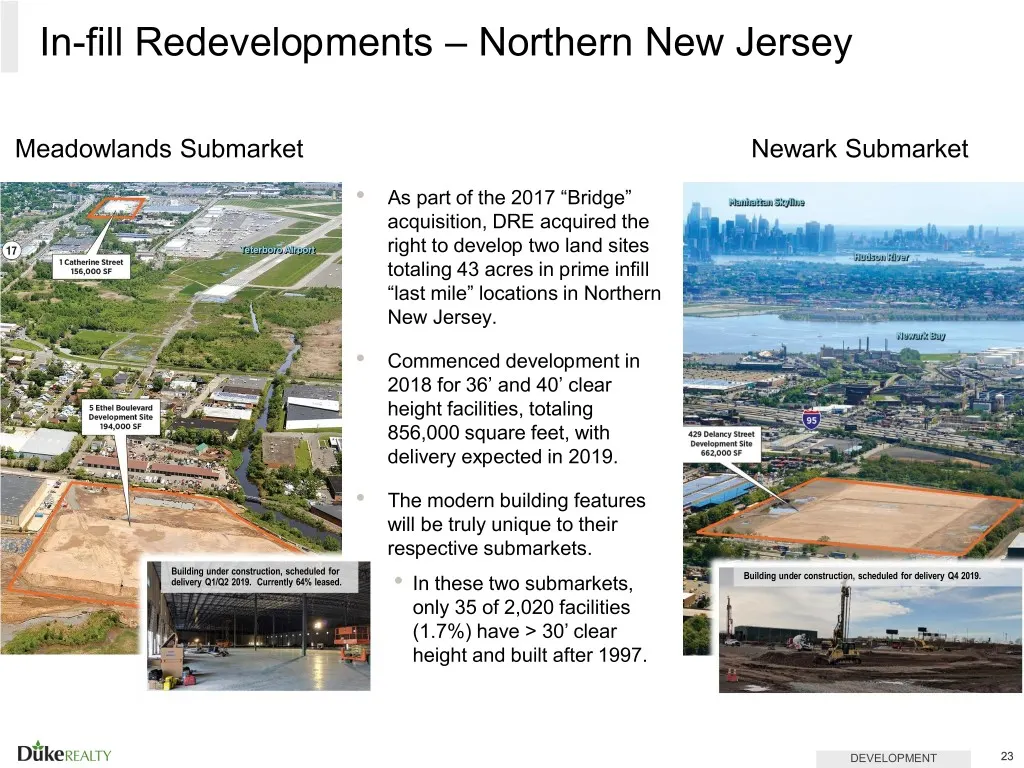
In-fill Redevelopments — Northern New Jersey Meadowlands Submarket Newark Submarket As part of the 2017 “Bridge” Muindton ene acquisition, DRE acquired the right to develop two land sites totaling 43 acres in prime infill “last mile” locations in Northern New Jersey. an 3a Commenced development in 2
Slide 24: Strong Relative Development Pipeline
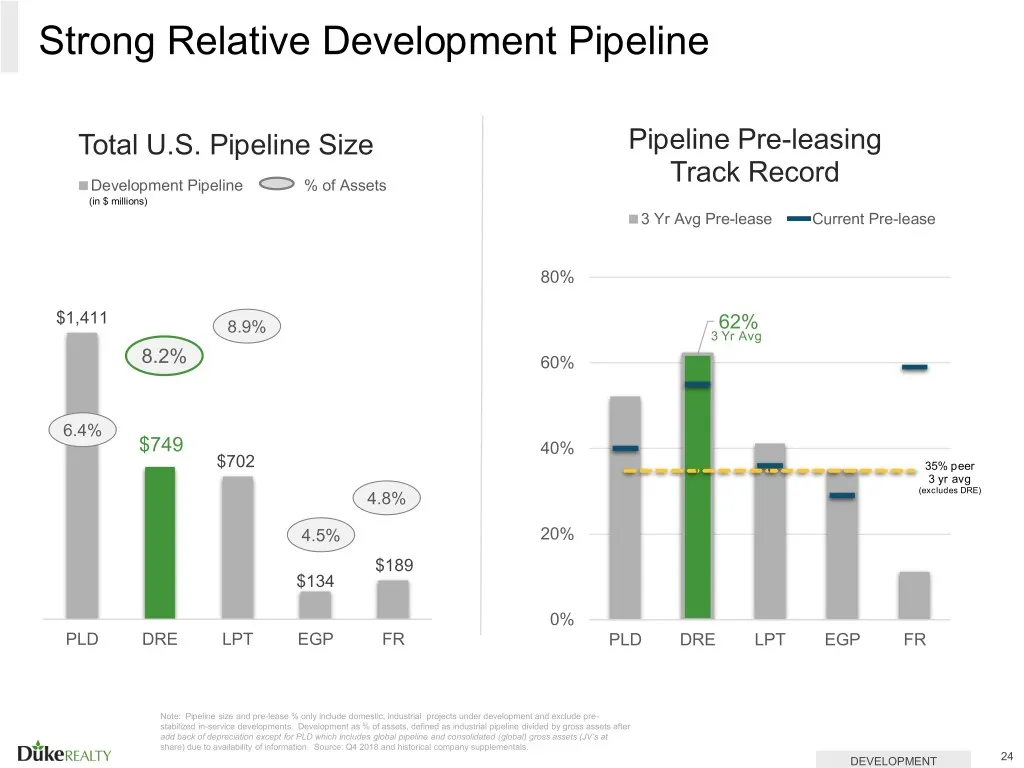
Strong Relative Development Pipeline Total U.S. Pipeline Size Pipeline Pre-leasing Track Record = Development Pipeline <> % of Assets {in miions) 3 Yr Avg Pre-lease ==Current Pre-lease 80% $1,411 62% /3Yr Avg 60% 6.4% $749 40% $702 - = oe 3% peer 20% $189 = 8 r Oo Be PLD DRE LPT EGP PLD DRE LPT EGP
Slide 25: Operating Strategy
OPERATING STRATEGY
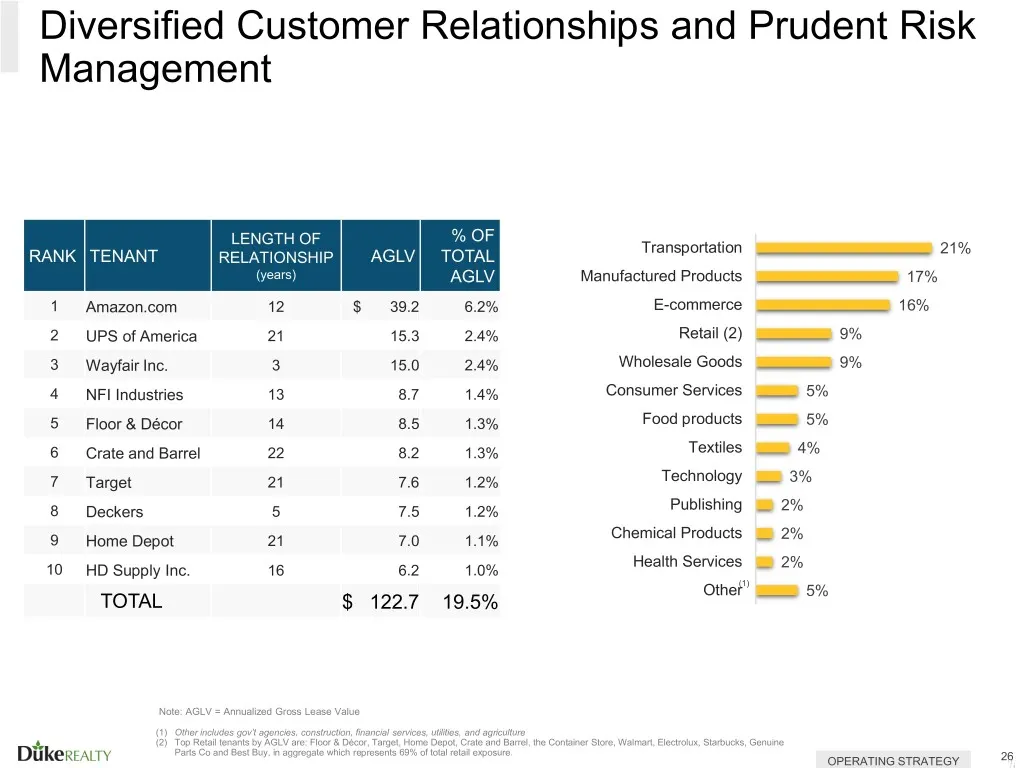
Slide 26: Diversified Customer Relationships and Prudent Risk Management
Diversified Customer Relationships and Prudent Risk Management LENGTH OF RANK | TENANT RELATIONSHIP. Amazon.com 2 UPS of America 2 3 Wayfair Inc. 3 4 NFI Industries 13 5 Floor & Décor 14 6 — Crate and Barrel a2 7 Target 2 8 Deckers 5 9 Home Depot a 10 HD Supply Inc. 16 TOTAL Note Anais Diikercatty P
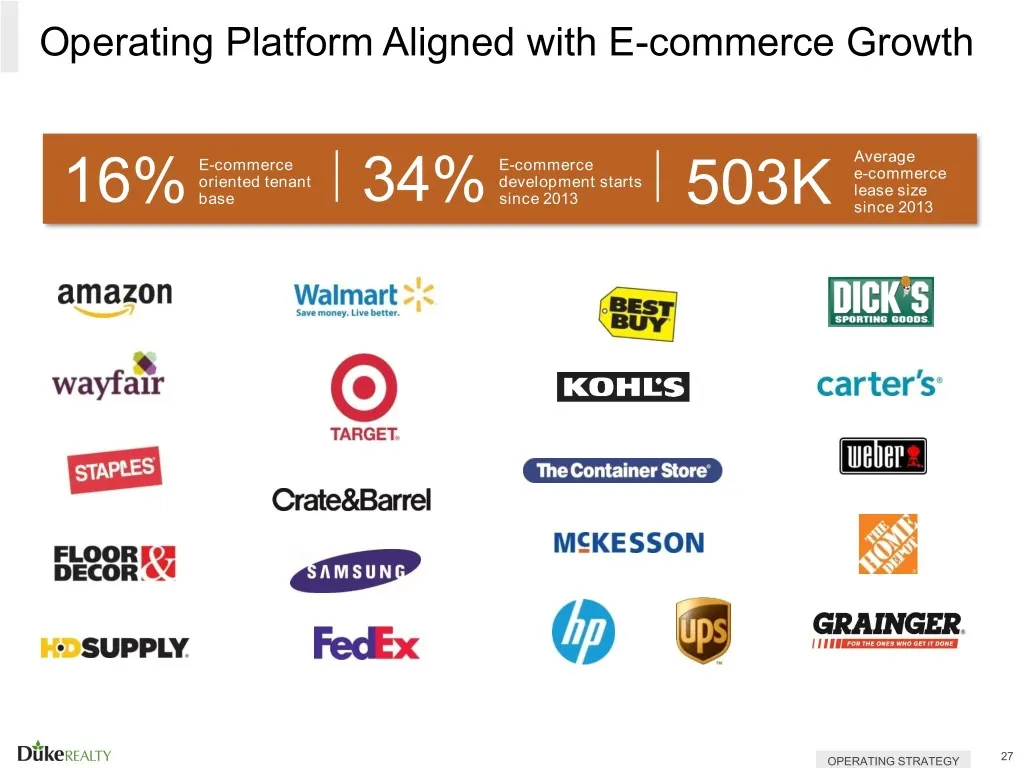
Slide 27: Operating Platform Aligned with E-commerce Growth
Operating Platform Aligned with E-commerce Growth amazon Walmart >< or ——7 ‘Save money. Live better. % ; wayfair |KOHLS| carter's: TARGET. | STAPLES | elie Crate&Barrel . MKESSON eS DECOR Primsuned SS GRAINGER. > SUPPLY. FedEx @ ps SSS i " Diikereatty OPERATING STRATEGY a
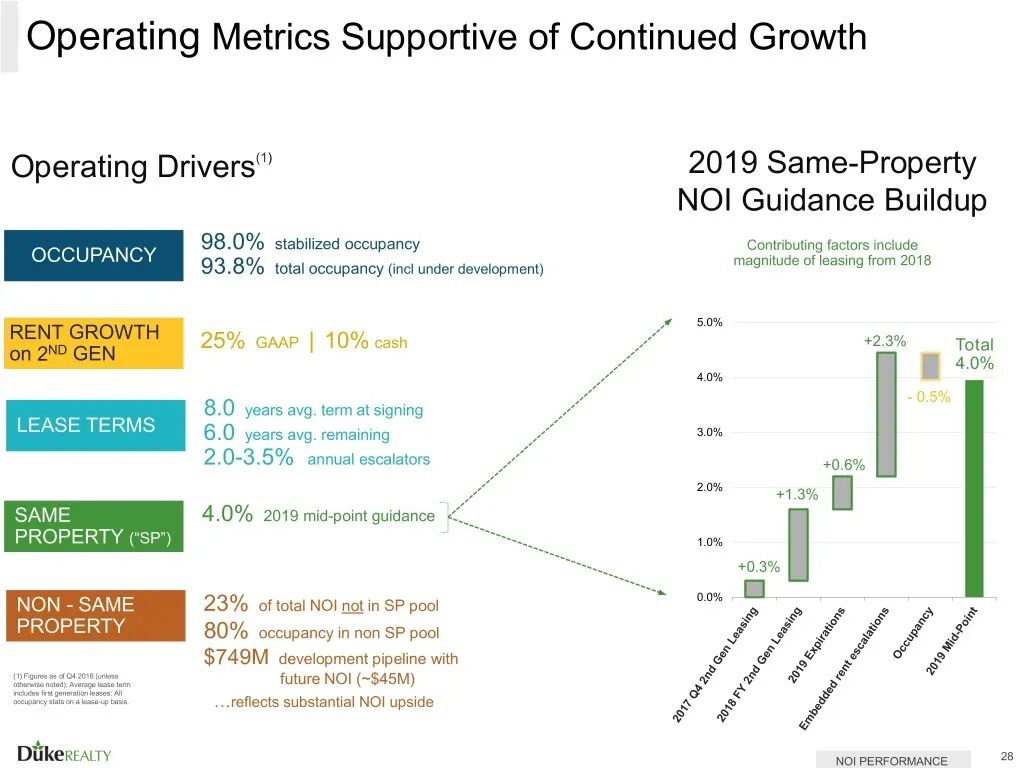
Slide 28: Operating Metrics Supportive of Continued Growth
Operating Metrics Supportive of Continued Growth Operating Drivers” OCCUPA ee | 25% GaP | 10% cash LEASE TERMS SAME PROPERTY ("sP”) NON - SAME PROPERTY Diikegeacty 98.0% stabilized occupancy 93.8% total occupancy (incl under development) 8.0 years avg. term at signing 6.0 years avg. remaining 2.0-3.
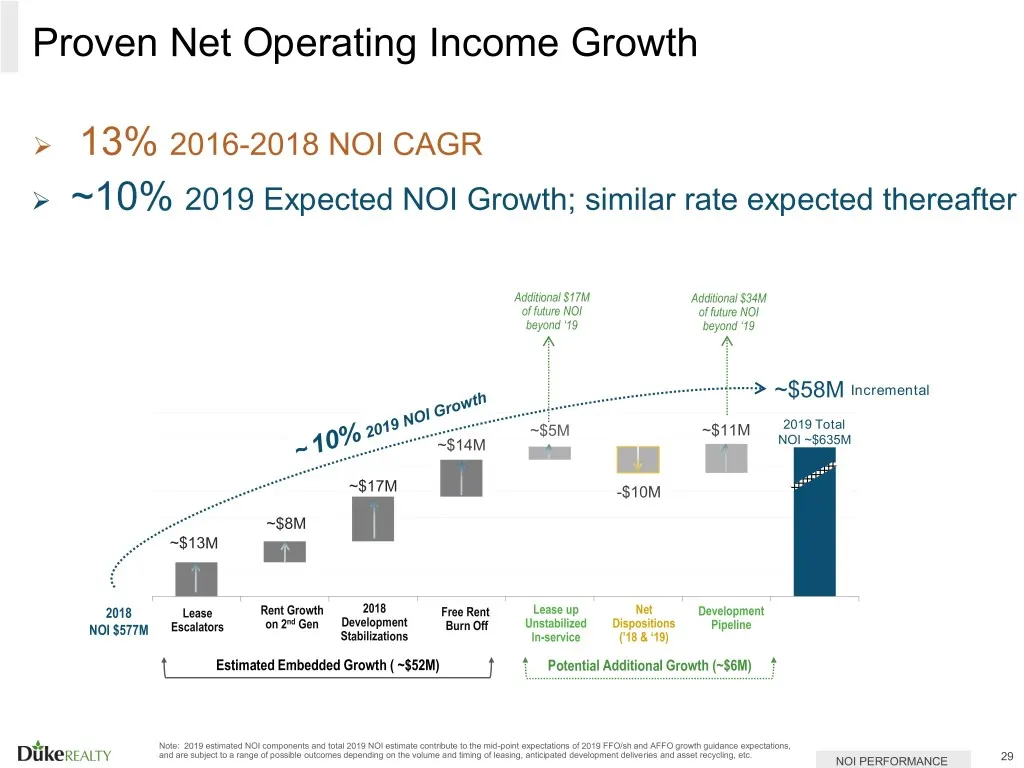
Slide 29: Proven Net Operating Income Growth
Proven Net Operating Income Growth > 13% 2016-2018 NOI CAGR > ~10% 2019 Expected NOI! Growth; similar rate expected thereafter Additional $17M ‘Additional $34M of future NOI of future NOI beyond 19 ‘beyond ‘19 A > ~$58M Incremental ~$11M 2019 Total Ea NOL ~$635M 2018 sae? Rent Growth 2018 Free Rent
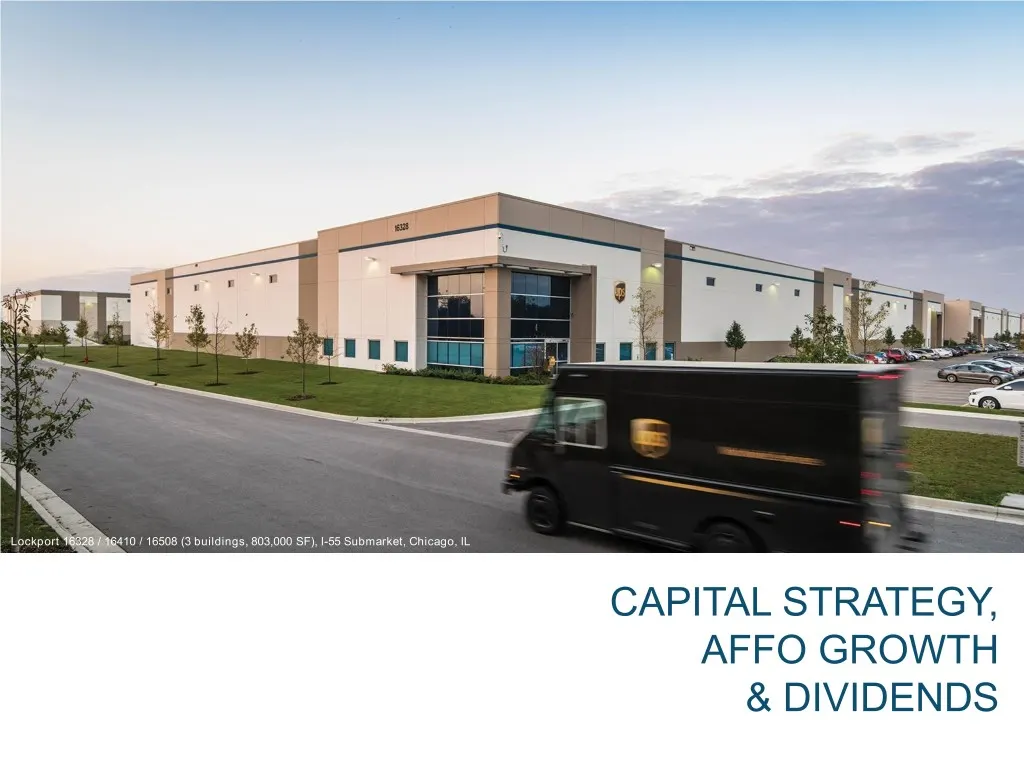
Slide 30: Capital Strategy, AFFO Growth & Dividends
CAPITAL STRATEGY, AFFO GROWTH & DIVIDENDS
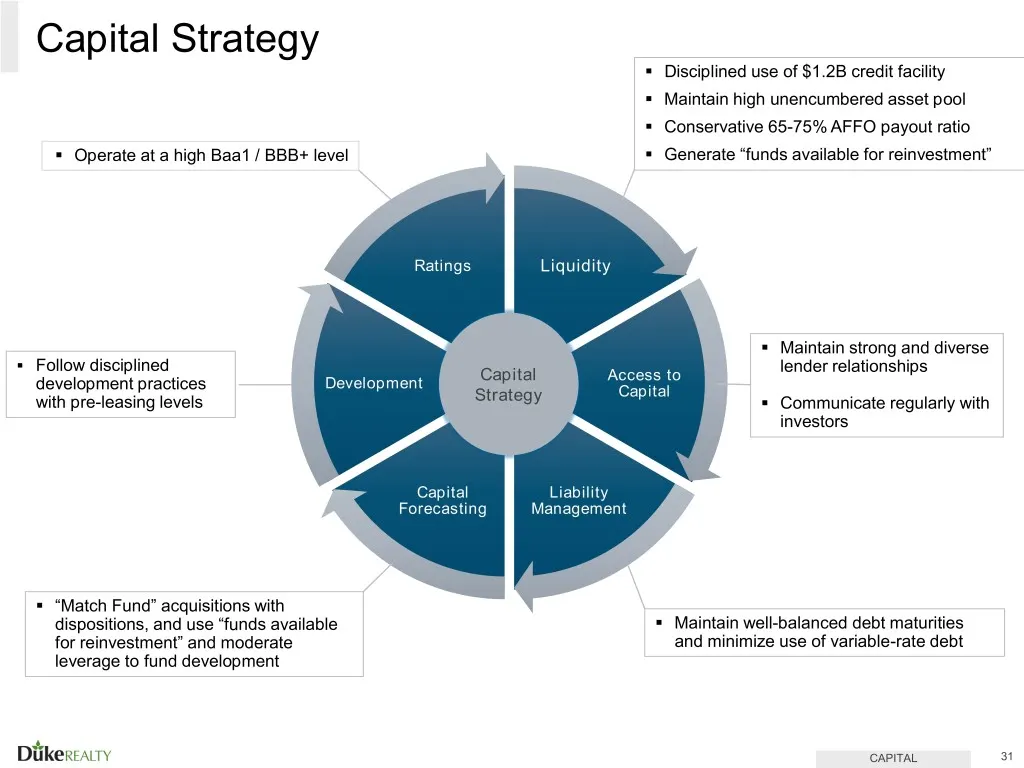
Slide 31: Capital Strategy
Capital Strategy Disciplined use of $1.2B credit facility Maintain high unencumbered asset pool Conservative 65-75% AFFO payout ratio Generate “funds available for reinvestment” = Operate at a high Baa1 / BBB+ level = Maintain strong and diverse * Follow disciplined lender relationships development
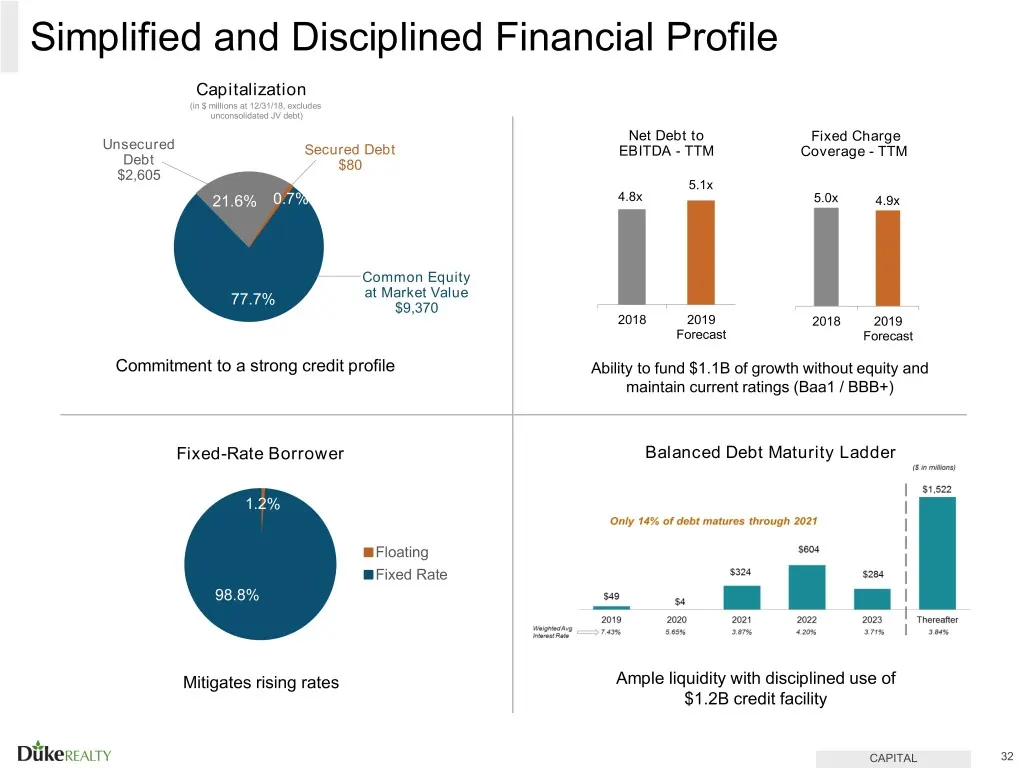
Slide 32: Simplified and Disciplined Financial Profile
Simplified and Disciplined Financial Profile Capitalization Unsecured bast aad Debt $2,605 Common Equity at Market Value $9,370 Commitment to a strong credit profile Fixed-Rate Borrower Floating Fixed Rate Mitigates rising rates Diikercatty Net Debt to Fixed Charge EBITDA - TTM Coverage - TTM 5.1K 4
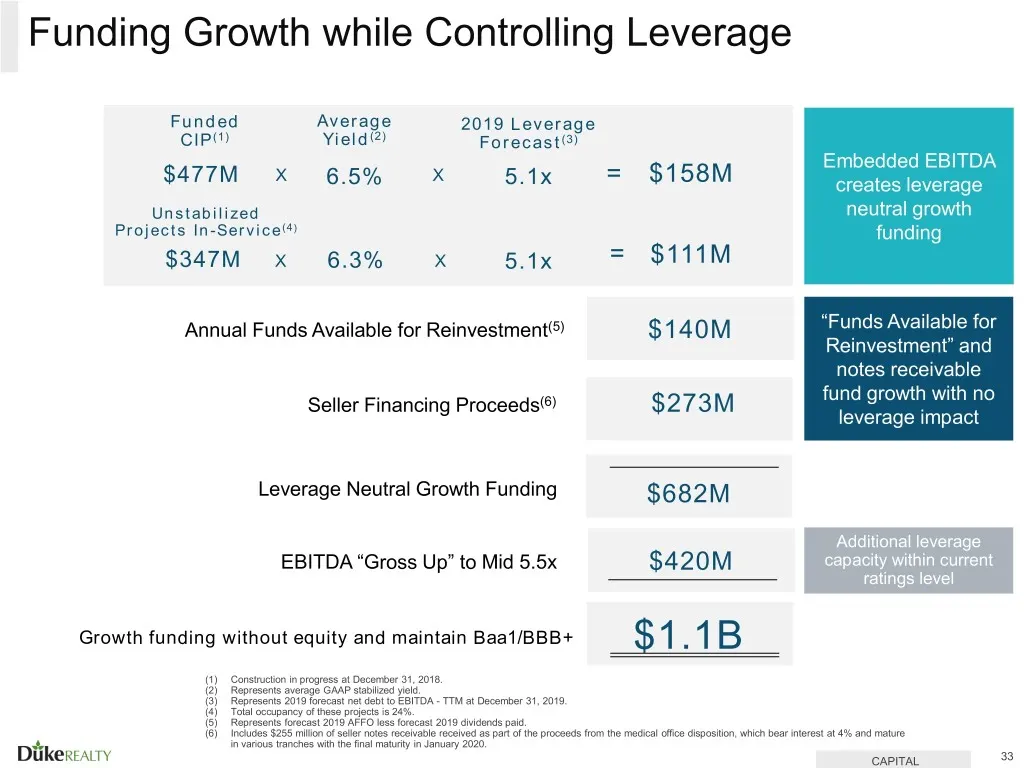
Slide 33: Funding Growth while Controlling Leverage
Funding Growth while Controlling Leverage Funded Average 2019 Leverage CIP) Yield’) Forecast(3) = Embedded EBITDA $477™M Xx 6.5% me 5.1x = $158M creates leverage Unstabilized neutral growth Projects In-Service!) funding $347M x 6.3% x 51x = $111M $140M “Funds Available for Reinvestment” and Annual F
Slide 34: Baa1/BBB+ Rated but Credit Metrics at A Quality Levels
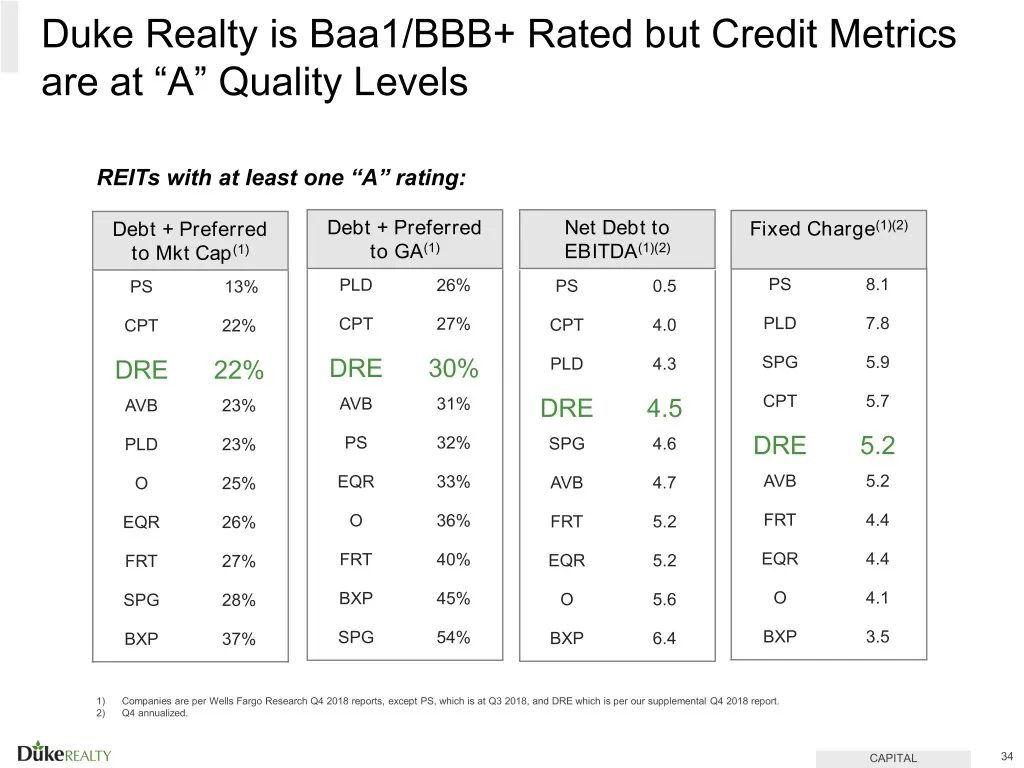
Duke Realty is Baa1/BBB+ Rated but Credit Metrics are at “A” Quality Levels REITs with at least one “A” rating: Debt + Preferred Debt + Preferred Net Debt to Fixed Charge(2) to Mkt Cap”) to GA") EBITDA“) PS 13% PLD 26% PS 05 PS 8.4 cPT 22% CPT 27% CPT 4.0 PLD 78 DRE 22% DRE 30% PLD 43 — Be AVB 23% A
Slide 35: Solid AFFO Growth throughout Major Repositioning
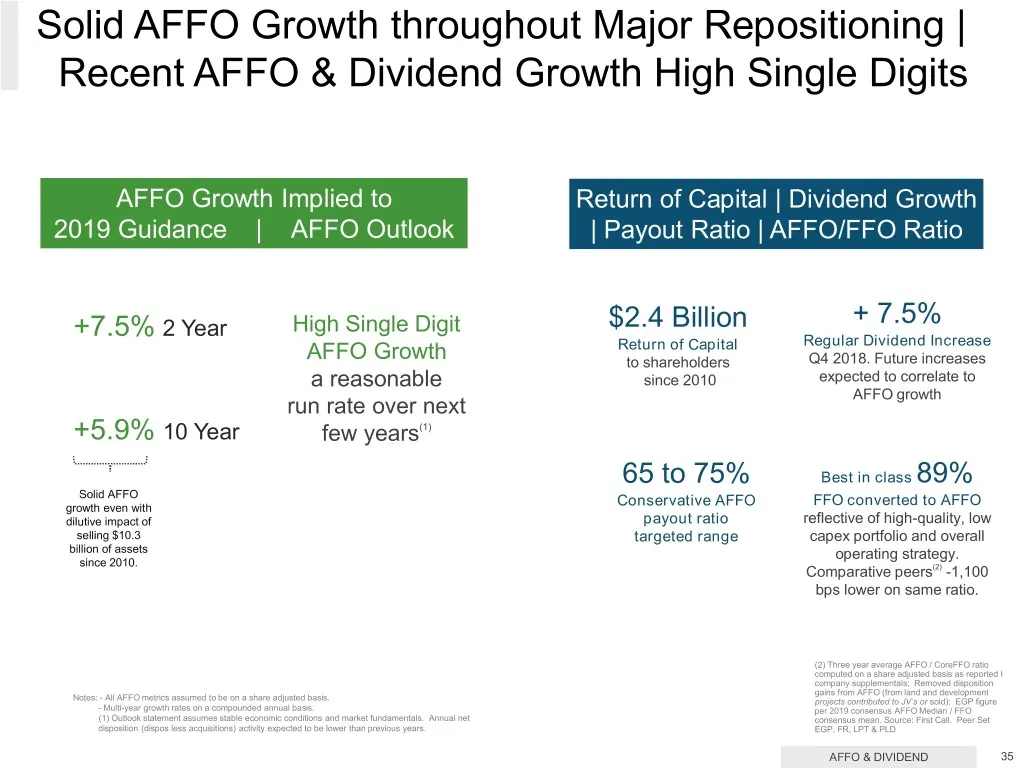
Solid AFFO Growth throughout Major Repositioning | Recent AFFO & Dividend Growth High Single Digits AFFO Growth Implied to 2019 Guidance | AFFO Outlook +7.5% 2 Year High Single Digit AFFO Growth a reasonable run rate over next +5.9% 10 Year few years” Solid AFFO ‘growth even with dllutive impact of
Slide 36: Corporate Responsibility
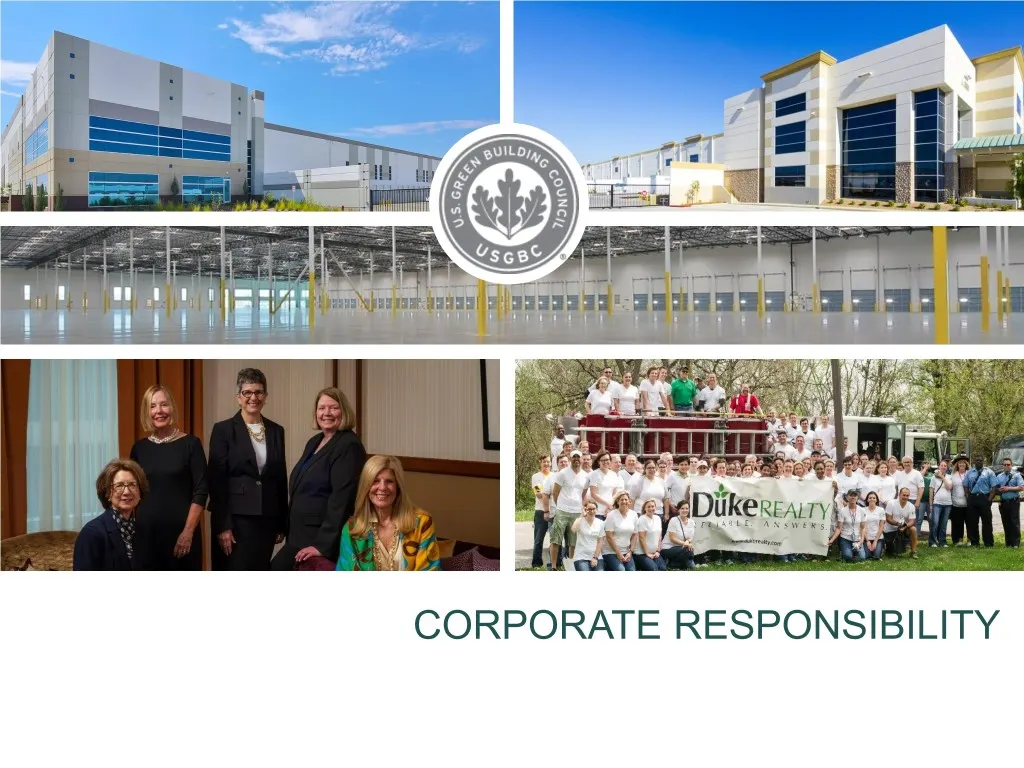
CORPORATE RESPONSIBILITY
Slide 37: Deep Rooted Approach to Corporate Responsibility
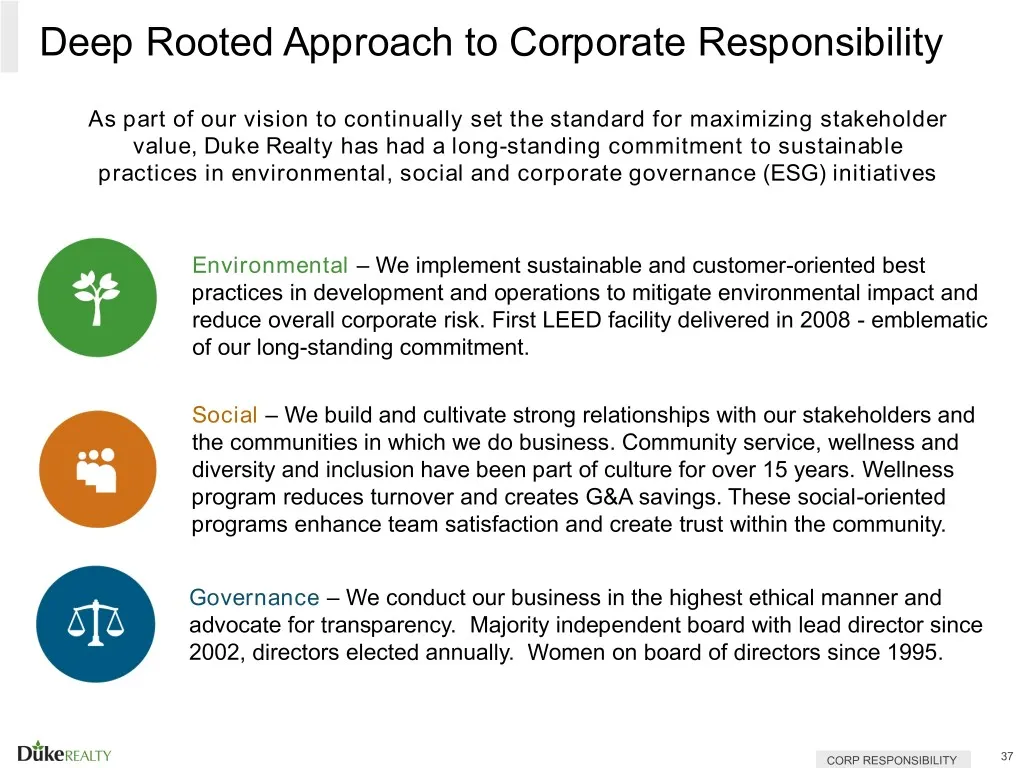
Deep Rooted Approach to Corporate Responsibility As part of our vision to continually set the standard for maximizing stakeholder value, Duke Realty has had a long-standing commitment to sustainable practices in environmental, social and corporate governance (ESG) initiatives Environmental — We impl
Slide 38: Safeguarding the Environment
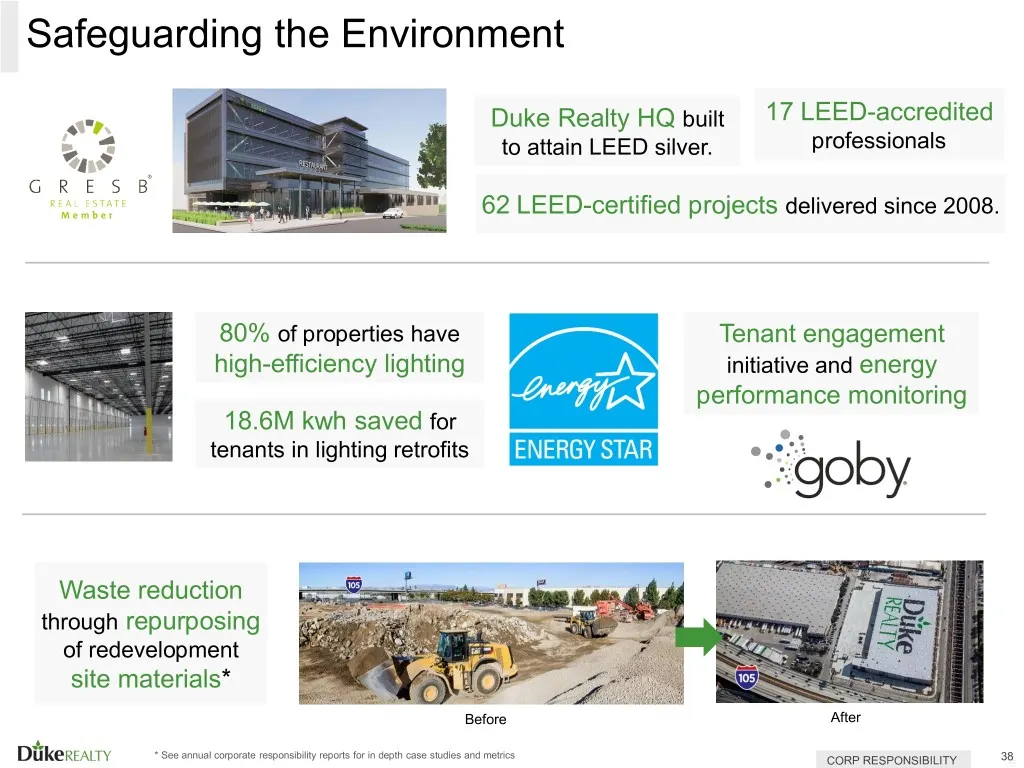
Safeguarding the Environment Duke Realty HQ built 17 LEED-accredited | to attain LEED silver. professionals 62 LEED-certified projects delivered since 2008. 80% of properties have va Tenant engagement high-efficiency lighting initiative and energy (anengeer performance monitoring 18.6M kwh saved for
Slide 39: Socially Responsible
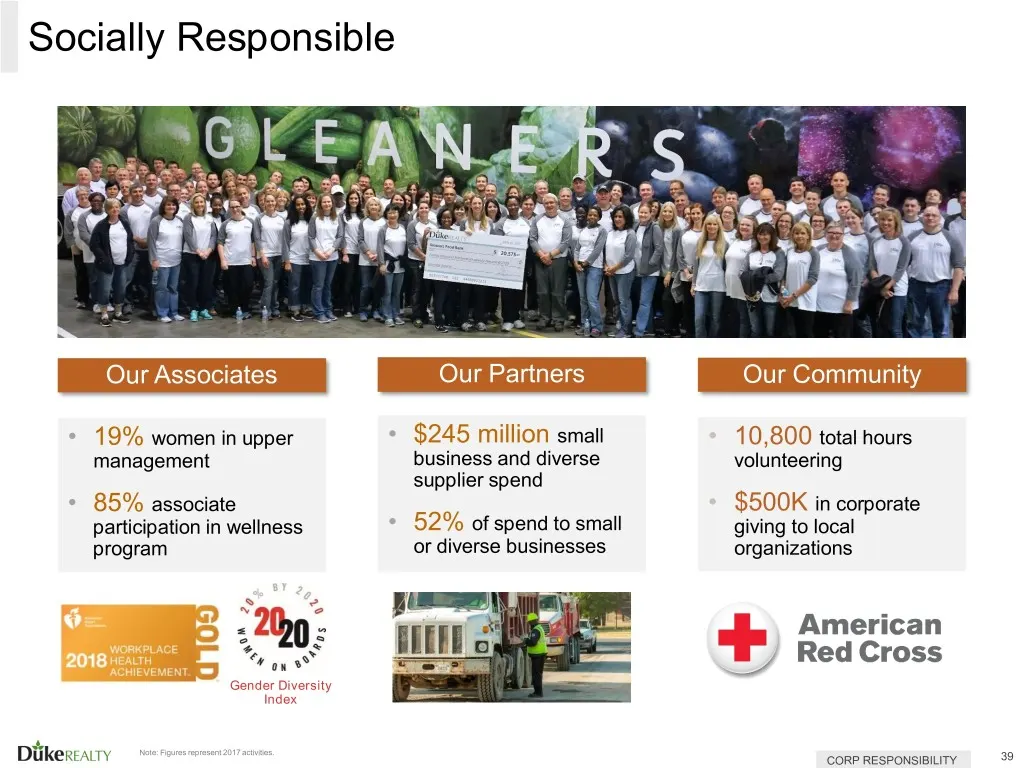
Socially Responsible » women in upper $245 million small 0,800 total hours management business and diverse volunteering supplier spend 5% associate 4 in corporate participation in wellness 92’ of spend to small givi 1g to local program or diverse businesses organizations American J, Red Cross i " Di
Slide 40: Committed to Governance
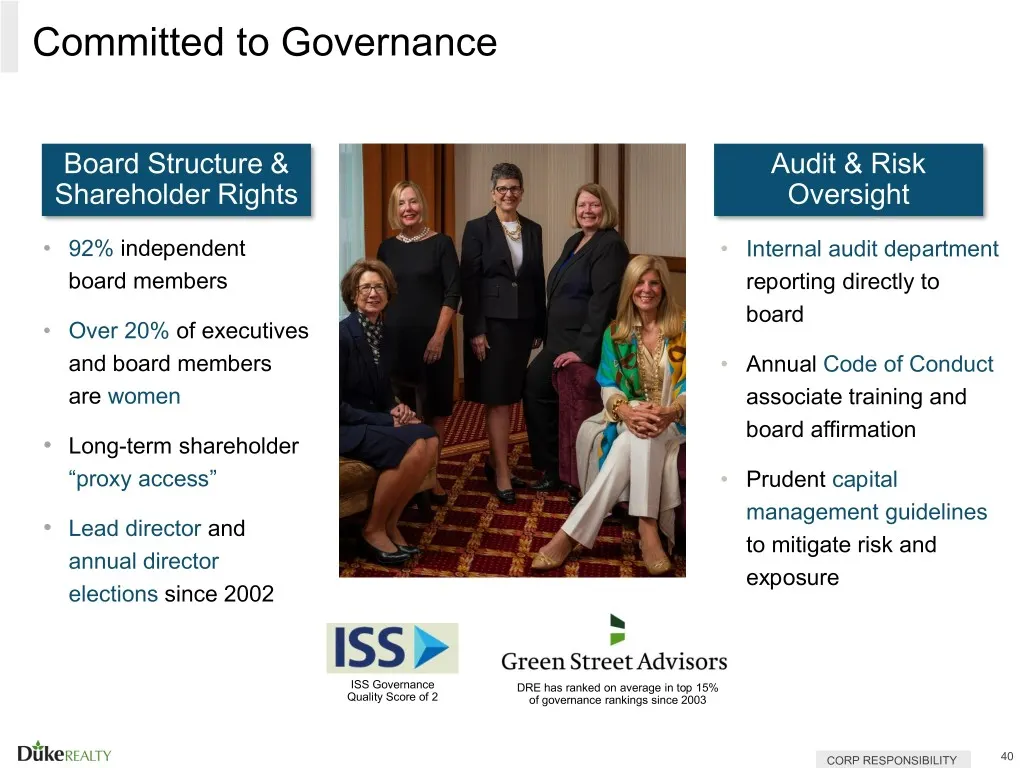
Committed to Governance Board Structure & Shareholder Rights 92% independent board members Internal audit department reporting directly to board Over 20% of executives and board members are women Annual Code of Conduct associate training and board affirmation Long-term shareholder “proxy access” Pru
Slide 41: Why Duke Realty?
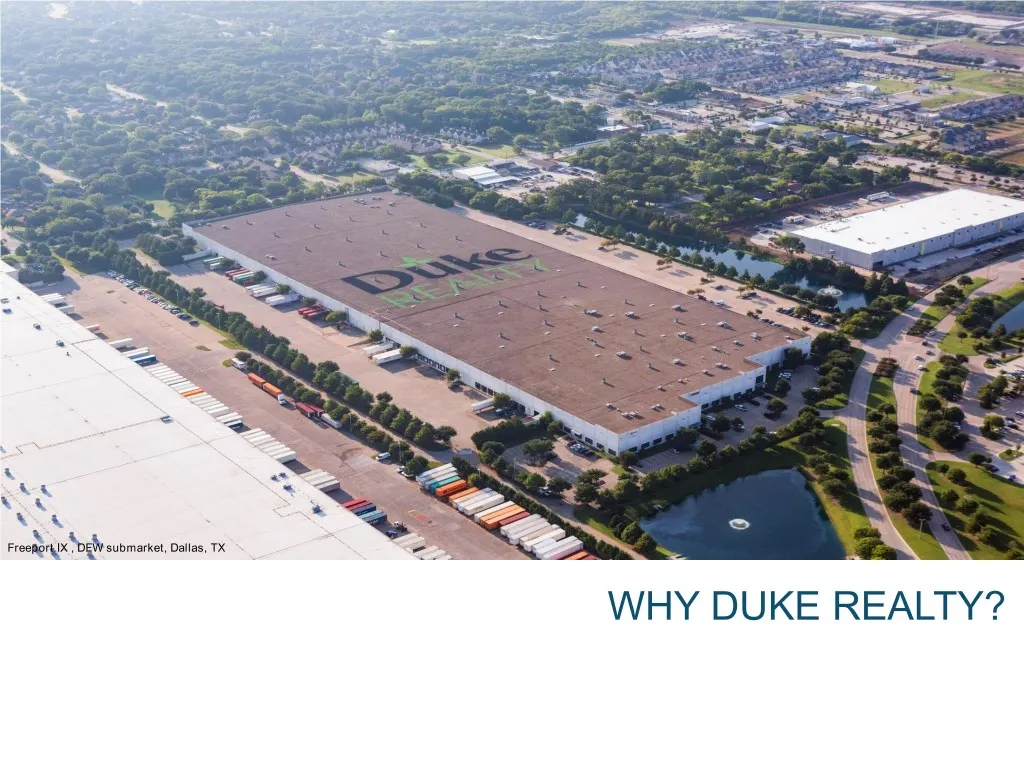
Be Gee ee WHY DUKE REALTY?
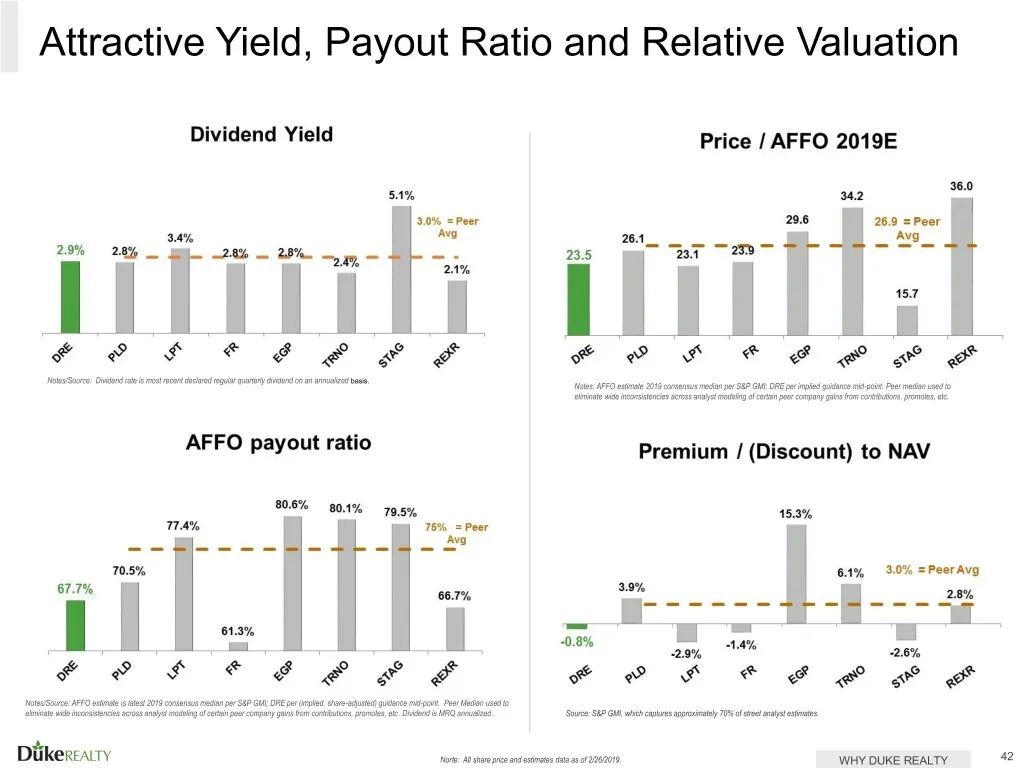
Slide 42: Attractive Yield, Payout Ratio and Relative Valuation
Attractive Yield, Payout Ratio and Relative Valuation Dividend Yield 20% ay 70.5% Diikegeacty Price / AFFO 2019E 36.0 29.8 26.9 =Peer 264 Avg —- 7 -m- EP ogo s 15.7 | eo F FF oO gf CF Premium / (Discount) to NAV 15.3% 6.1% 3.0% =PeerAvg 23 ities abel Je aa & & & WHY DUKE REALTY 42
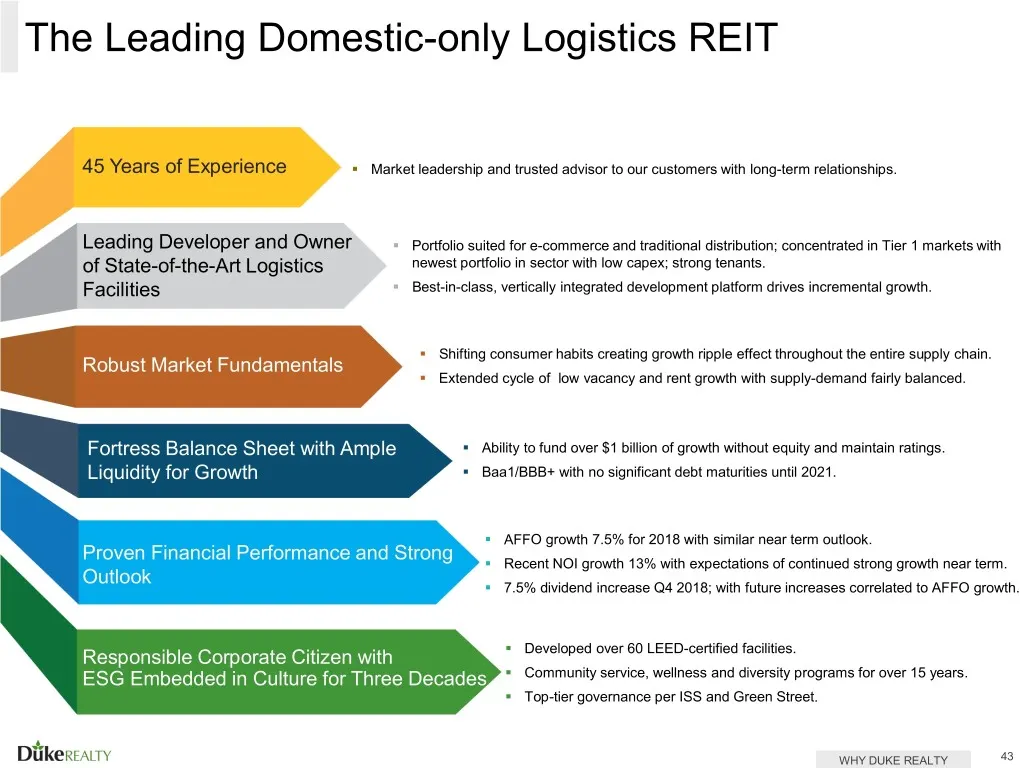
Slide 43: The Leading Domestic-only Logistics REIT
The Leading Domestic-only Logistics REIT » Market leadership and trusted advisor to our customers with long-term relationships. Leading Developer and Owner * Portfolio suited for e-commerce and traditional distribution; concentrated in Tier 1 markets with of State-of-the-Art Logistics newest portfol
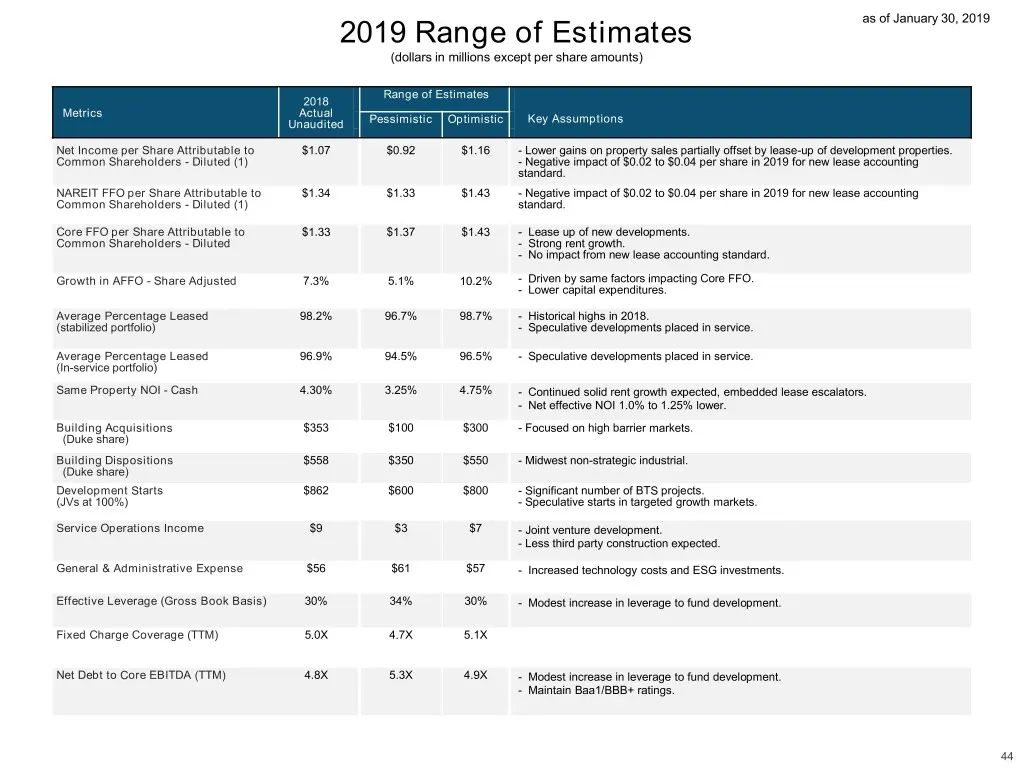
Slide 44: 2019 Range of Estimates
2019 Range of Estimates — (dollars in millions except per share amounts) Range of Estimates Not Income per Share Attributable to $1.07 $0.92 $1.18; Lower gains on property sles partial offset by lease-up of development properties ‘Common Shareholders - Diluted (1) = Negative impact of $0.02 to $0.04
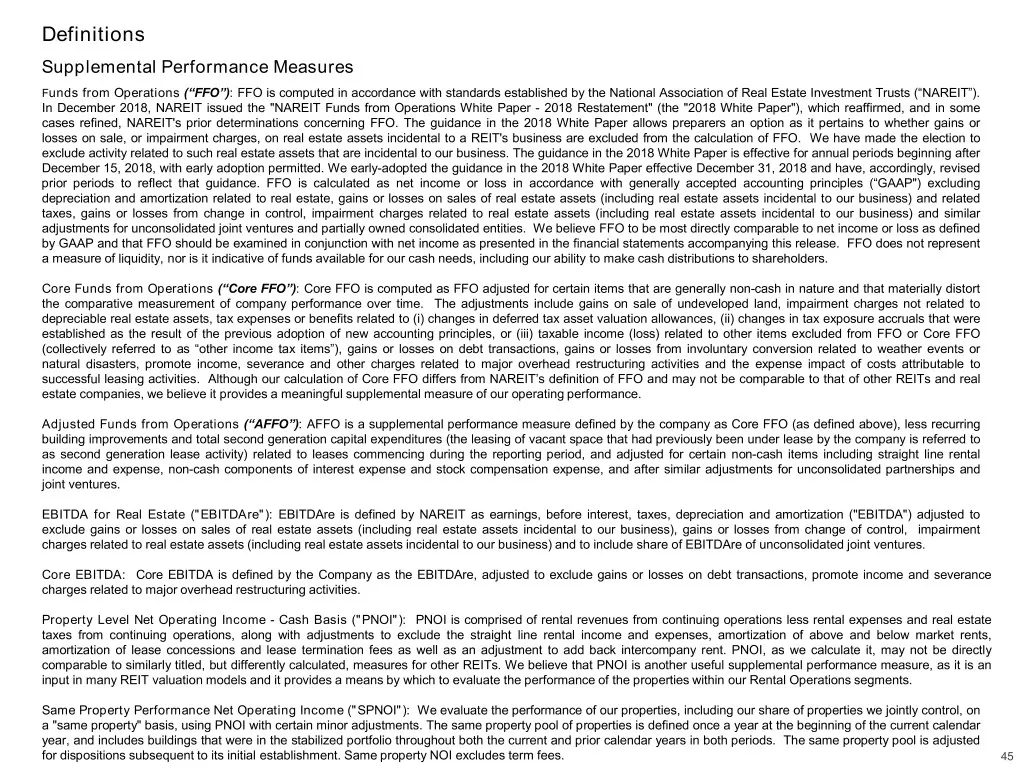
Slide 45: Definitions
Definitions Supplemental Performance Measures Funds from Operations (“FFO”): FFO is computed in accordance with standards established by the National Association of Real Estate Investment Trusts (‘NAREIT’). In December 2018, NAREIT issued the "NAREIT Funds from Operations White Paper - 2018 Restatem
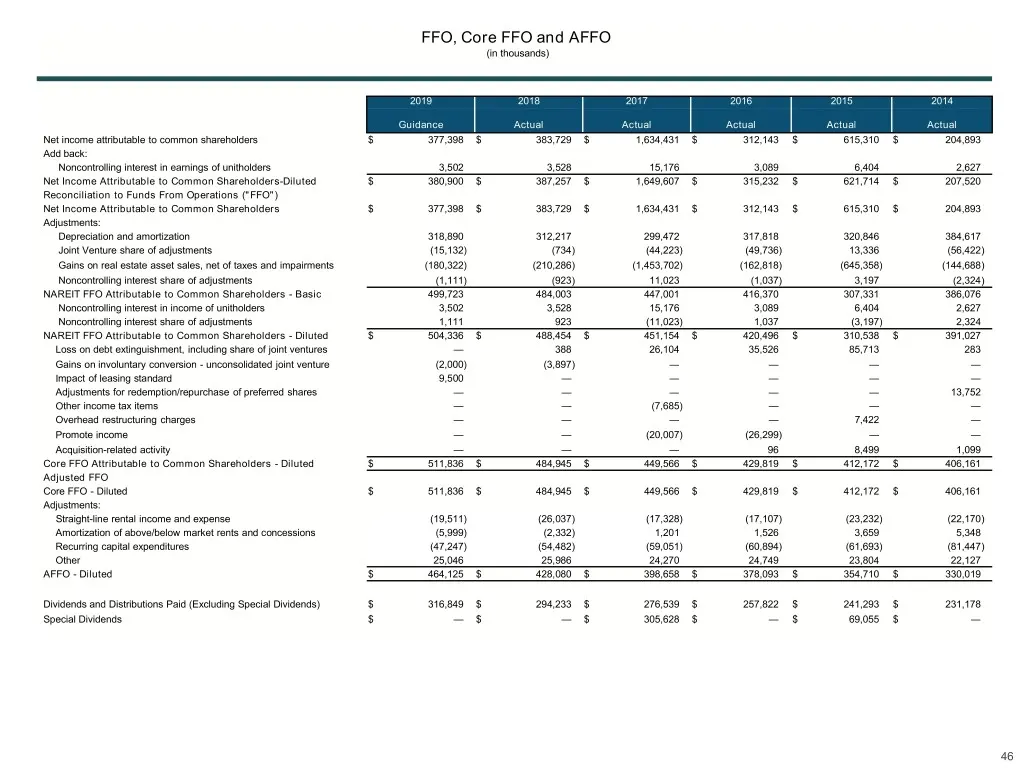
Slide 46: Reconciliation to Funds From Operations
Net income attrbutable to common sharsholders ‘Ads back: Noncontoting inert in eamings of unitholders Not Income Attributabie to Common Shareholders-Diluted Reconciliation to Funds From Operations ("FO") Net Income Attributable to Common Sharsholders ‘Adjustments: Depreciation and amortization Joint
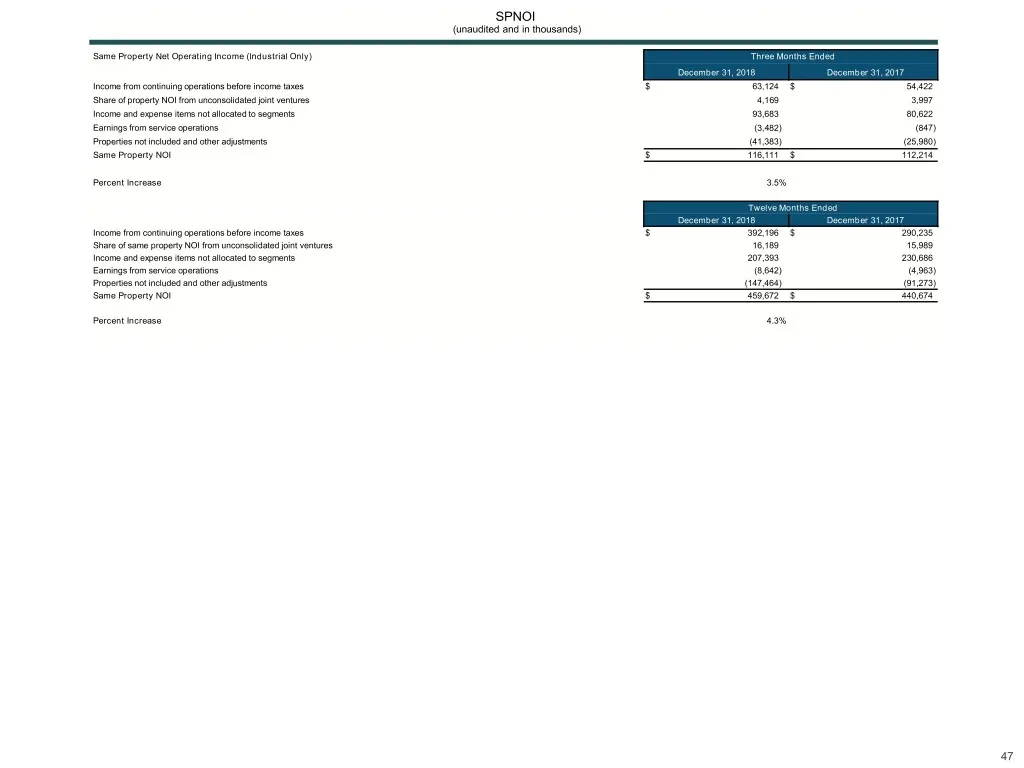
Slide 47: Same Property Net Operating Income (Industrial Only)
‘Same Property Net Operating neome (Indus Only) Income rm contaung sprains bear income te ‘Share of property NOI tom uncandadstea it vets Income and expense es nt allocated to segments Eamings tom sare paratons Propries nt includes and ore asuseents Same Property NO! Percent increase Income rom cont
Source: SEC EDGAR · 8-K filed Mar 4, 2019
More decks from Duke Realty Corporation
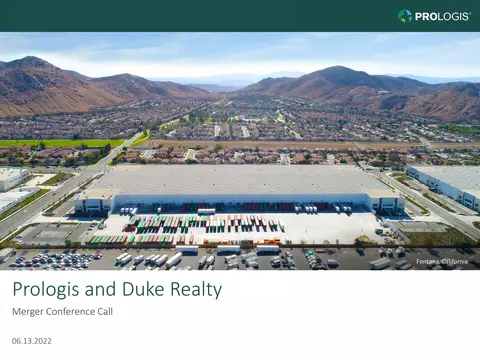 Merger or Acquisition (June 2022)14 slides · Jun 13, 2022
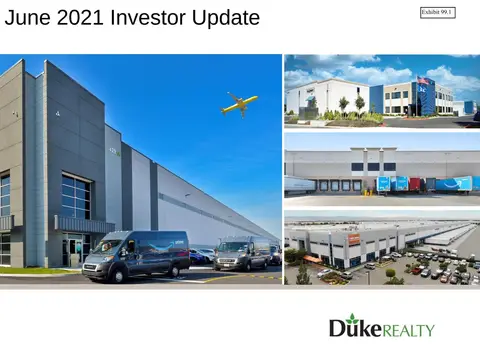 Investor Presentation (June 2021)58 slides · Jun 7, 2021
 Investor Presentation (May 2021)44 slides · May 10, 2021
 Investor Presentation (February 2021)58 slides · Feb 22, 2021
 NAREIT REITworld Virtual Investor Conference 202056 slides · Nov 16, 2020
 B of A Securities 2020 Global Real Estate Conference56 slides · Sep 15, 2020