Duke Realty — NAREIT REITworld Virtual Investor Conference 2020
56 slides from Duke Realty's conference presentation, Nov 16, 2020
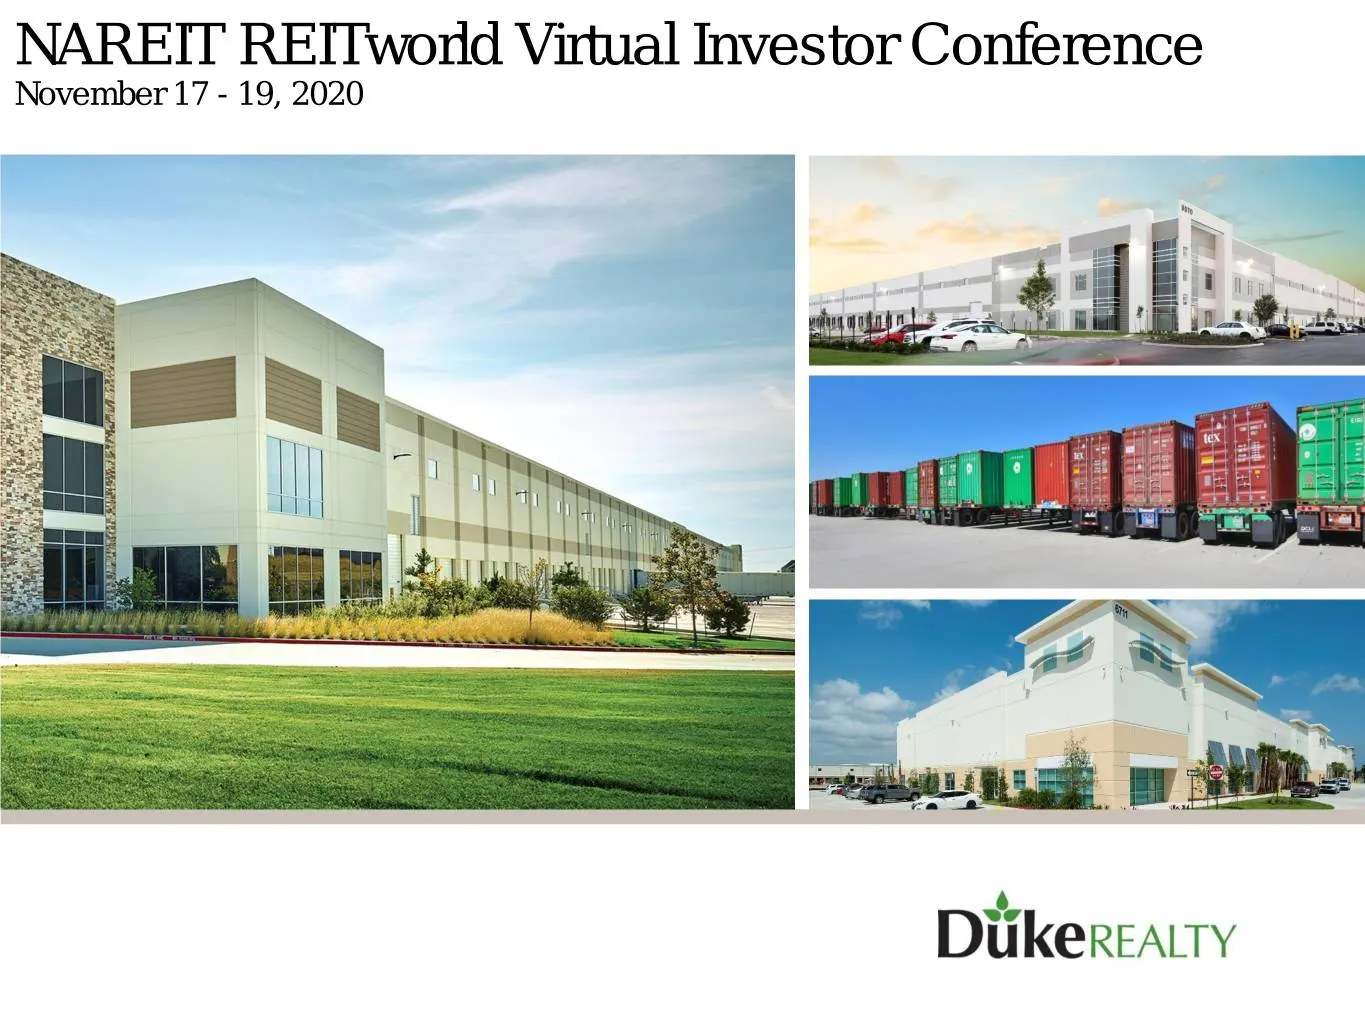
Slide 1: NAREIT REITworld Virtual Investor Conference November 17-19, 2020
NAREIT REITworld Virtual Investor Conference November 17 - 19, 2020
Slide 2: Forward-Looking Statement
Forward-Looking Statement This slide presentation contains statements that constitute “forward-looking statements” within the meaning of the Securities Act of 1933 and the Securities Exchange Act of 1934 as amended by the Private Securities Litigation Reform Act of 1995. These forward-looking statem
Slide 3: Contents
Contents Who We Are | U.S. Logistics Strategy 4 Recession Resilient Portfolio | Relative Value 6 Supply and Demand Fundamentals 12 Key Net Operating Income Drivers 17 Logistics Asset Strategy 20 Development Strategy 27 Liquidity and Capital Strategy 30 Corporate Responsibility 36 Why Duke Realty & G
Slide 4: The Leading Domestic-Only Logistics REIT
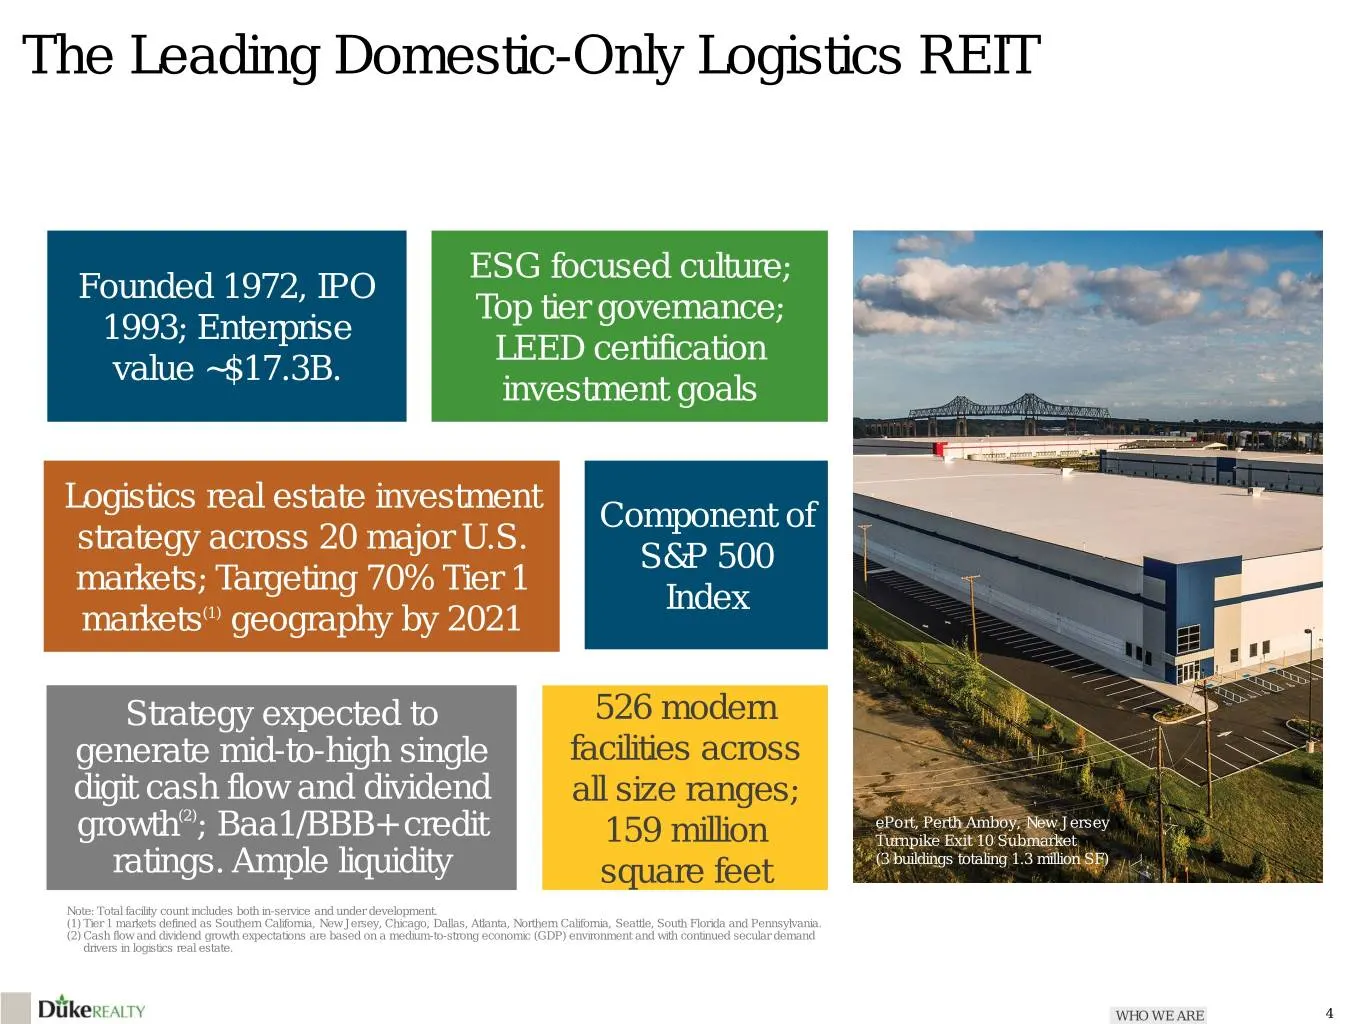
The Leading Domestic-Only Logistics REIT ESG focused culture; Founded 1972, IPO Top tier governance; 1993; Enterprise LEED certification value ~$17.3B. investment goals Logistics real estate investment Component of strategy across 20 major U.S. S&P 500 markets; Targeting 70% Tier 1 Index markets(1)
Slide 5: Only REIT that Checks All the Boxes
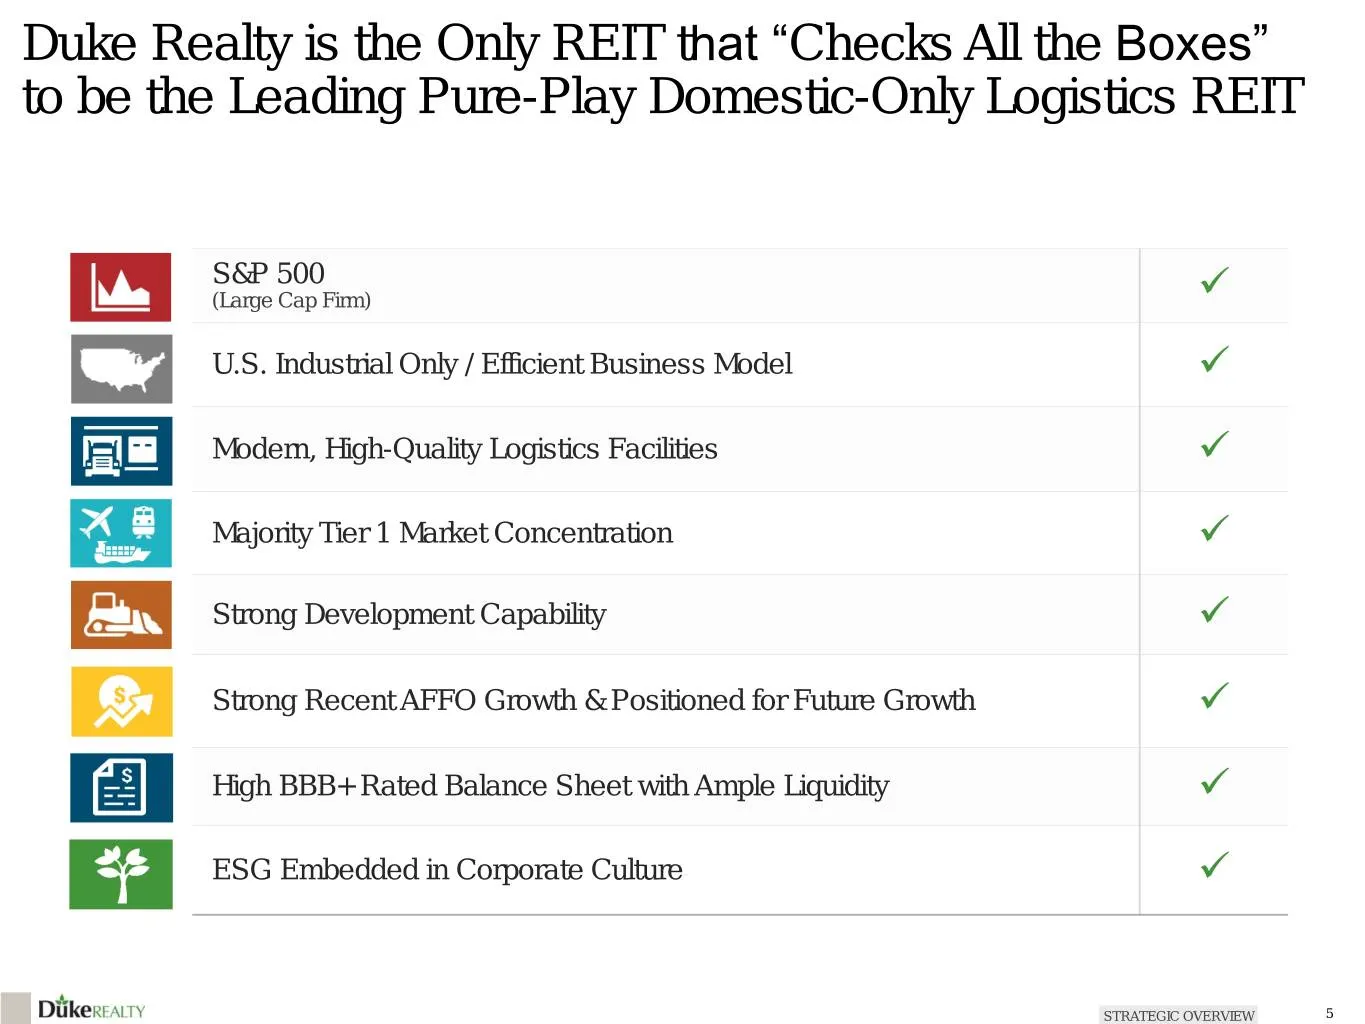
Duke Realty is the Only REIT that “Checks All the Boxes” to be the Leading Pure-Play Domestic-Only Logistics REIT S&P 500 (Large Cap Firm) U.S. Industrial Only / Efficient Business Model Modern, High-Quality Logistics Facilities Majority Tier 1 Market Concentration Strong Development Capabil
Slide 6: Recession Resiliency / Strong Relative Portfolio Performance
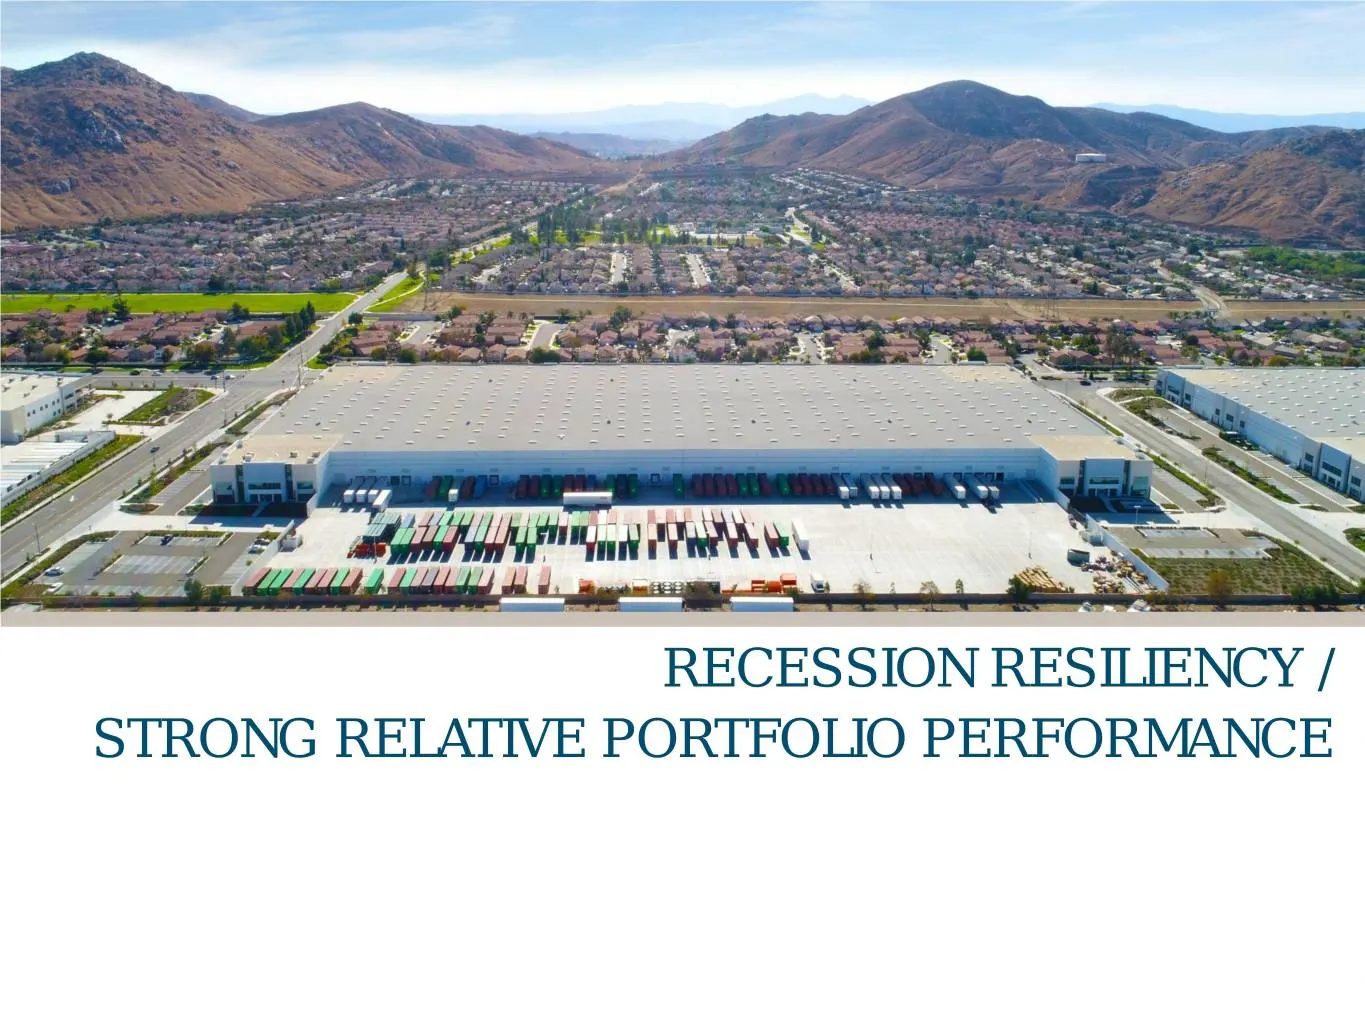
RECESSION RESILIENCY / STRONG RELATIVE PORTFOLIO PERFORMANCE Legacy Commerce Center (Brownfield development), Linden, NJ
Slide 7: Ample Liquidity to Fund Expected Commitments
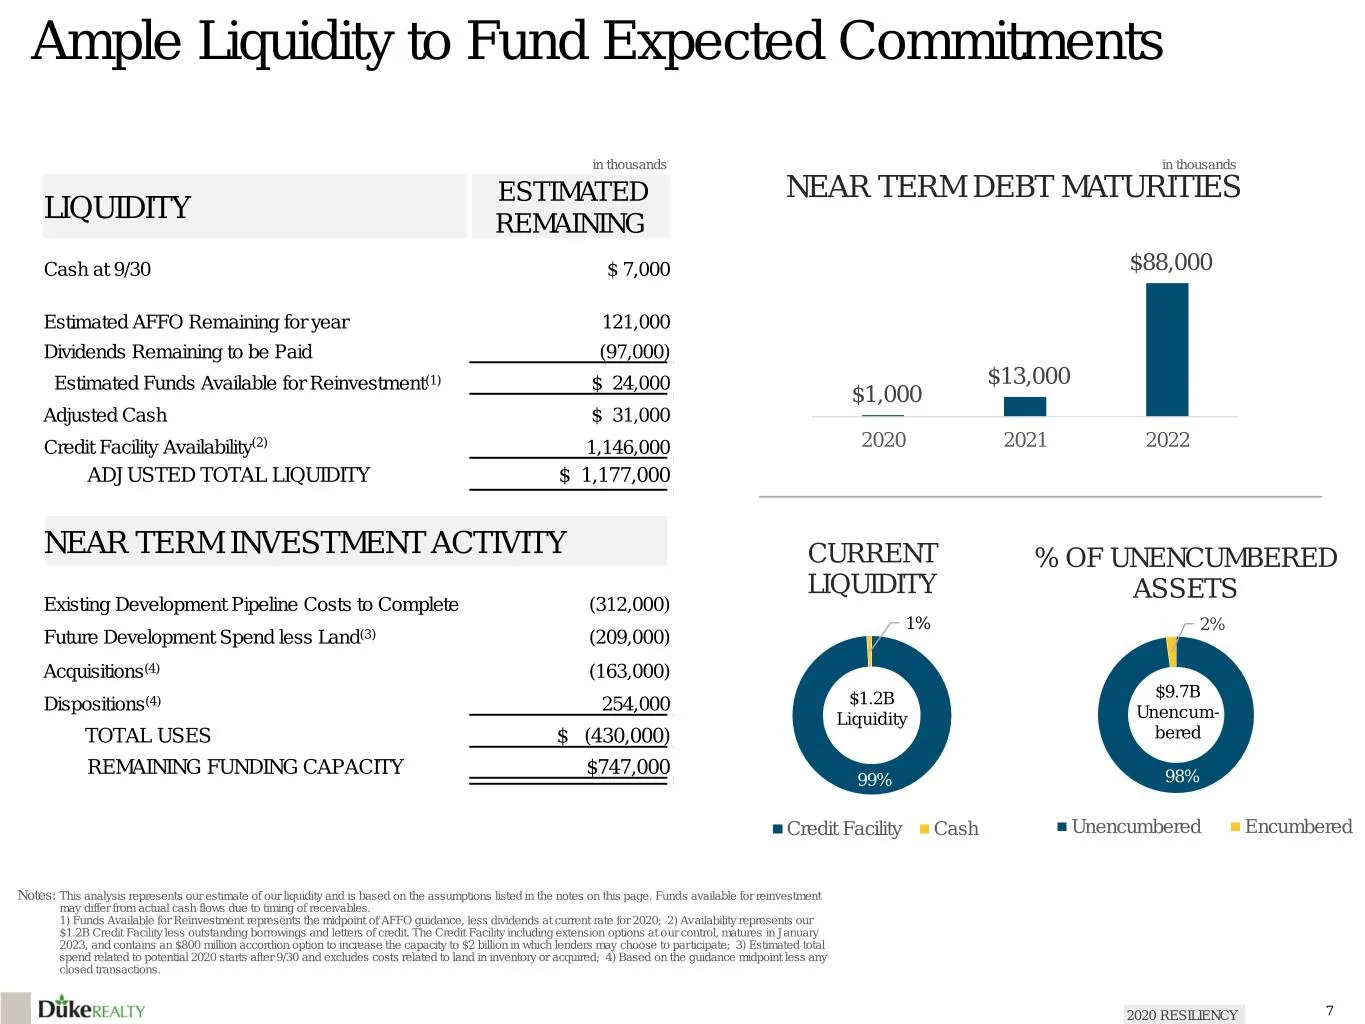
Ample Liquidity to Fund Expected Commitments in thousands in thousands ESTIMATED NEAR TERM DEBT MATURITIES LIQUIDITY REMAINING Cash at 9/30 $ 7,000 $88,000 Estimated AFFO Remaining for year 121,000 Dividends Remaining to be Paid (97,000) (1) $13,000 Estimated Funds Available for Reinvestment $ 24,00
Slide 8: Diversified Customer Relationships by Company & Industry
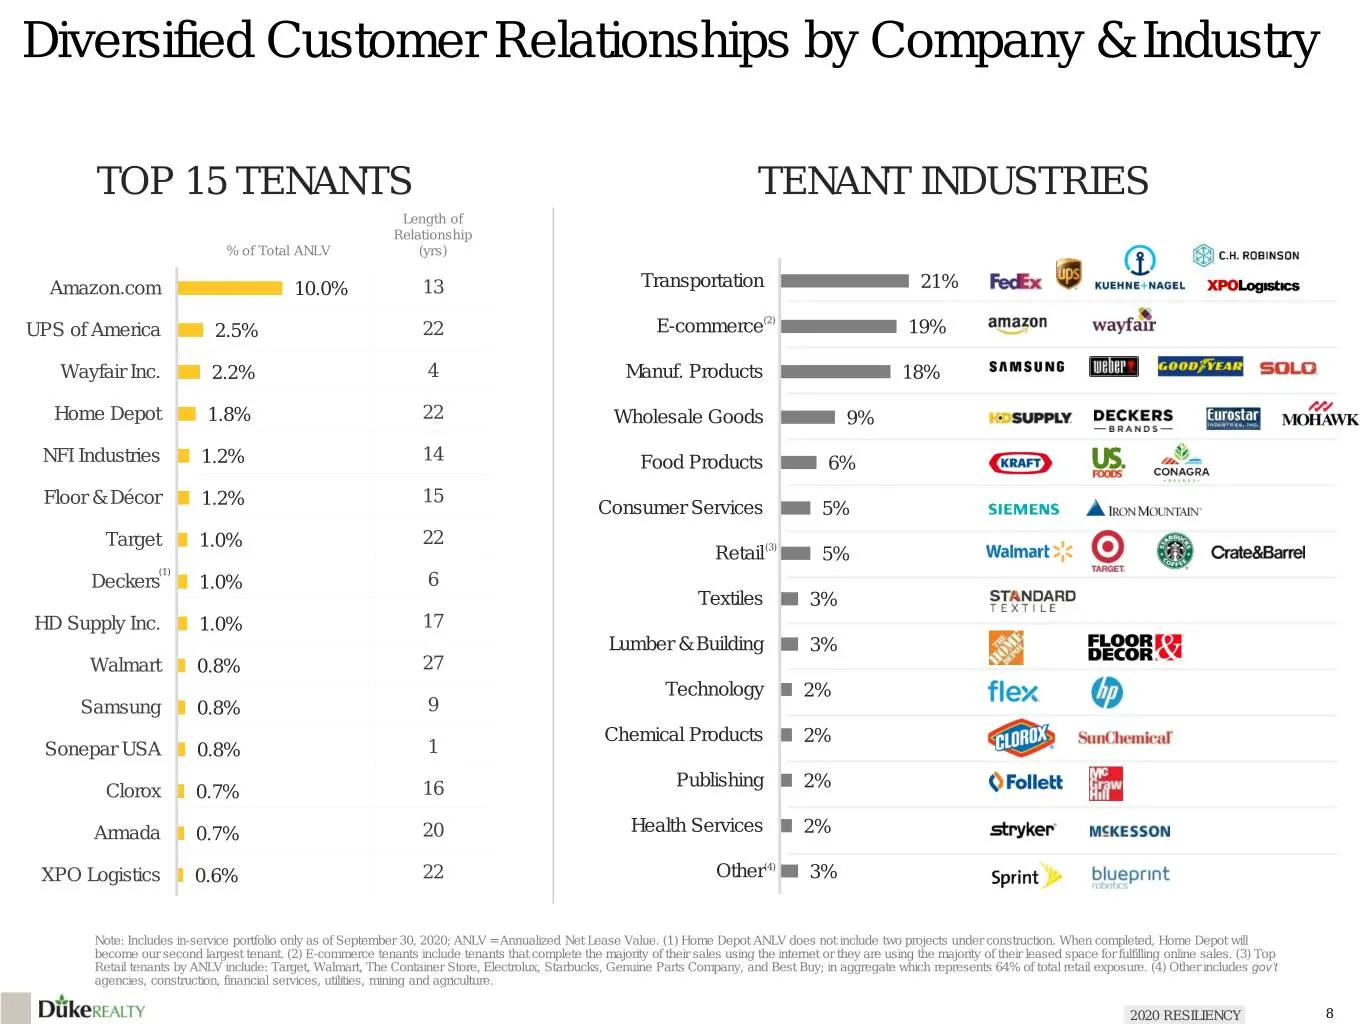
Diversified Customer Relationships by Company & Industry TOP 15 TENANTS TENANT INDUSTRIES Length of Relationship % of Total ANLV (yrs) Amazon.com 10.0% 13 Transportation 21% (2) UPS of America 2.5% 22 E-commerce 19% Wayfair Inc. 2.2% 4 Manuf. Products 18% Home Depot 1.8% 22 Wholesale Goods 9% NFI In
Slide 9: Rent Collections and Deferrals
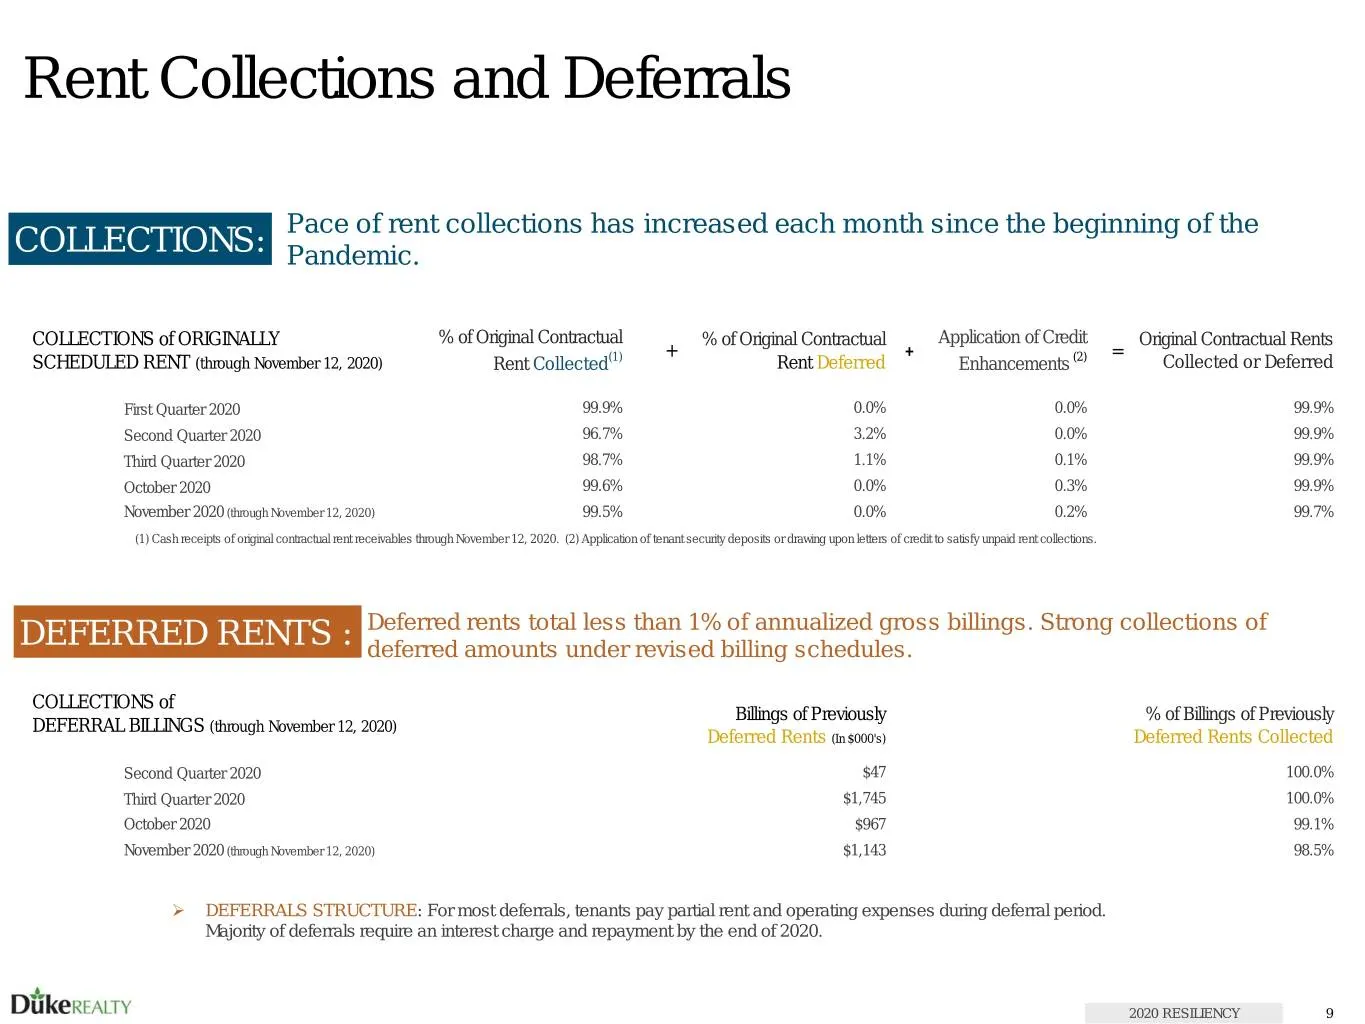
Rent Collections and Deferrals Pace of rent collections has increased each month since the beginning of the COLLECTIONS: Pandemic. COLLECTIONS of ORIGINALLY % of Original Contractual % of Original Contractual Application of Credit Original Contractual Rents + + = SCHEDULED RENT (through November 12,
Slide 10: 2020 YTD Metrics and Development Pre-leasing Support Outperformance
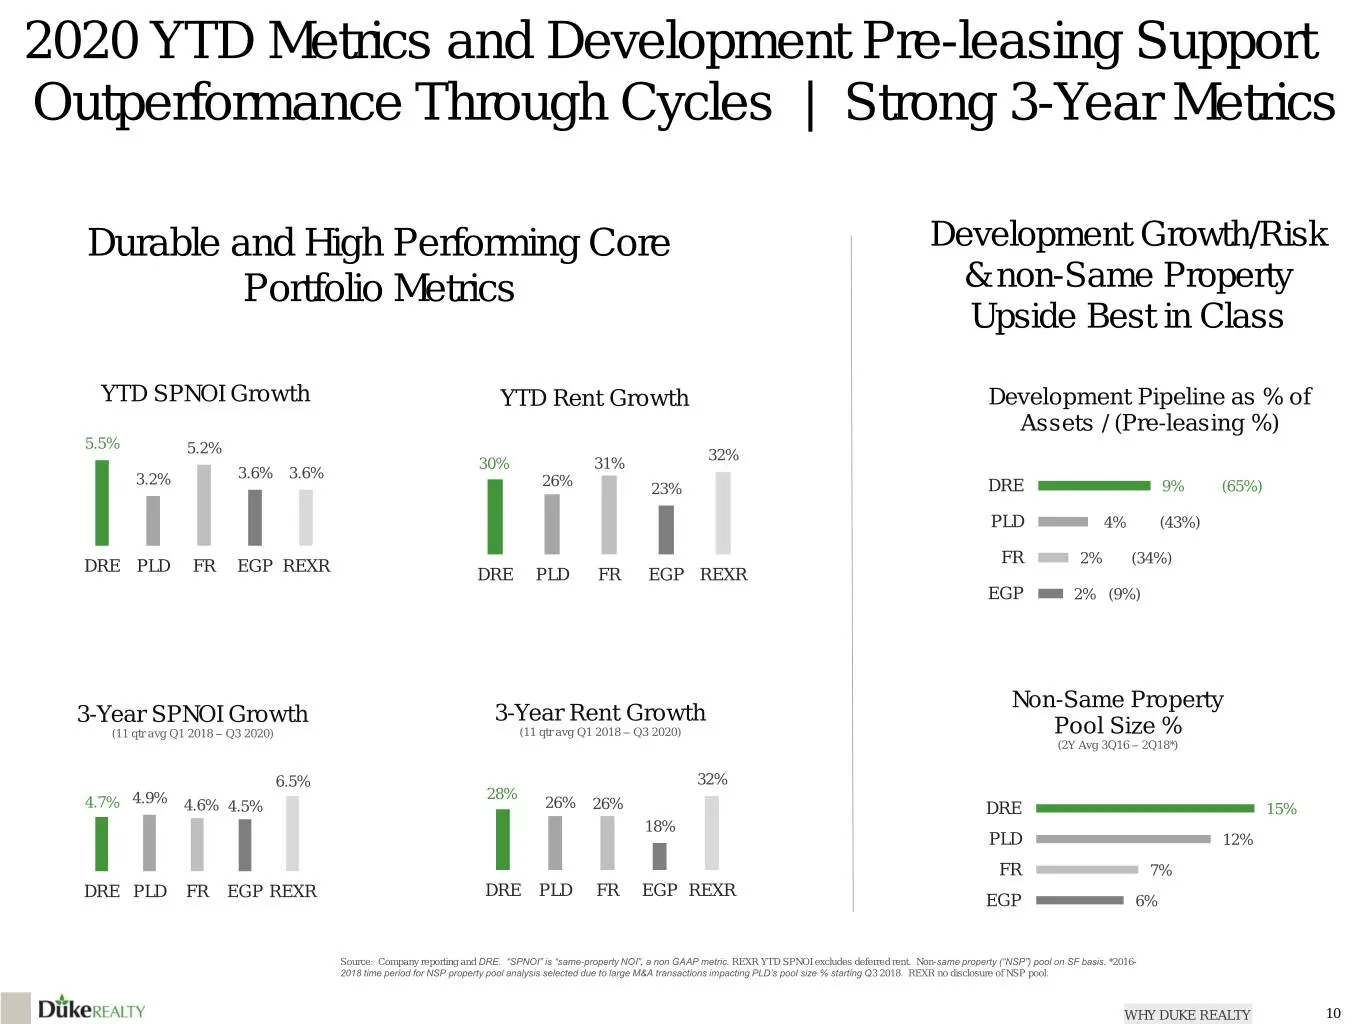
2020 YTD Metrics and Development Pre-leasing Support Outperformance Through Cycles | Strong 3-Year Metrics Durable and High Performing Core Development Growth/Risk Portfolio Metrics & non-Same Property Upside Best in Class YTD SPNOI Growth YTD Rent Growth Development Pipeline as % of Assets / (Pre-l
Slide 11: Portfolio Performance and Balance Sheet with Discounted Relative Value
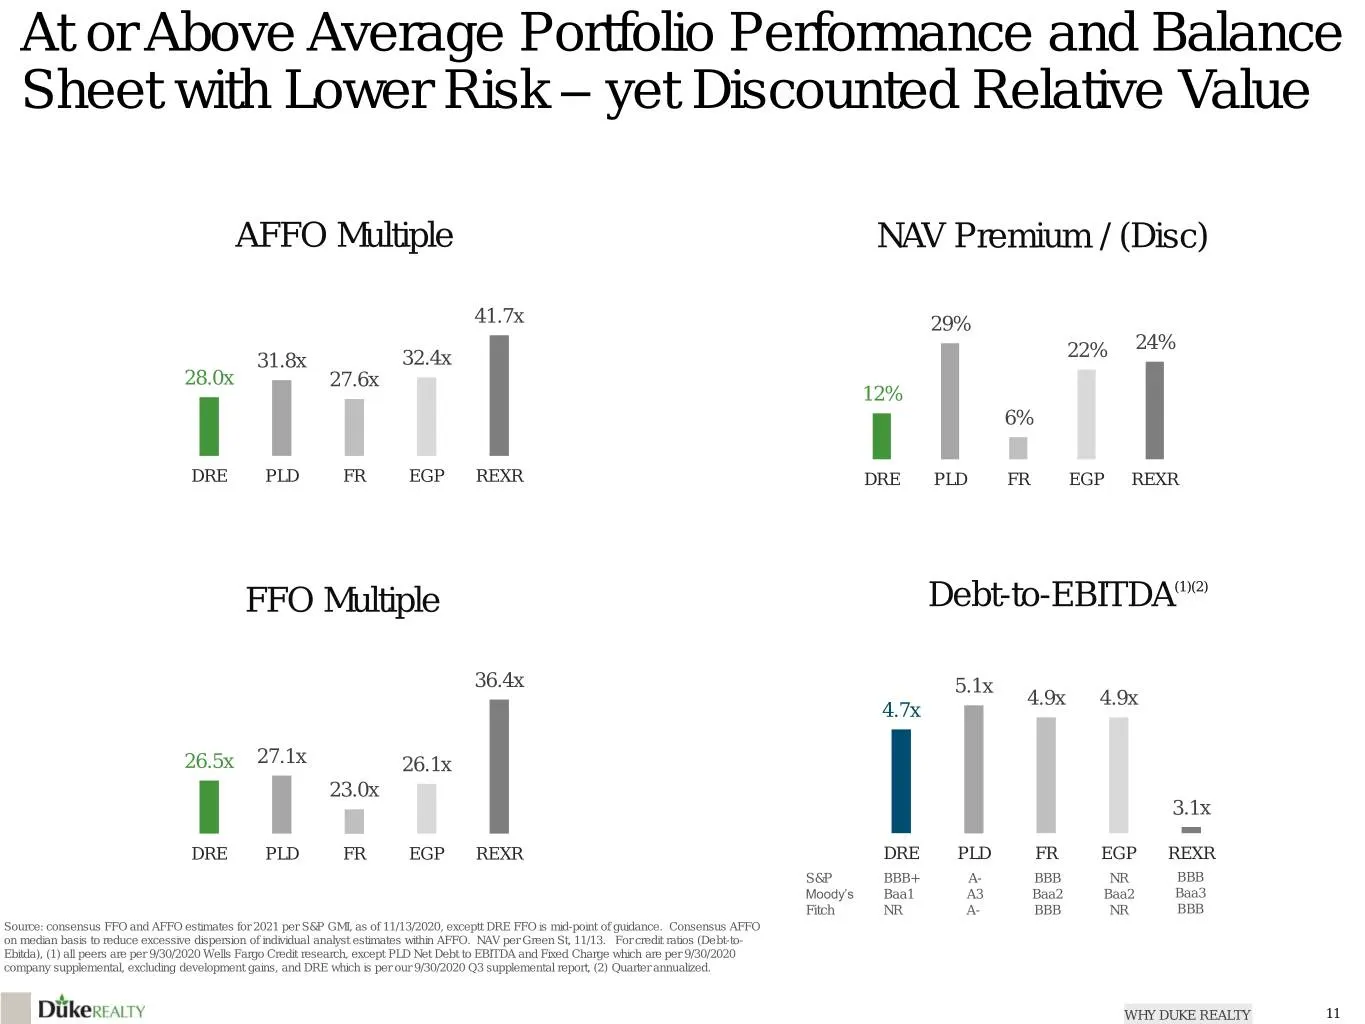
At or Above Average Portfolio Performance and Balance Sheet with Lower Risk – yet Discounted Relative Value AFFO Multiple NAV Premium / (Disc) 41.7x 29% 22% 24% 31.8x 32.4x 28.0x 27.6x 12% 6% DRE PLD FR EGP REXR DRE PLD FR EGP REXR FFO Multiple Debt-to-EBITDA(1)(2) 36.4x 5.1x 4.9x 4.9x 4.7x 26.5x 27

Slide 12: Macroeconomic & Secular Drivers: Industrial Supply-Demand Fundamentals
MACROECONOMIC & SECULAR DRIVERS INDUSTRIAL SUPPLY-DEMAND FUNDAMENTALS
Slide 13: Pandemic Further Accelerating E-Commerce and Supply Chain Resilience
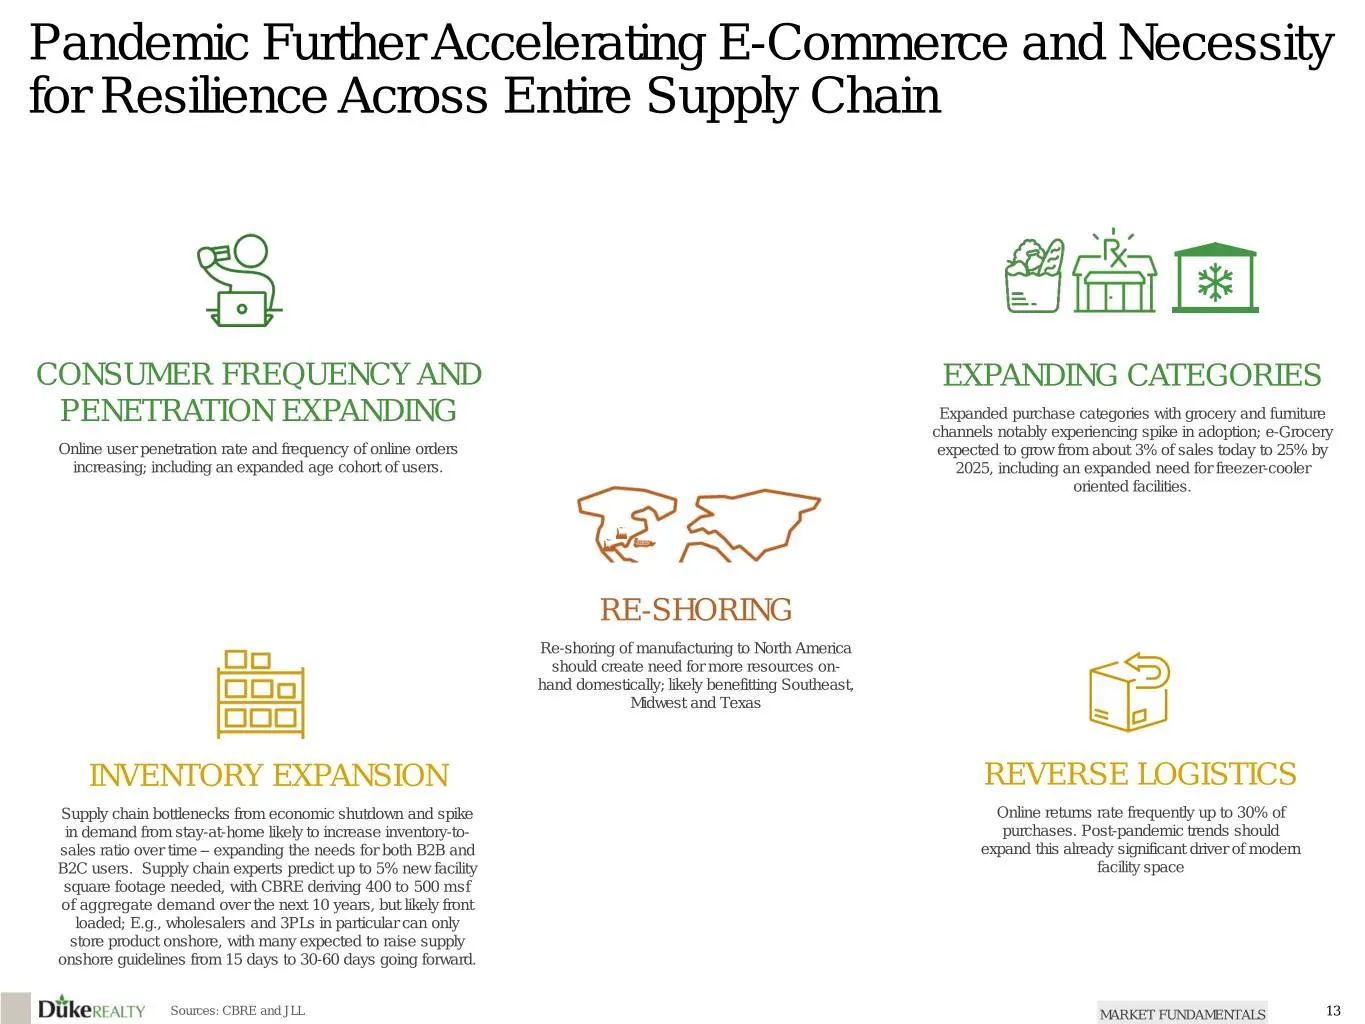
Pandemic Further Accelerating E-Commerce and Necessity for Resilience Across Entire Supply Chain CONSUMER FREQUENCY AND EXPANDING CATEGORIES PENETRATION EXPANDING Expanded purchase categories with grocery and furniture channels notably experiencing spike in adoption; e-Grocery Online user penetratio
Slide 14: E-Comm Sales Growth Booming, Space Requirements
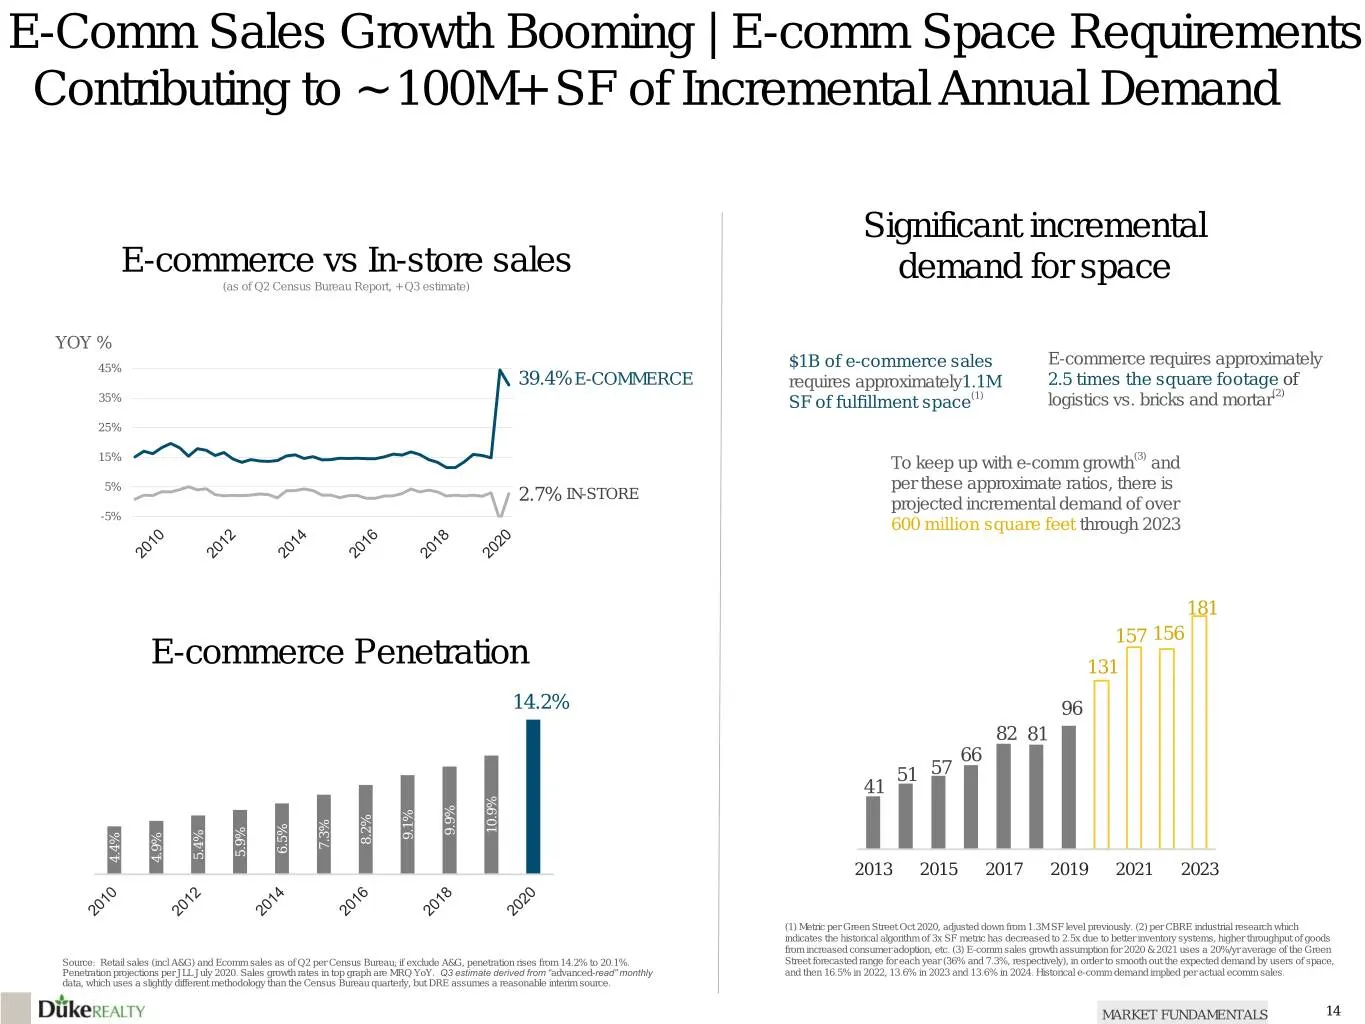
E-Comm Sales Growth Booming | E-comm Space Requirements Contributing to ~ 100M+ SF of Incremental Annual Demand Significant incremental E-commerce vs In-store sales demand for space (as of Q2 Census Bureau Report, + Q3 estimate) YOY % E-commerce requires approximately 45% $1B of e-commerce sales 39.
Slide 15: Supply-Demand-Vacancy Set Up Supportive of Rent Growth
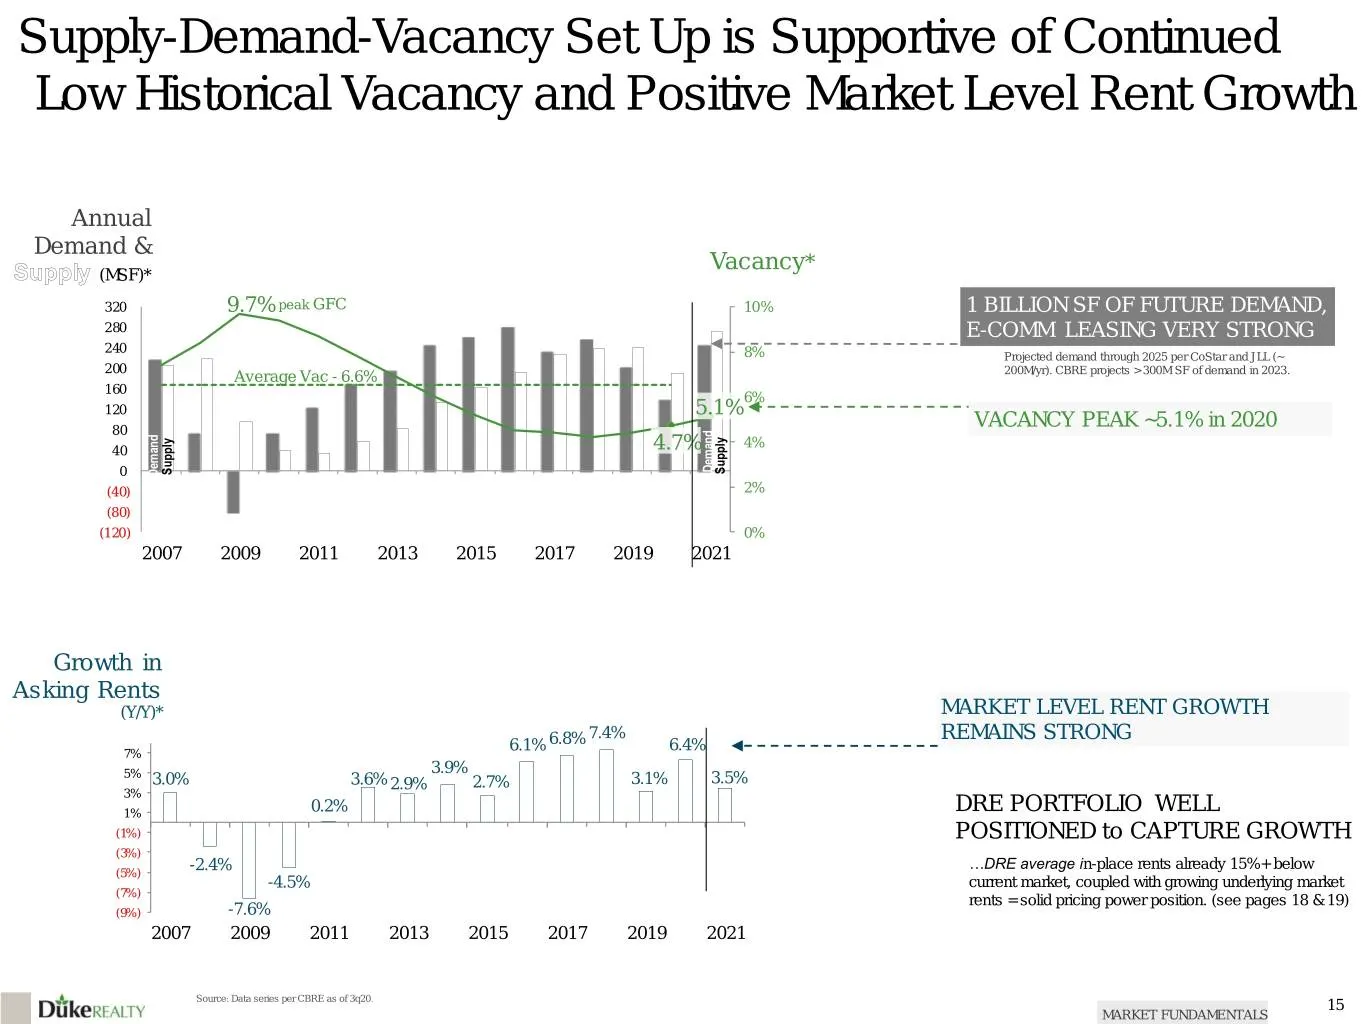
Supply-Demand-Vacancy Set Up is Supportive of Continued Low Historical Vacancy and Positive Market Level Rent Growth Annual Demand & Vacancy* (MSF)* 320 9.7% peak GFC 10% 1 BILLION SF OF FUTURE DEMAND, 280 E-COMM LEASING VERY STRONG 240 8% Projected demand through 2025 per CoStar and JLL (~ 200 Aver
Slide 16: Evolution of Amazon Distribution Network
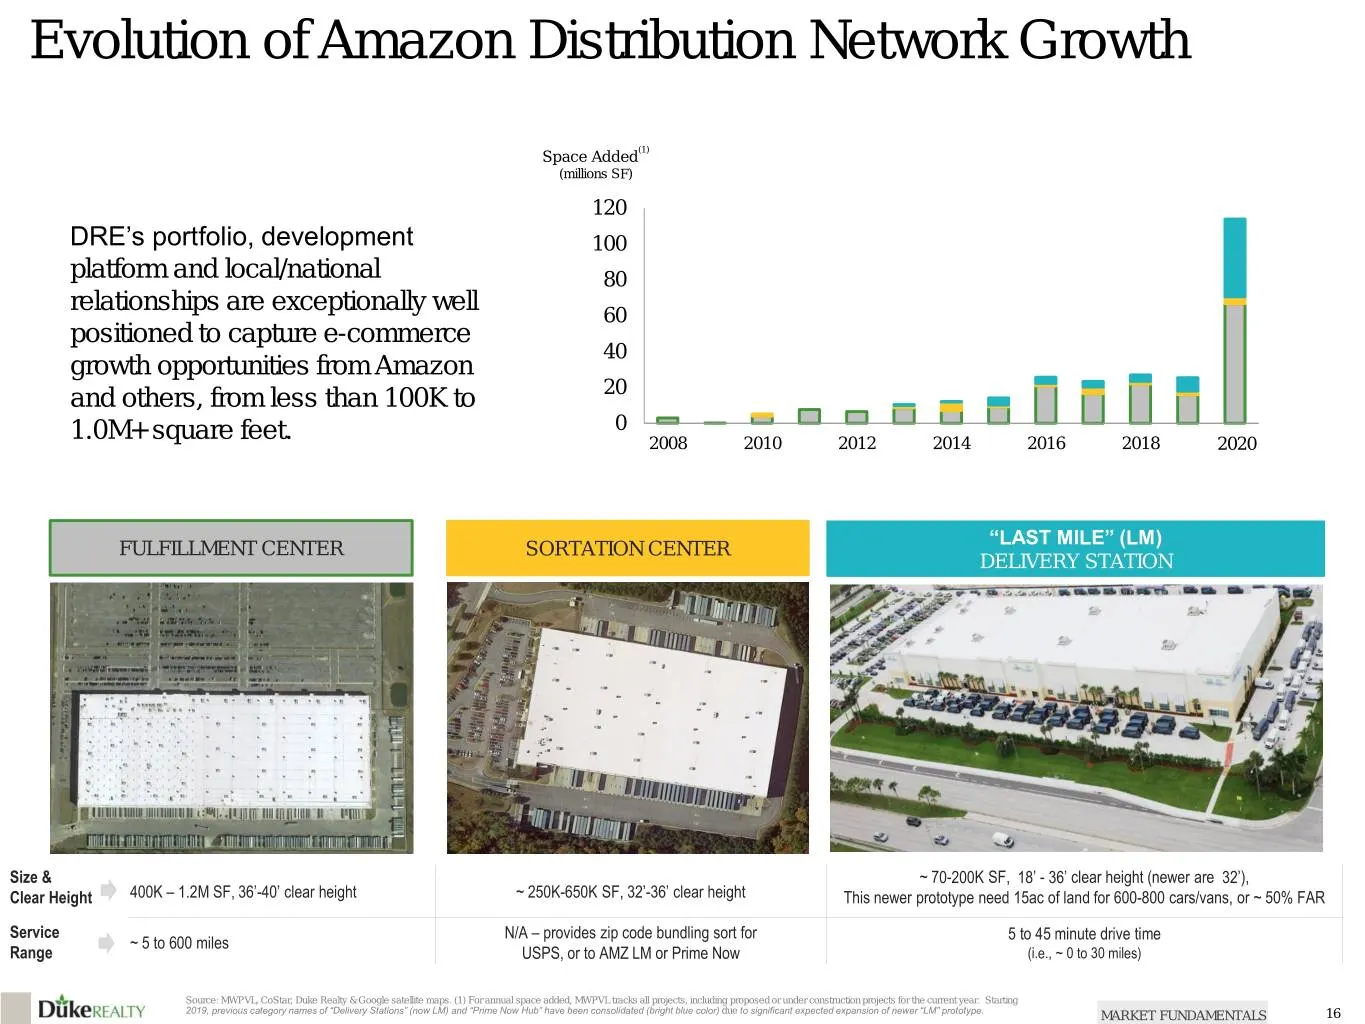
Evolution of Amazon Distribution Network Growth Space Added(1) (millions SF) 120 DRE’s portfolio, development 100 platform and local/national 80 relationships are exceptionally well 60 positioned to capture e-commerce 40 growth opportunities from Amazon and others, from less than 100K to 20 1.0M+ sq
Slide 17: Key Net Operating Income (NOI) Drivers
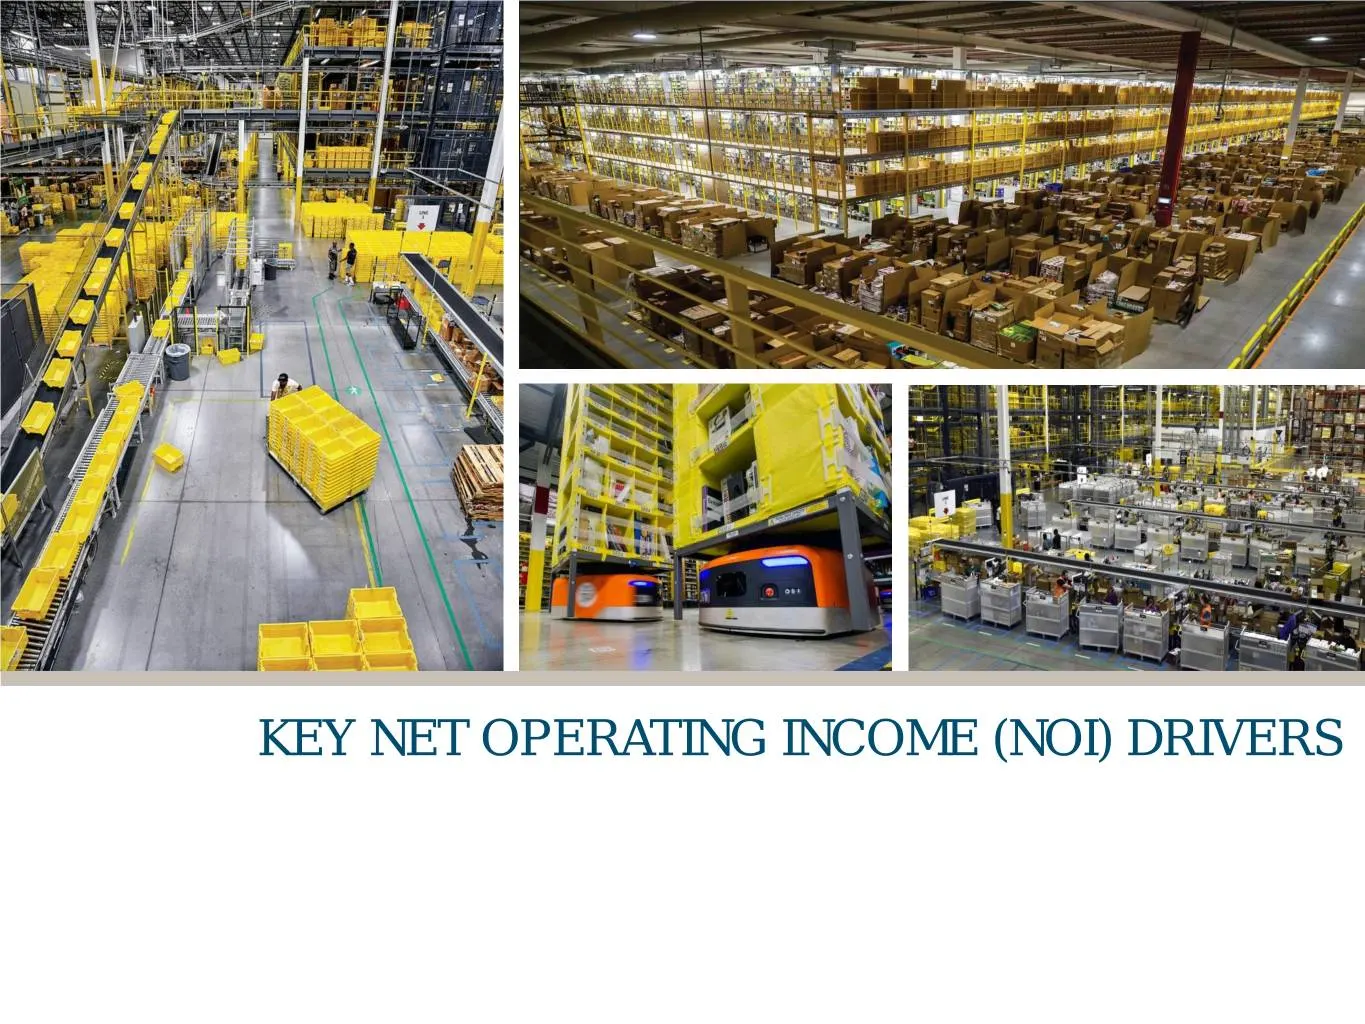
KEY NET OPERATING INCOME (NOI) DRIVERS Legacy Commerce Center (Brownfield development), Linden, NJ
Slide 18: Operating Metrics Supportive of Continued Growth
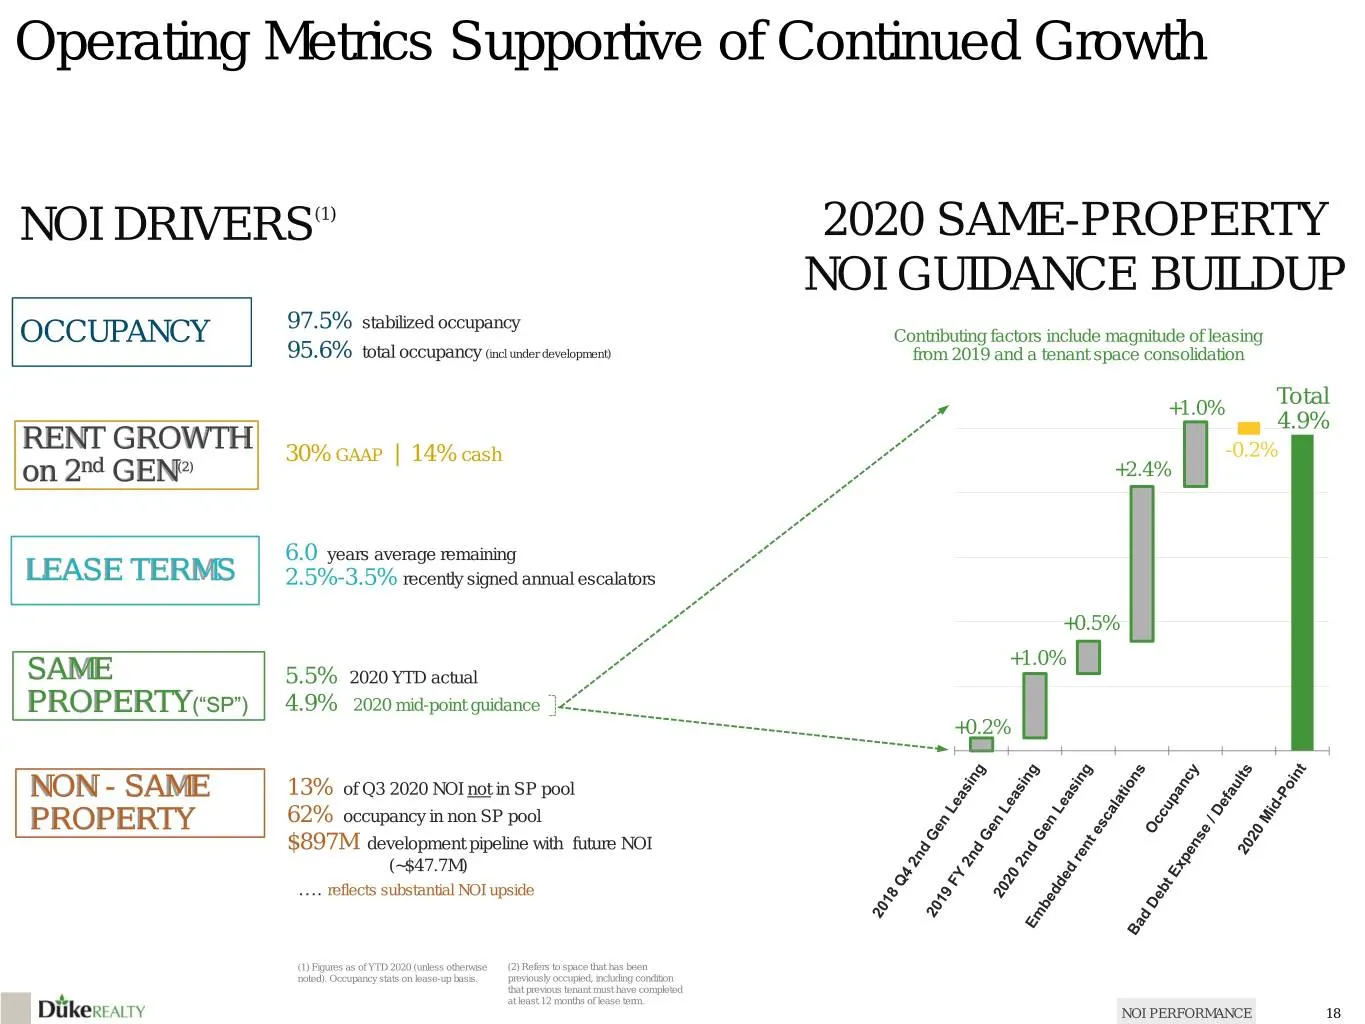
Operating Metrics Supportive of Continued Growth NOI DRIVERS(1) 2020 SAME-PROPERTY NOI GUIDANCE BUILDUP 97.5% stabilized occupancy OCCUPANCY Contributing factors include magnitude of leasing 95.6% total occupancy (incl under development) from 2019 and a tenant space consolidation Total +1.0% 4.9% RE
Slide 19: Proven Net Operating Income Growth
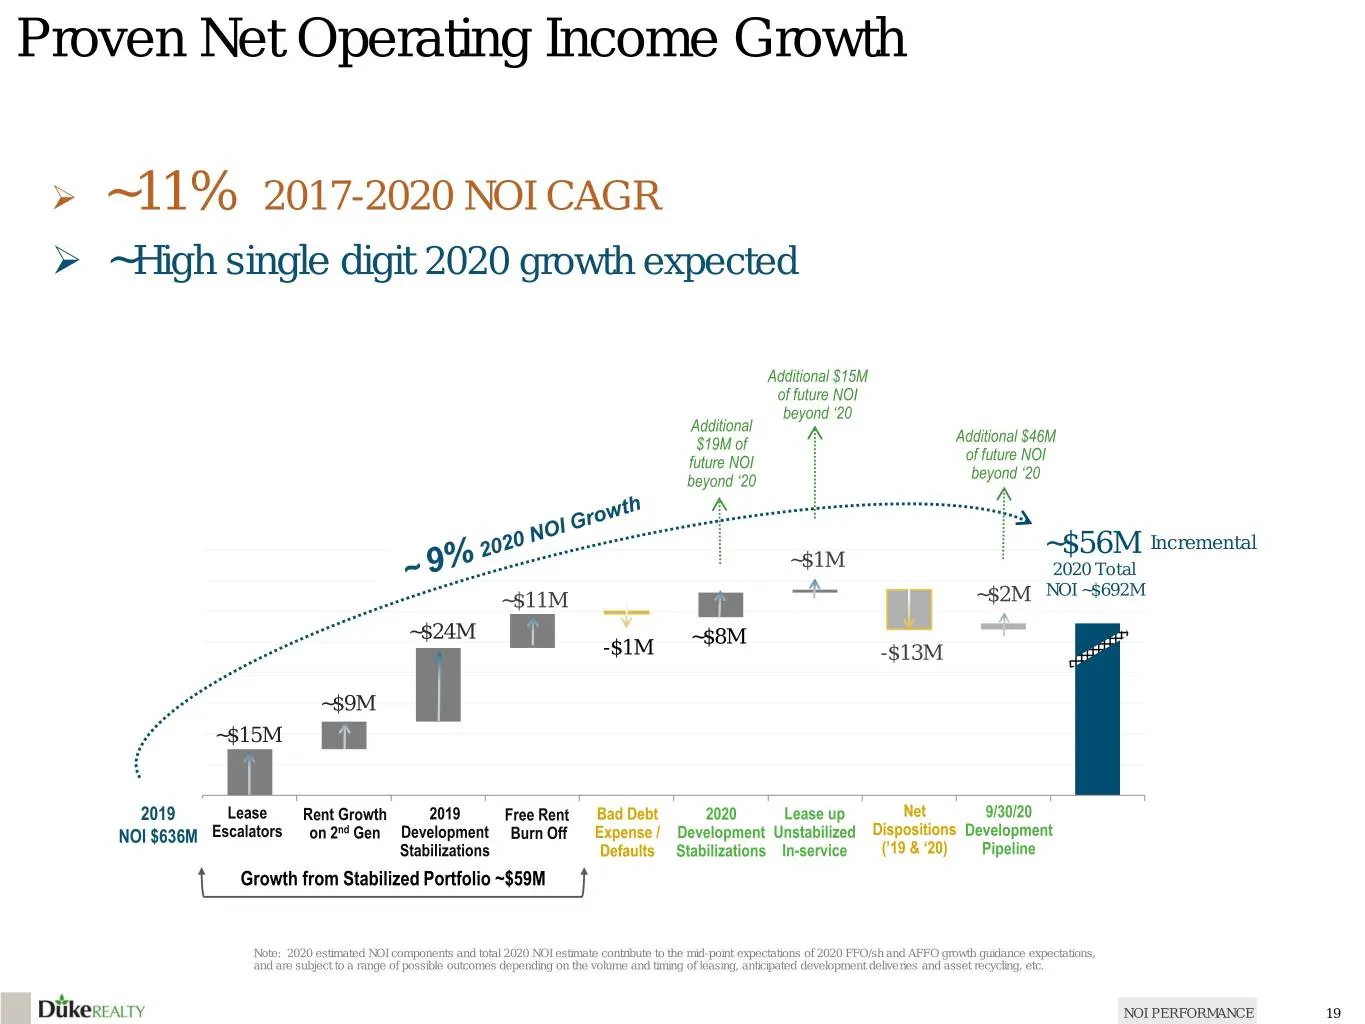
Proven Net Operating Income Growth ~11% 2017-2020 NOI CAGR ~High single digit 2020 growth expected Additional $15M of future NOI beyond ‘20 Additional $19M of Additional $46M future NOI of future NOI beyond ‘20 beyond ‘20 ~$56M Incremental ~$1M 2020 Total NOI ~$692M ~$11M ~$2M ~$24M ~$8M -$1M -$
Slide 20: Logistics Asset Strategy / Capital Allocation
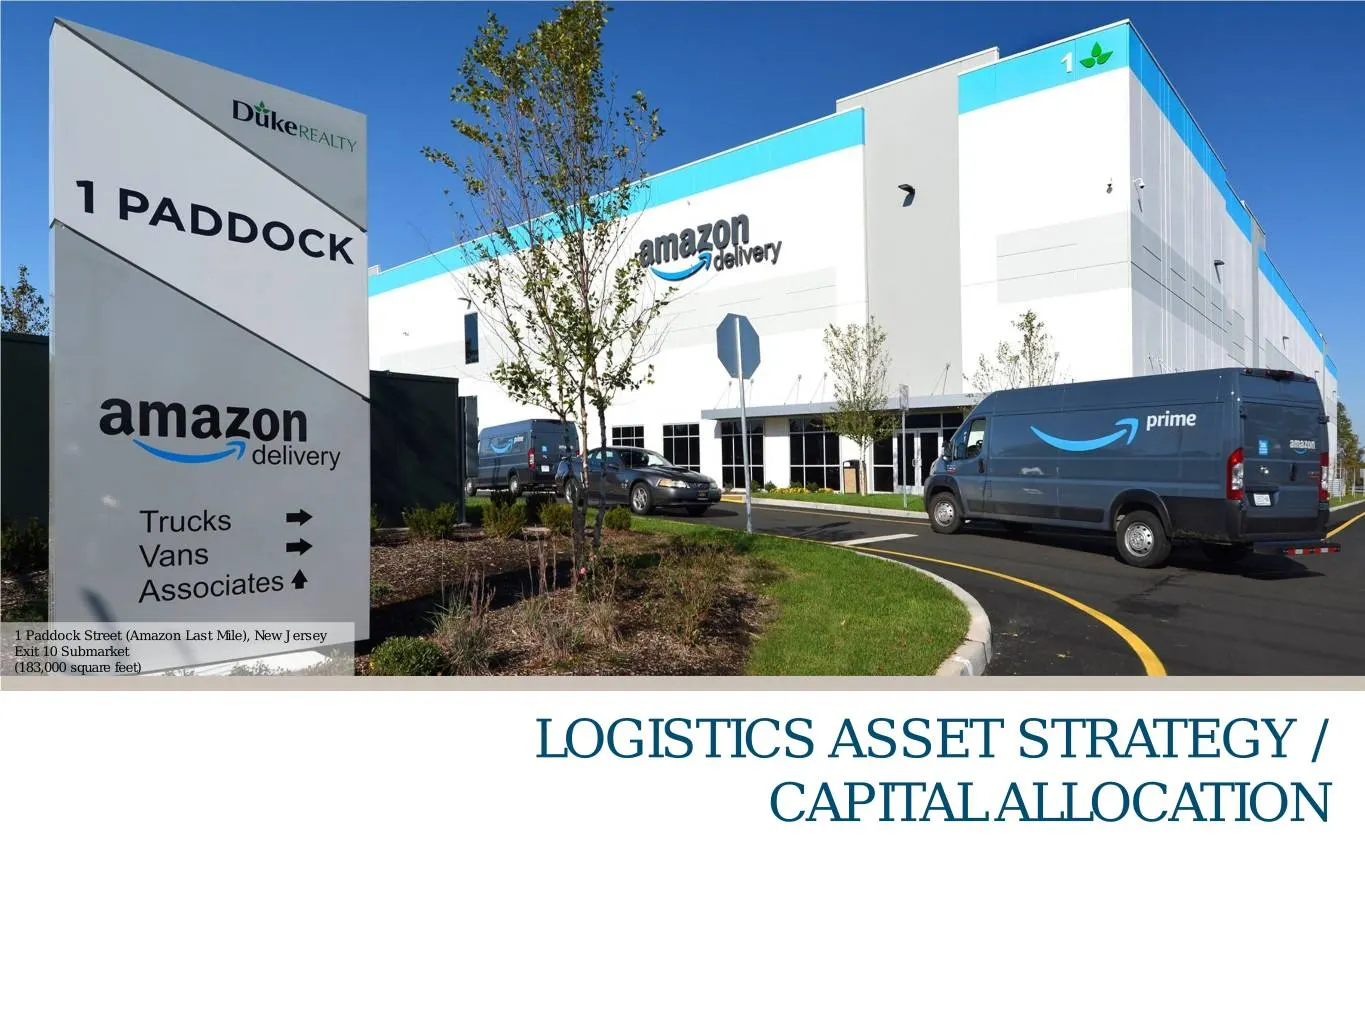
1 Paddock Street (Amazon Last Mile), New Jersey Exit 10 Submarket (183,000 square feet) LOGISTICS ASSET STRATEGY / CAPITAL ALLOCATION
Slide 21: National Platform with Growing Diversification into Tier 1 Markets
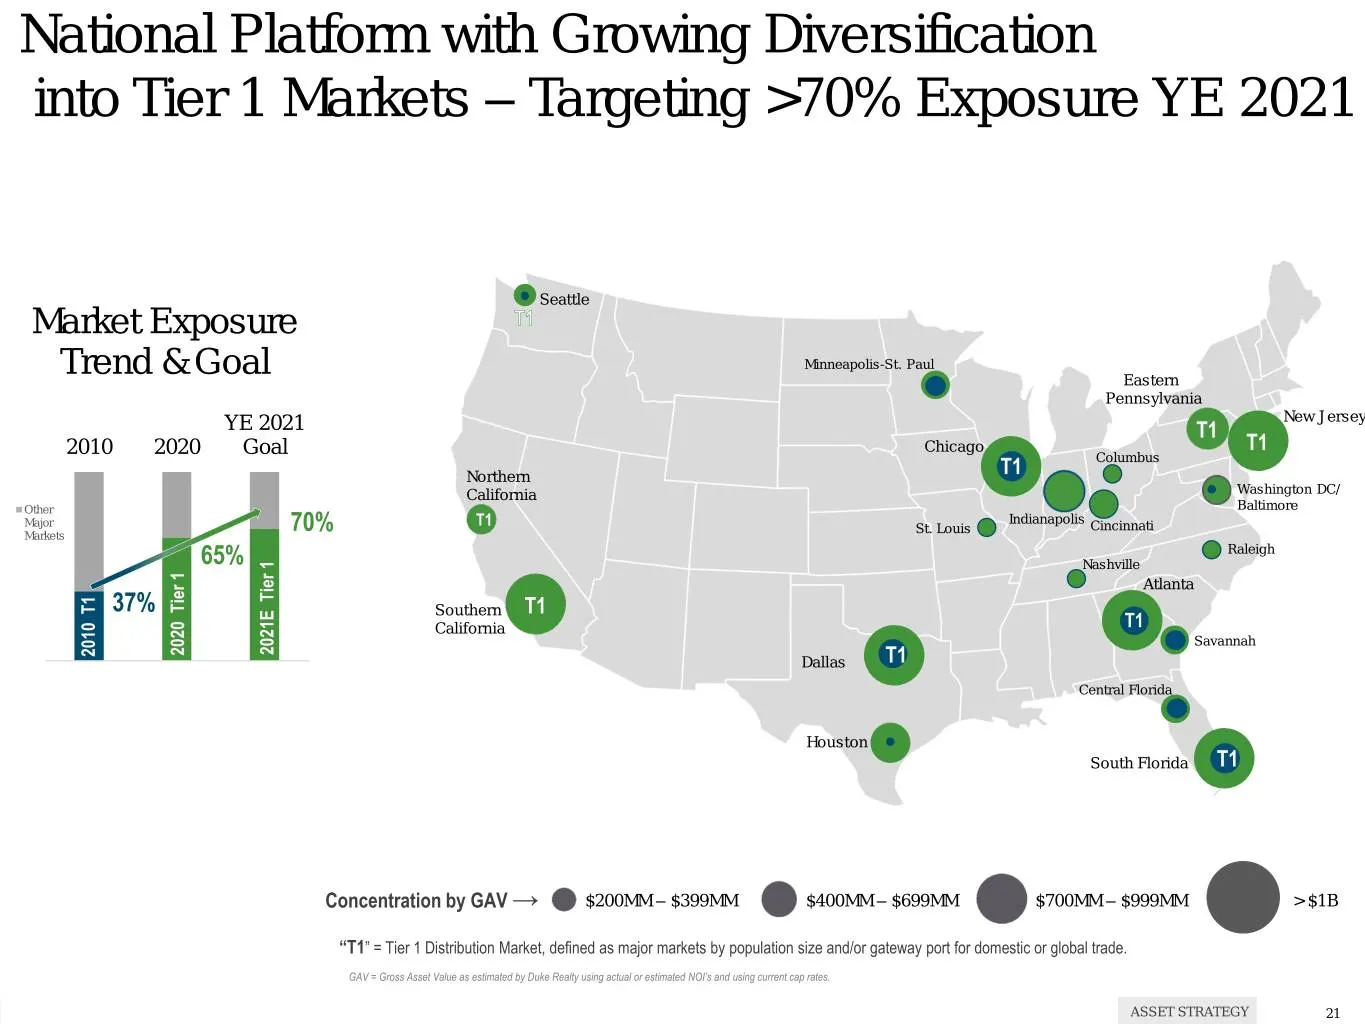
National Platform with Growing Diversification into Tier 1 Markets – Targeting >70% Exposure YE 2021 Seattle Market Exposure Minneapolis-St. Paul Trend & Goal Eastern Pennsylvania New Jersey YE 2021 T1 Chicago T1 2010 2020 Goal Columbus Northern T1 California Washington DC/ Other Baltimore Major T1
Slide 22: Recent Capital Allocation Achieving Geographic Objectives
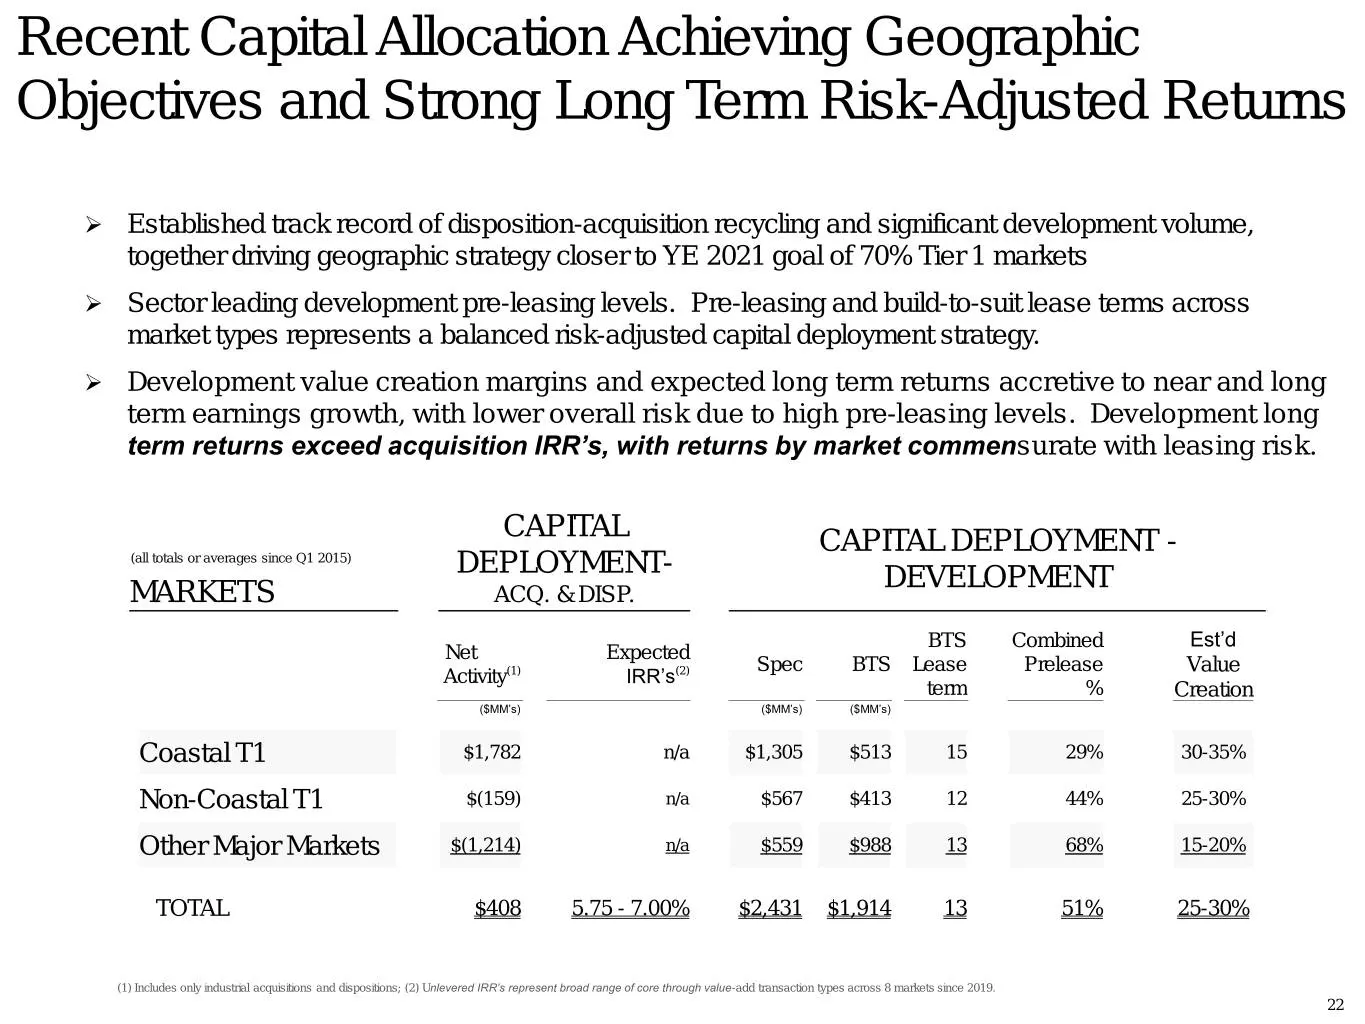
Recent Capital Allocation Achieving Geographic Objectives and Strong Long Term Risk-Adjusted Returns Established track record of disposition-acquisition recycling and significant development volume, together driving geographic strategy closer to YE 2021 goal of 70% Tier 1 markets Sector leading
Slide 23: Diversity of Facility Types & Sizes
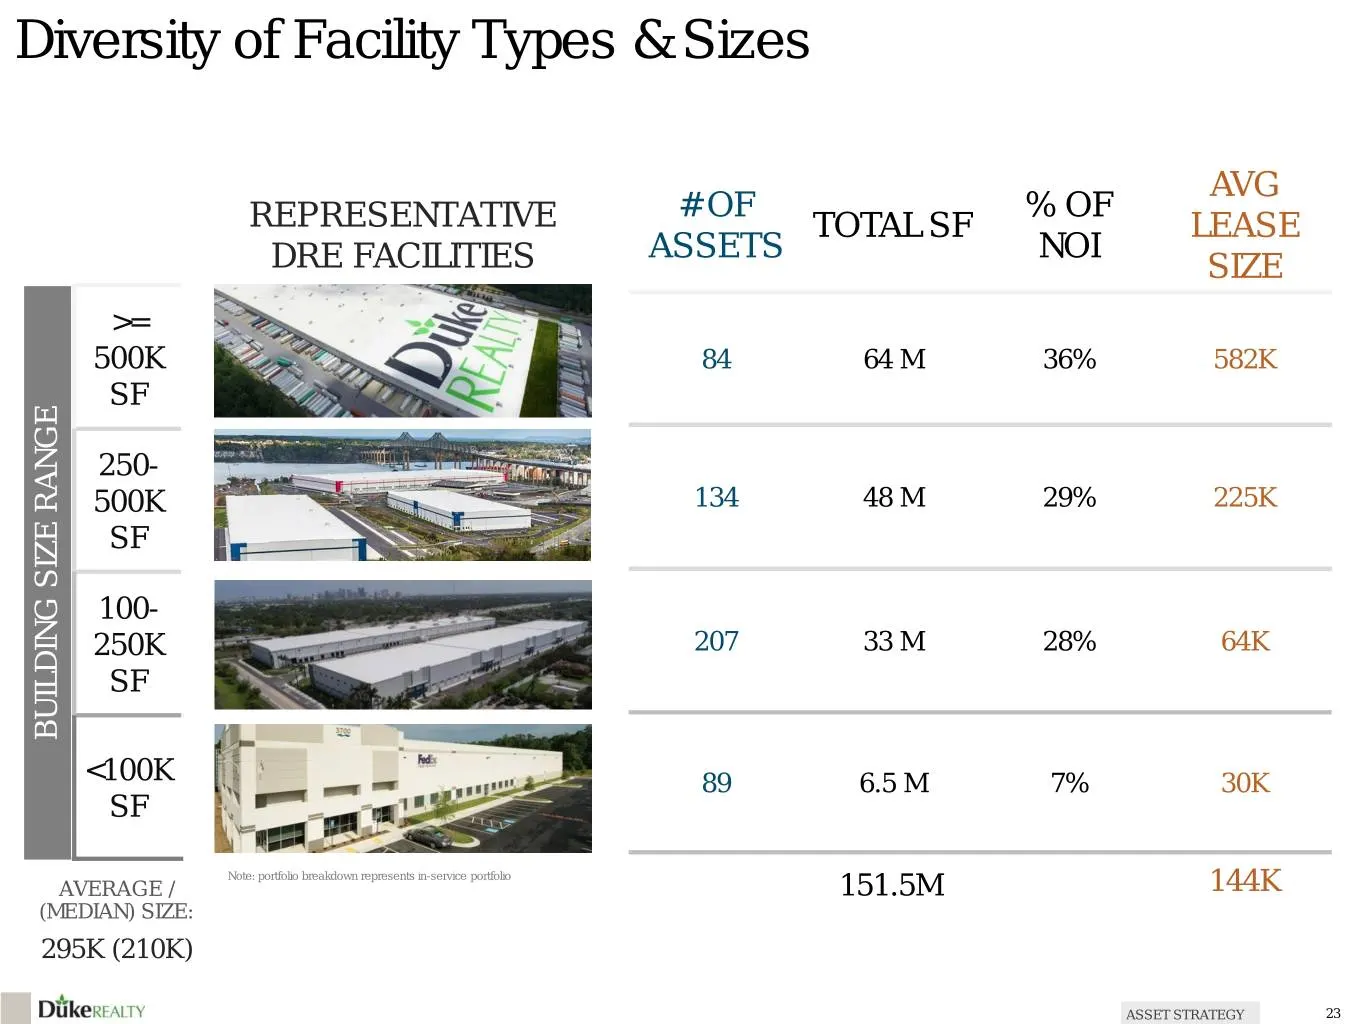
Diversity of Facility Types & Sizes AVG # OF % OF REPRESENTATIVE TOTAL SF LEASE ASSETS NOI DRE FACILITIES SIZE >= 500K 84 64 M 36% 582K SF 250- 500K 134 48 M 29% 225K SF 100- 250K 207 33 M 28% 64K SF BUILDING BUILDING RANGE SIZE <100K 89 6.5 M 7% 30K SF Note: portfolio breakdown represents in-servic
Slide 24: Modern Portfolio Performs Across All Sizes and Markets
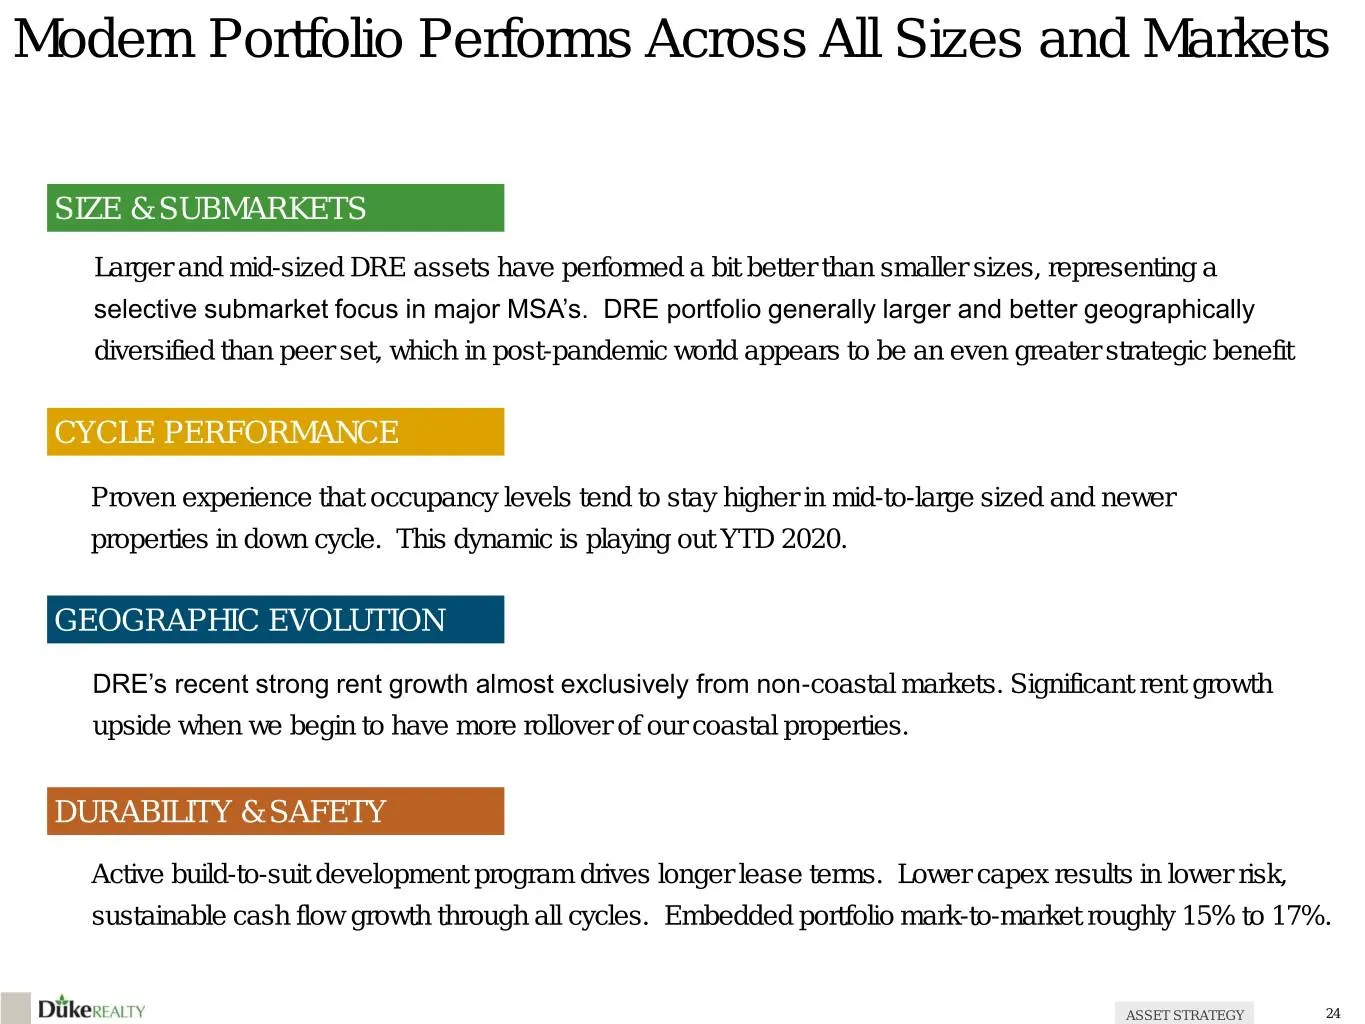
Modern Portfolio Performs Across All Sizes and Markets SIZE & SUBMARKETS Larger and mid-sized DRE assets have performed a bit better than smaller sizes, representing a selective submarket focus in major MSA’s. DRE portfolio generally larger and better geographically diversified than peer set, which
Slide 25: Focused Submarket Strategy | Modest Risk to Supply
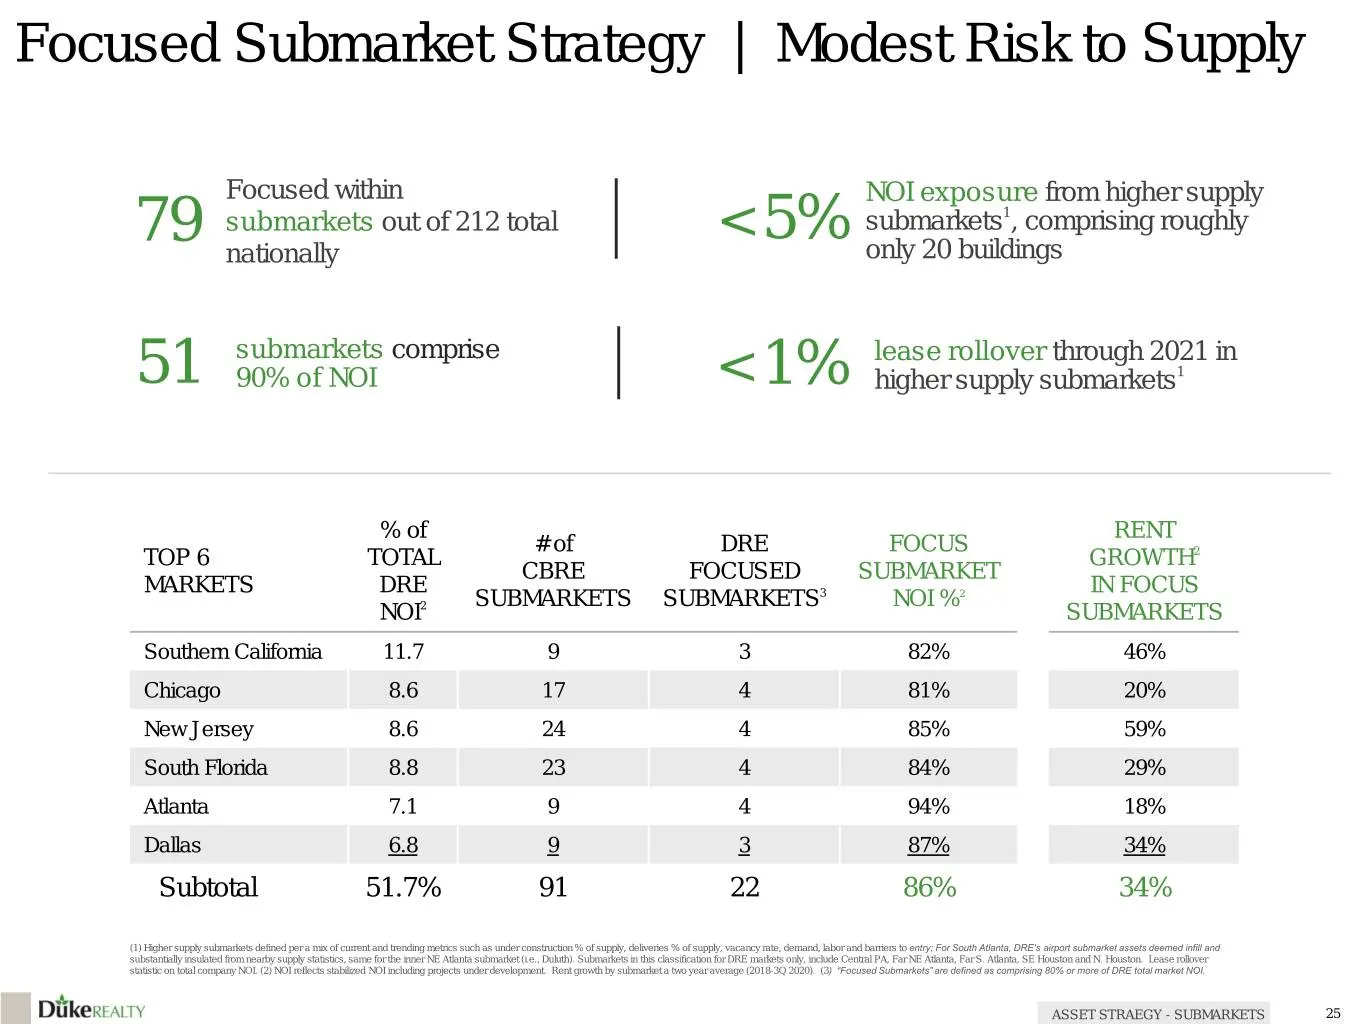
Focused Submarket Strategy | Modest Risk to Supply Focused within NOI exposure from higher supply 79 submarkets out of 212 total < 5% submarkets1, comprising roughly nationally only 20 buildings submarkets comprise lease rollover through 2021 in 51 90% of NOI < 1% higher supply submarkets1 % of RENT
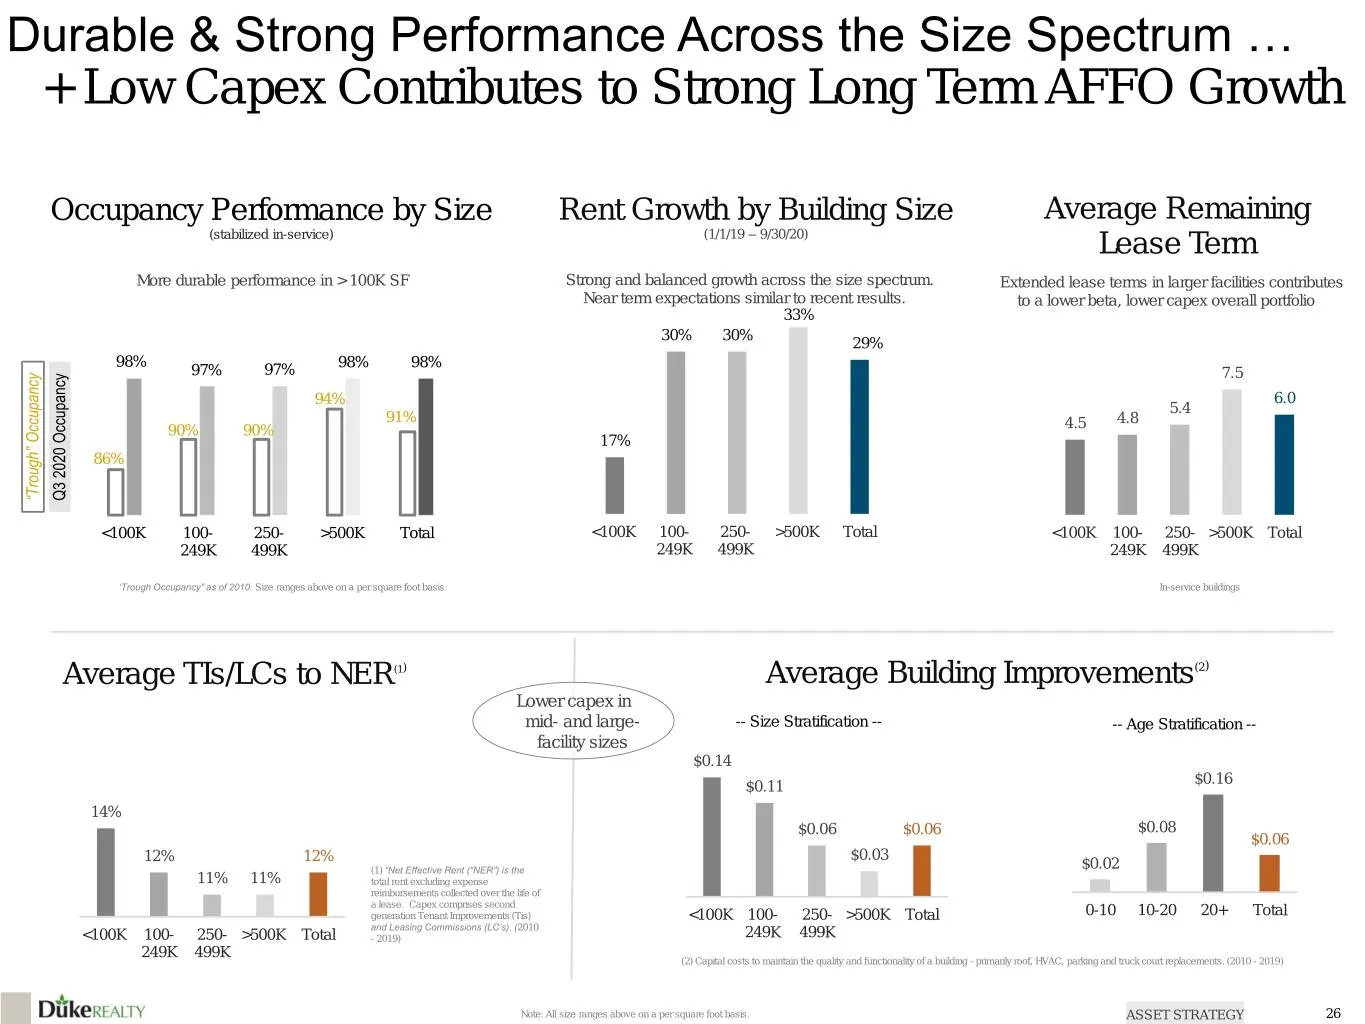
Slide 26: Durable & Strong Performance Across the Size Spectrum
Durable & Strong Performance Across the Size Spectrum … + Low Capex Contributes to Strong Long Term AFFO Growth Occupancy Performance by Size Rent Growth by Building Size Average Remaining (stabilized in-service) (1/1/19 – 9/30/20) Lease Term More durable performance in > 100K SF Strong and balanced
Slide 27: Development: A Key Growth Driver
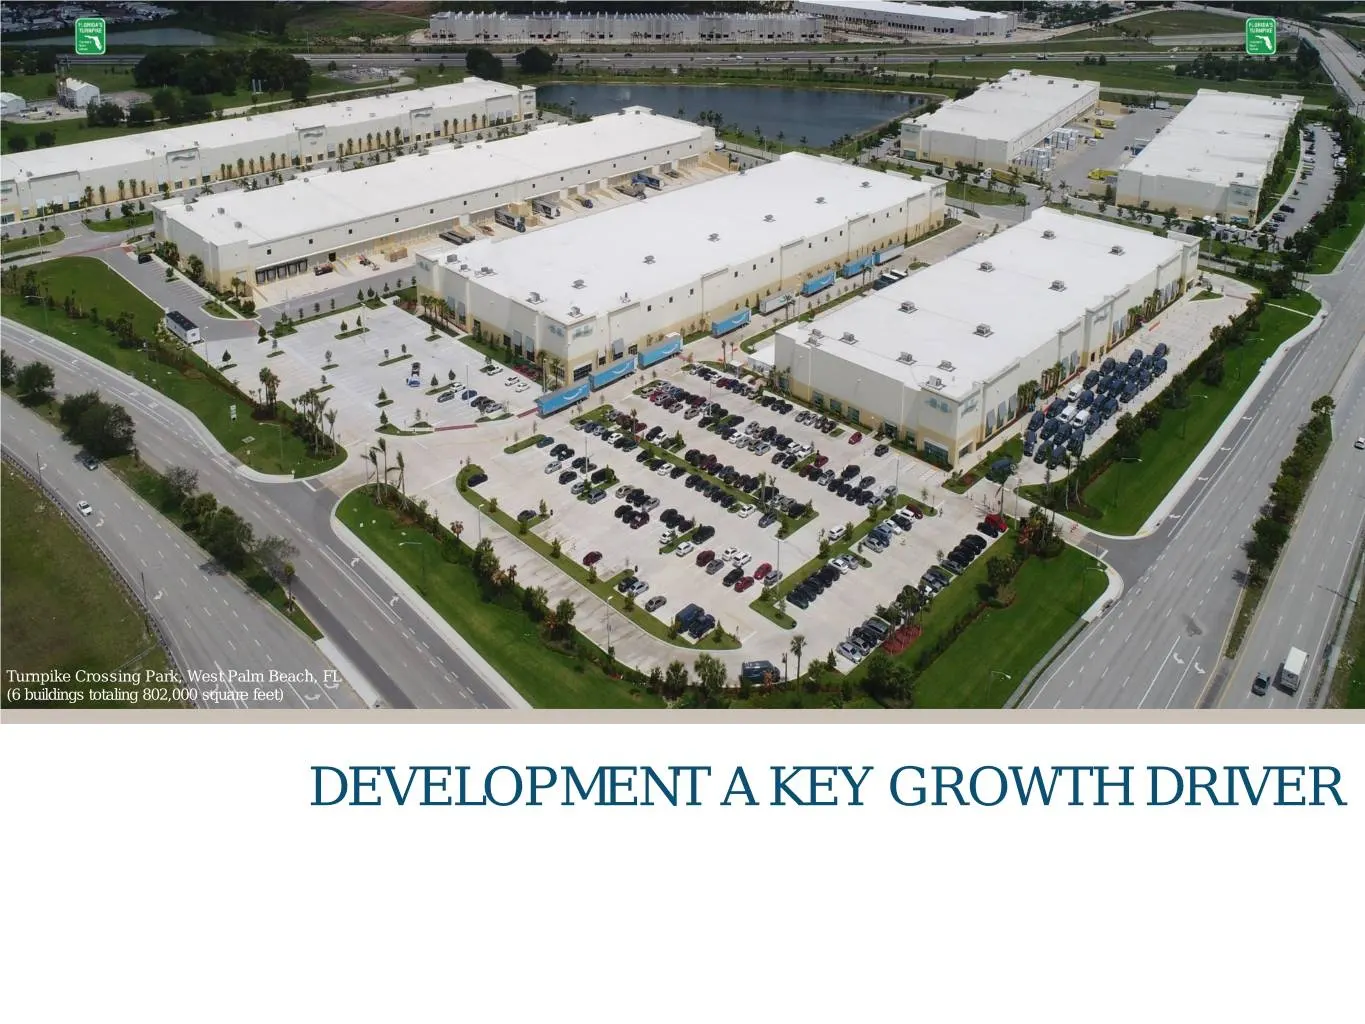
Turnpike Crossing Park, West Palm Beach, FL (6 buildings totaling 802,000 square feet) DEVELOPMENT A KEY GROWTH DRIVER
Slide 28: Development Strategic Advantages
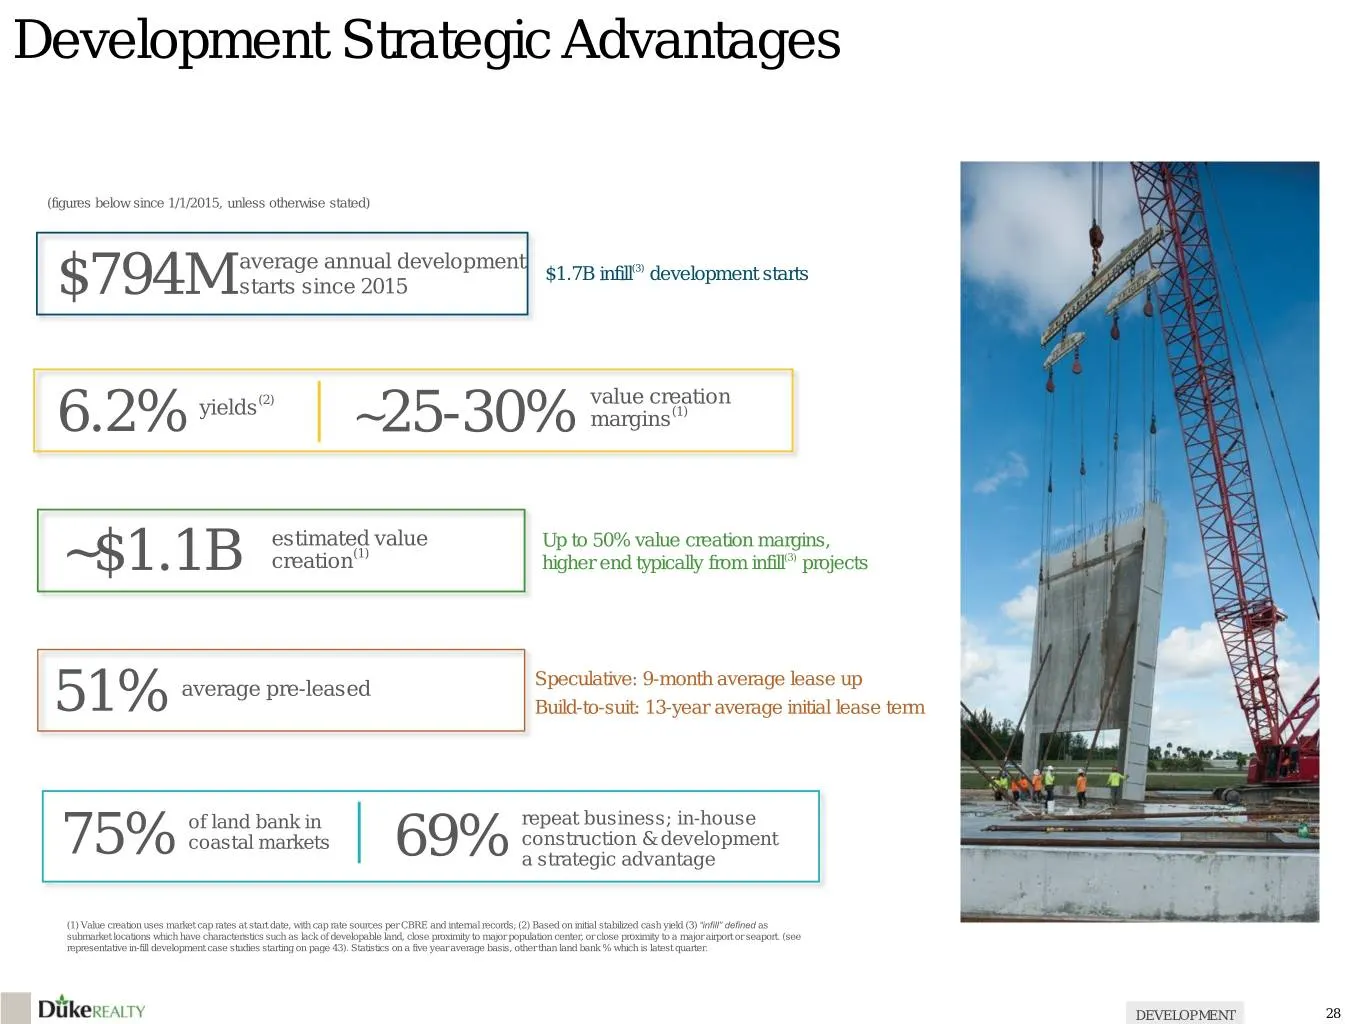
Development Strategic Advantages (figures below since 1/1/2015, unless otherwise stated) average annual development $1.7B infill(3) development starts $794M starts since 2015 (2) value creation yields (1) 6.2% ~25-30% margins estimated value Up to 50% value creation margins, (1) ~$1.1B creation high
Slide 29: Development Pipeline - Relatively Low Risk, Tier 1 Focus
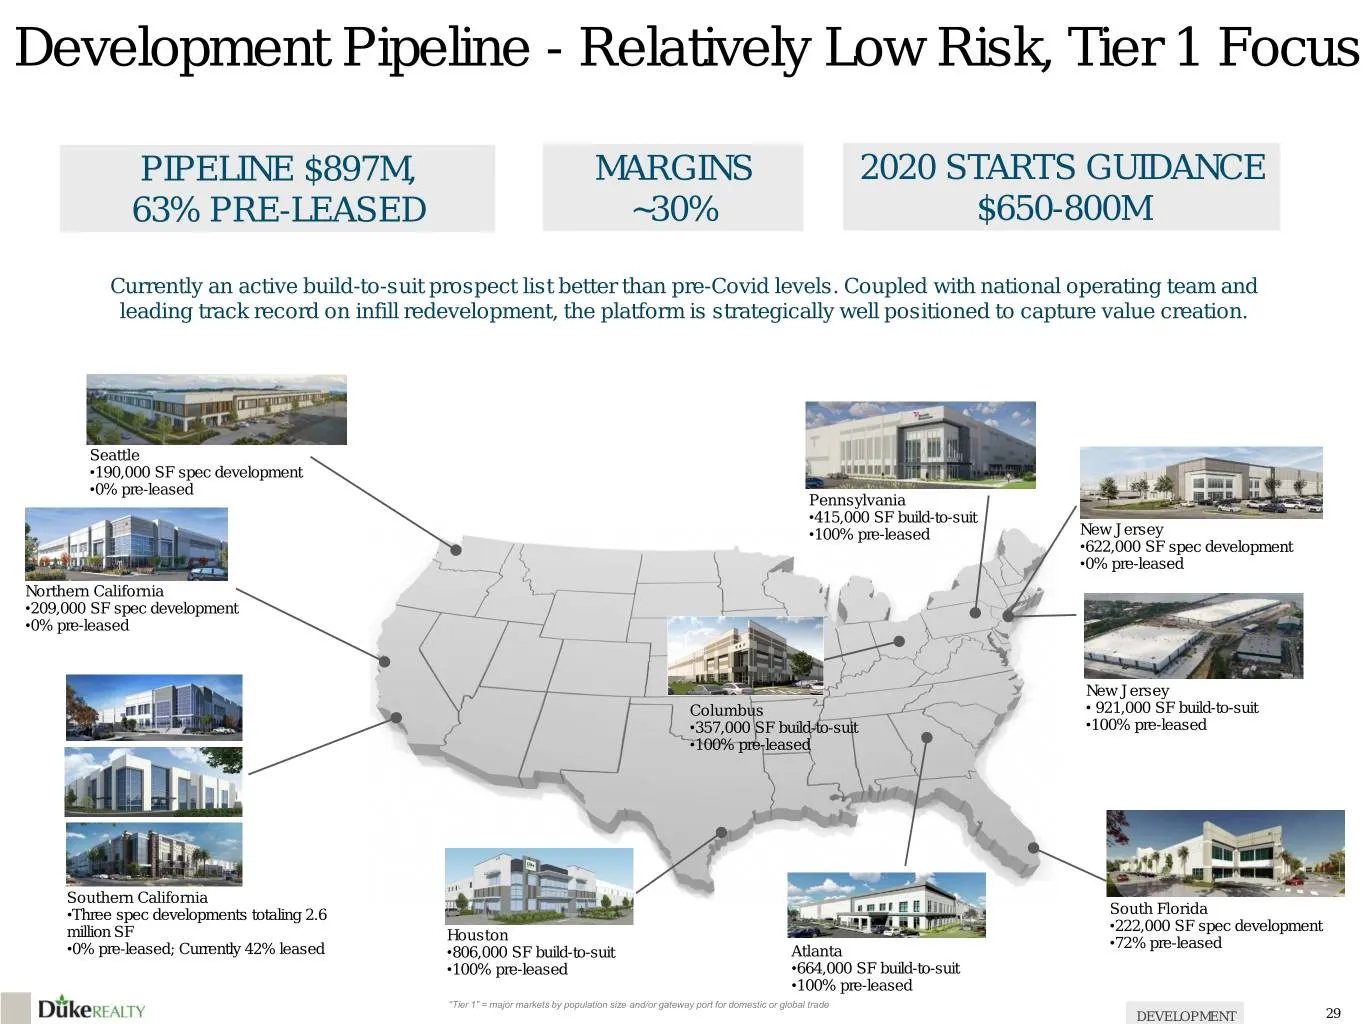
Development Pipeline - Relatively Low Risk, Tier 1 Focus PIPELINE $897M, MARGINS 2020 STARTS GUIDANCE 63% PRE-LEASED ~30% $650-800M Currently an active build-to-suit prospect list better than pre-Covid levels. Coupled with national operating team and leading track record on infill redevelopment, the
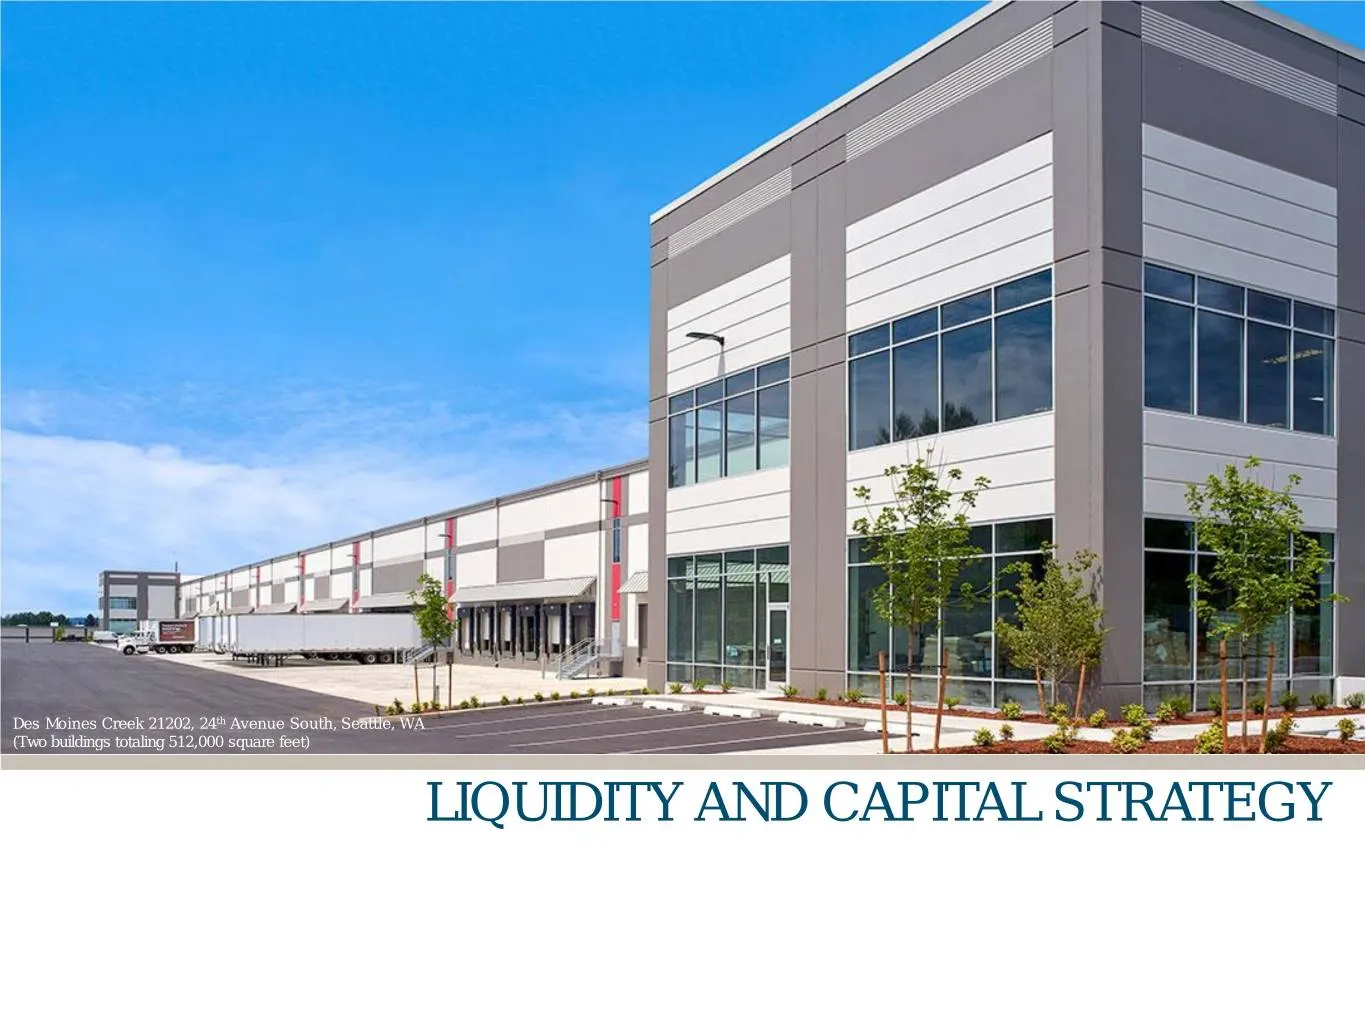
Slide 30: Liquidity and Capital Strategy
DesLockport Moines 16328 Creek / 16410 21202, / 16508 24th Avenue (3 buildings, South, 803,000 Seattle, SF), WA I-55 Submarket, Chicago, IL (Two buildings totaling 512,000 square feet) LIQUIDITY AND CAPITAL STRATEGY
Slide 31: Capital Strategy
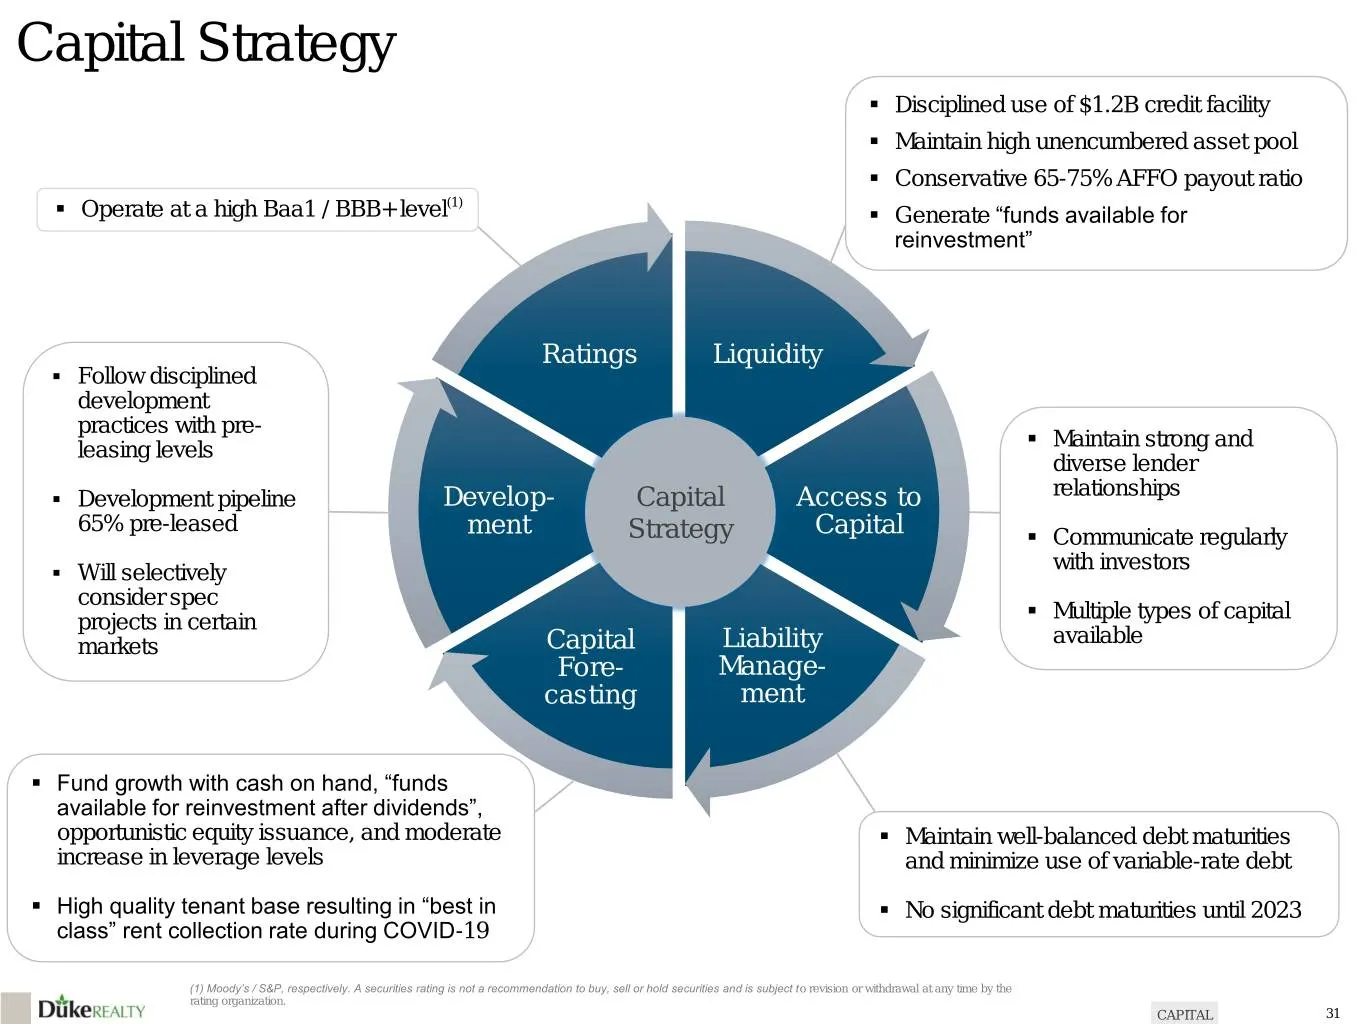
Capital Strategy . Disciplined use of $1.2B credit facility . Maintain high unencumbered asset pool . Conservative 65-75% AFFO payout ratio (1) . Operate at a high Baa1 / BBB+ level . Generate “funds available for reinvestment” Ratings Liquidity . Follow disciplined development practices with pre- l
Slide 32: Simplified and Disciplined Financial Profile
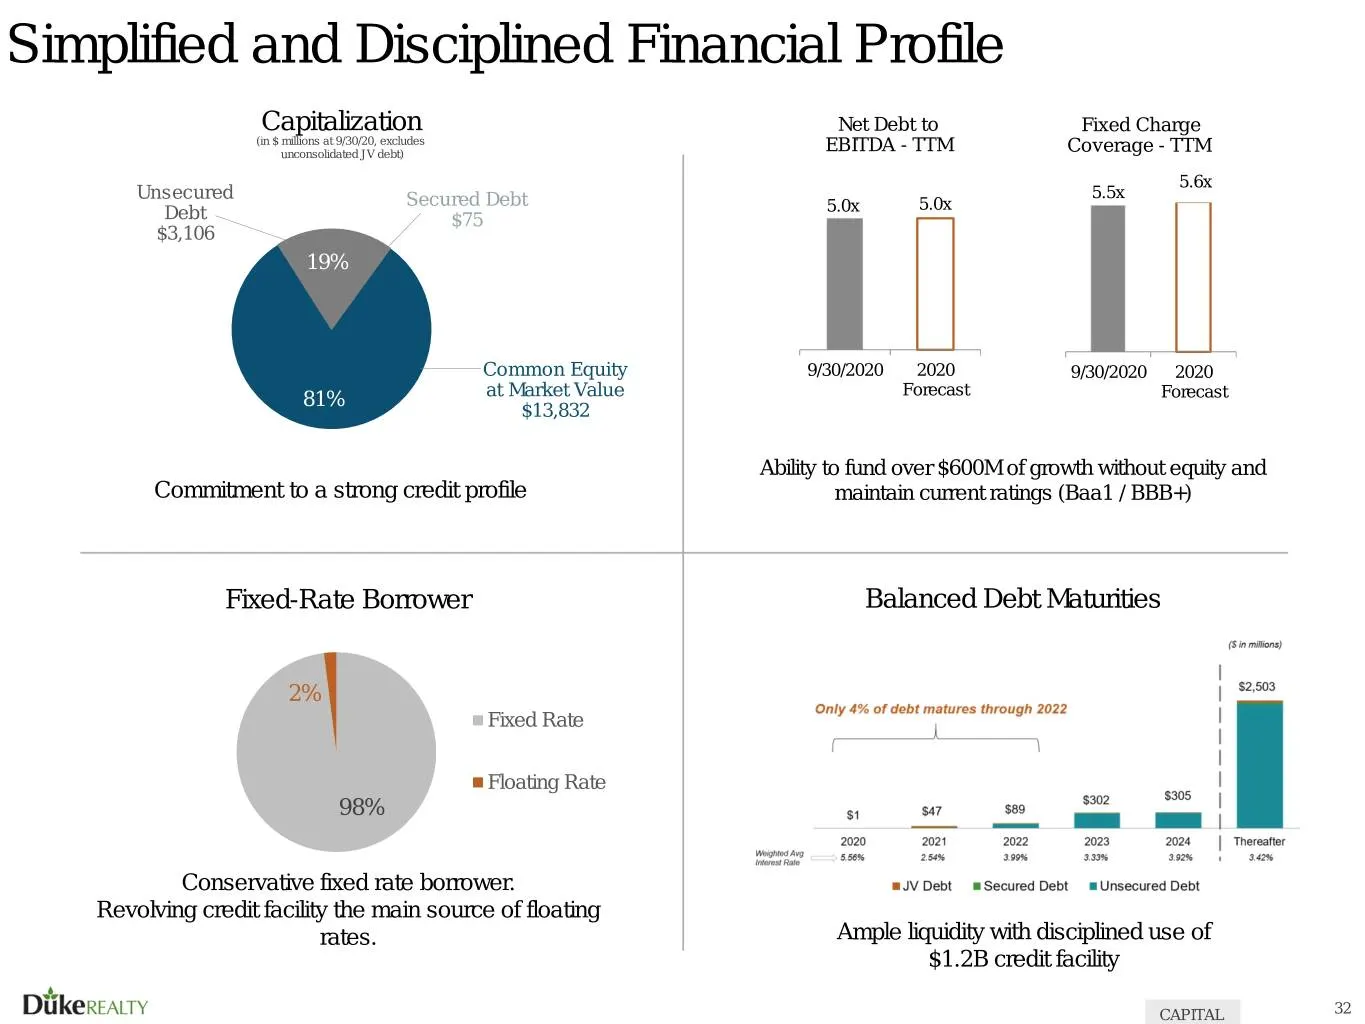
Simplified and Disciplined Financial Profile Capitalization Net Debt to Fixed Charge (in $ millions at 9/30/20, excludes unconsolidated JV debt) EBITDA - TTM Coverage - TTM 5.6x Unsecured 5.5x Secured Debt 5.0x 5.0x Debt $75 $3,106 19% Common Equity 9/30/2020 2020 9/30/2020 2020 81% at Market Value
Slide 33: Funding Growth While Controlling Leverage
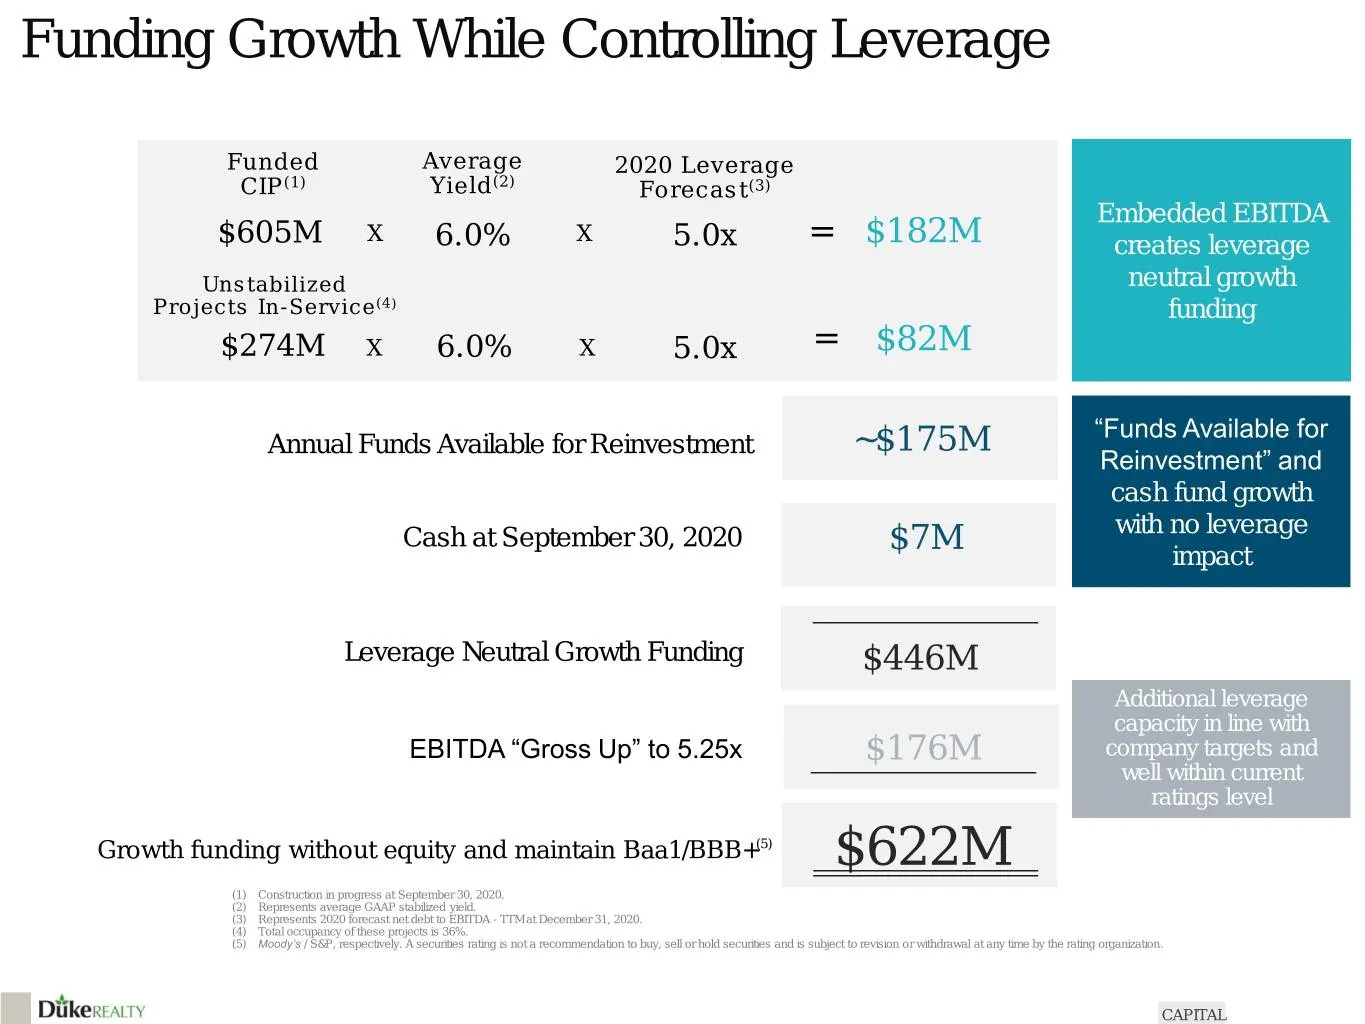
Funding Growth While Controlling Leverage Funded Average 2020 Leverage CIP(1) Yield(2) Forecast(3) Embedded EBITDA $605M X 6.0% X 5.0x = $182M creates leverage Unstabilized neutral growth Projects In-Service (4) funding $274M X 6.0% X 5.0x = $82M “Funds Available for Annual Funds Available for Reinv
Slide 34: Baa1/BBB+ Rated but Credit Metrics at A Quality Levels
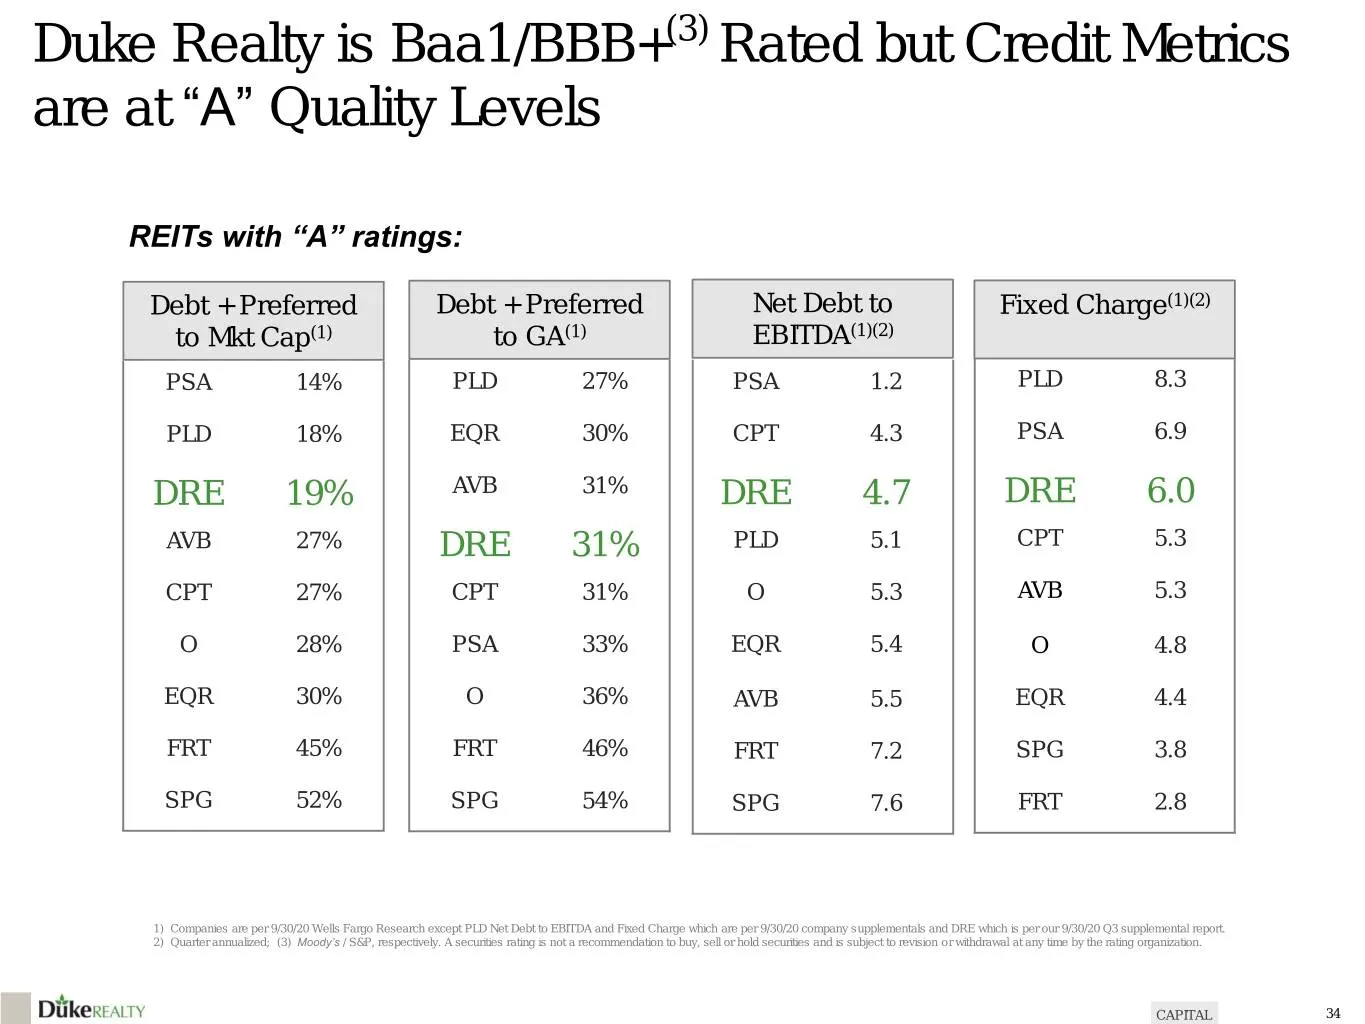
Duke Realty is Baa1/BBB+(3) Rated but Credit Metrics are at “A” Quality Levels REITs with “A” ratings: Debt + Preferred Debt + Preferred Net Debt to Fixed Charge(1)(2) to Mkt Cap(1) to GA(1) EBITDA(1)(2) PSA 14% PLD 27% PSA 1.2 PLD 8.3 PLD 18% EQR 30% CPT 4.3 PSA 6.9 DRE 19% AVB 31% DRE 4.7 DRE 6.0
Slide 35: Solid AFFO Growth Throughout Major Repositioning
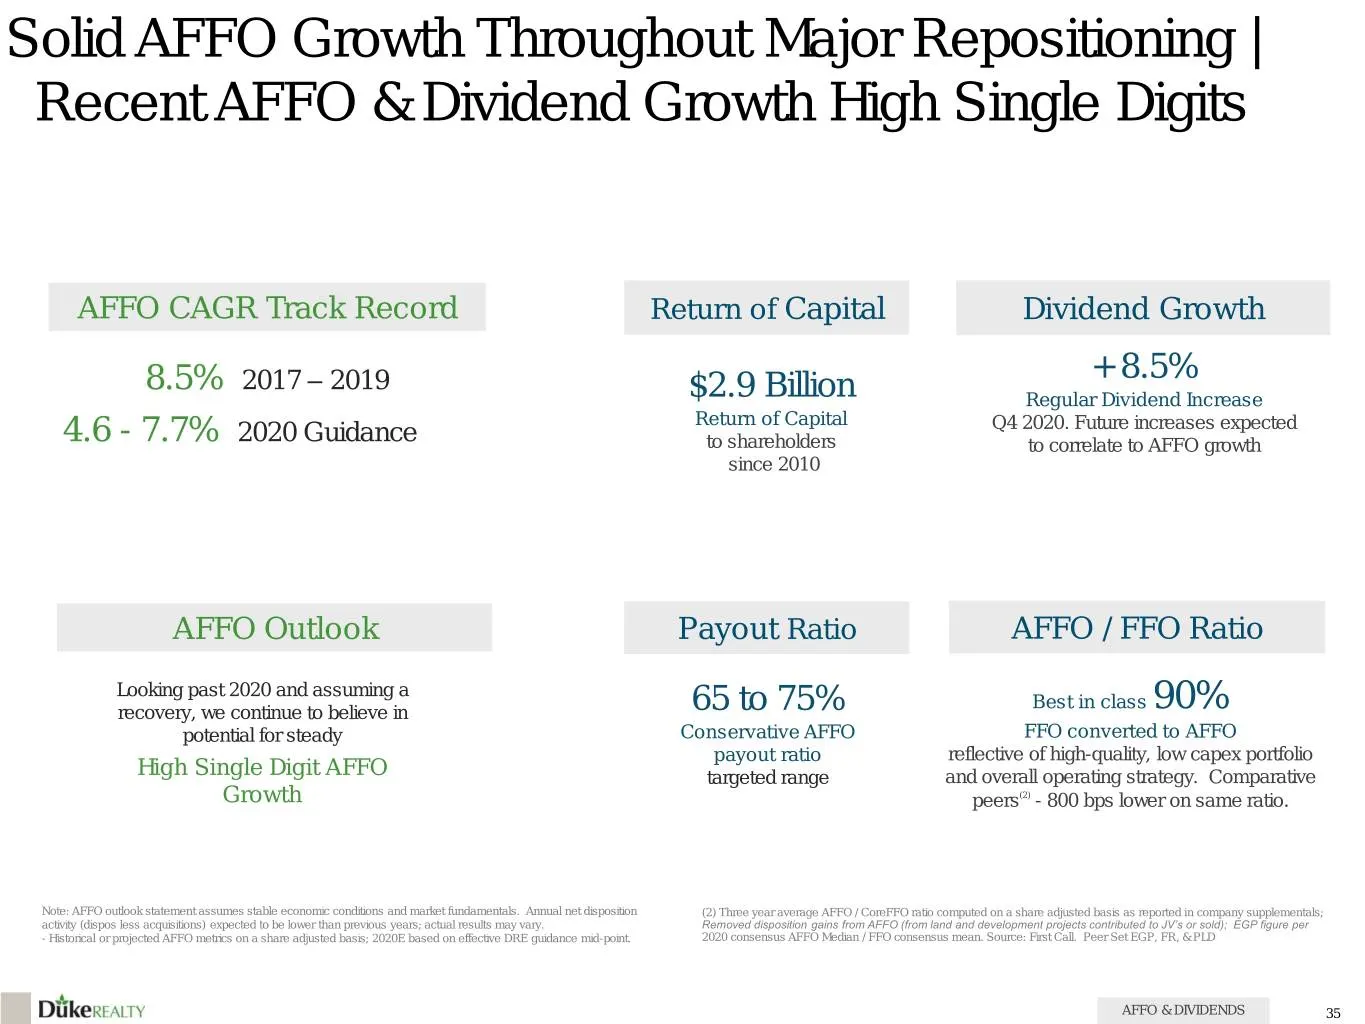
Solid AFFO Growth Throughout Major Repositioning | Recent AFFO & Dividend Growth High Single Digits AFFO CAGR Track Record Return of Capital Dividend Growth 8.5% 2017 – 2019 + 8.5% $2.9 Billion Regular Dividend Increase Return of Capital Q4 2020. Future increases expected 4.6 - 7.7% 2020 Guidance to
Slide 36: Corporate Responsibility
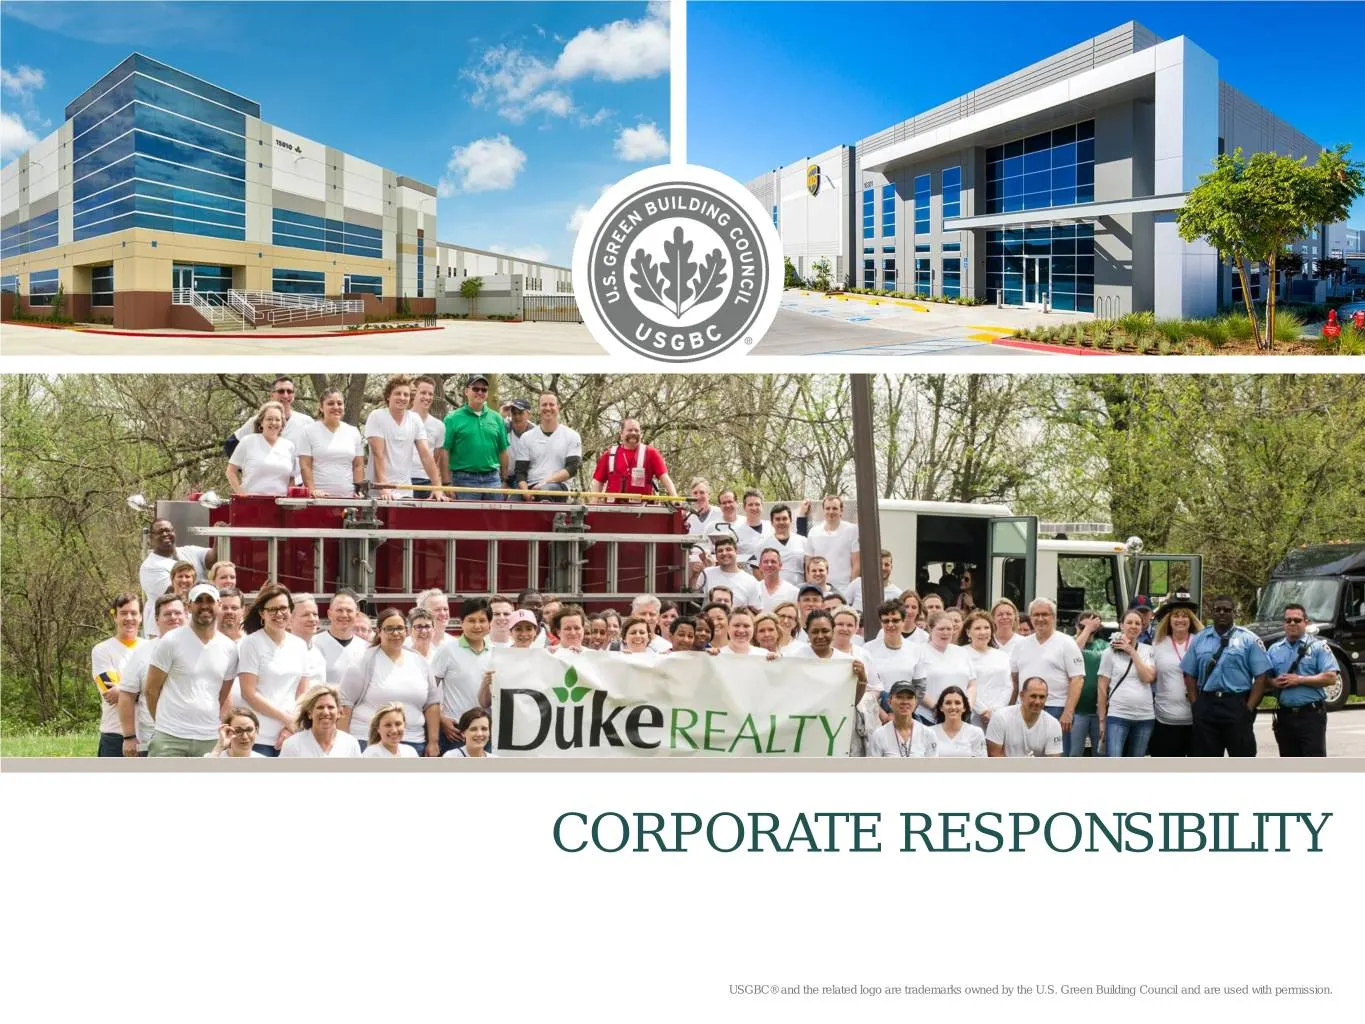
CORPORATE RESPONSIBILITY USGBC® and the related logo are trademarks owned by the U.S. Green Building Council and are used with permission.
Slide 37: Green Initiatives
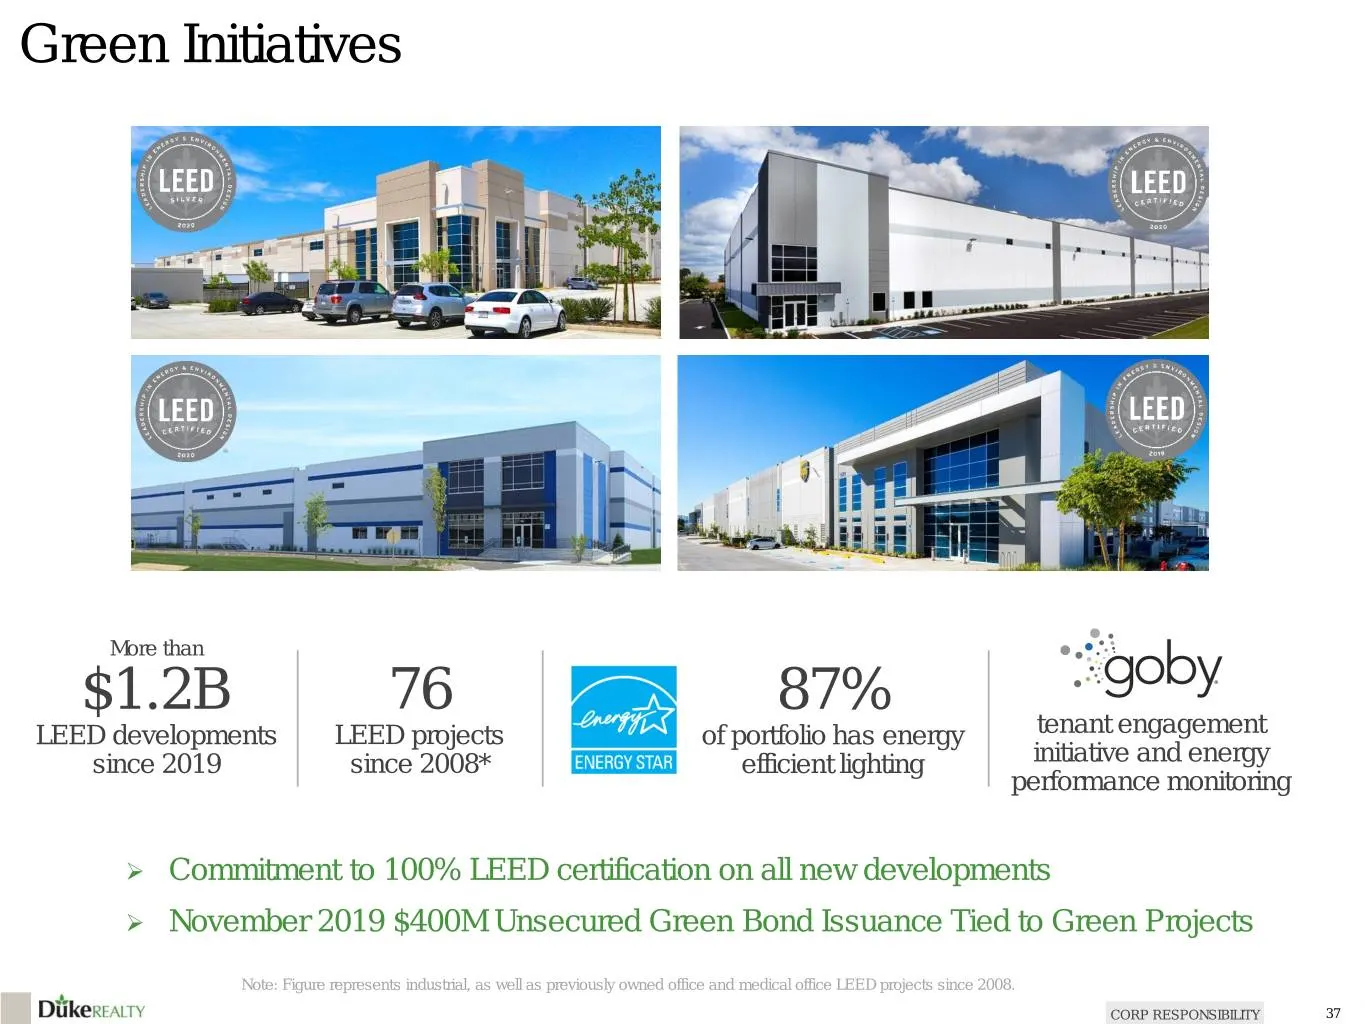
Green Initiatives More than $1.2B 76 87% LEED developments LEED projects of portfolio has energy tenant engagement since 2019 since 2008* efficient lighting initiative and energy performance monitoring Commitment to 100% LEED certification on all new developments November 2019 $400M Unsecured Gr
Slide 38: Commitment to Social and Governance
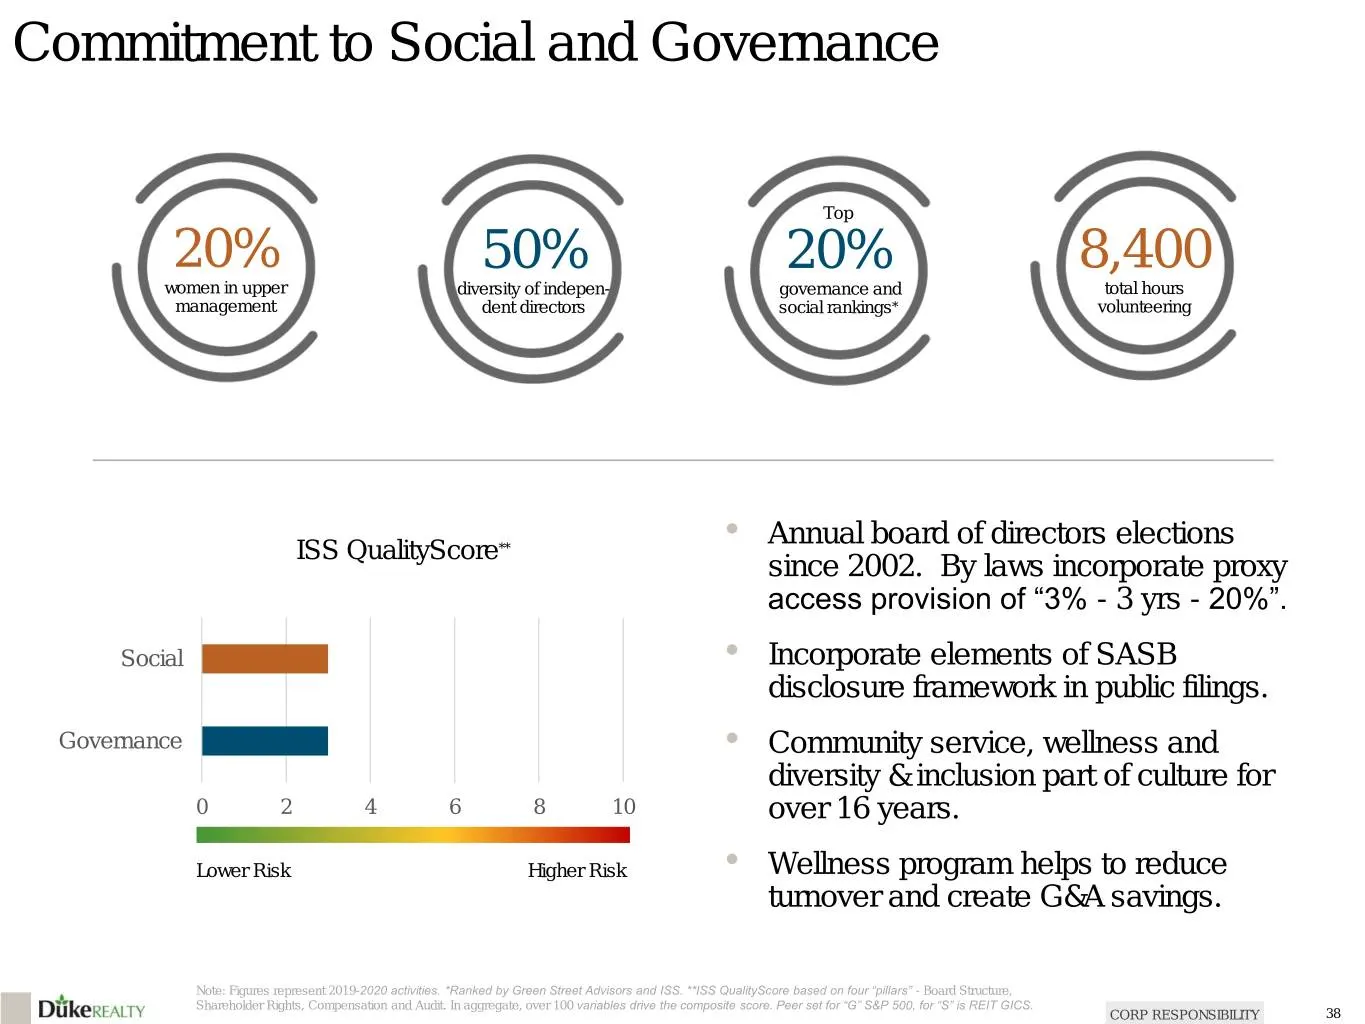
Commitment to Social and Governance Top 20% 50% 20% 8,400 women in upper diversity of indepen- governance and total hours management dent directors social rankings* volunteering • Annual board of directors elections ISS QualityScore** since 2002. By laws incorporate proxy access provision of “3% - 3
Slide 39: Industry Recognitions & Affiliations
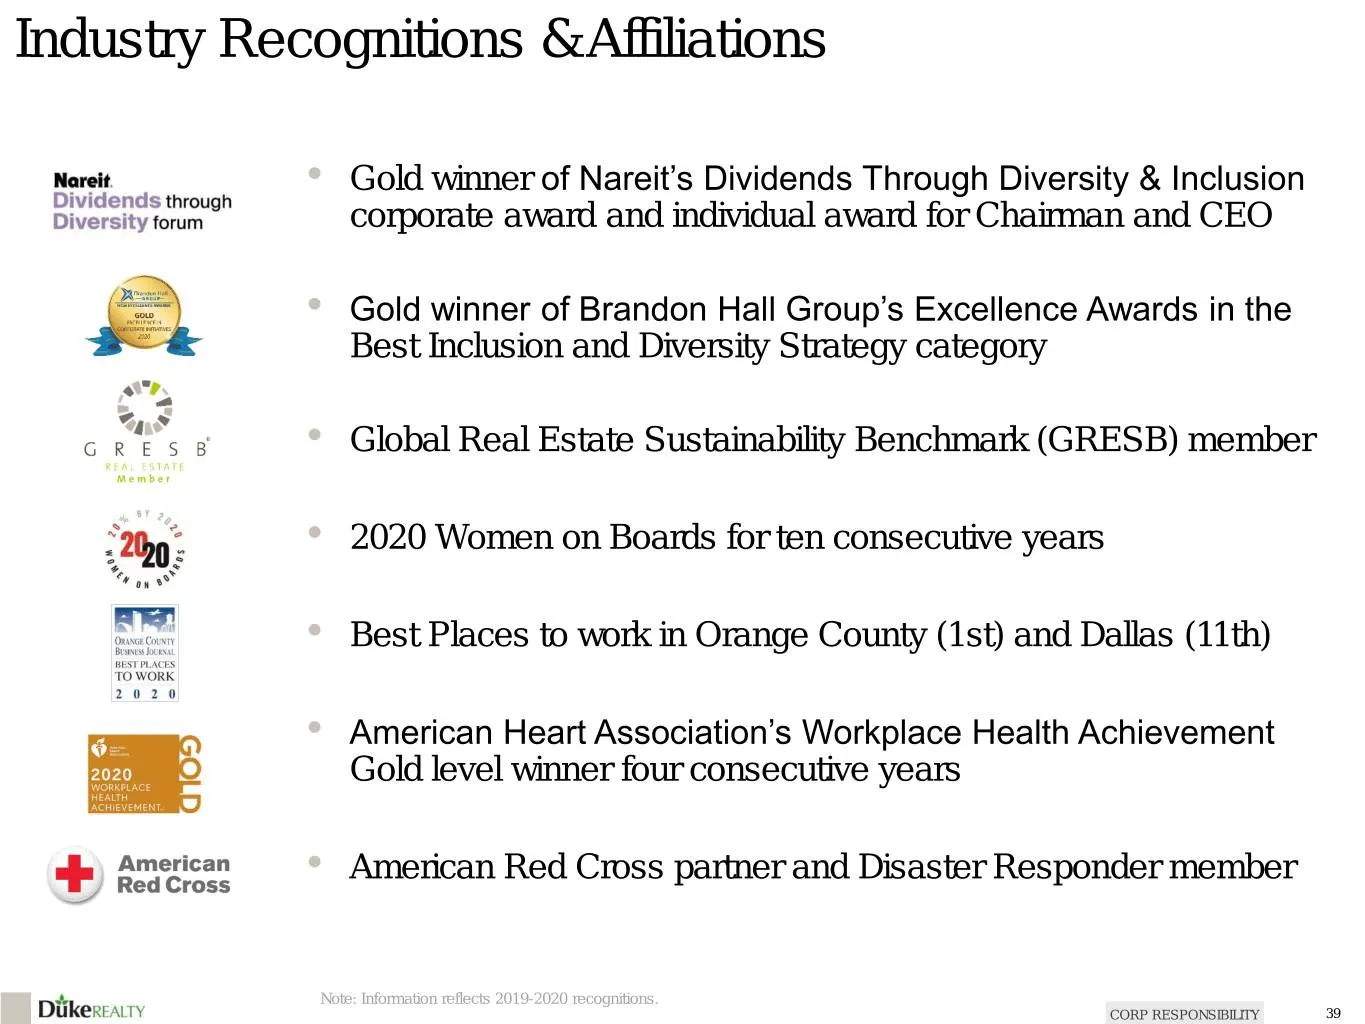
Industry Recognitions & Affiliations • Gold winner of Nareit’s Dividends Through Diversity & Inclusion corporate award and individual award for Chairman and CEO • Gold winner of Brandon Hall Group’s Excellence Awards in the Best Inclusion and Diversity Strategy category • Global Real Estate Sustaina
Slide 40: Why Duke Realty?
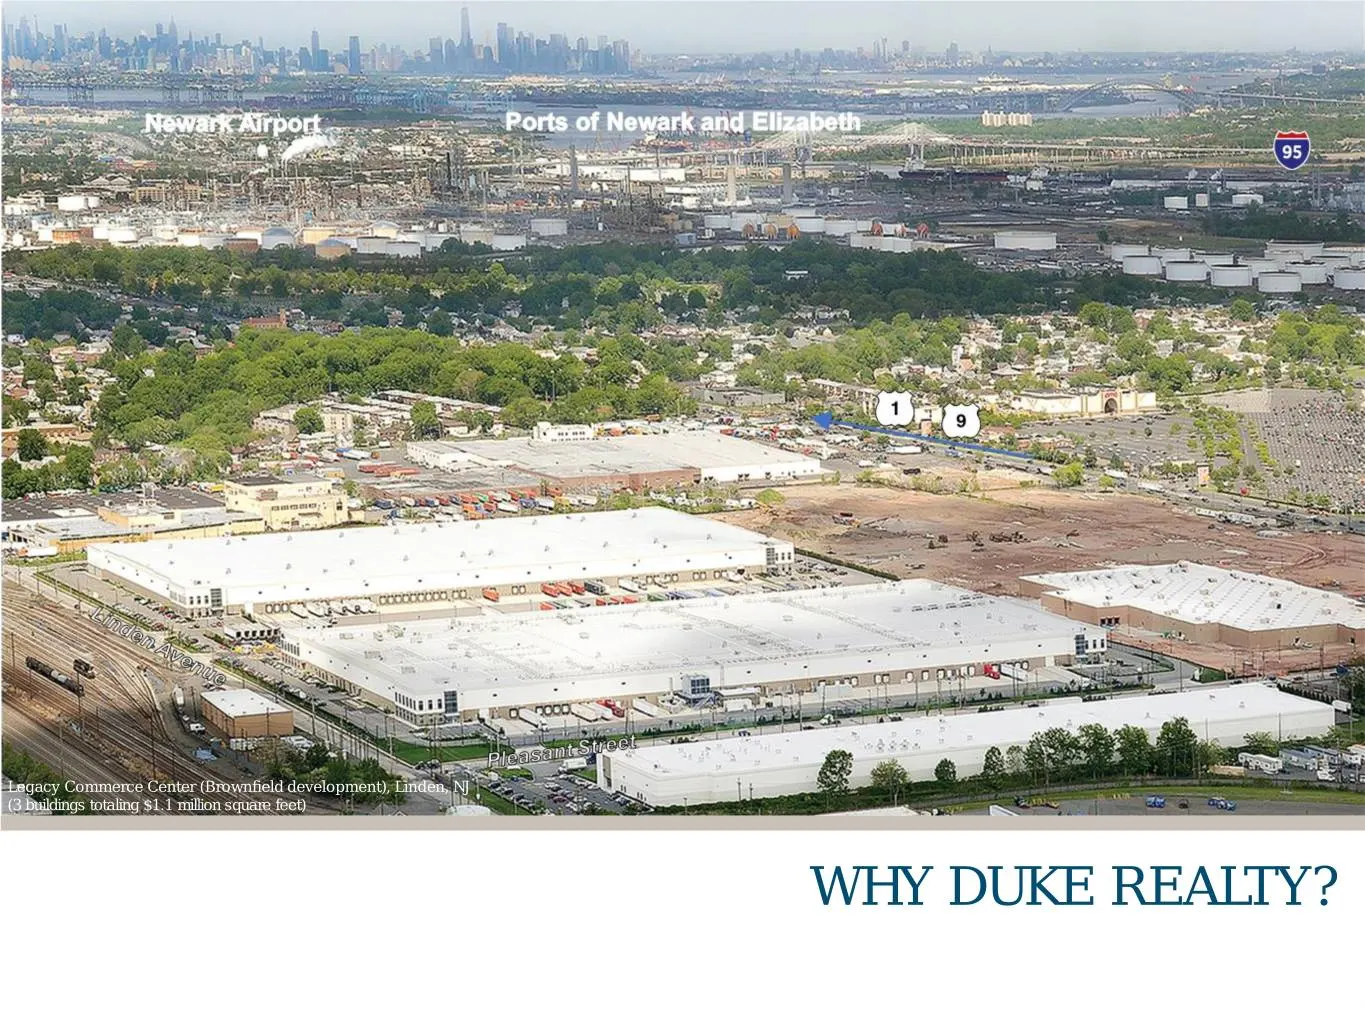
Legacy Commerce Center (Brownfield development), Linden, NJ (3 buildings totaling $1.1 million square feet) WHY DUKE REALTY?
Slide 41: The Leading Domestic-Only Logistics REIT
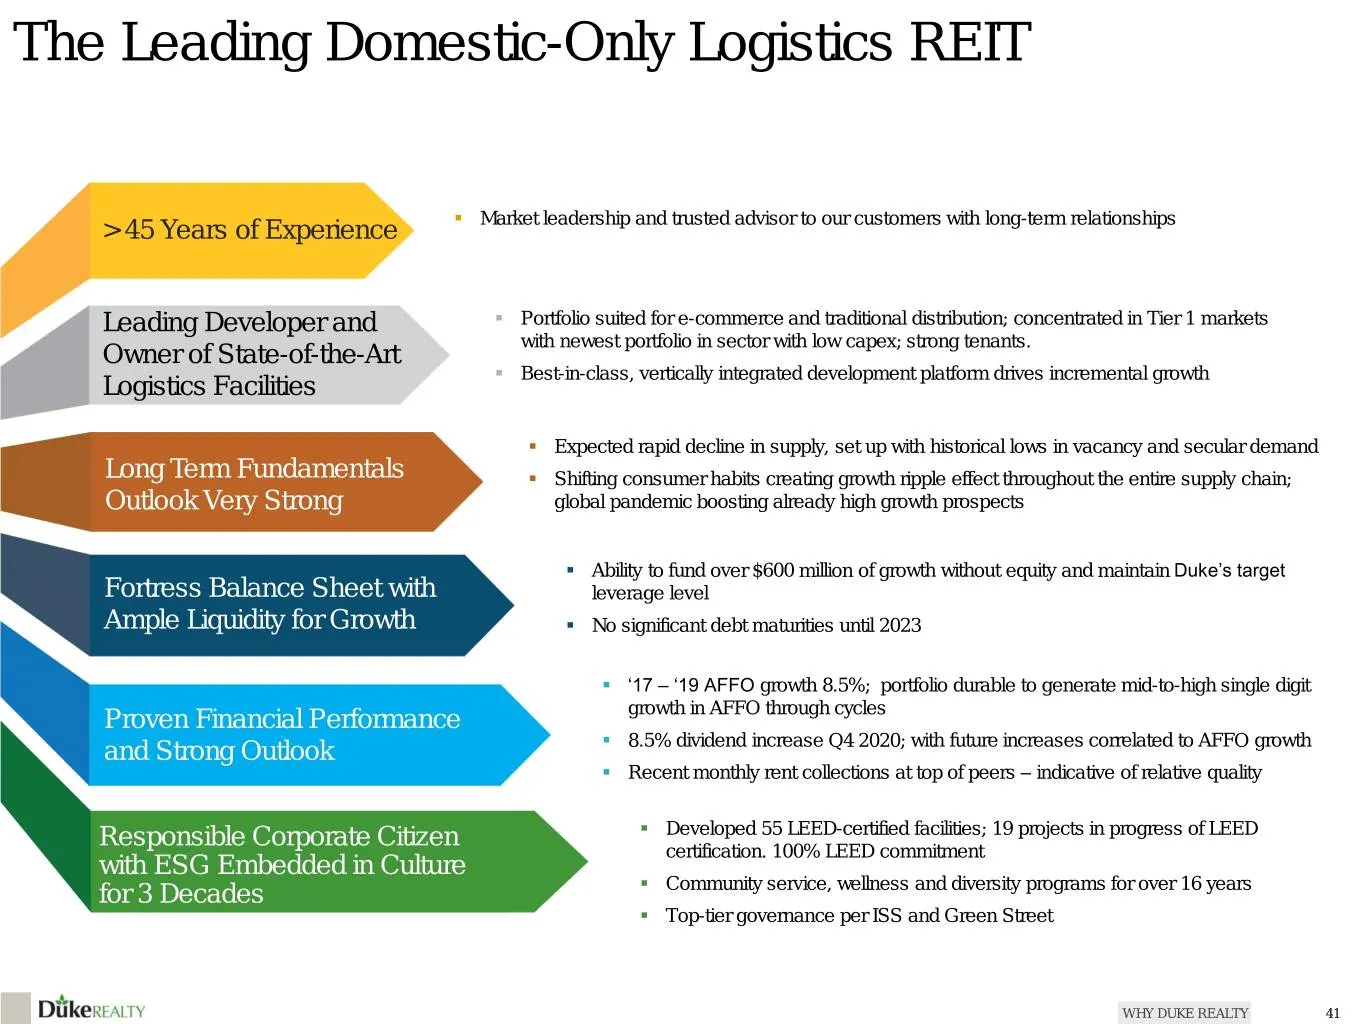
The Leading Domestic-Only Logistics REIT > 45 Years of Experience . Market leadership and trusted advisor to our customers with long-term relationships Leading Developer and . Portfolio suited for e-commerce and traditional distribution; concentrated in Tier 1 markets with newest portfolio in sector
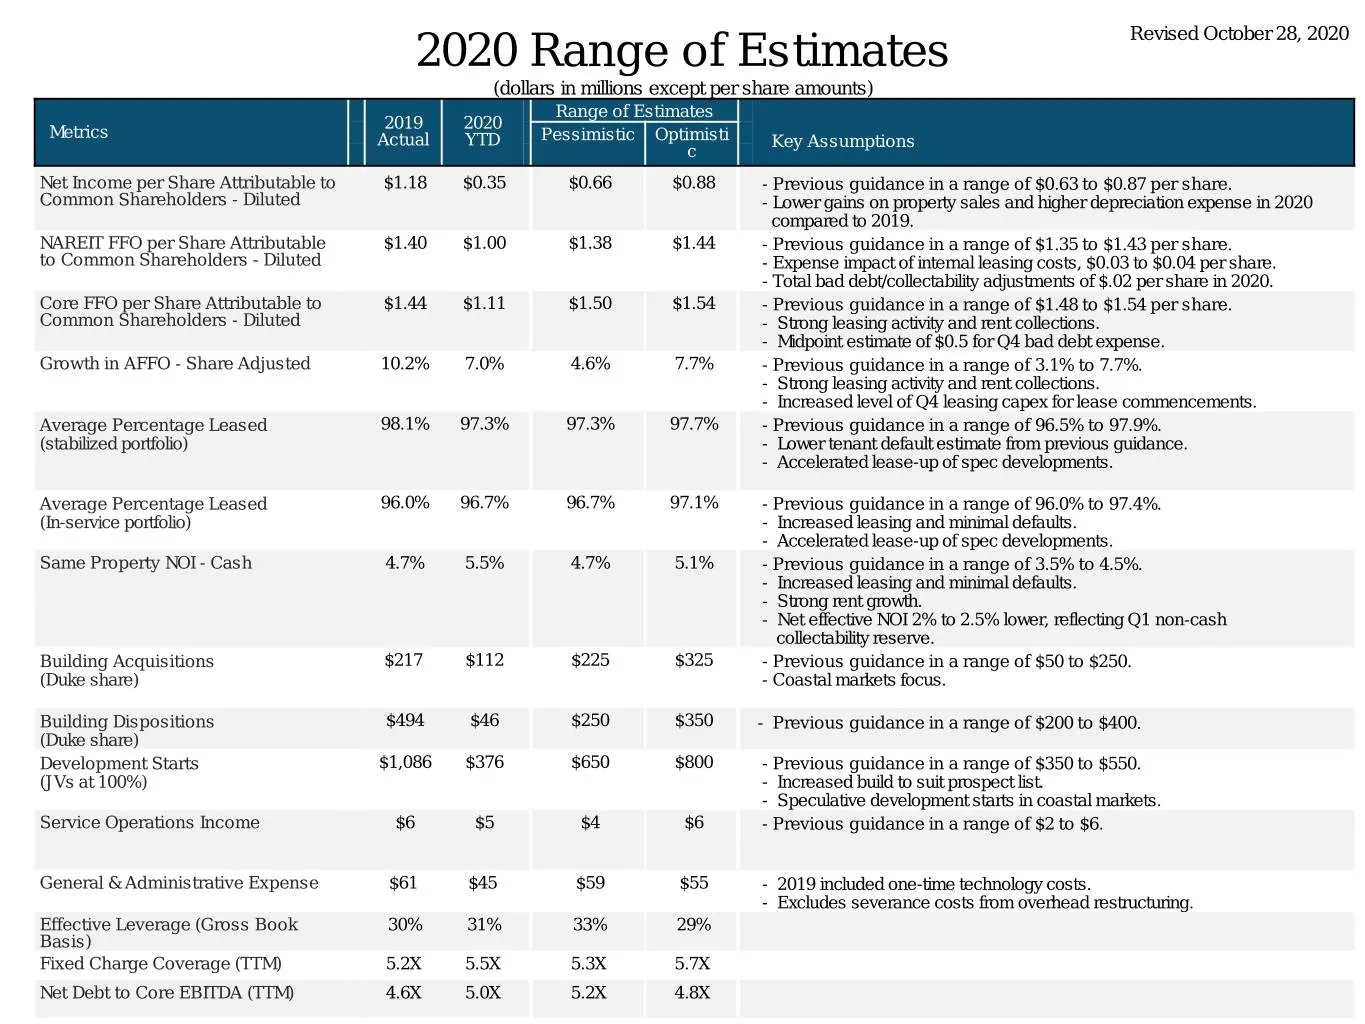
Slide 42: 2020 Range of Estimates Revised October 28, 2020
2020 Range of Estimates Revised October 28, 2020 (dollars in millions except per share amounts) Range of Estimates 2019 2020 Metrics Actual YTD Pessimistic Optimisti Key Assumptions c Net Income per Share Attributable to $1.18 $0.35 $0.66 $0.88 - Previous guidance in a range of $0.63 to $0.87 per sh
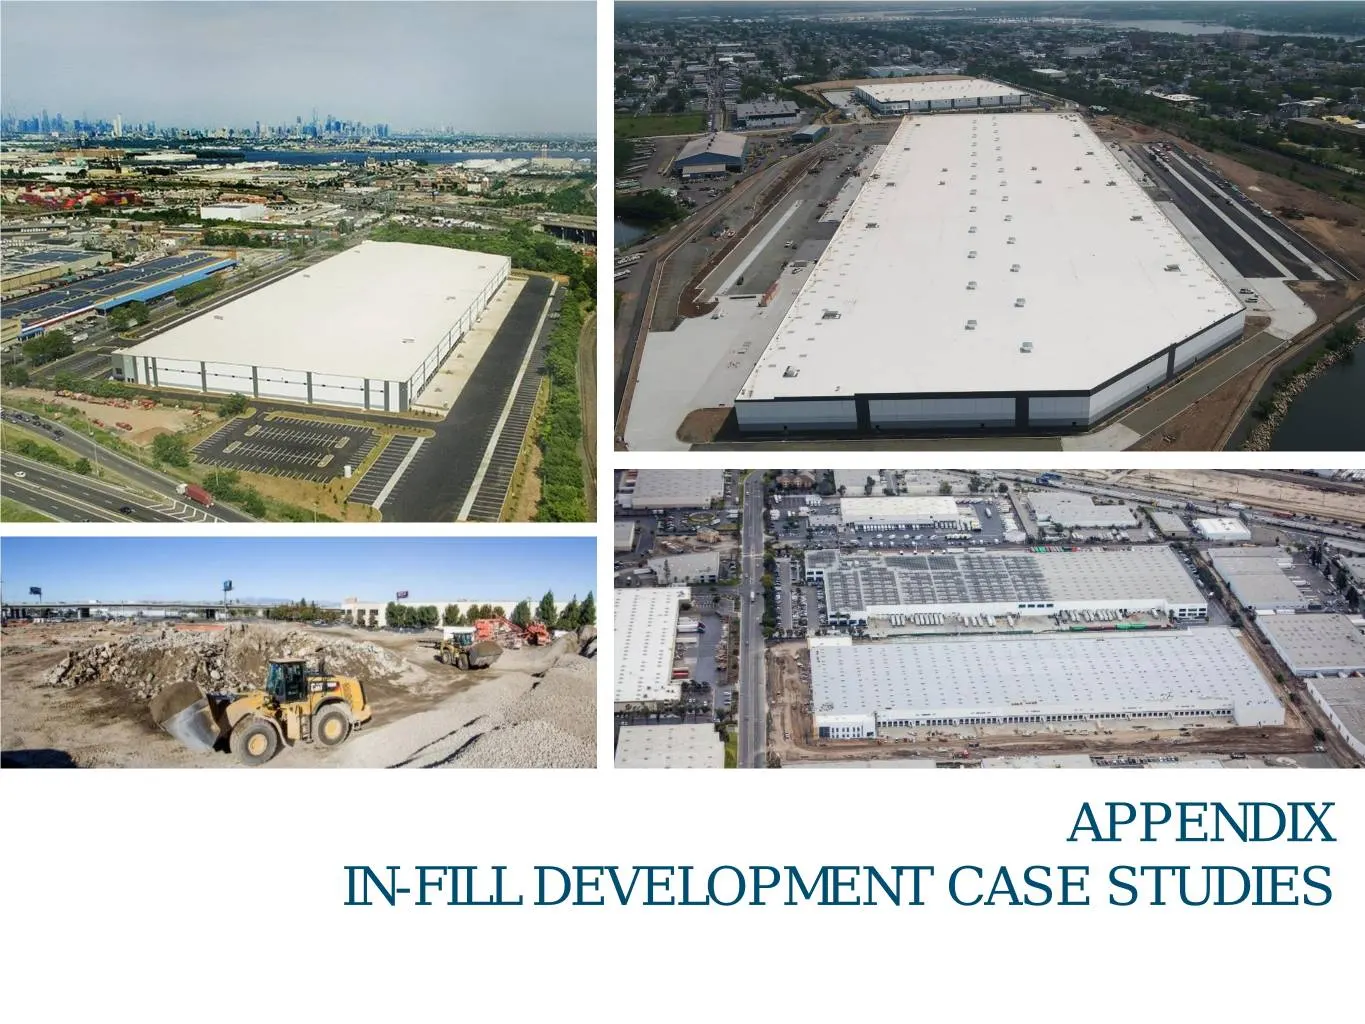
Slide 43: Appendix: Infill Development Case Studies
Lockport 16328 / 16410 / 16508 (3 buildings, 803,000 SF), I-55 Submarket, Chicago, IL APPENDIX IN-FILL DEVELOPMENT CASE STUDIES
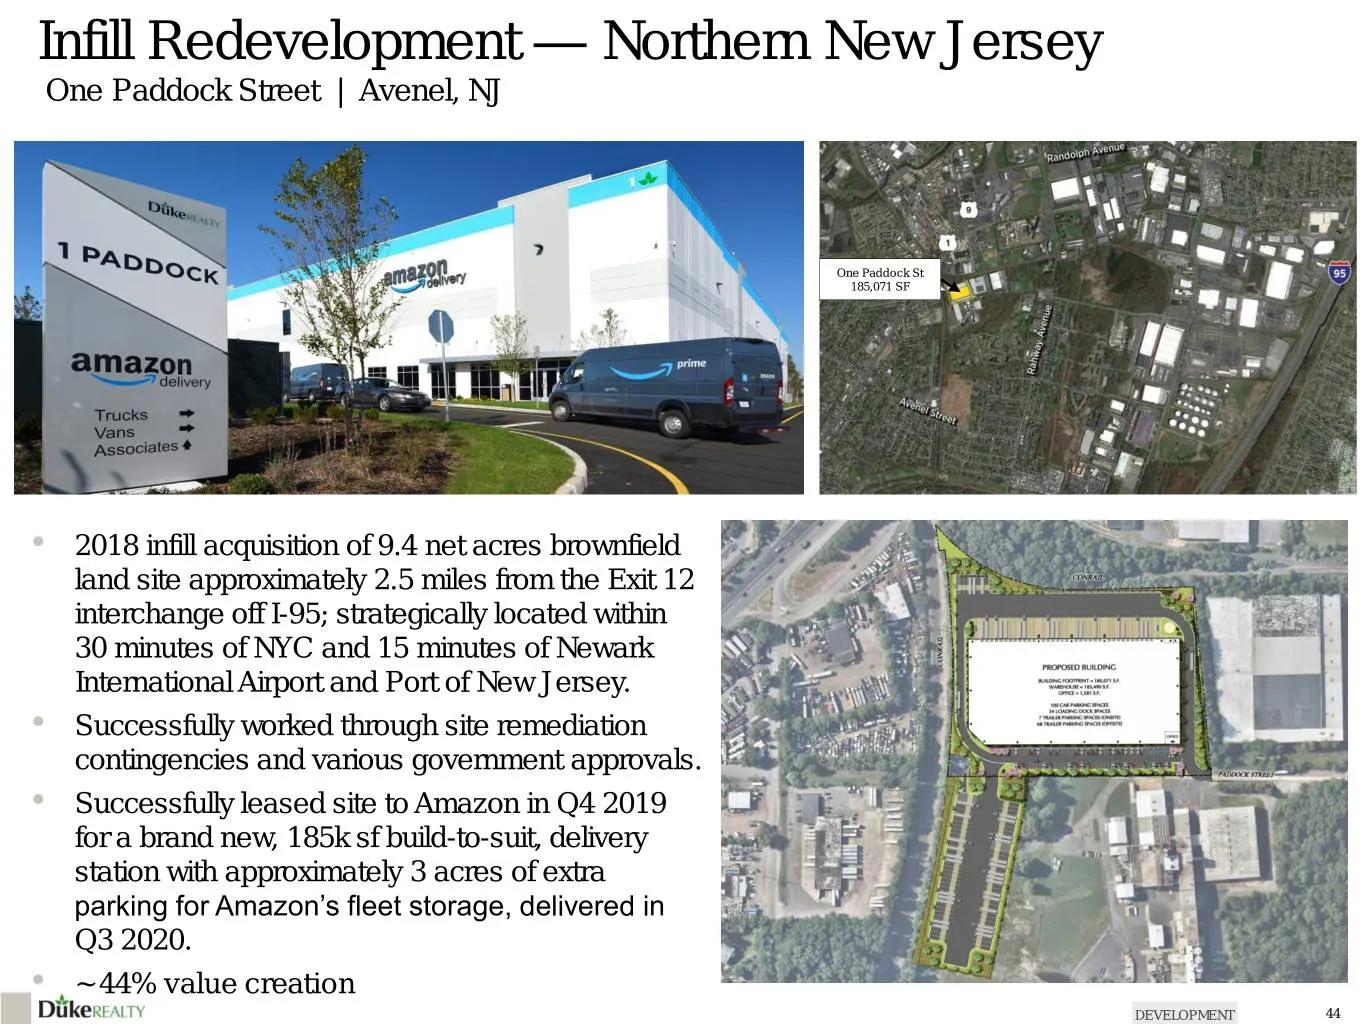
Slide 44: Infill Redevelopment — Northern New Jersey
Infill Redevelopment — Northern New Jersey One Paddock Street | Avenel, NJ One Paddock St 185,071 SF • 2018 infill acquisition of 9.4 net acres brownfield land site approximately 2.5 miles from the Exit 12 interchange off I-95; strategically located within 30 minutes of NYC and 15 minutes of Newark
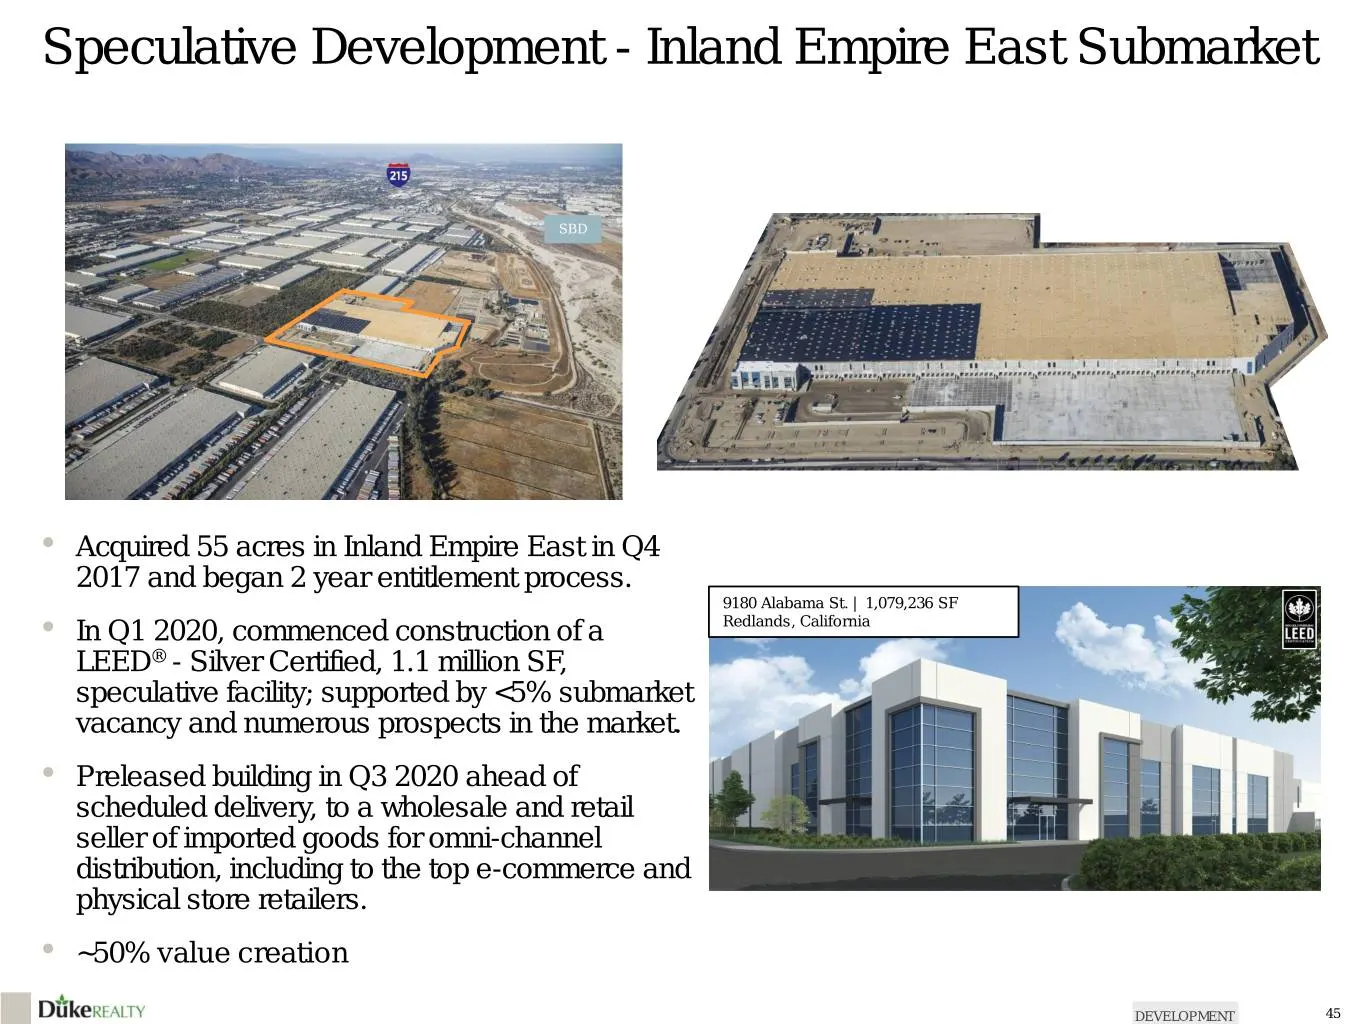
Slide 45: Speculative Development - Inland Empire East Submarket
Speculative Development - Inland Empire East Submarket SBD • Acquired 55 acres in Inland Empire East in Q4 2017 and began 2 year entitlement process. 9180 Alabama St. | 1,079,236 SF • In Q1 2020, commenced construction of a Redlands, California LEED® - Silver Certified, 1.1 million SF, speculative f
Slide 46: Infill Redevelopment – Northern New Jersey
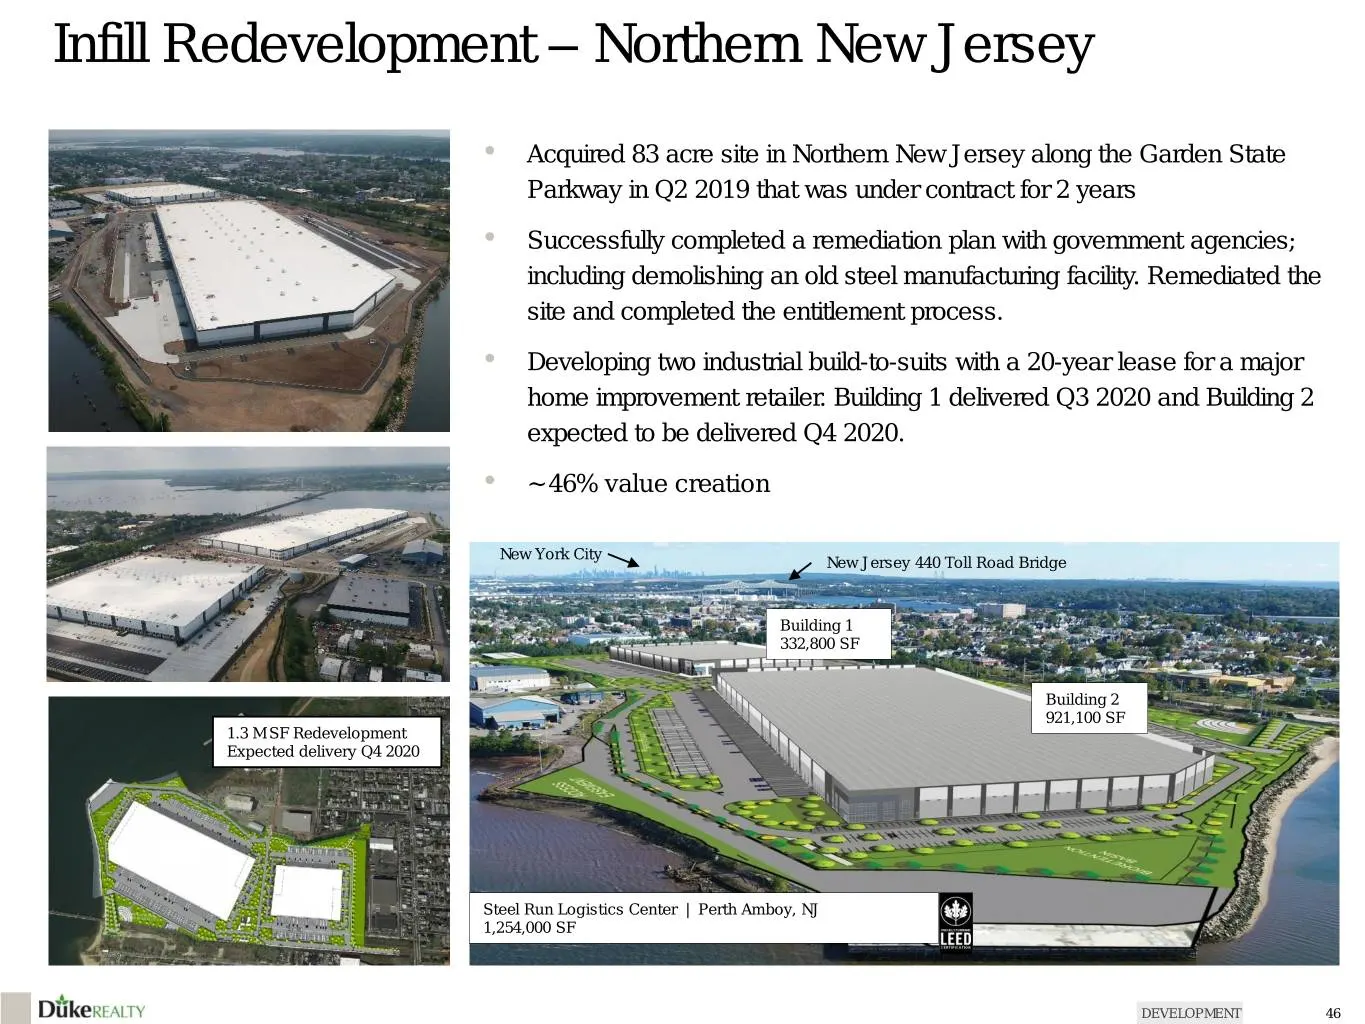
Infill Redevelopment – Northern New Jersey • Acquired 83 acre site in Northern New Jersey along the Garden State Parkway in Q2 2019 that was under contract for 2 years • Successfully completed a remediation plan with government agencies; including demolishing an old steel manufacturing facility. Rem
Slide 47: Infill Redevelopment – Northern New Jersey
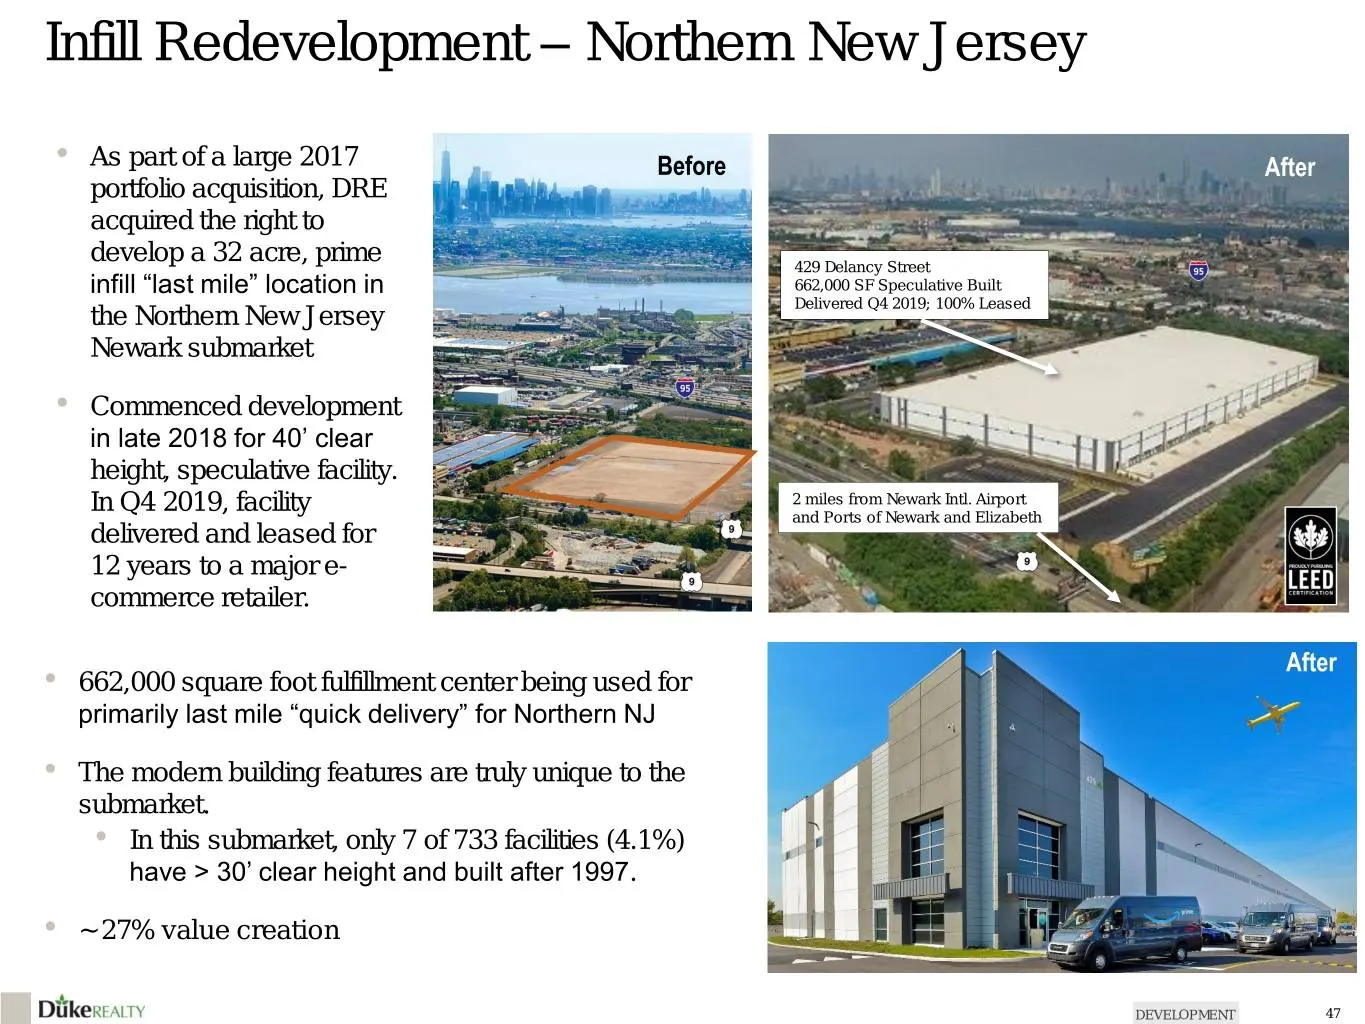
Infill Redevelopment – Northern New Jersey • As part of a large 2017 Before After portfolio acquisition, DRE acquired the right to develop a 32 acre, prime 429 Delancy Street infill “last mile” location in 662,000 SF Speculative Built the Northern New Jersey Delivered Q4 2019; 100% Leased Newark sub
Slide 48: Infill Redevelopment – Southern California
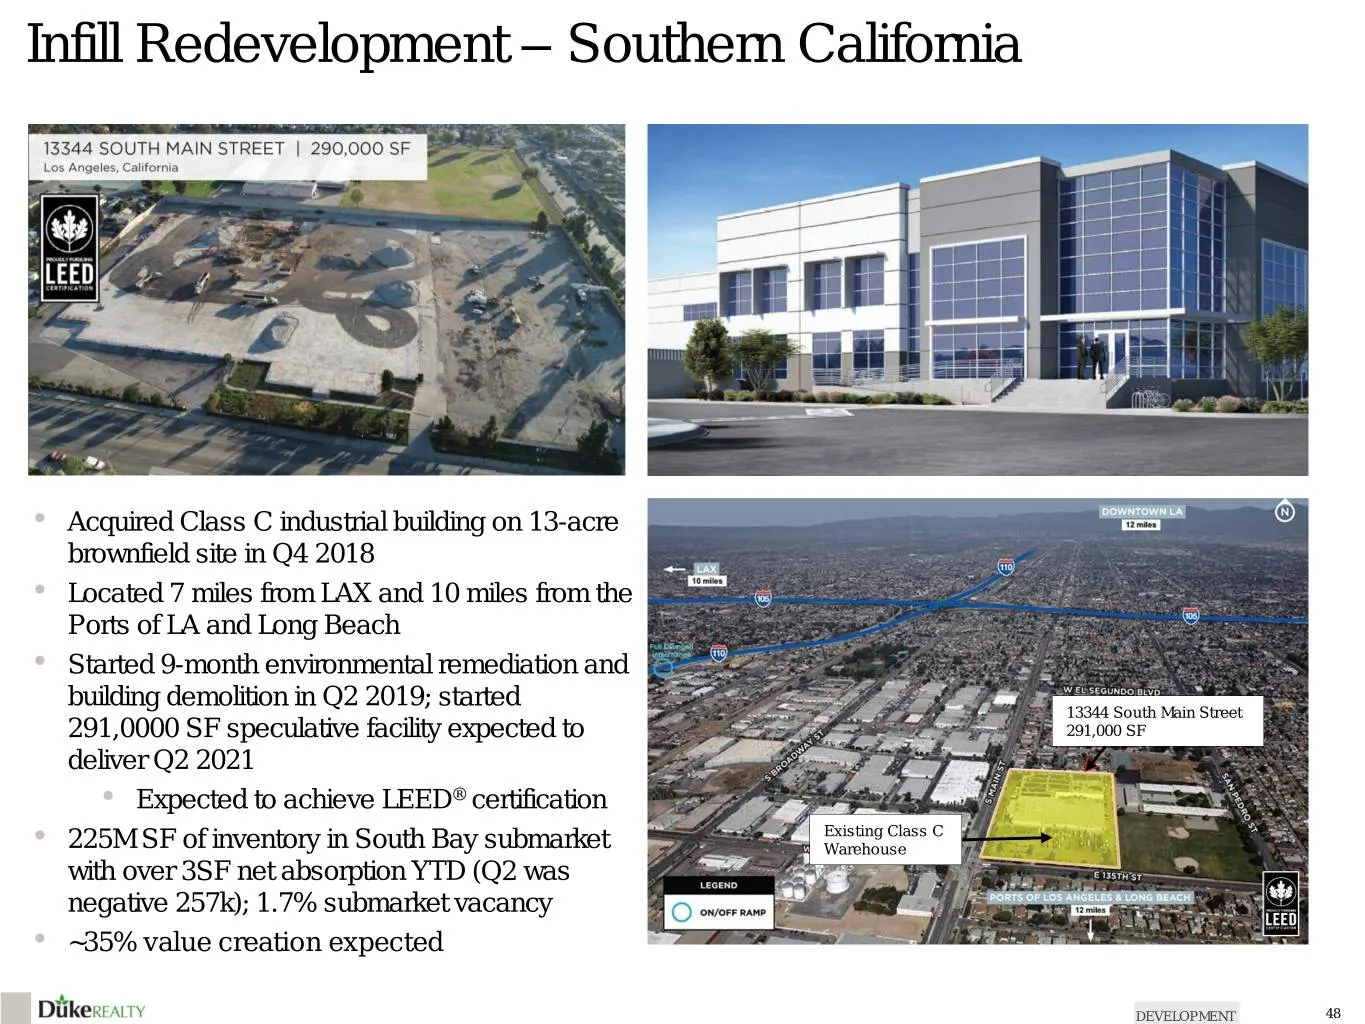
Infill Redevelopment – Southern California • Acquired Class C industrial building on 13-acre brownfield site in Q4 2018 • Located 7 miles from LAX and 10 miles from the Ports of LA and Long Beach • Started 9-month environmental remediation and building demolition in Q2 2019; started 13344 South Main
Slide 49: Infill Build-to-Suit Developments – Atlanta Airport
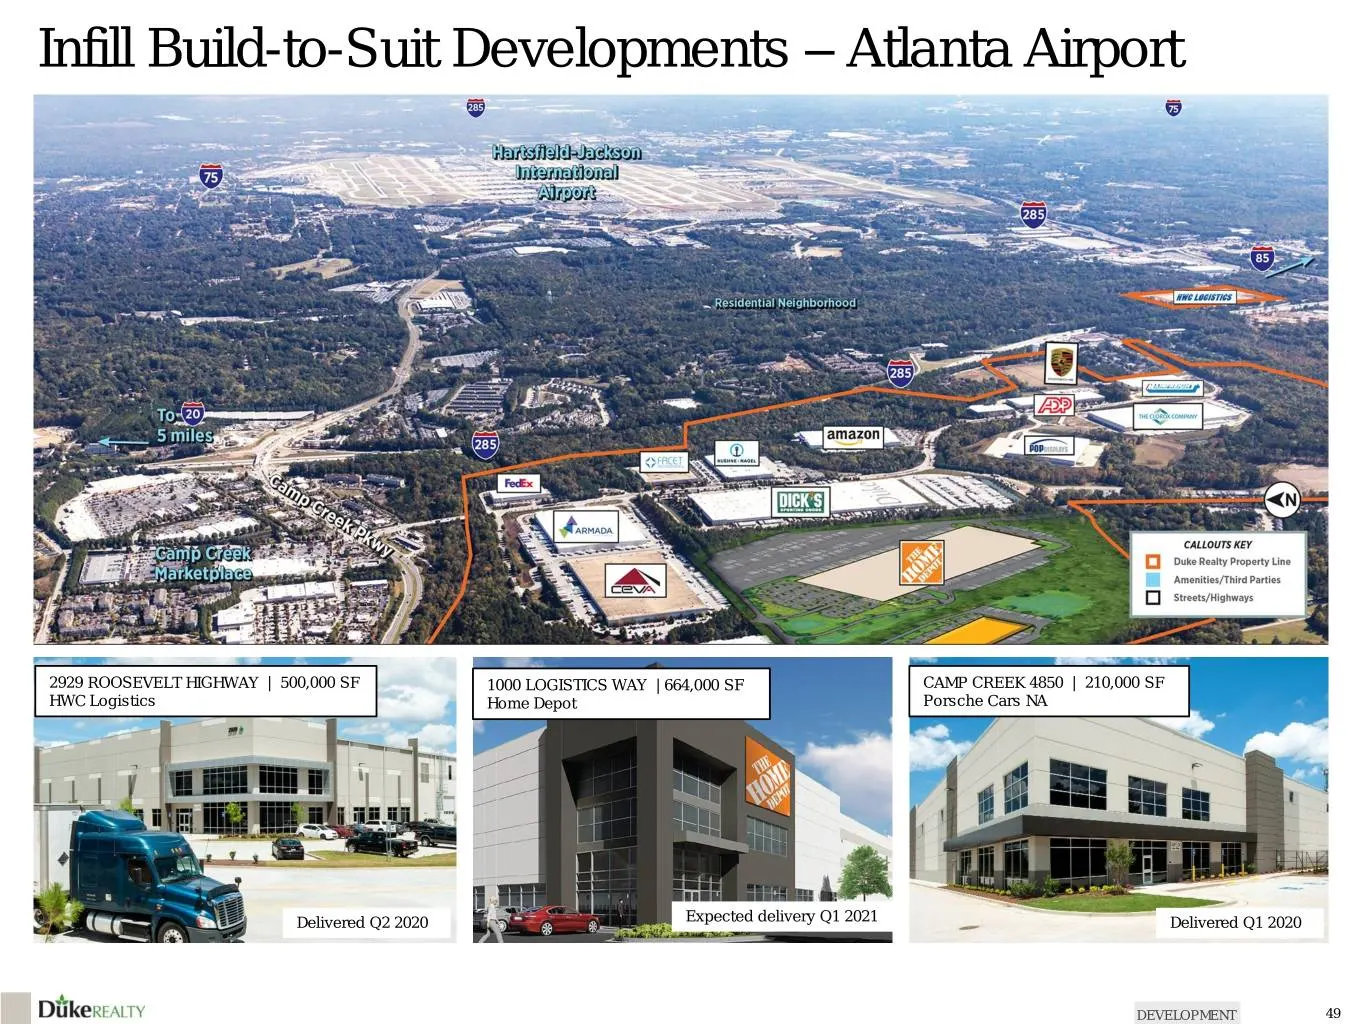
Infill Build-to-Suit Developments – Atlanta Airport 2929 ROOSEVELT HIGHWAY | 500,000 SF 1000 LOGISTICS WAY | 664,000 SF CAMP CREEK 4850 | 210,000 SF HWC Logistics Home Depot Porsche Cars NA Delivered Q2 2020 Expected delivery Q1 2021 Delivered Q1 2020 DEVELOPMENT 49
Slide 50: Infill Redevelopment – Northern New Jersey
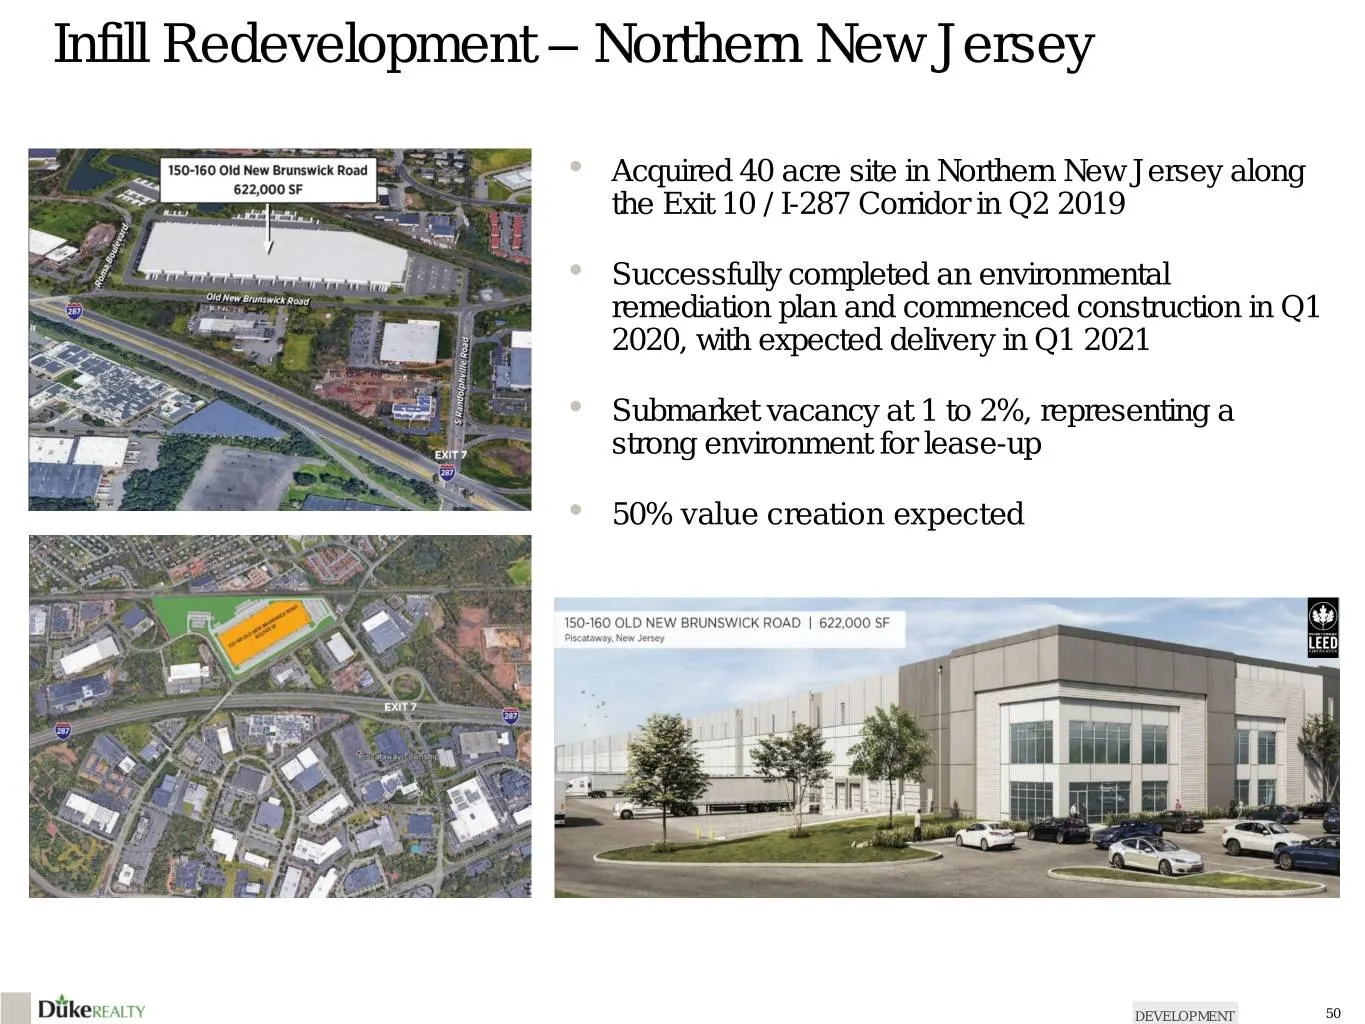
Infill Redevelopment – Northern New Jersey • Acquired 40 acre site in Northern New Jersey along the Exit 10 / I-287 Corridor in Q2 2019 • Successfully completed an environmental remediation plan and commenced construction in Q1 2020, with expected delivery in Q1 2021 • Submarket vacancy at 1 to 2%,
Slide 51: Speculative Development - Inland Empire East Submarket
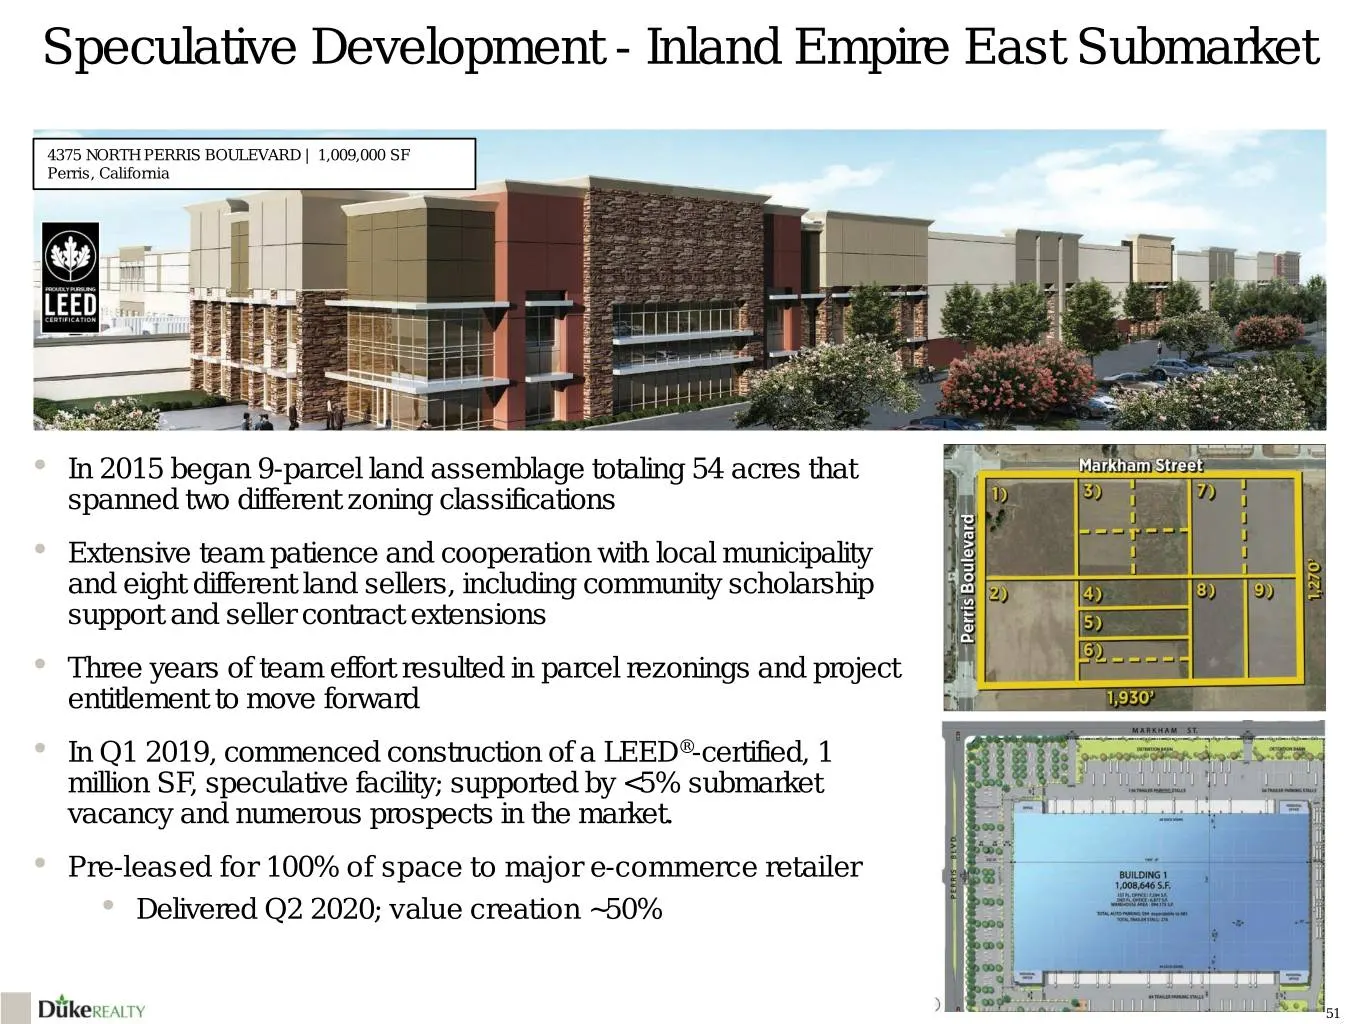
Speculative Development - Inland Empire East Submarket 4375 NORTH PERRIS BOULEVARD | 1,009,000 SF Perris, California • In 2015 began 9-parcel land assemblage totaling 54 acres that spanned two different zoning classifications • Extensive team patience and cooperation with local municipality and eigh
Slide 52: Infill Redevelopment – Northern California
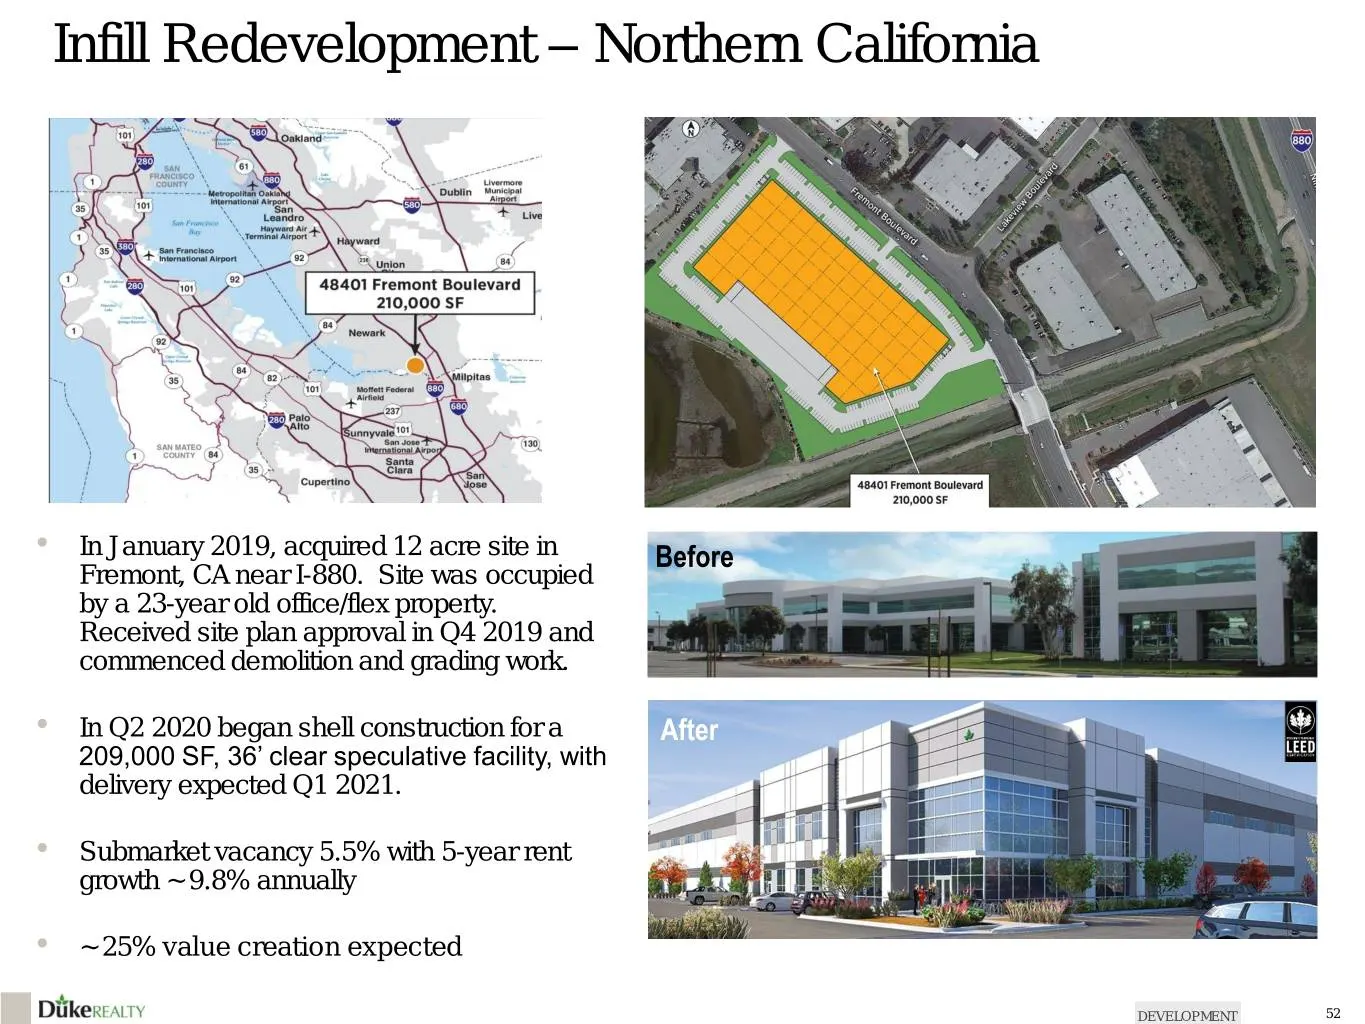
Infill Redevelopment – Northern California • In January 2019, acquired 12 acre site in Before Fremont, CA near I-880. Site was occupied by a 23-year old office/flex property. Received site plan approval in Q4 2019 and commenced demolition and grading work. • In Q2 2020 began shell construction for a
Slide 53: Infill Redevelopments – Southern California
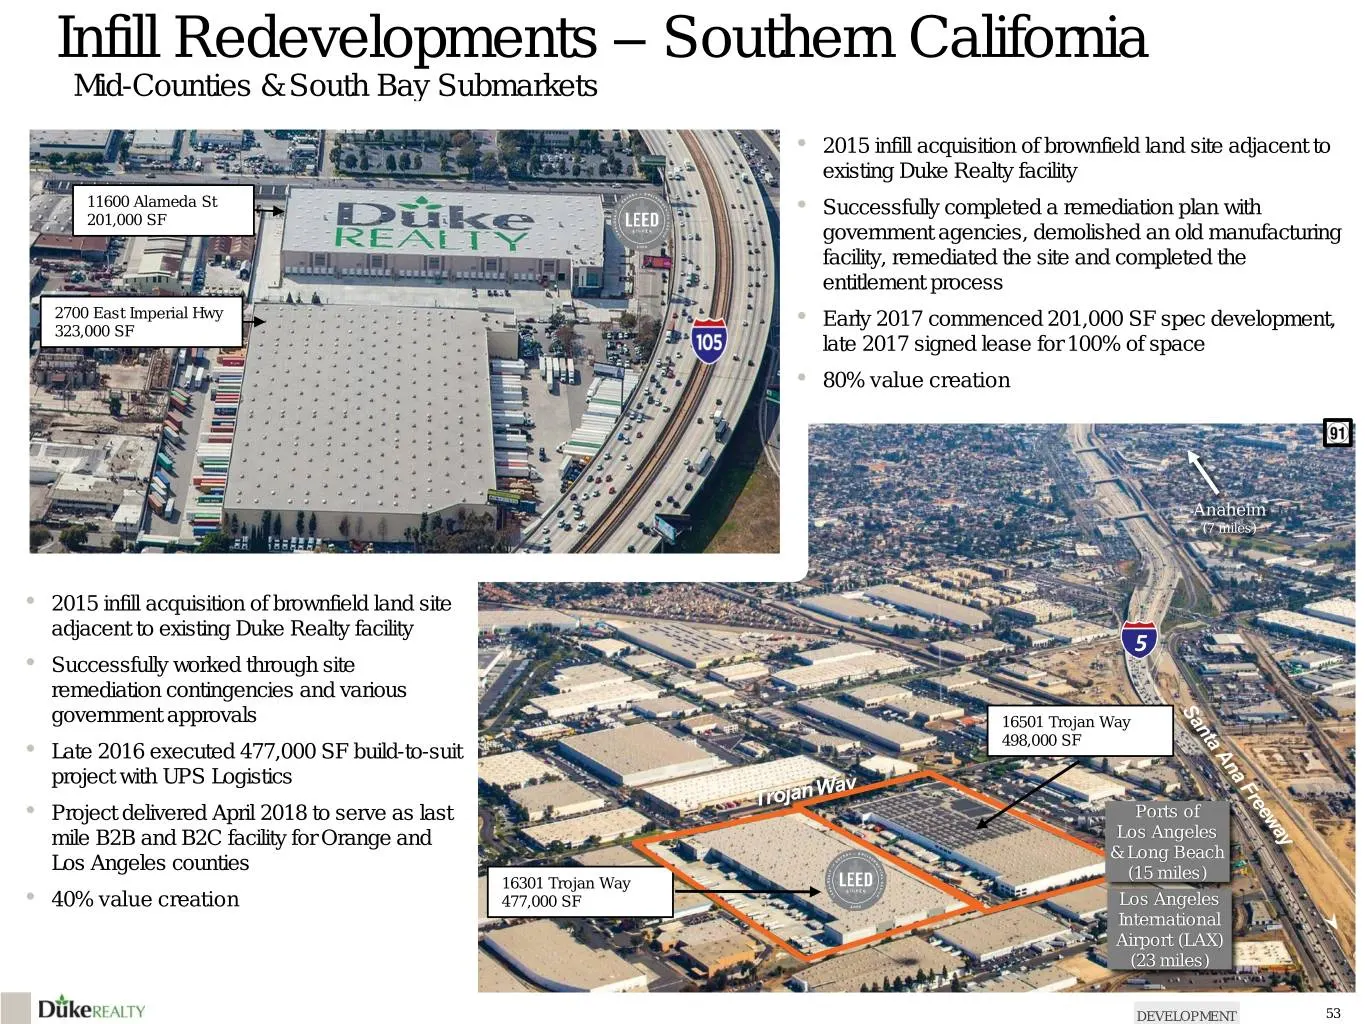
Infill Redevelopments – Southern California Mid-Counties & South Bay Submarkets • 2015 infill acquisition of brownfield land site adjacent to existing Duke Realty facility 11600 Alameda St • Successfully completed a remediation plan with 201,000 SF government agencies, demolished an old manufacturin
Slide 54: Definitions: Supplemental Performance Measures
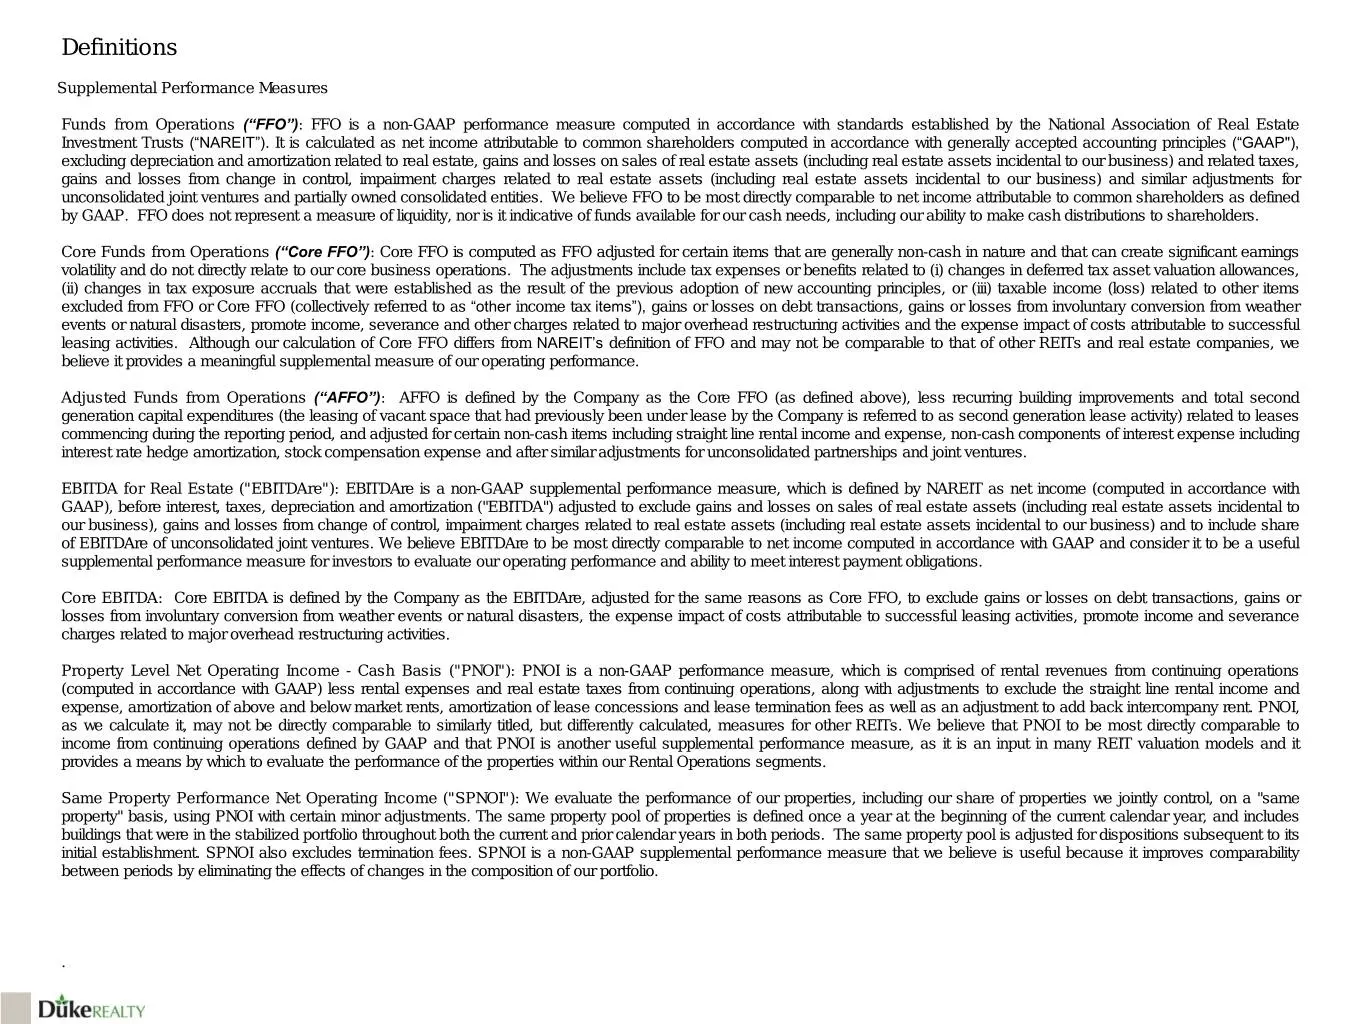
Definitions Supplemental Performance Measures Funds from Operations (“FFO”): FFO is a non-GAAP performance measure computed in accordance with standards established by the National Association of Real Estate Investment Trusts (“NAREIT”). It is calculated as net income attributable to common sharehol
Slide 55: FFO, Core FFO and AFFO
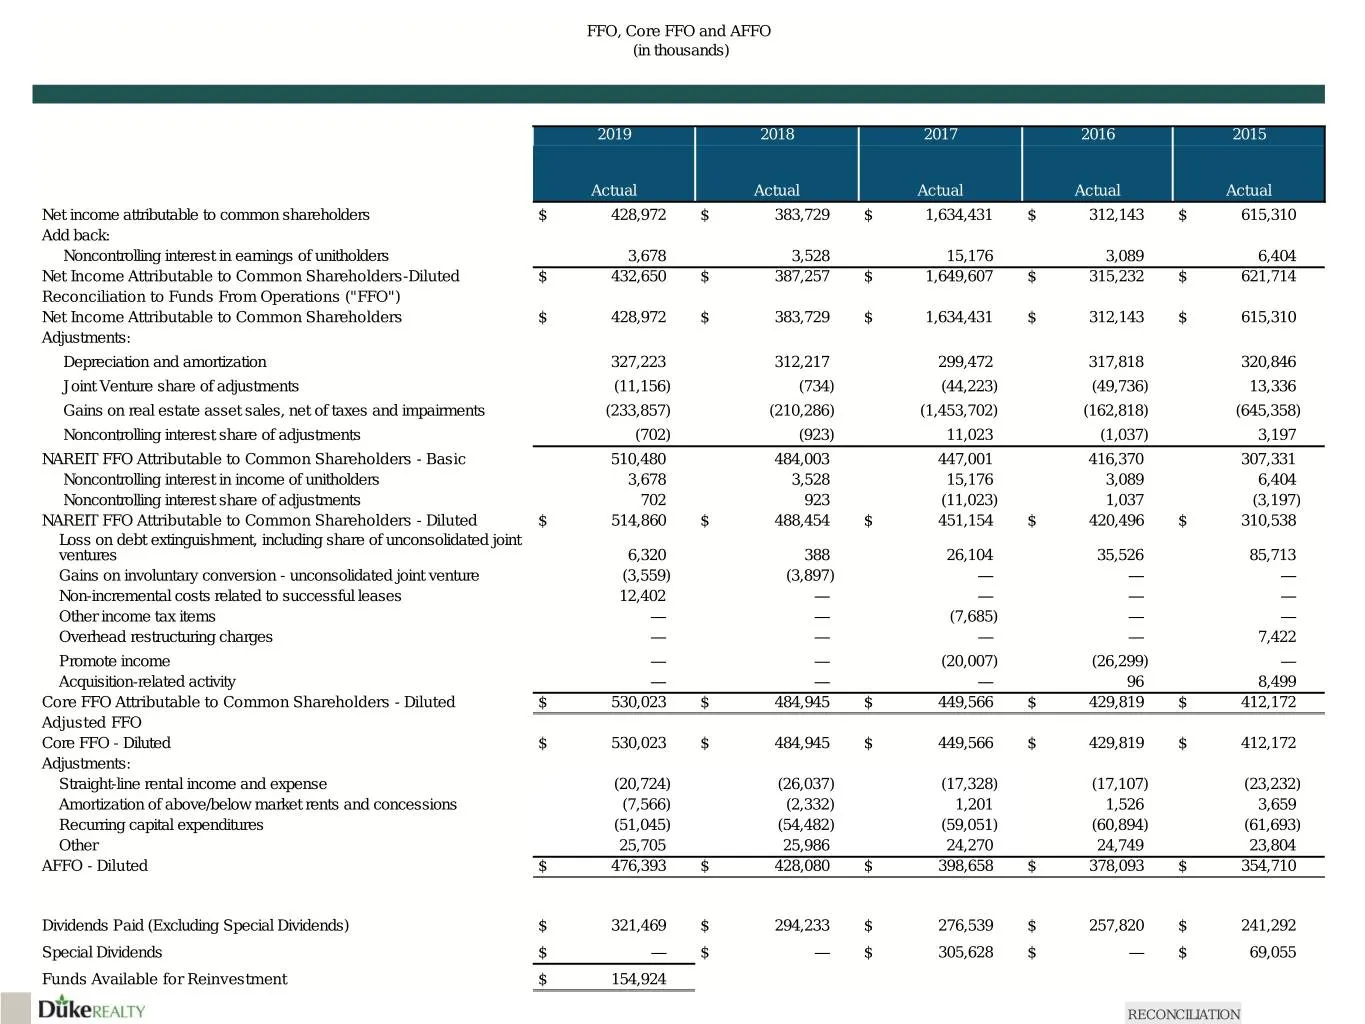
FFO, Core FFO and AFFO (in thousands) 2019 2018 2017 2016 2015 Actual Actual Actual Actual Actual Net income attributable to common shareholders $ 428,972 $ 383,729 $ 1,634,431 $ 312,143 $ 615,310 Add back: Noncontrolling interest in earnings of unitholders 3,678 3,528 15,176 3,089 6,404 Net Income
Slide 56: Reconciliation of 2020 FFO Per Diluted Share Guidance
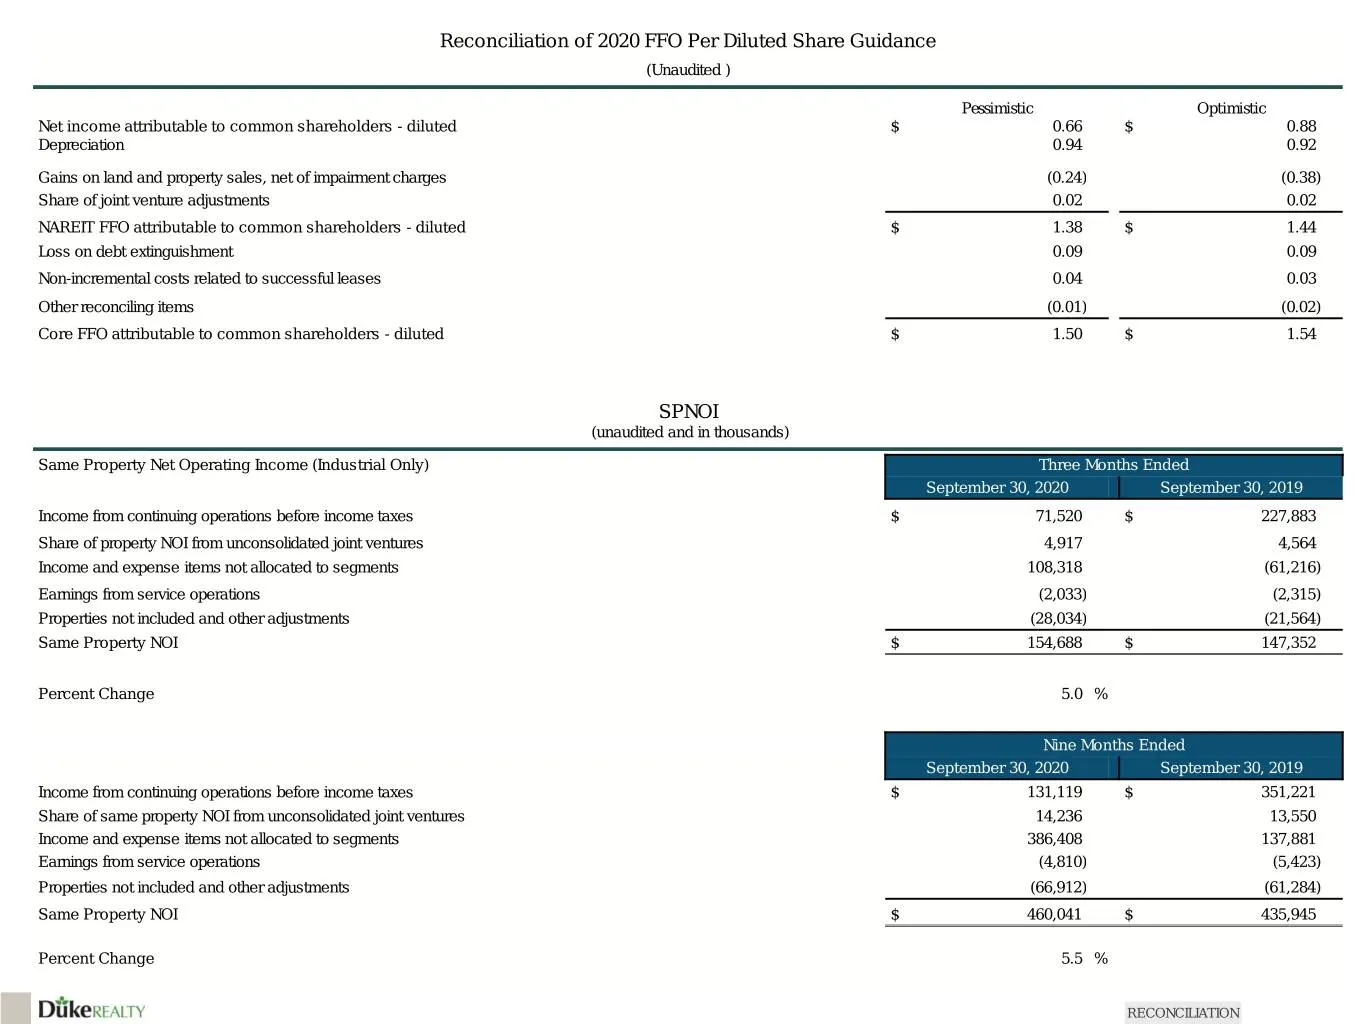
Reconciliation of 2020 FFO Per Diluted Share Guidance (Unaudited ) Pessimistic Optimistic Net income attributable to common shareholders - diluted $ 0.66 $ 0.88 Depreciation 0.94 0.92 Gains on land and property sales, net of impairment charges (0.24) (0.38) Share of joint venture adjustments 0.02 0.
Source: SEC EDGAR · 8-K filed Nov 16, 2020
More decks from Duke Realty Corporation
 Merger or Acquisition (June 2022)14 slides · Jun 13, 2022
 Investor Presentation (June 2021)58 slides · Jun 7, 2021
 Investor Presentation (May 2021)44 slides · May 10, 2021
 Investor Presentation (February 2021)58 slides · Feb 22, 2021
 B of A Securities 2020 Global Real Estate Conference56 slides · Sep 15, 2020
 Q2 2020 Earnings Presentation56 slides · Aug 24, 2020