Susquehanna Bancshares — Investor Presentation (November 2009)
22 slides from Susquehanna Bancshares's investor presentation, Nov 12, 2009

Slide 1: Exhibit 99.1
Exhibit 99.1
Slide 2: Susquehanna Profile
Susquehanna Profile Susquehanna Profile Overview Geography Size Shareholder base 221 branches in PA, NJ, MD, WV $13.7 billion in assets $8.9 billion in deposits $6.2 billion in assets under management & administration 86.4 million shares outstanding 28,100 shareholders (record and street) 47% instit
Slide 3: Susquehanna Branch Footprint
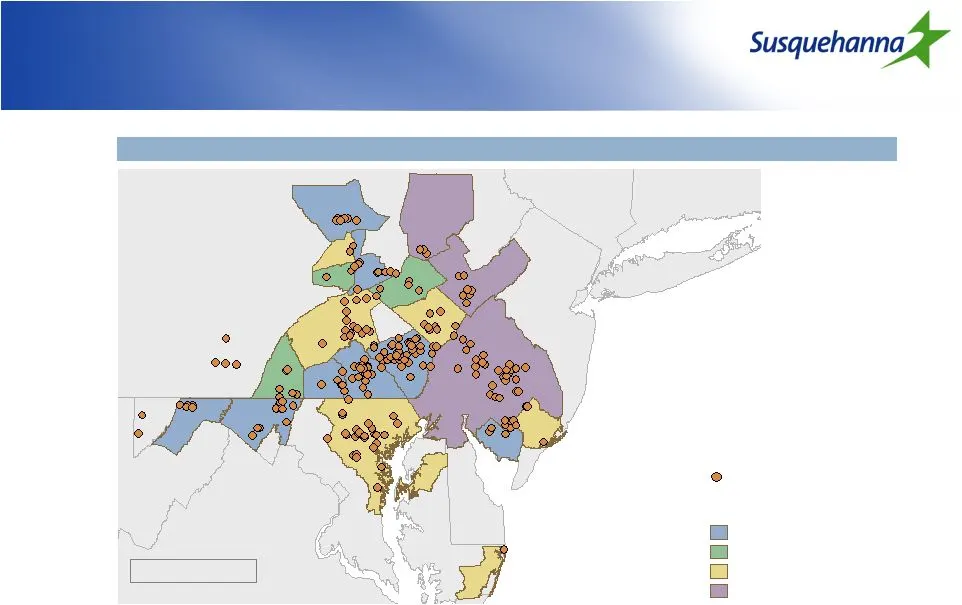
Susquehanna Branch Footprint Susquehanna Branch Footprint PA WV VA DC MD DE NJ NY CT SUSQ MSA rank by market share 1–3 4–6 7–10 10+ No. of branches
Slide 4: Susquehanna Demographics
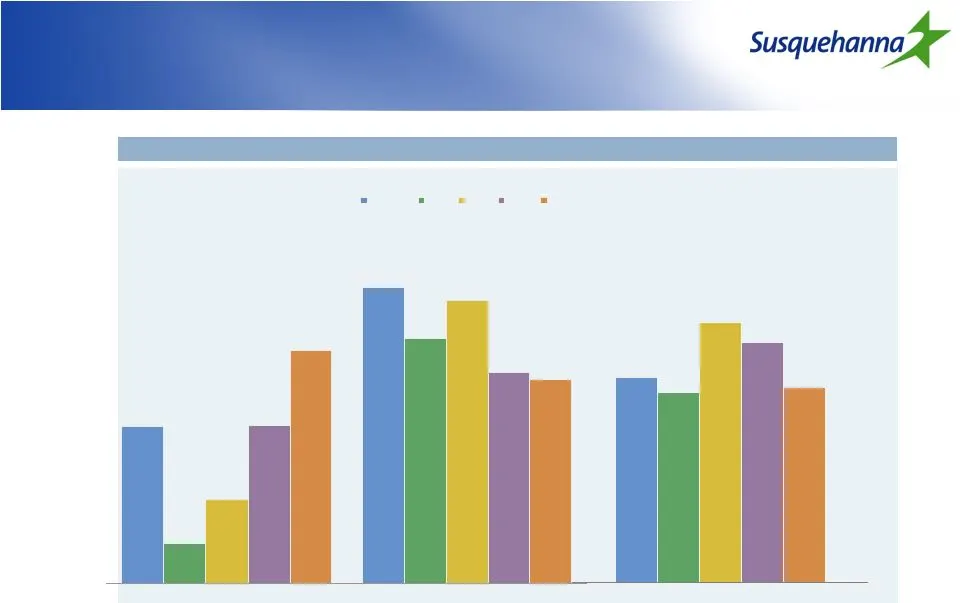
Susquehanna Demographics Susquehanna Demographics 3.1% 5.9% 0.8% 4.9% 1.7% 5.6% 3.1% 4.2% 4.6% 4.1% Population growth 2009 - 2014 Median HH income growth 2009 - 2014 SUSQ PA NJ MD US $57,512 $72,809 $53,225 $67,267 $54,719 Median HH income 2009
Slide 5: Susquehanna
Susquehanna
Slide 6: Improved Market Position Across Franchise
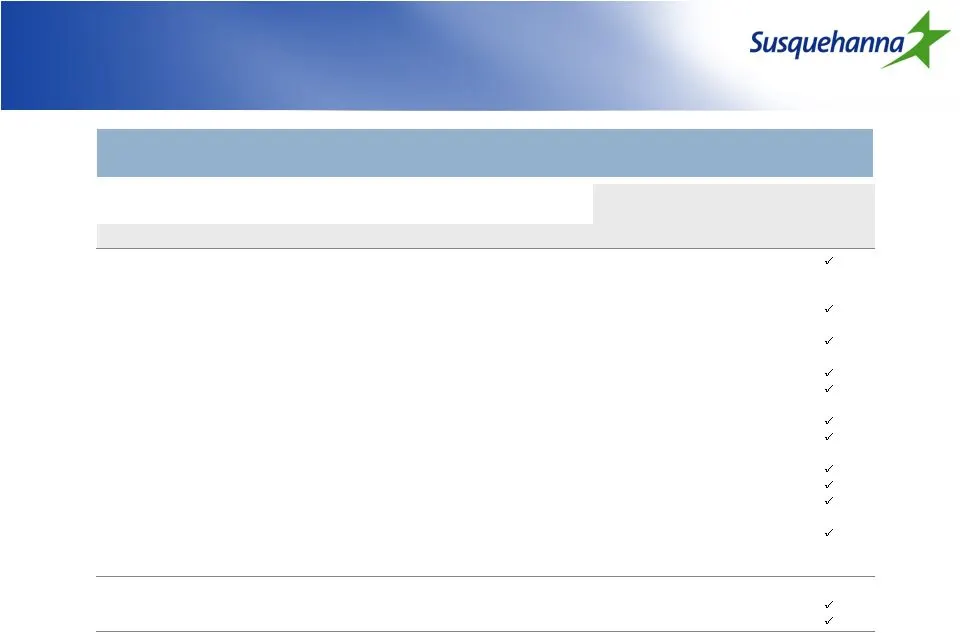
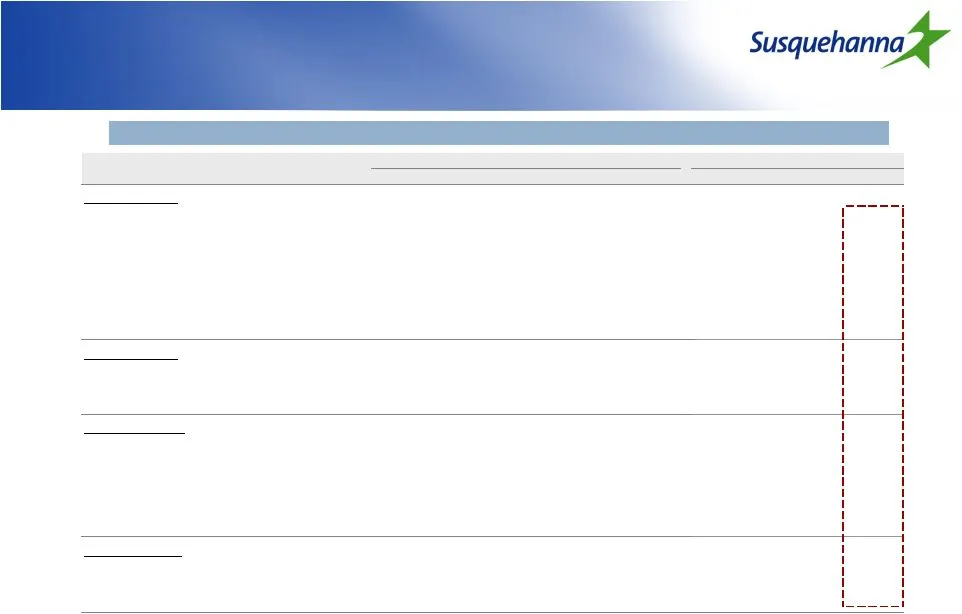
Improved Market Position Across Franchise Sorted by 2009 market rank Improved Market Position Across Franchise Market share MSA rank by market share MSA 2004 2009 % change 2004 2009 Change Current rank 1-3 Hagerstown-Martinsburg, MD-WV 19.0% 18.7% (0.3%) Flat Sunbury, PA 17.6% 22.9% 5.4% + 1 Cumberl
Slide 7: Loan Composition 09/30/09
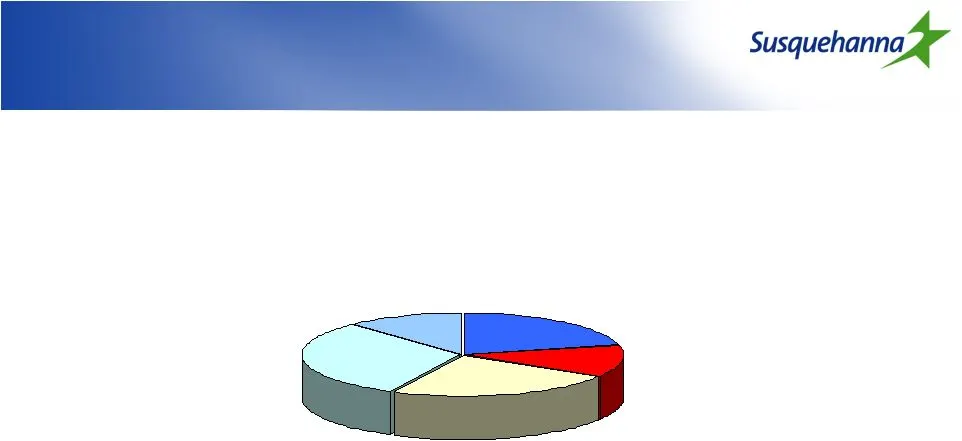
Loan Composition 09/30/09 Total Loans $9,863,705 Yield = 5.66% Loan Composition 09/30/09 Total Loans $9,863,705 Yield = 5.66% Real estate secured - commercial 31% Real estate secured - residential 24% Real estate construction 12% Commercial, financial and agricultural 21% Consumer & leases 12%

Slide 8: Loan Trends
Loan Trends Loan Trends % Increase/ 9/30/2008 12/31/2008 3/31/2009 6/30/2009 9/30/2009 (Decrease) Commercial, financial and agricultural 1,987,149 2,063,942 2,222,518 2,138,732 2,096,869 5.5 Real estate construction 1,305,935 1,313,647 1,308,187 1,282,201 1,208,706 (7.4) Real estate secured -residen
Slide 9: Deposit Composition 09/30/09
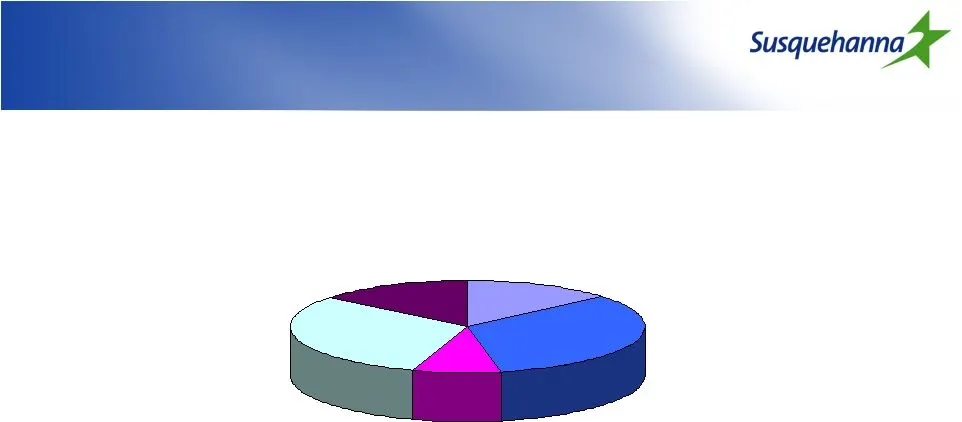
Deposit Composition 09/30/09 Total Deposits $8,900,313 Yield = 1.69% Deposit Composition 09/30/09 Total Deposits $8,900,313 Yield = 1.69% Interest-bearing demand 33% Savings 8% Time <$100 31% Time >$100 14% Demand 14%

Slide 10: Deposit Trends
Deposit Trends Deposit Trends % Increase/ 9/30/2008 12/31/2008 3/31/2009 6/30/2009 9/30/2009 (Decrease) Demand 1,228,255 1,201,416 1,242,979 1,253,124 1,210,770 (1.4) Interest-bearing demand 2,446,467 2,528,475 2,780,871 2,831,315 2,962,307 21.1 Savings 712,930 695,275 731,166 746,164 724,487 1.6 Co

Slide 11: Earnings Trends
Earnings Trends Earnings Trends 1st Q 2nd Q 3rd Q 4th Q 1st Q 2nd Q 3rd Q Net Interest Margin (FTE) 3.71% 3.66% 3.60% 3.52% 3.40% 3.52% 3.64% In-Market Peer Average 3.48% 3.50% 3.53% 3.45% 3.17% 3.27% 3.38% Core Pre-Provision, Pre-Tax Income (In millions) 49.1 53.4 52.0 48.4 35.8 40.9 49.2 2008 2009

Slide 12: Summary of Credit Metrics
Summary of Credit Metrics Summary of Credit Metrics $ In thousands 1Q 2Q 3Q 4Q 1Q 2Q 3Q Provisions 9,837 13,765 17,704 22,525 35,000 50,000 48,000 Net charge-offs (NCO) 5,411 10,726 8,162 14,351 16,584 24,648 36,946 Non-performing assets (NPA) 91,991 91,516 109,285 118,192 169,236 255,962 280,041 Re

Slide 13: Aggressive actions taken to offset weak economic backdrop
Aggressive actions taken to offset weak economic backdrop Aggressive actions taken to offset weak economic backdrop Redesigned processes to handle weak economic outlook Loan Review was divided into two groups Work-Out Department (Credit Risk Management) divided to focus on small and large non-accrui

Slide 14: Credit Migration by Portfolio Type
Credit Migration by Portfolio Type Credit Migration by Portfolio Type Non-performing Loans 12/31/2007 12/31/2008 3/31/2009 6/30/2009 9/30/2009 Commercial, financial and agricultural 0.29 0.80 1.23 1.18 1.03 Real estate construction 1.62 3.79 5.49 8.05 8.49 Real estate secured -residential 0.55 0.79

Slide 15: Summary of Liquidity Position
Summary of Liquidity Position Summary of Liquidity Position Liquidity management team regularly monitors performance and outlook Strong liquidity position despite adverse economic environment Continues to renew and attract core funding at market rates Liquid and conservatively invested securities po

Slide 16: Wholesale Funding
Wholesale Funding Wholesale Funding As of September 30, 2009 Unused (In billions) Capacity Outstanding Capacity Brokered CDs $ 0.9 $ 0.0 $ 0.9 FRB - Discount Window 0.8 0.4 0.4 Federal Funds Purchased 1.3 0.2 1.1 FHLB Advances 2.1 1.0 1.1 Subtotal $ 5.1 $ 1.6 $ 3.5 Repos 0.4 Long-term Debt Other 0.2

Slide 17: Securities Portfolio
Securities Portfolio Securities Portfolio At September 30, 2009 Amortized Fair (In millions) Cost Value Difference Available-for-sale: U.S. Government agencies $277.8 $284.8 $7.0 State and municipal 347.2 359.7 12.5 Agency residential mortgage-backed 646.6 675.4 28.8 Non-agency residential mortgage-

Slide 18: Other-Than-Temporary Impairment
Other-Than-Temporary Impairment Other-Than-Temporary Impairment (In thousands) 1Q 2Q 3Q 4Q 1Q 2Q 3Q Portfolio Balance $2,043,217 $2,033,509 $2,039,590 $1,879,891 $1,851,155 $1,789,267 $1,822,895 OTTI Charge 17,550 OTTI as a % of Investments 0.00% 0.00% 0.86% 0.00% 0.00% 0.05% 0.00% In market peer av

Slide 19: Capital Ratios
Capital Ratios Capital Ratios 12/31/2007 12/31/2008 3/31/2009 6/30/2009 9/30/2009 Tangible Common Equity / Tangible Assets 6.0 4.6 4.5 4.6 4.9 Tier 1 Common Capital 6.8 6.1 6.0 5.9 5.9 Tier 1 9.2 11.2 11.1 11.0 11.1 Total Risk-based Capital 11.3 13.5 13.7 13.4 13.5 Leverage 8.2 9.9 9.8 9.6 9.7 %

Slide 20: Stress Test – Capital Ratios
Stress Test – Capital Ratios Stress Test – Capital Ratios Base Stress Stress Case Case Limit Estimated Credit Losses for 2010 ( In millions) 88.0 205.0 285.0 Capital Ratios (December 31, 2010) Tangible Common Equity / Tangible Assets 5.1 4.5 4.2 Tier 1 Common Capital 6.1 5.4 5.2 Tier 1 10.8 10.2 10.

Slide 21: Reasons to Invest in Susquehanna
Reasons to Invest in Susquehanna Reasons to Invest in Susquehanna Diversified financial holding company Comparatively stable market Do business only in our geographic footprint (Mid-Atlantic) Current stock price less than tangible book value Current stock price not reflective of underlying franchise

Slide 22
Source: SEC EDGAR · 8-K filed Nov 12, 2009
More decks from Susquehanna Bancshares Inc
 Investor Presentation (December 2014)51 slides · Dec 3, 2014
 Merger or Acquisition (November 2014)28 slides · Nov 17, 2014
 Merger or Acquisition (November 2014)13 slides · Nov 12, 2014
 Q2 2014 Earnings Presentation46 slides · Aug 11, 2014
 Investor Presentation (May 2014)44 slides · May 5, 2014
 Shareholder Meeting (May 2014)35 slides · May 2, 2014