Susquehanna Bancshares — Shareholder Meeting (May 2014)
35 slides from Susquehanna Bancshares's shareholder meeting presentation, May 2, 2014

Slide 1: Welcome to the 2014 Annual Shareholders Meeting
Welcome to the 2014 Annual Shareholders Meeting Exhibit 99.1

Slide 2: Pledge of Allegiance
I pledge allegiance to the flag of the United States of America and to the republic for which it stands: one nation under God, indivisible, with liberty and justice for all.

Slide 3: Introductions
Introductions

Slide 4: Executive Leadership Team
Executive Leadership Team • Michael W. Harrington, EVP, Chief Financial Officer and Treasurer • Carl D. Lundblad, EVP and Chief Legal and Administrative Officer • Andrew S. Samuel, President • Kevin J. Burns, EVP and Chief Risk Officer • Gregory A. Duncan, EVP and Chief Operating Officer • Michael M

Slide 5: Voting Instructions
Voting Instructions

Slide 6: Board of Directors Nominees
Board of Directors Nominees Anthony J. Agnone, Sr. Wayne E. Alter, Jr. Henry R. Gibbel Bruce A. Hepburn Donald L. Hoffman Sara G. Kirkland Jeffrey F. Lehman Michael A. Morello Scott J. Newkam Robert E. Poole, Jr. William J. Reuter Andrew S. Samuel Christine Sears James A. Ulsh

Slide 7: Additional Orders of Business
Additional Orders of Business Advisory Vote on Executive Compensation Ratification of PricewaterhouseCoopers LLP as Independent Registered Public Accountants

Slide 8: Voting
Voting
Slide 9: Susquehanna Learning & Resource Center
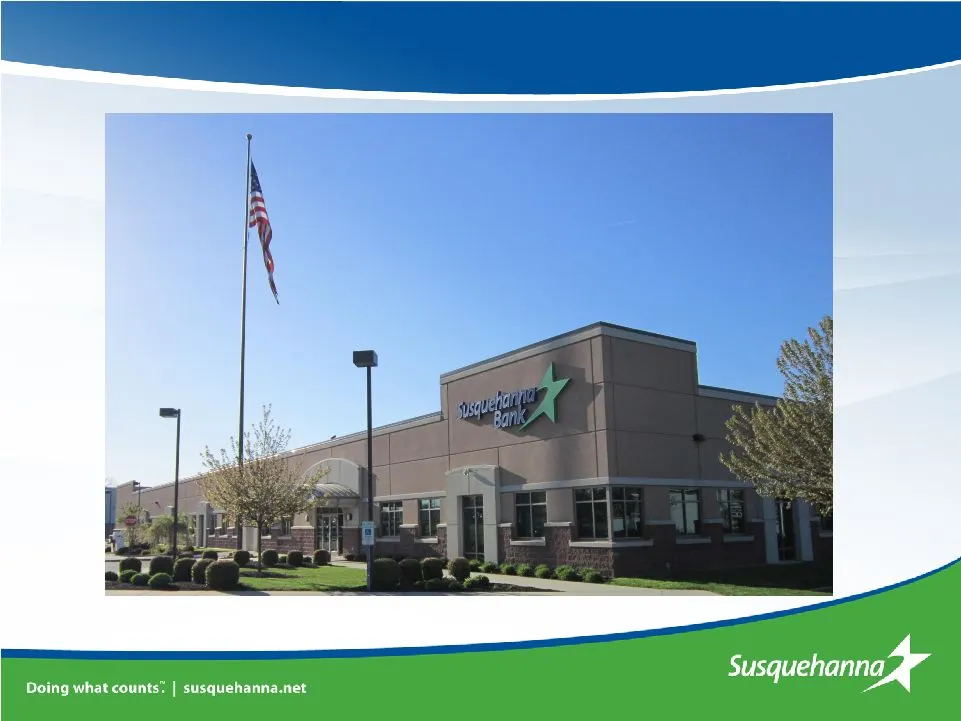
Susquehanna Learning & Resource Center

Slide 10: Voting Results
Voting Results Election of Directors Advisory Vote on Executive Compensation Ratification of PricewaterhouseCoopers LLP as Independent Registered Public Accountants

Slide 11: 2013: Year in Review Presentation
2013: Year in Review Presentation

Slide 12: Forward-looking statements
During the course of this presentation, we may make projections and other forward-looking statements regarding events or the future financial performance of Susquehanna. We wish to caution you that these forward- looking statements may differ materially from actual results due to a number of risks a
Slide 13: Susquehanna Bancshares Current Profile
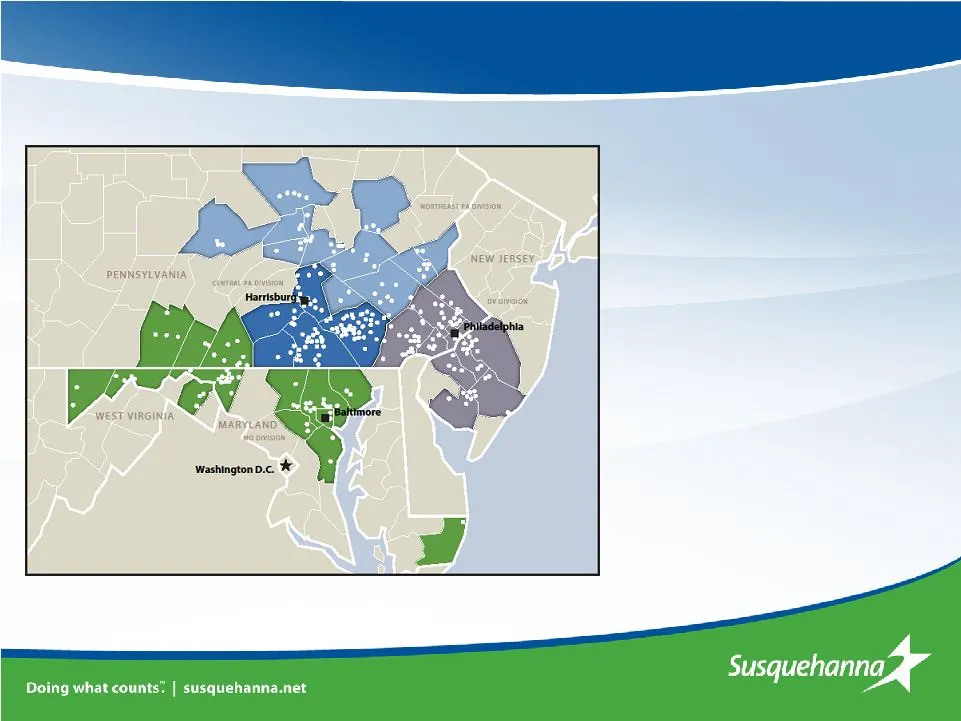
Susquehanna Bancshares Current Profile • th largest U.S. commercial bank • $18.5 billion in assets • 245 branches in PA, NJ, MD and WV • 3,500 employees • $2 billion market capitalization • > 1.5 million shares in average daily volume

Slide 14: 2013 Year in Review: Deposit Growth
2013 Year in Review: Deposit Growth • $12.9 billion in deposits at year-end 2013 – 2.3% increase over 2012 – Interest-bearing deposit costs improved from 66 to 56 basis points – Streamlined retail checking account offerings • Reduced from more than 10 account options to 3

Slide 15: 2013 Year in Review: Deposit Growth
2013 Year in Review: Deposit Growth Stellar Checking account introduced in March 2013 • 70,610 accounts (through March 31, 2014) - Approximately 30% new to the bank • Accountholders bringing additional deposits - $181 million total relationship growth since March 2013 • Strong 93% retention rate

Slide 16: 2013 Year in Review: Online and Mobile Banking
2013 Year in Review: Online and Mobile Banking • Strong growth in online, mobile banking – Introduced mobile deposit – Mobile banking users up 120% – Customers receiving eStatements up 107% – Online banking users up 27%

Slide 17: 2013 Year in Review: Loan Growth
2013 Year in Review: Loan Growth • $13.6 billion in loans & leases at year-end 2013 – 5.3% increase over 2012 – Commercial loans up 5.3% – Consumer loans up 13.1% – Leases up 35.4% • $4.7 billion in loan originations • Net interest margin contracted from 4.01% in 2012 to 3.79% in 2013 – Impact of ne

Slide 18: 2013 Year in Review: Credit Quality
2013 Year in Review: Credit Quality 2013 2012 Net Charge-offs/ Average Loans & Leases 0.44% 0.55% Non-Performing Assets/ Loans, Leases & Foreclosed Real Estate 0.86% 0.96% Provision for Loan & Lease Losses $31 million $64 million

Slide 19: 2013 Year in Review: Non-Interest Income
2013 Year in Review: Non-Interest Income • $184 million in non-interest income – 10% increase from 2012 – Capital Markets: $5 million, up 66% from 2012 – Cash Management: $10 million, up 15% – Wealth Management: $51 million, up 8%

Slide 20: 2013 Year in Review: Mortgage Banking
2013 Year in Review: Mortgage Banking • Record volume in mortgage loan originations • Loans originated and sold to investors = 56% • Servicing retained on 68% of mortgage loans – Continued opportunity to cross-sell to customers

Slide 21: 2013 Year in Review: Cost Management
2013 Year in Review: Cost Management • $491 million in non-interest expenses, virtually unchanged from $490 million in 2012 • Consolidated 14 branches in close proximity – Strong adoption of online and mobile banking reduces branch traffic – $5 million in annualized ongoing savings • Sale-leaseback
Slide 22: 2013 Year in Review: Profitability
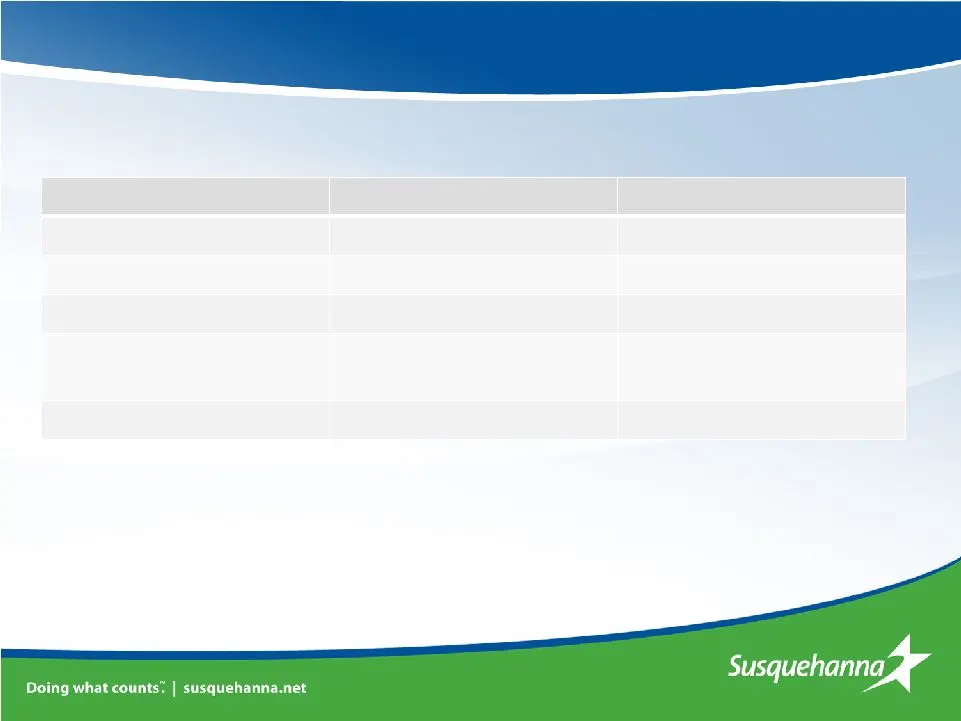
2013 Year in Review: Profitability 2013 2012 Net Income $174 million $141 million Diluted Earnings per Share $0.92 $0.77 Return on Average Assets 0.95% 0.81% Return on Average Tangible Equity* 13.57% 12.03% Dividends Paid $0.31** $0.21 * Non-GAAP measurement. See calculations at end of presentation.
Slide 23: 2013 Year in Review: Peer Comparison
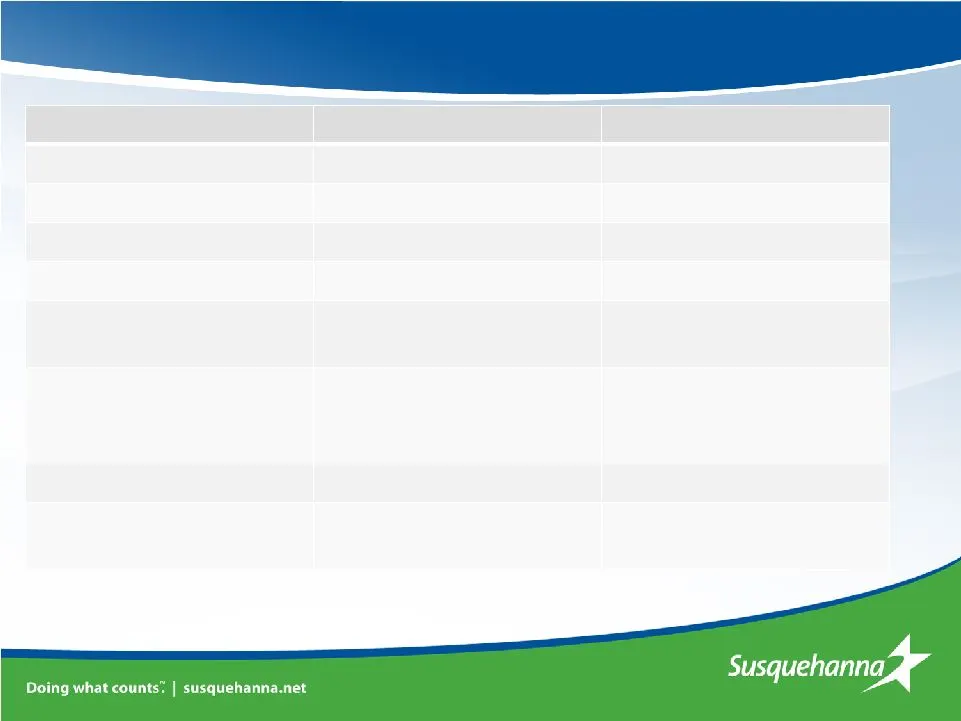
2013 Year in Review: Peer Comparison Susquehanna Peer Median* Loan Growth 5.3% 7.2% Deposit Growth 2.3% 2.5% Net Interest Margin 3.79% 3.39% Efficiency Ratio** 62.55% 63.85% Net Charge-offs/ Average Loans & Leases 0.44% 0.26% Non-performing Assets/ Loans, Leases & Foreclosed Real Estate 0.86% 1.07%
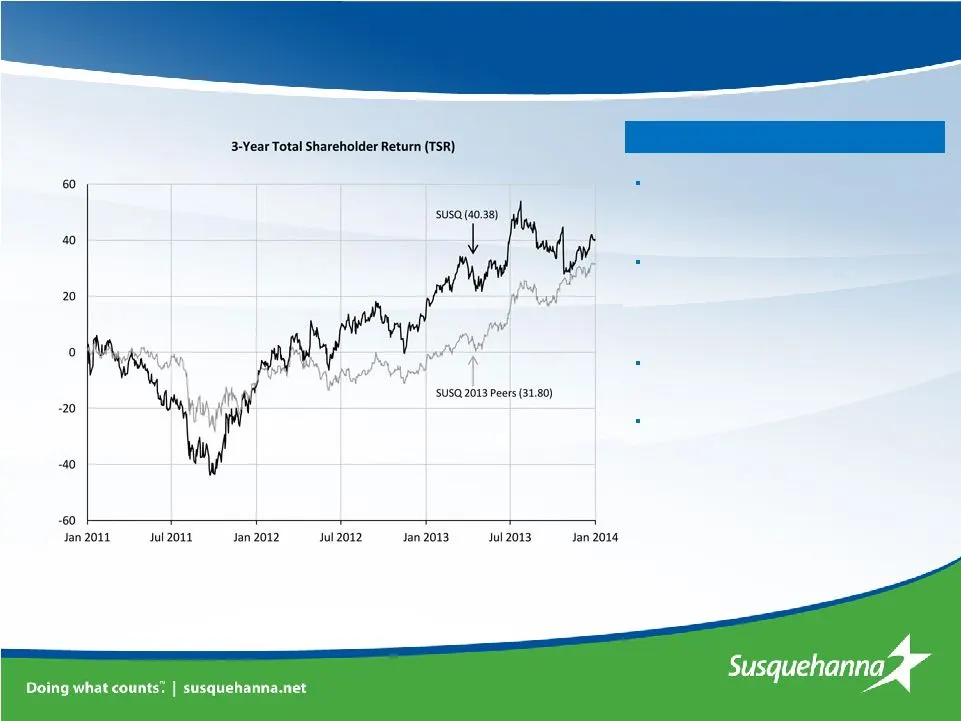
Slide 24: Total Shareholder Return Performance Comments
Total Shareholder Return Performance Comments Three year total shareholder return of 40.38% compared to 31.80% for the peer group Reset earnings expectations for 2014 due to prolonged low interest rate environment, slow economic growth and new strategic direction around liquidity Resulted in underpe
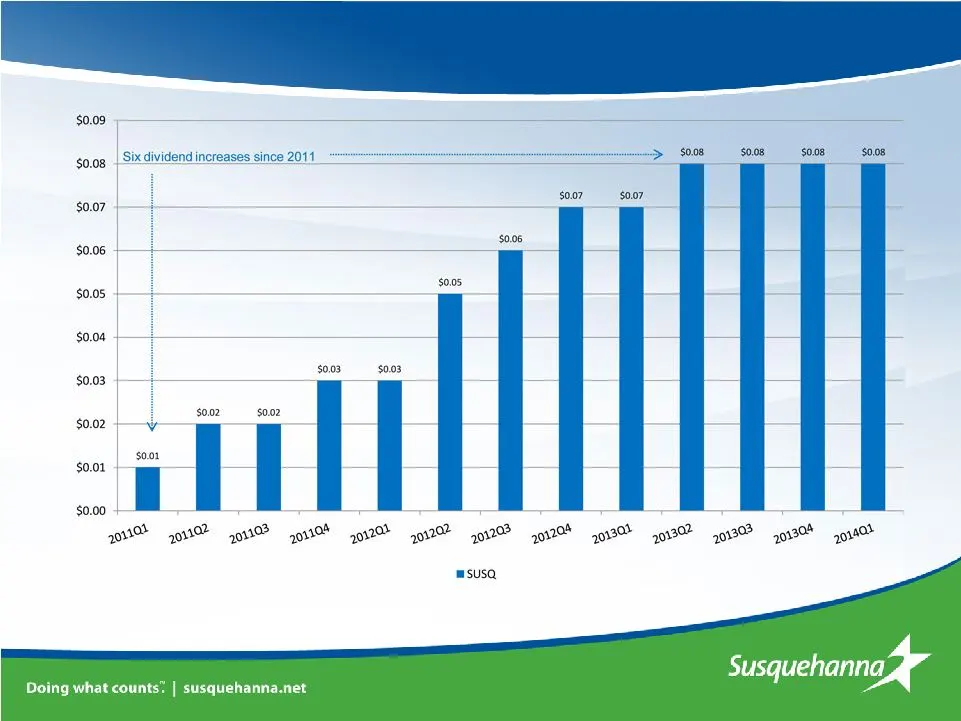
Slide 25: Increasing the Dividend
Increasing the Dividend Note: Data adjusted to reflect accelerated payment of first quarter 2013 dividend
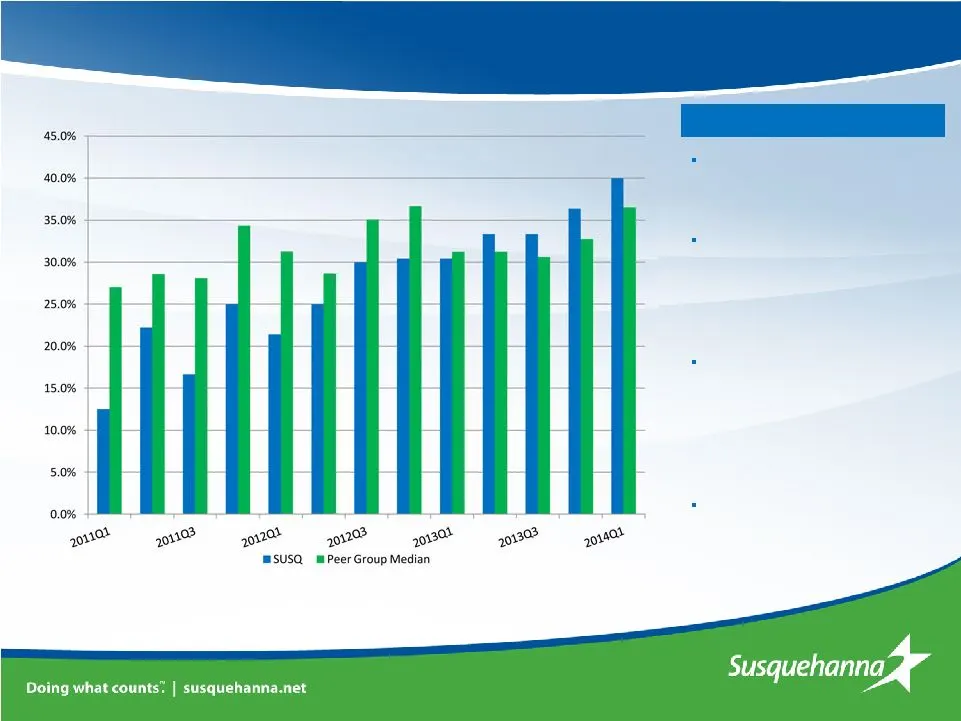
Slide 26: Dividend Payout Ratio Comments
Dividend Payout Ratio Comments Current dividend payout ratio of 40.0% compared to 36.5% peer median SUSQ establishes a dividend payout level that is consistent with safe and sound banking practices and sufficiently satisfies the shareholder base SUSQ recognizes the importance shareholders place on d

Slide 27: Investing for Our Future: 2014 and Beyond
Investing for Our Future: 2014 and Beyond • Multi-year strategy to strengthen relationship banking and earnings power – Investing to enhance the customer experience – Significant commitment to developing risk management culture – Elevating employee engagement & development • Susquehanna Learning Ins

Slide 28: First Quarter 2014
1 st Quarter 2014 • Net income of $37.2 million, or $0.20 per share • Loans & leases flat from prior quarter, up 4.4% year-over-year – Winter weather reduced business activity, but commercial loans and leases showed solid growth • Deposits showed strong growth, up 1.6% for the quarter and 3.1% year-

Slide 29: Focus Areas for 2014
Focus Areas for 2014 • Effectively managing expenses and increasing efficiency in a challenging revenue environment • Building on the momentum in deposit growth • Rebalancing loan portfolio by growing commercial loans • Capitalizing on opportunities for non-interest income through cross-selling and

Slide 30: Questions
Questions

Slide 31: Thank you for your investment in Susquehanna!
Thank you for your investment in Susquehanna!

Slide 32: Appendix: Non-GAAP Measures Peer Company List
Appendix: Non-GAAP Measures Peer Company List

Slide 33: Return on Average Tangible Equity
Return on Average Tangible Equity Return on average tangible equity is a non-GAAP based financial measure calculated using non-GAAP based amounts. The most directly comparable GAAP-based measure is return on average equity. We calculate return on average tangible equity by excluding the balance of i

Slide 34: Efficiency Ratio
Efficiency Ratio Efficiency ratio is a non-GAAP based financial measure. Management excludes merger-related expenses and certain other selected items when calculating this ratio, which is used to measure the relationship of operating expenses to revenues. (Dollars in thousands) Other expense $490,84

Slide 35: Peer Companies
Peer Companies Associated Banc-Corp BancorpSouth Inc. City National Corp. Commerce Bancshares Inc. Cullen/Frost Bankers Inc. F.N.B. Corp. First Horizon National Corp. First Niagara Financial Group FirstMerit Corp. Fulton Financial Corp. Hancock Holding Co. IBERIABANK Corp. People’s United Financial
Source: SEC EDGAR · 8-K filed May 2, 2014
More decks from Susquehanna Bancshares Inc
 Investor Presentation (December 2014)51 slides · Dec 3, 2014
 Merger or Acquisition (November 2014)28 slides · Nov 17, 2014
 Merger or Acquisition (November 2014)13 slides · Nov 12, 2014
 Q2 2014 Earnings Presentation46 slides · Aug 11, 2014
 Investor Presentation (May 2014)44 slides · May 5, 2014
 Investor Presentation (February 2014)45 slides · Feb 7, 2014