Quanterix Corporation · NASDAQ:QTRX
Quanterix — Technical Presentation (September 2015)
40 slides from Quanterix's technical presentation, September 2015

Slide 1: Single Cells and Single Molecules – Measuring at the Fundamental Limits of Chemistry and Biology
Walt Laboratory Single Cells and Single Molecules – Measuring at the Fundamental Limits of Chemistry and Biology DAVID R. WALT Tu#s University
Slide 2: Outline
Walt Laboratory Outline • Array Format • Fundamental Enzyme Studies • Clinical Applica@ons • Single Cells 2
Slide 3: Outline
Walt Laboratory Outline • Array Format • Fundamental Enzyme Studies • Clinical Applica@ons • Single Cells 3
Slide 4: Single Molecule Detection
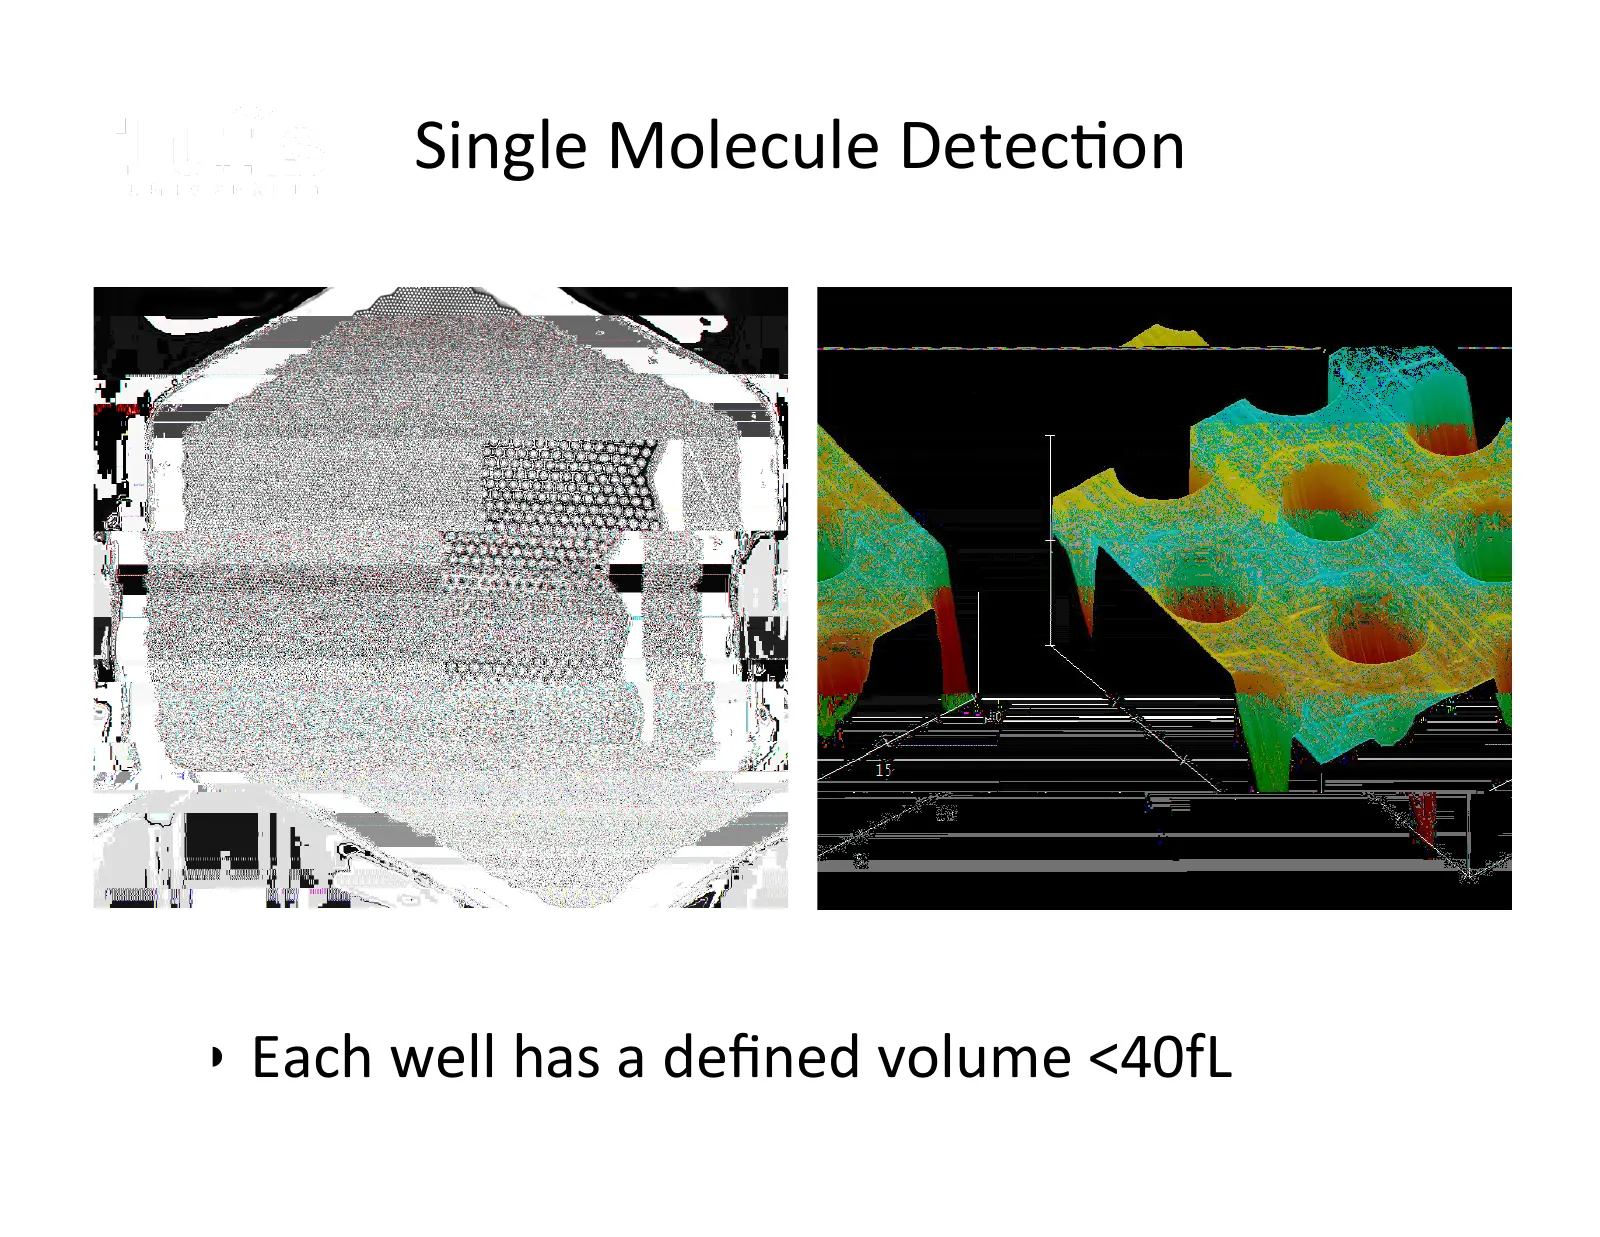
Single Molecule Detec@on Walt Laboratory • Each well has a defined volume <40fL
Slide 5: Single Molecule Isolation in Femtoliter array
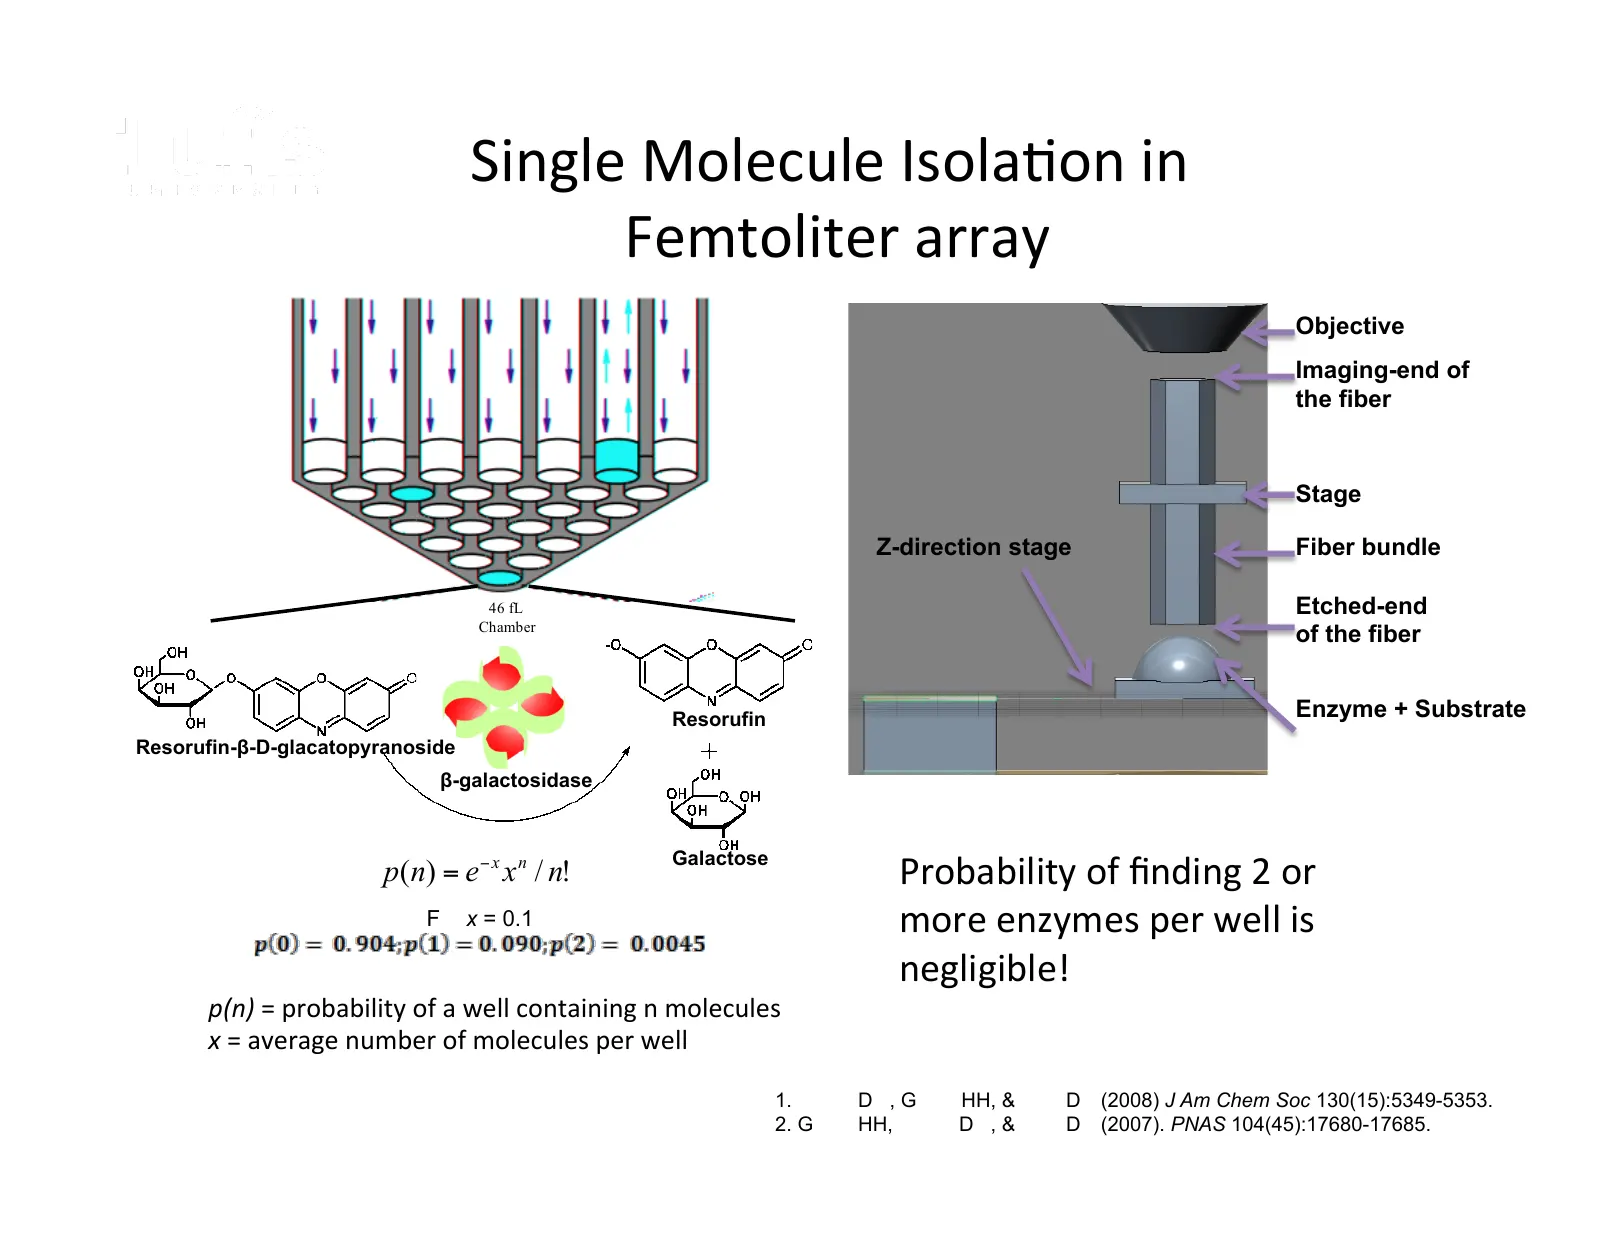
Single Molecule Isola@on in Walt Laboratory Femtoliter array Objective Imaging-end of the fiber Stage Z-direction stage Fiber bundle 46 fL Etched-end Chamber of the fiber Resorufin Enzyme + Substrate Resorufin-β-D-glacatopyranoside β-galactosidase p(n) = e − x x n / n! Galactose Probability of findin
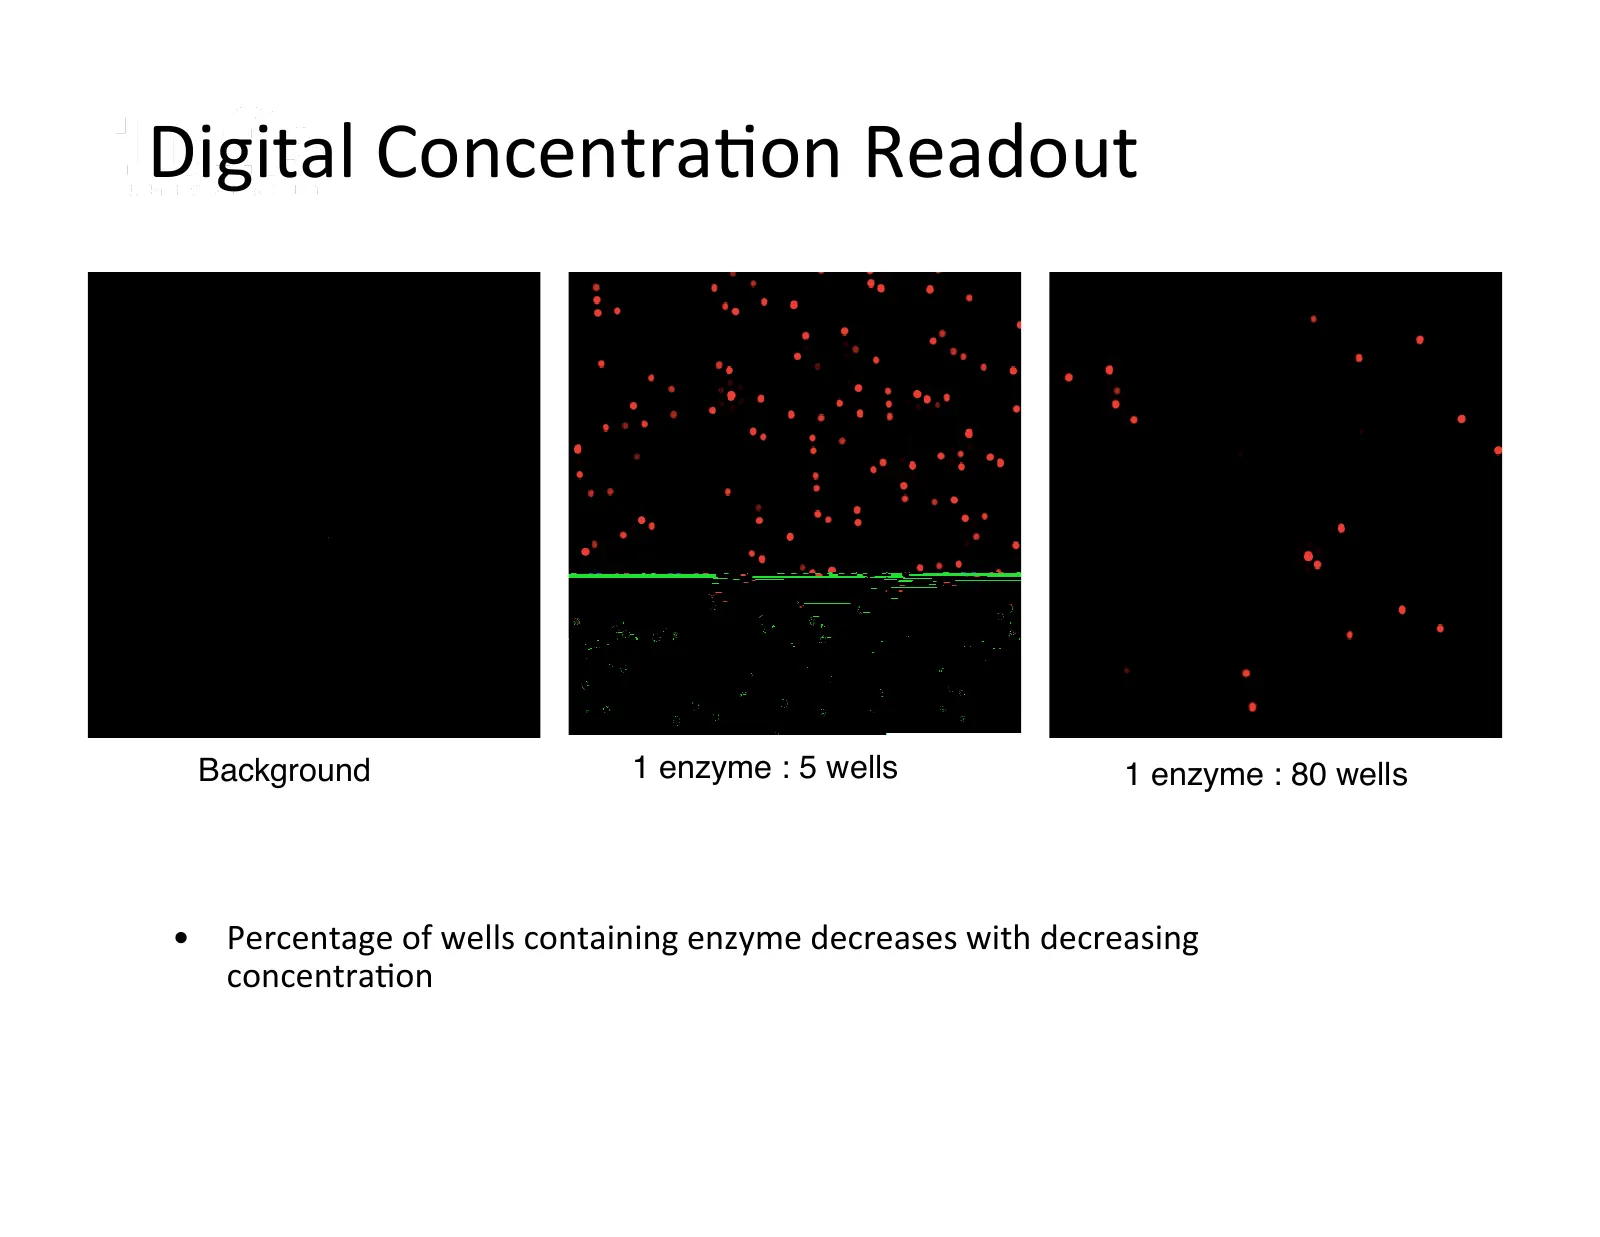
Slide 6: Digital Concentration Readout
Digital Concentra@on Readout Walt Laboratory Background" 1 enzyme : 5 wells" 1 enzyme : 80 wells" • Percentage of wells containing enzyme decreases with decreasing concentra@on
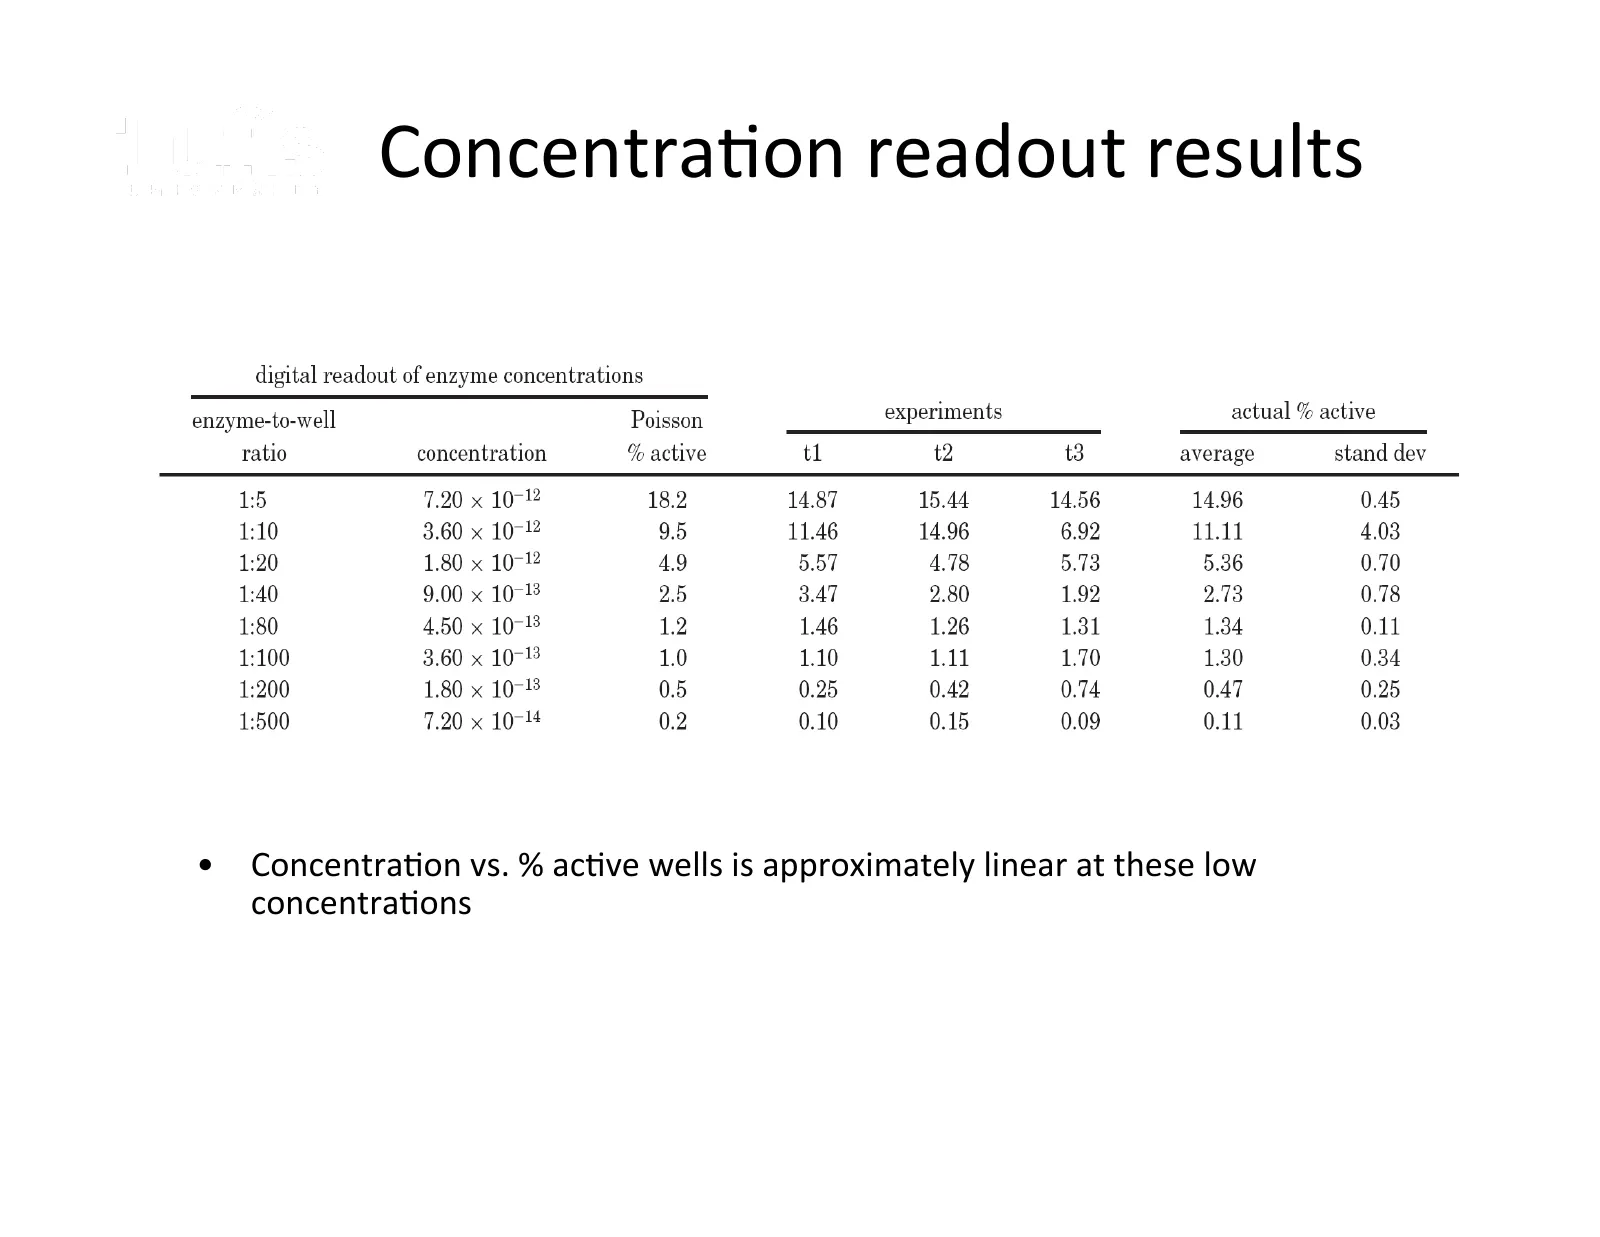
Slide 7: Concentration readout results
Concentra@on readout results Walt Laboratory • Concentra@on vs. % ac@ve wells is approximately linear at these low concentra@ons
Slide 8: Outline
Walt Laboratory Outline • Array Format • Fundamental Enzyme Studies • Clinical Applica@ons • Single Cells 8
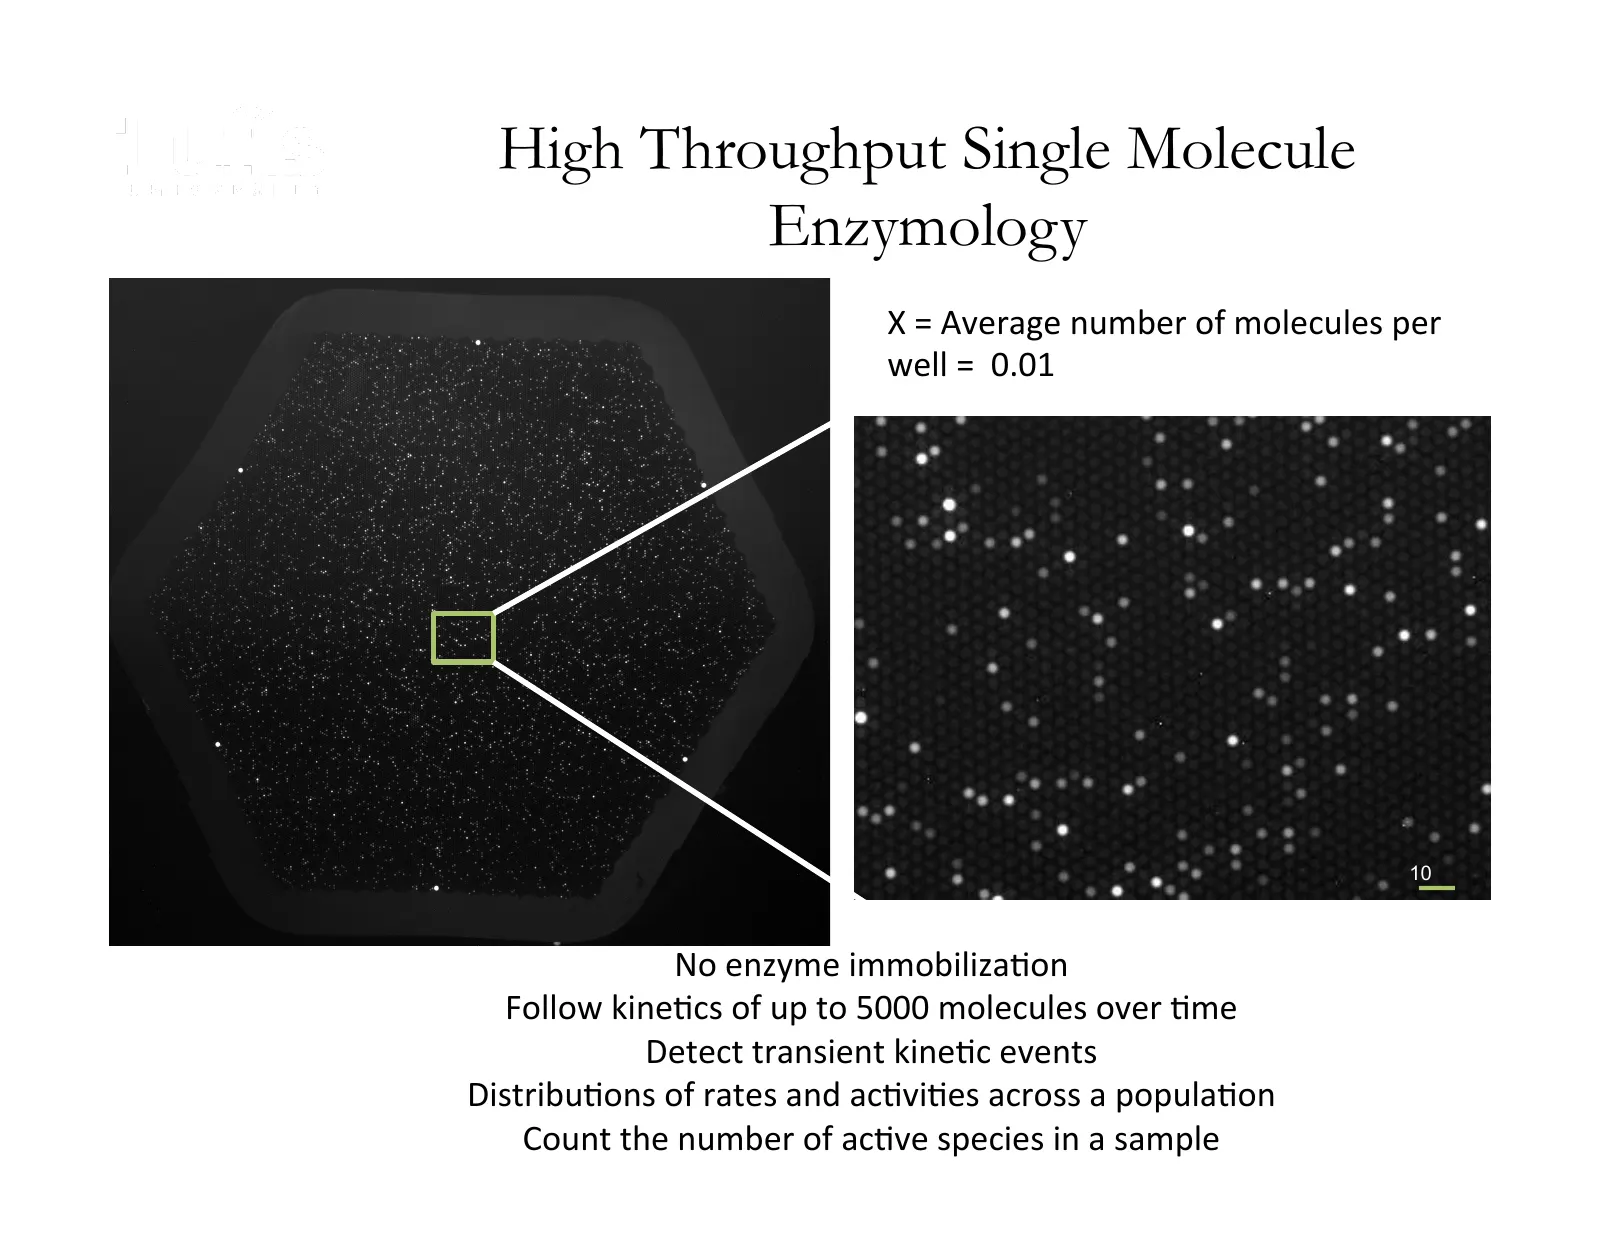
Slide 9: High Throughput Single Molecule Enzymology
High Throughput Single Molecule Walt Laboratory Enzymology X = Average number of molecules per well = 0.01 10 µm • No enzyme immobiliza@on • Follow kine@cs of up to 5000 molecules over @me • Detect transient kine@c events • Distribu@ons of rates and ac@vi@es across a popula@on • Count the number of
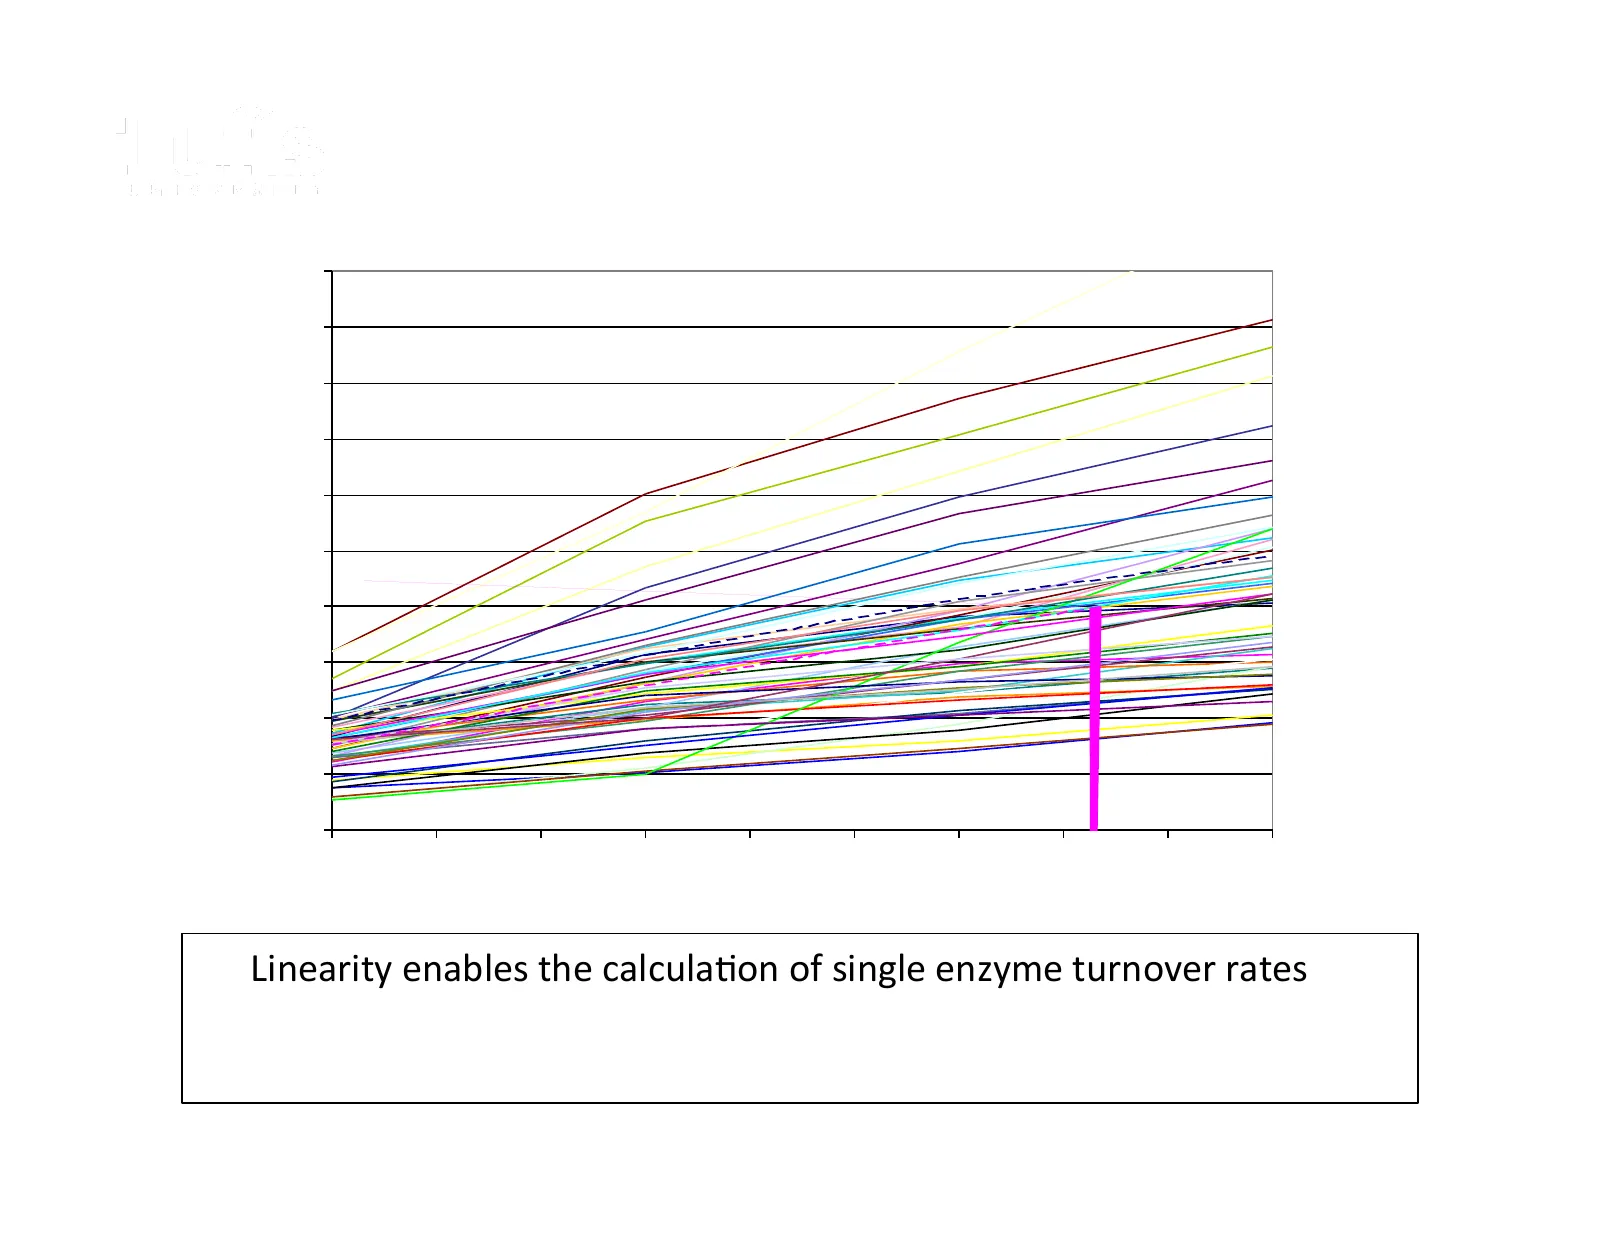
Slide 10: Linearity enables the calculation of single enzyme turnover rates
Walt Laboratory • Linearity enables the calcula@on of single enzyme turnover rates
Slide 11: Hypotheses
Hypotheses Walt Laboratory • Different conforma@ons • Different proteoforms
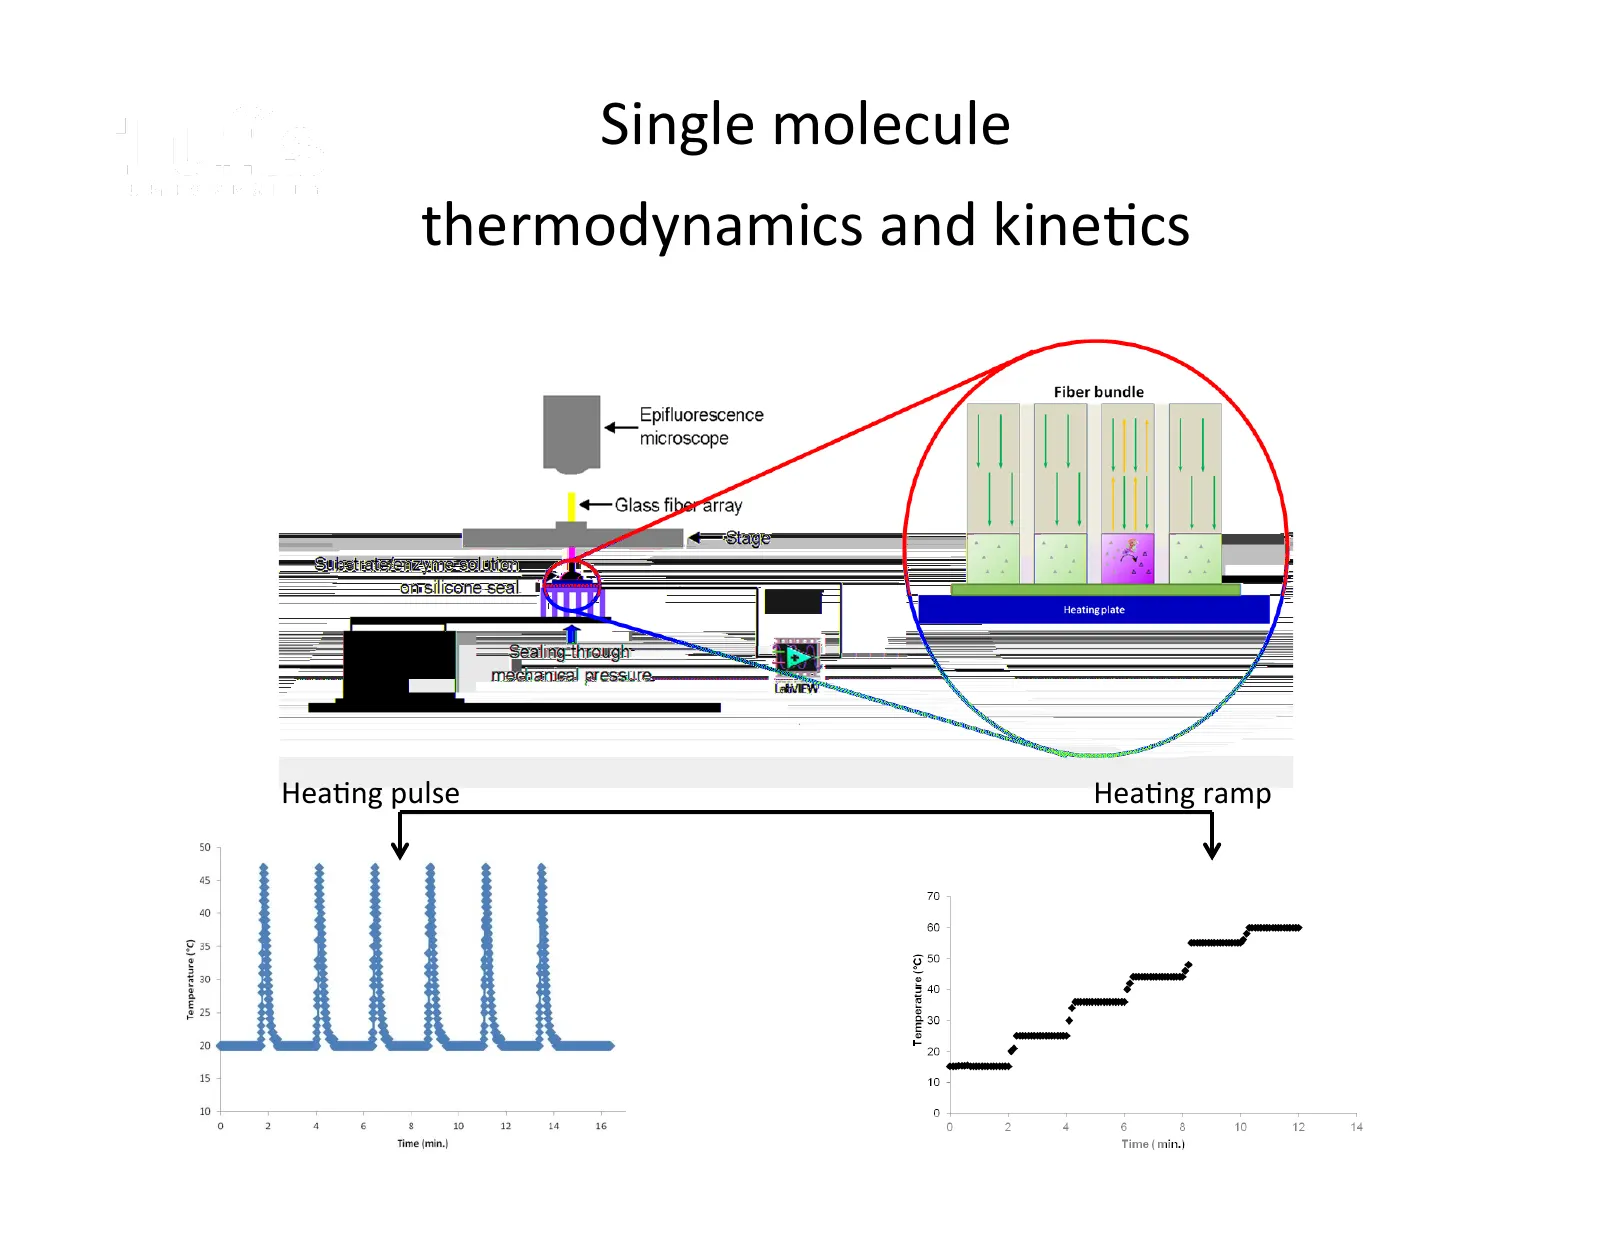
Slide 12: Single molecule thermodynamics and kinetics
Single molecule Walt Laboratory thermodynamics and kine@cs Hea@ng pulse Hea@ng ramp
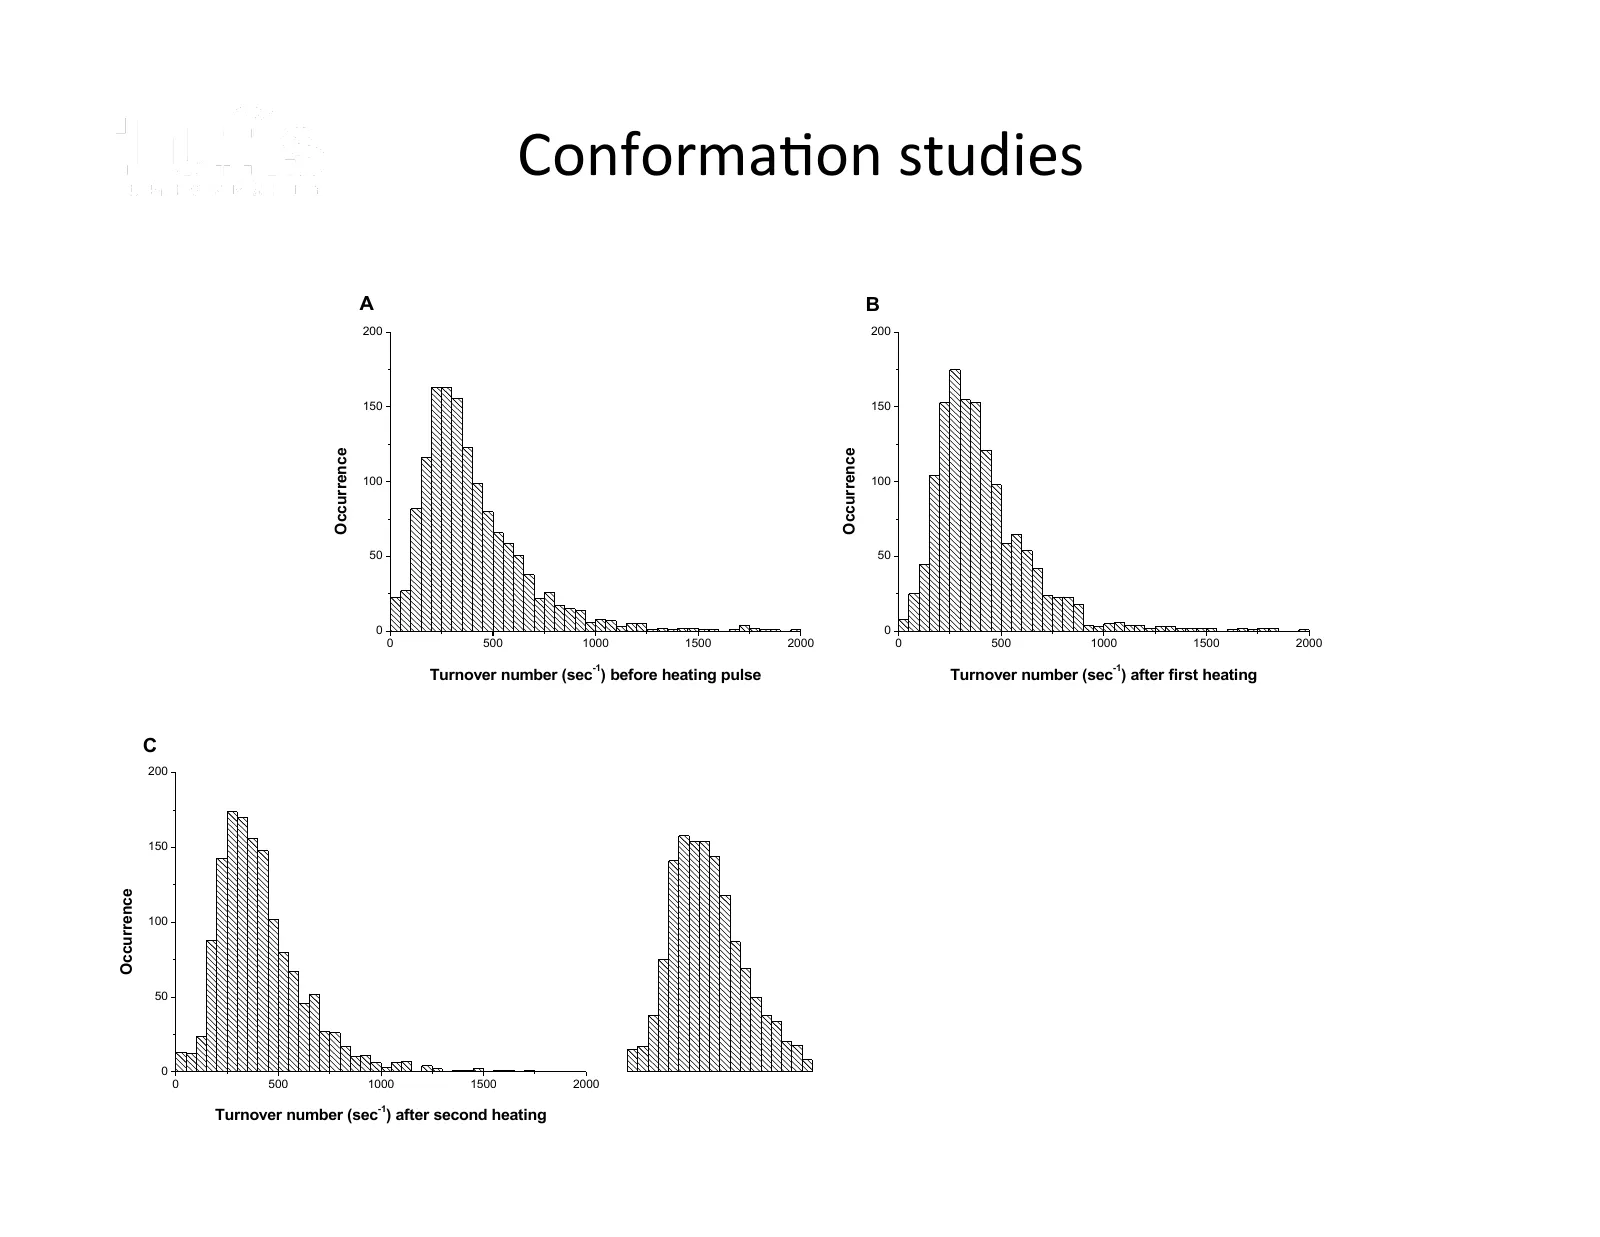
Slide 13: Conformation studies
Conforma@on studies Walt Laboratory A B 200 200 150 150 Occurrence Occurrence 100 100 50 50 0 0 0 500 1000 1500 2000 0 500 1000 1500 2000 -1 -1 Turnover number (sec ) before heating pulse Turnover number (sec ) after first heating C 200 150 Occurrence 100 50 0 0 500 1000 1500 2000 -1 Turnover number
Slide 14: Conformation studies
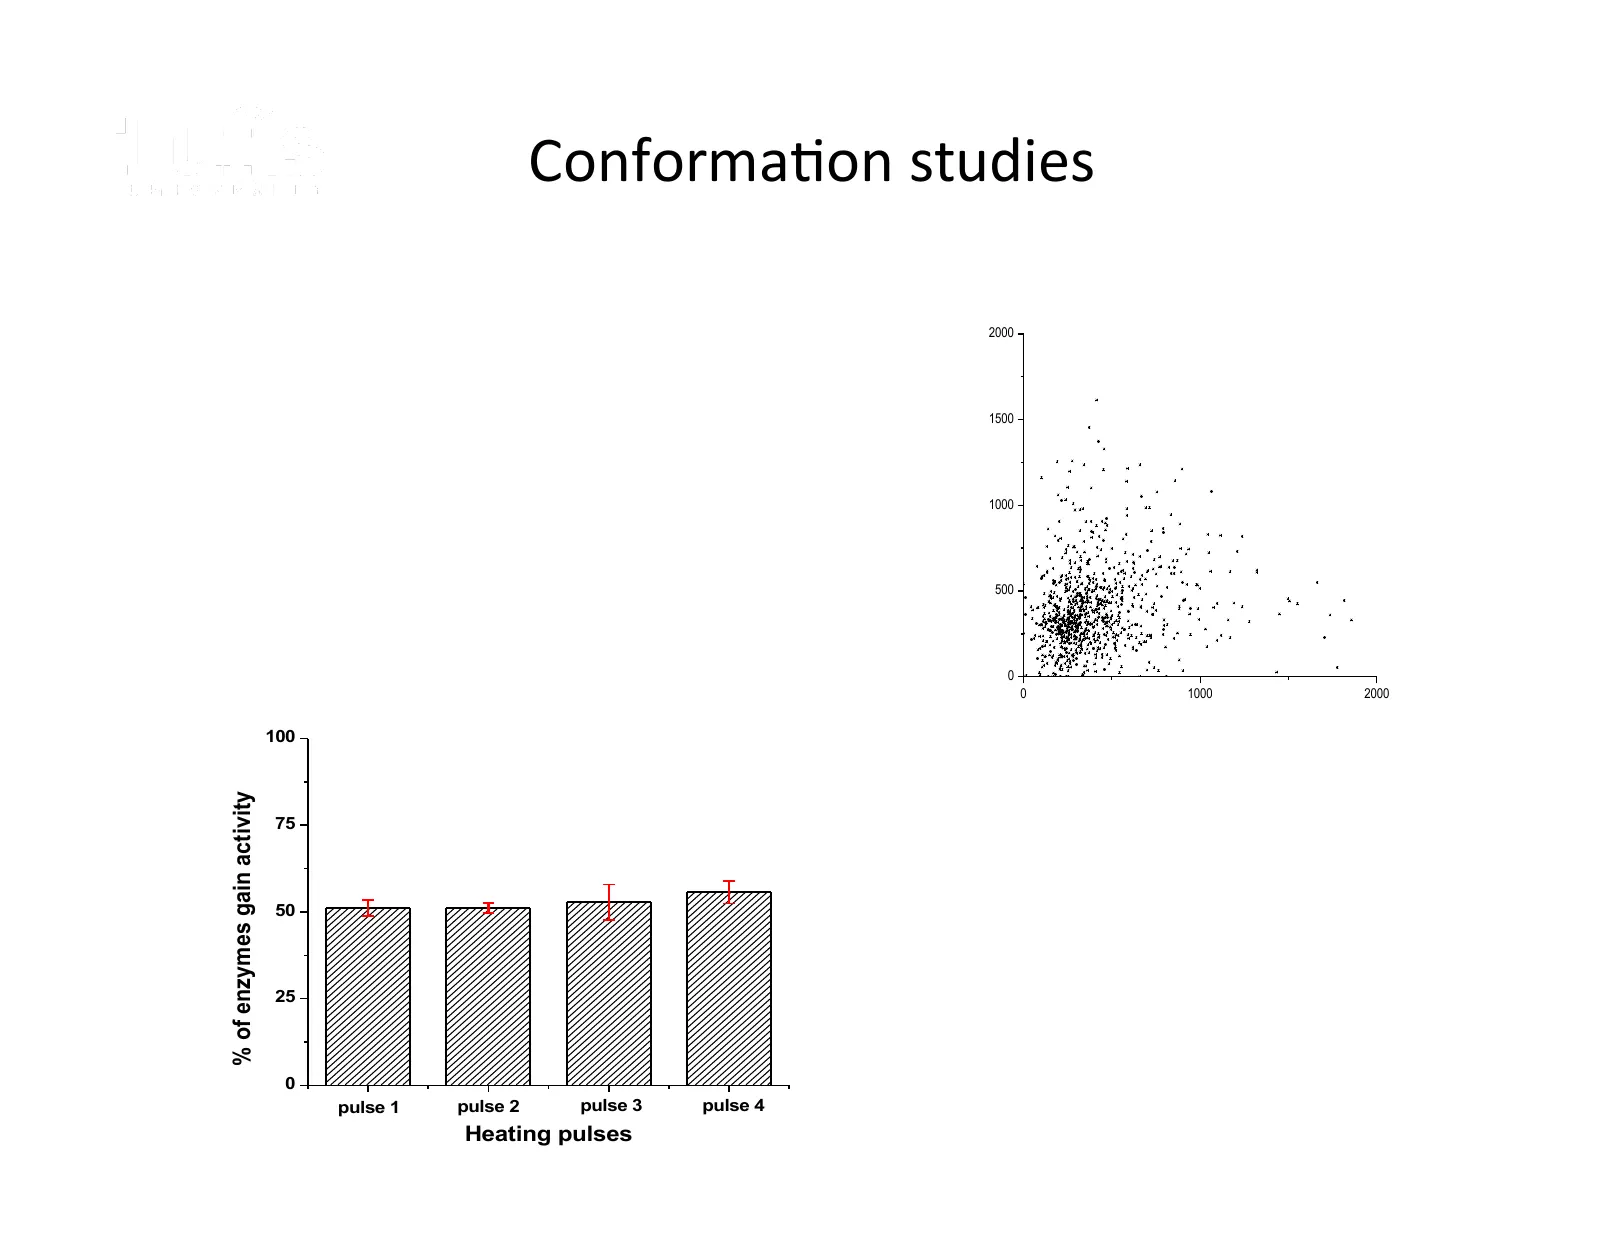
Conforma@on studies Walt Laboratory 2000 1500 1000 500 0 0 1000 2000 100 % of enzymes gain activity 75 50 25 0 pulse 1 pulse 2 pulse 3 pulse 4 Heating pulses
Slide 15: Conformation studies
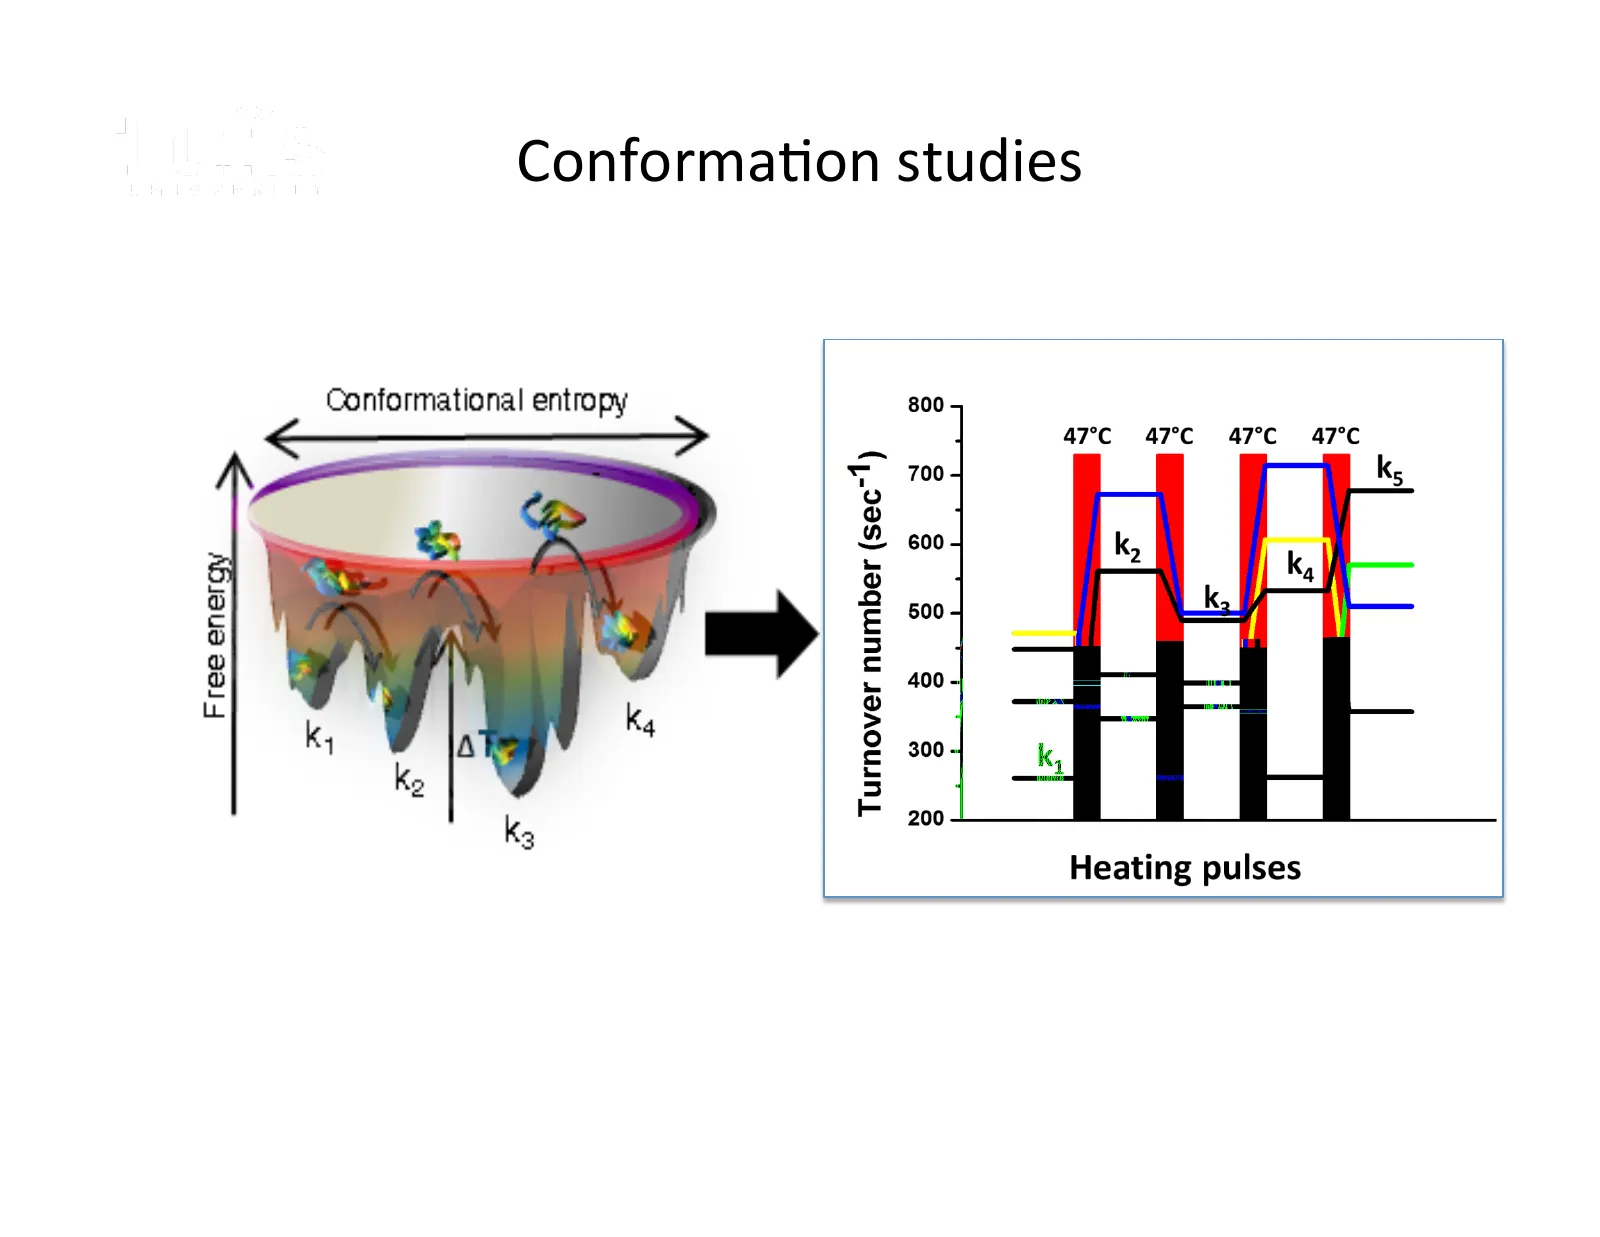
Conforma@on studies Walt Laboratory
Slide 16: Outline
Walt Laboratory Outline • Array Format • Fundamental Enzyme Studies • Clinical Applica>ons • Single Cells 16

Slide 17: Can we use Simoa as a model to track tumor progression?
Walt Laboratory Can we use Simoa as a model to track tumor progression? mice? 1. How many cells to we need to inject before tumors form? 2. How soon can we detect PSA before the tumors form? 3. Can we predict if a mouse will form a tumor based off of the PSA concentra@on in serum?
Slide 18: SiMoA PSA Assay
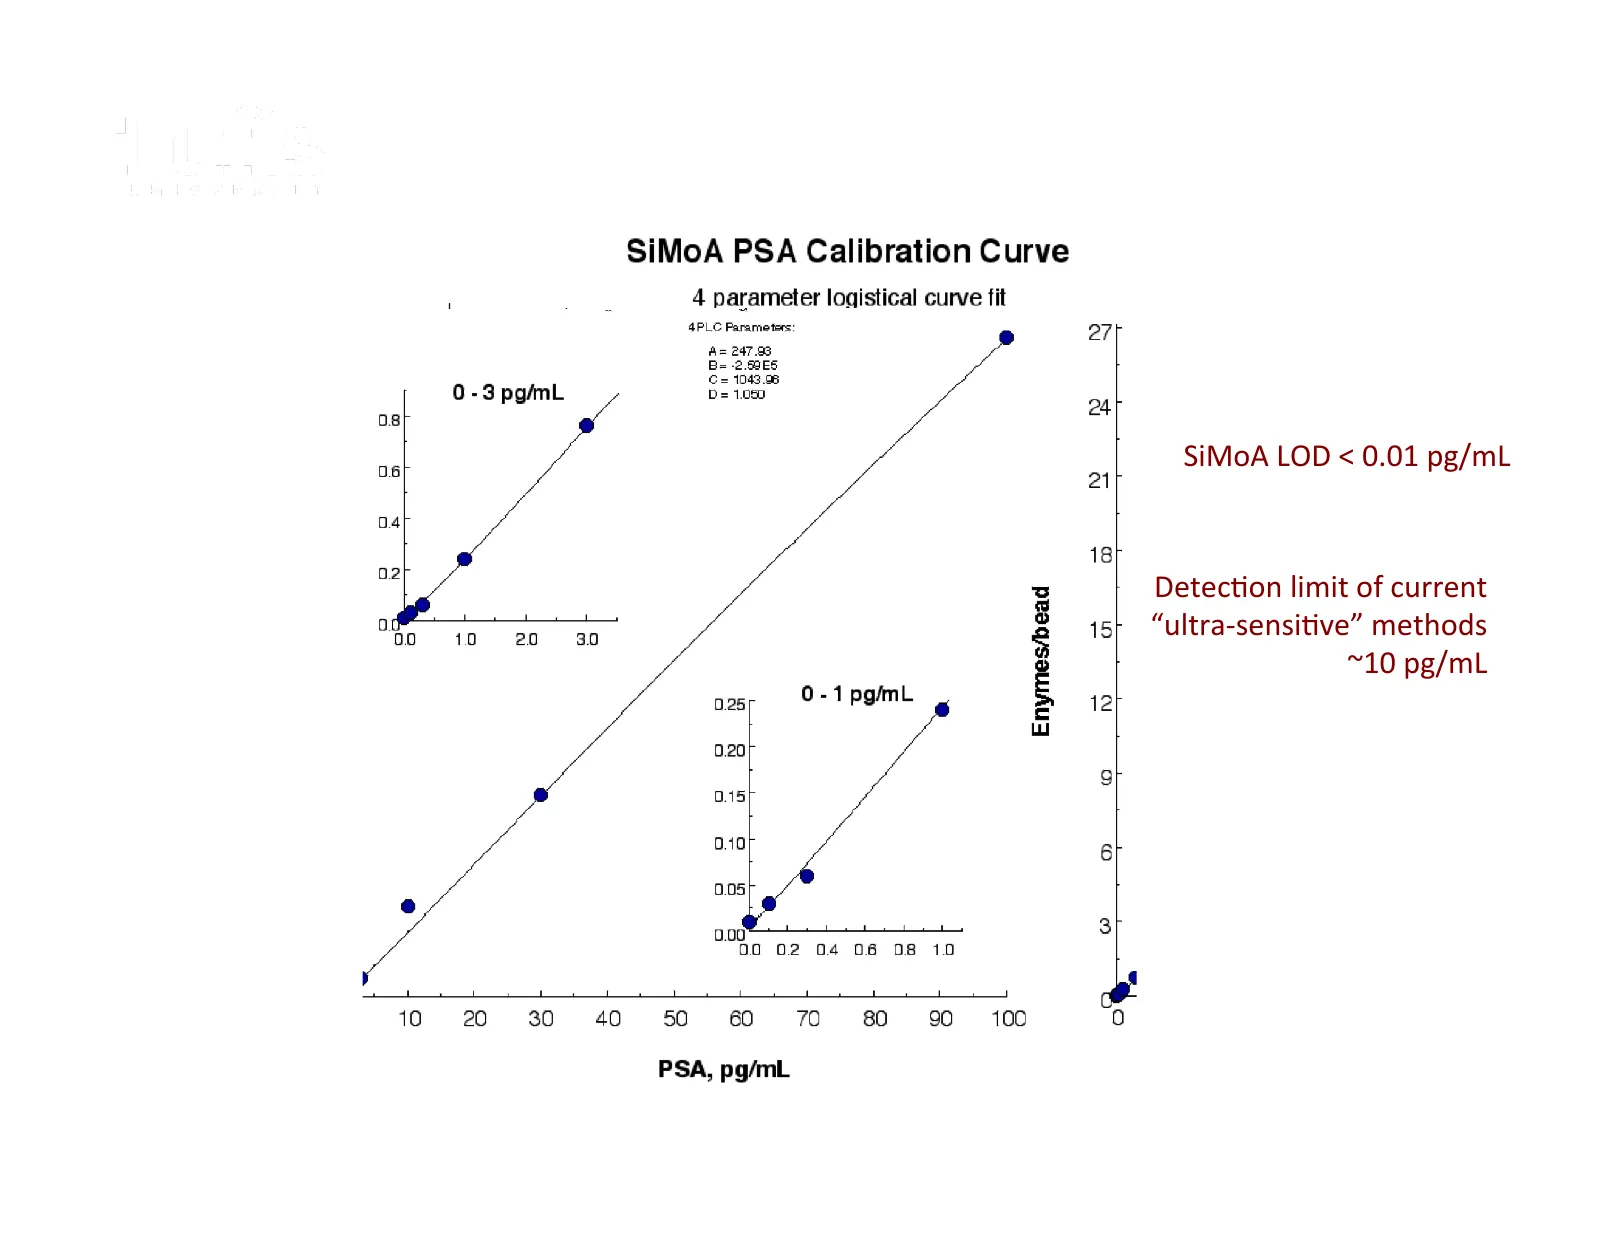
SiMoA PSA Assay Walt Laboratory SiMoA LOD < 0.01 pg/mL Detec@on limit of current “ultra-‐sensi@ve” methods ~10 pg/mL
Slide 19: Experiment #1
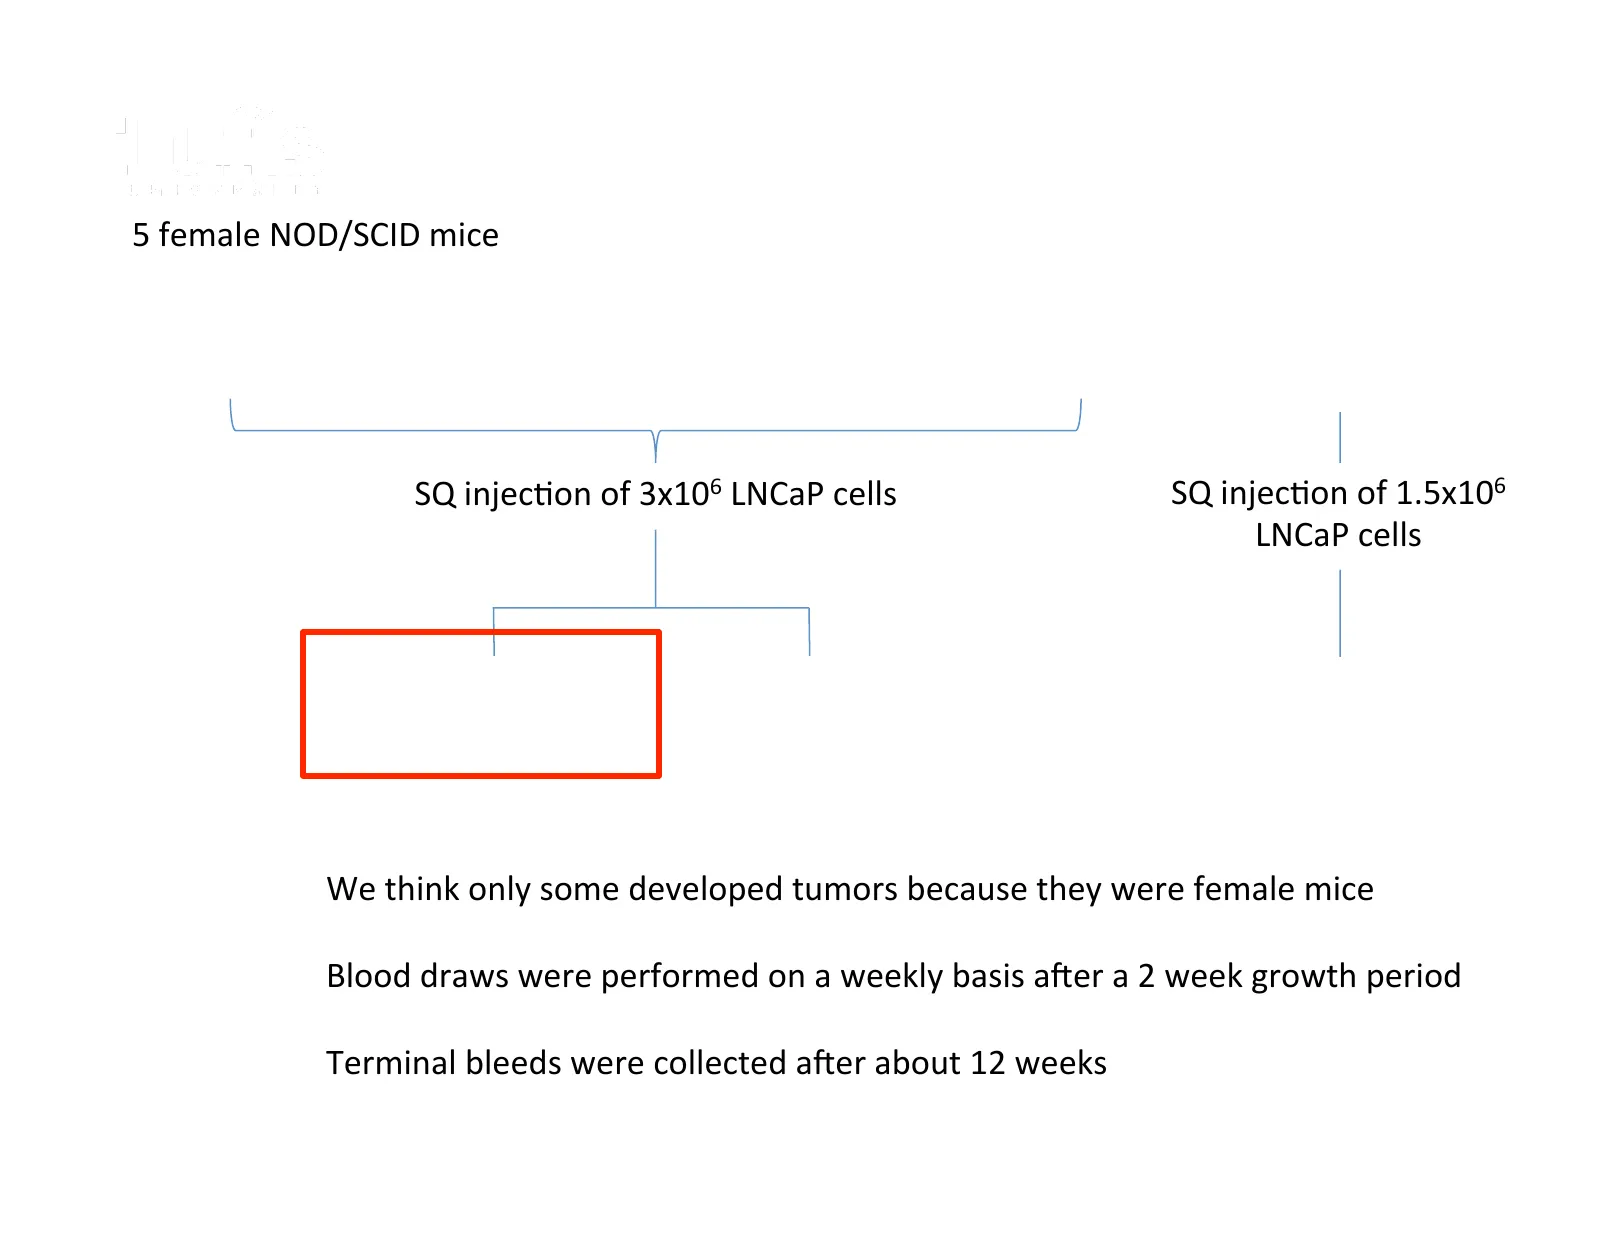
Experiment #1 Walt Laboratory 5 female NOD/SCID mice SQ injec@on of 3x10⁶ LNCaP cells SQ injec@on of 1.5x10⁶ LNCaP cells 2 mice developed 2 mice did not Did not develop tumors develop tumors tumors • We think only some developed tumors because they were female mice • Blood draws were performed on a
Slide 20: PSA Mouse Model with Tumor Formation
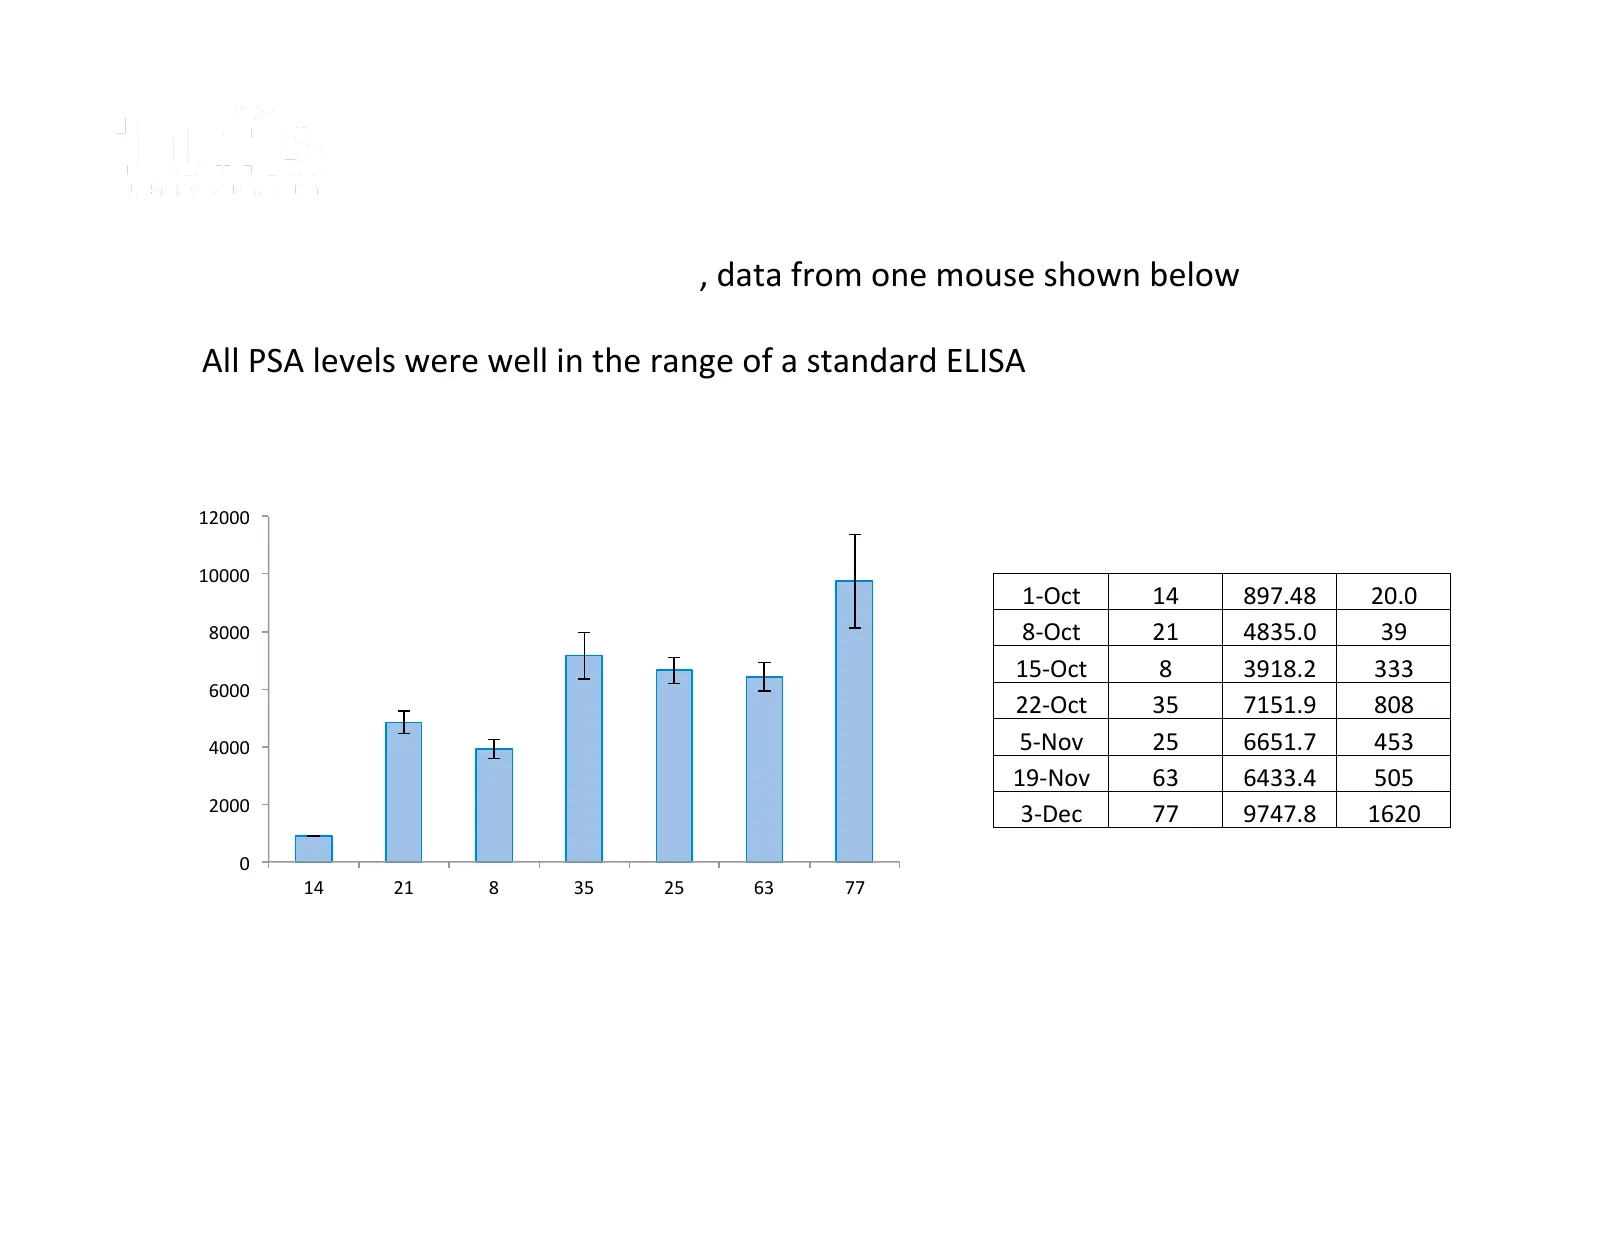
PSA Mouse Model with Tumor Forma>on Walt Laboratory • Mice developed palpable tumors, data from one mouse shown below • All PSA levels were well in the range of a standard ELISA PSA in Mouse Serum 12000 Avg [PSA] Date Days (pg/mL) Stdev 10000 1-‐Oct 14 897.48 20.0 8000 8-‐Oct 21 4835.0 39 [PSA] (p
Slide 21: Experiment #1
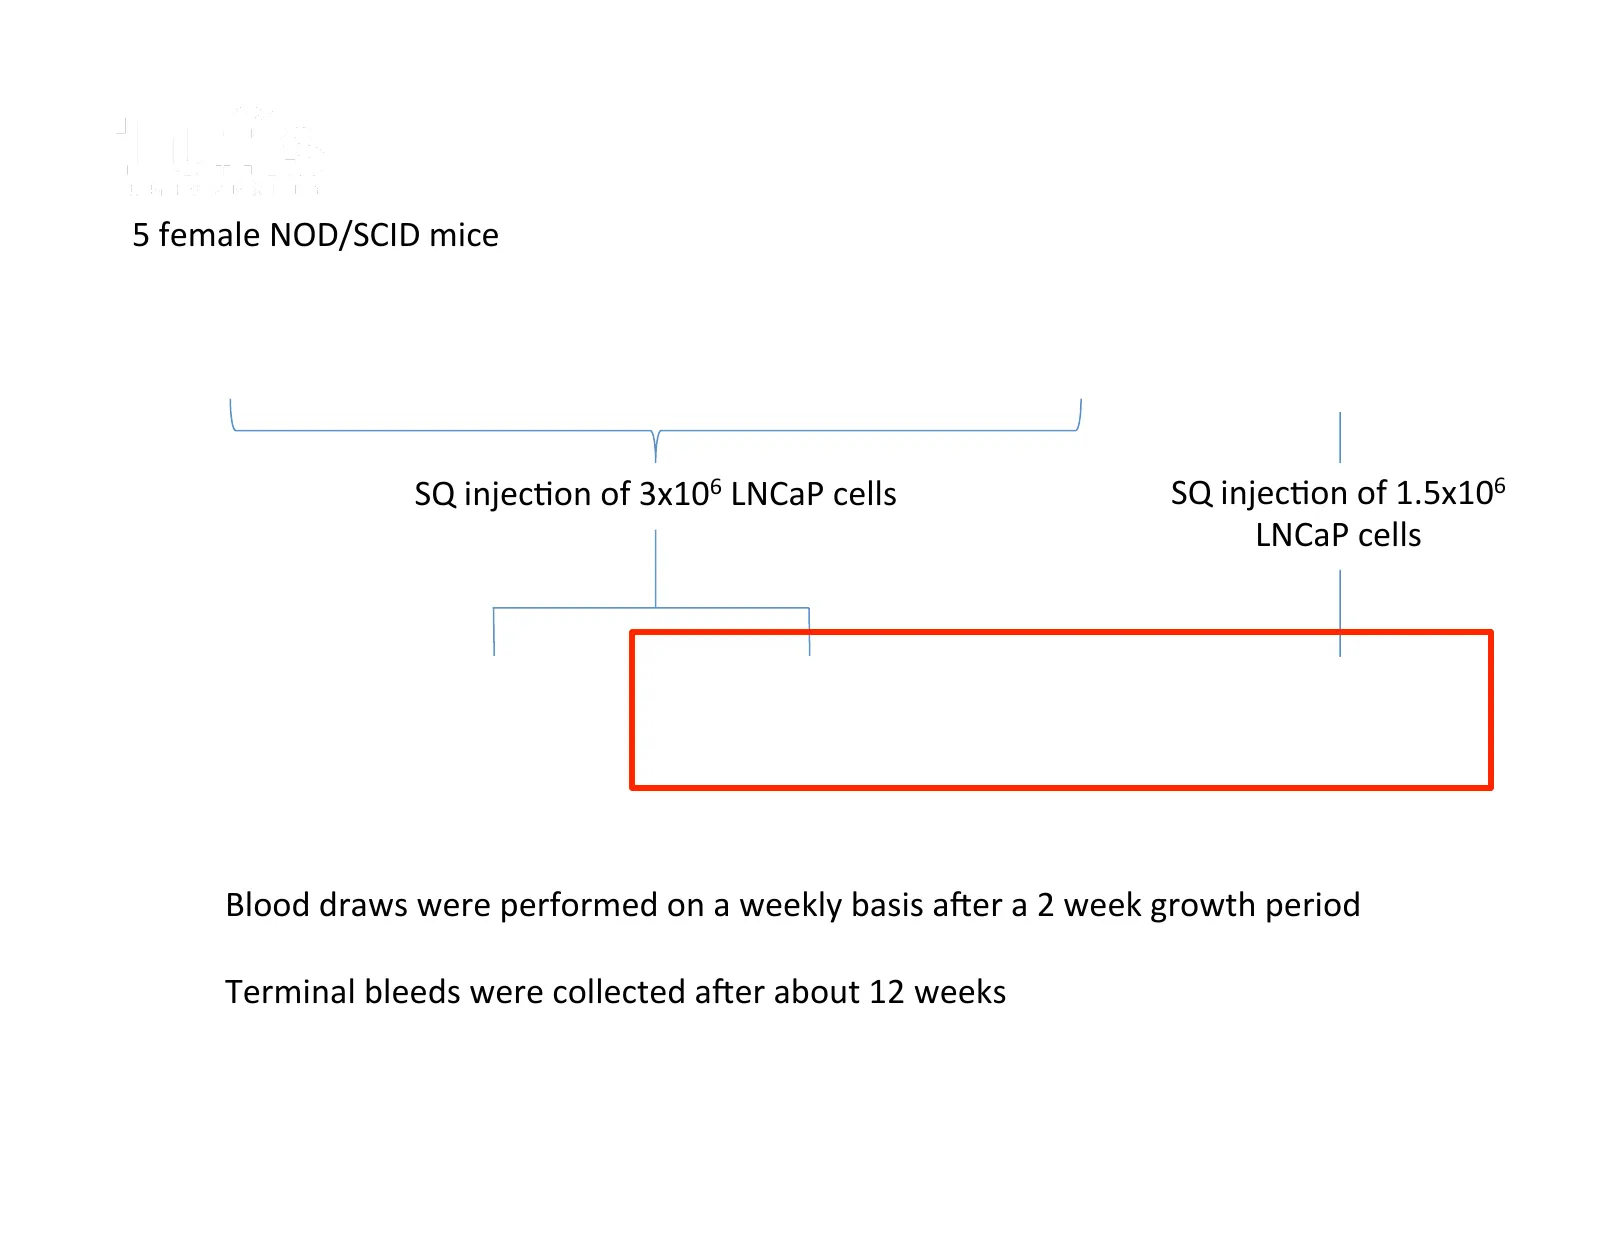
Experiment #1 Walt Laboratory 5 female NOD/SCID mice SQ injec@on of 3x10⁶ LNCaP cells SQ injec@on of 1.5x10⁶ LNCaP cells 2 mice developed 2 mice did not Did not develop tumors develop tumors tumors • Blood draws were performed on a weekly basis ager a 2 week growth period • Terminal bleeds were coll
Slide 22: Inoculation with 100k LNCaP Cells
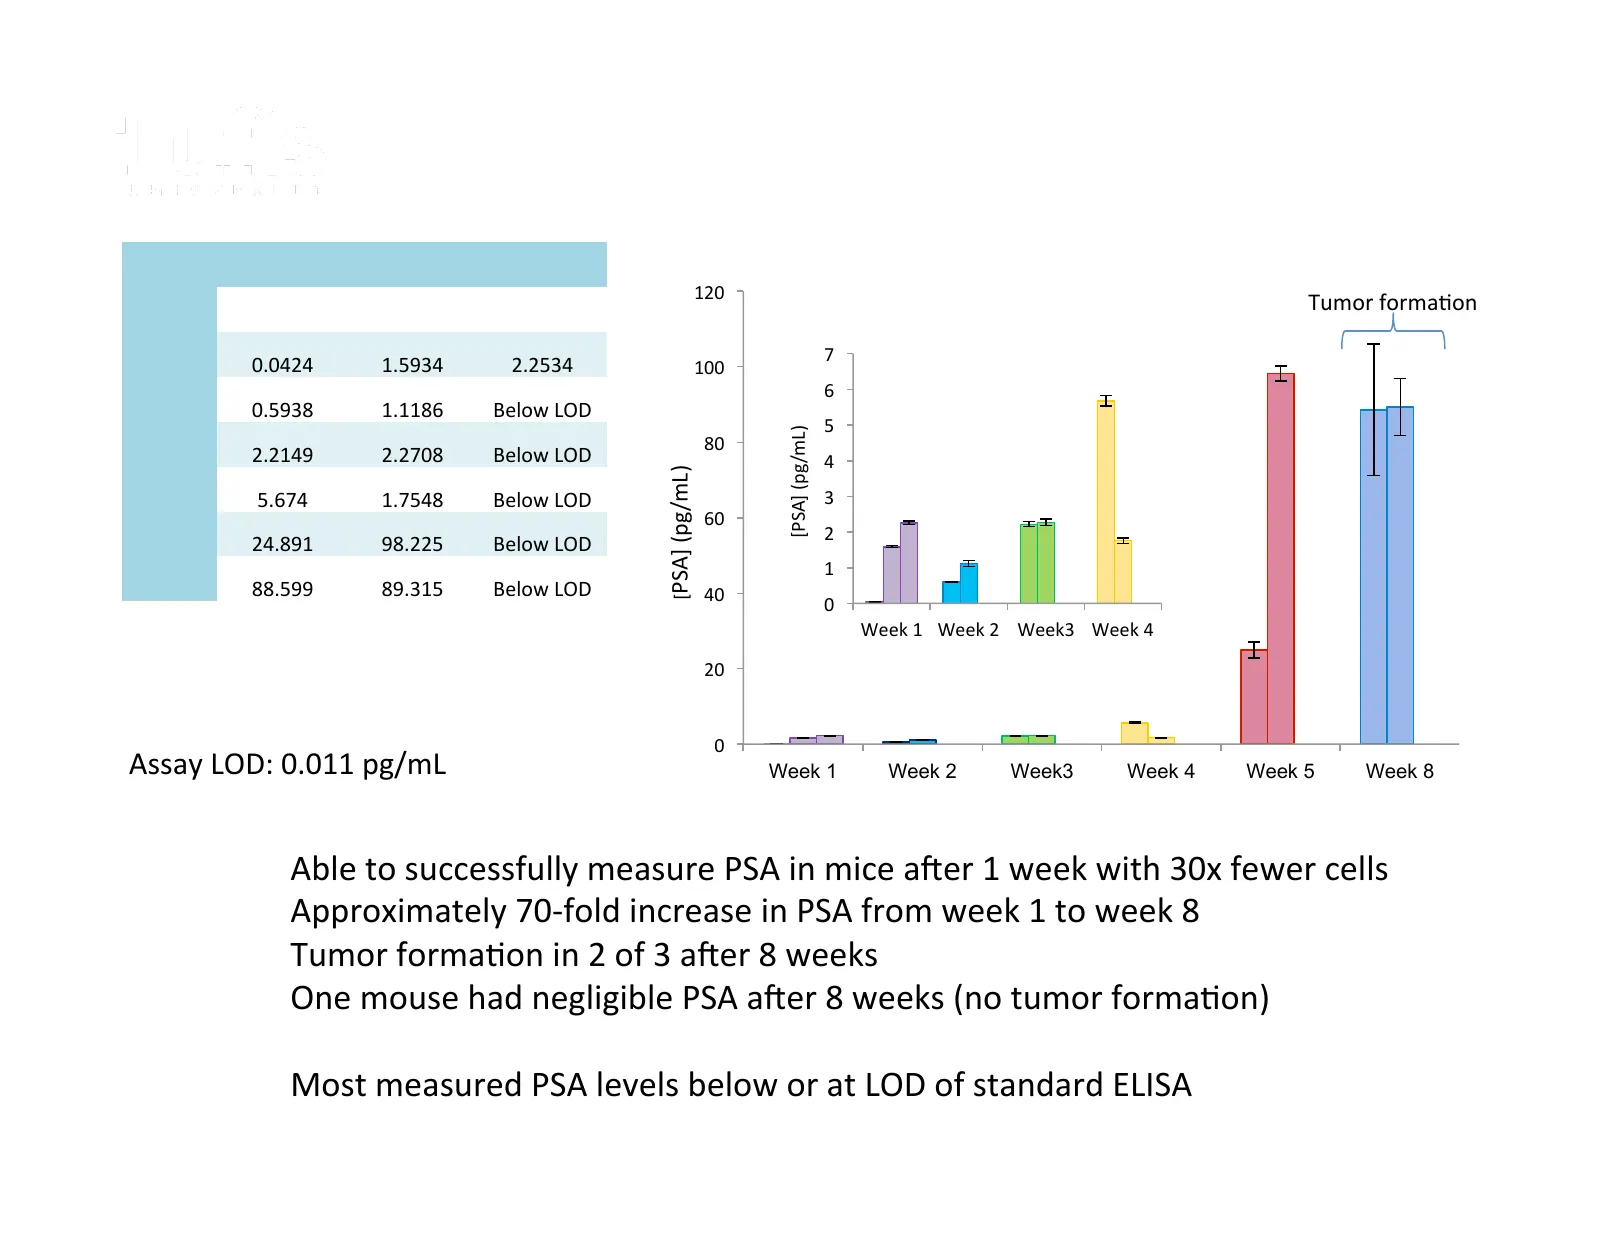
Inocula>on with 100k LNCaP Cells Walt Laboratory [PSA] (pg/mL) PSA in serum of mice inoculated with 100k Mouse 1 Mouse 2 Mouse 3 120 LNCaP Cells Tumor forma@on 7 Week 1 0.0424 1.5934 2.2534 100 6 Week 2 0.5938 1.1186 Below LOD 5 [PSA] (pg/mL) 80 Week 3 2.2149 2.2708 Below LOD 4 [PSA] (pg/mL) Week 4
Slide 23: Inoculation with 10k LNCaP Cells
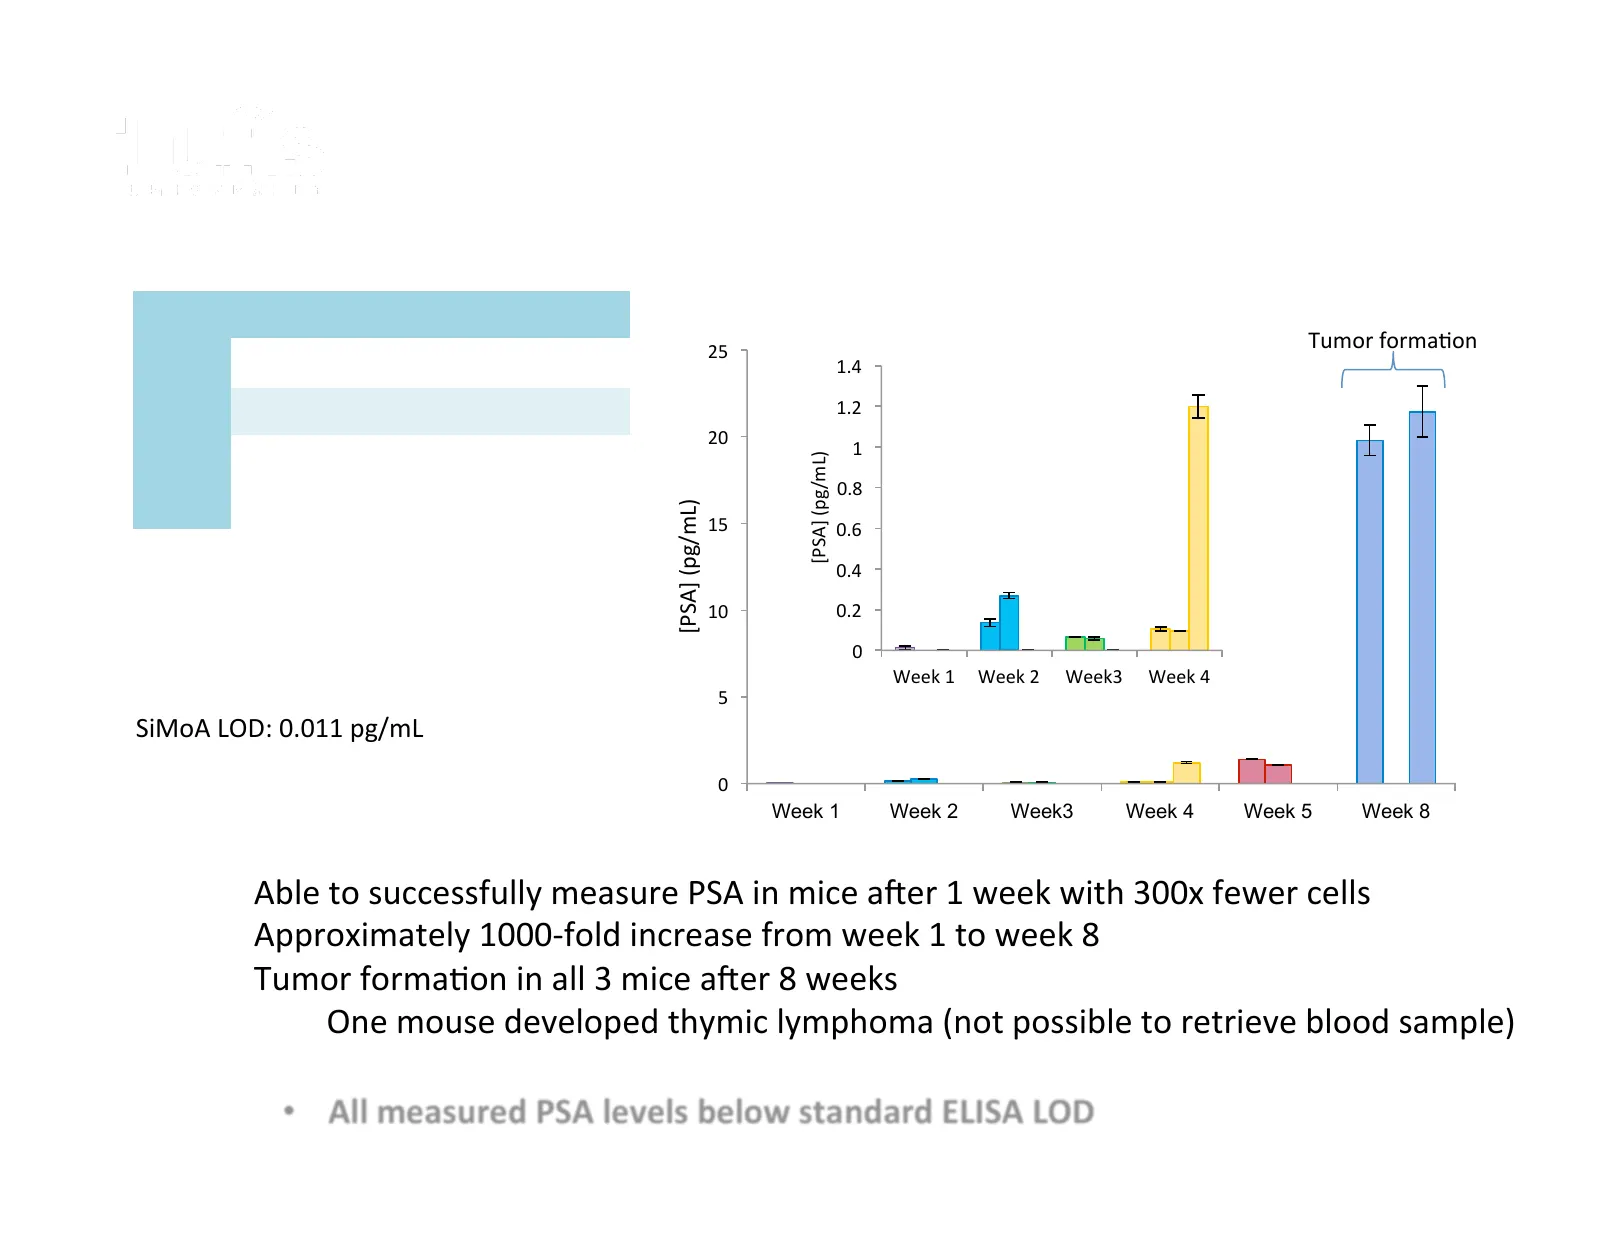
Inocula>on with 10k LNCaP Cells Walt Laboratory PSA in serum of mice inoculated with 10k LNCaP Cells 25 Tumor forma@on 1.4 1.2 20 1 [PSA] (pg/mL) 0.8 [PSA] (pg/mL) 15 0.6 0.4 10 0.2 0 Week 1 Week 2 Week3 Week 4 5 SiMoA LOD: 0.011 pg/mL 0 Week 1 Week 2 Week3 Week 4 Week 5 Week 8 • Able to successfull
Slide 24: Immune Host Response
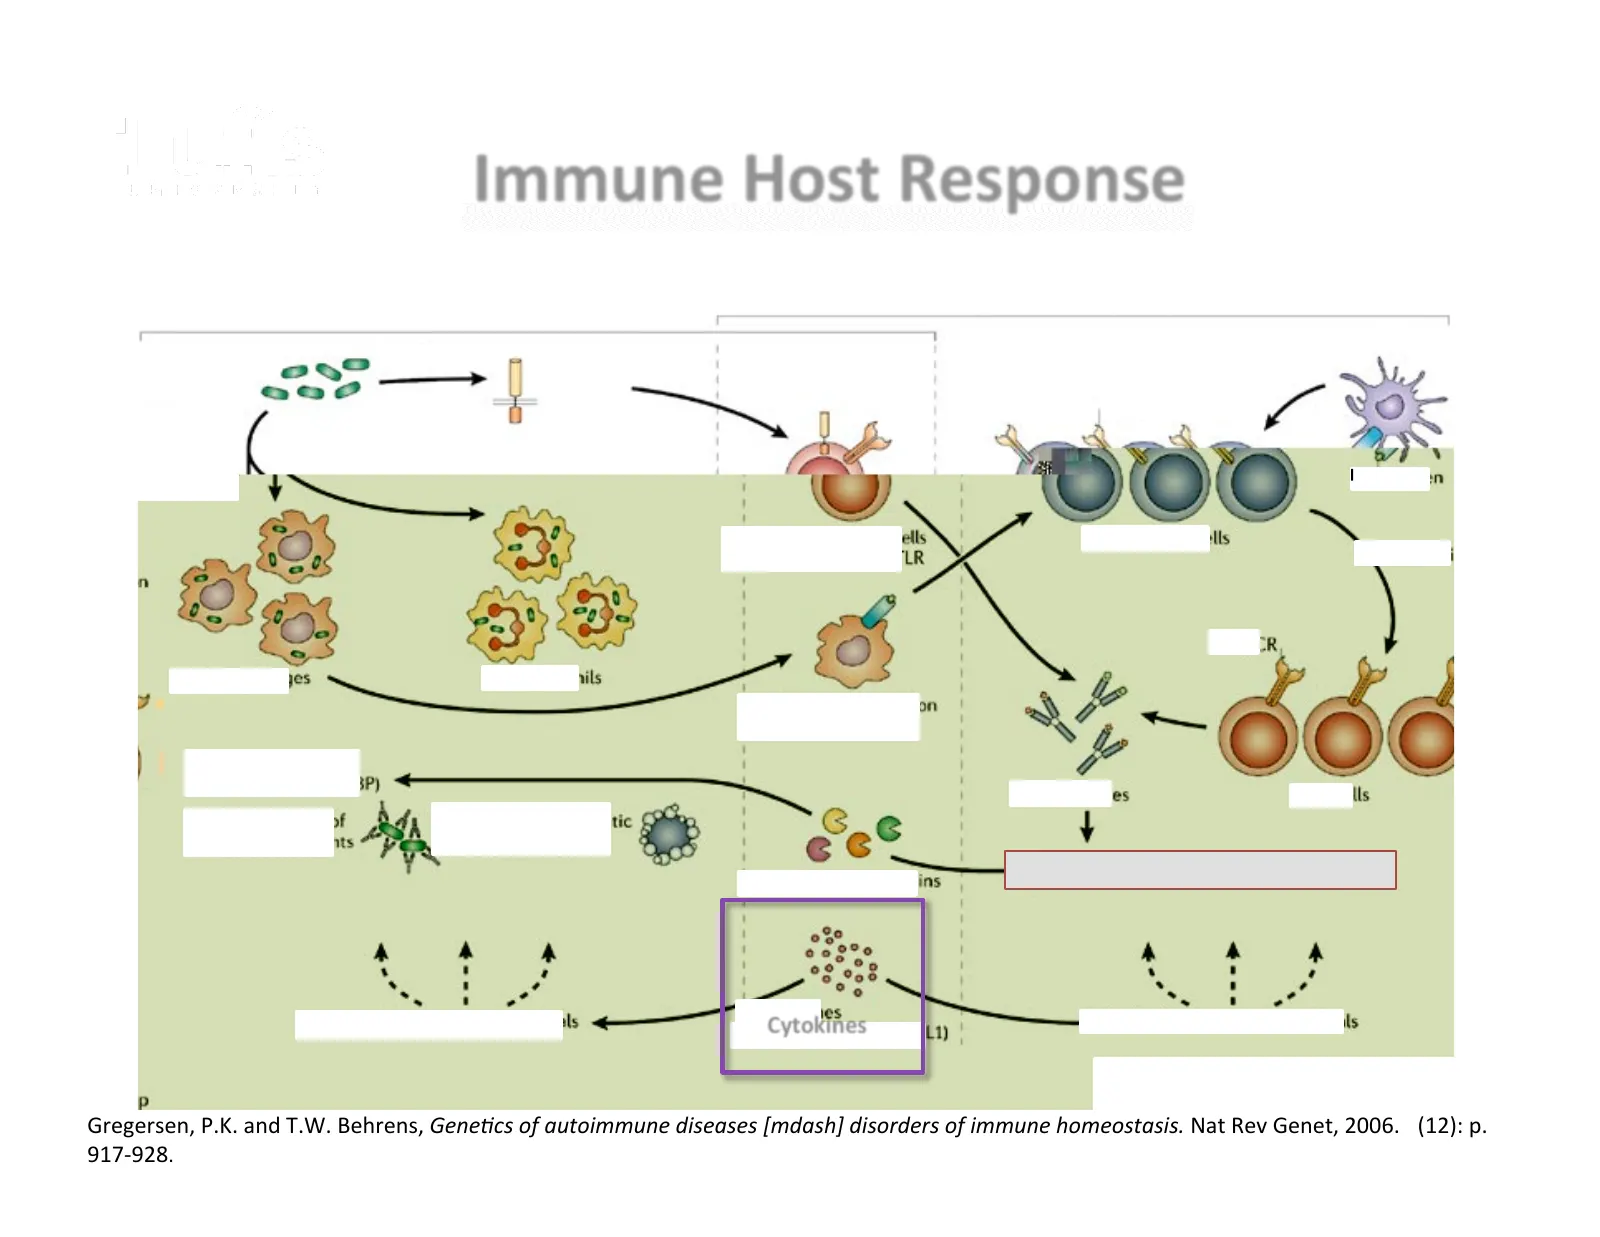
Immune Host Response Walt Laboratory Adap>ve immune system Innate immune system APC Ac>va>on PRRs Infec>ous (e.g. TLRs) agent TCR Phagocy>c or endocy>c uptake An>gen Co-‐ac>va>on of B cells Effector T cells through BCR and TLR S>mula>on BCR Macrophages Neutrophils An>gen presenta>on by macrophage So
Slide 25: Cytokines Relating to Infectious Diseases
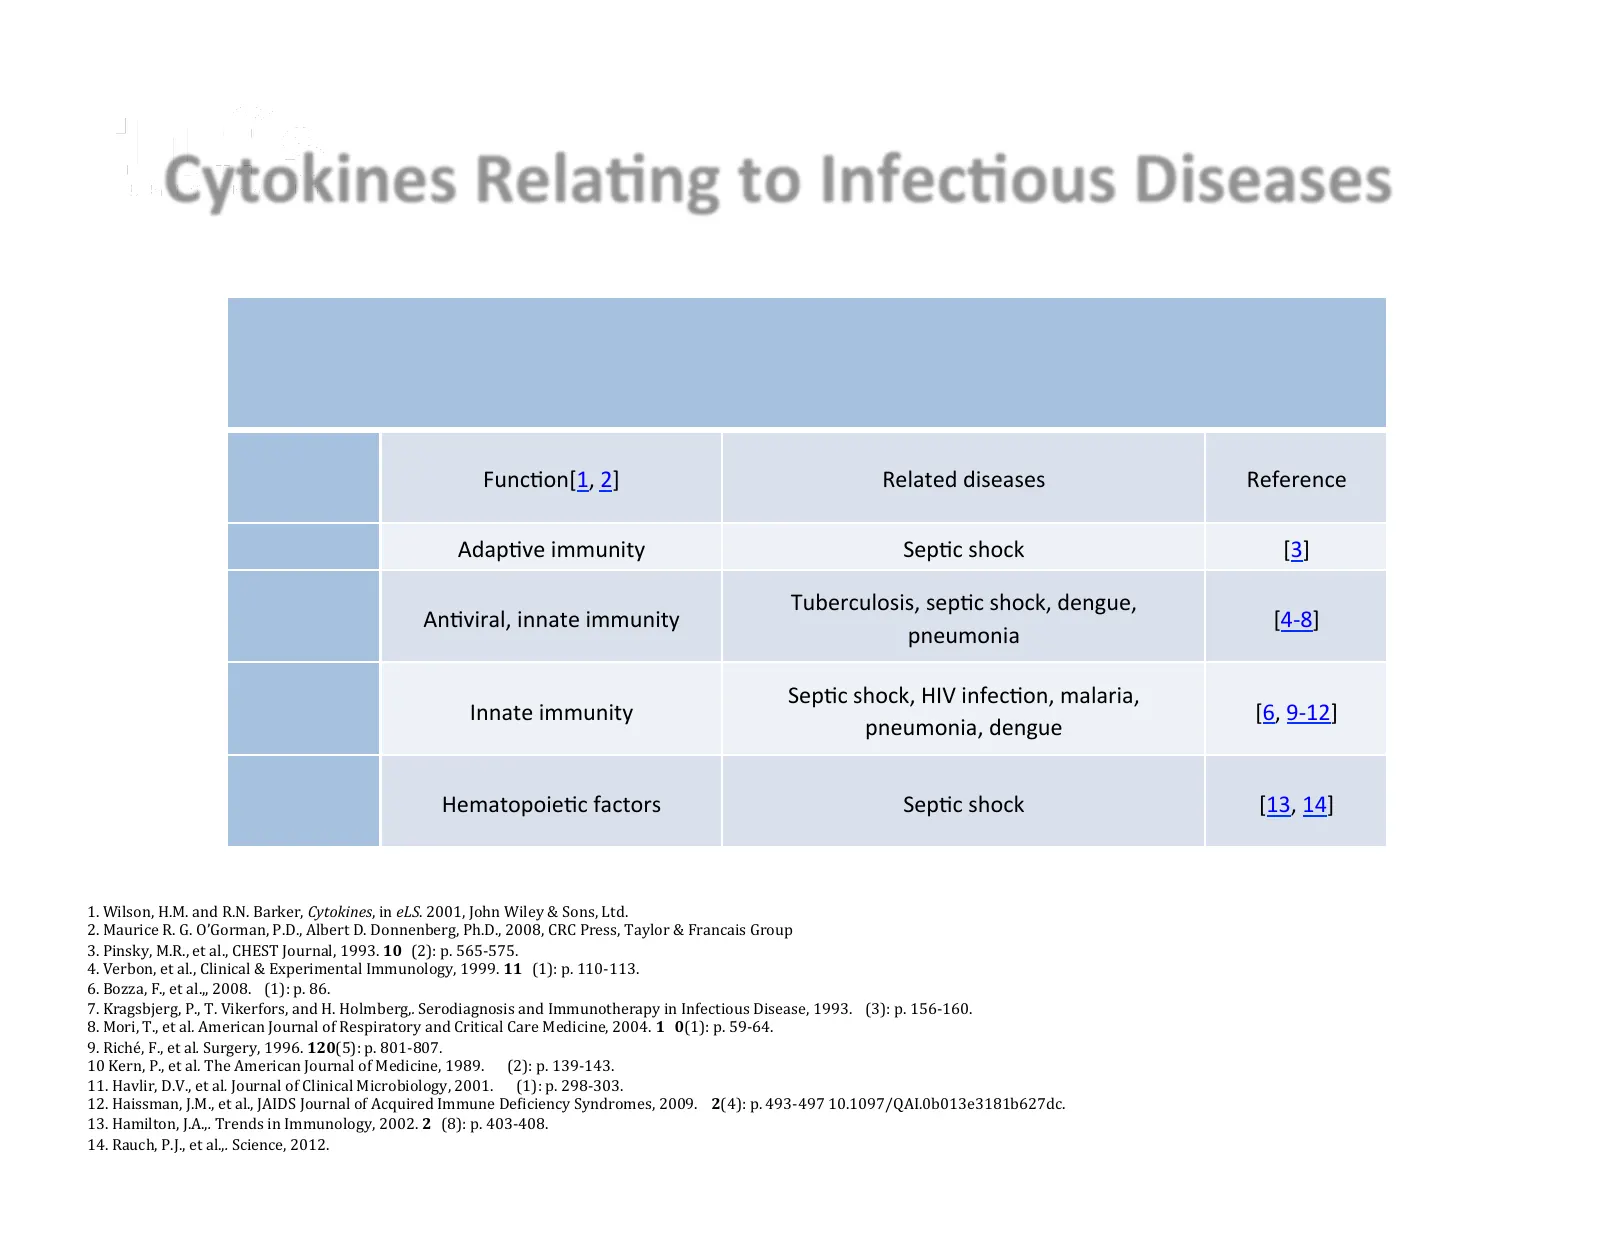
Cytokines Rela>ng to Infec>ous Diseases Walt Laboratory Cytokines for which we are developing SiMoA assays Cytokine Func@on[1, 2] Related diseases Reference IL-‐2 Adap@ve immunity Sep@c shock [3] Tuberculosis, sep@c shock, dengue, IFN-‐γ An@viral, innate immunity [4-‐8] pneumonia Sep@c shock, HIV
Slide 26: Summary for Eight Cytokines
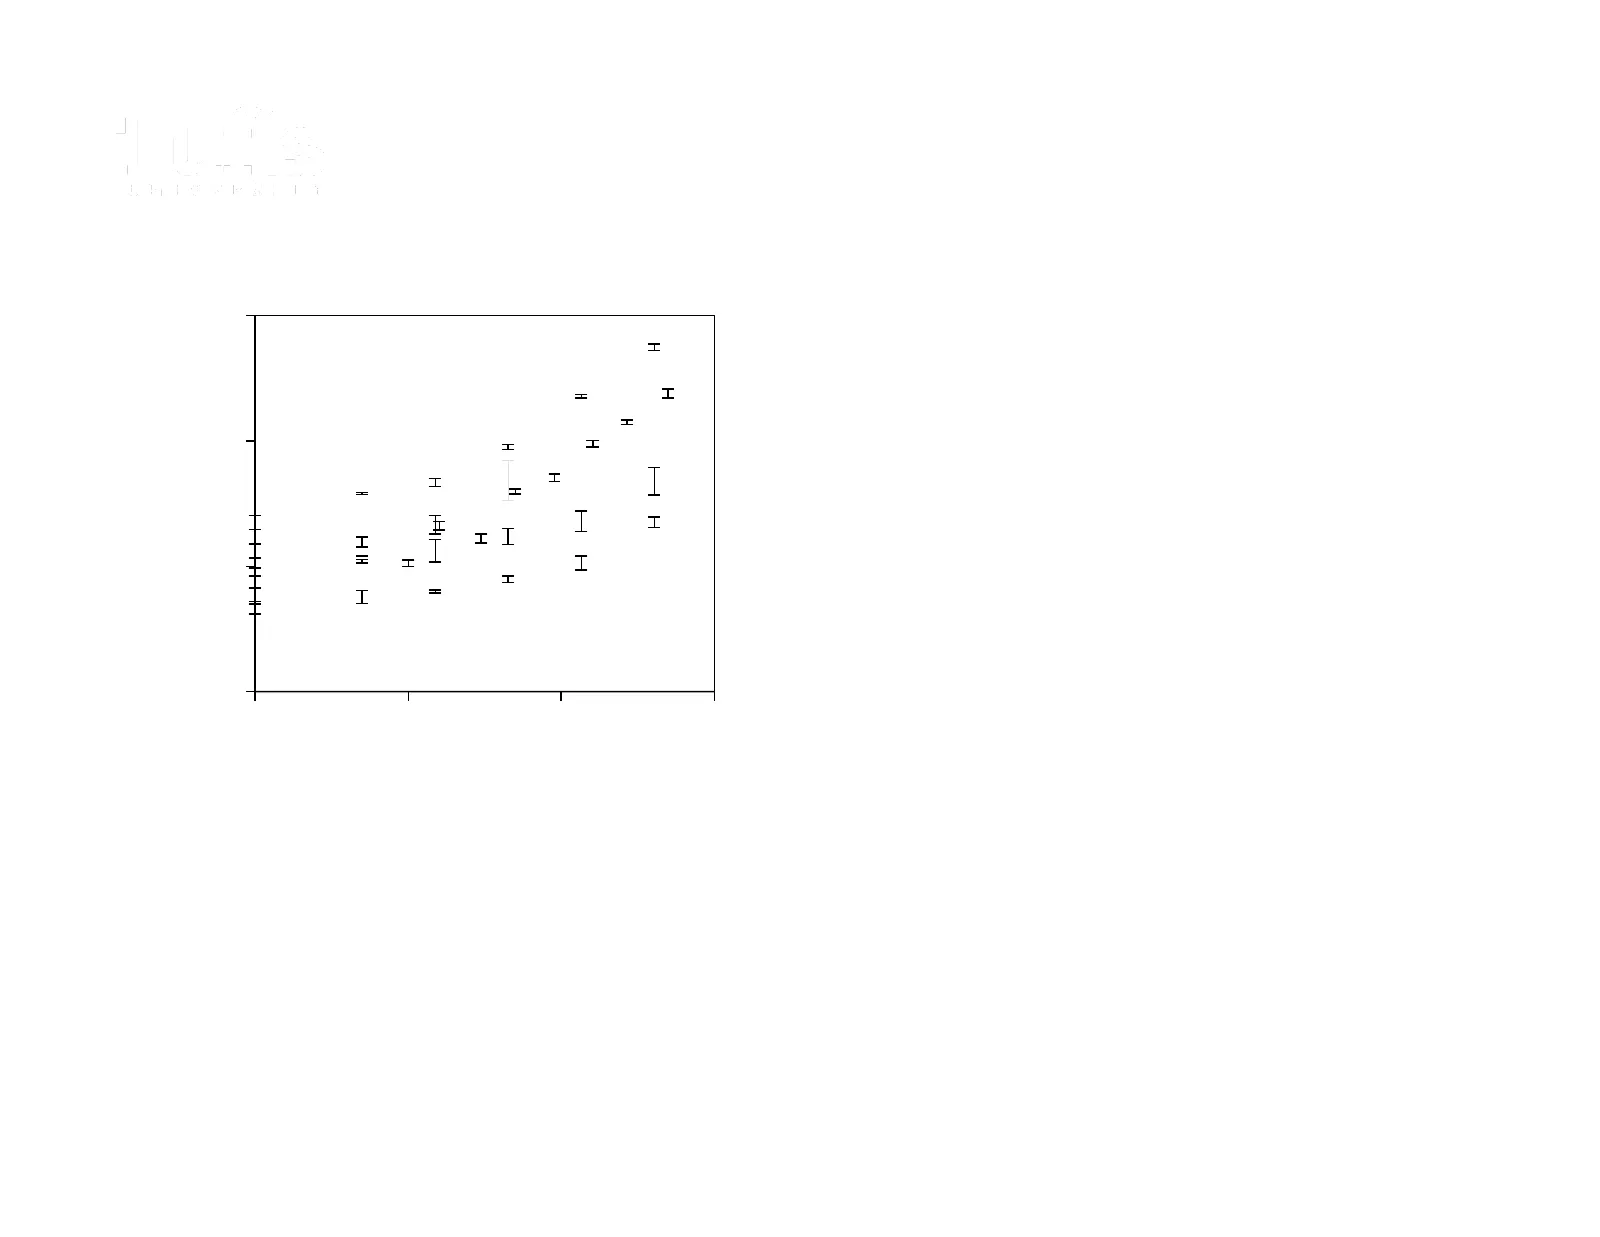
Summary for Eight Cytokines Walt Laboratory
Slide 27: GM-CSF Measurement by Commercial ELISA Kits
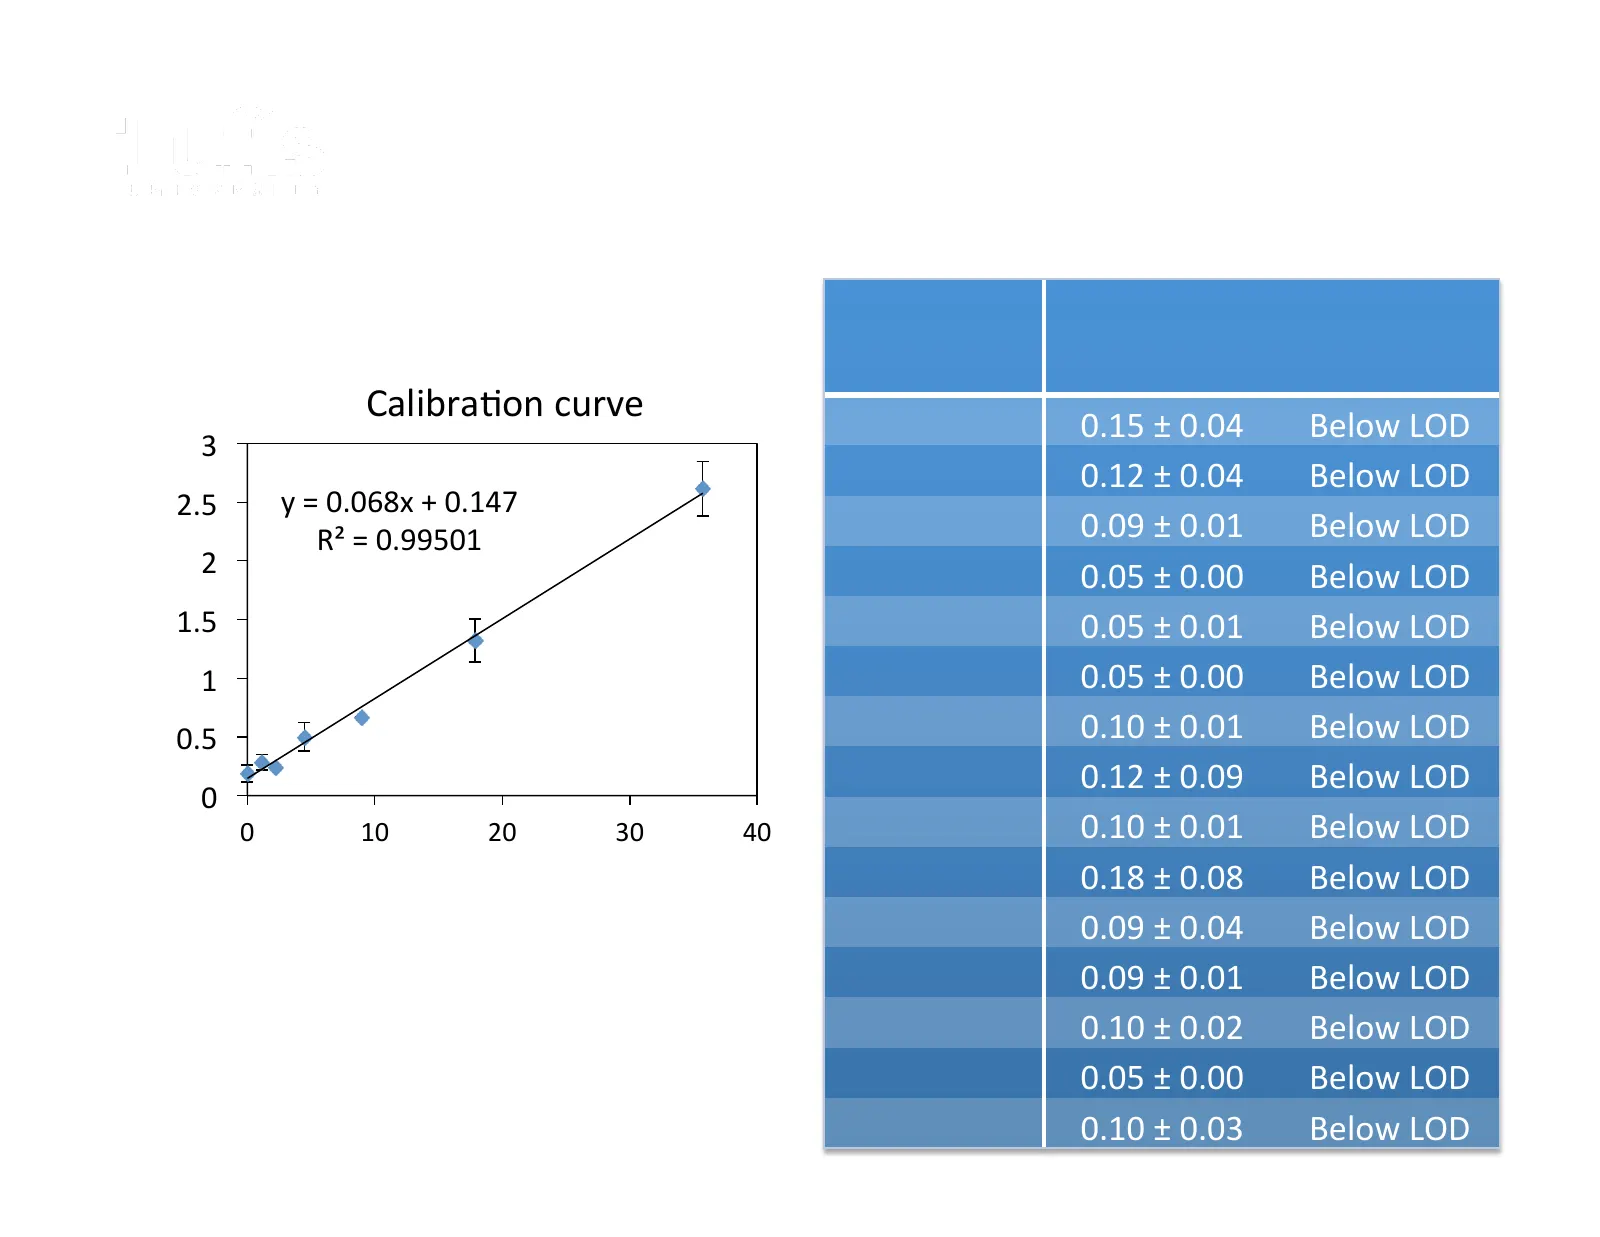
GM-‐CSF Measurement by Walt Laboratory Commercial ELISA Kits [GM-‐CSF], pM Absorbance Detected with Sample Detected with commercial ELISA commercial ELISA kit kit Calibra@on curve 1 0.15 ± 0.04 Below LOD 3 2 0.12 ± 0.04 Below LOD 2.5 y = 0.068x + 0.147 R² = 0.99501 3 0.09 ± 0.01 Below LOD Absorban
Slide 28: GM-CSF SiMoA for Healthy Human Serum Samples
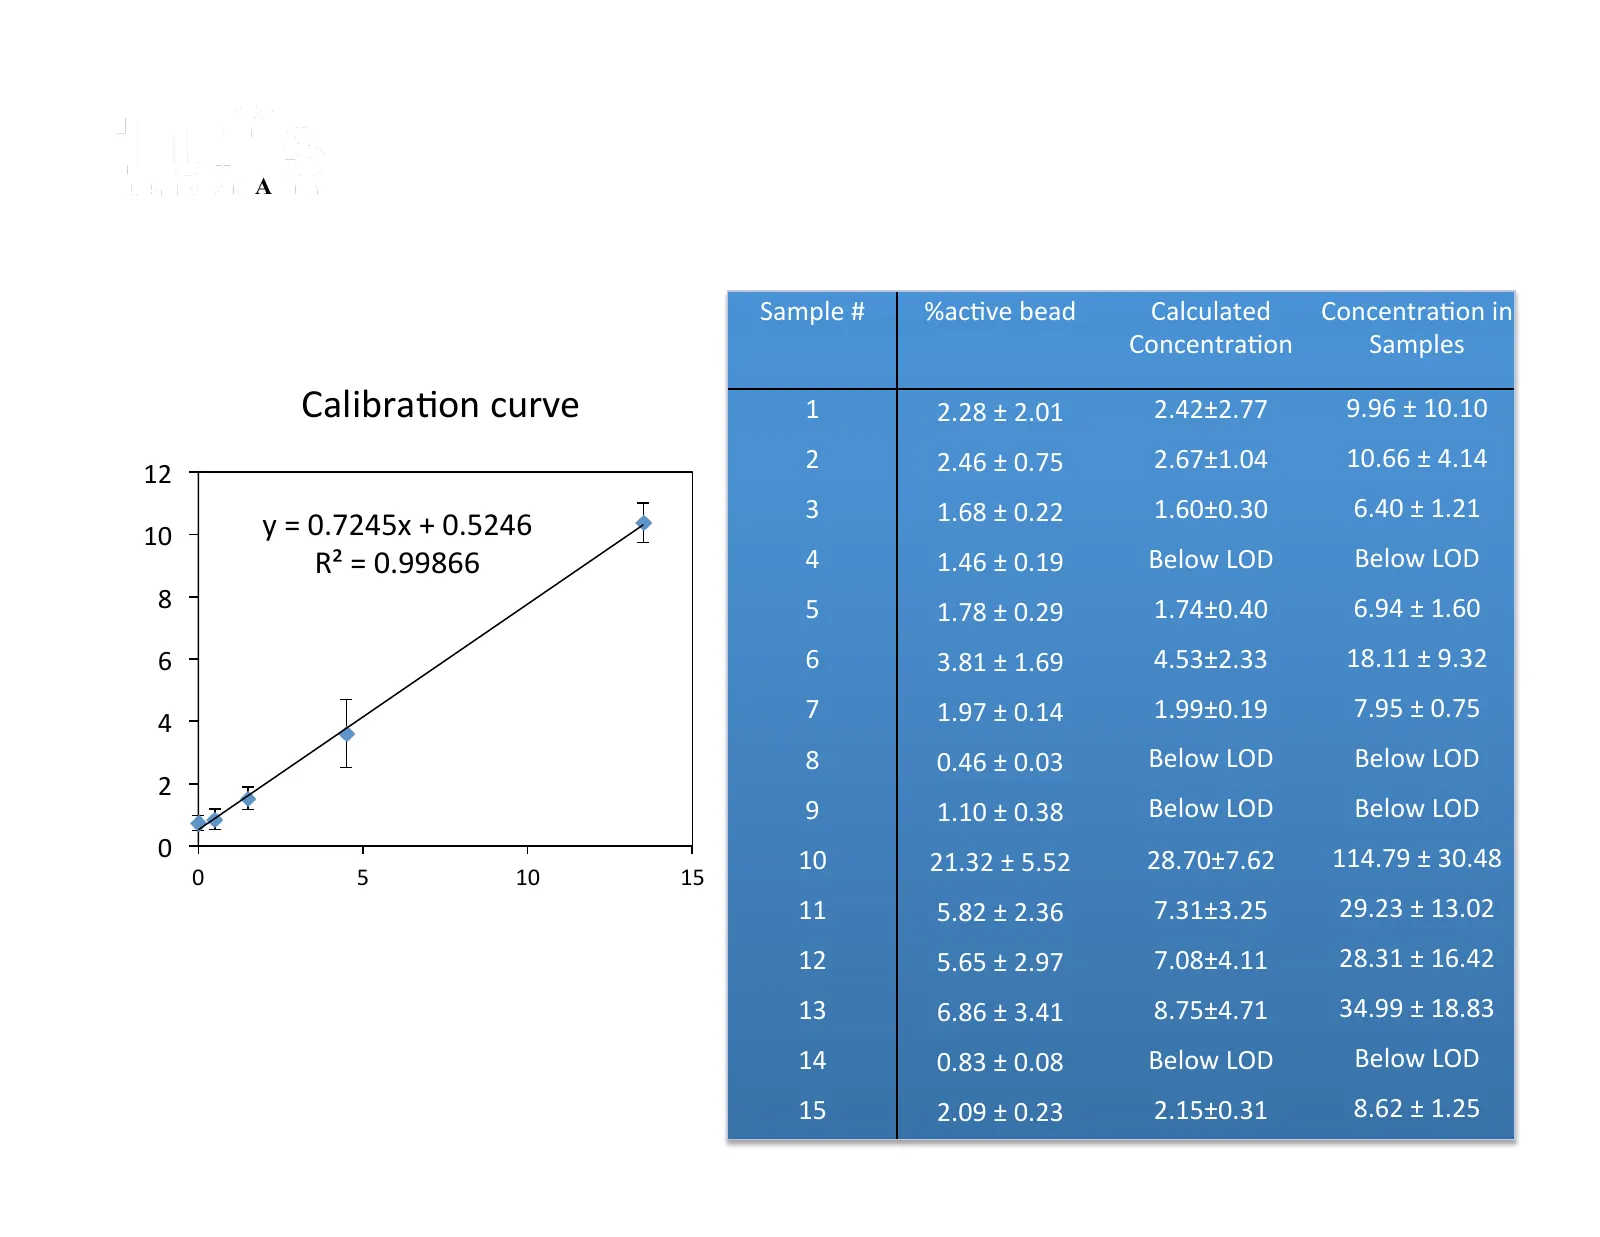
GM-‐CSF SiMoA for Healthy Human A Walt Laboratory Serum Samples Sample # %ac@ve bead Calculated Concentra@on in Concentra@on Samples Calibra@on curve 1 2.28 ± 2.01 2.42±2.77 9.96 ± 10.10 2 2.46 ± 0.75 2.67±1.04 10.66 ± 4.14 12 3 1.68 ± 0.22 1.60±0.30 6.40 ± 1.21 10 y = 0.7245x + 0.5246 % ac>ve bead
Slide 29: Profiles for Eight Cytokines in Healthy Human Serum Samples
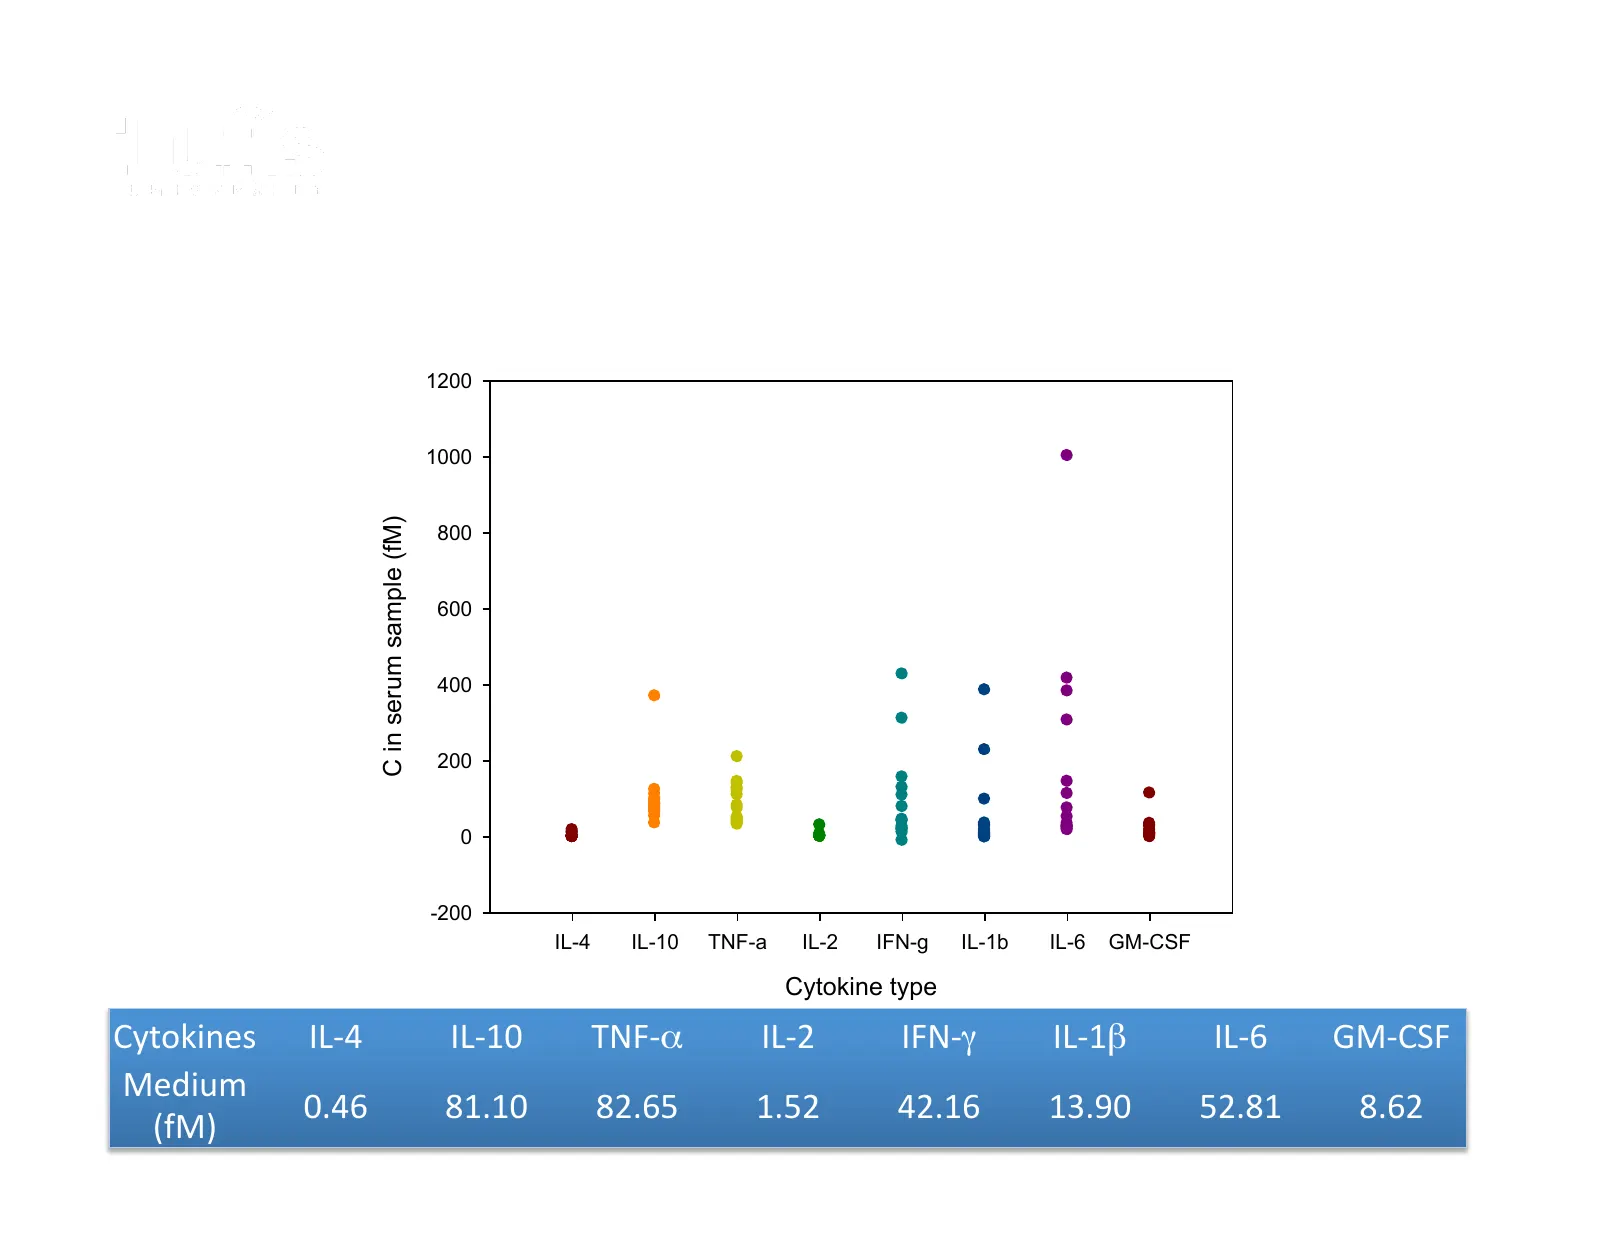
Profiles for Eight Cytokines in Walt Laboratory 15 Healthy Human Serum Samples 1200 1000 C in serum sample (fM) 800 600 400 200 0 -200 IL-4 IL-10 TNF-a IL-2 IFN-g IL-1b IL-6 GM-CSF Cytokine type Cytokines IL-‐4 IL-‐10 TNF-‐α IL-‐2 IFN-‐γ IL-‐1β IL-‐6 GM-‐CSF Medium 0.46 81.10 82.65 1.52 42.16
Slide 30: Cytokine Profiles for Healthy Human Samples
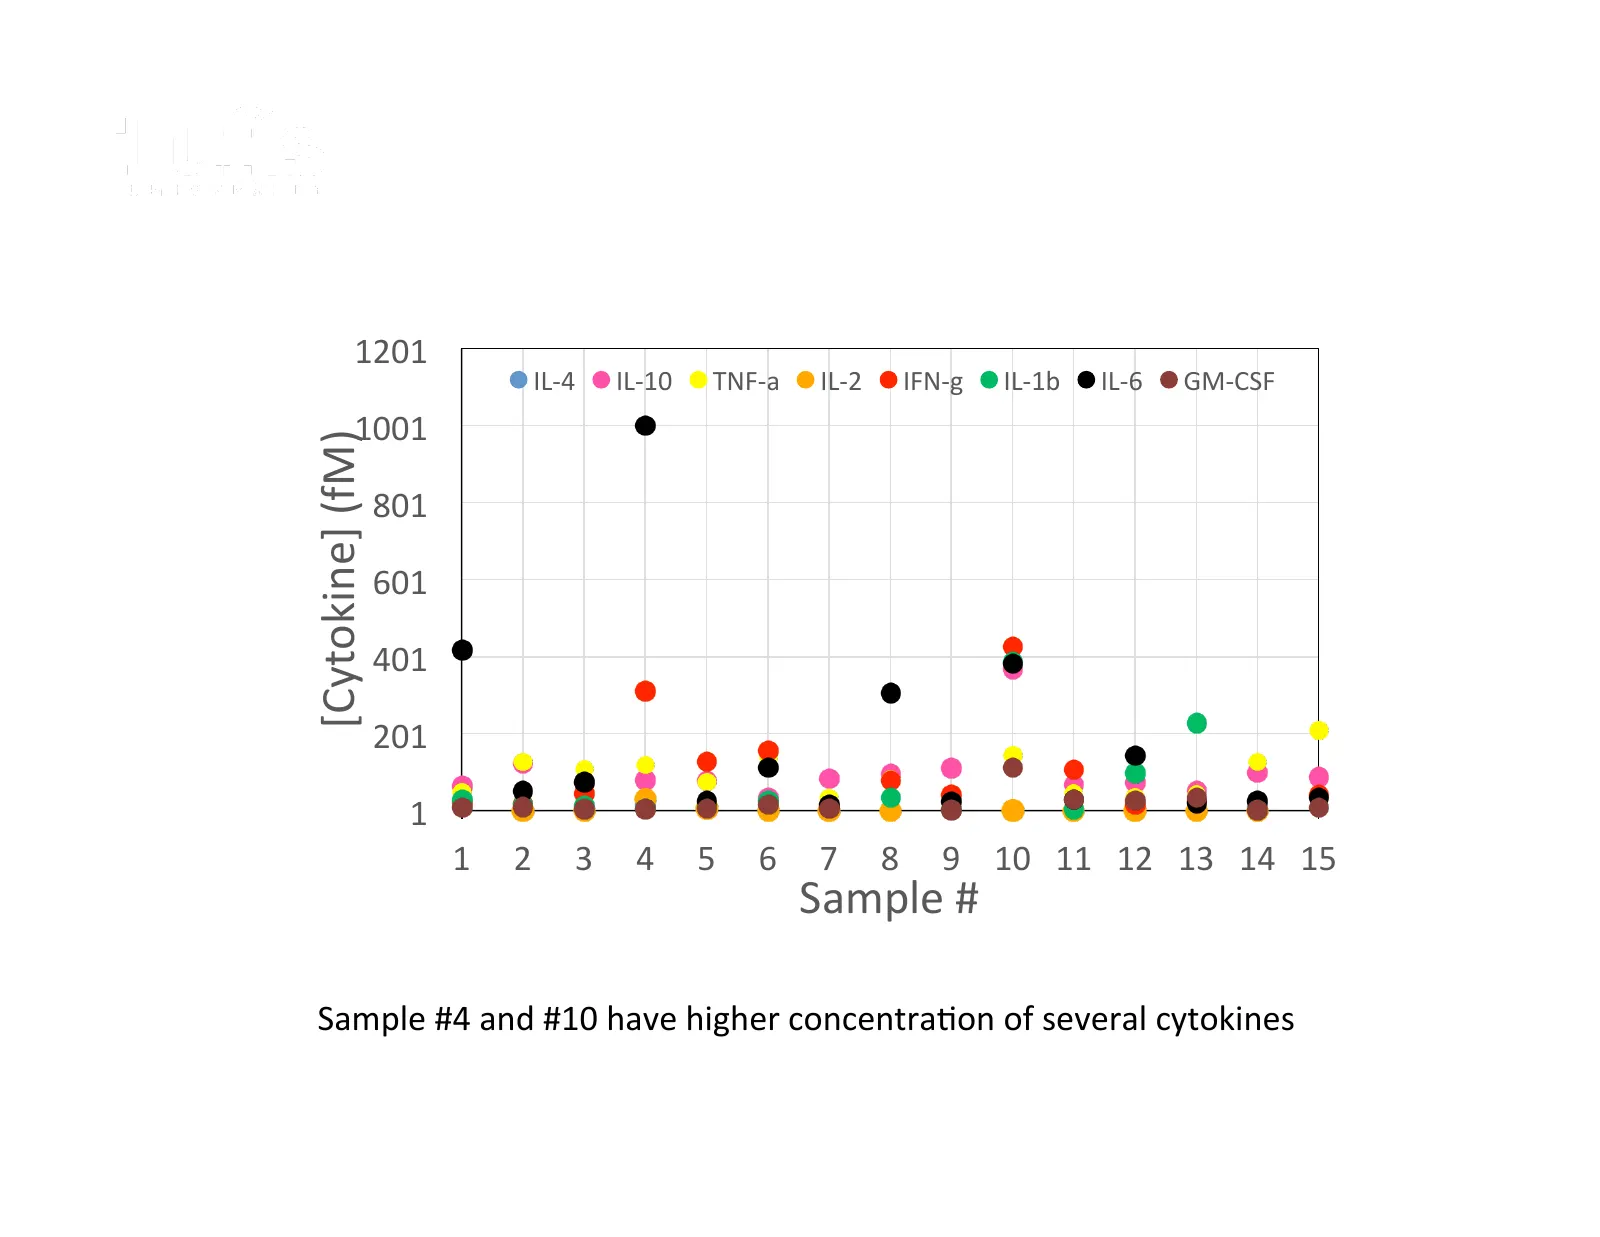
Cytokine Profiles for 15 Healthy Human Samples Cytokine Values Vary Between Individuals Walt Laboratory 1201 IL-‐4 IL-‐10 TNF-‐a IL-‐2 IFN-‐g IL-‐1b IL-‐6 GM-‐CSF 1001 [Cytokine] (fM) 801 601 401 201 1 1 2 3 4 5 6 7 8 9 10 11 12 13 14 15 Sample # Sample #4 and #10 have higher concentra@on of
Slide 31: Influenza Biomarker Discovery
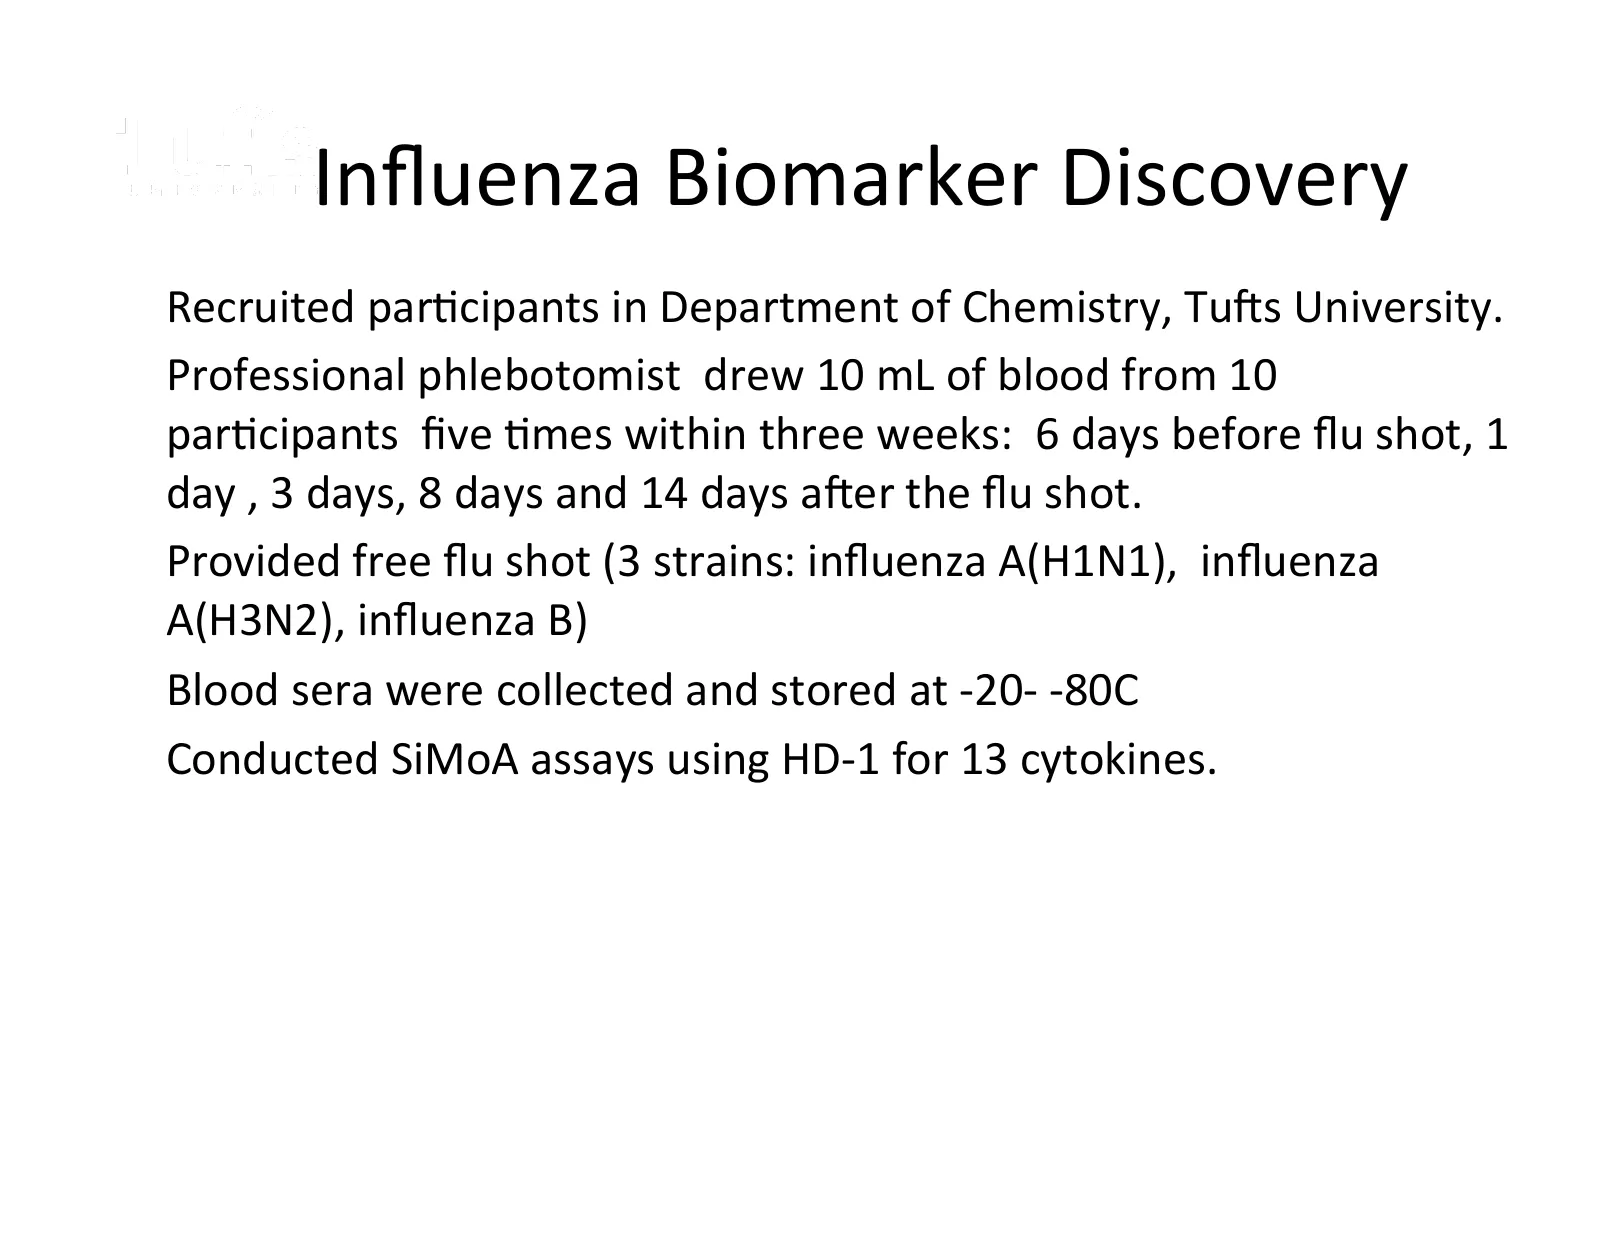
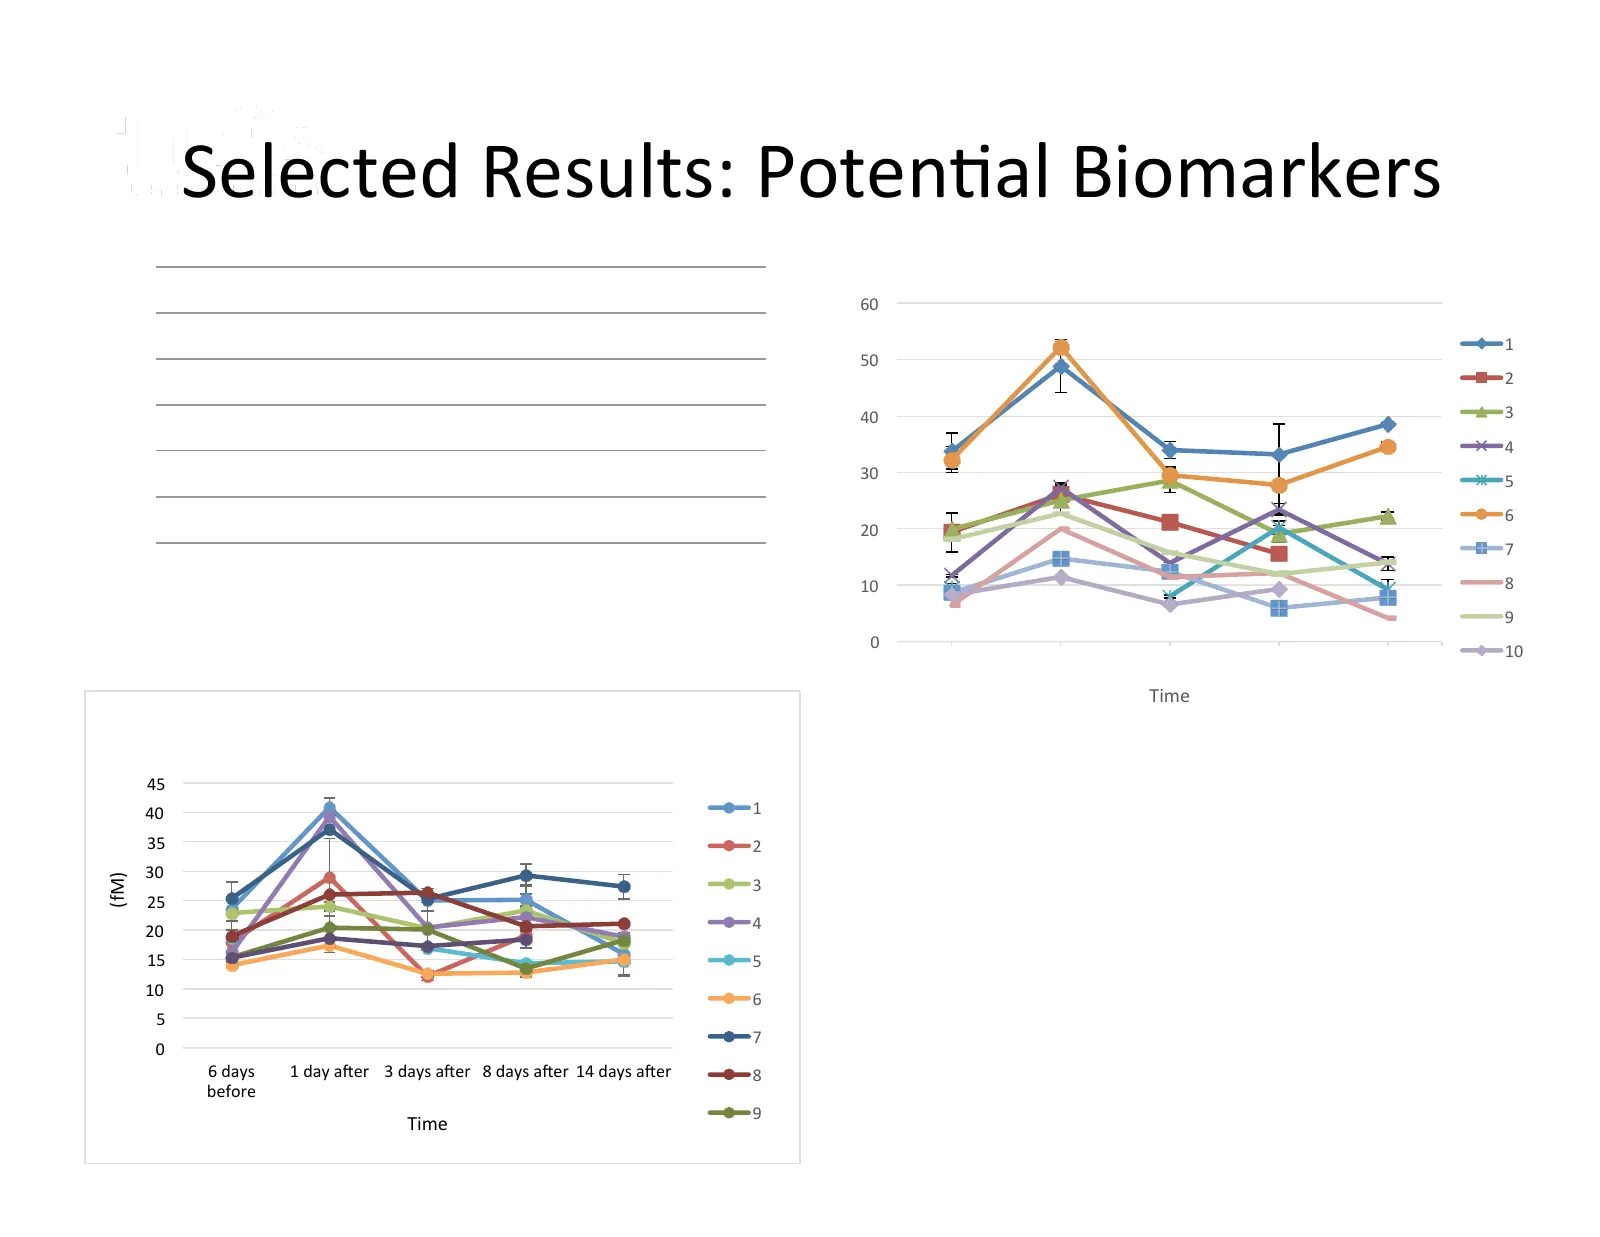
Walt Laboratory Influenza Biomarker Discovery • Recruited par@cipants in Department of Chemistry, Tugs University. • Professional phlebotomist drew 10 mL of blood from 10 par@cipants five @mes within three weeks: 6 days before flu shot, 1 day , 3 days, 8 days and 14 days ager the flu shot. • Provided fr
Slide 32: Selected Results: Potential Biomarkers
Walt Laboratory Selected Results: Poten@al Biomarkers 60 2 1 50 2 40 3 4 (fM) 30 5 6 20 7 10 8 9 0 10 6 days before 1 day aOer 3 days aOer 8 days aOer 14 days aOer Time 3 45 40 1 35 2 30 (fM) 3 25 20 4 15 5 10 6 5 7 0 6 days 1 day ager 3 days ager 8 days ager 14 days ager 8 before 9 Time
Slide 33: Outline
Walt Laboratory Outline • Array Format • Fundamental Enzyme Studies • Clinical Applica@ons • Single Cells 33
Slide 34: Motivation for Single Cell Measurements
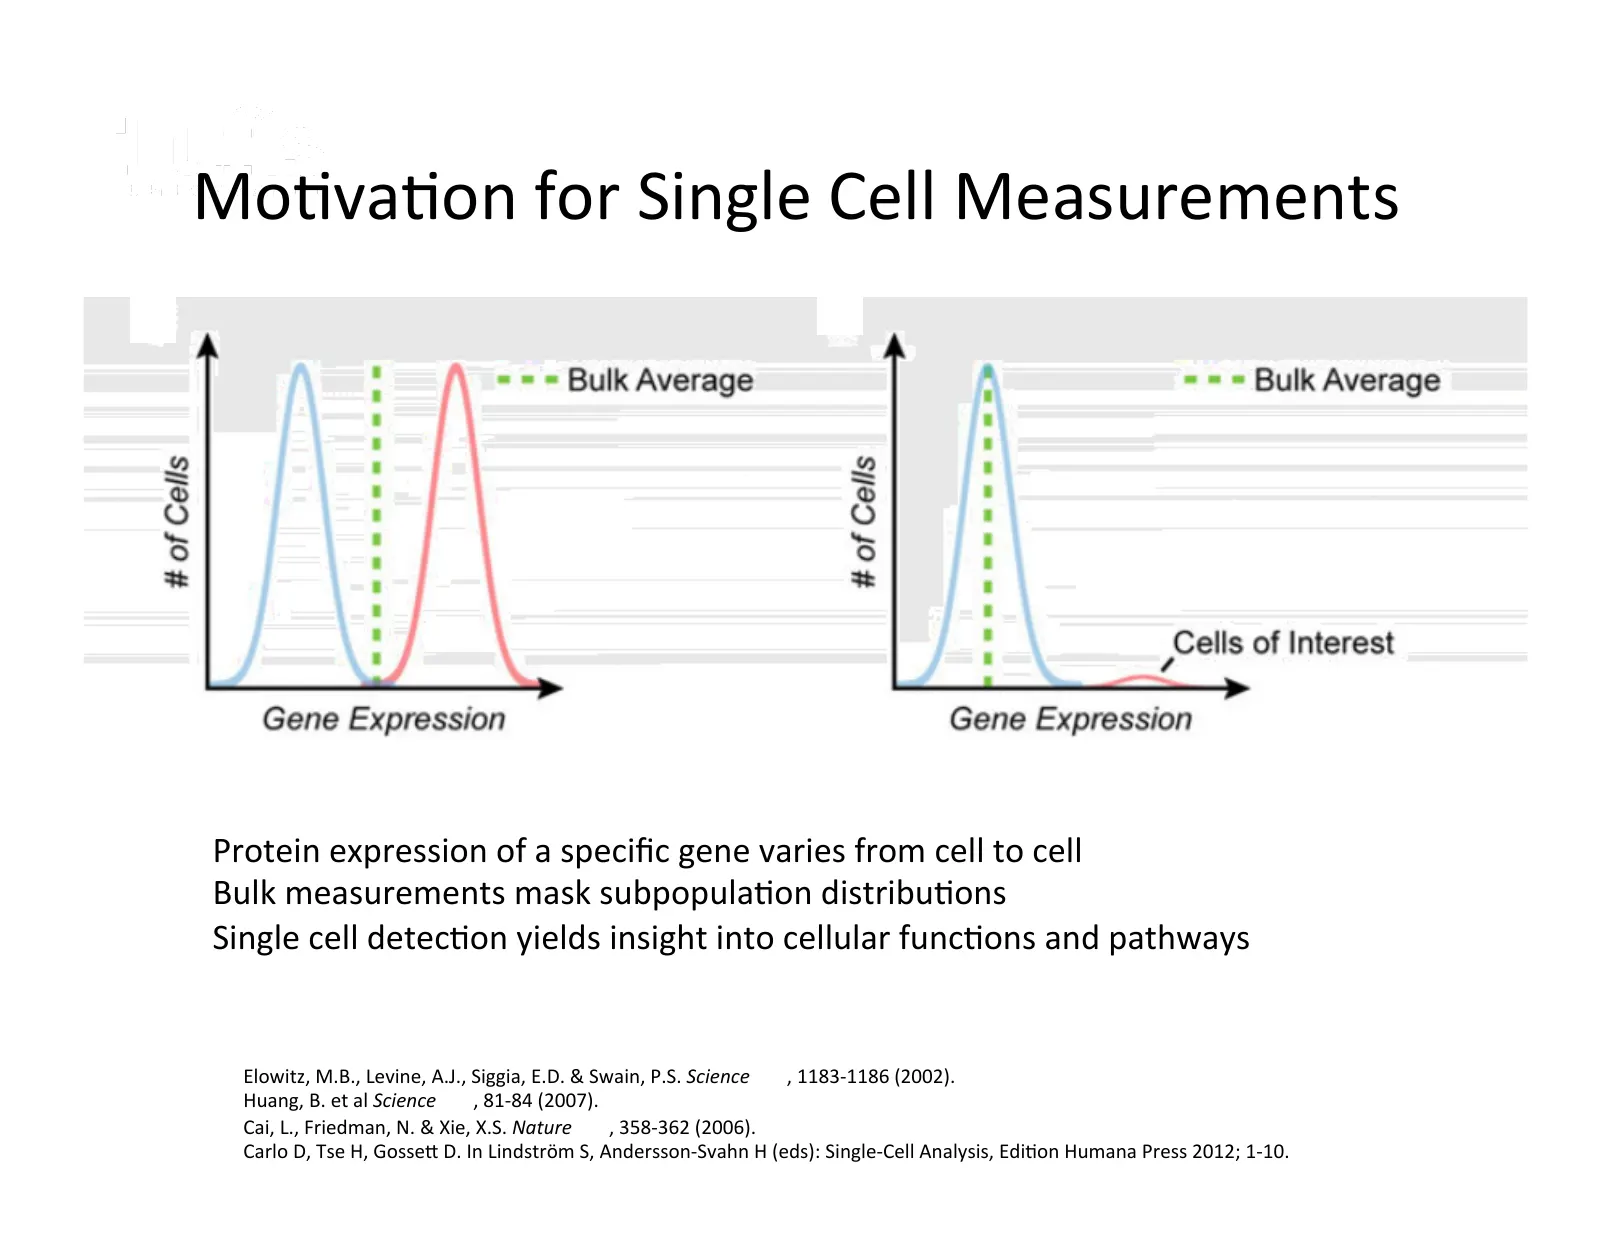
Mo@va@on for Single Cell Measurements Walt Laboratory • Protein expression of a specific gene varies from cell to cell • Bulk measurements mask subpopula@on distribu@ons • Single cell detec@on yields insight into cellular func@ons and pathways Elowitz, M.B., Levine, A.J., Siggia, E.D. & Swain, P.S. S
Slide 35: Single cell analysis for cancer
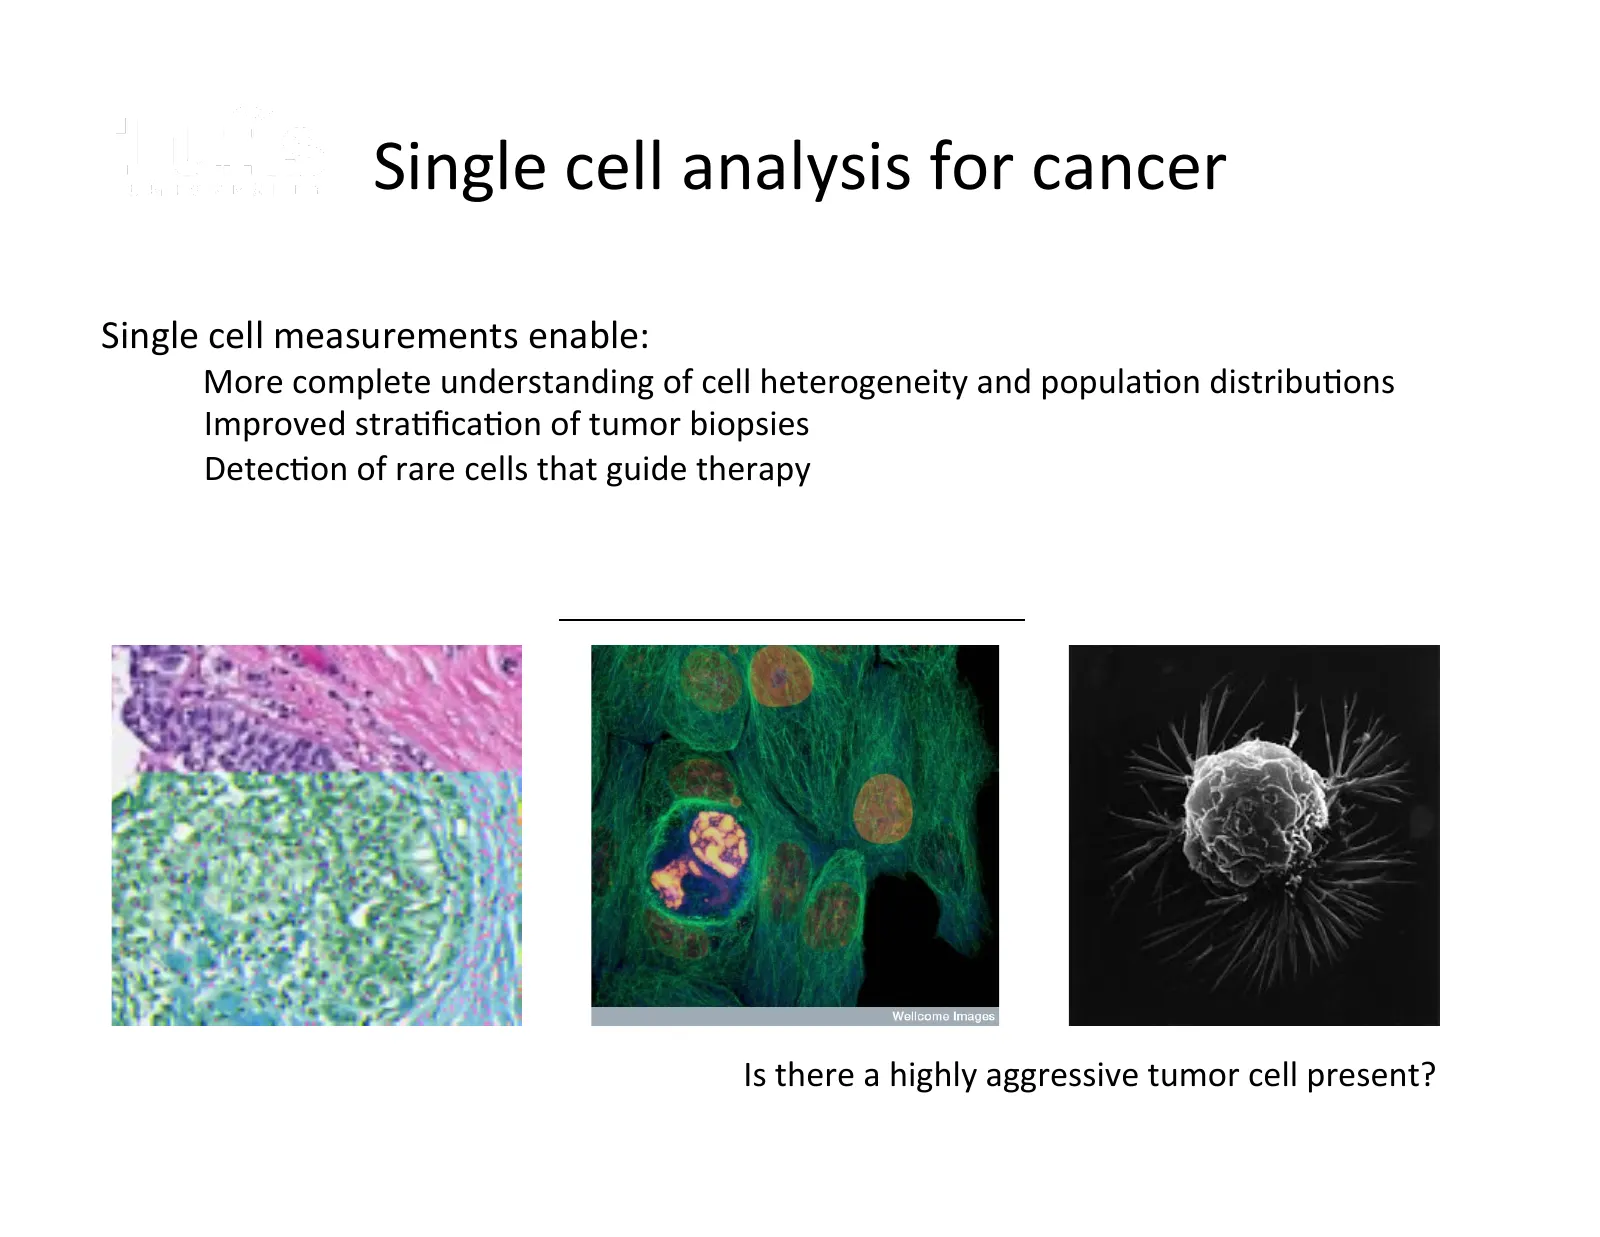
Single cell analysis for cancer Walt Laboratory Single cell measurements enable: • More complete understanding of cell heterogeneity and popula@on distribu@ons • Improved stra@fica@on of tumor biopsies • Detec@on of rare cells that guide therapy Heterogeneity in Cancer Tissue Is there a highly aggres
Slide 36: The Challenge for Single Cell Analysis
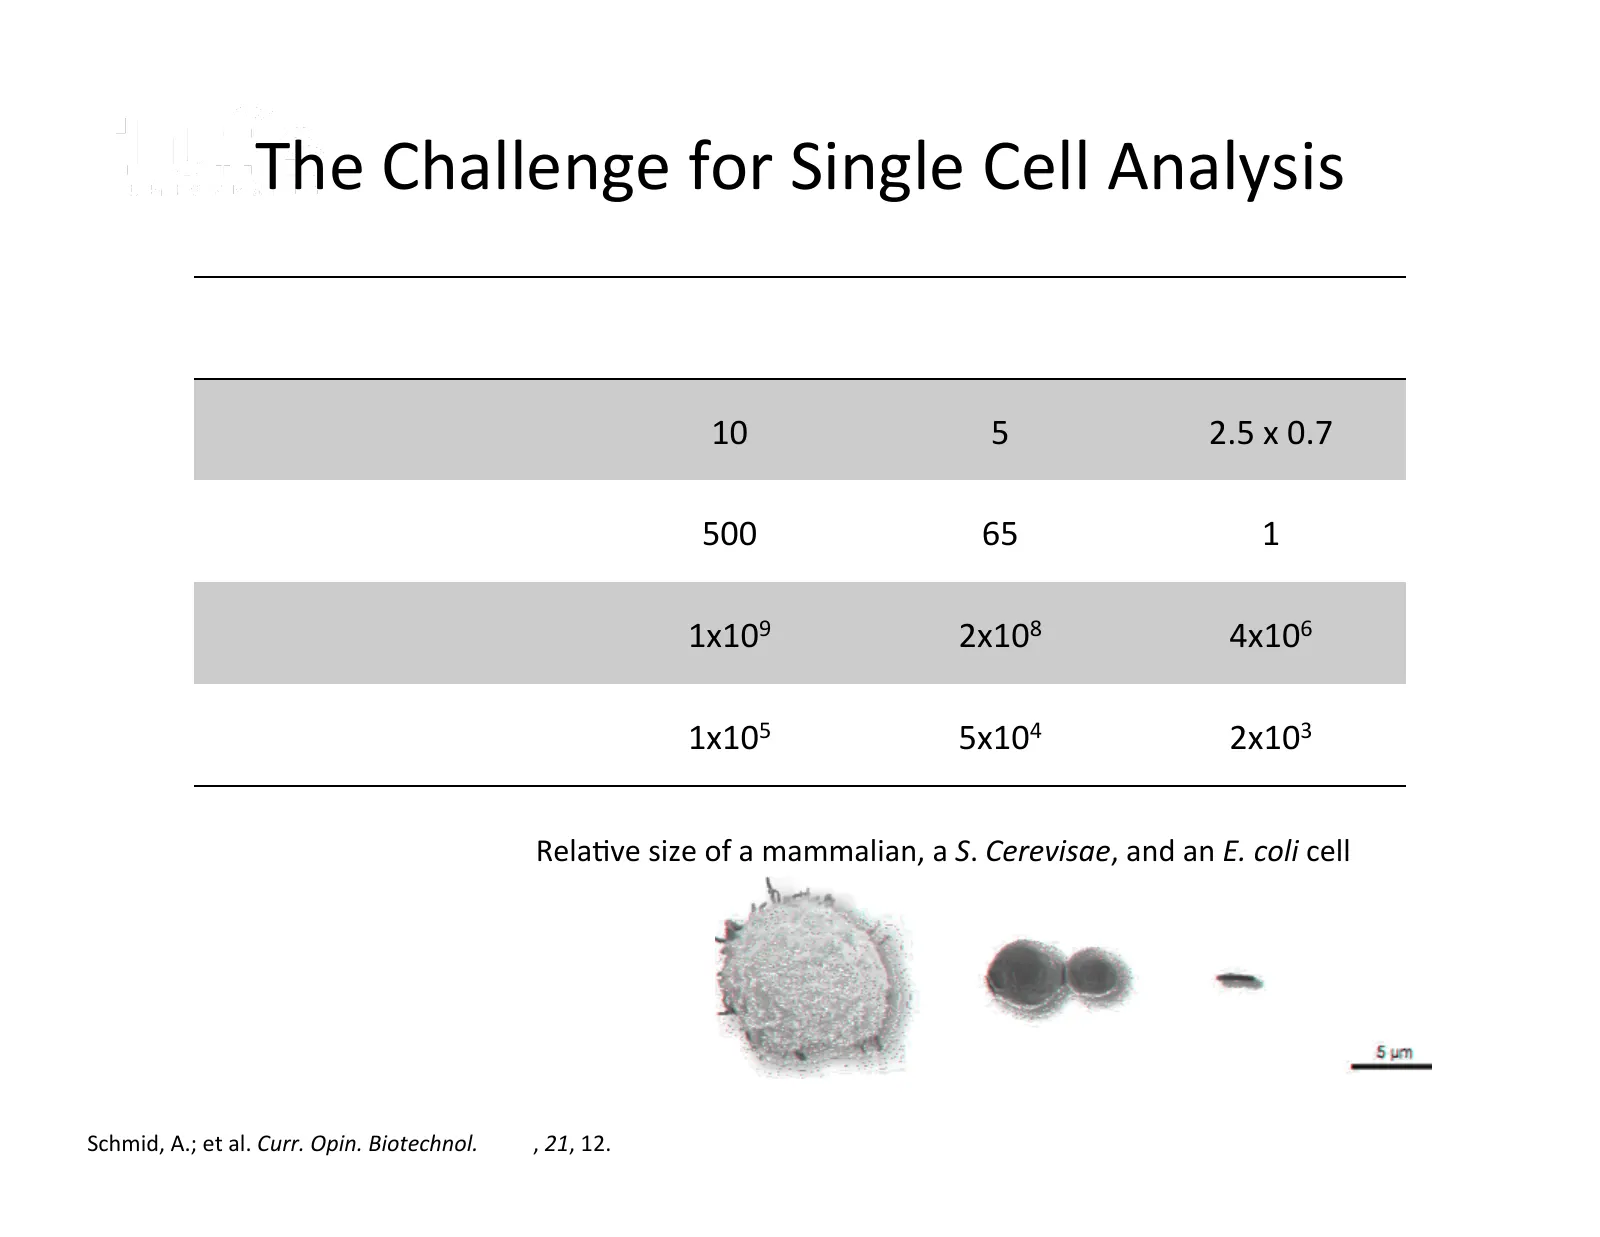
The Challenge for Single Cell Analysis Walt Laboratory Mammalian Yeast Bacteria Diameter (µm) 10 5 2.5 x 0.7 Volume (µm3) 500 65 1 Total Protein Content 1x10⁹ 2x10⁸ 4x10⁶ (# molecules) Average per protein 1x10⁵ 5x10⁴ 2x10³ (# molecules) Rela@ve size of a mammalian, a S. Cerevisae, and an E. coli cel
Slide 37: Scheme: Single Cell SiMoA
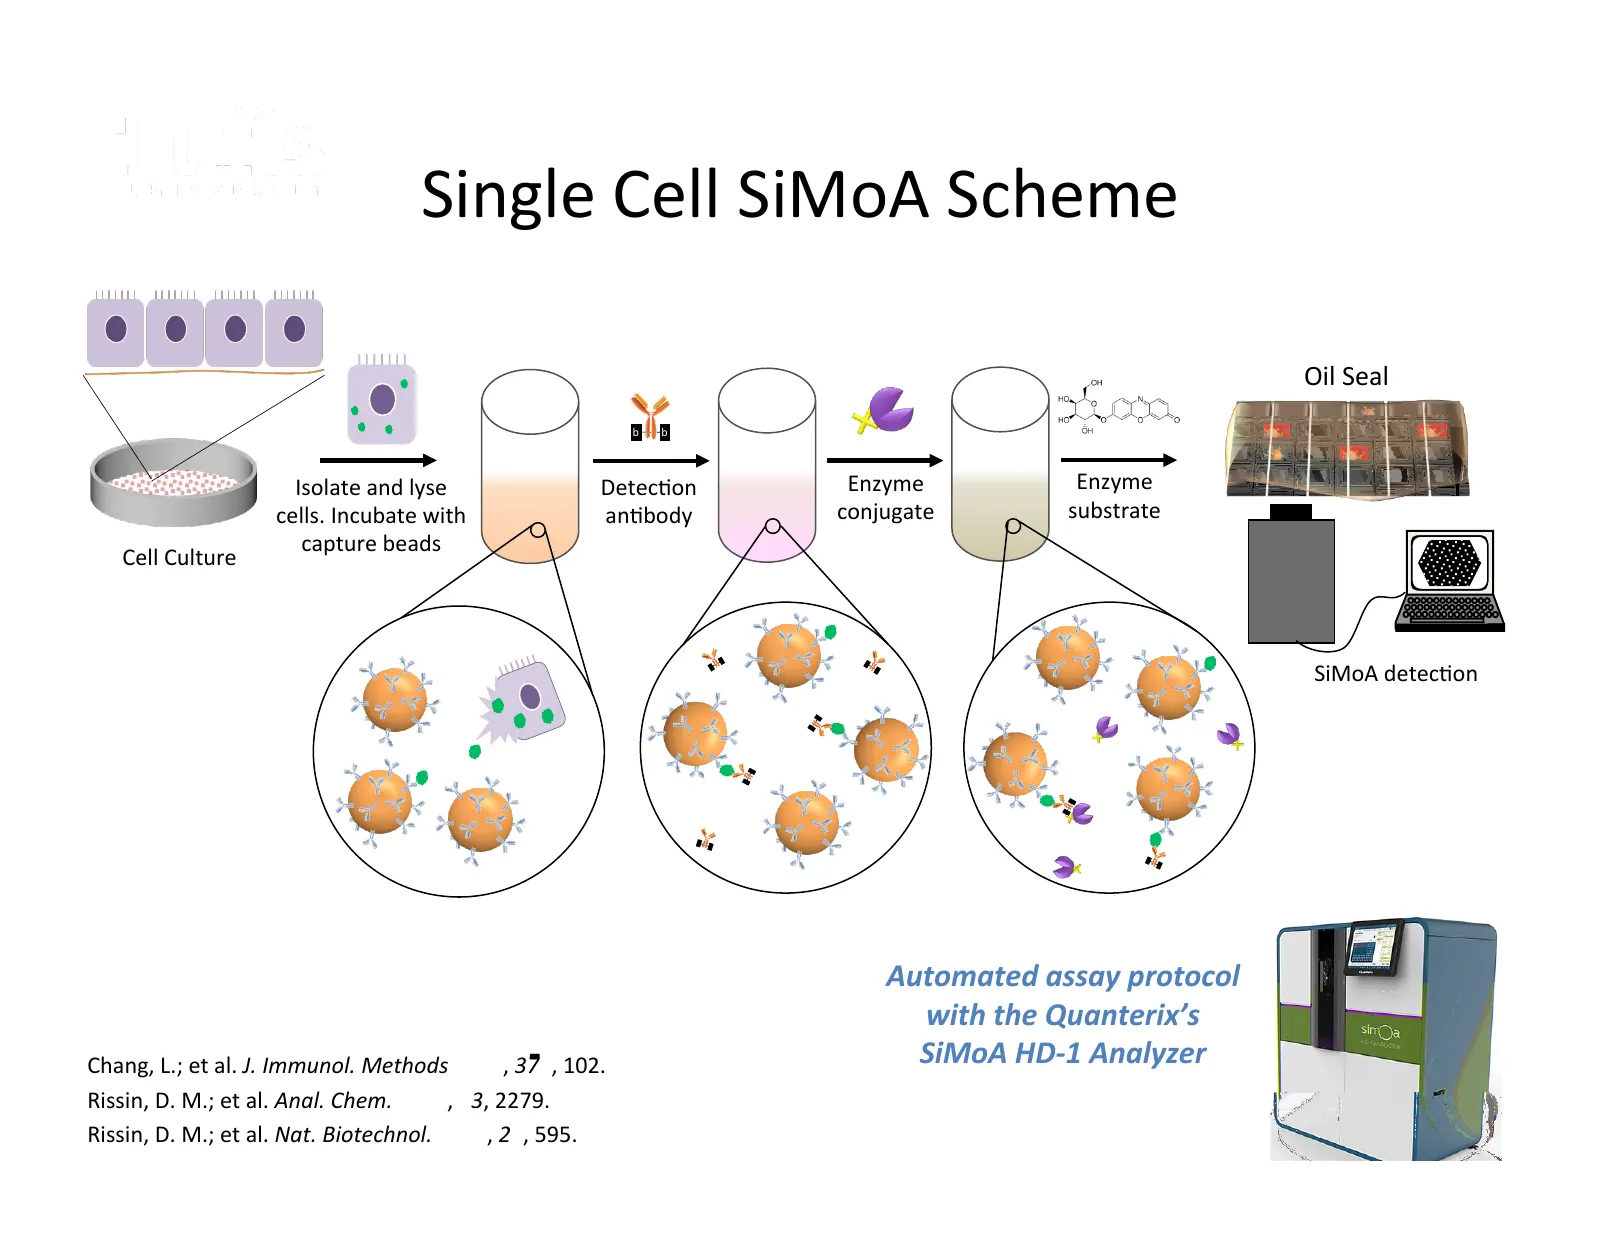
Walt Laboratory Scheme Single Cell SiMoA Oil Seal b b Isolate and lyse Detec@on Enzyme Enzyme cells. Incubate with an@body conjugate substrate capture beads Cell Culture I SiMoA detec@on Automated assay protocol with the Quanterix’s Chang, L.; et al. J. Immunol. Methods 2012, 378, 102. SiMoA HD-‐1
Slide 38: Outline
Walt Laboratory Outline • Array Format • Fundamental Enzyme Studies • Clinical Applica@ons • Single Cells 38

Slide 39: Acknowledgements
Acknowledgements Walt Laboratory Students 39

Slide 40: Walt Group
Walt Laboratory Walt Group
Source: Internet Archive copy of quanterix.com
More decks from Quanterix Corporation
 Q3 2026 Earnings Presentation21 slides · Nov 9, 2026
 Q2 2026 Earnings Presentation21 slides · Aug 10, 2026
 Q1 2026 Earnings Presentation17 slides · May 6, 2026
 FY2025 Earnings Presentation14 slides · Mar 2, 2026
 Q3 2025 Earnings Presentation11 slides · Nov 10, 2025
 Q2 2025 Earnings Presentation12 slides · Aug 7, 2025