Quanterix Corporation · NASDAQ:QTRX
Quanterix — Q3 2026 Earnings Presentation
21 slides from Quanterix's earnings presentation, Nov 9, 2026
Slide 1: Q3 2026 Earnings Presentation
Q3 2026 Earnings Presentation Quanterix Corporation: (NASDAQ: QTRX) November 9, 2026 Everett Cunningham, Chief Executive Officer Jason Faessler, Chief Financial Officer
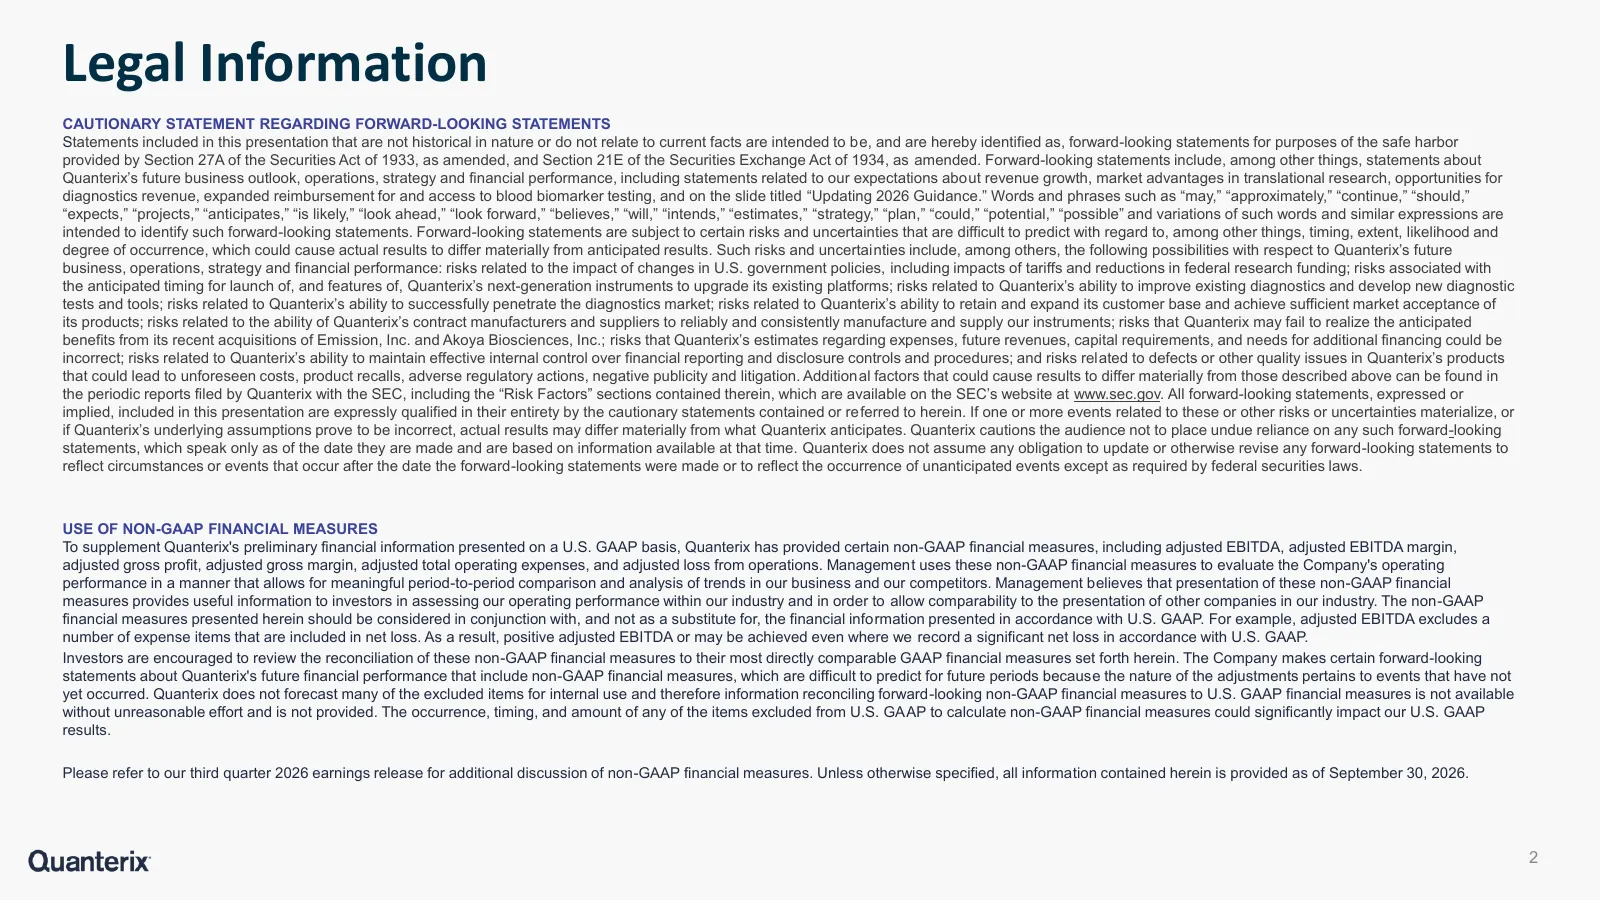
Slide 2: Legal Information
Legal Information CAUTIONARY STATEMENT REGARDING FORWARD-LOOKING STATEMENTS Statements included in this presentation that are not historical in nature or do not relate to current facts are intended to be, and are hereby identified as, forward-looking statements for purposes of the safe harbor provid
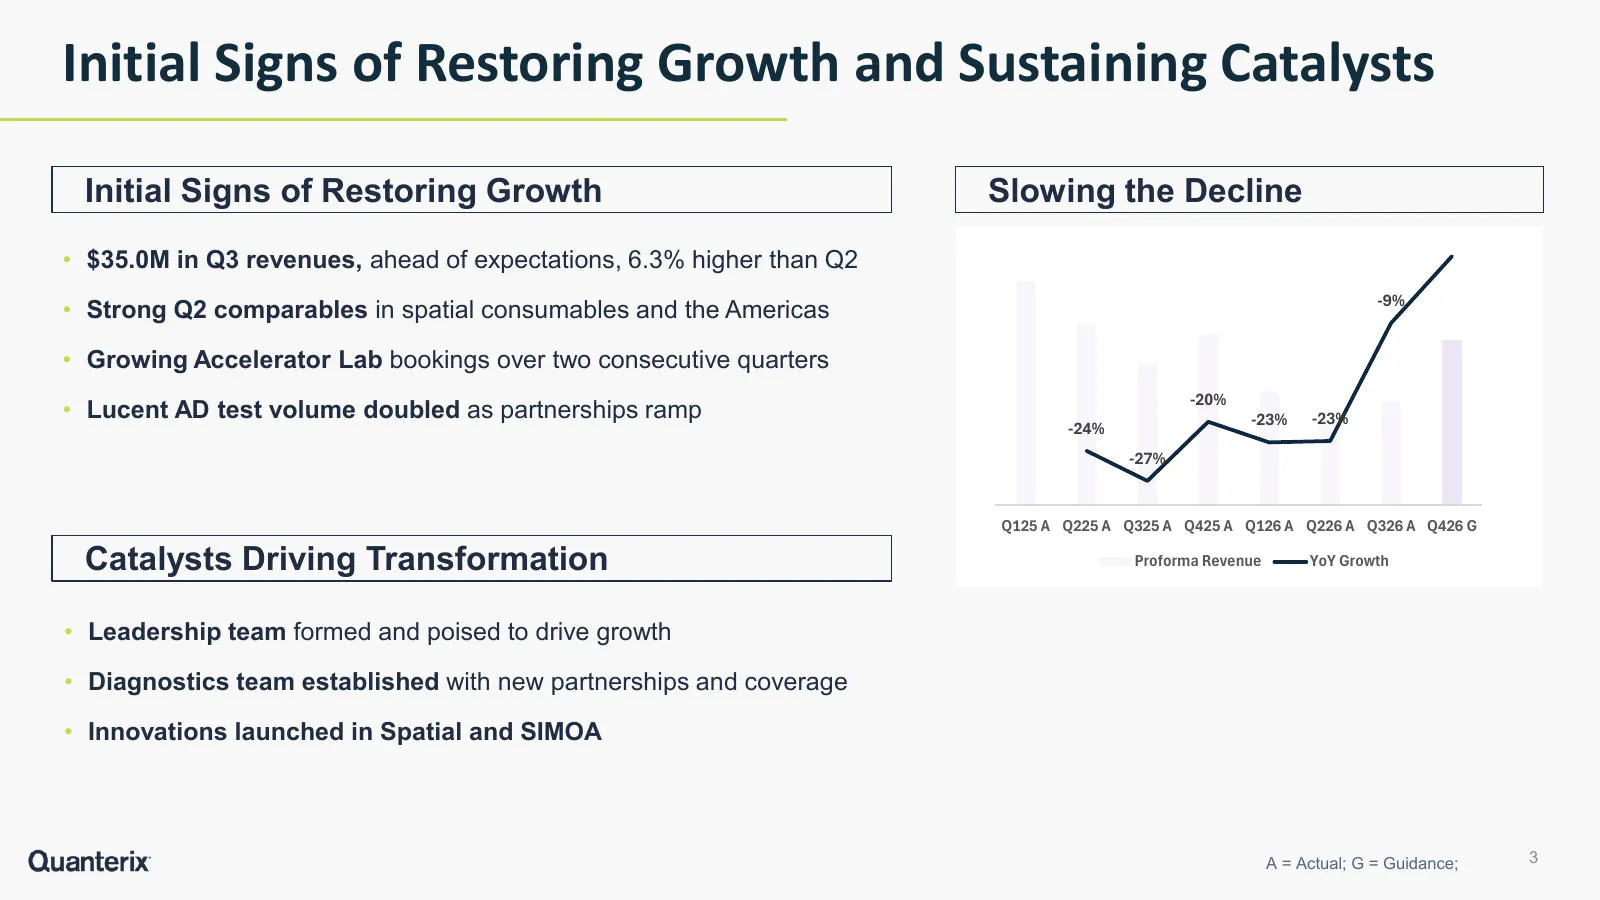
Slide 3: Initial Signs of Restoring Growth and Sustaining Catalysts
Initial Signs of Restoring Growth and Sustaining Catalysts Initial Signs of Restoring Growth Slowing the Decline 50 -1% 0% • $35.0M in Q3 revenues, ahead of expectations, 6.3% higher than Q2 45 -5% -9% • Strong Q2 comparables in spatial consumables and the Americas -10% 40 • Growing Accelerator Lab
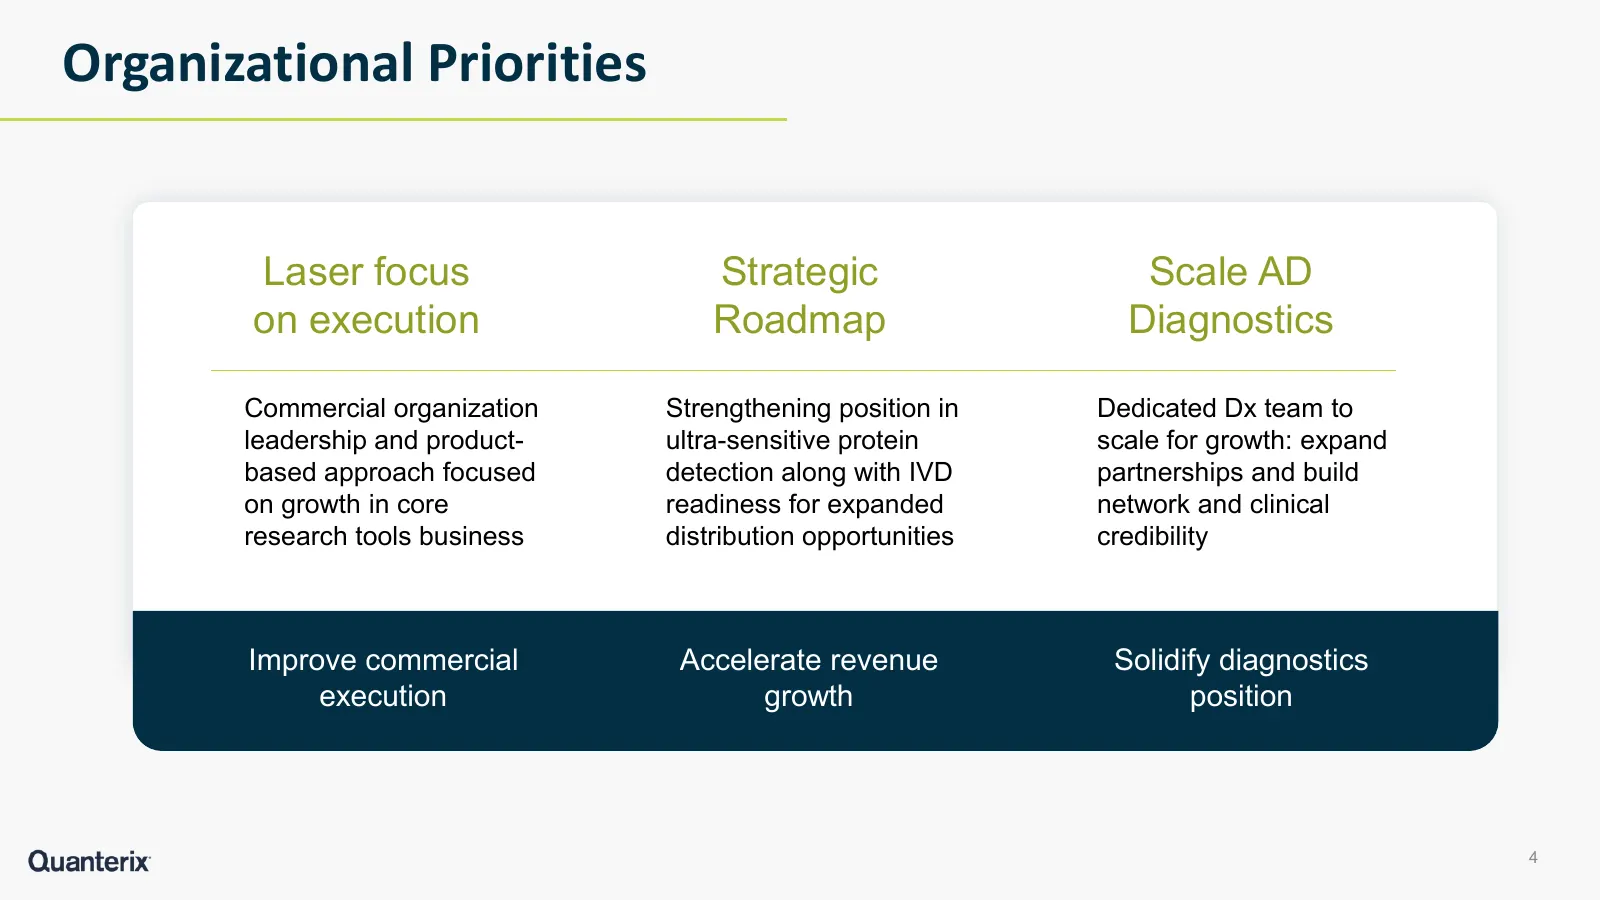
Slide 4: Organizational Priorities
Organizational Priorities Laser focus Strategic Scale AD on execution Roadmap Diagnostics Commercial organization Strengthening position in Dedicated Dx team to leadership and product- ultra-sensitive protein scale for growth: expand based approach focused detection along with IVD partnerships and b
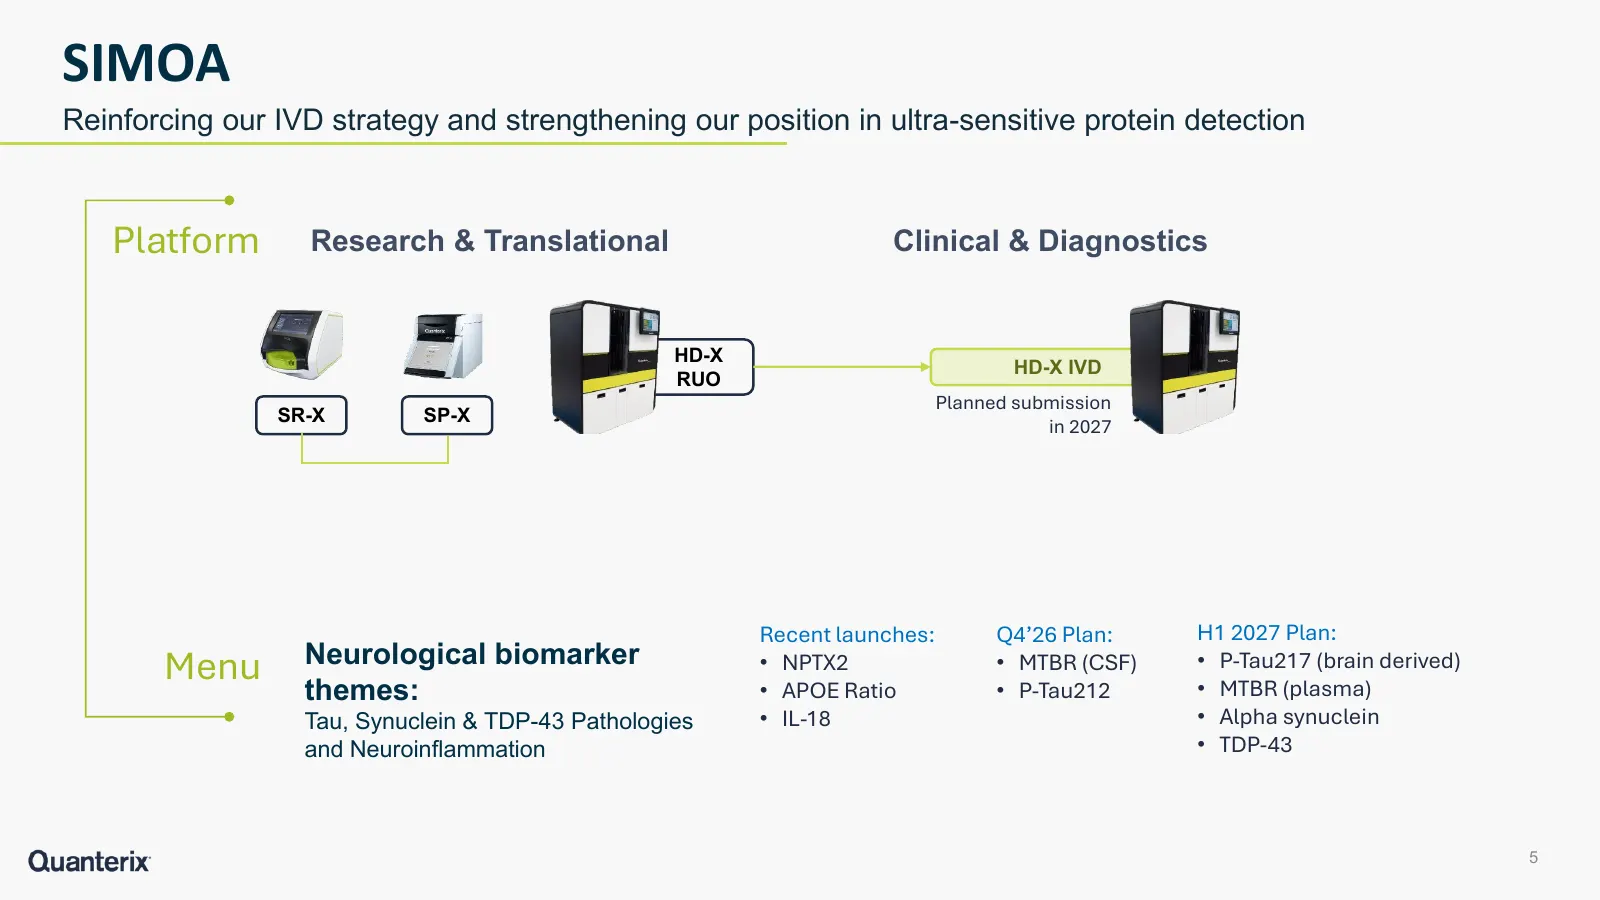
Slide 5: SIMOA
SIMOA Reinforcing our IVD strategy and strengthening our position in ultra-sensitive protein detection Platform Research & Translational Clinical & Diagnostics HD-X HD-X IVD RUO Planned submission SR-X SP-X in 2027 Recent launches: Q4’26 Plan: H1 2027 Plan: Neurological biomarker Menu • NPTX2 • MTBR
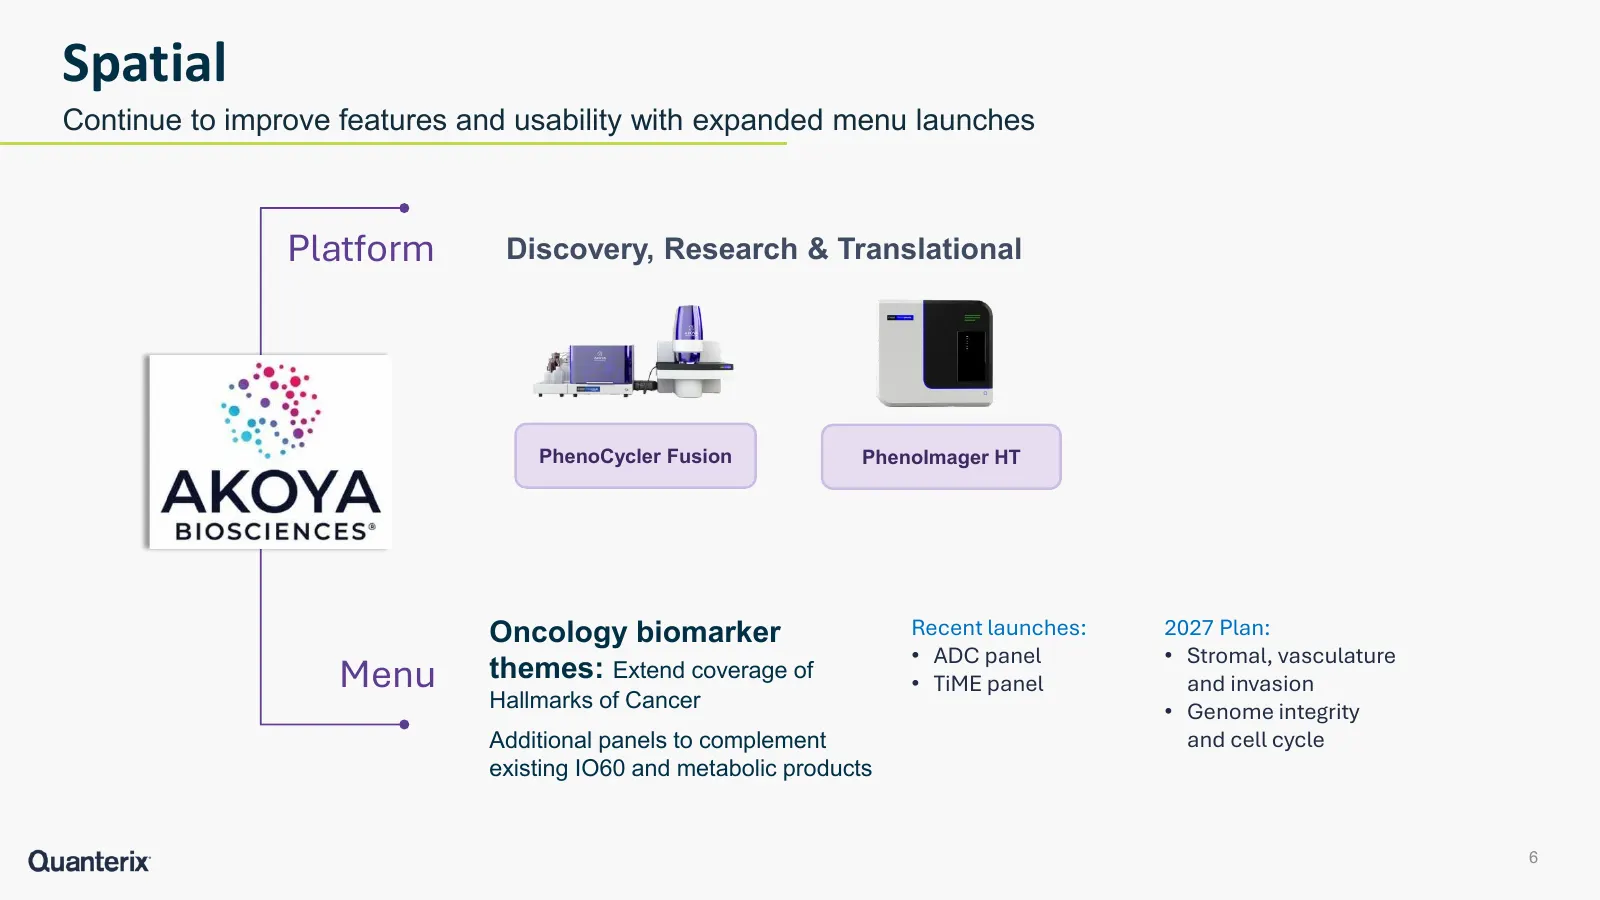
Slide 6: Spatial
Spatial Continue to improve features and usability with expanded menu launches Platform Discovery, Research & Translational PhenoCycler Fusion PhenoImager HT Oncology biomarker Recent launches: 2027 Plan: • ADC panel • Stromal, vasculature Menu themes: Extend coverage of • TiME panel and invasion Ha
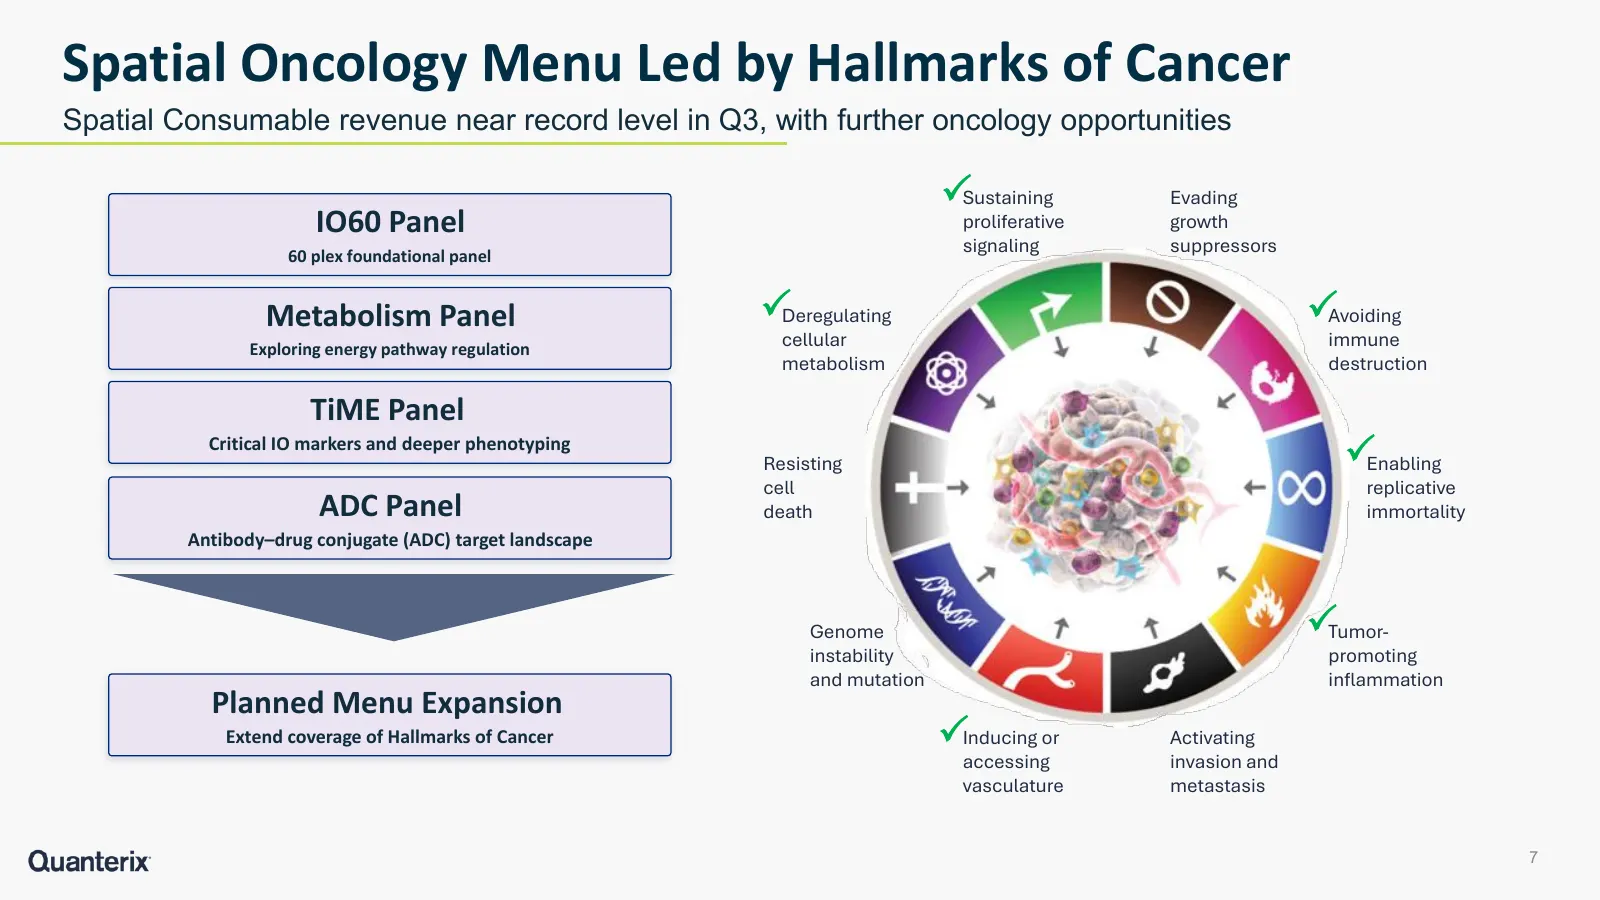
Slide 7: Spatial Oncology Menu Led by Hallmarks of Cancer
Spatial Oncology Menu Led by Hallmarks of Cancer Spatial Consumable revenue near record level in Q3, with further oncology opportunities Sustaining Evading IO60 Panel proliferative growth 60 plex foundational panel signaling suppressors Metabolism Panel Deregulating Avoiding Exploring energy path
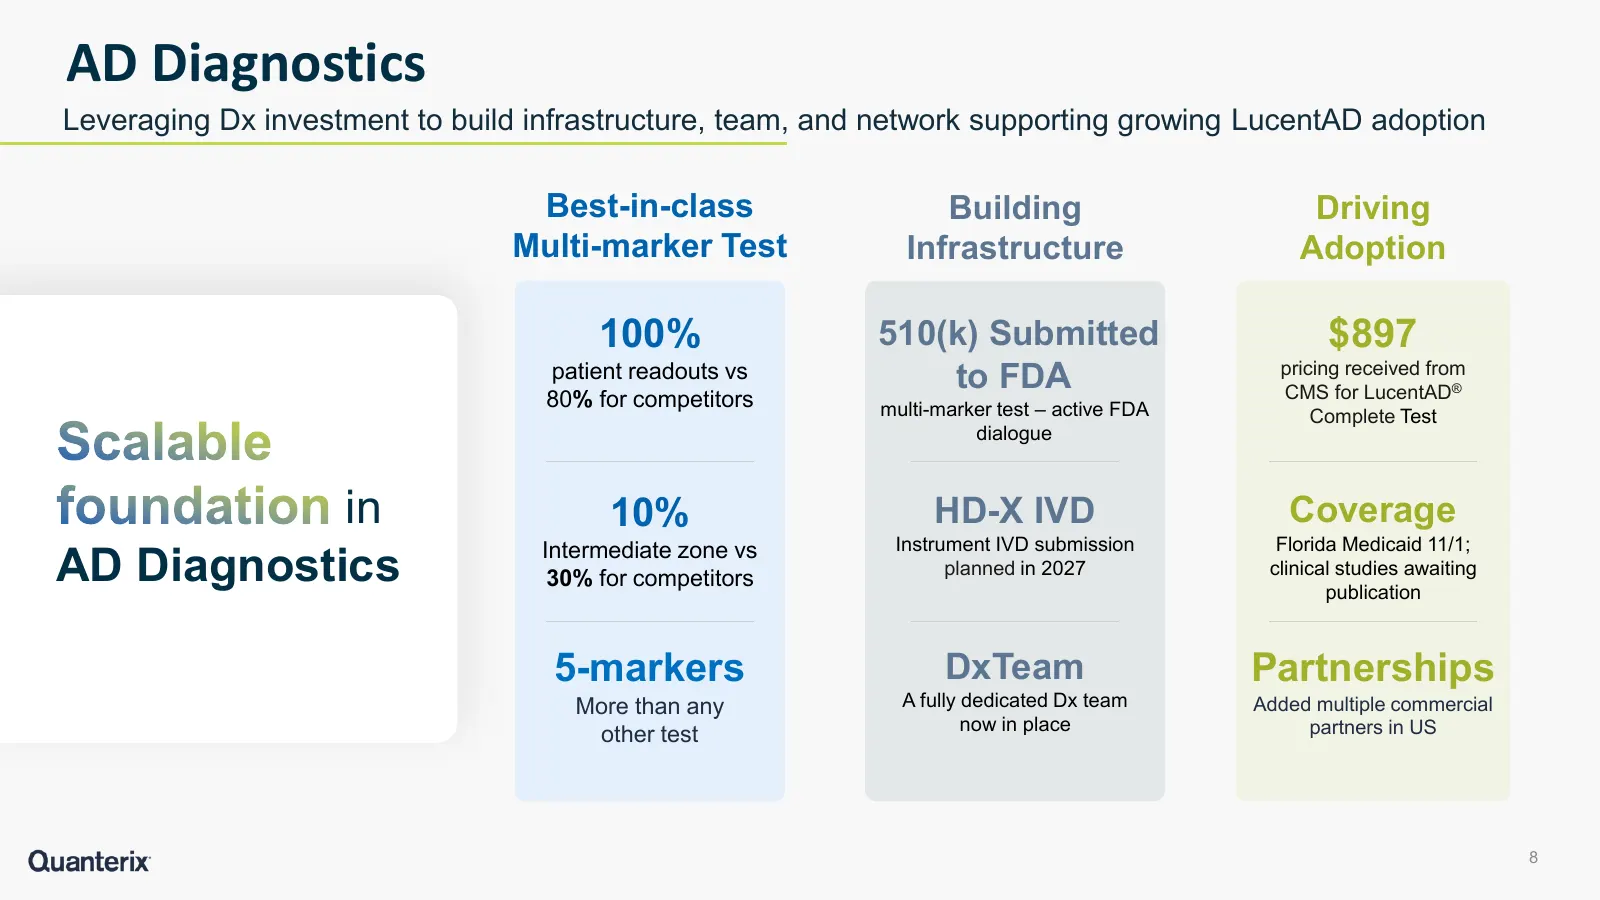
Slide 8: AD Diagnostics: Scalable foundation
AD Diagnostics Leveraging Dx investment to build infrastructure, team, and network supporting growing LucentAD adoption Best-in-class Building Driving Multi-marker Test Infrastructure Adoption 100% 510(k) Submitted $897 patient readouts vs to FDA pricing received from CMS for LucentAD® 80% for compe
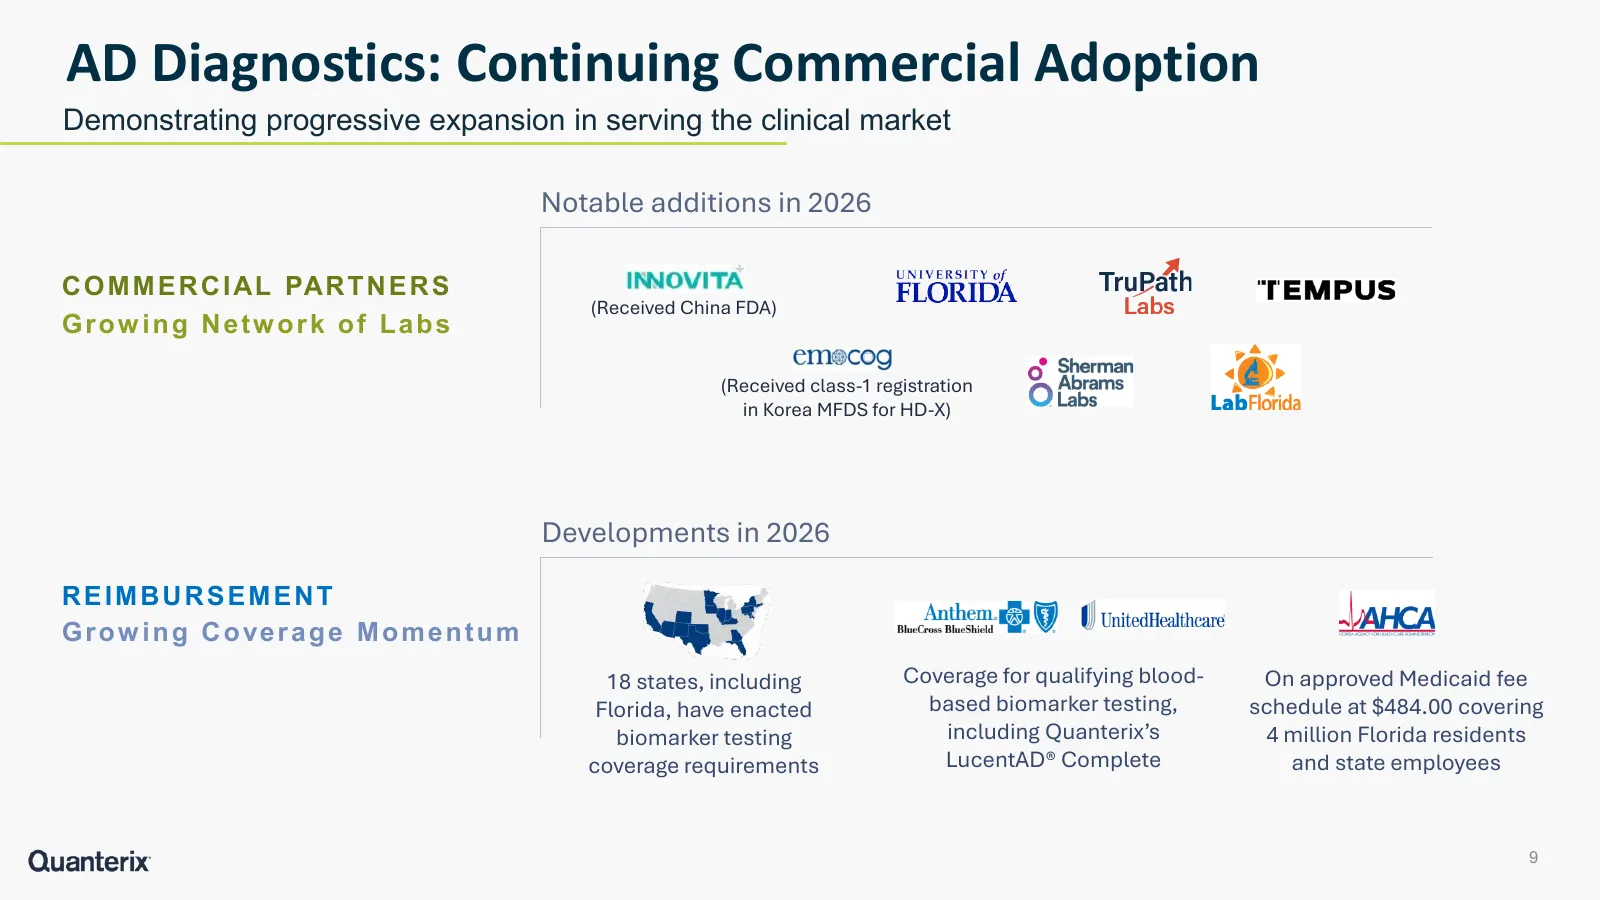
Slide 9: AD Diagnostics: Continuing Commercial Adoption
AD Diagnostics: Continuing Commercial Adoption Demonstrating progressive expansion in serving the clinical market Notable additions in 2026 C O M M E R C I AL PAR T N E R S (Received China FDA) Growing Network of Labs (Received class-1 registration in Korea MFDS for HD-X) Developments in 2026 REIMBU

Slide 10: Q3'26 Financial Update
Q3’26 Financial Update
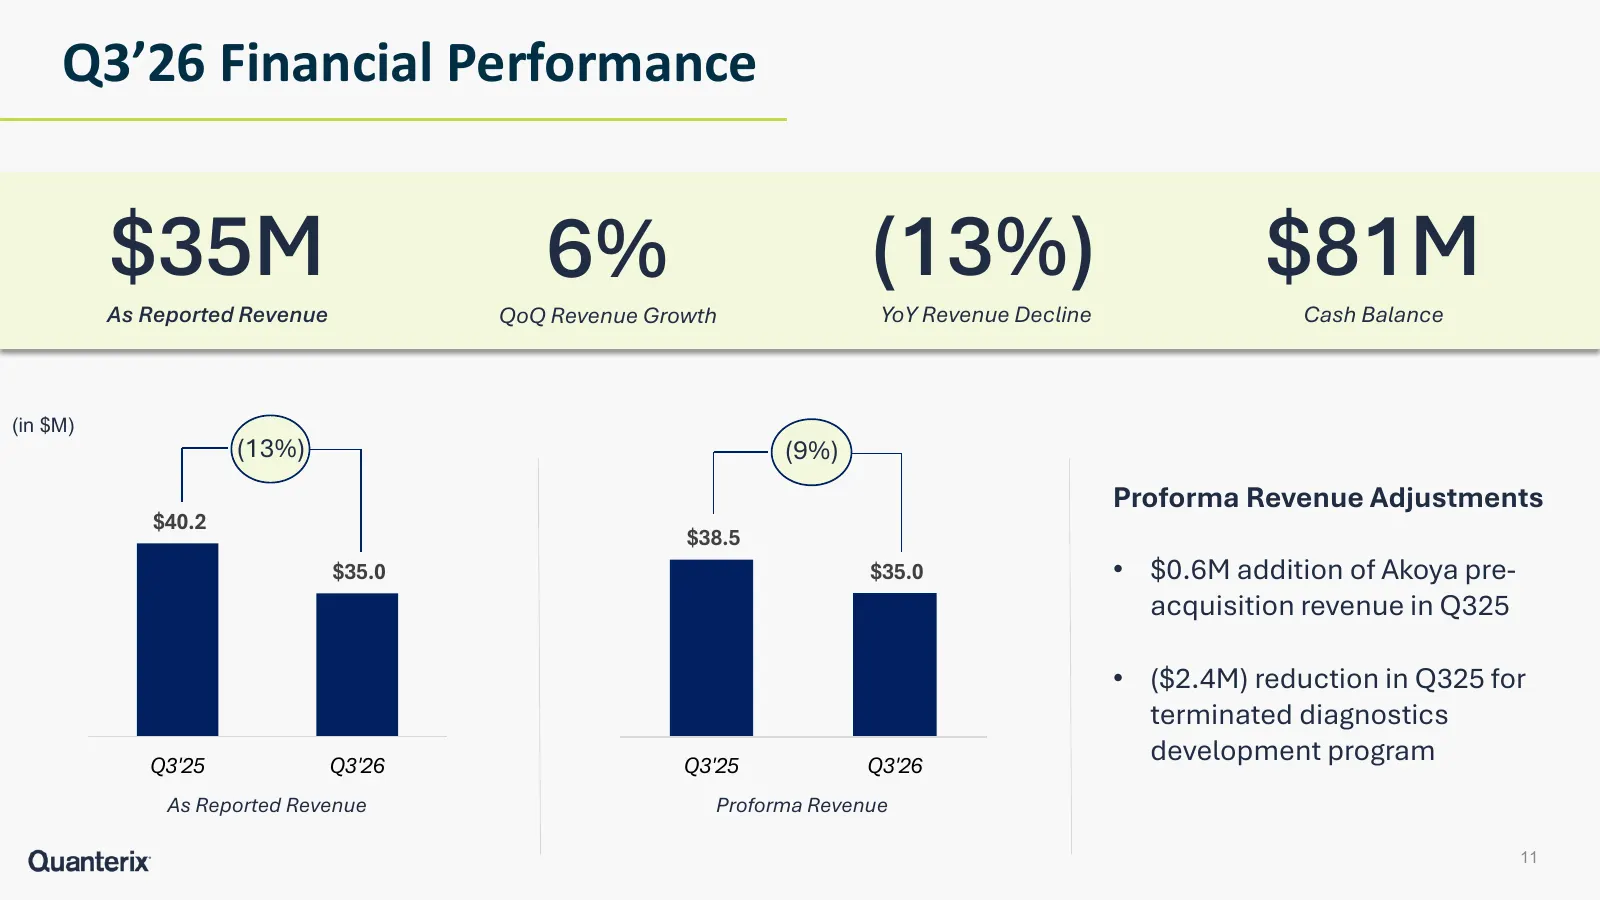
Slide 11: Q3'26 Financial Performance
Q3’26 Financial Performance $35M 6% (13%) $81M As Reported Revenue QoQ Revenue Growth YoY Revenue Decline Cash Balance (in $M) (13%) (9%) Proforma Revenue Adjustments $40.2 $38.5 $35.0 $35.0 • $0.6M addition of Akoya pre- acquisition revenue in Q325 • ($2.4M) reduction in Q325 for terminated diagnos
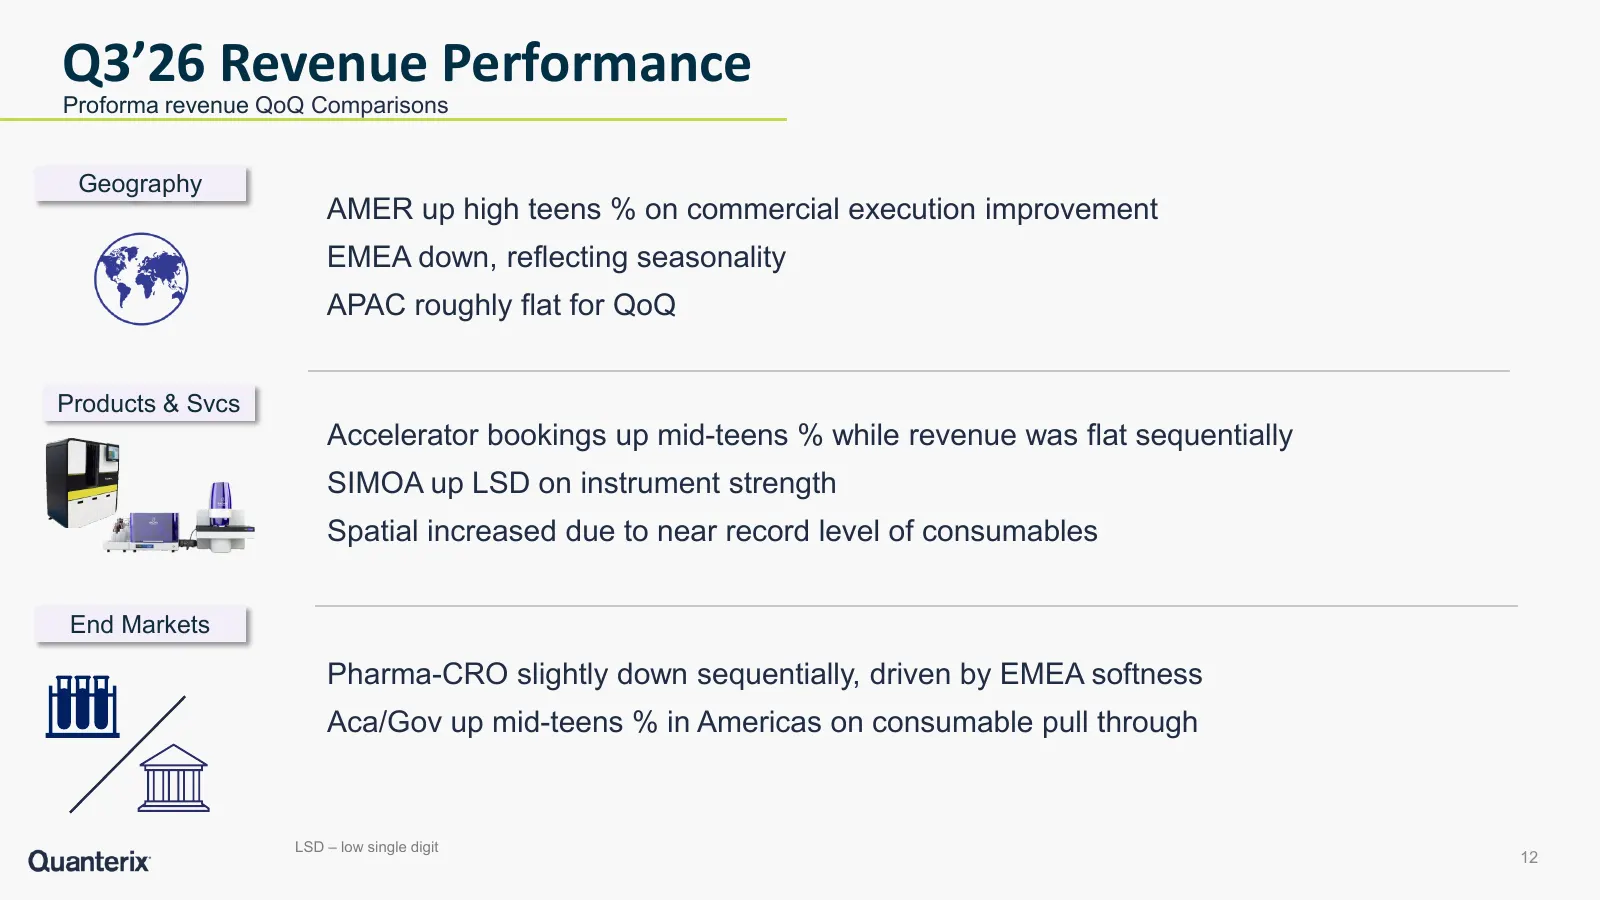
Slide 12: Q3'26 Revenue Performance
Q3’26 Revenue Performance Proforma revenue QoQ Comparisons Geography AMER up high teens % on commercial execution improvement EMEA down, reflecting seasonality APAC roughly flat for QoQ Products & Svcs Accelerator bookings up mid-teens % while revenue was flat sequentially SIMOA up LSD on instrument
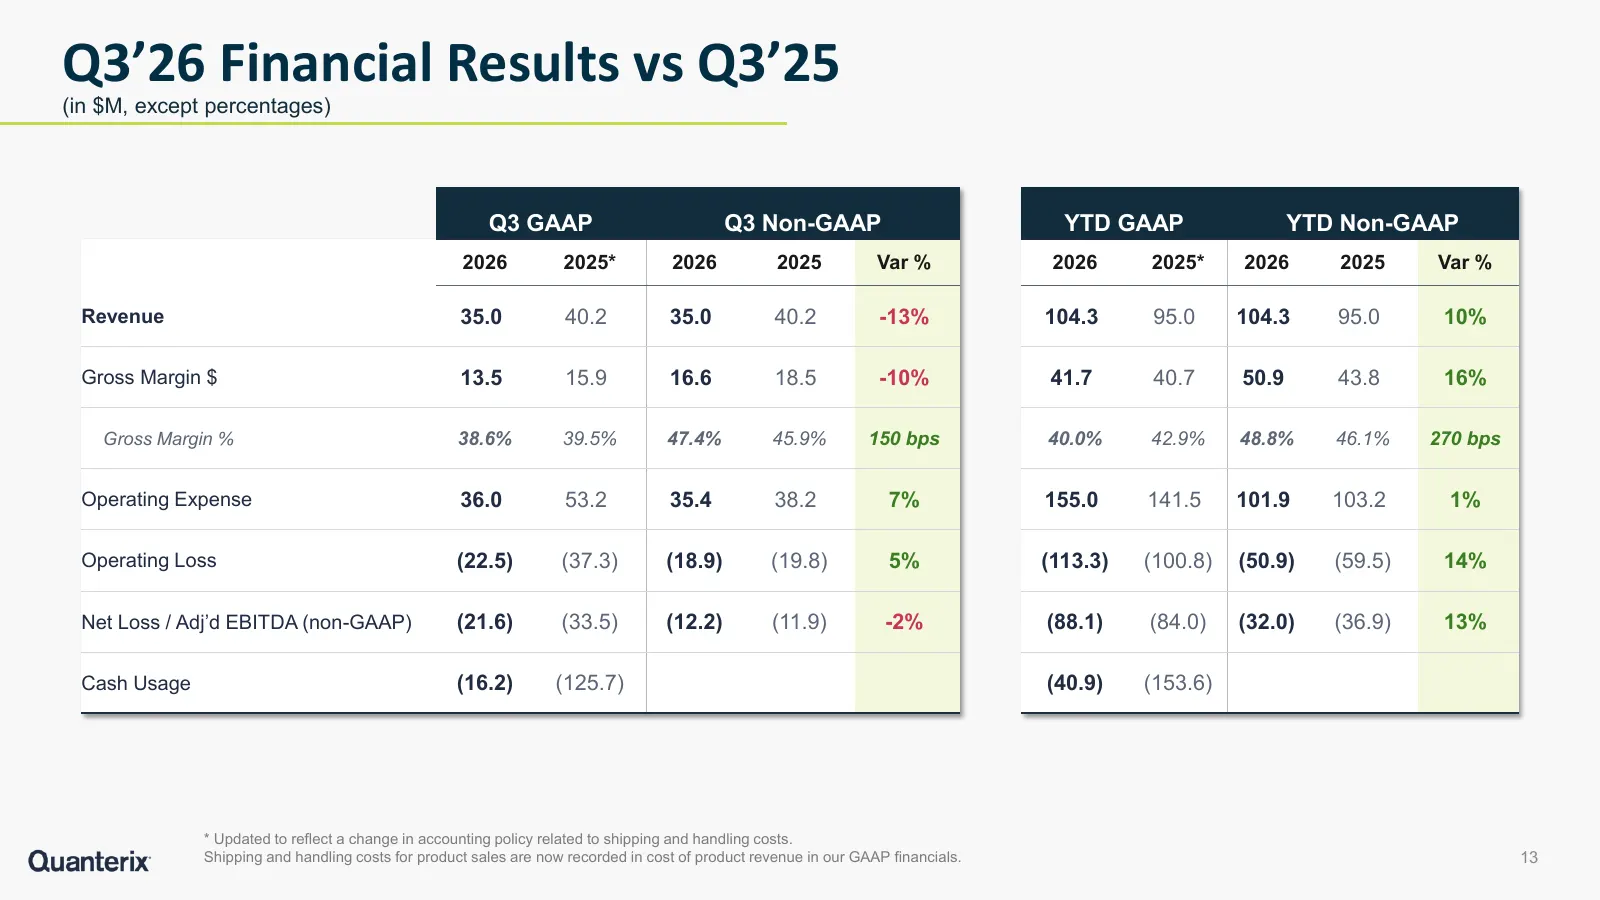
Slide 13: Q3'26 Financial Results vs Q3'25
Q3’26 Financial Results vs Q3’25 (in $M, except percentages) Q3 GAAP Q3 Non-GAAP YTD GAAP YTD Non-GAAP 2026 2025* 2026 2025 Var % 2026 2025* 2026 2025 Var % Revenue 35.0 40.2 35.0 40.2 -13% 104.3 95.0 104.3 95.0 10% Gross Margin $ 13.5 15.9 16.6 18.5 -10% 41.7 40.7 50.9 43.8 16% Gross Margin % 38.6%
Slide 14: Updating 2026 Guidance
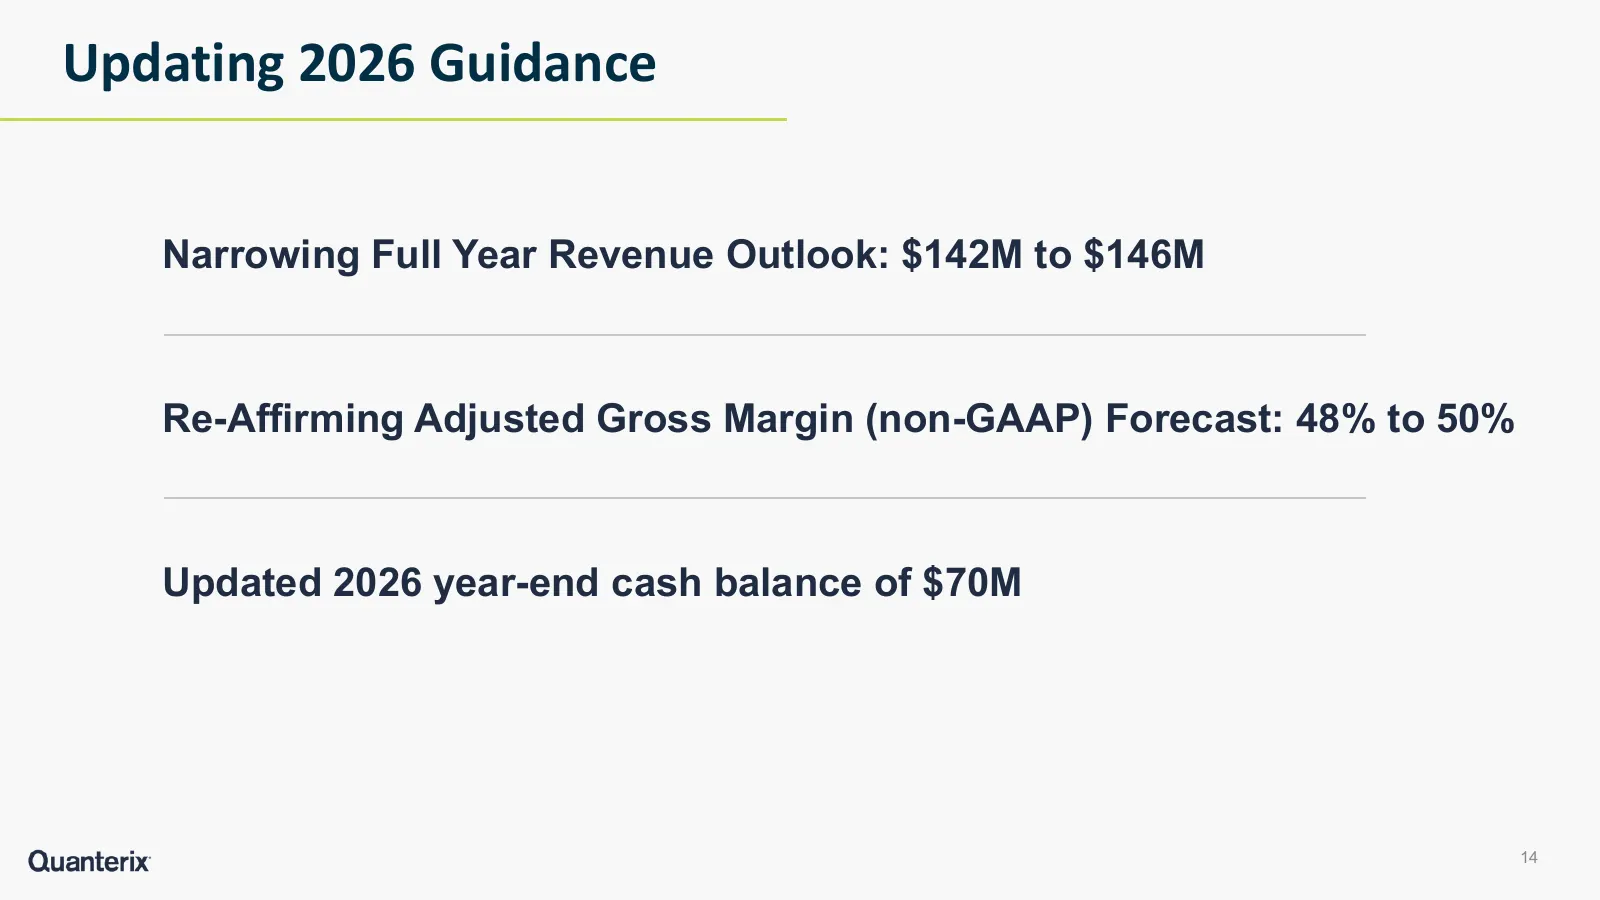
Updating 2026 Guidance Narrowing Full Year Revenue Outlook: $142M to $146M Re-Affirming Adjusted Gross Margin (non-GAAP) Forecast: 48% to 50% Updated 2026 year-end cash balance of $70M 14
Slide 15: Summary
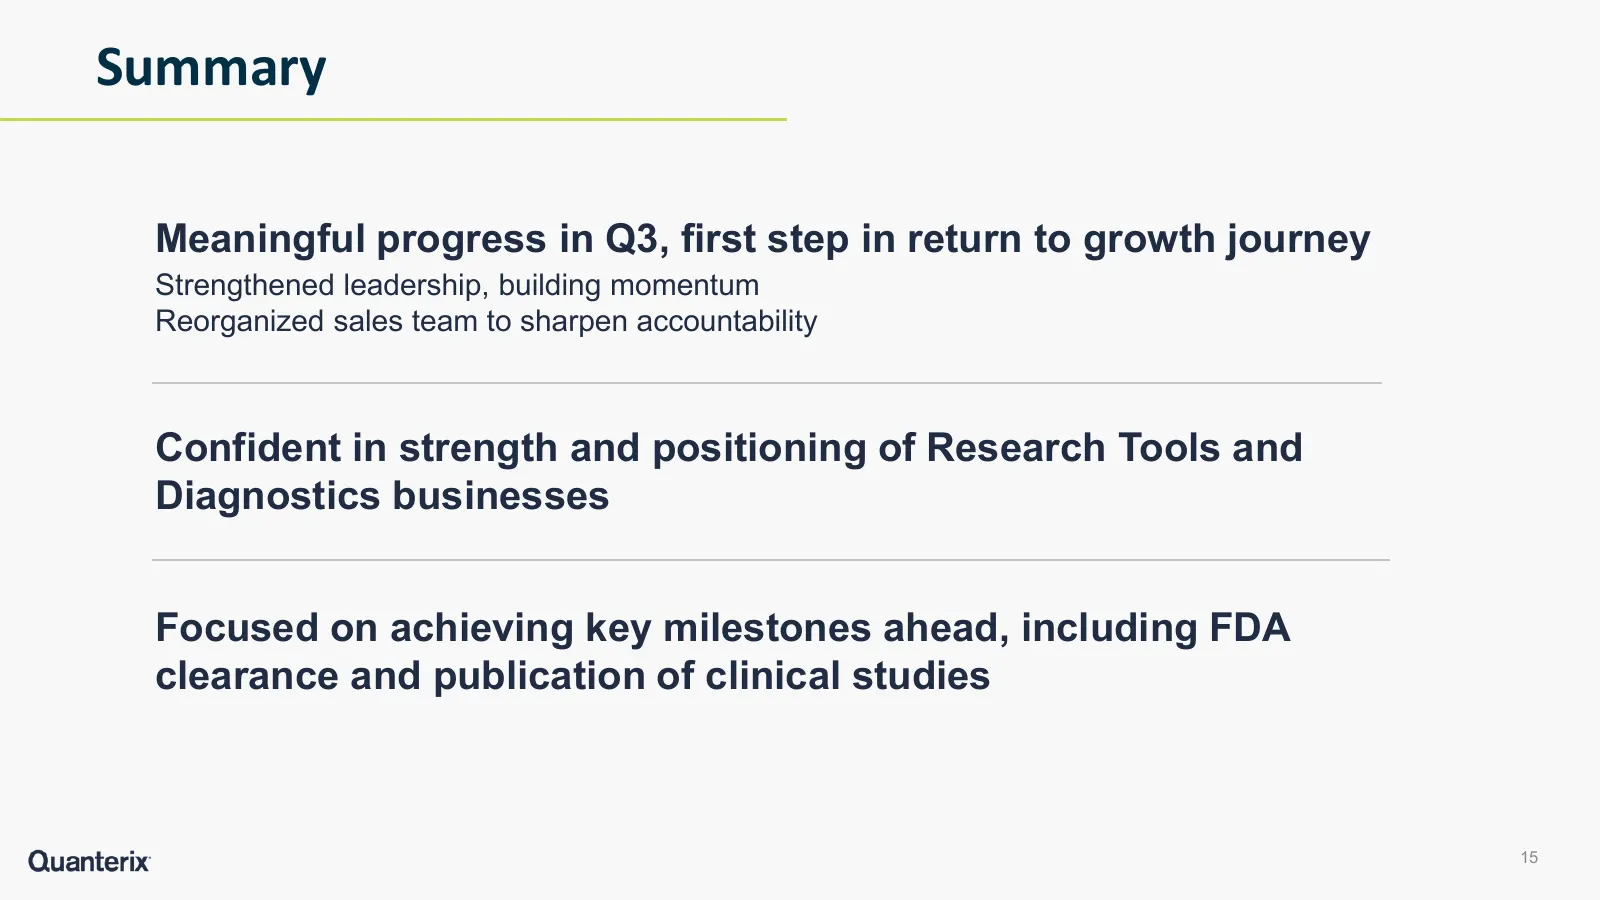
Summary Meaningful progress in Q3, first step in return to growth journey Strengthened leadership, building momentum Reorganized sales team to sharpen accountability Confident in strength and positioning of Research Tools and Diagnostics businesses Focused on achieving key milestones ahead, includin

Slide 16: Appendix
Appendix
Slide 17: Quanterix's Leadership Positioning in Proteomics
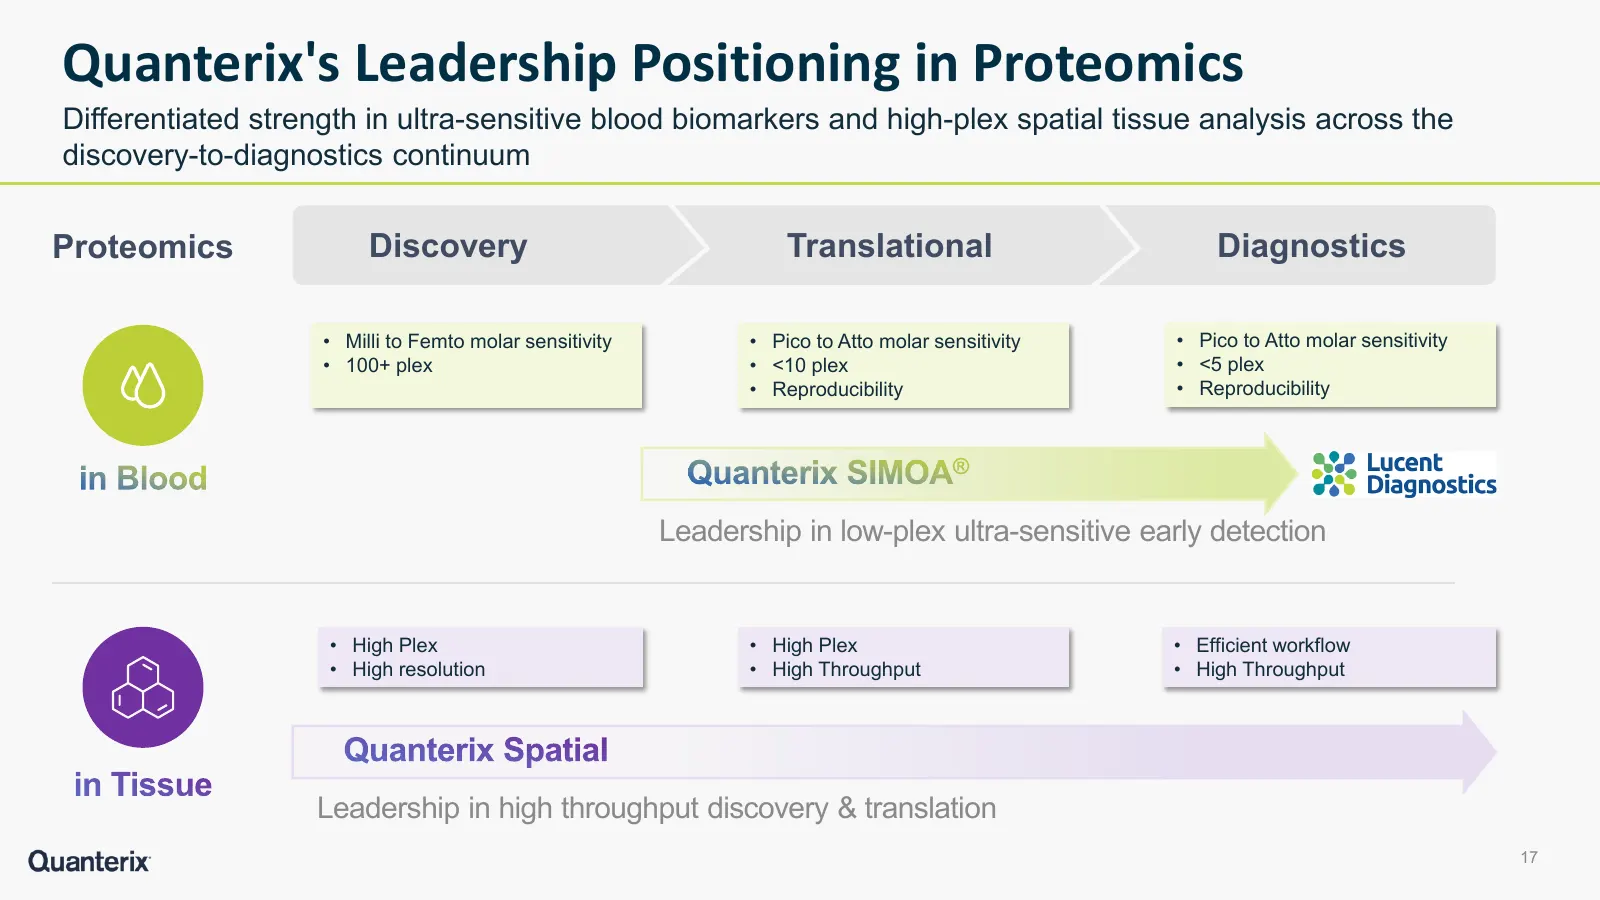
Quanterix's Leadership Positioning in Proteomics Differentiated strength in ultra-sensitive blood biomarkers and high-plex spatial tissue analysis across the discovery-to-diagnostics continuum Proteomics Discovery Translational Diagnostics • Milli to Femto molar sensitivity • Pico to Atto molar sens
Slide 18: Scientific Validation Driving Adoption
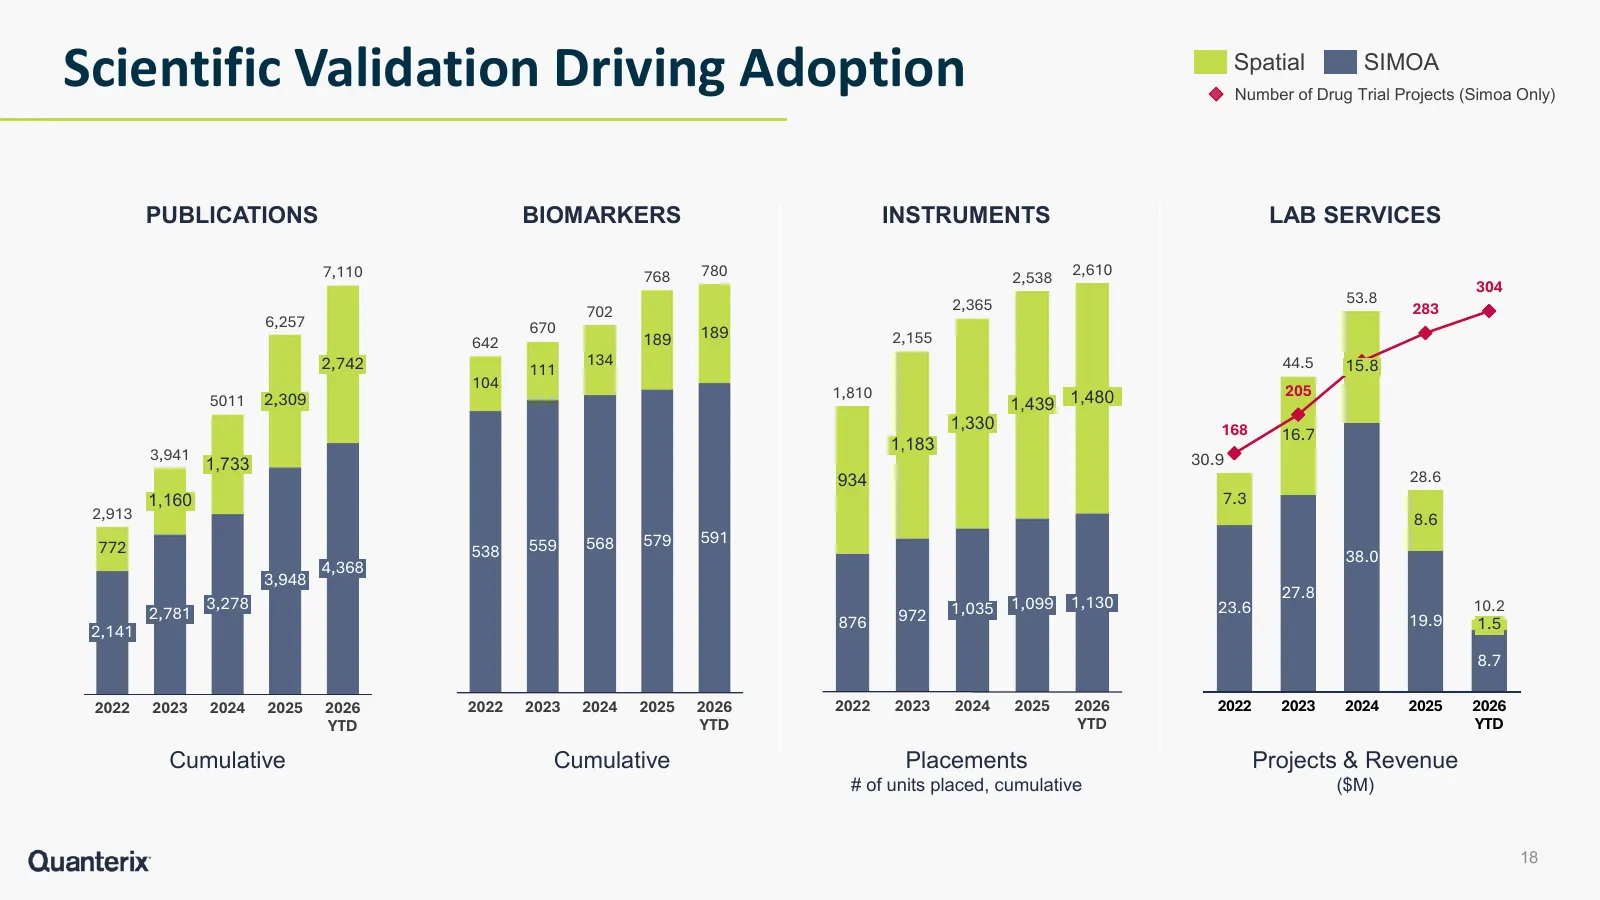
Scientific Validation Driving Adoption Spatial SIMOA Number of Drug Trial Projects (Simoa Only) PUBLICATIONS BIOMARKERS INSTRUMENTS LAB SERVICES 7,110 768 780 2,538 2,610 304 2,365 53.8 702 283 6,257 670 189 189 2,155 642 2,742 134 44.5 15.8 111 104 205 1,810 5011 2,309 1439 1,480 1,439 1,330 1330 1
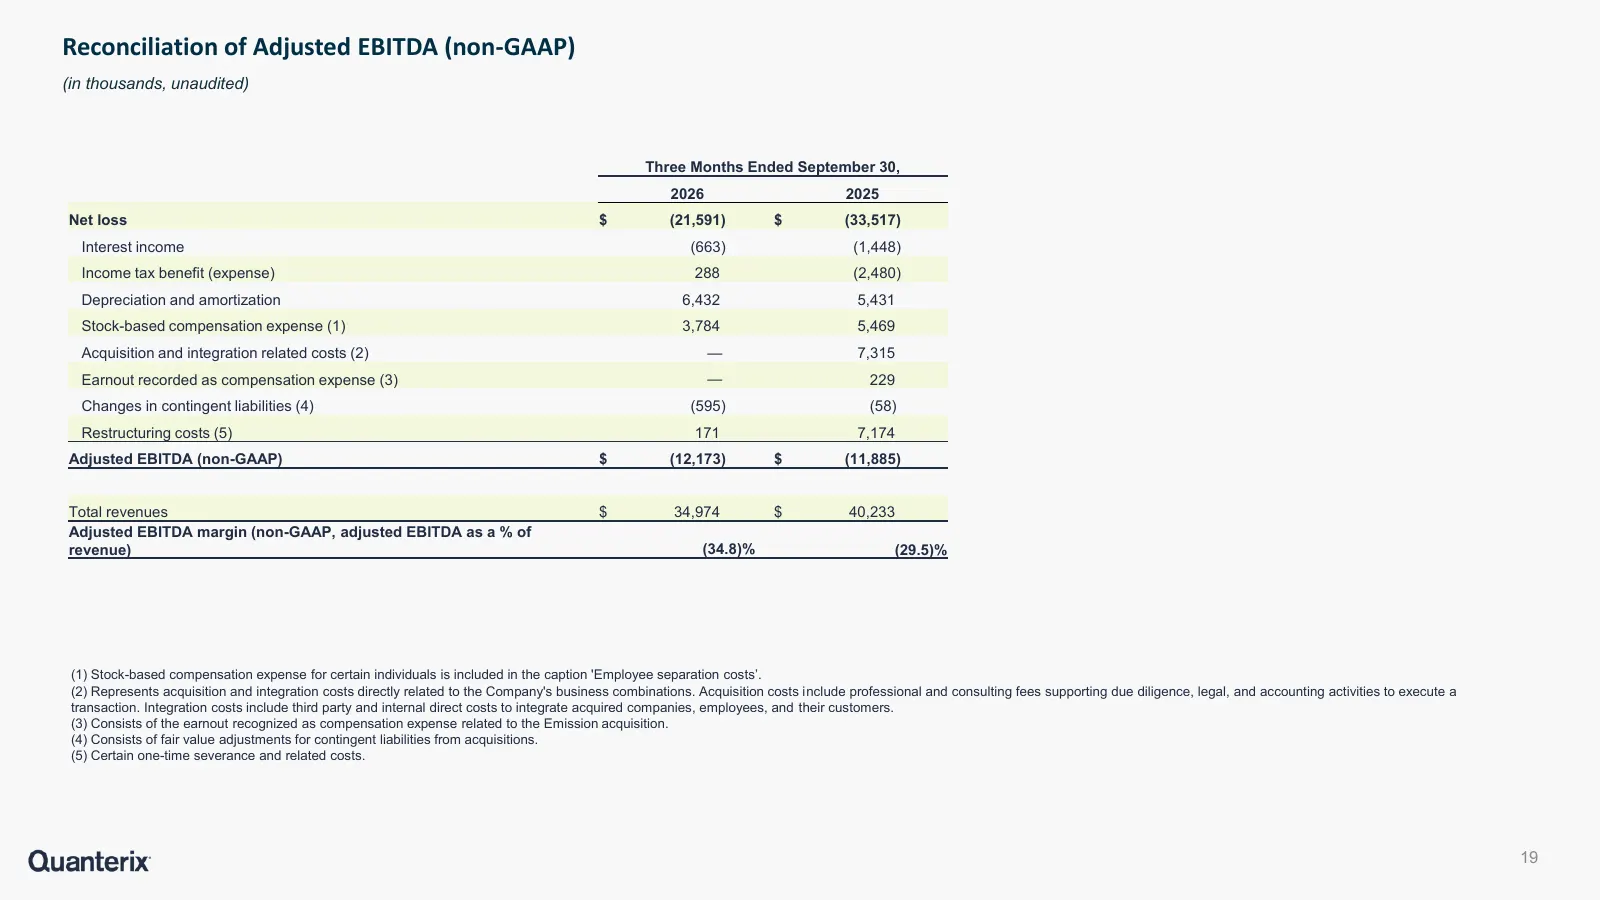
Slide 19: Reconciliation of Adjusted EBITDA (non-GAAP)
Reconciliation of Adjusted EBITDA (non-GAAP) (in thousands, unaudited) Three Months Ended September 30, 2026 2025 Net loss $ (21,591) $ (33,517) Interest income (663) (1,448) Income tax benefit (expense) 288 (2,480) Depreciation and amortization 6,432 5,431 Stock-based compensation expense (1) 3,784
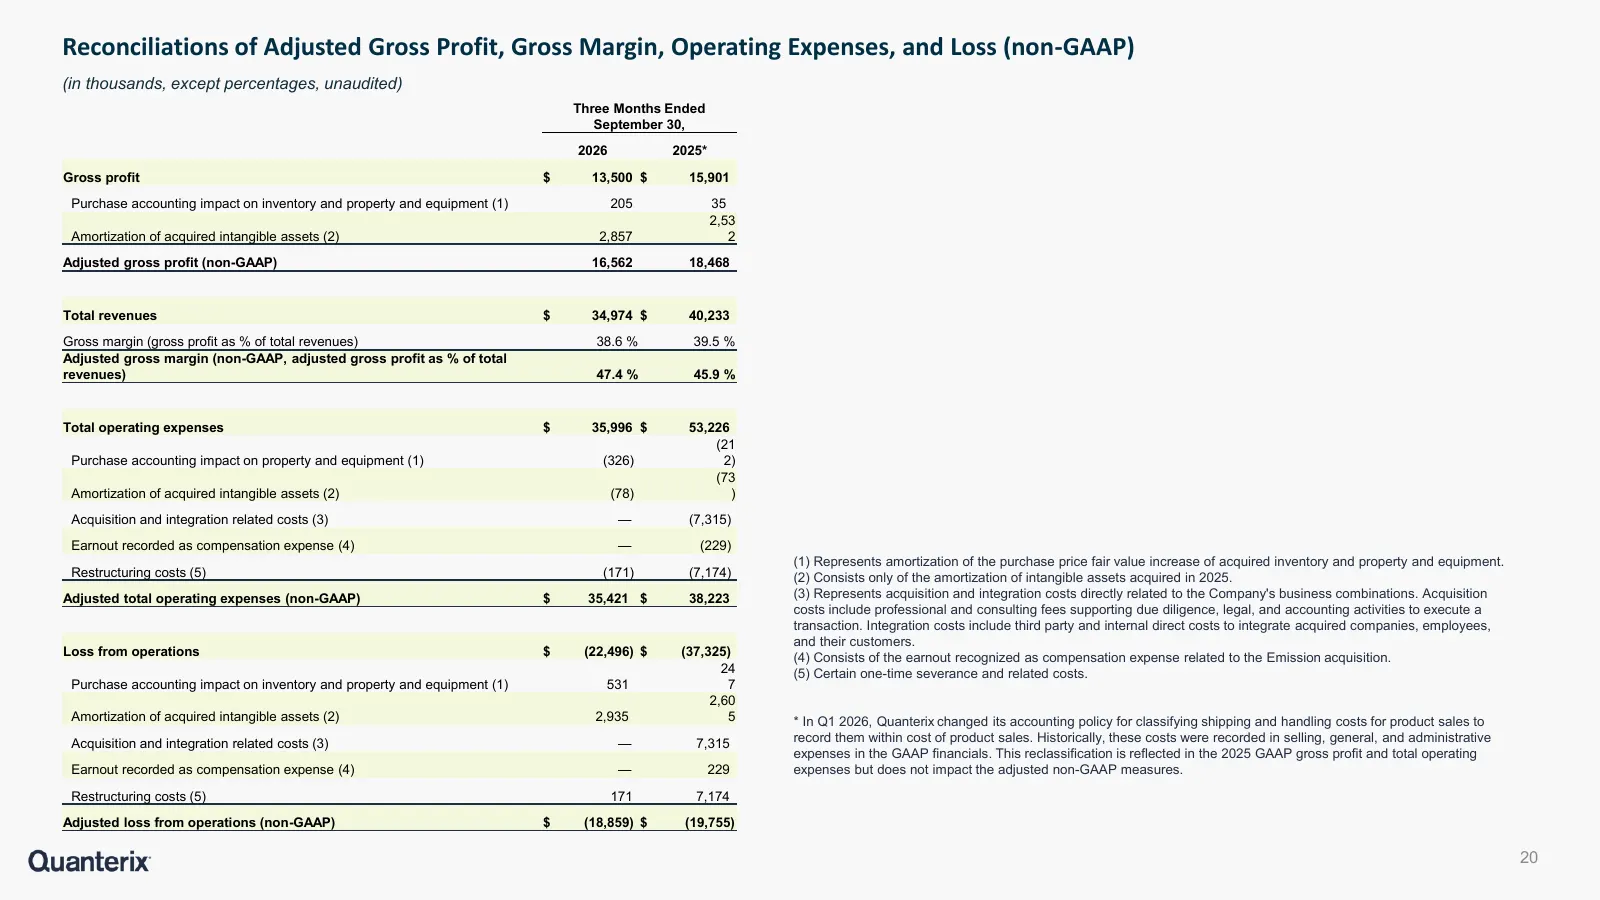
Slide 20: Reconciliations of Adjusted Gross Profit, Gross Margin, Operating Expenses, and Loss
Reconciliations of Adjusted Gross Profit, Gross Margin, Operating Expenses, and Loss (non-GAAP) (in thousands, except percentages, unaudited) Three Months Ended September 30, 2026 2025* Gross profit $ 13,500 $ 15,901 Purchase accounting impact on inventory and property and equipment (1) 205 35 2,53

Slide 21: Contact Us
Contact Us General inquiries 900 Middlesex Turnpike, Billerica, MA 01821 USA 617.301.9400 info@quanterix.com www.quanterix.com
Source: 6ix earnings call
More decks from Quanterix Corporation
 Q2 2026 Earnings Presentation21 slides · Aug 10, 2026
 Q1 2026 Earnings Presentation17 slides · May 6, 2026
 FY2025 Earnings Presentation14 slides · Mar 2, 2026
 Q3 2025 Earnings Presentation11 slides · Nov 10, 2025
 Q2 2025 Earnings Presentation12 slides · Aug 7, 2025
 Q1 2025 Earnings Presentation19 slides · May 12, 2025