Terra Industries — Merrill Lynch Midwest Roadshow (August 2009)
29 slides from Terra Industries's conference presentation, Aug 7, 2009
Slide 1: Terra Industries Inc. Building Shareholder Value
Supplying3Industry Cleaning3the3Air Feeding3the3World Terra3Industries3Inc. Building3Shareholder3Value Merrill3Lynch3Midwest3Roadshow August353and36,32009
Slide 2: Forward Looking Statements
Forward3Looking3Statements3 Certain3statements3in3this3presentation3may3constitute3“forward3looking” statements3within3the3meaning3 of3the3Private3Securities3Litigation3Reform3Act3of31995.3Statements3made3in3connection3with3the3exch ange3 offer3proposed3by3CF3Industries3Holdings,3Inc.3referred3to3in
Slide 3: Important Additional Information
Important3Additional3Information3 Important3information3and3where3to3find3it3 On3June326,32009,3Terra3filed3with3the3Securities3and3Exchange3Commission3(the3“SEC”)3a3revised3 preliminary3proxy3statement3in3connection3with3its320093Annual3Meeting,3which3is3available3free3of3 charge3at3the3SEC’s3websi
Slide 4: Important Additional Information (cont'd)
Important3Additional3Information3(cont’d) Certain3information3concerning3participants Terra,3its3directors,3executive3officers3and3certain3employees3specified3in3Annex3A3to3Terra’s3 revised3preliminary3proxy3statement3for3the320093Annual3Meeting, which3was3filed3with3the3 SEC3on3June326,32009,3are3p
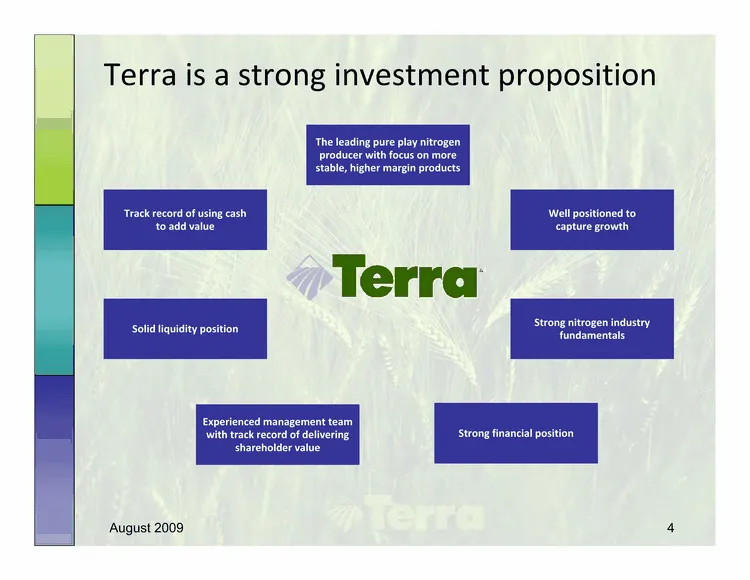
Slide 5: Terra is a strong investment proposition
Terra3is3a3strong3investment3proposition The3leading3pure3play3nitrogen3 producer3with3focus3on3more3 stable,3higher3margin3products Track3record3of3using3cash3 Well3positioned3to3 to3add3value capture3growth Strong3nitrogen3industry3 Solid3liquidity3position fundamentals Experienced3management3team
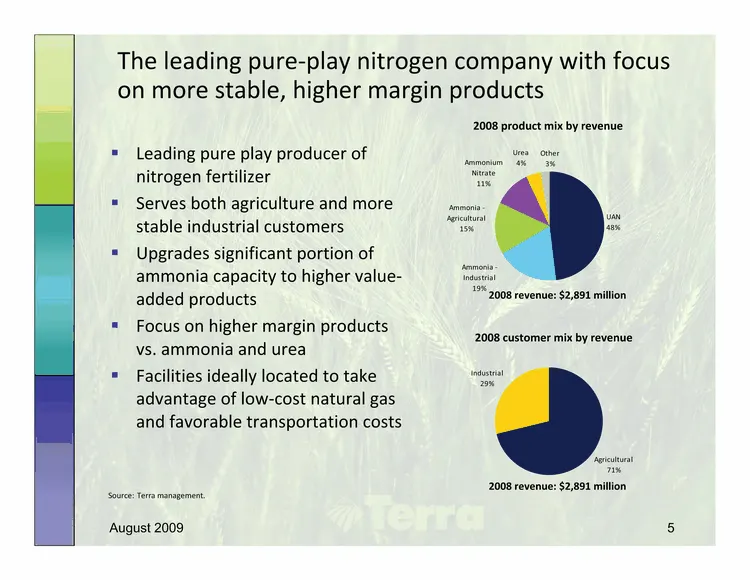
Slide 6: The leading pure play nitrogen company focused on more stable, higher margin products
The3leading3pure3play3nitrogen3company3with3focus3 on3more3stable,3higher3margin3products 20083product3mix3by3revenue 3 Leading3pure3play3producer3of3 Urea Other Ammonium3 4% 3% nitrogen3fertilizer Nitrate 11% 3 Serves3both3agriculture3and3more3 Ammonia333 Agricultural UAN stable3industrial3customer
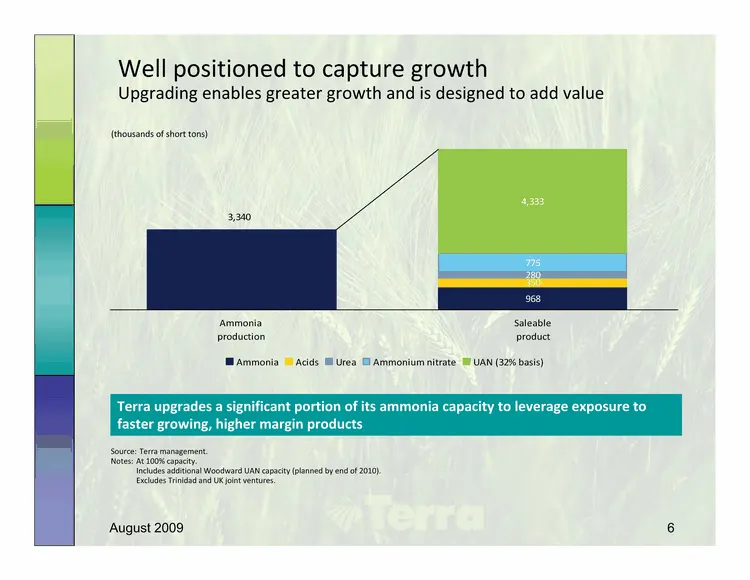
Slide 7: Well positioned to capture growth
Well3positioned3to3capture3growth3 Upgrading3enables3greater3growth3and3is3designed3to3add3value (thousands3of3short3tons) 4,333 3,340 775 280 350 968 Ammonia3 Saleable production product Ammonia Acids Urea Ammonium3nitrate UAN3(32%3basis) Terra3upgrades3a3significant3portion3of3its3ammonia3capacity
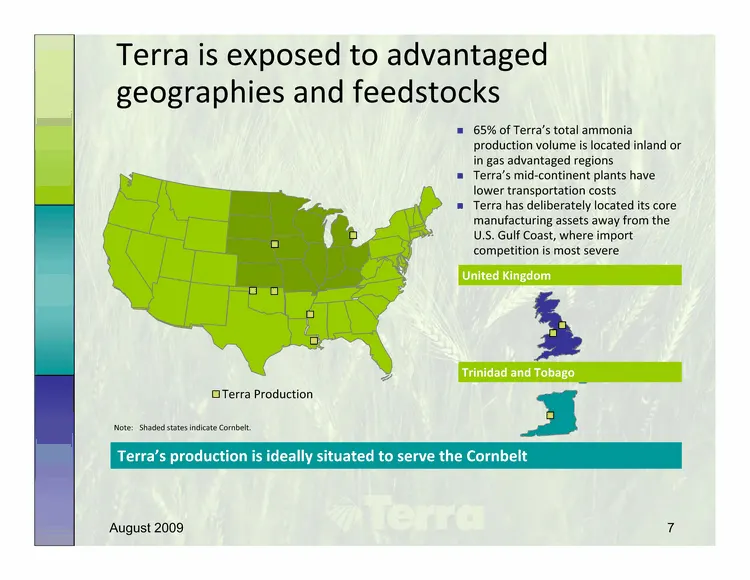
Slide 8: Terra is exposed to advantaged geographies and feedstocks
Terra3is3exposed3to3advantaged3 geographies3and3feedstocks 3 65%3of3Terra’s3total3ammonia3 production3volume3is3located3inland3or3 in3gas3advantaged3regions 3 Terra’s3mid3continent3plants3have3 lower3transportation3costs 3 Terra3has3deliberately3located3its3core3 manufacturing3assets3away3from3the3
Slide 9: Well positioned to capture growth: Increased exposure to UAN
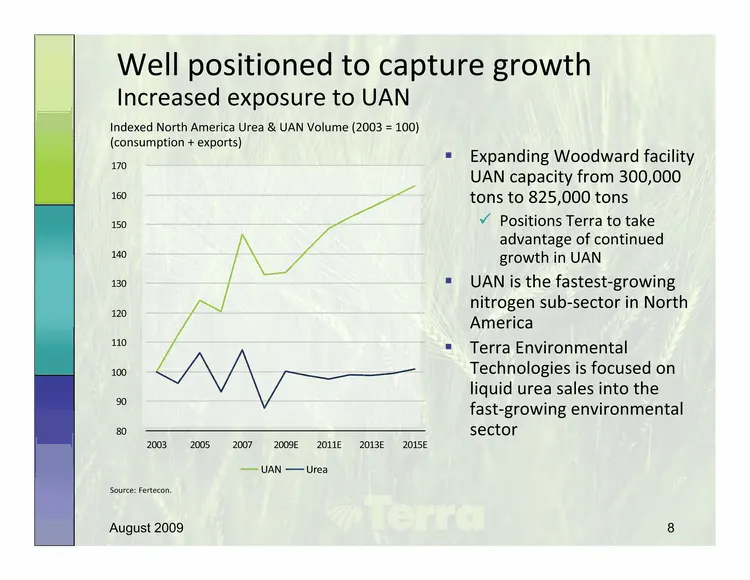
Well3positioned3to3capture3growth3 Increased3exposure3to3UAN Indexed3North3America3Urea3&3UAN3Volume3(20033=3100) (consumption3+3exports)3 3 Expanding3Woodward3facility3 170 UAN3capacity3from3300,0003 160 tons3to3825,0003tons 150 3 Positions3Terra3to3take3 advantage3of3continued3 140 growth3in3UAN 1
Slide 10: UAN commands a premium
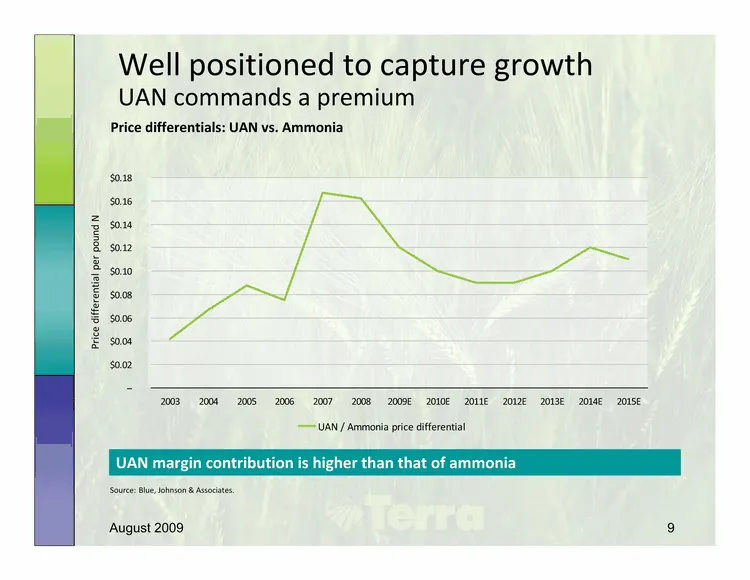
Well3positioned3to3capture3growth3 UAN3commands3a3premium3 Price3differentials:3UAN3vs.3Ammonia $0.18 $0.16 $0.14 $0.12 $0.10 $0.08 $0.06 Price3differential3per3pound3N $0.04 $0.02 — 2003 2004 2005 2006 2007 2008 2009E 2010E 2011E 2012E 2013E 2014E 2015E UAN3/3Ammonia3price3differential UAN3margin3c
Slide 11: UAN provides significant advantages to growers
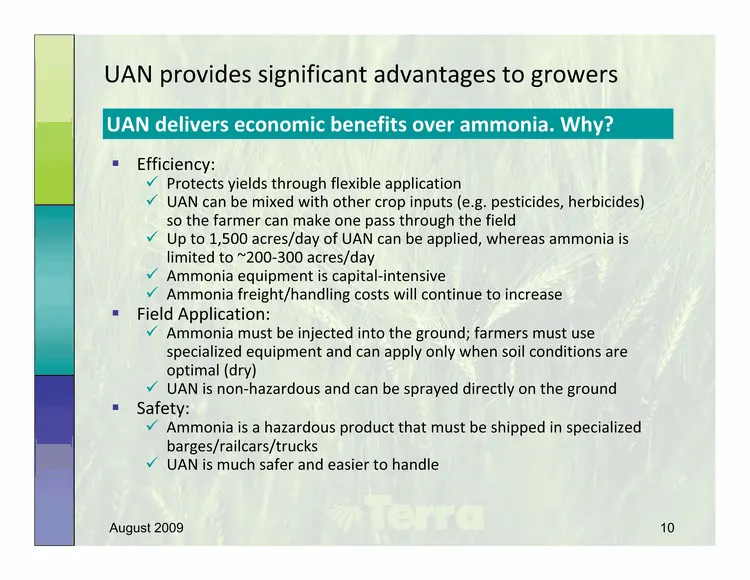
UAN3provides3significant3advantages3to3growers UAN3delivers3economic3benefits3over3ammonia.3Why? 3 Efficiency: 3 Protects3yields3through3flexible3application 3 UAN3can3be3mixed3with3other3crop3inputs3(e.g.3pesticides,3herbicides)3 so3the3farmer3can3make3one3pass3through3the3field 3 Up3to31,5003acres
Slide 12: Strong nitrogen industry fundamentals
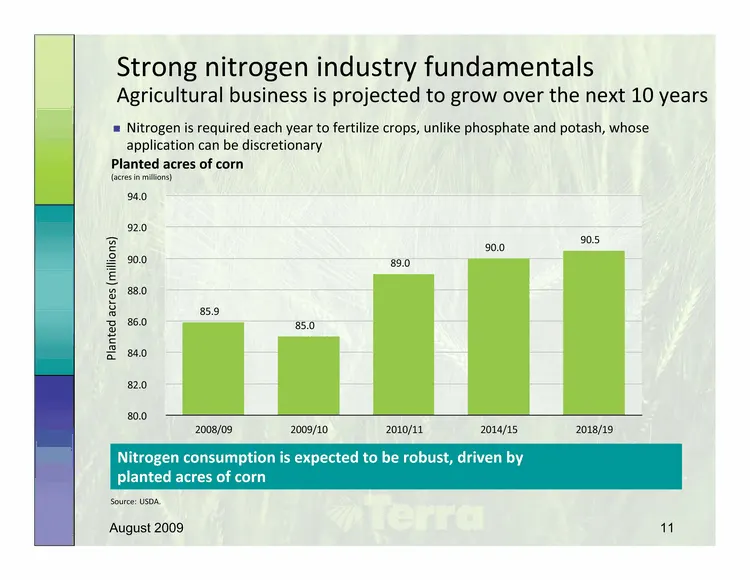
Strong3nitrogen3industry3fundamentals3 Agricultural3business3is3projected3to3grow3over3the3next3103years 3 Nitrogen3is3required3each3year3to3fertilize3crops,3unlike3phosphate3and3potash,3whose3 application3can3be3discretionary3 Planted3acres3of3corn (acres3in3millions) 94.0 92.0 90.5 90.0 90.0 89.0
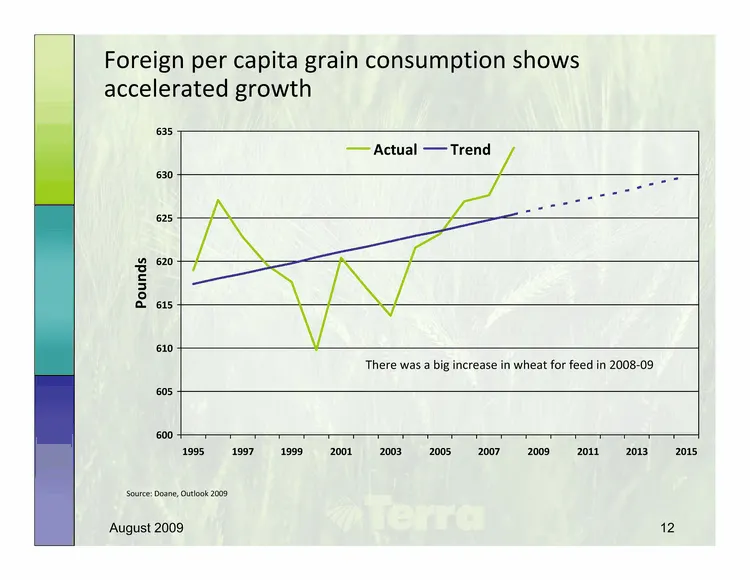
Slide 13: Foreign per capita grain consumption shows accelerated growth
Foreign3per3capita3grain3consumption3shows3 accelerated3growth 635 Actual Trend 630 625 620 Pounds 615 610 There3was3a3big3increase3in3wheat3for3feed3in32008309 605 600 1995 1997 1999 2001 2003 2005 2007 2009 2011 2013 2015 Source:3Doane,3Outlook32009 August 2009 12
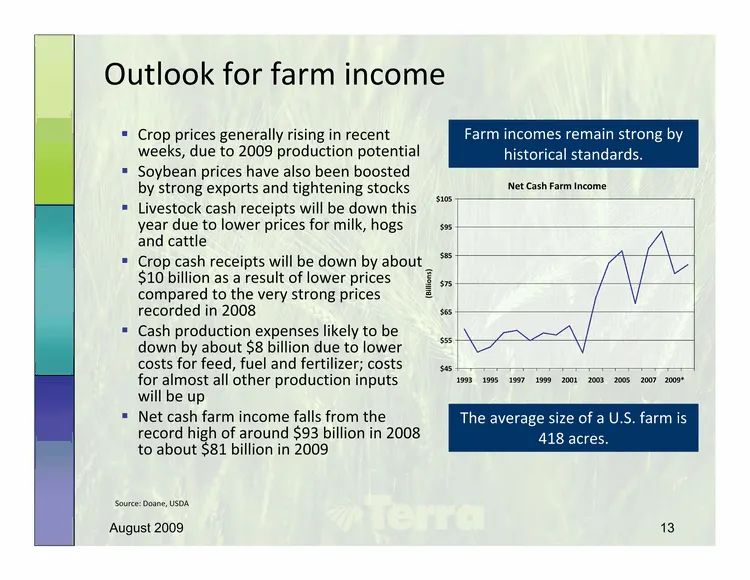
Slide 14: Outlook for farm income
Outlook3for3farm3income 3 Crop3prices3generally3rising3in3recent3 Farm3incomes3remain3strong3by3 weeks,3due3to320093production3potential historical3standards. 3 Soybean3prices3have3also3been3boosted3 by3strong3exports3and3tightening3stocks Net3Cash3Farm3Income $105 3 Livestock3cash3receipts3will3be3
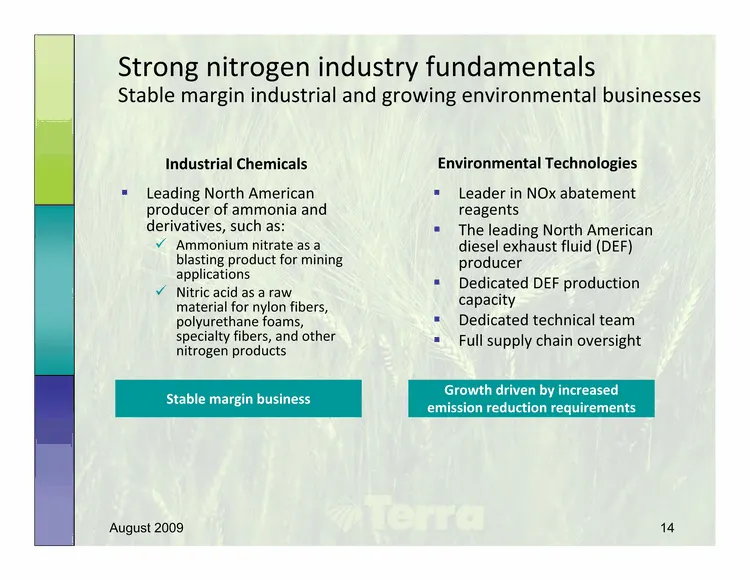
Slide 15: Stable margin industrial and growing environmental businesses
Strong3nitrogen3industry3fundamentals Stable3margin3industrial3and3growing3environmental3businesses Industrial3Chemicals Environmental3Technologies 3 Leading3North3American3 3 Leader3in3NOx3abatement3 producer3of3ammonia3and3 reagents derivatives,3such3as: 3 The3leading3North3American3 3 Ammonium3ni
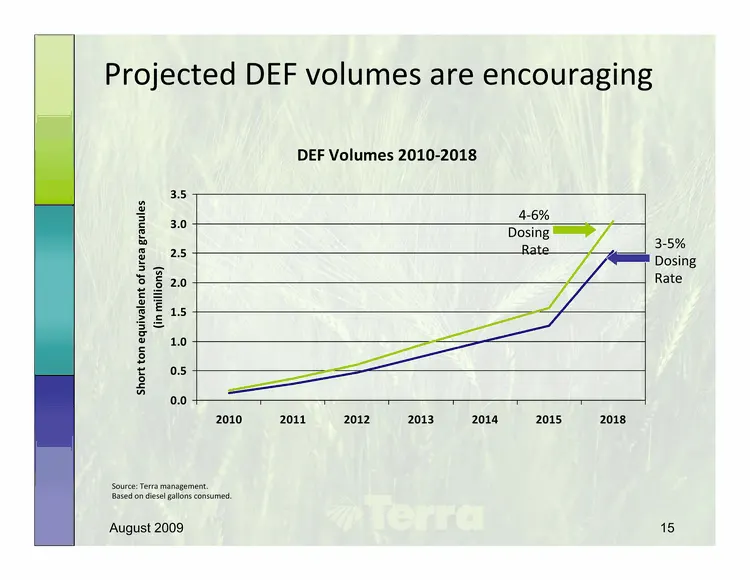
Slide 16: Projected DEF volumes are encouraging
Projected3DEF3volumes3are3encouraging DEF3Volumes3201032018 3.5 436%3 3.0 Dosing3 Rate 335%3 2.5 Dosing3 2.0 Rate (in3millions) 1.5 1.0 Short3ton3equivalent3of3urea3granules 0.5 0.0 2010 2011 2012 2013 2014 2015 2018 Source:3Terra3management. Based3on3diesel3gallons3consumed. August 2009 15
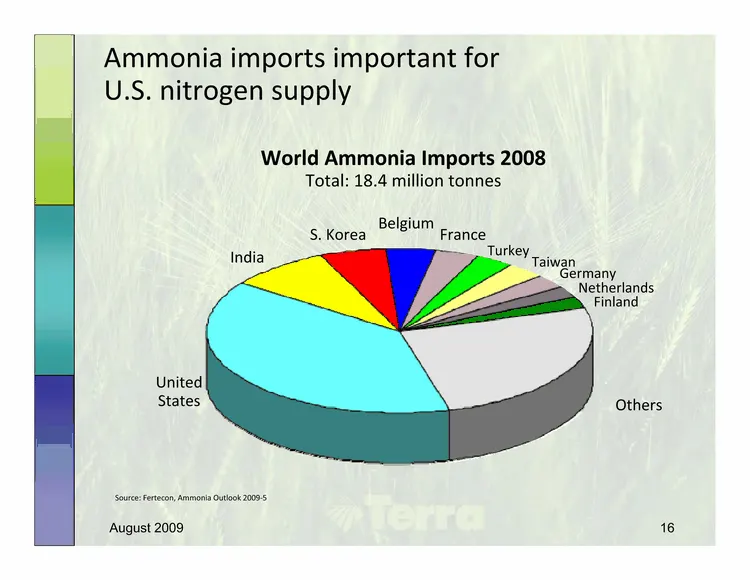
Slide 17: Ammonia imports important for U.S. nitrogen supply
Ammonia3imports3important3for3 U.S.3nitrogen3supply World3Ammonia3Imports32008 Total:318.43million3tonnes S.3Korea Belgium France India Turkey Taiwan Germany Netherlands Finland United3 States Others Source:3Fertecon,3Ammonia3Outlook3200935 August 2009 16
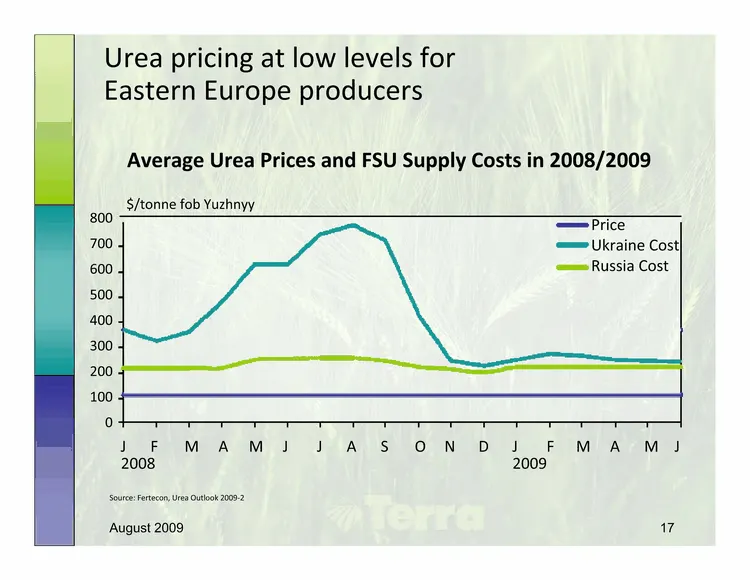
Slide 18: Urea pricing at low levels for Eastern Europe producers
Urea3pricing3at3low3levels3for3 Eastern3Europe3producers Average3Urea3Prices3and3FSU3Supply3Costs3in32008/2009 $/tonne fob3Yuzhnyy 800 Price 700 Ukraine3Cost 600 Russia3Cost 500 400 300 200 100 0 J F M A M J J A S O N D J F M A M J 2008 2009 Source:3Fertecon,3Urea3Outlook3200932 August 2009 17
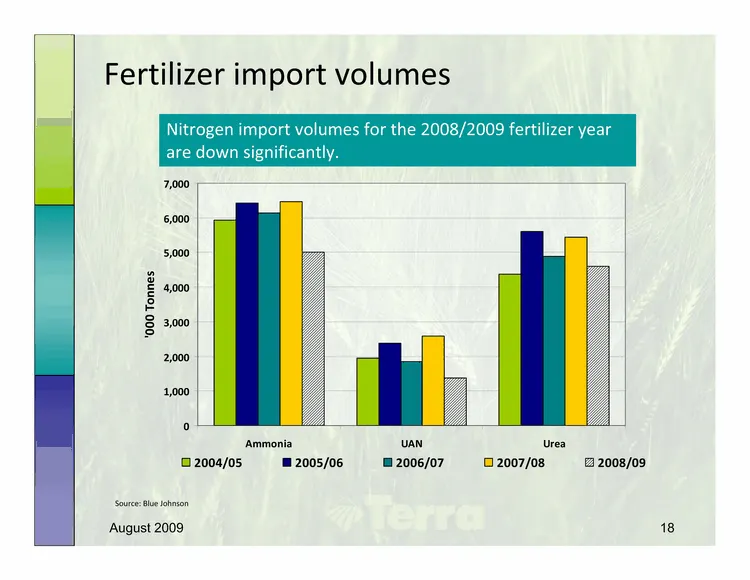
Slide 19: Fertilizer import volumes
Fertilizer3import3volumes Nitrogen3import3volumes3for3the32008/20093fertilizer3year3 are3down3significantly. 7,000 6,000 5,000 4,000 ‘0003Tonnes 3,000 2,000 1,000 0 Ammonia UAN Urea 2004/05 2005/06 2006/07 2007/08 2008/09 Source:3Blue3Johnson August 2009 18
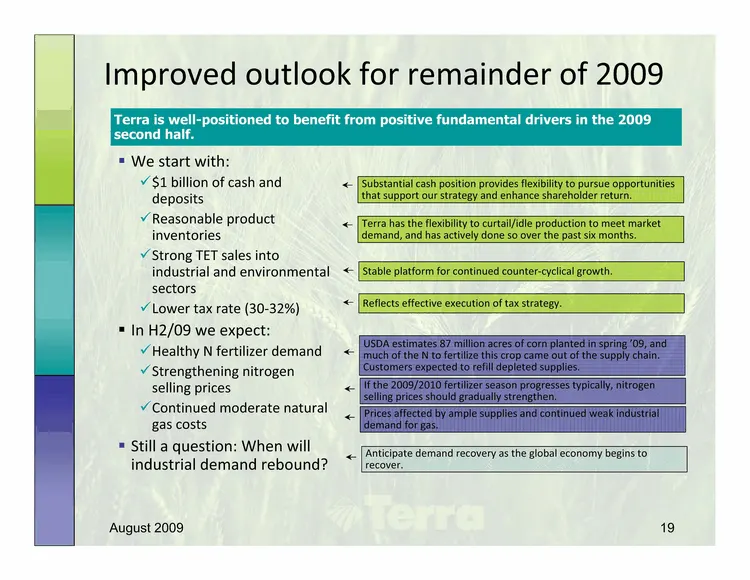
Slide 20: Improved outlook for remainder of 2009
Improved3outlook3for3remainder3of32009 Terra is well-positioned to benefit from positive fundamental drivers in the 2009 second half. 3 We3start3with: 3 $13billion3of3cash3and3 Substantial3cash3position3provides3flexibility3to3pursue3opportunities3 deposits that3support3our3strategy3and3enhance3shar
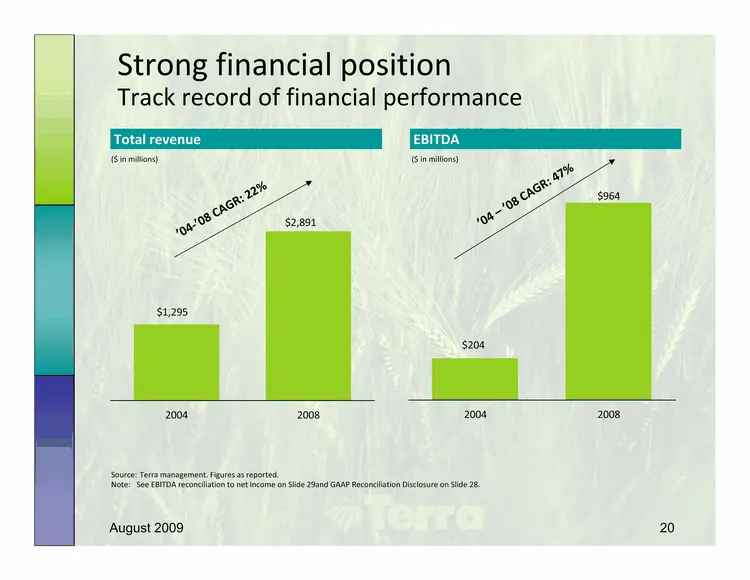
Slide 21: Strong financial position
Strong3financial3position Track3record3of3financial3performance Total3revenue3 EBITDA ($3in3millions) ($3in3millions) 7 % : 3 4 % G R 3 2 2 A $964 R : 8 3 C A G ’ 0 C 4 3— ’ 0 83 $2,891 ’ 0 ’ 0 43 $1,295 $204 2004 2008 2004 2008 Source: Terra3management.3Figures3as3reported.3 Note: See3EBITDA3reconc
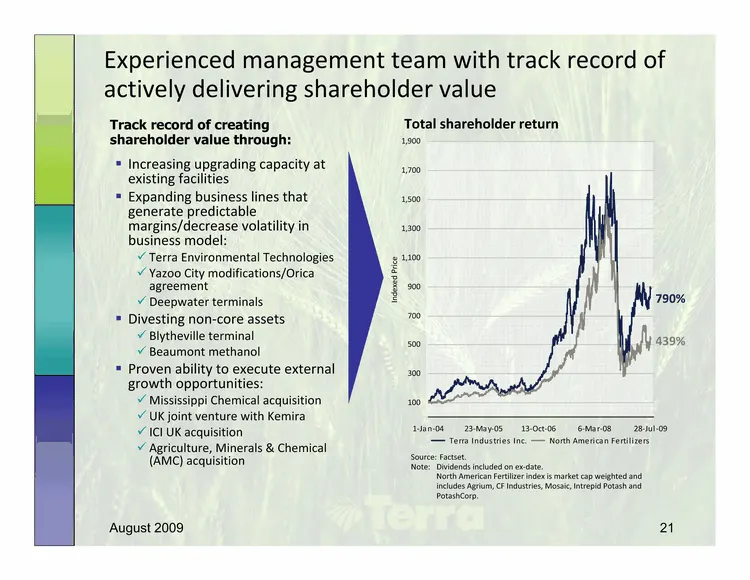
Slide 22: Experienced management team with track record of actively delivering shareholder value
Experienced3management3team3with3track3record3of33 actively3delivering3shareholder3value Track record of creating Total3shareholder3return shareholder value through: 1,900 3 Increasing3upgrading3capacity3at3 1,700 existing3facilities 3 Expanding3business3lines3that3 1,500 generate3predictable3 margi
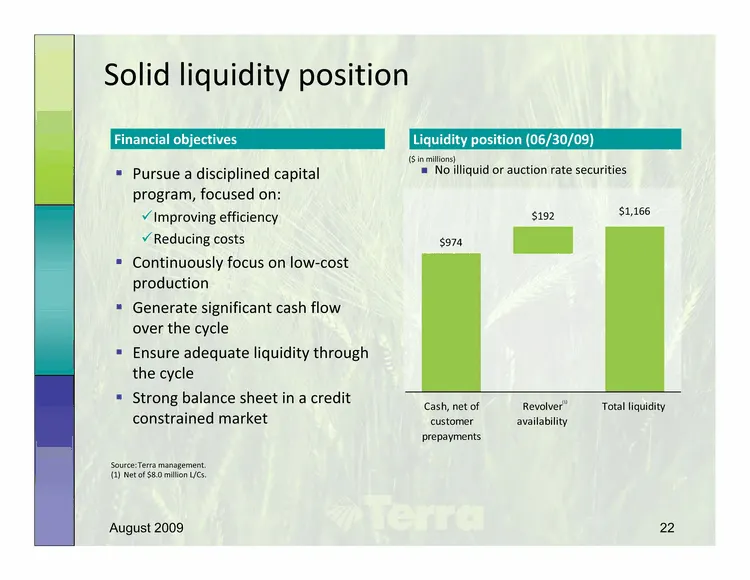
Slide 23: Solid liquidity position
Solid3liquidity3position Financial3objectives Liquidity3position3(06/30/09) ($3in3millions) 3 Pursue3a3disciplined3capital3 3 No3illiquid3or3auction3rate3securities program,3focused3on: 3 Improving3efficiency $192 $1,166 3 Reducing3costs $974 3 Continuously3focus3on3low3cost3 production 3 Generate3s
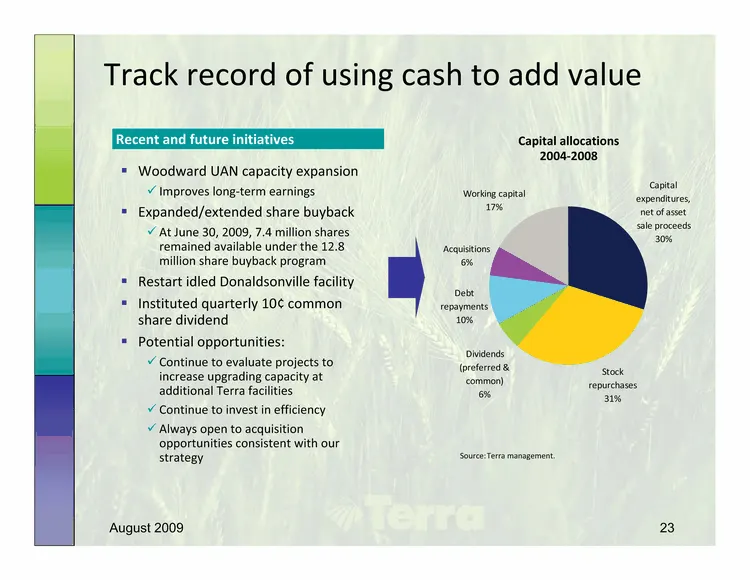
Slide 24: Track record of using cash to add value
Track3record3of3using3cash3to3add3value Recent3and3future3initiatives Capital3allocations 200432008 3 Woodward3UAN3capacity3expansion 3 Improves3long3term3earnings Capital3 Working3capital expenditures,3 17% 3 Expanded/extended3share3buyback net3of3asset3 At3June330,32009,37.43million3shares3 sale3p
Slide 25: Terra's strategy is right for the current environment and potential future cycles
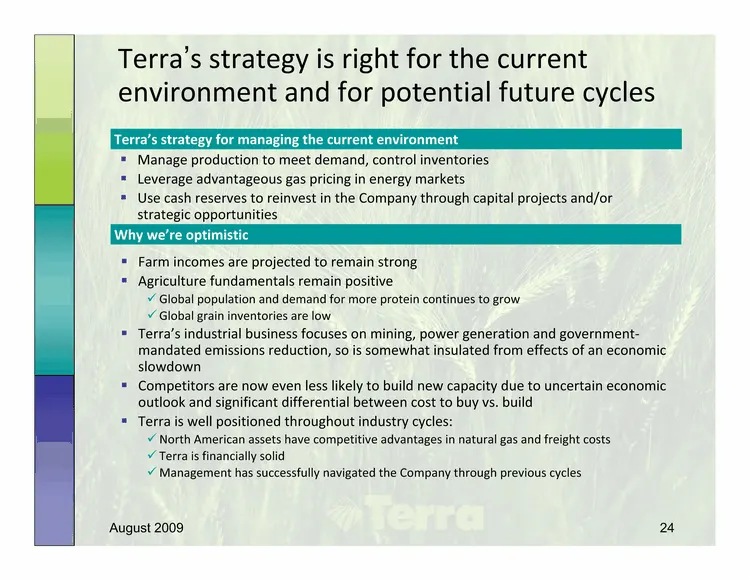
Terra’s3strategy3is3right3for3the3current3 environment3and3for3potential3future3cycles Terra’s3strategy3for3managing3the3current3environment 3 Manage3production3to3meet3demand,3control3inventories 3 Leverage3advantageous3gas3pricing3in3energy3markets 3 Use3cash3reserves3to3reinvest3in3the3Company3th
Slide 26: Terra will deliver value for its shareholders
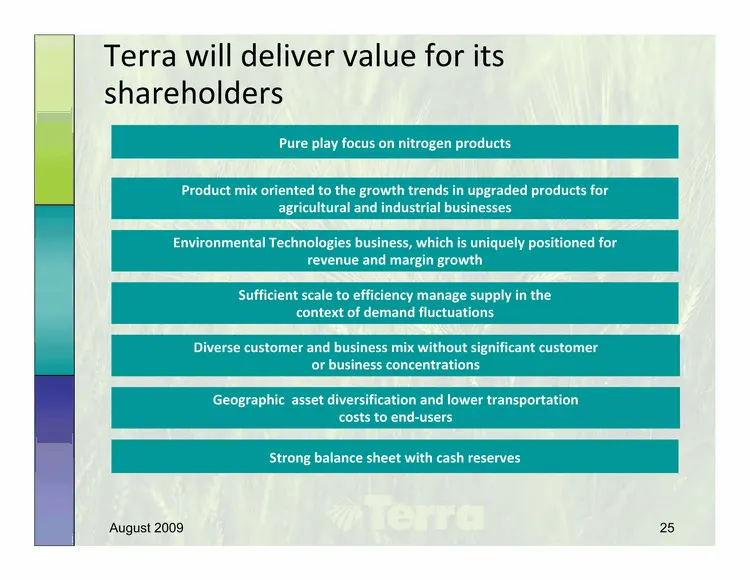
Terra3will3deliver3value3for3its3 shareholders Pure3play3focus3on3nitrogen3products Product3mix3oriented3to3the3growth3trends3in3upgraded3products3for3 agricultural3and3industrial3businesses Environmental3Technologies3business,3which3is3uniquely3positioned3for3 revenue3and3margin3growth Sufficient3s
Slide 27: Questions & Answers
Supplying3Industry Cleaning3the3Air Feeding3the3World Terra3Industries3Inc. Questions3&3Answers
Slide 28: GAAP Reconciliation Disclosure
GAAP3Reconciliation3Disclosure 3 Terra3prepares3its3financial3statements3in3conformity3with3accounting3 principles3generally3accepted3in3the3United3States3of3America3 (“GAAP”).33However,3management3believes3that3certain3non3GAAP3 financial3measures3used3to3manage3Terra’s3business3that3fall3within3 t
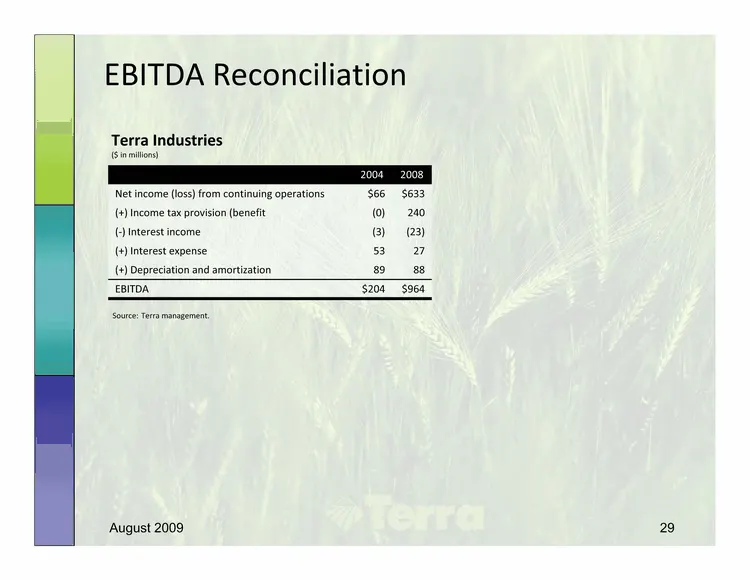
Slide 29: EBITDA Reconciliation
EBITDA3Reconciliation Terra3Industries ($3in3millions) 2004 2008 Net3income3(loss)3from3continuing3operations $66 $633 (+)3Income3tax3provision3(benefit (0) 240 (3)3Interest3income (3) (23) (+)3Interest3expense 53 27 (+)3Depreciation3and3amortization 89 88 EBITDA $204 $964 Source: Terra3management.3
Source: SEC EDGAR · 425 filed Aug 7, 2009
More decks from Terra Industries Inc
 Merger or Acquisition (March 2010)7 slides · Mar 2, 2010
 Merger or Acquisition (February 2010)50 slides · Feb 17, 2010
 SterneAgee HarvestFest Global Food and Agriculture Conference 200949 slides · Sep 24, 2009
 Sterne Agee & Leach HarvestFest 200921 slides · Sep 24, 2009
 Credit Suisse Chemical & Ag Science Conference 200930 slides · Sep 15, 2009
 Merger or Acquisition (June 2009)33 slides · Jun 25, 2009