Terra Industries — Sterne Agee & Leach HarvestFest 2009
21 slides from Terra Industries's conference presentation, Sep 24, 2009
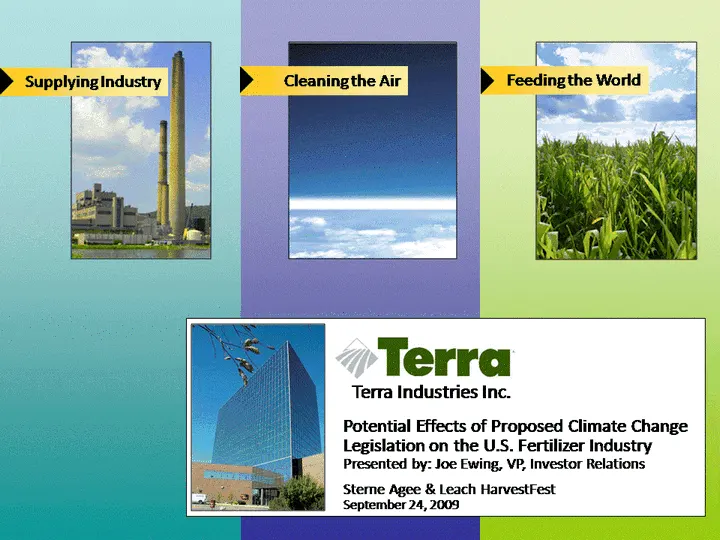
Slide 1: Potential Effects of Proposed Climate Change Legislation on the U.S. Fertilizer Industry
Potential Effects of Proposed Climate Change Legislation on the U.S. Fertilizer Industry Presented by: Joe Ewing, VP, Investor Relations Sterne Agee & Leach HarvestFest September 24, 2009
Slide 2: Forward-Looking Statements
Forward-Looking Statements Certain statements in this communication may constitute "forward-looking" statements within the meaning of the Private Securities Litigation Reform Act of 1995. Forward-looking statements are based upon assumptions as to future events that may not prove to be accurate. The
Slide 3: Important Information and Where to Find It
Important Information and Where to Find It On September 18, 2009, Terra filed with the Securities and Exchange Commission (the "SEC") a revised preliminary proxy statement in connection with its 2009 Annual Meeting, which is available free of charge at the SEC's Web site at www.sec.gov and Terra's W
Slide 4: Certain Information Concerning Participants
Certain Information Concerning Participants Terra, its directors, executive officers and certain employees specified in Annex A to Terra's revised preliminary proxy statement for the 2009 Annual Meeting, which was filed with the SEC on September 18, 2009, are participants in the solicitation of Terr
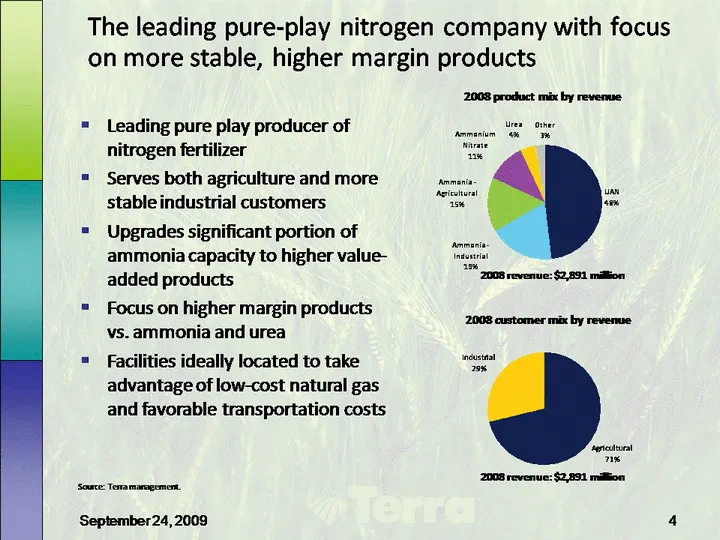
Slide 5: The leading pure-play nitrogen company with focus on more stable, higher margin products
The leading pure-play nitrogen company with focus on more stable, higher margin products Leading pure play producer of nitrogen fertilizer Serves both agriculture and more stable industrial customers Upgrades significant portion of ammonia capacity to higher value- added products Focus on higher mar
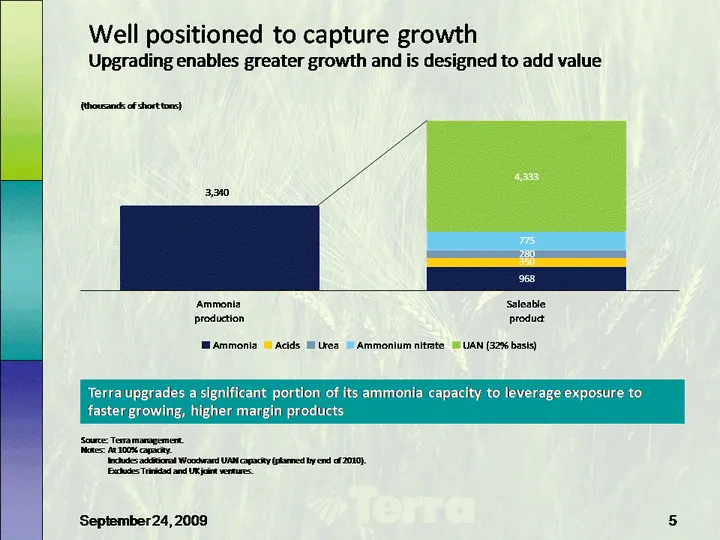
Slide 6: Well positioned to capture growth
Well positioned to capture growth Upgrading enables greater growth and is designed to add value Source: Terra management. Notes: At 100% capacity. Includes additional Woodward UAN capacity (planned by end of 2010). Excludes Trinidad and UK joint ventures. Terra upgrades a significant portion of its
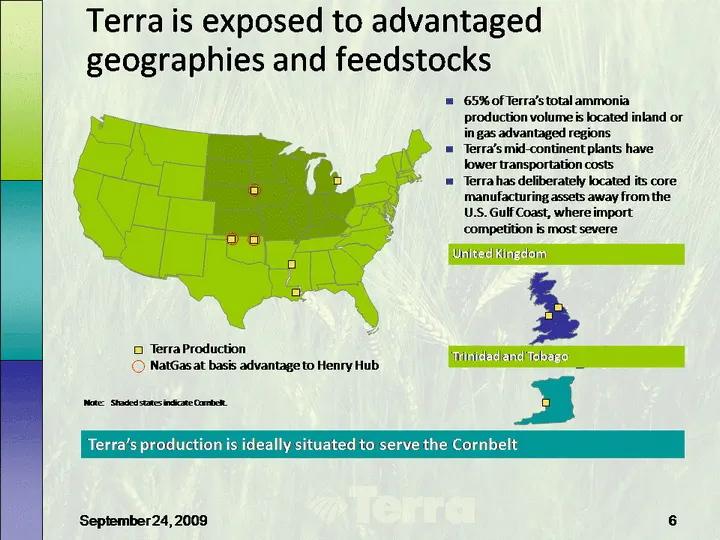
Slide 7: Terra is exposed to advantaged geographies and feedstocks
Terra is exposed to advantaged geographies and feedstocks 65% of Terra's total ammonia production volume is located inland or in gas advantaged regions Terra's mid-continent plants have lower transportation costs Terra has deliberately located its core manufacturing assets away from the U.S. Gulf Co
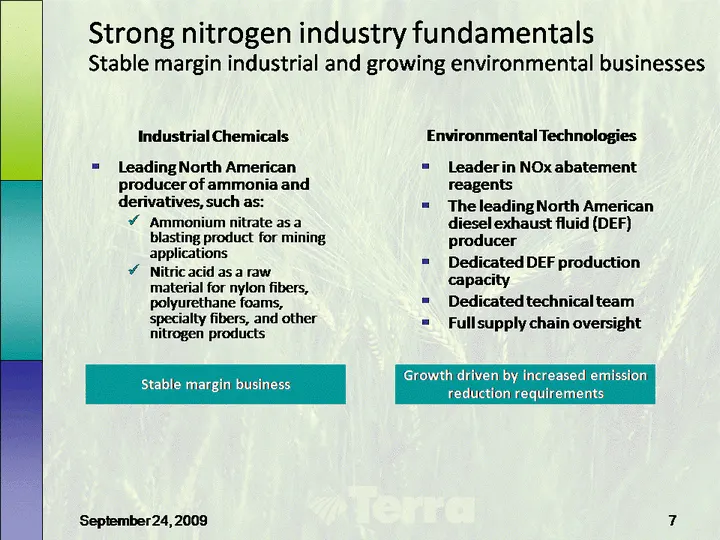
Slide 8: Strong nitrogen industry fundamentals
Strong nitrogen industry fundamentals Stable margin industrial and growing environmental businesses Industrial Chemicals Environmental Technologies Growth driven by increased emission reduction requirements Stable margin business Leading North American producer of ammonia and derivatives, such as: A
Slide 9: Proposed Climate Change Legislation
Proposed Climate Change Legislation
Slide 10: Today's discussion
Today's discussion Pertains to potential future legislation; there is no current Climate Change law Covers provisions of the Waxman-Markey Bill (H.R. 2454), which has passed the House Senate will initiate its own bill, possibly premised on H.R. 2454 Focuses on potential effects on nitrogen productio
Slide 11: H.R. 2454: Bill provisions
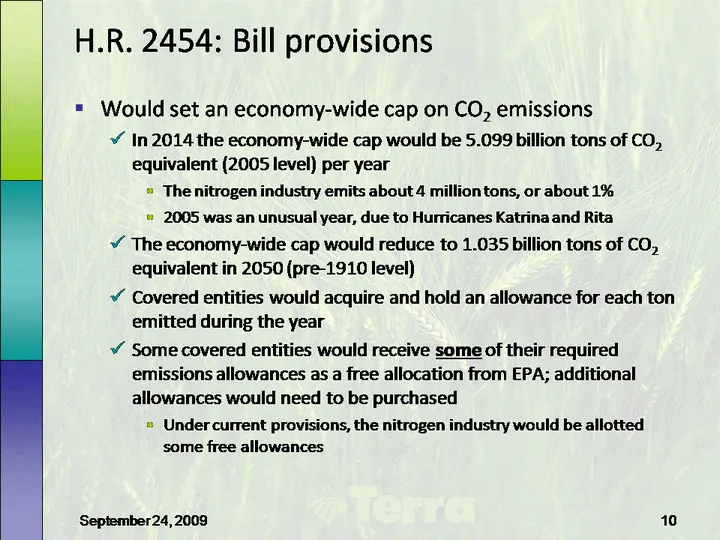
H.R. 2454: Bill provisions Would set an economy-wide cap on CO2 emissions In 2014 the economy-wide cap would be 5.099 billion tons of CO2 equivalent (2005 level) per year The nitrogen industry emits about 4 million tons, or about 1% 2005 was an unusual year, due to Hurricanes Katrina and Rita The ec
Slide 12: H.R. 2454: Bill provisions (continued)
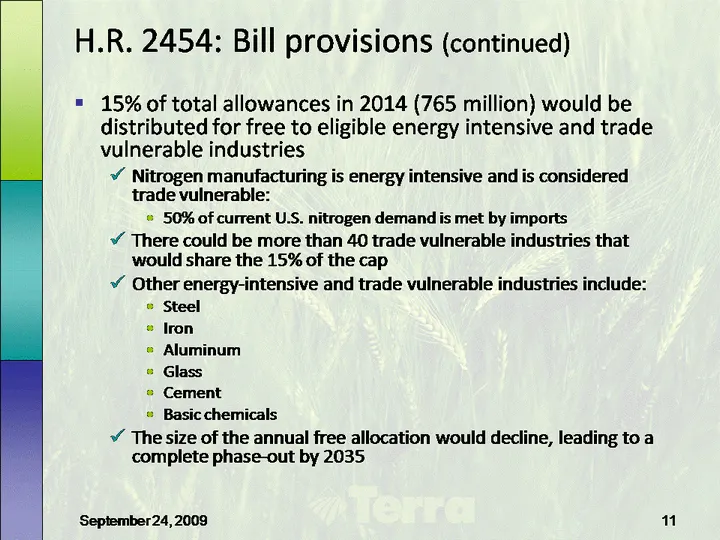
H.R. 2454: Bill provisions (continued) 15% of total allowances in 2014 (765 million) would be distributed for free to eligible energy intensive and trade vulnerable industries Nitrogen manufacturing is energy intensive and is considered trade vulnerable: 50% of current U.S. nitrogen demand is met by
Slide 13: H.R. 2454: Bill provisions (continued)
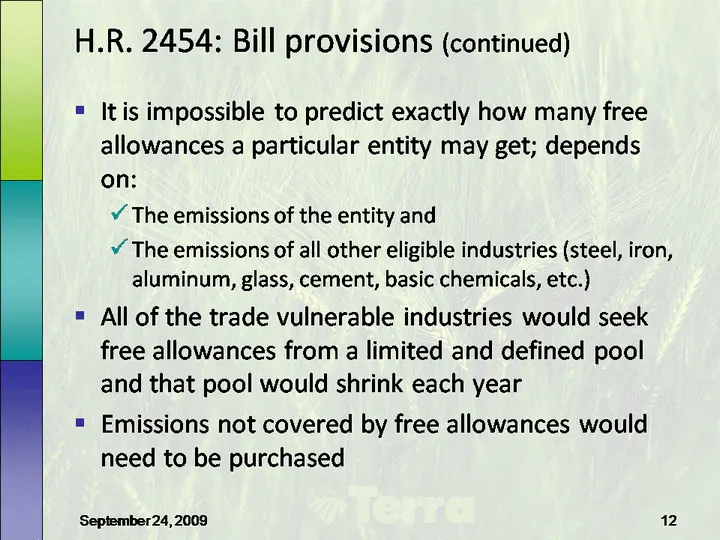
H.R. 2454: Bill provisions (continued) It is impossible to predict exactly how many free allowances a particular entity may get; depends on: The emissions of the entity and The emissions of all other eligible industries (steel, iron, aluminum, glass, cement, basic chemicals, etc.) All of the trade v
Slide 14: Potential effects of climate change legislation
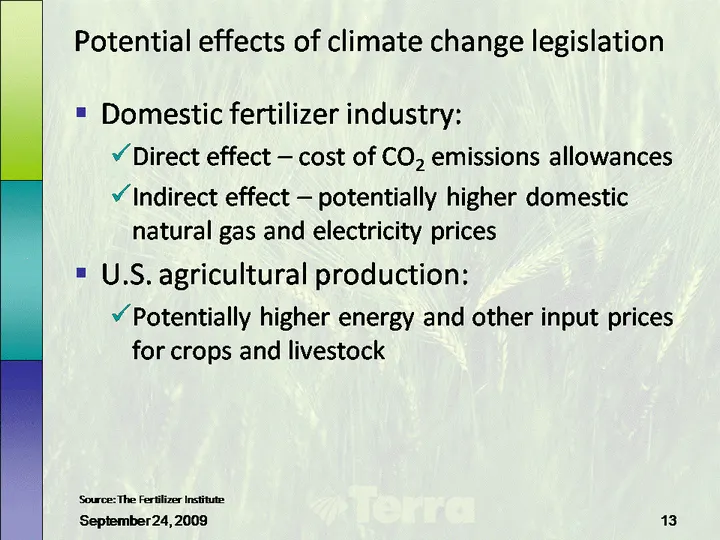
Potential effects of climate change legislation Domestic fertilizer industry: Direct effect - cost of CO2 emissions allowances Indirect effect - potentially higher domestic natural gas and electricity prices U.S. agricultural production: Potentially higher energy and other input prices for crops and
Slide 15: Summary of potential impact on U.S. fertilizer industry by sector
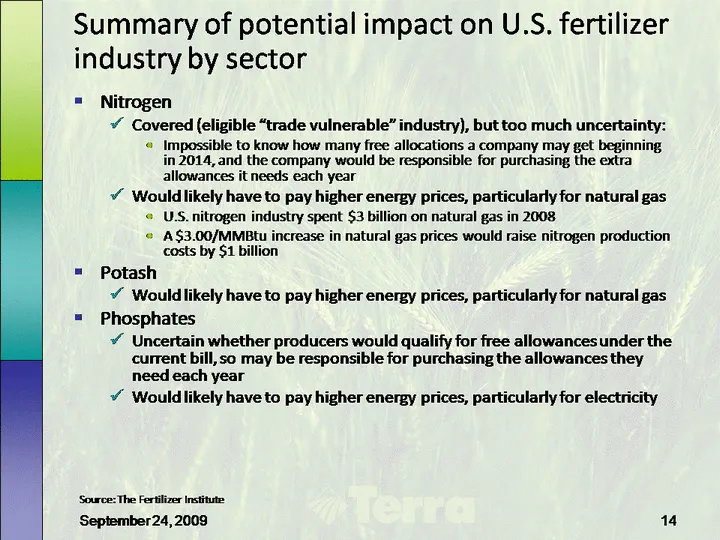
Summary of potential impact on U.S. fertilizer industry by sector Nitrogen Covered (eligible "trade vulnerable" industry), but too much uncertainty: Impossible to know how many free allocations a company may get beginning in 2014, and the company would be responsible for purchasing the extra allowan
Slide 16: Domestic producers would compete with imports from countries with no climate change legislation
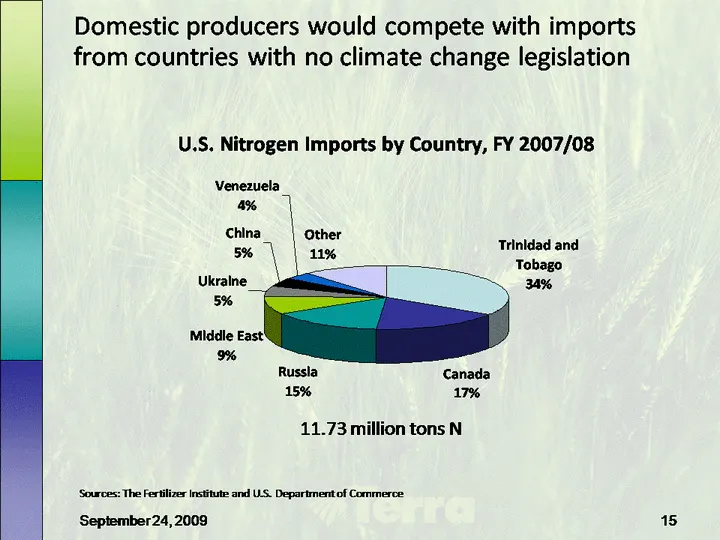
Domestic producers would compete with imports from countries with no climate change legislation Trinidad and Tobago Canada Russia Middle East Ukraine China Venezuela Other Trinidad and Tobago 0.341 0.173 0.15 0.092 0.051 0.047 0.036 0.11 11.73 million tons N Sources: The Fertilizer Institute and U.S
Slide 17: ~35% of CO2 emissions are from heat/energy production
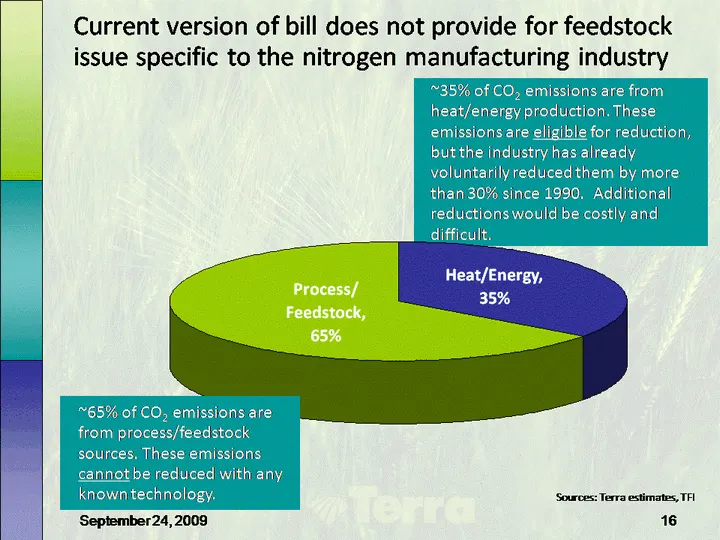
~35% of CO2 emissions are from heat/energy production. These emissions are eligible for reduction, but the industry has already voluntarily reduced them by more than 30% since 1990. Additional reductions would be costly and difficult. Heat/Energy Process/Feedstock 0.35 0.65 Current version of bill d
Slide 18: Potential cost of proposed legislation to U.S. nitrogen producers
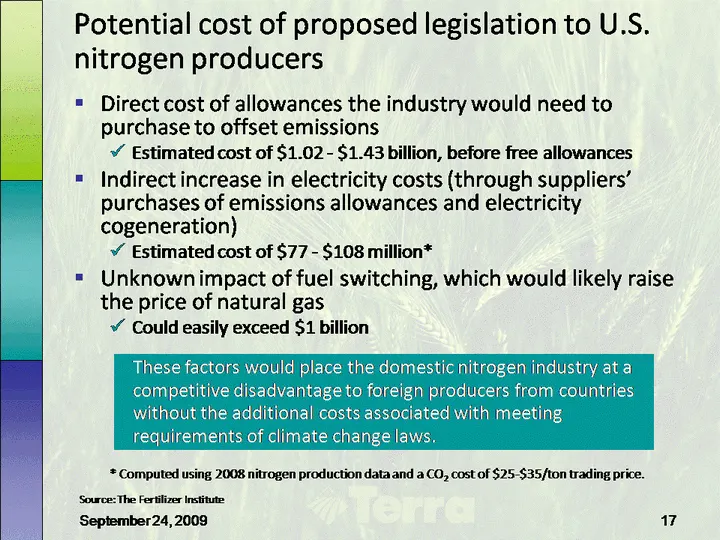
Potential cost of proposed legislation to U.S. nitrogen producers Direct cost of allowances the industry would need to purchase to offset emissions Estimated cost of $1.02 - $1.43 billion, before free allowances Indirect increase in electricity costs (through suppliers' purchases of emissions allowa
Slide 19: Proposed allowances timeline
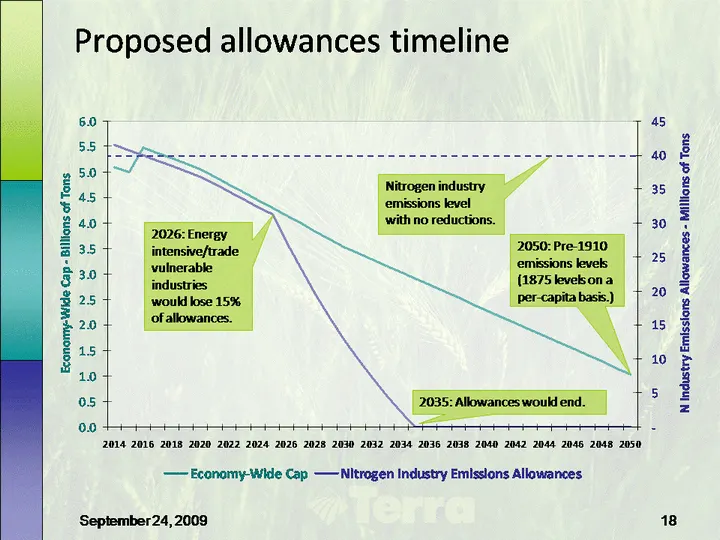
Proposed allowances timeline 2026: Energy intensive/trade vulnerable industries would lose 15% of allowances. 2035: Allowances would end. 2050: Pre-1910 emissions levels (1875 levels on a per-capita basis.) Nitrogen industry emissions level with no reductions.
Slide 20: EPA estimates of energy cost increases are extremely conservative
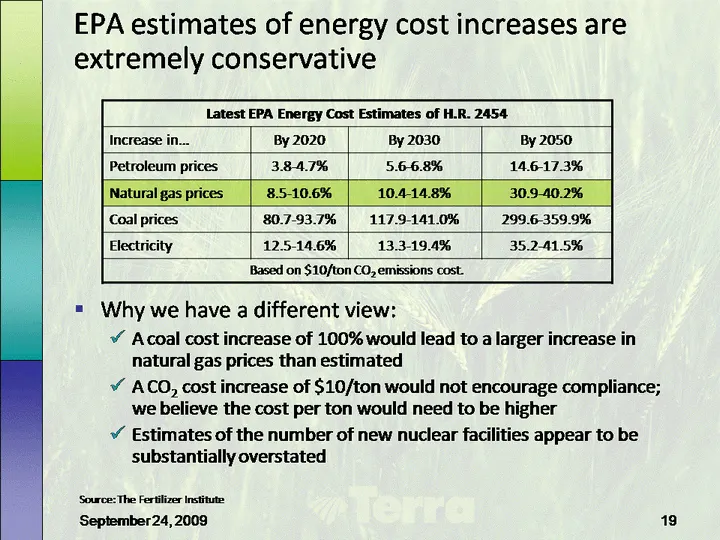
EPA estimates of energy cost increases are extremely conservative Why we have a different view: A coal cost increase of 100% would lead to a larger increase in natural gas prices than estimated A CO2 cost increase of $10/ton would not encourage compliance; we believe the cost per ton would need to b
Slide 21: Questions & Answers
Terra Terra Industries Inc. Questions & Answers
Source: SEC EDGAR · DEFA14A filed Sep 24, 2009
More decks from Terra Industries Inc
 Merger or Acquisition (March 2010)7 slides · Mar 2, 2010
 Merger or Acquisition (February 2010)50 slides · Feb 17, 2010
 SterneAgee HarvestFest Global Food and Agriculture Conference 200949 slides · Sep 24, 2009
 Credit Suisse Chemical & Ag Science Conference 200930 slides · Sep 15, 2009
 Merrill Lynch Midwest Roadshow (August 2009)29 slides · Aug 7, 2009
 Merger or Acquisition (June 2009)33 slides · Jun 25, 2009