Perion Network Ltd · NASDAQ:PERI
Perion Network — Investor Presentation (May 2014)
20 slides from Perion Network's investor presentation, May 2014

Slide 1: Presentation for the Capital Market
Presentation for the Capital Market May 2014 www.perion.com 1
Slide 2: Forward-Looking Information
Forward-Looking Information This presentation was prepared by Perion Network Ltd. (“the Company”) as a general presentation All forward-looking information is solely intended for the date that it relates to. Other than the about the Company. obligation to disclose information as required under the s
Slide 3: Business Card
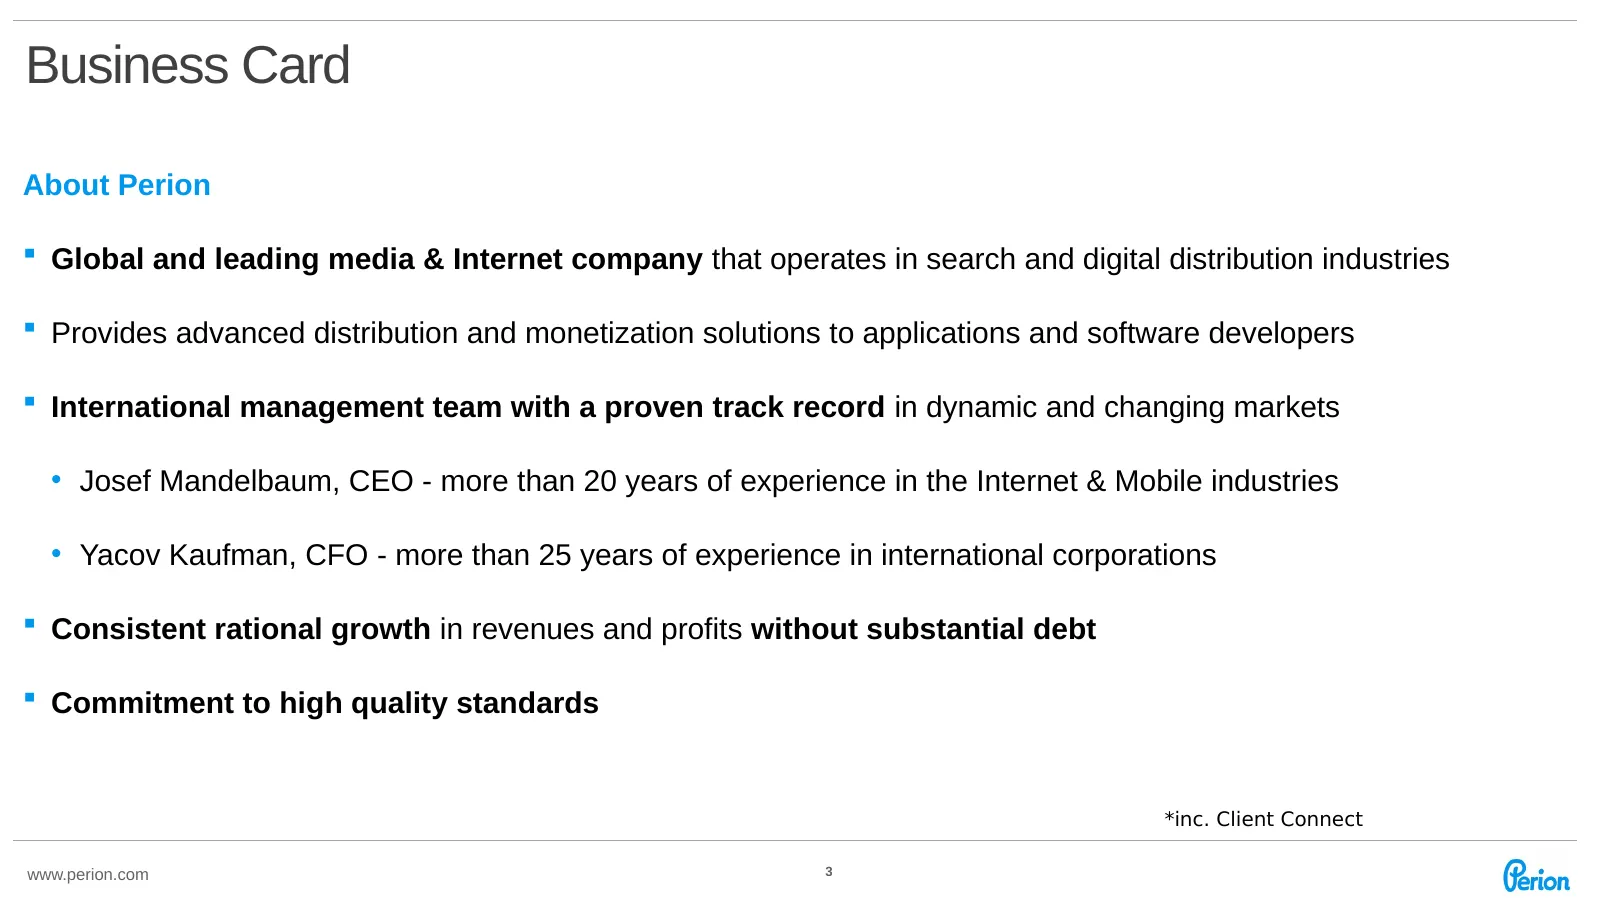
Business Card About Perion Global and leading media & Internet company that operates in search and digital distribution industries Provides advanced distribution and monetization solutions to applications and software developers International management team with a proven track record in dynam
Slide 4: Leading financial data
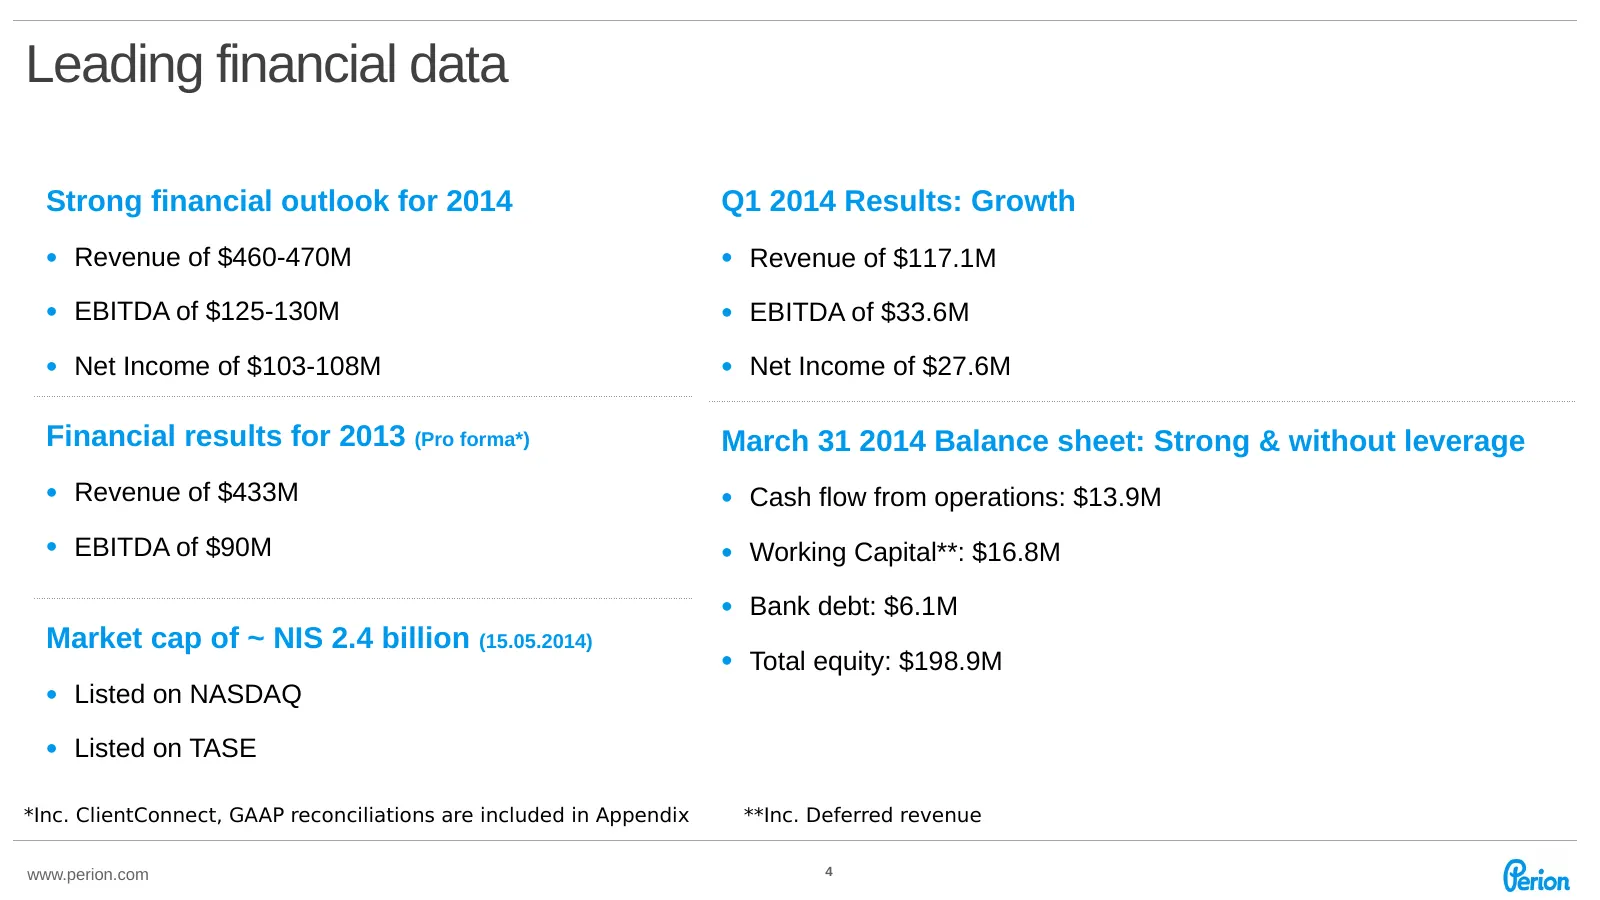
Leading financial data Strong financial outlook for 2014 Q1 2014 Results: Growth • Revenue of $460-470M • Revenue of $117.1M • EBITDA of $125-130M • EBITDA of $33.6M • Net Income of $103-108M • Net Income of $27.6M Financial results for 2013 (Pro forma*) March 31 2014 Balance sheet: Strong & without
Slide 5: Strong financial performance
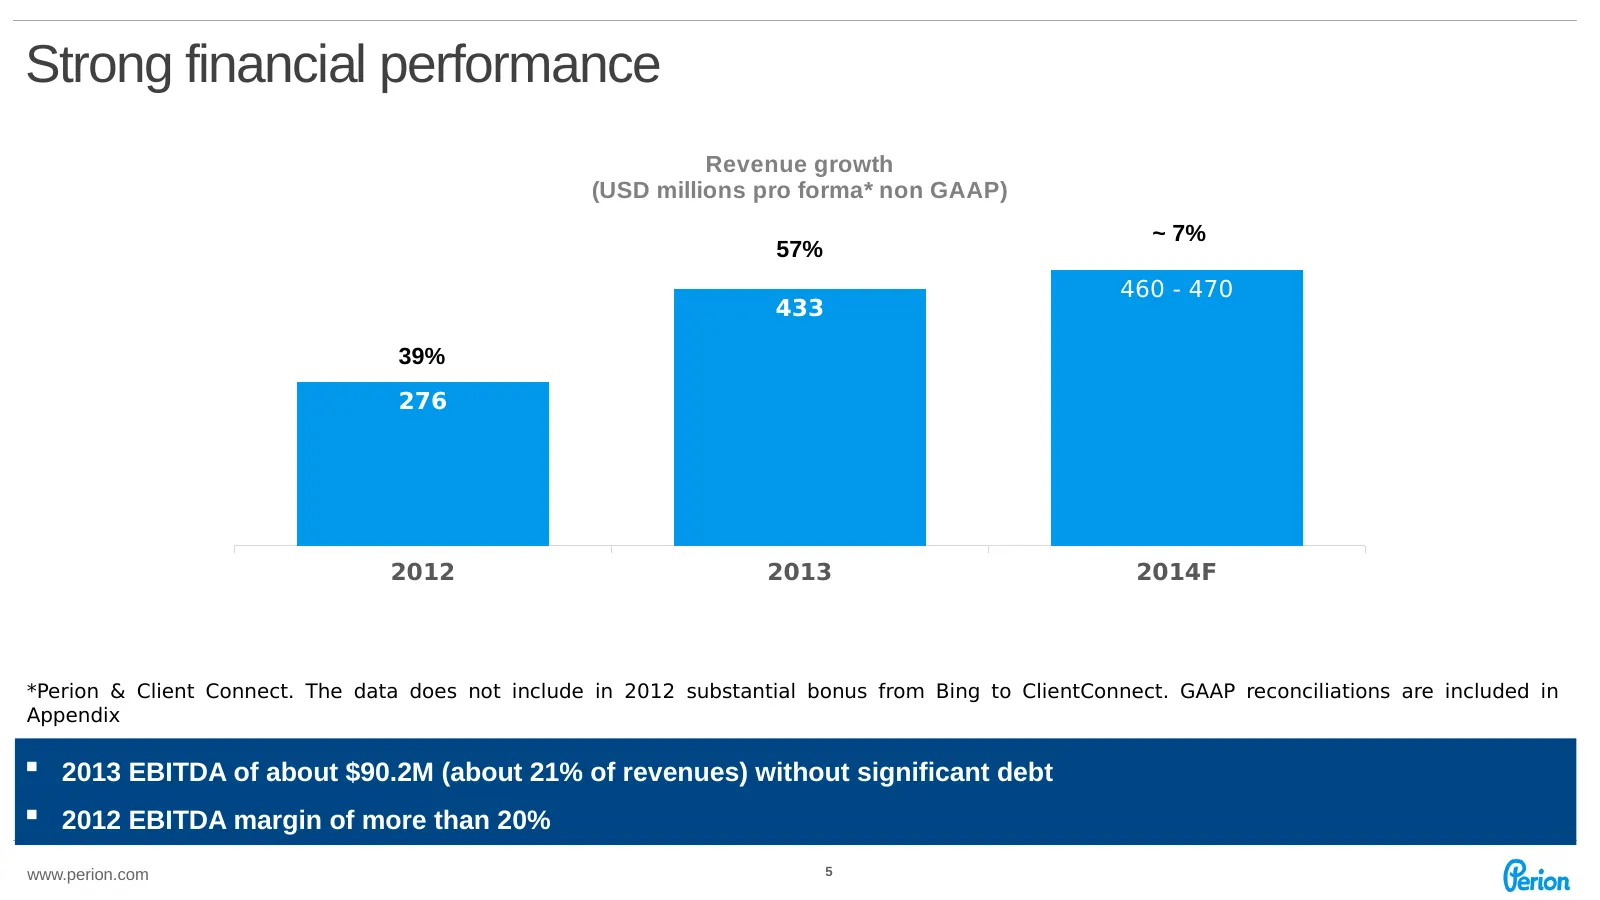
Strong financial performance Revenue growth (USD millions pro forma* non GAAP) ~ 7% 57% 460 - 470 433 39% 276 2012 2013 2014F *Perion & Client Connect. The data does not include in 2012 substantial bonus from Bing to ClientConnect. GAAP reconciliations are included in Appendix 2013 EBITDA of about
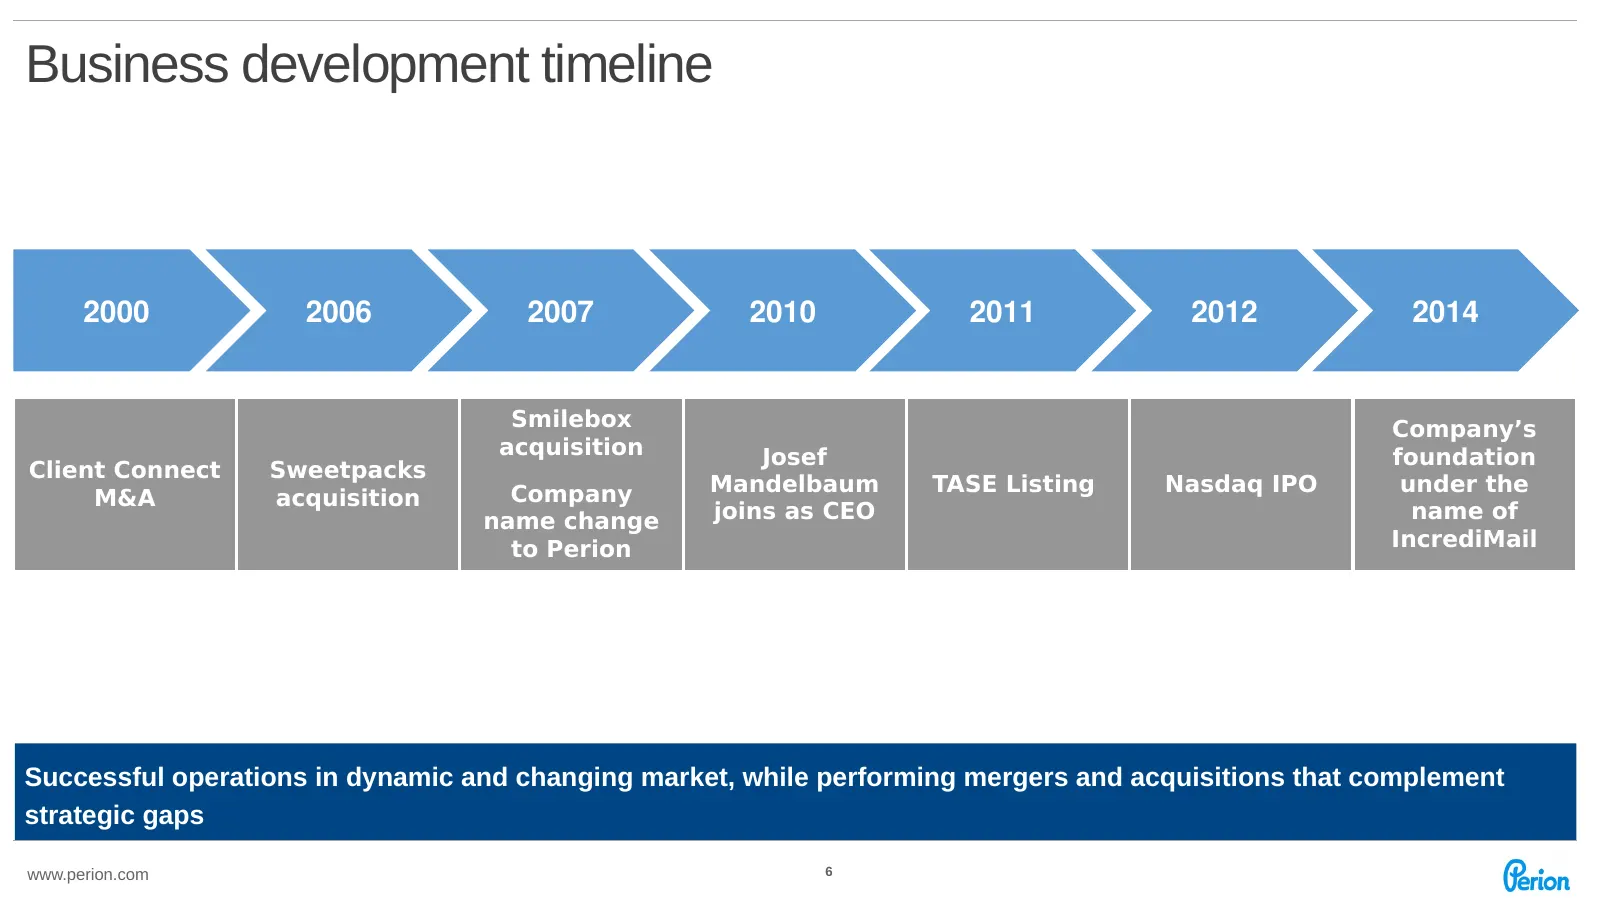
Slide 6: Business development timeline
Business development timeline 2000 2006 2007 2010 2011 2012 2014 Smilebox Company’s acquisition Josef foundation Client Connect Sweetpacks Company Mandelbaum TASE Listing Nasdaq IPO under the M&A acquisition name change joins as CEO name of to Perion IncrediMail Successful operations in dynamic and
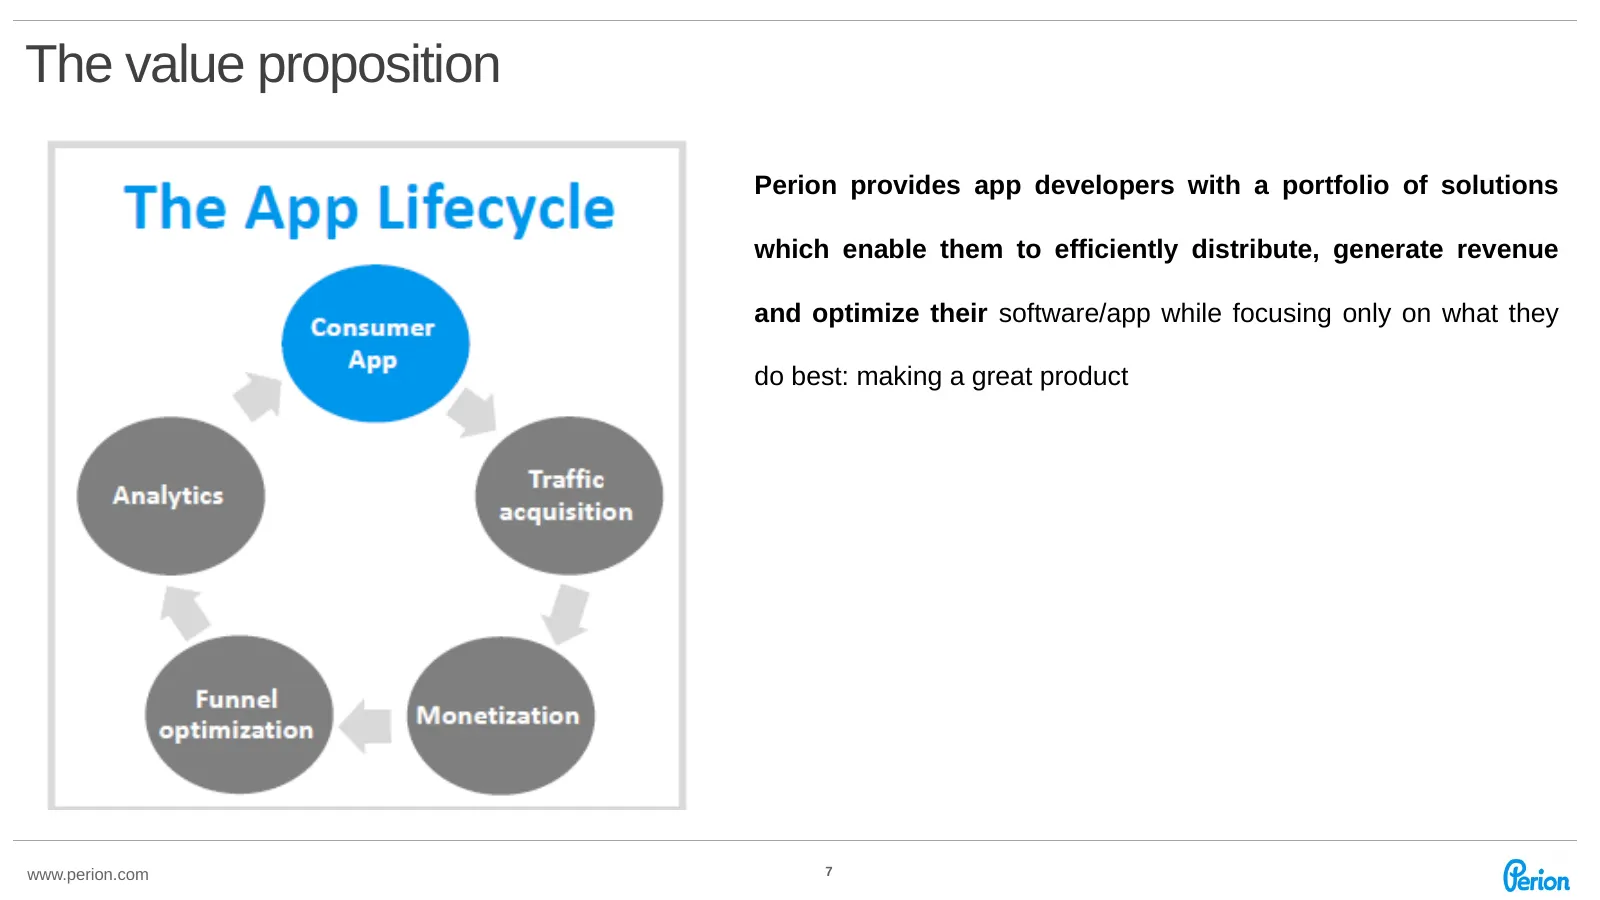
Slide 7: The value proposition
The value proposition Perion provides app developers with a portfolio of solutions which enable them to efficiently distribute, generate revenue and optimize their software/app while focusing only on what they do best: making a great product www.perion.com 7
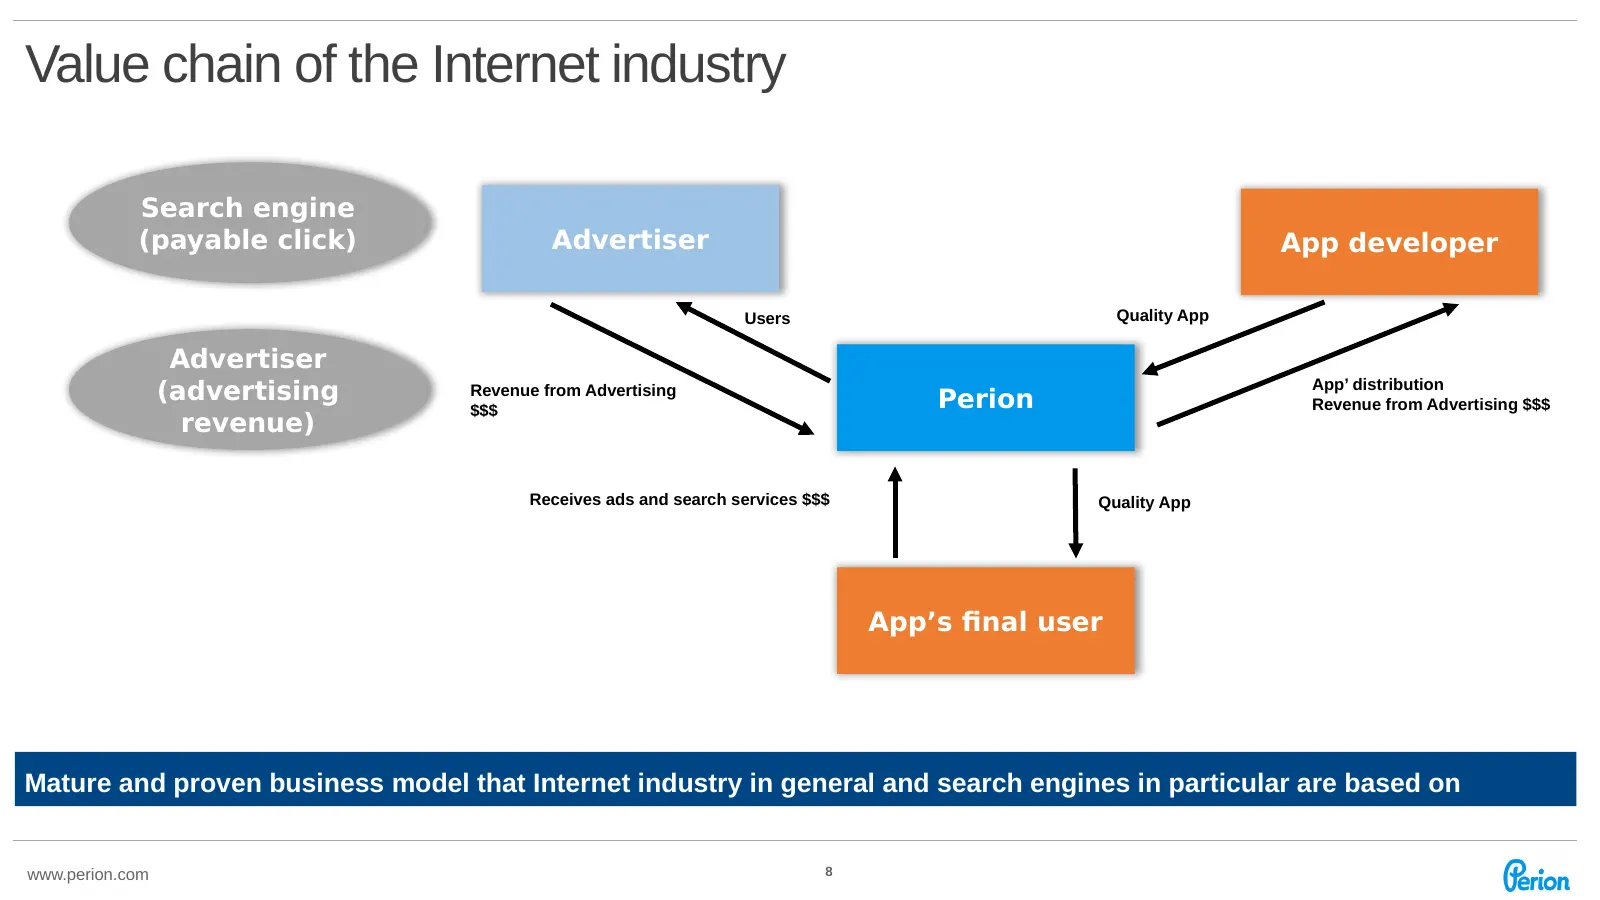
Slide 8: Value chain of the Internet industry
Value chain of the Internet industry Search engine (payable click) Advertiser App developer Users Quality App Advertiser App’ distribution (advertising Revenue from Advertising Perion Revenue from Advertising $$$ $$$ revenue) Receives ads and search services $$$ Quality App App’s final user Mature a
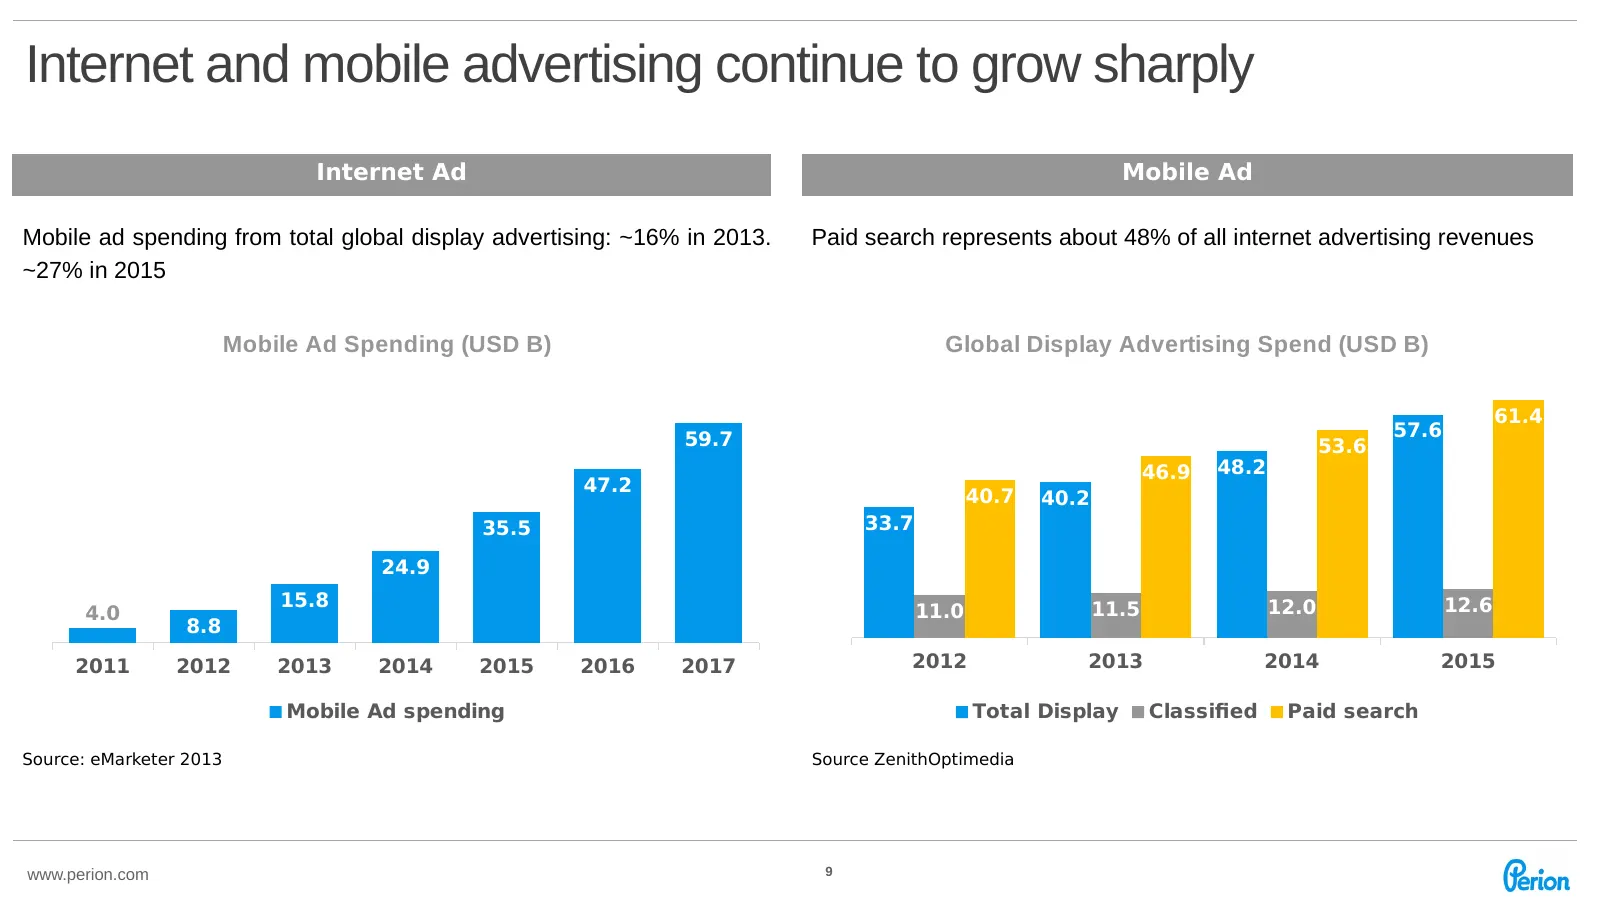
Slide 9: Internet and mobile advertising continue to grow sharply
Internet and mobile advertising continue to grow sharply Internet Ad Mobile Ad Mobile ad spending from total global display advertising: ~16% in 2013. Paid search represents about 48% of all internet advertising revenues ~27% in 2015 Mobile Ad Spending (USD B) Global Display Advertising Spend (USD B
Slide 10: App developers are coping with significant business challenges
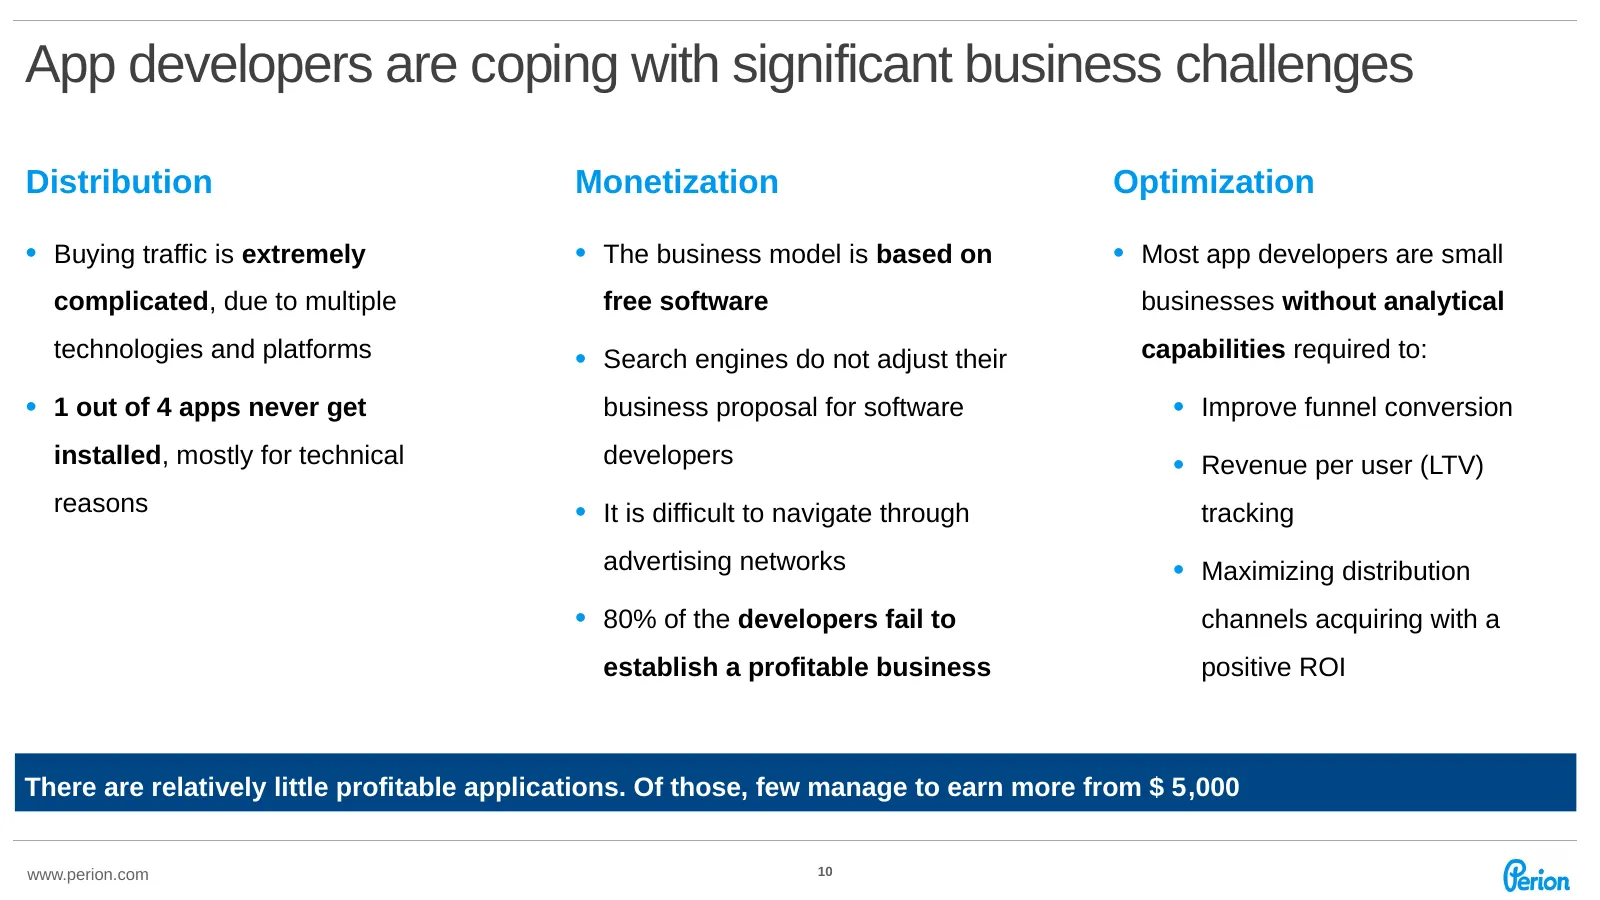
App developers are coping with significant business challenges Distribution Monetization Optimization • Buying traffic is extremely • The business model is based on • Most app developers are small complicated, due to multiple free software businesses without analytical technologies and platforms • S
Slide 11: Perion's value proposition: Profit generating business model for application developers
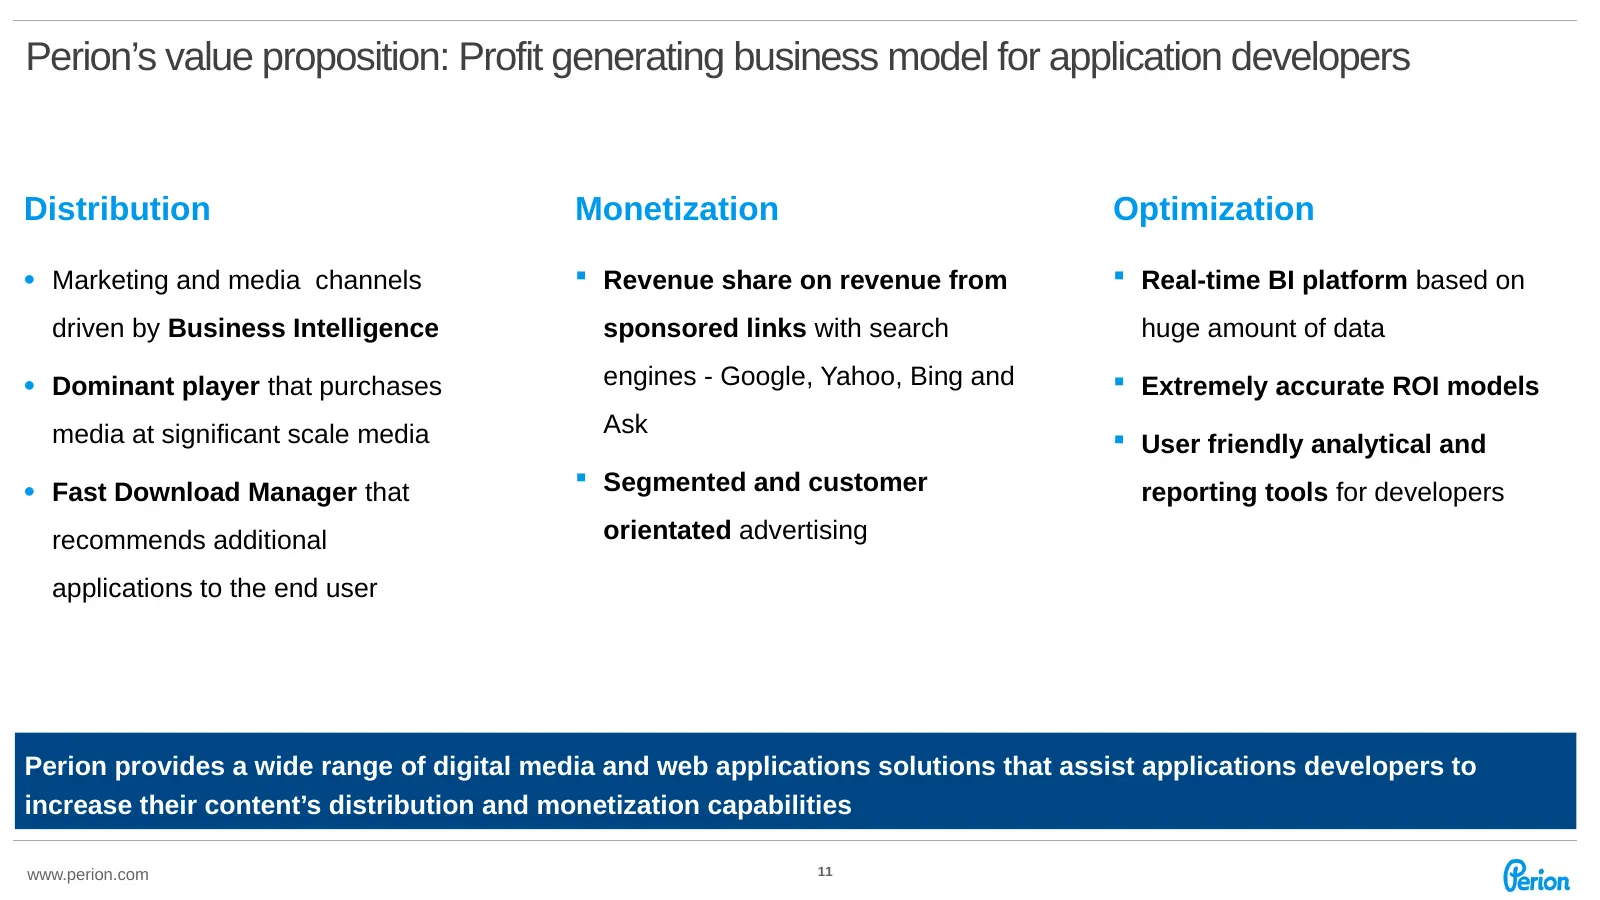
Perion’s value proposition: Profit generating business model for application developers Distribution Monetization Optimization • Marketing and media channels Revenue share on revenue from Real-time BI platform based on driven by Business Intelligence sponsored links with search huge amount of da
Slide 12: Perion increases its presence in the U.S. market vs. competitors (Ask, AOL)
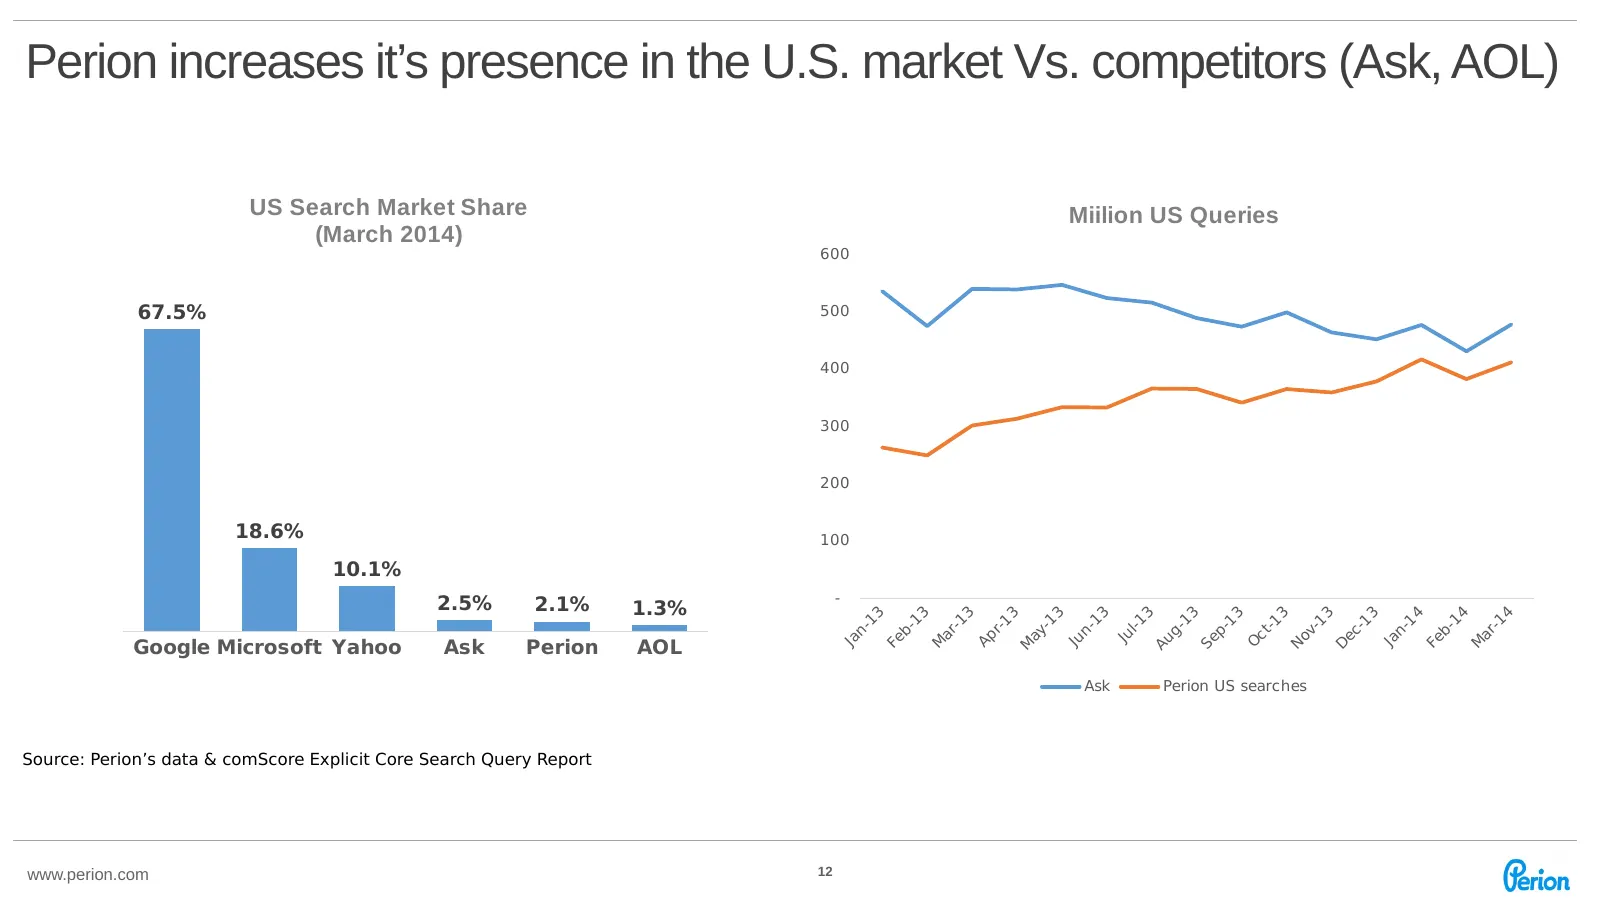
Perion increases it’s presence in the U.S. market Vs. competitors (Ask, AOL) US Search Market Share Miilion US Queries (March 2014) 600 80.0% 70.0% 67.5% 500 60.0% 400 50.0% 300 40.0% 200 30.0% 20.0% 18.6% 100 10.1% 10.0% 2.5% - 2.1% 1.3% 3 3 3 3 3 3 3 3 3 3 3 3 4 4 4 0.0% n -1 b -1 r-1 r-1 y -1 n -
Slide 13: Agreements with search engines
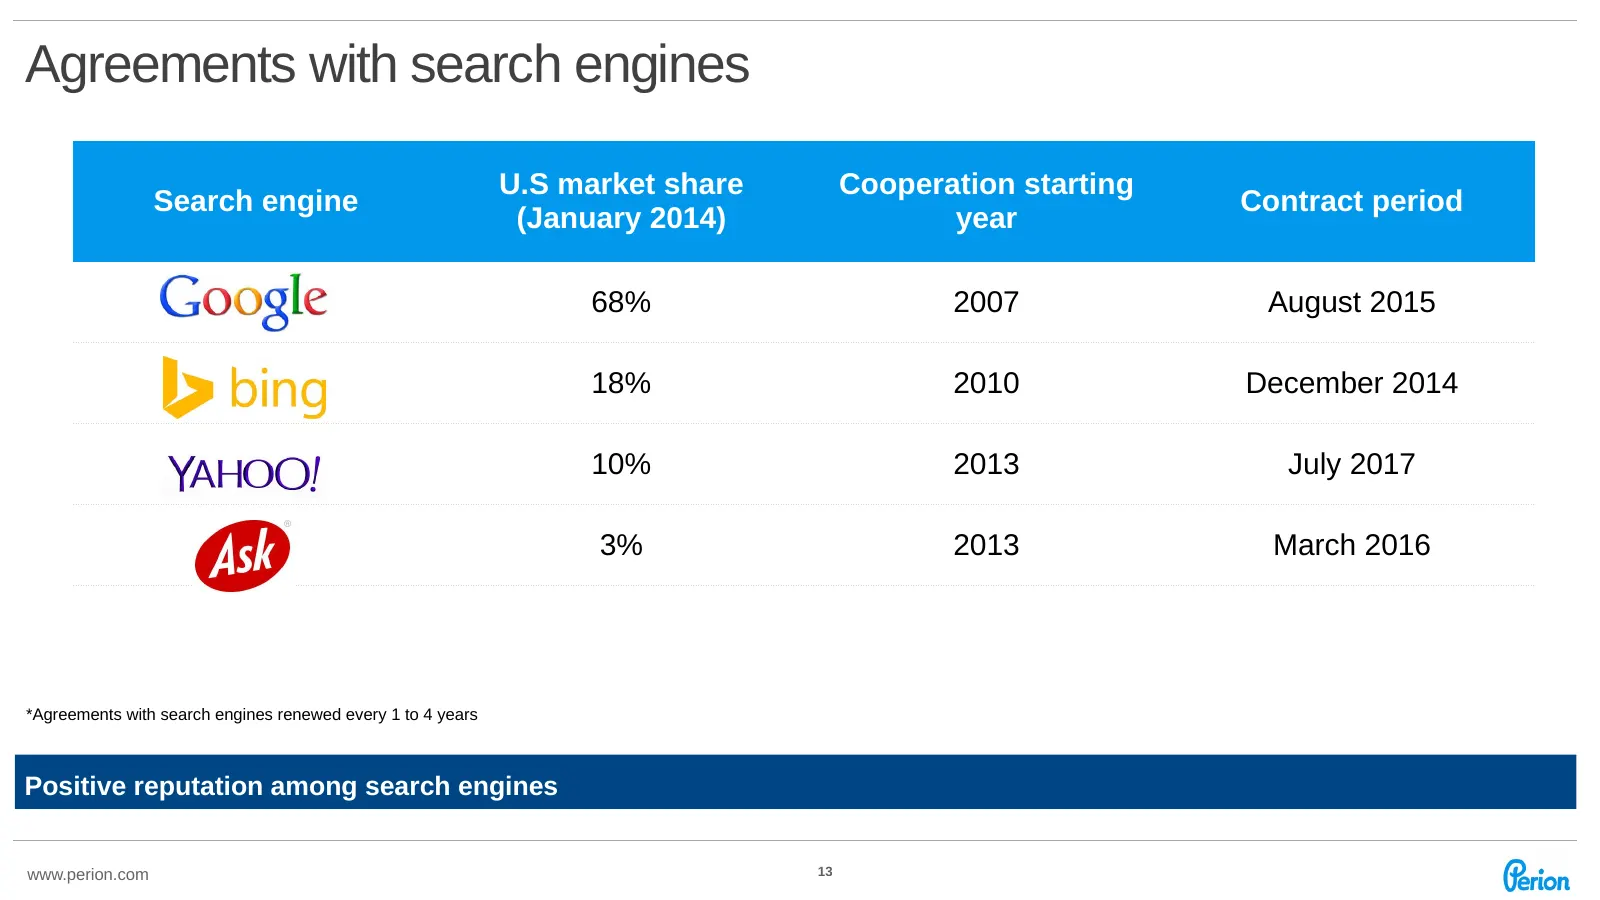
Agreements with search engines U.S market share Cooperation starting Search engine Contract period (January 2014) year Google 68% 2007 August 2015 Bing 18% 2010 December 2014 Yahoo 10% 2013 July 2017 Ask 3% 2013 March 2016 *Agreements with search engines renewed every 1 to 4 years Positive reputatio
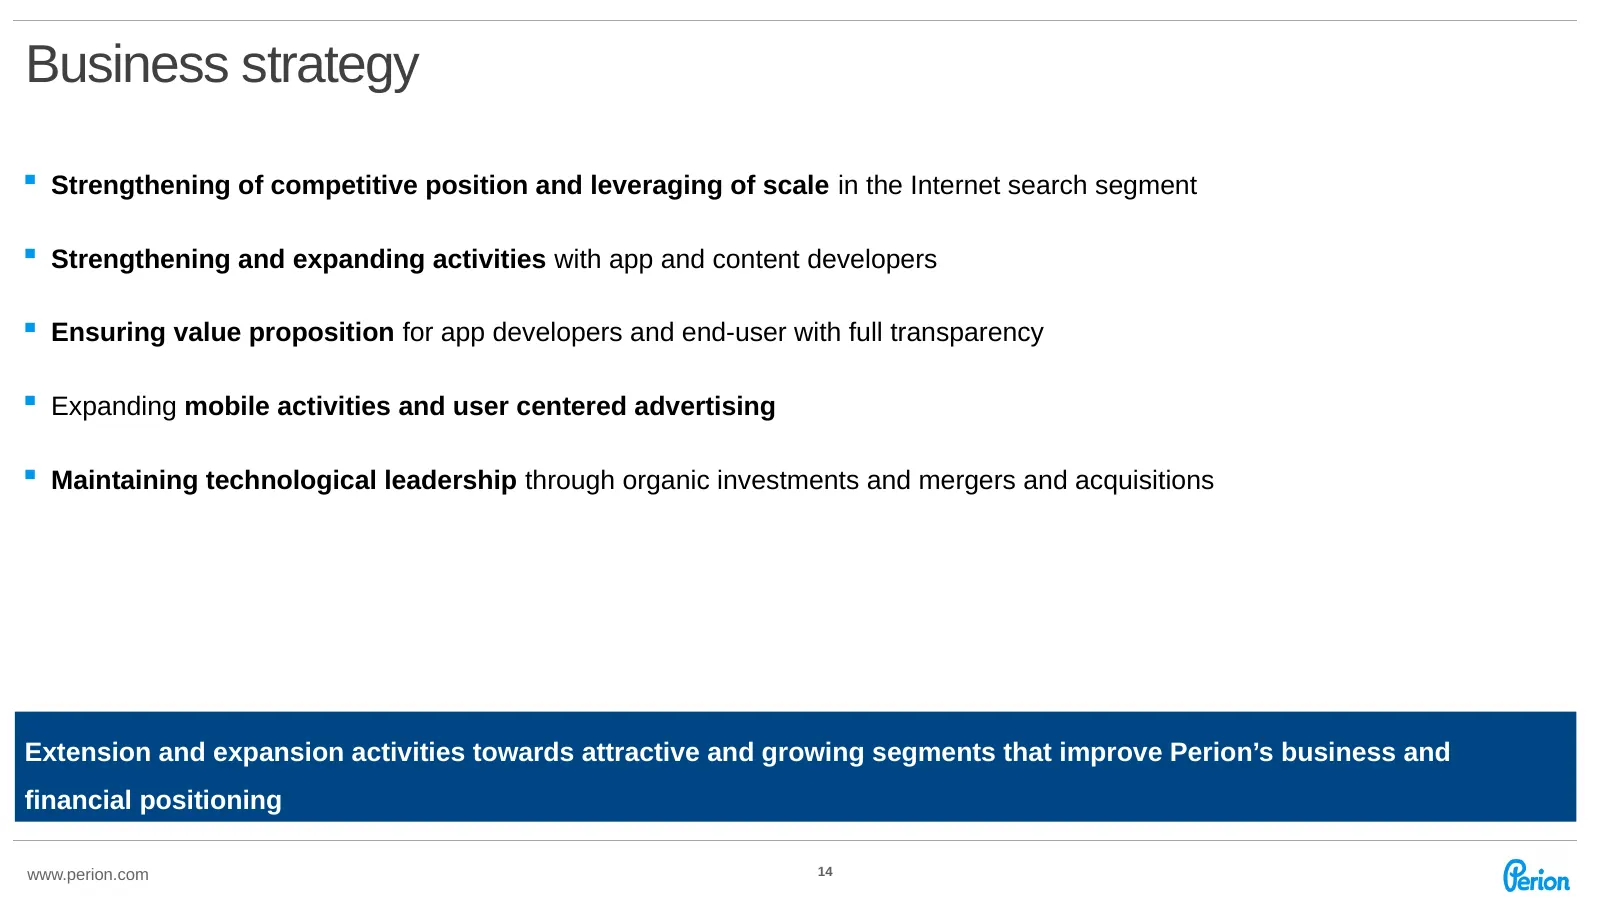
Slide 14: Business strategy
Business strategy Strengthening of competitive position and leveraging of scale in the Internet search segment Strengthening and expanding activities with app and content developers Ensuring value proposition for app developers and end-user with full transparency Expanding mobile activities
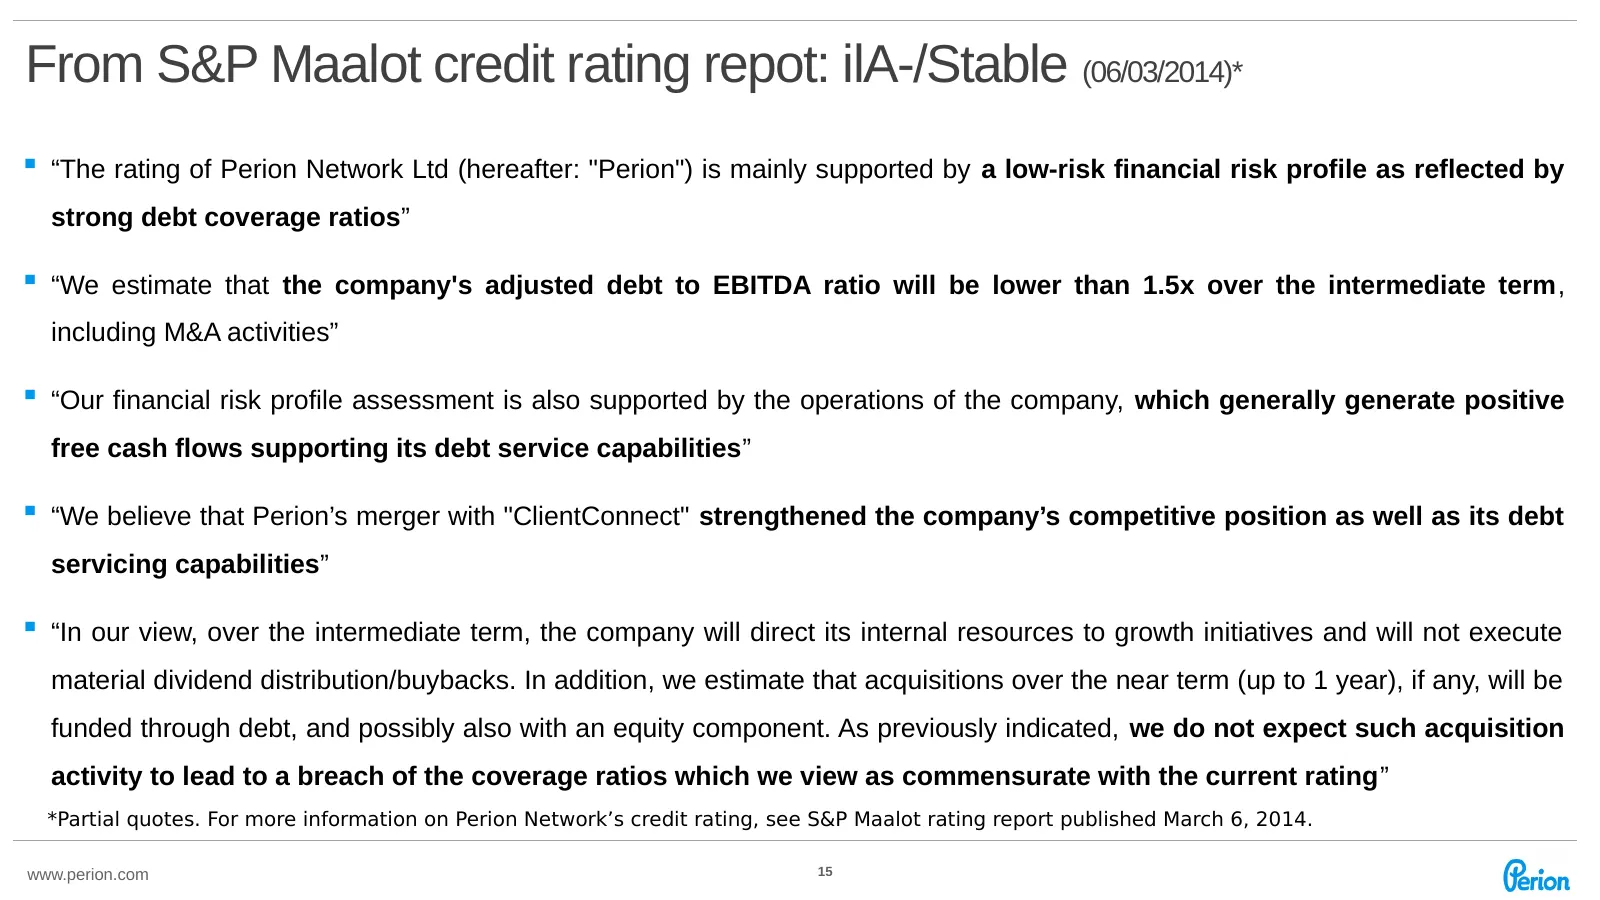
Slide 15: From S&P Maalot credit rating report: ilA-/Stable
From S&P Maalot credit rating repot: ilA-/Stable (06/03/2014)* “The rating of Perion Network Ltd (hereafter: "Perion") is mainly supported by a low-risk financial risk profile as reflected by strong debt coverage ratios” “We estimate that the company's adjusted debt to EBITDA ratio will be lower
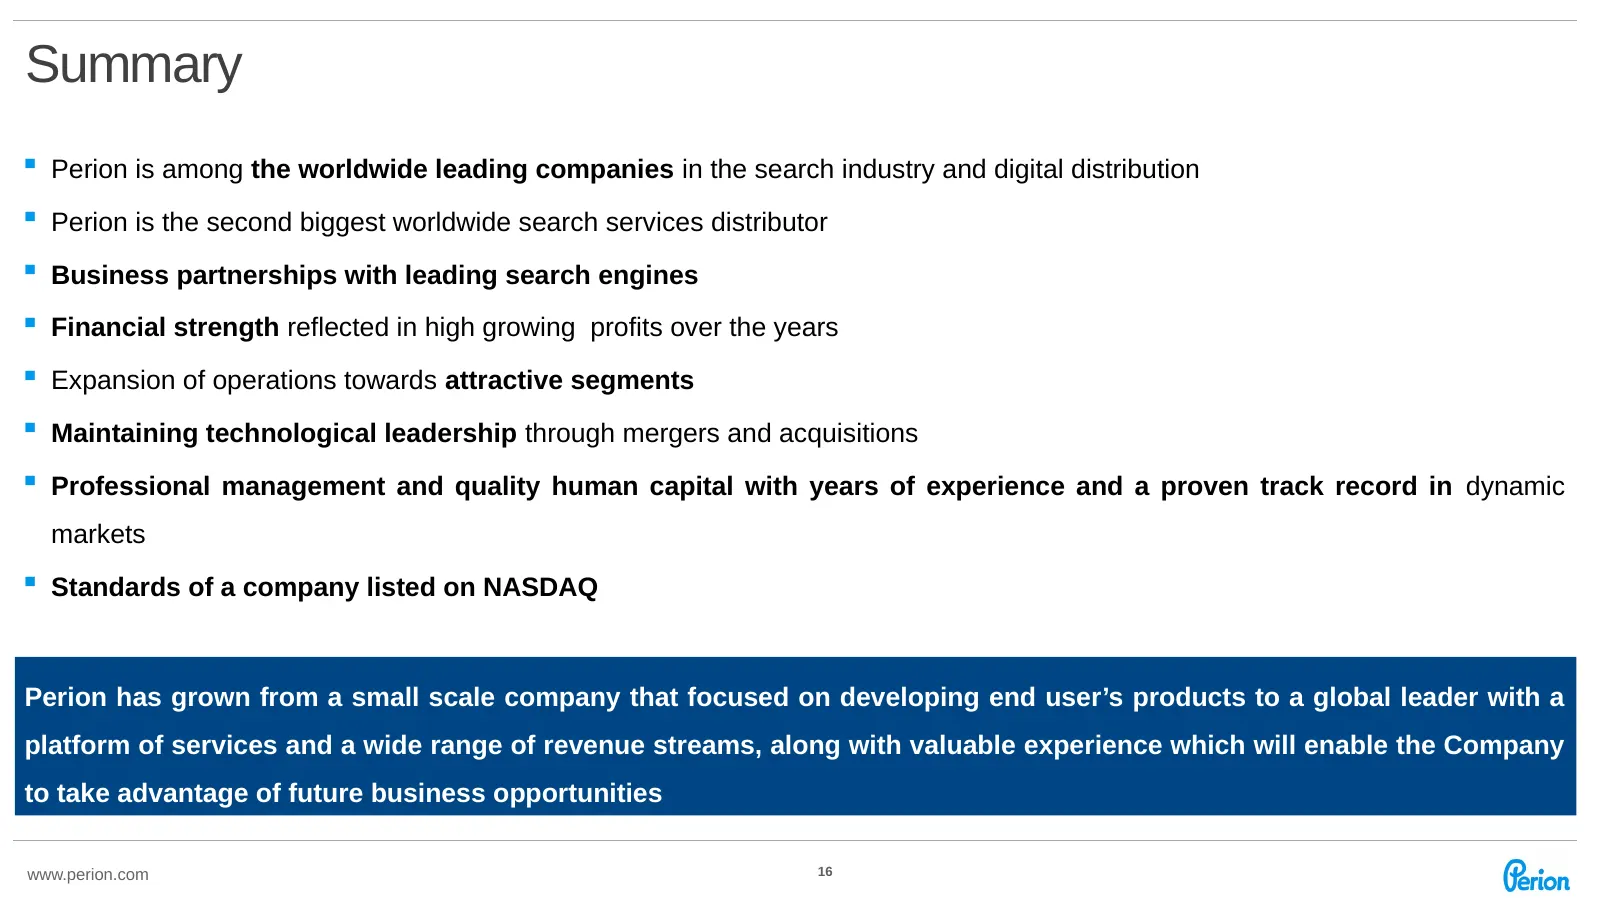
Slide 16: Summary
Summary Perion is among the worldwide leading companies in the search industry and digital distribution Perion is the second biggest worldwide search services distributor Business partnerships with leading search engines Financial strength reflected in high growing profits over the years E
Slide 17: Appendix
Appendix www.perion.com 17
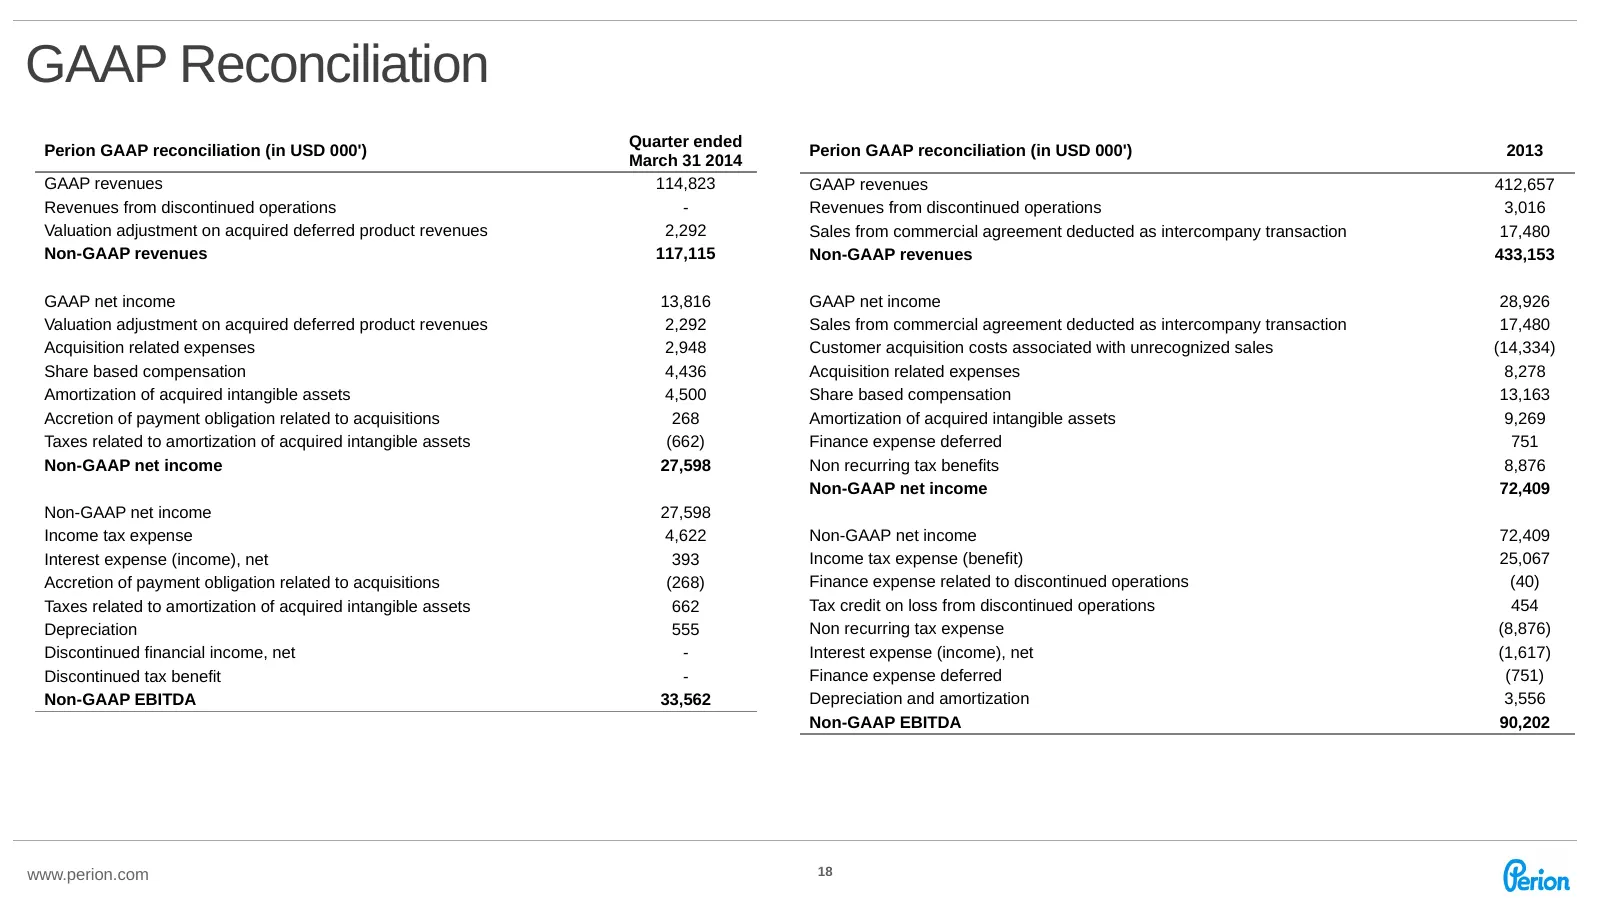
Slide 18: GAAP Reconciliation
GAAP Reconciliation Quarter ended Perion GAAP reconciliation (in USD 000') Perion GAAP reconciliation (in USD 000') 2013 March 31 2014 GAAP revenues 114,823 GAAP revenues 412,657 Revenues from discontinued operations - Revenues from discontinued operations 3,016 Valuation adjustment on acquired defe
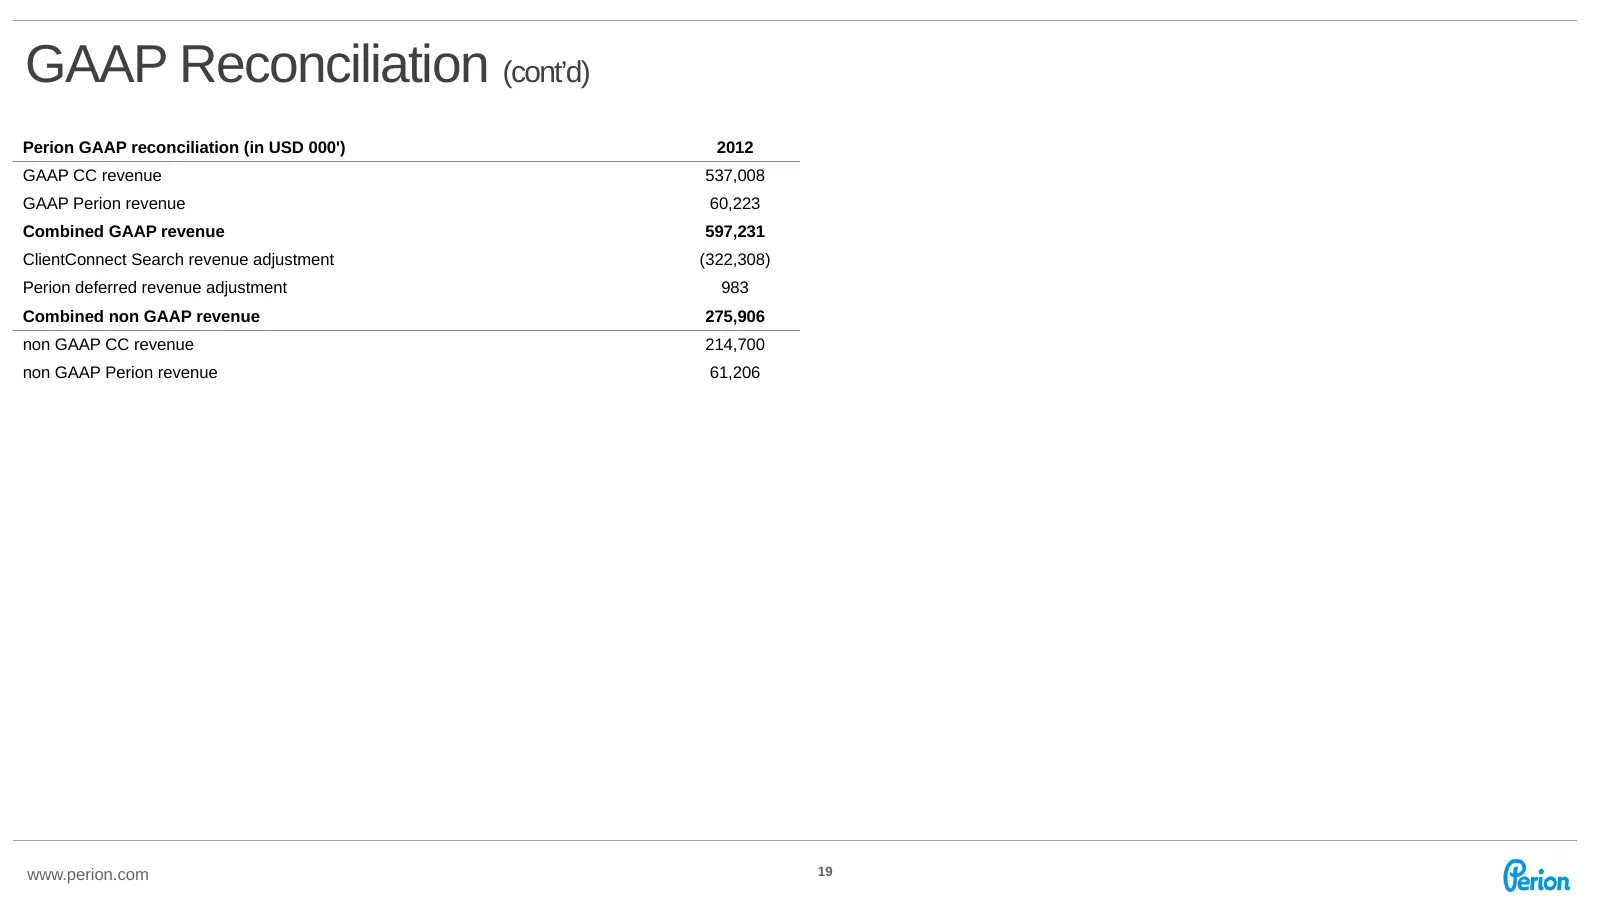
Slide 19: GAAP Reconciliation (cont'd)
GAAP Reconciliation (cont’d) Perion GAAP reconciliation (in USD 000') 2012 GAAP CC revenue 537,008 GAAP Perion revenue 60,223 Combined GAAP revenue 597,231 ClientConnect Search revenue adjustment (322,308) Perion deferred revenue adjustment 983 Combined non GAAP revenue 275,906 non GAAP CC revenue 2
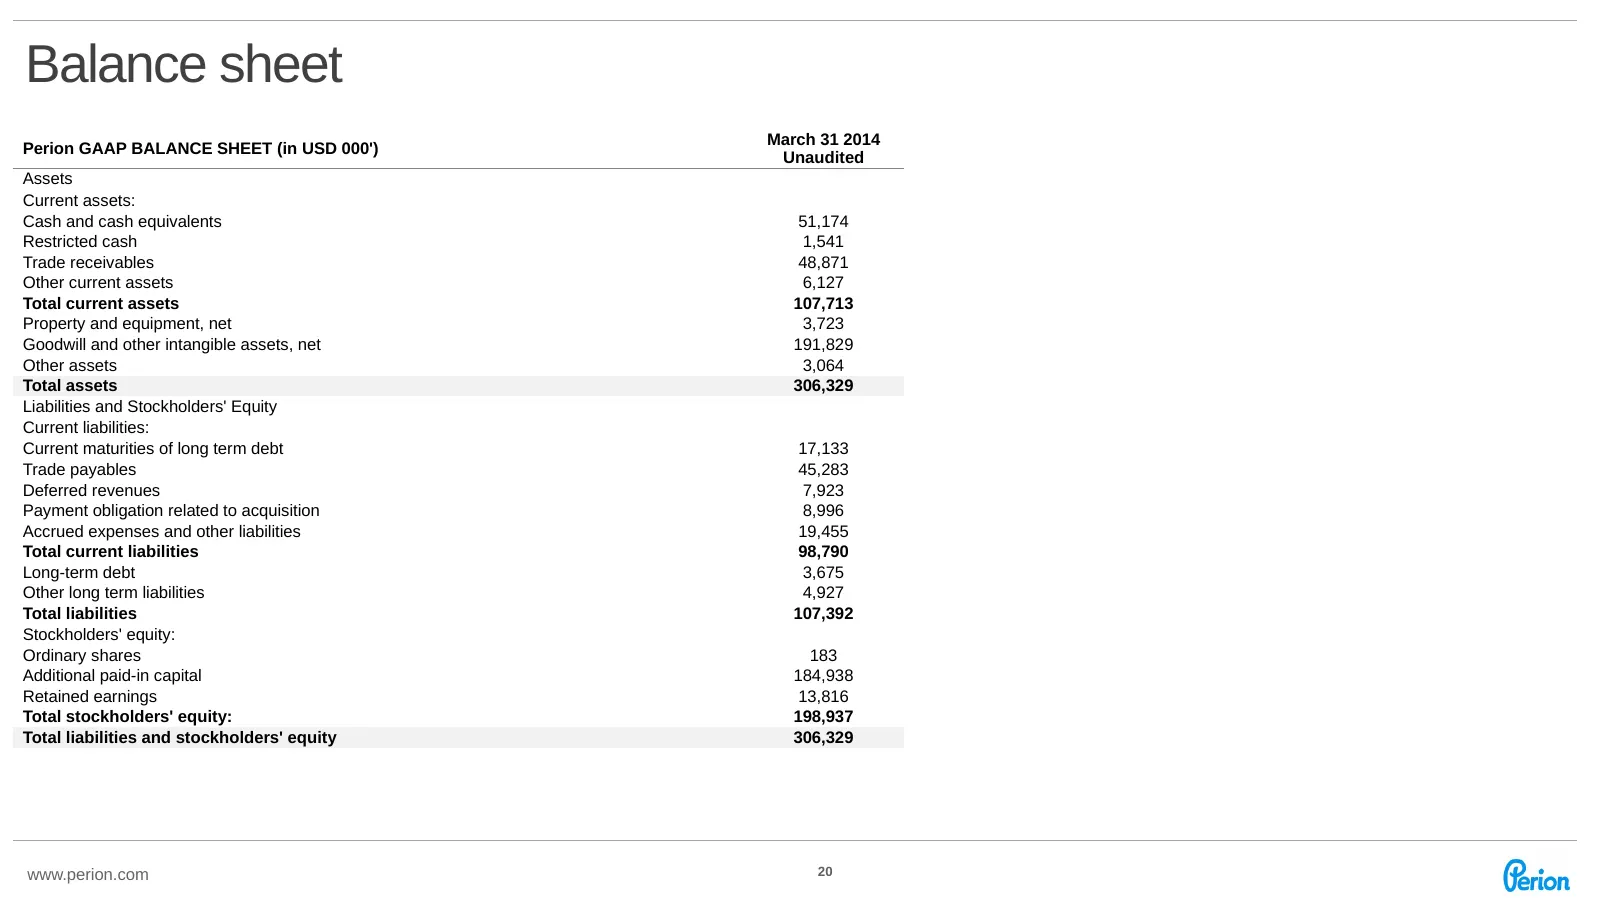
Slide 20: Balance sheet
Balance sheet March 31 2014 Perion GAAP BALANCE SHEET (in USD 000') Unaudited Assets Current assets: Cash and cash equivalents 51,174 Restricted cash 1,541 Trade receivables 48,871 Other current assets 6,127 Total current assets 107,713 Property and equipment, net 3,723 Goodwill and other intangible
Source: Internet Archive copy of perion.com
More decks from Perion Network Ltd
 Q2 2026 Earnings Presentation43 slides · Aug 10, 2026
 Investor Presentation (August 2026)83 slides · August 2026
 Investor Presentation (June 2026)80 slides · Jun 29, 2026
 Q1 2026 Earnings Presentation39 slides · May 20, 2026
 Q4 2025 Earnings Presentation54 slides · Feb 18, 2026
 Q3 2025 Earnings Presentation40 slides · Nov 12, 2025