Curo — William Blair 2020 Growth Stock Conference
30 slides from Curo's conference presentation, Jun 10, 2020

Slide 1: William Blair 2020 Growth Stock Conference
June 2020 William Blair 2020 Growth Stock Conference
Slide 2: Disclaimer
Disclaimer IMPORTANT: You must read the following information before continuing to the rest of the presentation, which is being provided to you for informational purposes only. Forward-Looking Statements This presentation contains forward-looking statements. These forward-looking statements include
Slide 3: CURO at a Glance
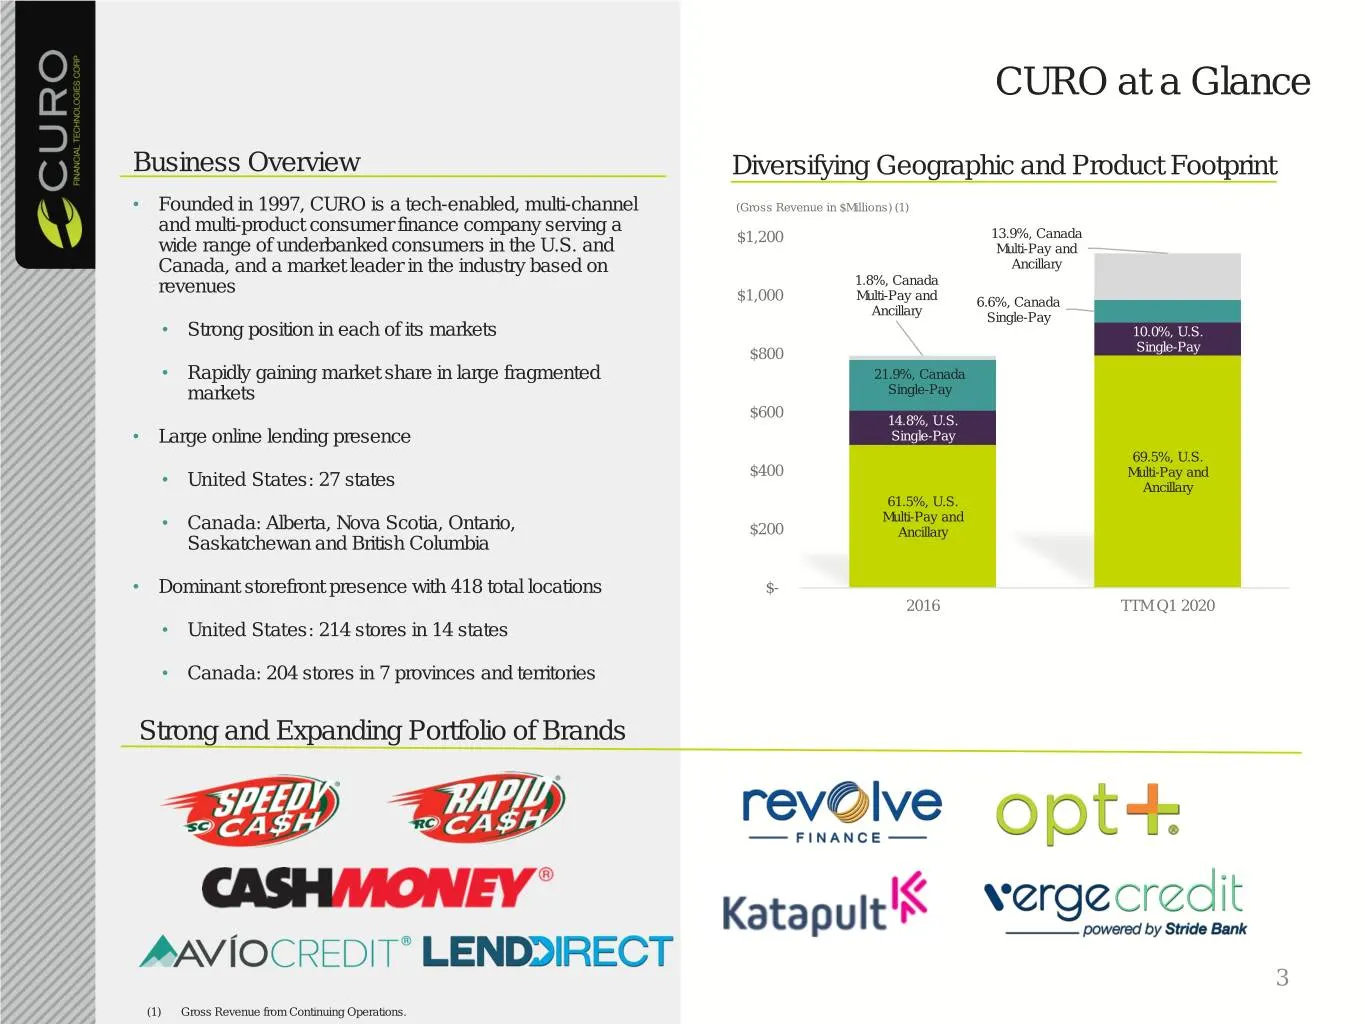
CURO at a Glance Business Overview Diversifying Geographic and Product Footprint • Founded in 1997, CURO is a tech-enabled, multi-channel (Gross Revenue in $Millions) (1) and multi-product consumer finance company serving a $1,200 13.9%, Canada wide range of underbanked consumers in the U.S. and Mul
Slide 4: Managing COVID-19 Performance
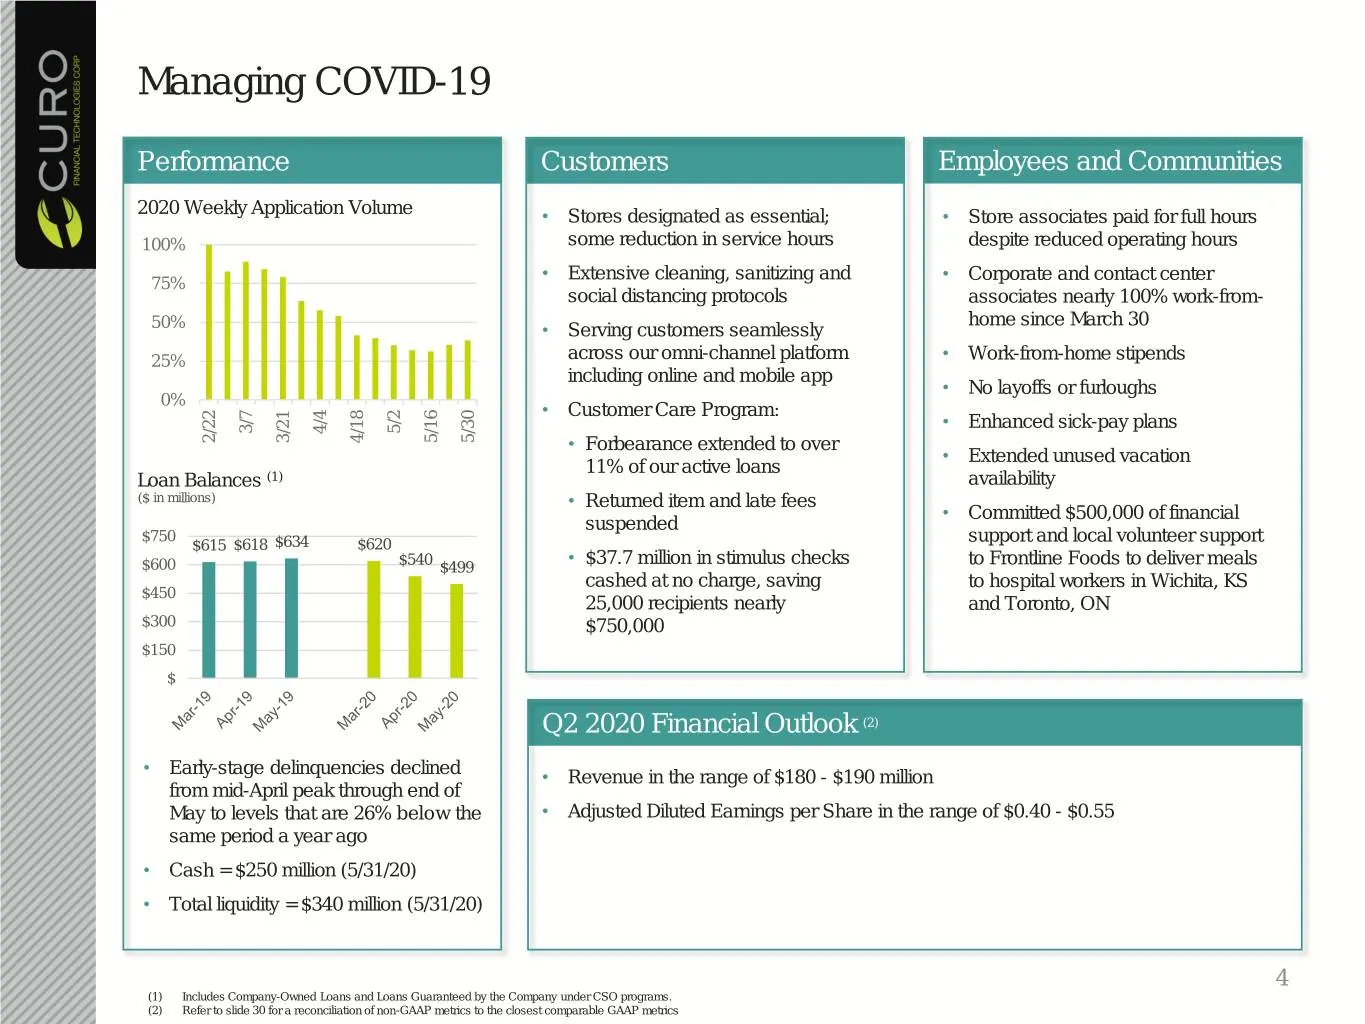
Managing COVID-19 Performance Customers Employees and Communities 2020 Weekly Application Volume • Stores designated as essential; • Store associates paid for full hours 100% some reduction in service hours despite reduced operating hours • Extensive cleaning, sanitizing and • Corporate and contact
Slide 5: Powering Innovation for Underbanked Consumers
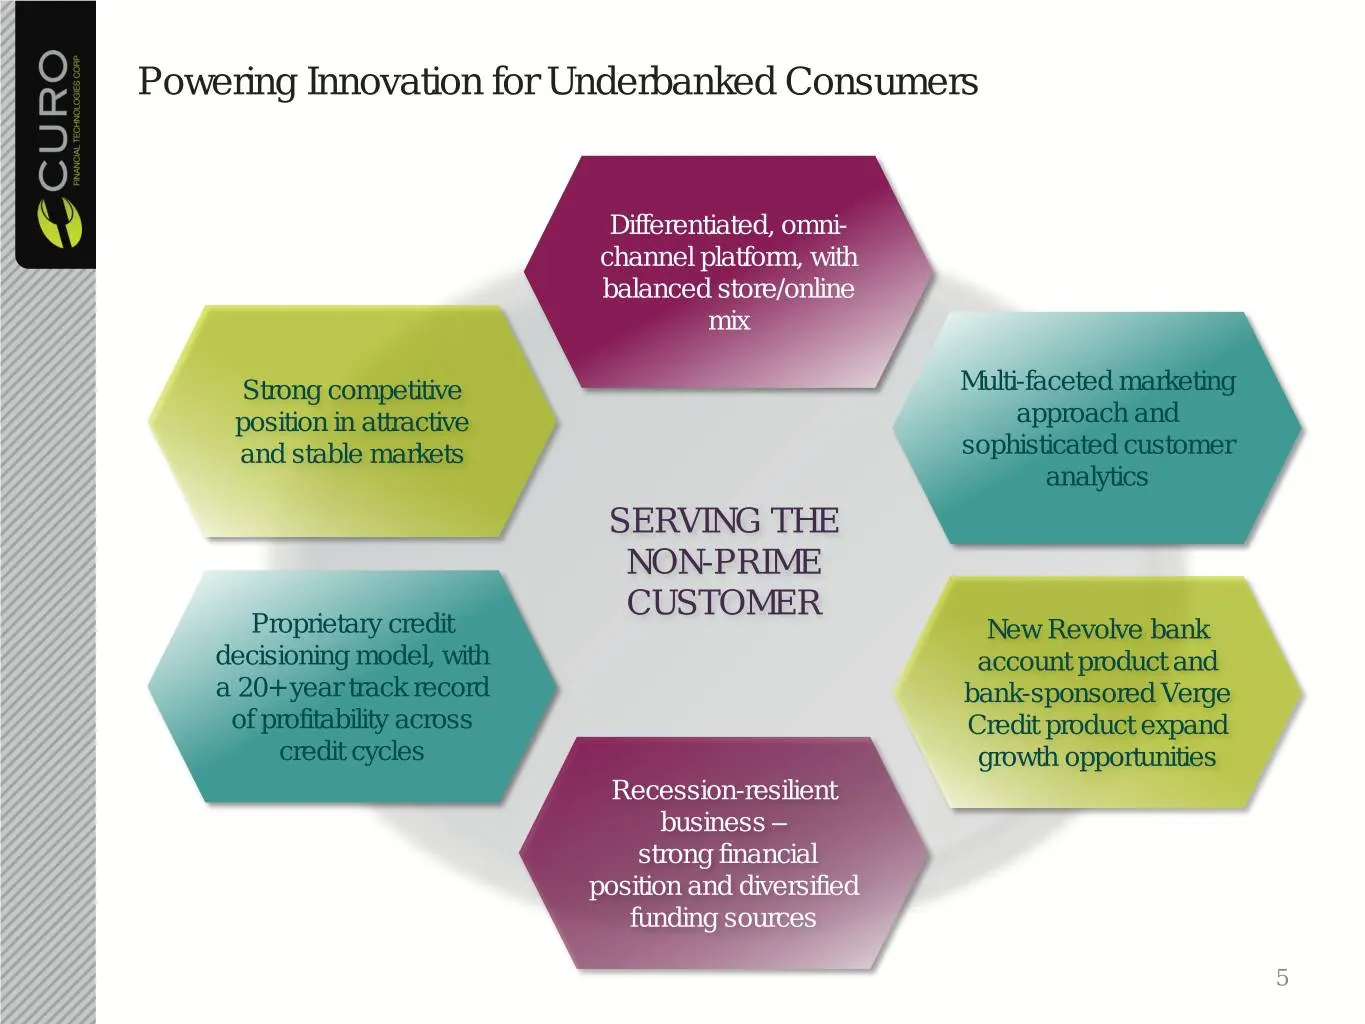
Powering Innovation for Underbanked Consumers Differentiated, omni- channel platform, with balanced store/online mix Strong competitive Multi-faceted marketing position in attractive approach and and stable markets sophisticated customer analytics SERVING THE NON-PRIME CUSTOMER Proprietary credit Ne
Slide 6: Leading Large-Scale Lender To Underbanked Consumers
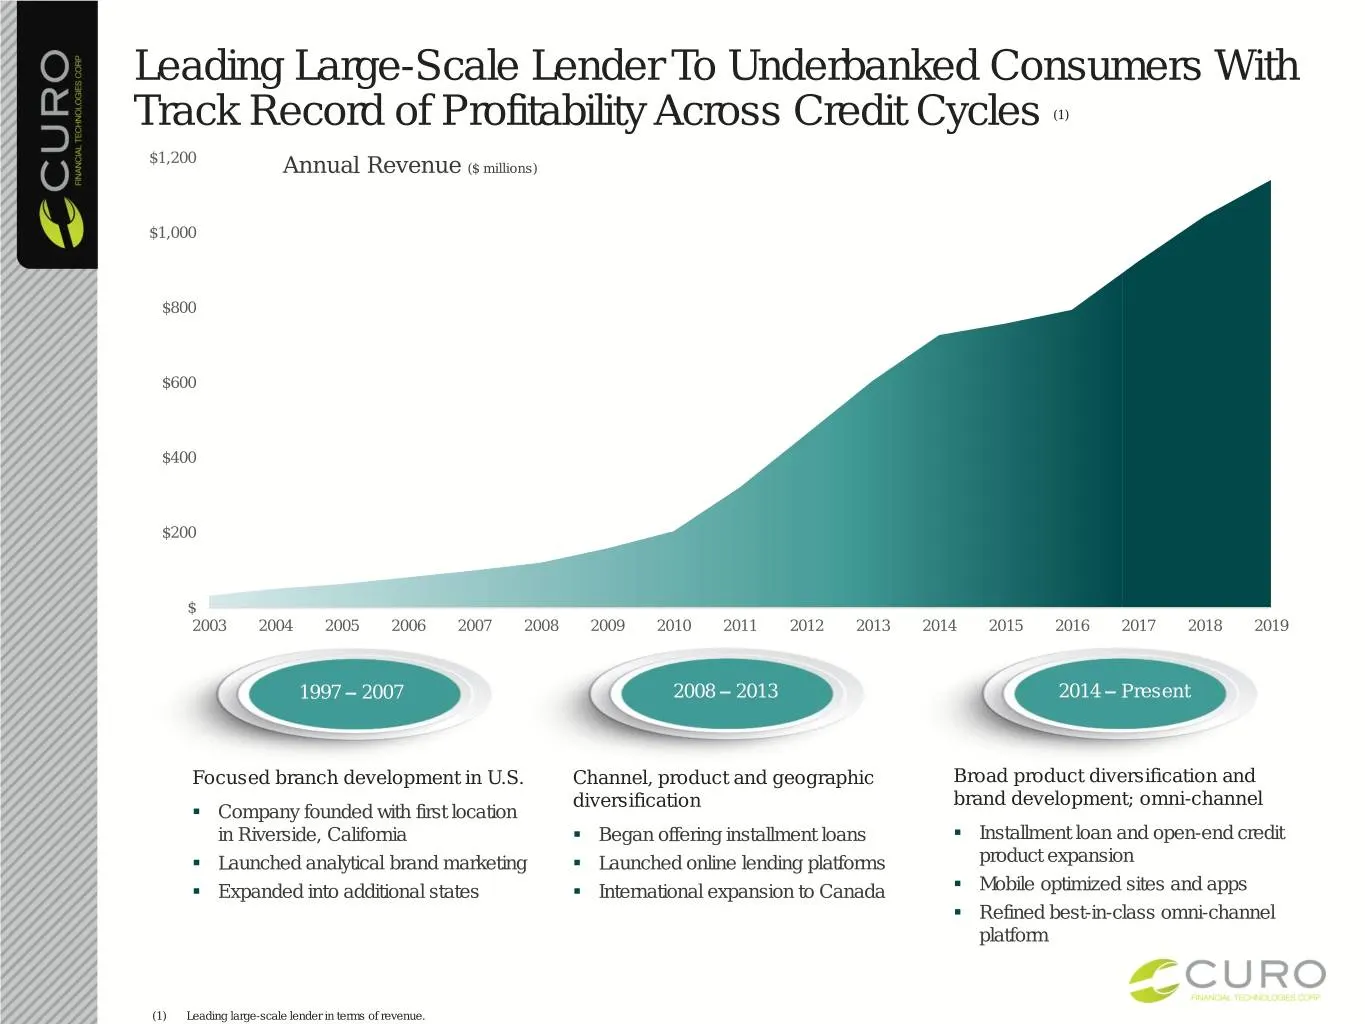
Leading Large-Scale Lender To Underbanked Consumers With Track Record of Profitability Across Credit Cycles (1) $1,200 Annual Revenue ($ millions) $1,000 $800 $600 $400 $200 $ 2003 2004 2005 2006 2007 2008 2009 2010 2011 2012 2013 2014 2015 2016 2017 2018 2019 1997 – 2007 2008 – 2013 2014 – Present
Slide 7: Large Addressable Market in US is Underserved
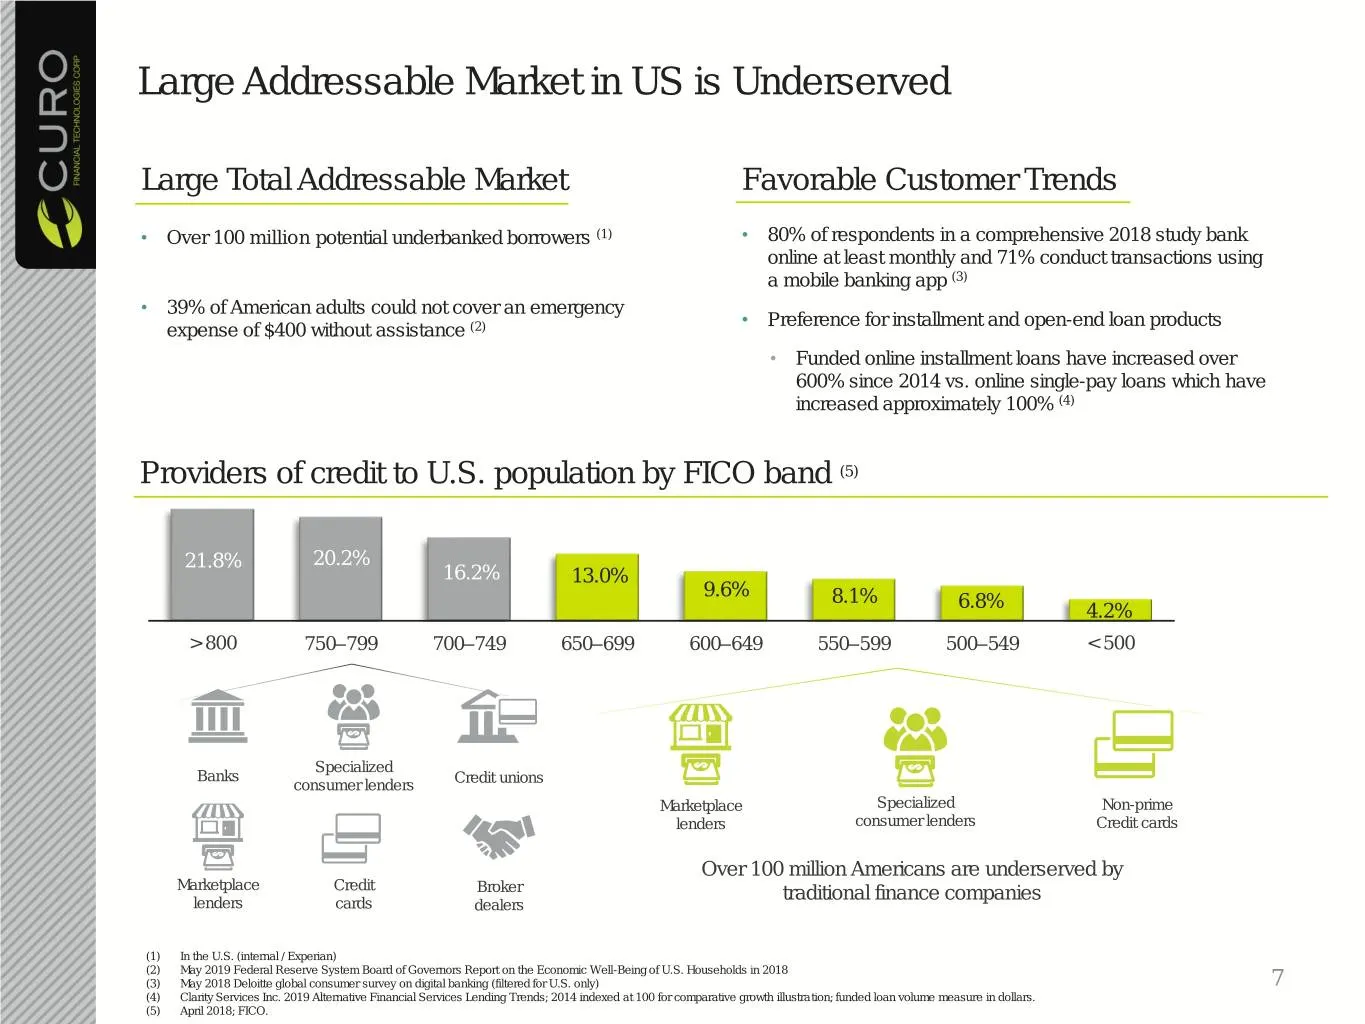
Large Addressable Market in US is Underserved Large Total Addressable Market Favorable Customer Trends • Over 100 million potential underbanked borrowers (1) • 80% of respondents in a comprehensive 2018 study bank online at least monthly and 71% conduct transactions using a mobile banking app (3) •
Slide 8: Evolving U.S. Competitive Landscape
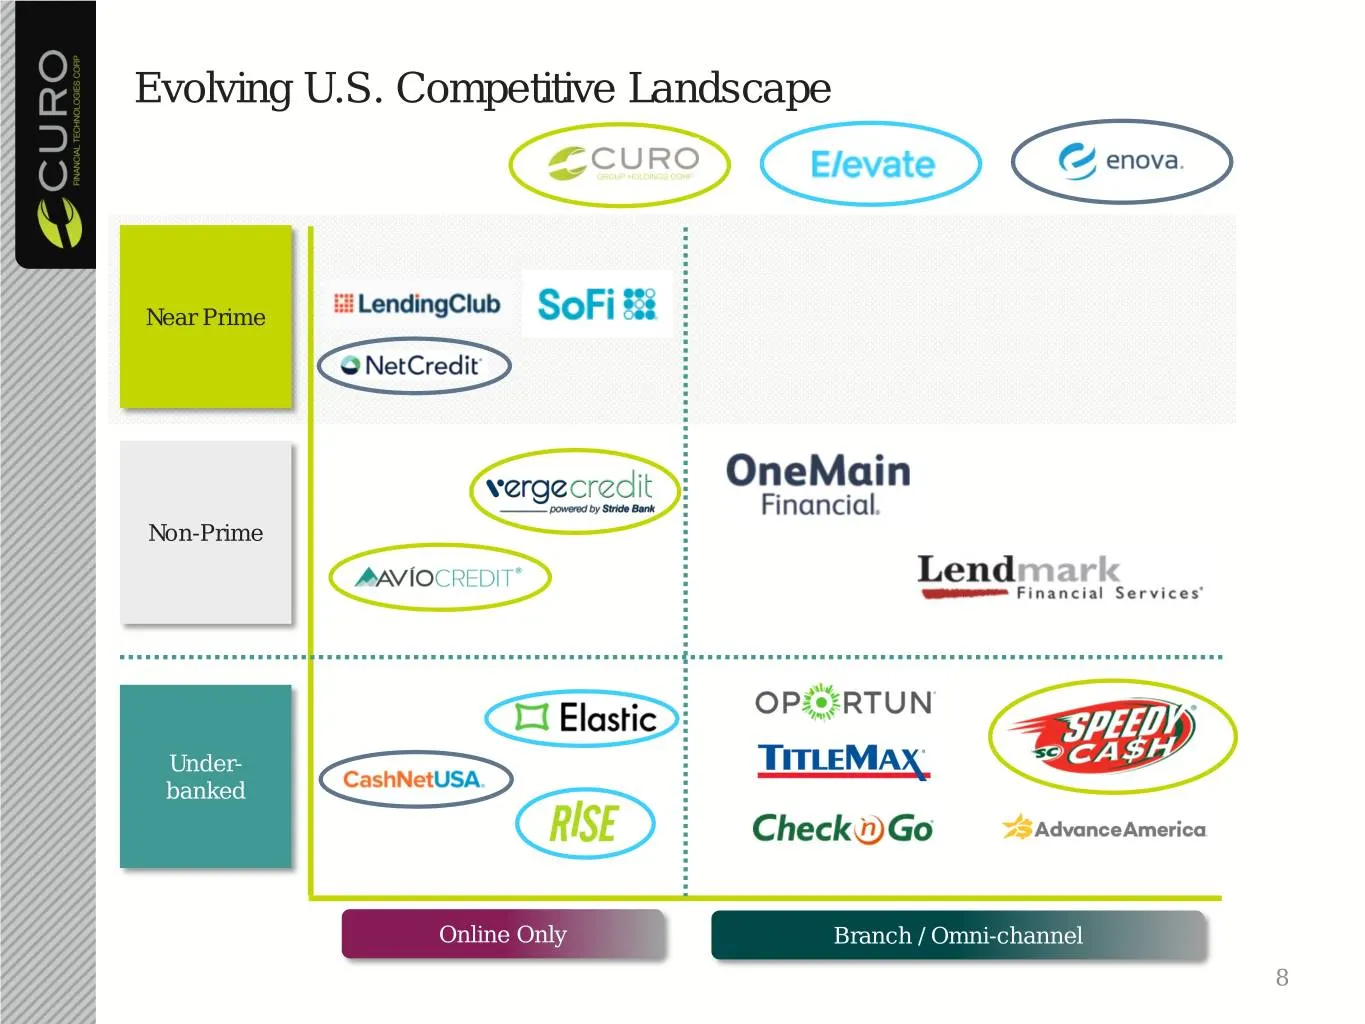
Evolving U.S. Competitive Landscape Near Prime Non-Prime Under- banked Online Only Branch / Omni-channel 8
Slide 9: Canadian Market Remains Very Attractive
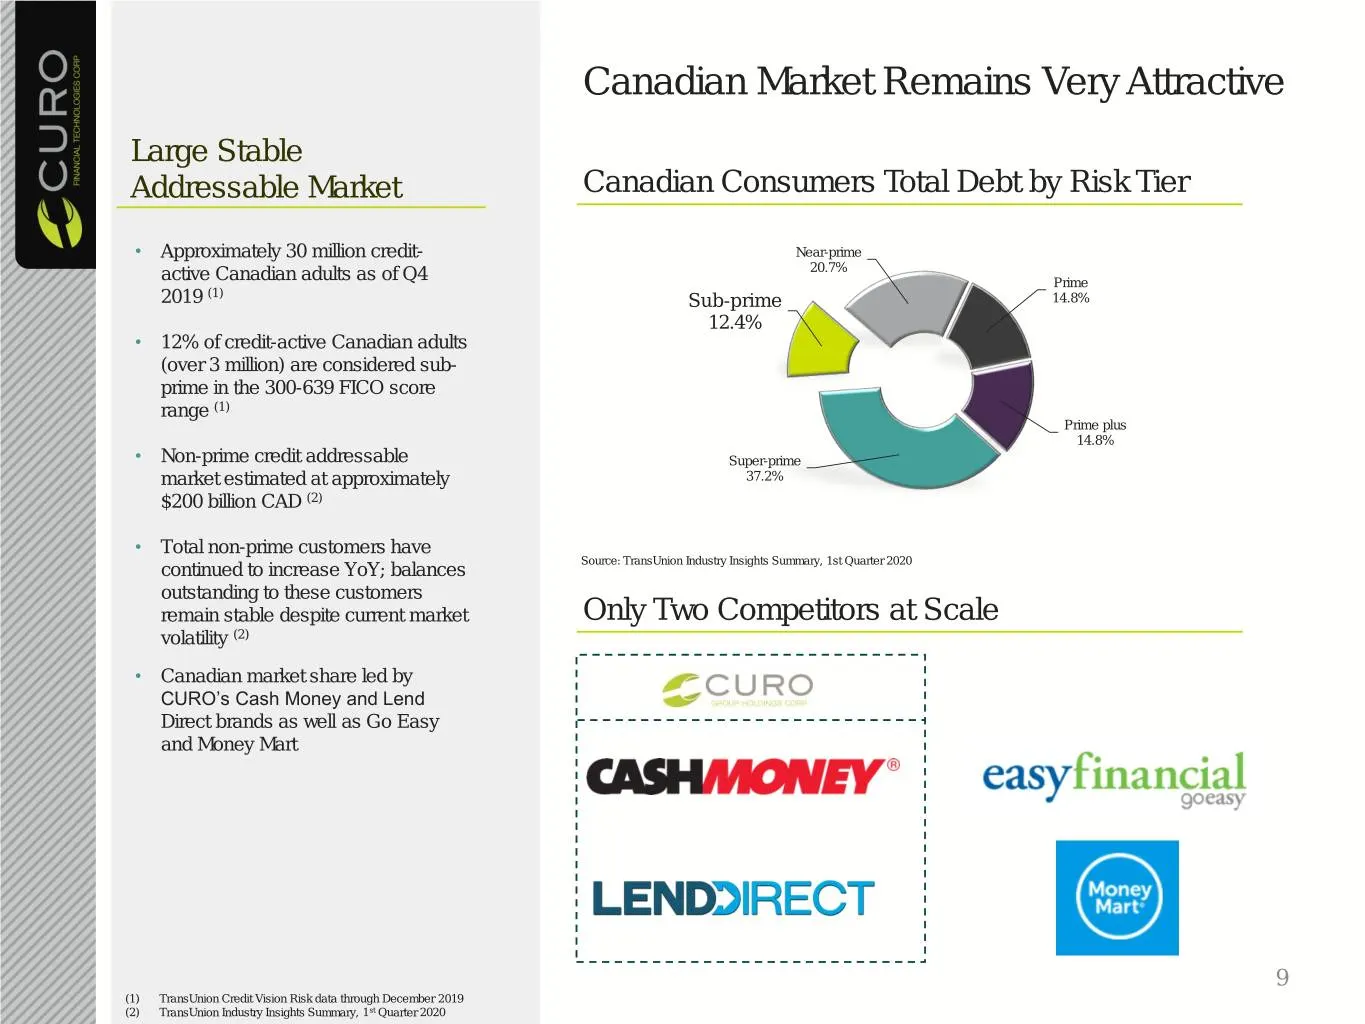
Canadian Market Remains Very Attractive Large Stable Addressable Market Canadian Consumers Total Debt by Risk Tier • Approximately 30 million credit- Near-prime 20.7% active Canadian adults as of Q4 Prime 2019 (1) Sub-prime 14.8% 12.4% • 12% of credit-active Canadian adults (over 3 million) are cons
Slide 10: Omni-Channel Platform Supports "Call, Click or Come In"
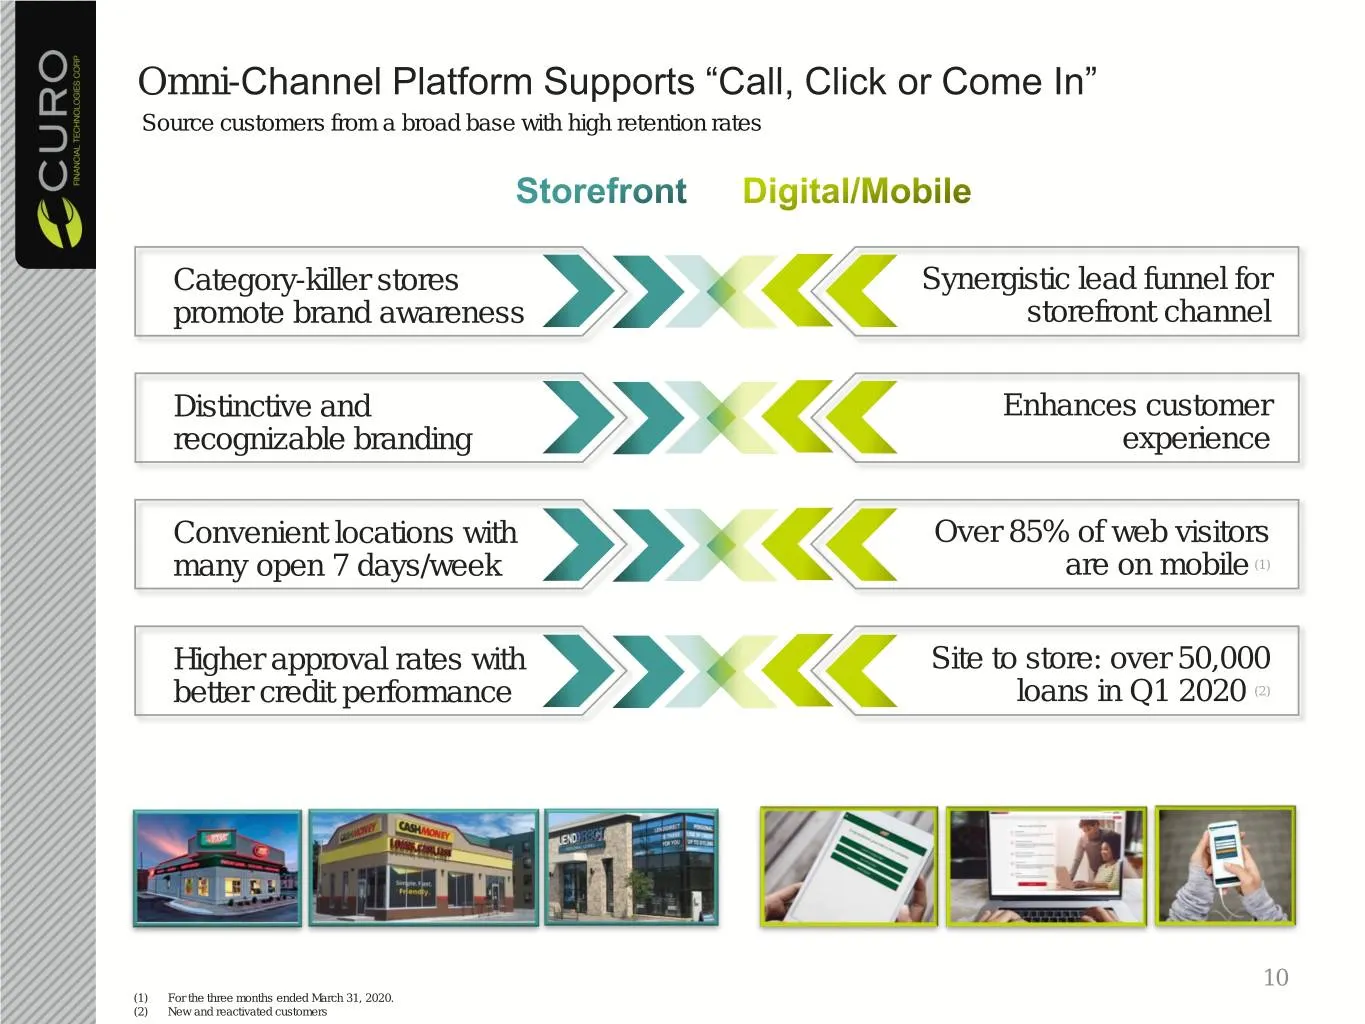
Omni-Channel Platform Supports “Call, Click or Come In” Source customers from a broad base with high retention rates Category-killer stores Synergistic lead funnel for promote brand awareness storefront channel Distinctive and Enhances customer recognizable branding experience Convenient locations w
Slide 11: Comprehensive Product Offerings and Diversified Revenue
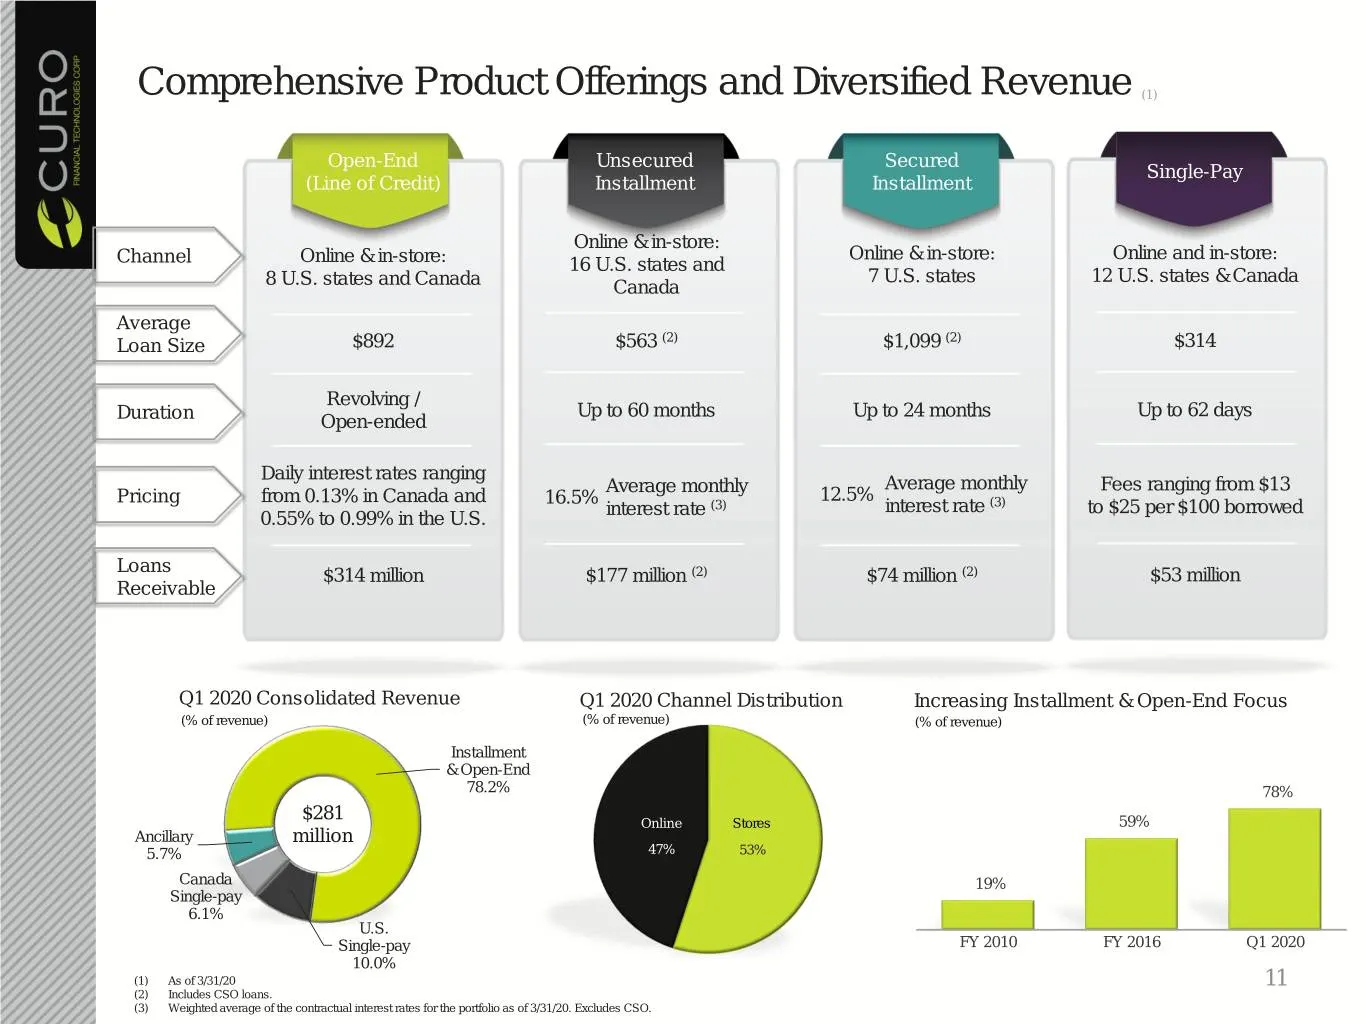
Comprehensive Product Offerings and Diversified Revenue (1) Open-End Unsecured Secured Single-Pay (Line of Credit) Installment Installment Online & in-store: Online & in-store: Online and in-store: Channel Online & in-store: 16 U.S. states and 7 U.S. states 12 U.S. states & Canada 8 U.S. states and
Slide 12: Strong Loan Growth Driven by Success of Open-End
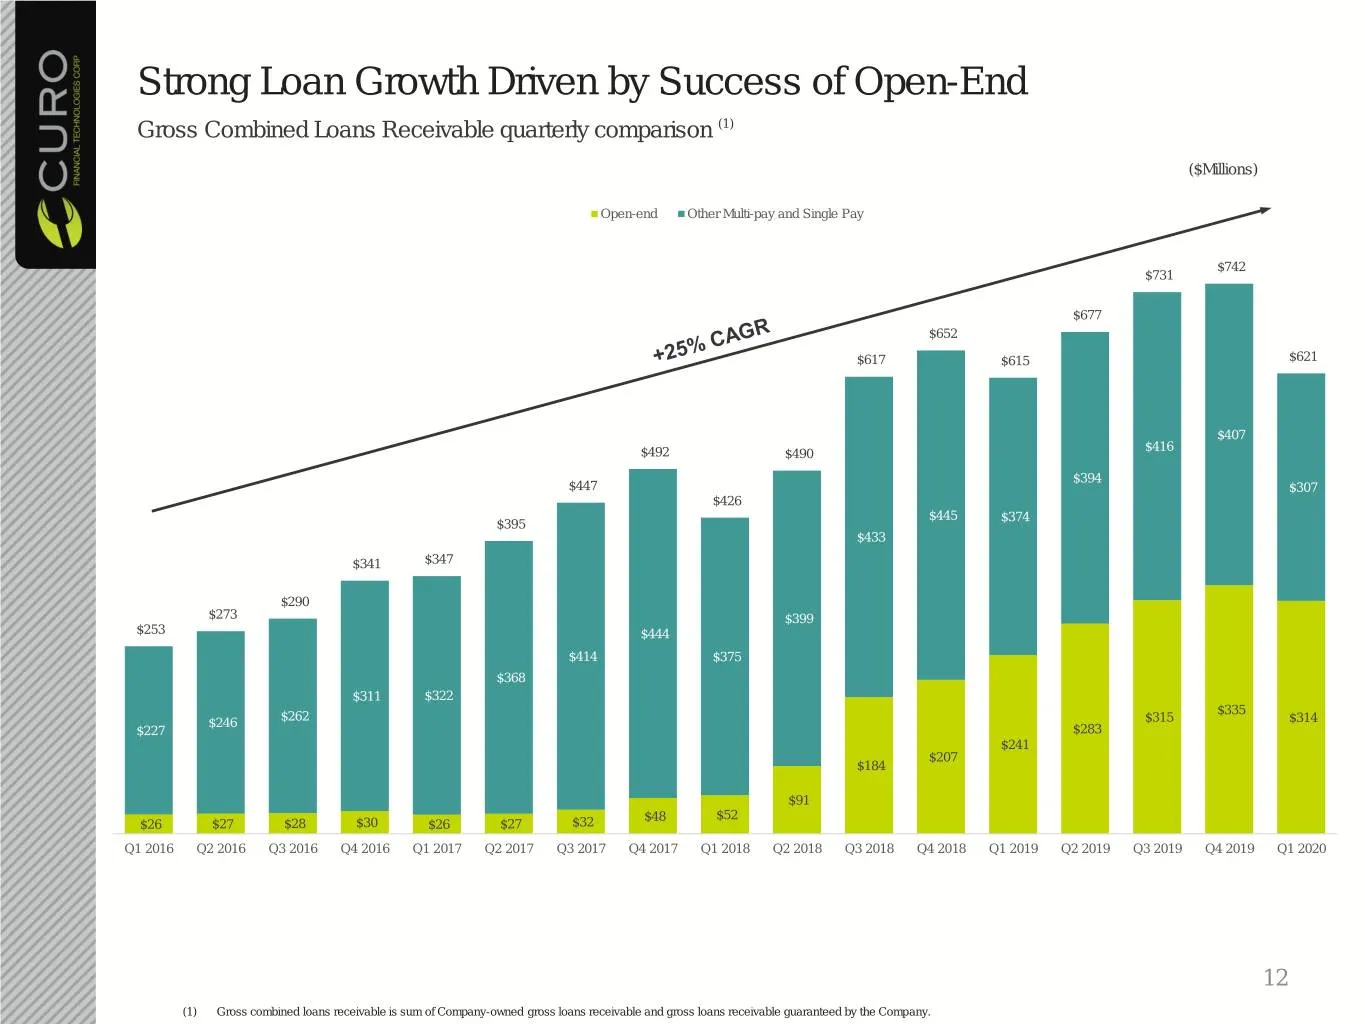
Strong Loan Growth Driven by Success of Open-End Gross Combined Loans Receivable quarterly comparison (1) ($Millions) Open-end Other Multi-pay and Single Pay $742 $731 $677 $652 $617 $615 $621 $407 $416 $492 $490 $394 $447 $307 $426 $445 $374 $395 $433 $341 $347 $290 $273 $399 $253 $444 $414 $375 $3
Slide 13: Canada – Successful Launch of Multi-Pay Loans
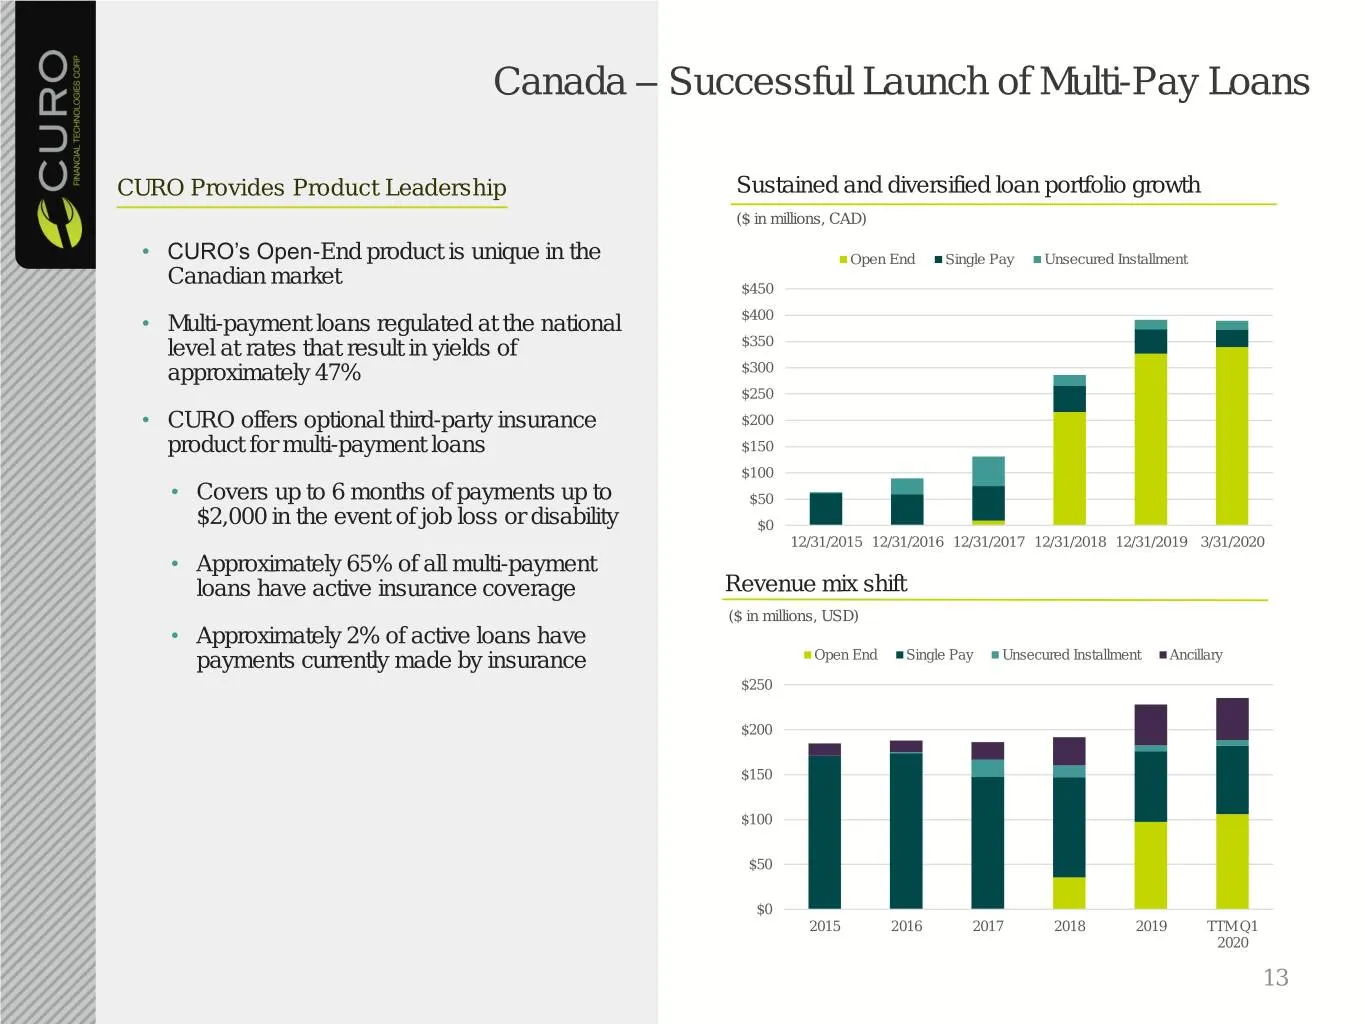
Canada – Successful Launch of Multi-Pay Loans CURO Provides Product Leadership Sustained and diversified loan portfolio growth ($ in millions, CAD) • CURO’s Open-End product is unique in the Open End Single Pay Unsecured Installment Canadian market $450 • Multi-payment loans regulated at the nationa
Slide 14: Proprietary Centralized IT and Analytics Platform
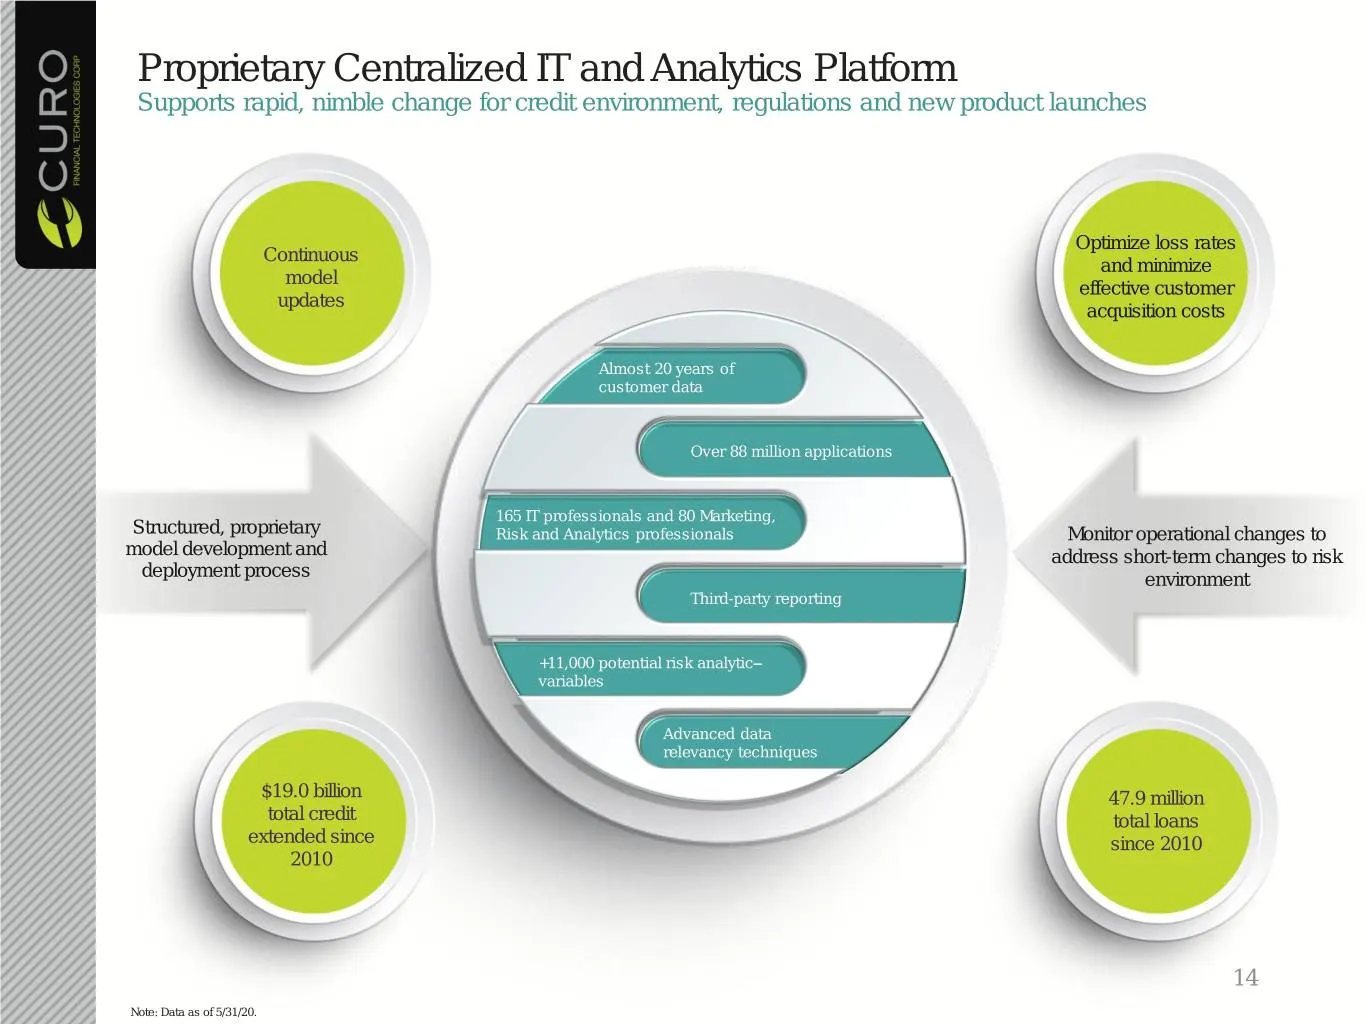
Proprietary Centralized IT and Analytics Platform Supports rapid, nimble change for credit environment, regulations and new product launches Optimize loss rates Continuous and minimize model effective customer updates acquisition costs Almost 20 years of customer data Over 88 million applications 16
Slide 15: Multi-faceted Marketing Strategy and Deep Data Analysis
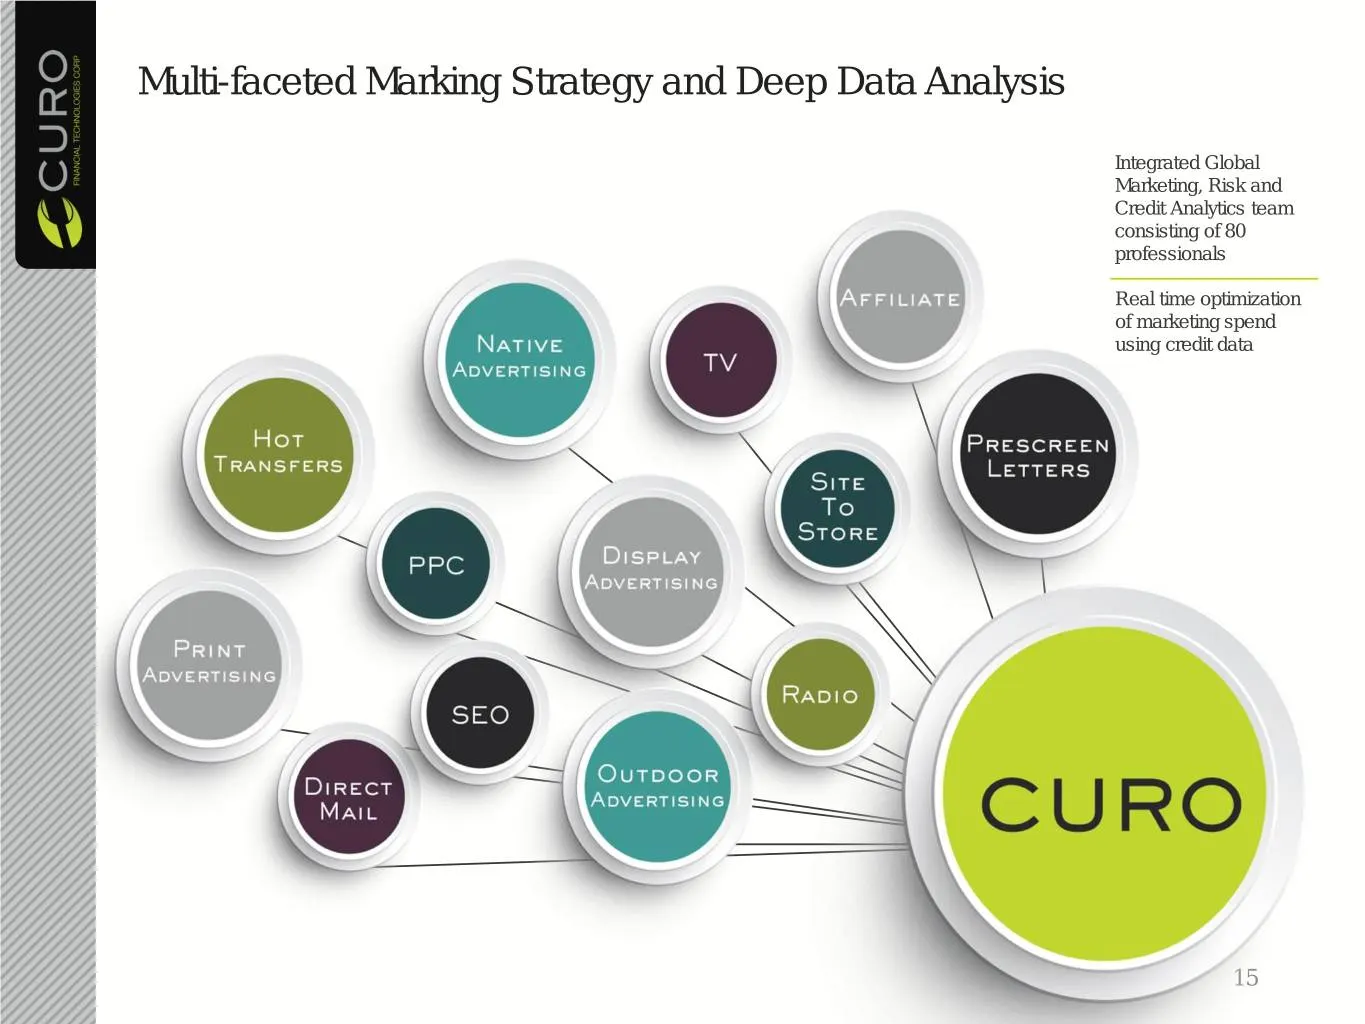
Multi-faceted Marking Strategy and Deep Data Analysis Integrated Global Marketing, Risk and Credit Analytics team consisting of 80 professionals Real time optimization of marketing spend using credit data 15
Slide 16: Continued Diversification = New Growth Opportunities
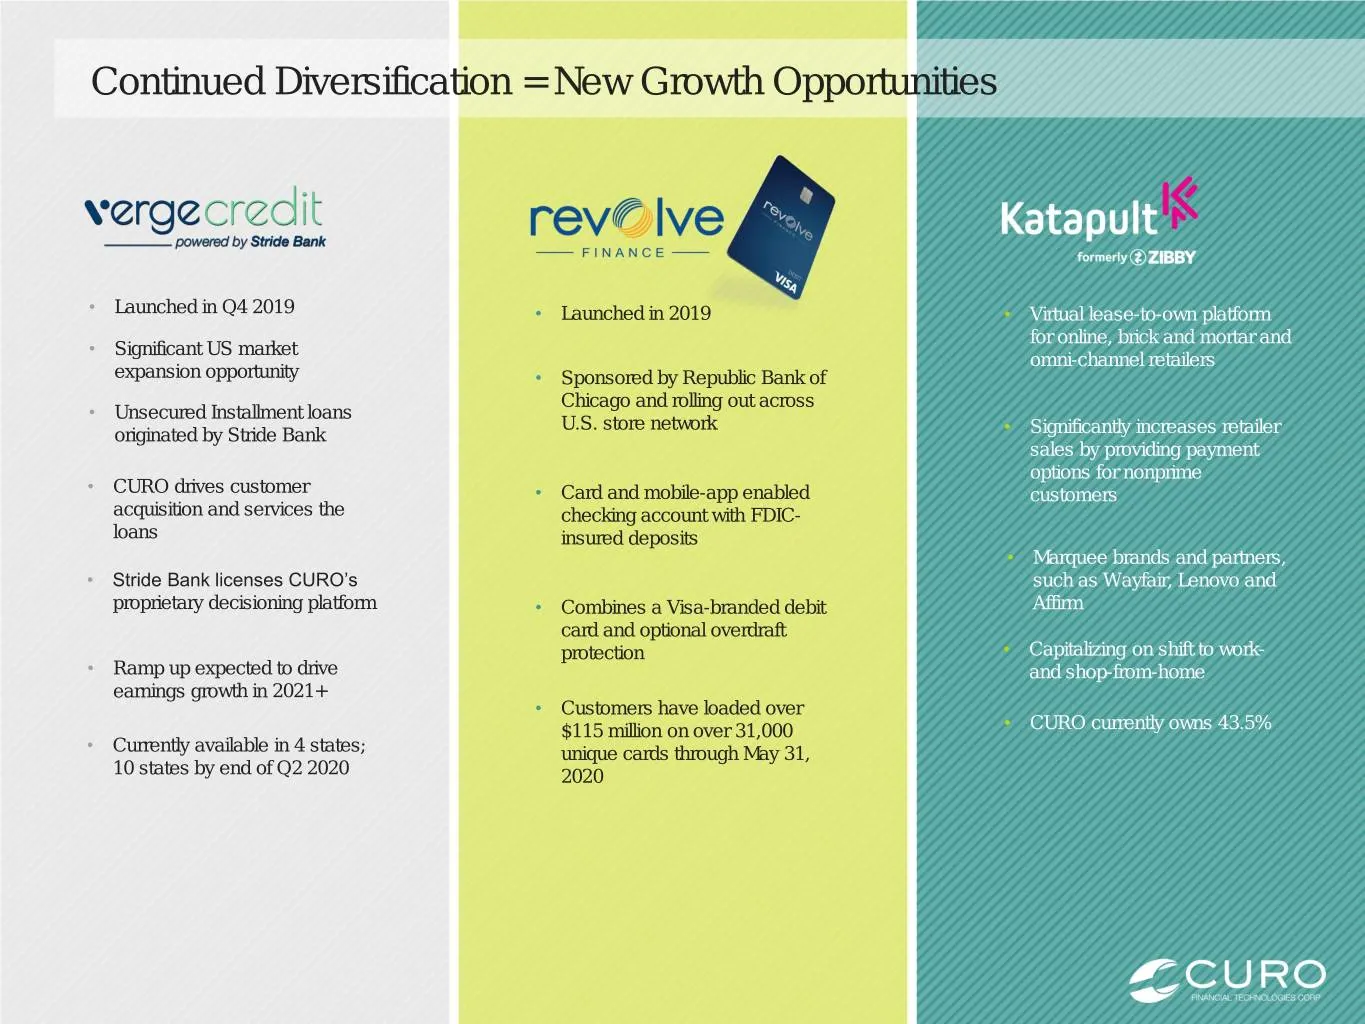
Continued Diversification = New Growth Opportunities • Launched in Q4 2019 • Launched in 2019 • Virtual lease-to-own platform for online, brick and mortar and • Significant US market omni-channel retailers expansion opportunity • Sponsored by Republic Bank of Chicago and rolling out across • Unsecur
Slide 17: Consumer spending and activity levels trending upward
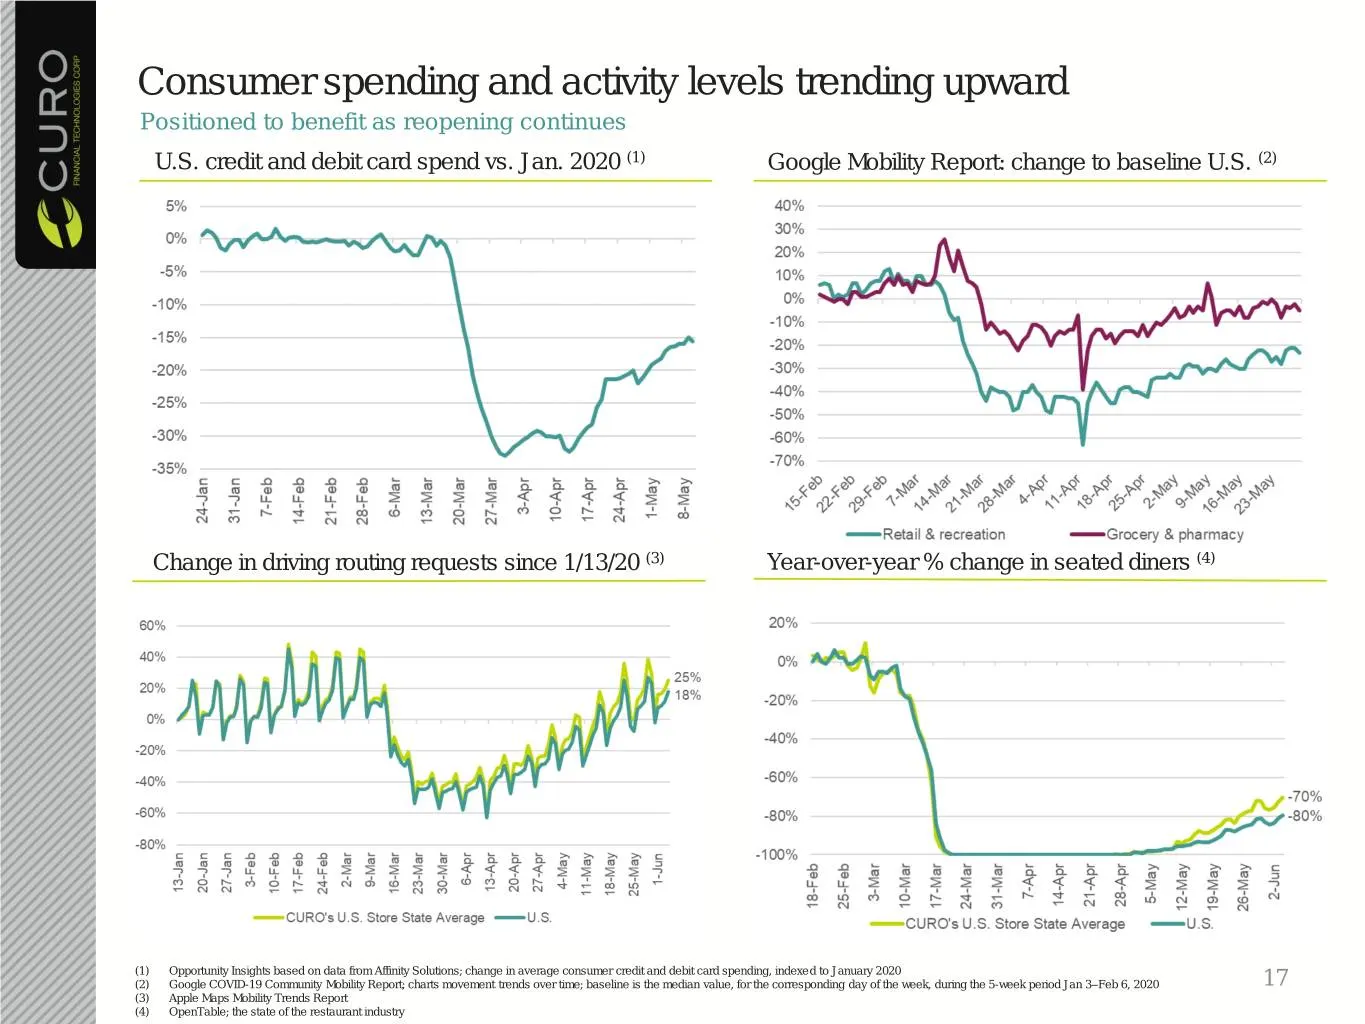
Consumer spending and activity levels trending upward Positioned to benefit as reopening continues U.S. credit and debit card spend vs. Jan. 2020 (1) Google Mobility Report: change to baseline U.S. (2) Change in driving routing requests since 1/13/20 (3) Year-over-year % change in seated diners (4)
Slide 18: Near-Term Opportunities
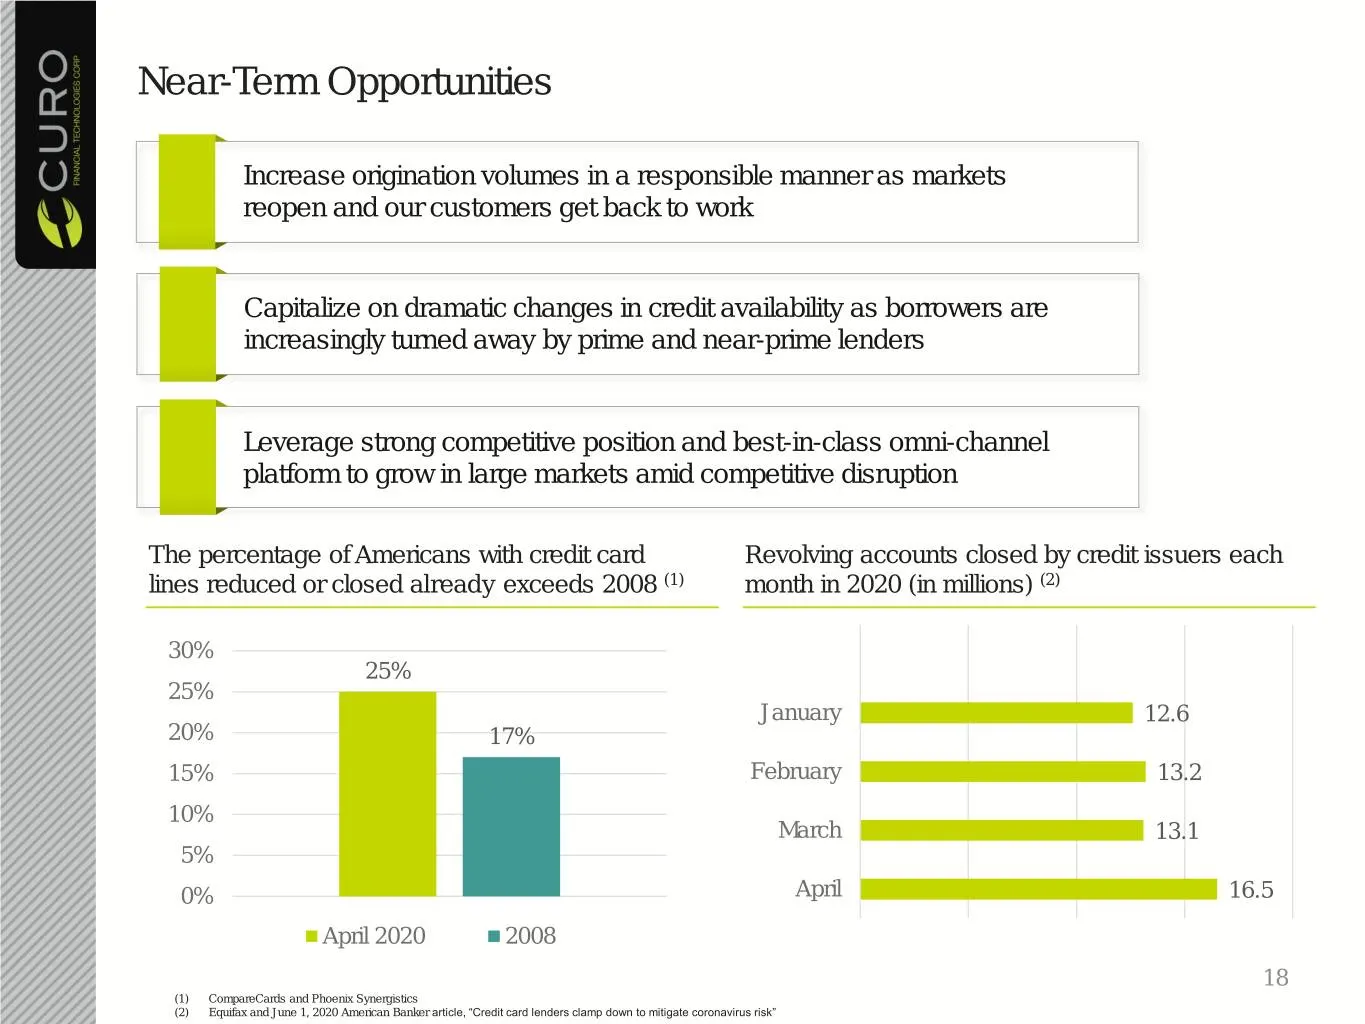
Near-Term Opportunities Increase origination volumes in a responsible manner as markets reopen and our customers get back to work Capitalize on dramatic changes in credit availability as borrowers are increasingly turned away by prime and near-prime lenders Leverage strong competitive position and b
Slide 19: Recent Business Trends
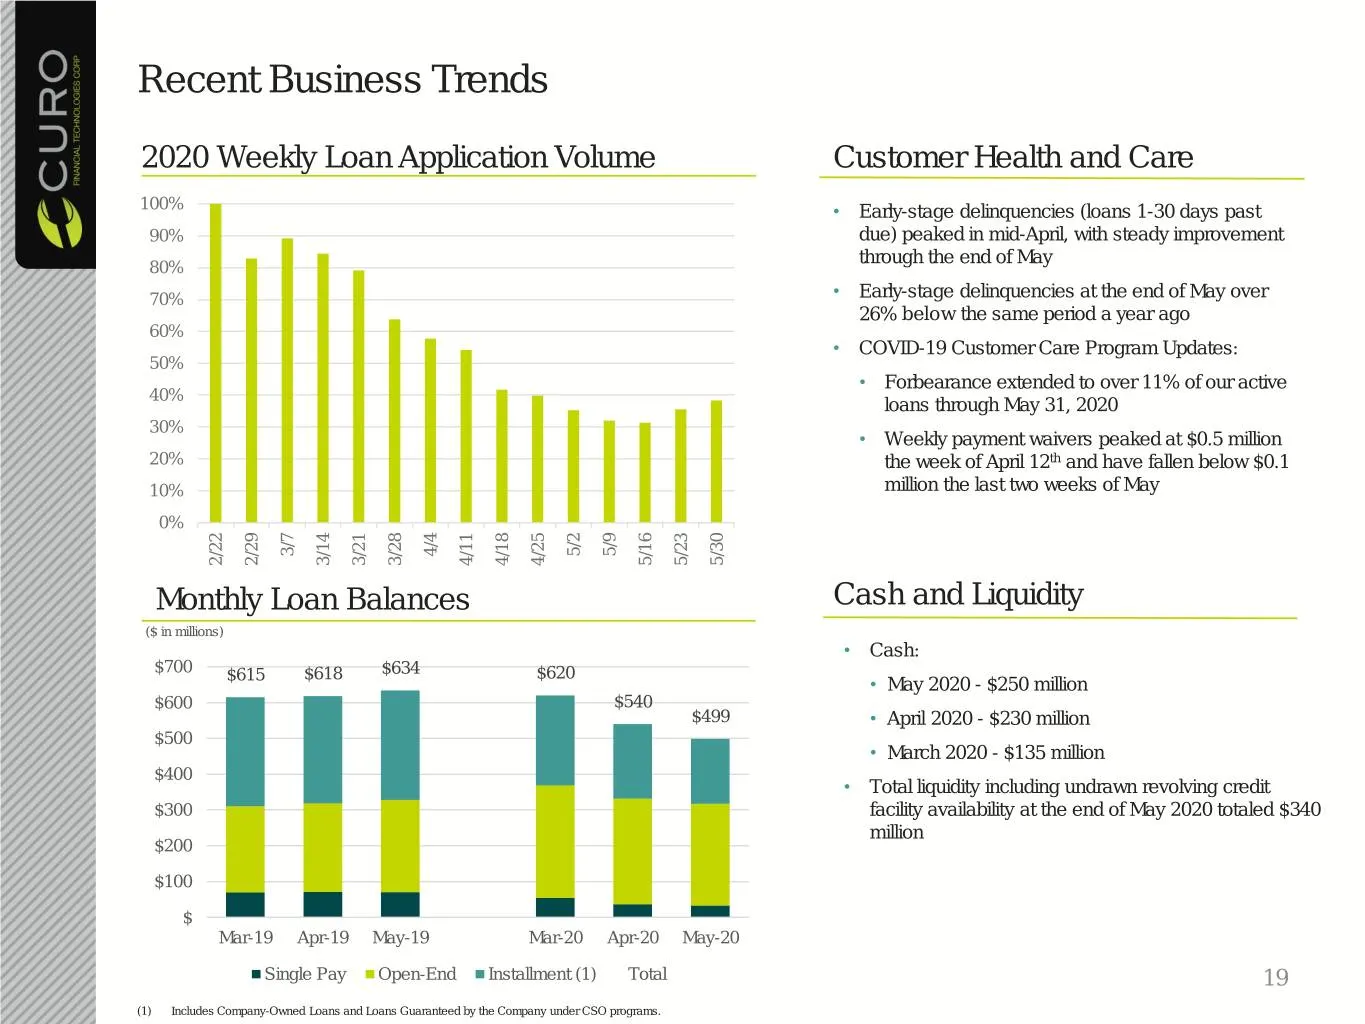
Recent Business Trends 2020 Weekly Loan Application Volume Customer Health and Care 100% • Early-stage delinquencies (loans 1-30 days past 90% due) peaked in mid-April, with steady improvement through the end of May 80% 70% • Early-stage delinquencies at the end of May over 26% below the same period
Slide 20: COVID-19 Customer Care Plan
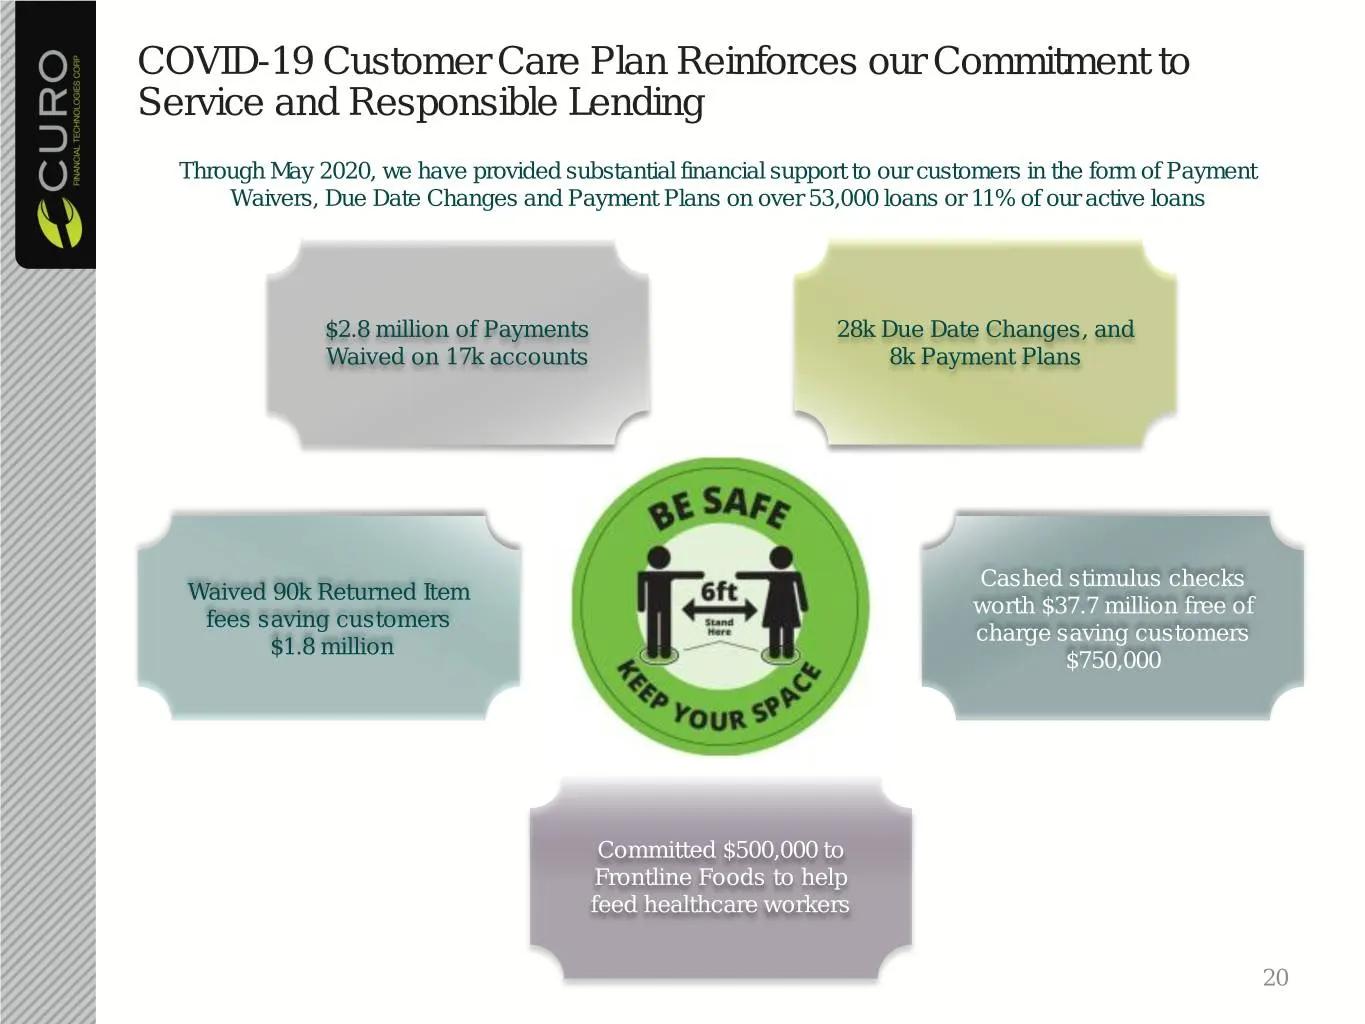
COVID-19 Customer Care Plan Reinforces our Commitment to Service and Responsible Lending Through May 2020, we have provided substantial financial support to our customers in the form of Payment Waivers, Due Date Changes and Payment Plans on over 53,000 loans or 11% of our active loans $2.8 million o
Slide 21: Financial Summary
Financial Summary 21
Slide 22: Financial Results at a Glance
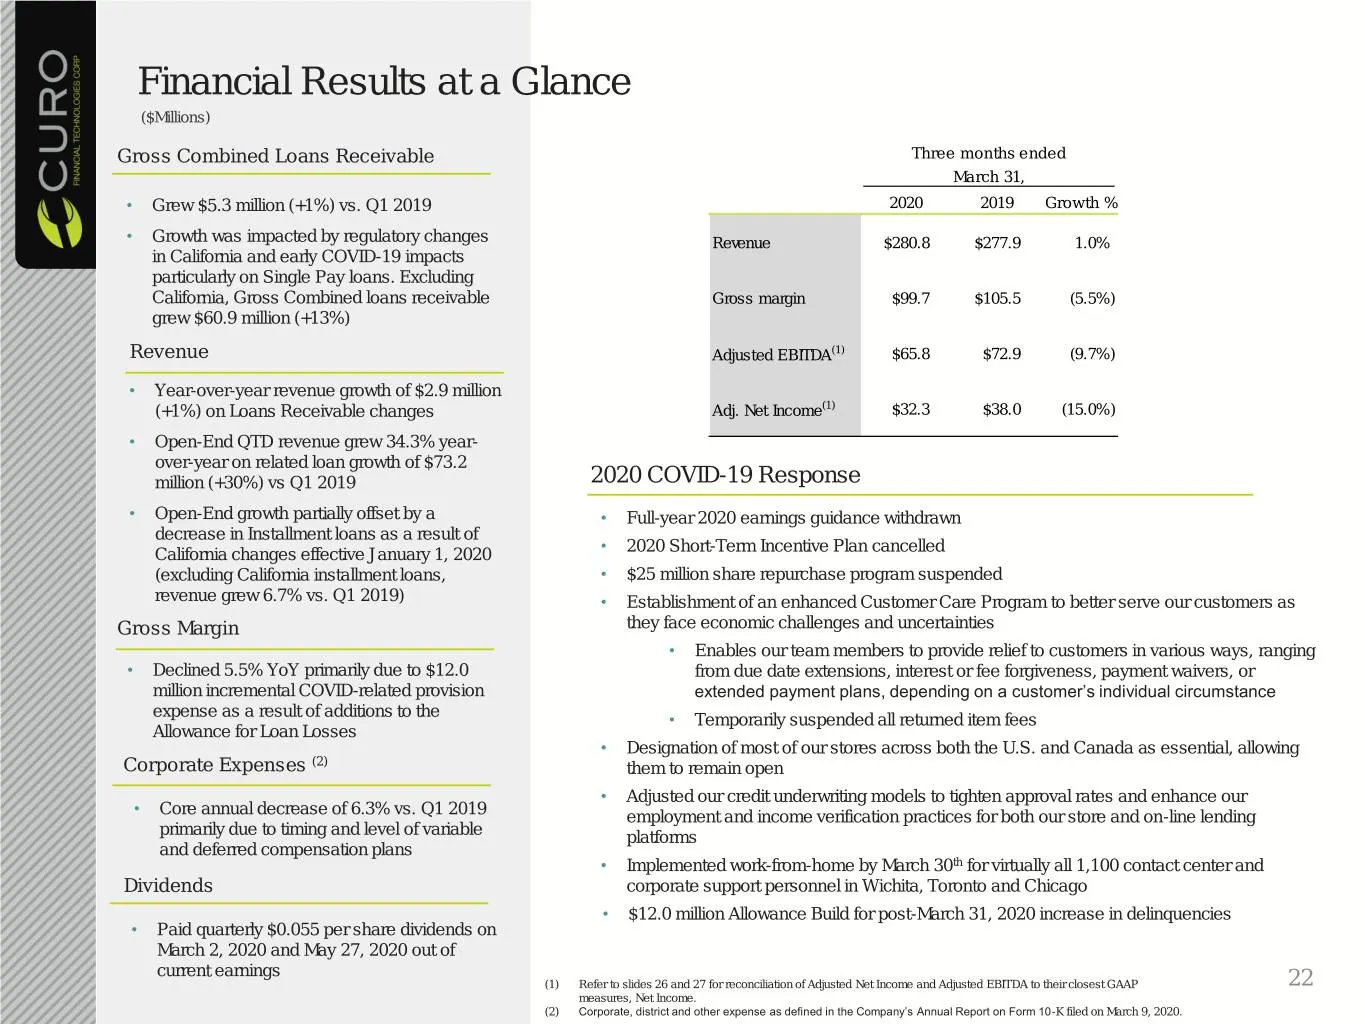
Financial Results at a Glance ($Millions) Gross Combined Loans Receivable Three months ended March 31, • Grew $5.3 million (+1%) vs. Q1 2019 2020 2019 Growth % • Growth was impacted by regulatory changes Revenue $280.8 $277.9 1.0% in California and early COVID-19 impacts particularly on Single Pay l
Slide 23: Improved Quarterly Net Charge-Off Rates
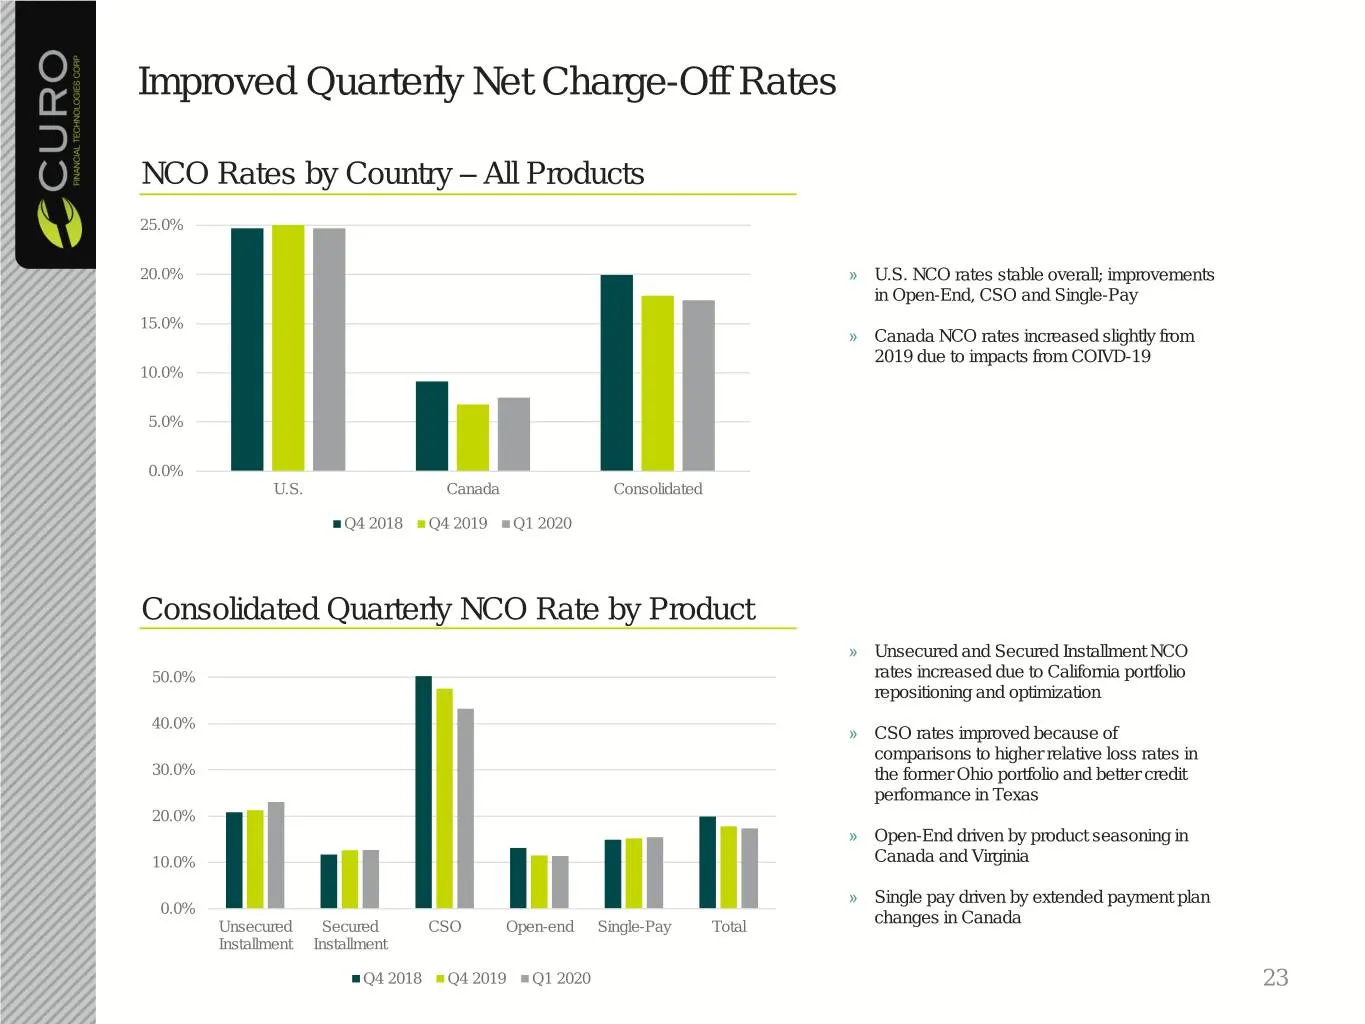
Improved Quarterly Net Charge-Off Rates NCO Rates by Country – All Products 25.0% 20.0% » U.S. NCO rates stable overall; improvements in Open-End, CSO and Single-Pay 15.0% » Canada NCO rates increased slightly from 2019 due to impacts from COIVD-19 10.0% 5.0% 0.0% U.S. Canada Consolidated Q4 2018 Q4
Slide 24: Strong Debt Capitalization and Liquidity
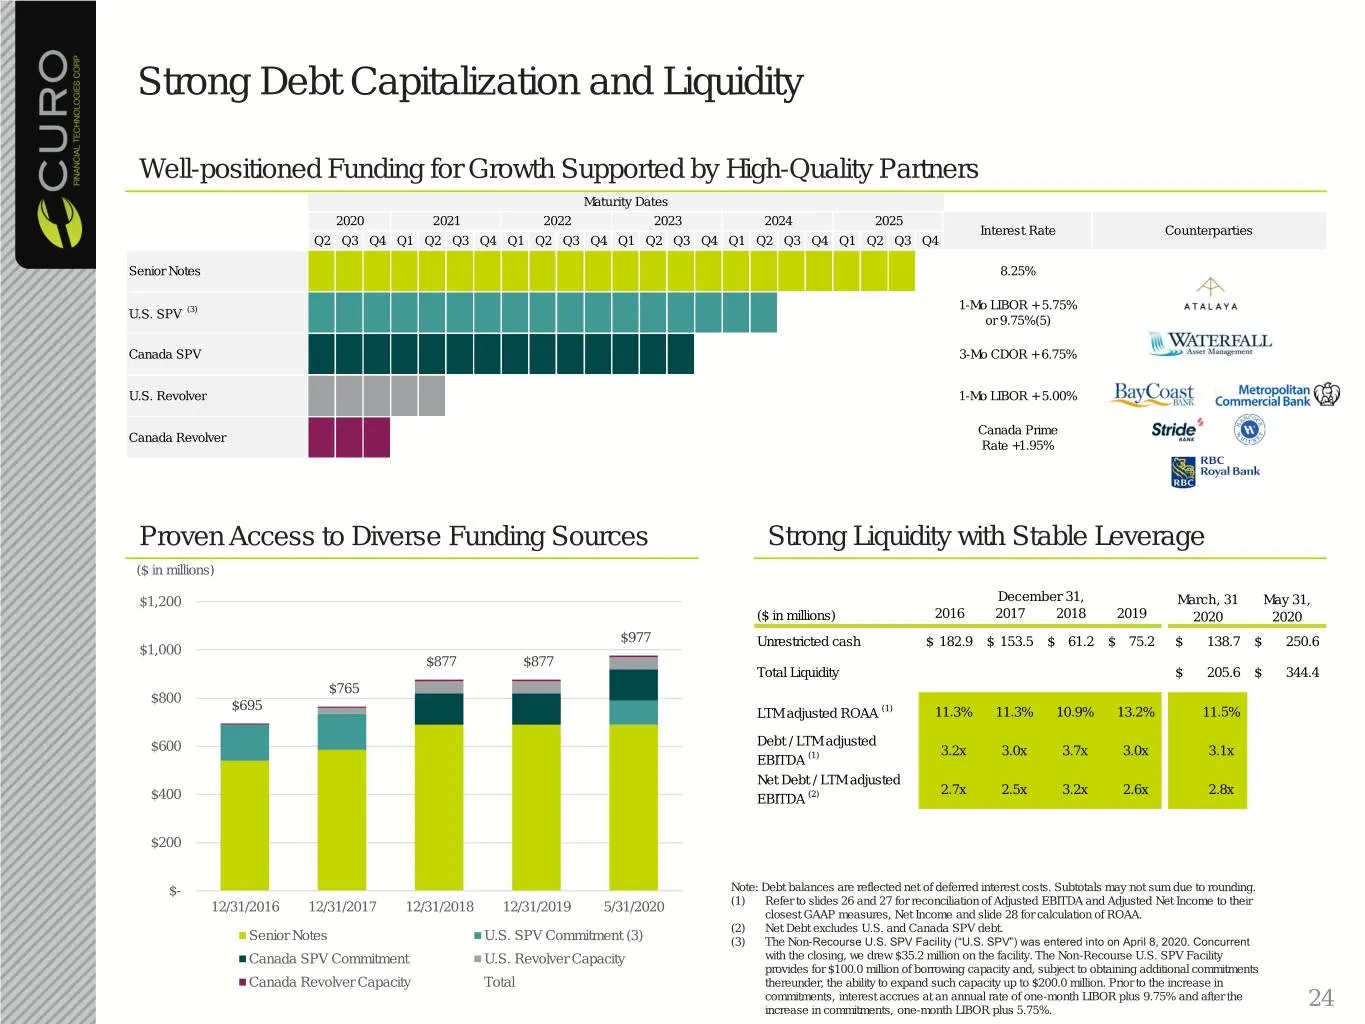
Strong Debt Capitalization and Liquidity Well-positioned Funding for Growth Supported by High-Quality Partners Maturity Dates 2020 2021 2022 2023 2024 2025 Interest Rate Counterparties Q2 Q3 Q4 Q1 Q2 Q3 Q4 Q1 Q2 Q3 Q4 Q1 Q2 Q3 Q4 Q1 Q2 Q3 Q4 Q1 Q2 Q3 Q4 Senior Notes 8.25% 1-Mo LIBOR + 5.75% U.S. SPV
Slide 25: Appendix
Appendix 25
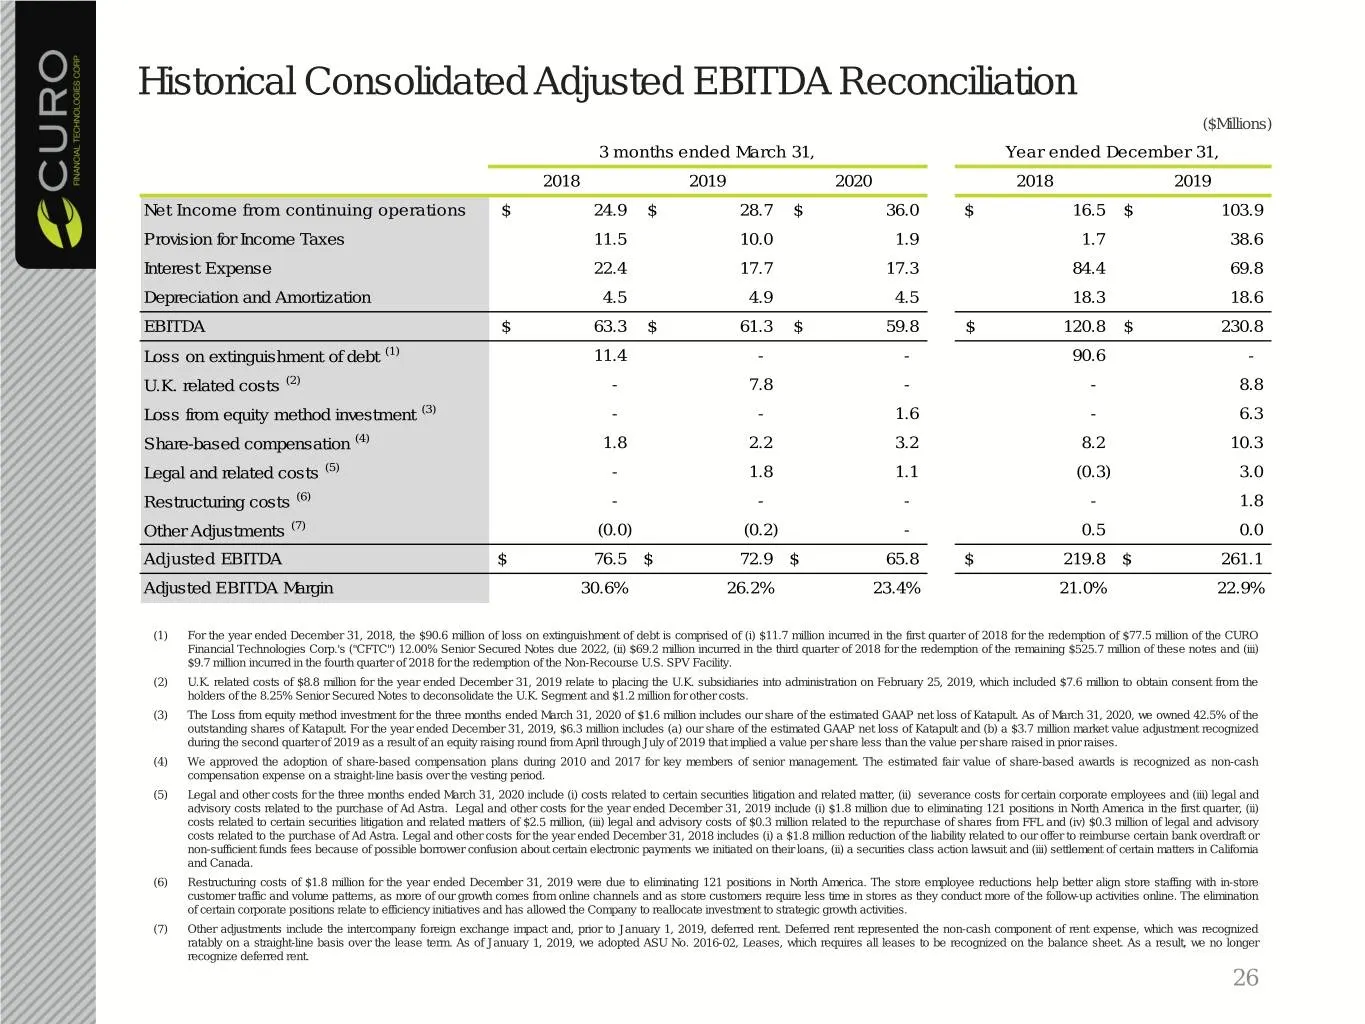
Slide 26: Historical Consolidated Adjusted EBITDA Reconciliation
Historical Consolidated Adjusted EBITDA Reconciliation ($Millions) 3 months ended March 31, Year ended December 31, 2018 2019 2020 2018 2019 Net Income from continuing operations $ 24.9 $ 28.7 $ 36.0 $ 16.5 $ 103.9 Provision for Income Taxes 11.5 10.0 1.9 1.7 38.6 Interest Expense 22.4 17.7 17.3 84.
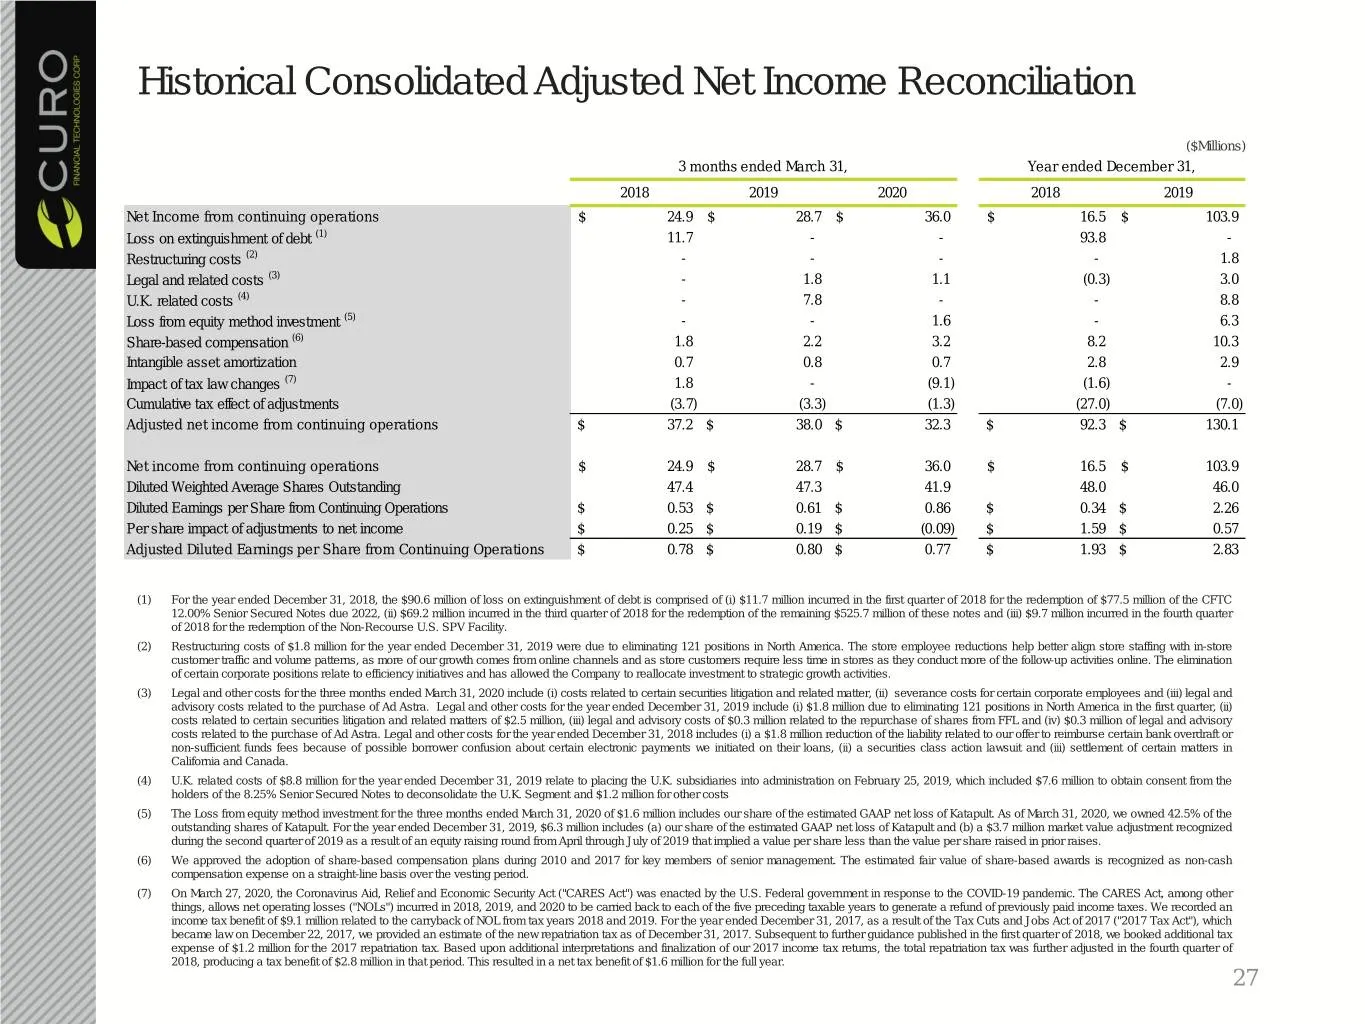
Slide 27: Historical Consolidated Adjusted Net Income Reconciliation
Historical Consolidated Adjusted Net Income Reconciliation ($Millions) 3 months ended March 31, Year ended December 31, 2018 2019 2020 2018 2019 Net Income from continuing operations $ 24.9 $ 28.7 $ 36.0 $ 16.5 $ 103.9 Loss on extinguishment of debt (1) 11.7 - - 93.8 - Restructuring costs (2) - - -
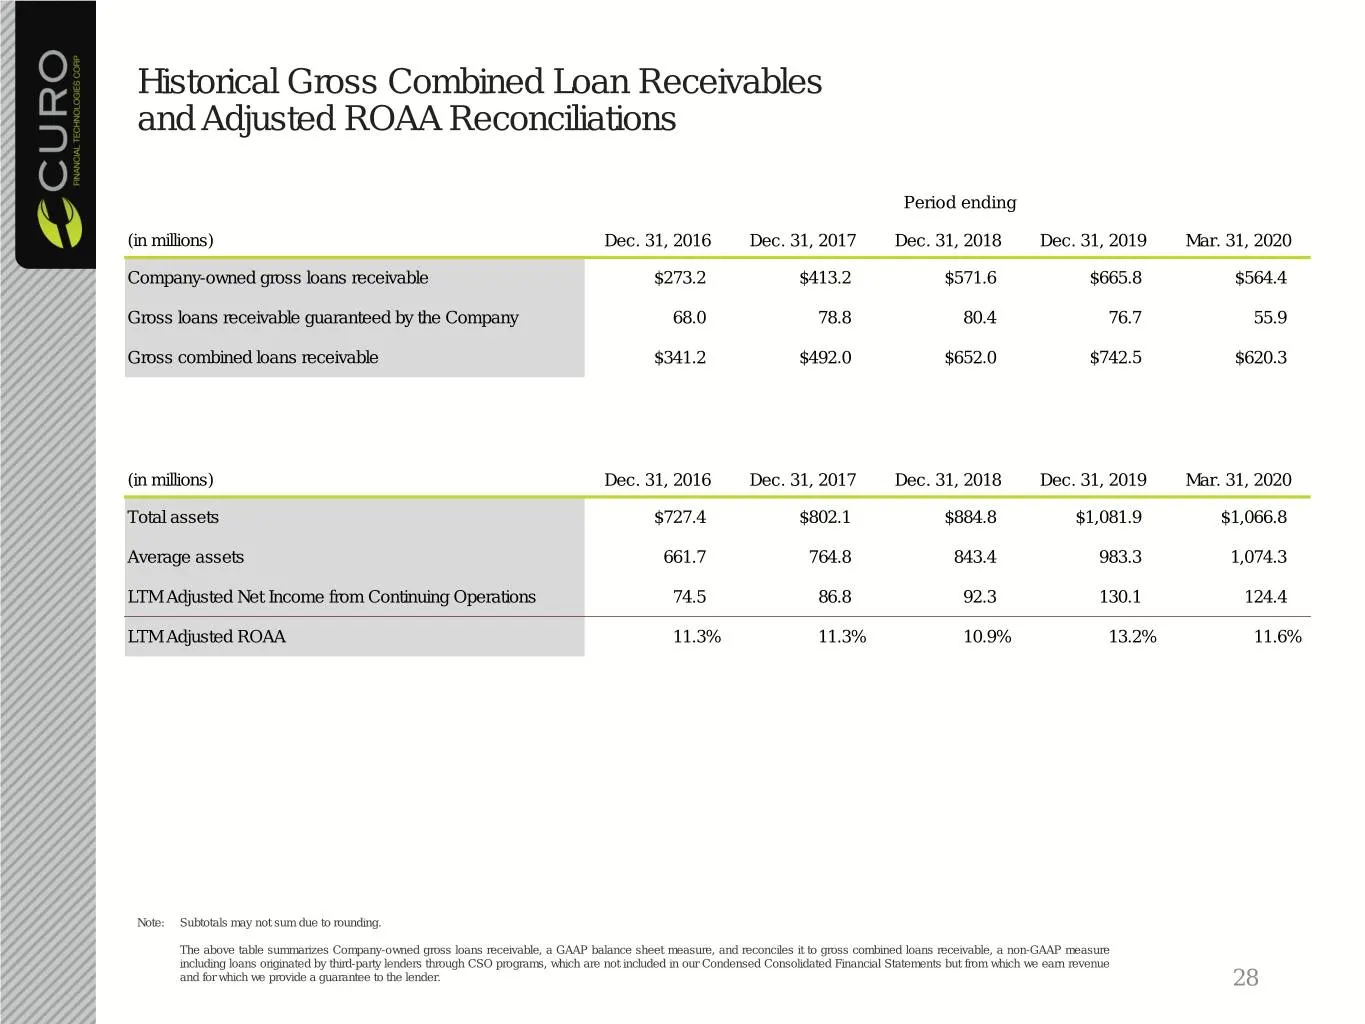
Slide 28: Historical Gross Combined Loan Receivables and Adjusted ROAA Reconciliations
Historical Gross Combined Loan Receivables and Adjusted ROAA Reconciliations Period ending (in millions) Dec. 31, 2016 Dec. 31, 2017 Dec. 31, 2018 Dec. 31, 2019 Mar. 31, 2020 Company-owned gross loans receivable $273.2 $413.2 $571.6 $665.8 $564.4 Gross loans receivable guaranteed by the Company 68.0
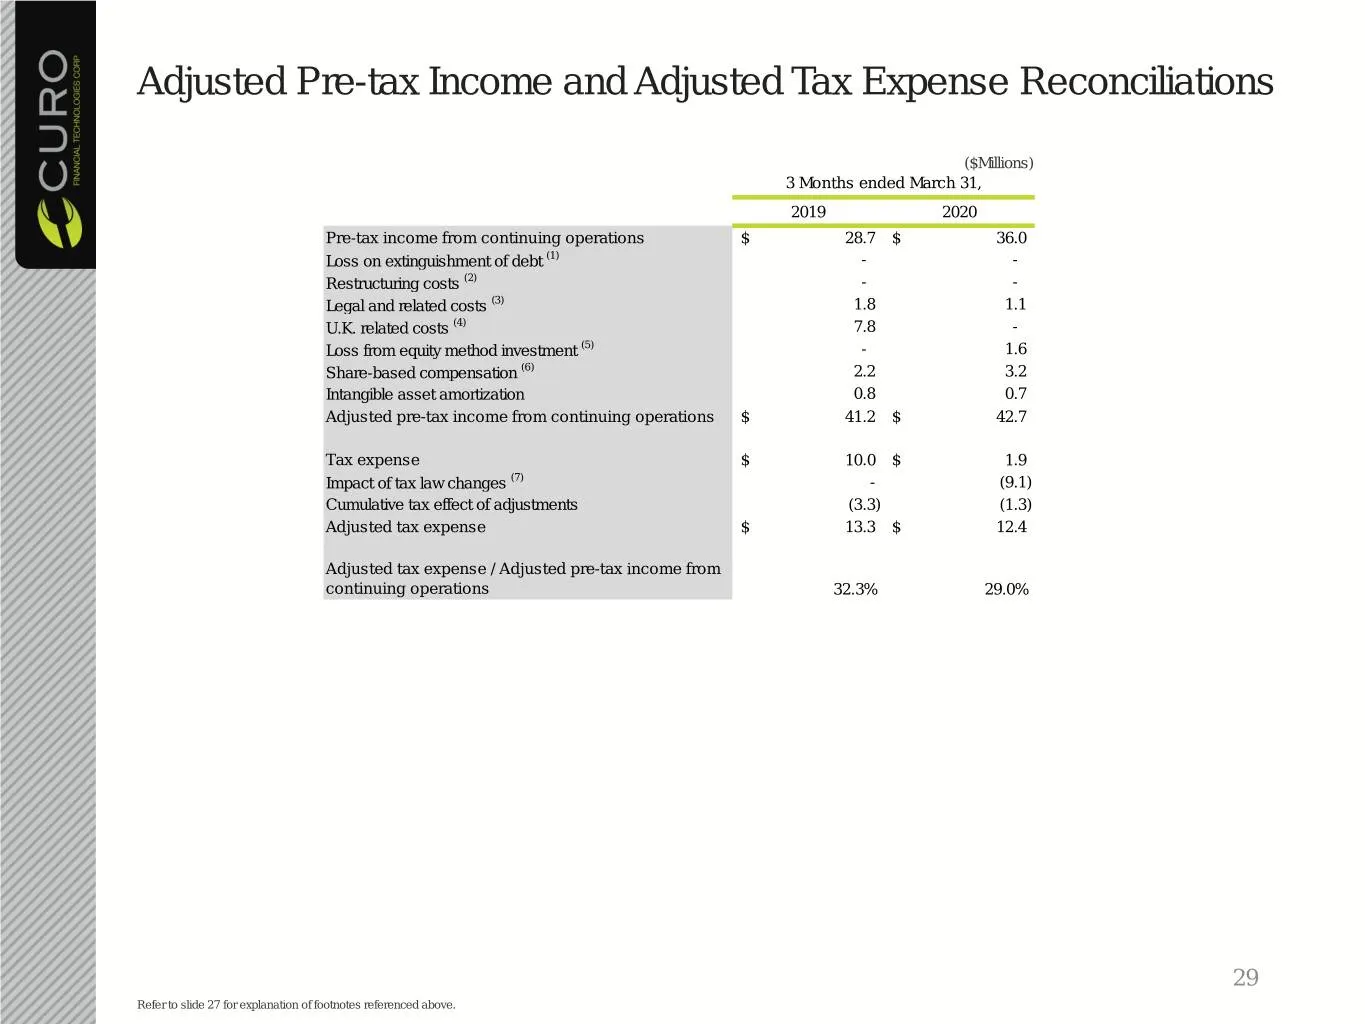
Slide 29: Adjusted Pre-tax Income and Adjusted Tax Expense Reconciliations
Adjusted Pre-tax Income and Adjusted Tax Expense Reconciliations ($Millions) 3 Months ended March 31, 2019 2020 Pre-tax income from continuing operations $ 28.7 $ 36.0 Loss on extinguishment of debt (1) - - Restructuring costs (2) - - Legal and related costs (3) 1.8 1.1 U.K. related costs (4) 7.8 -
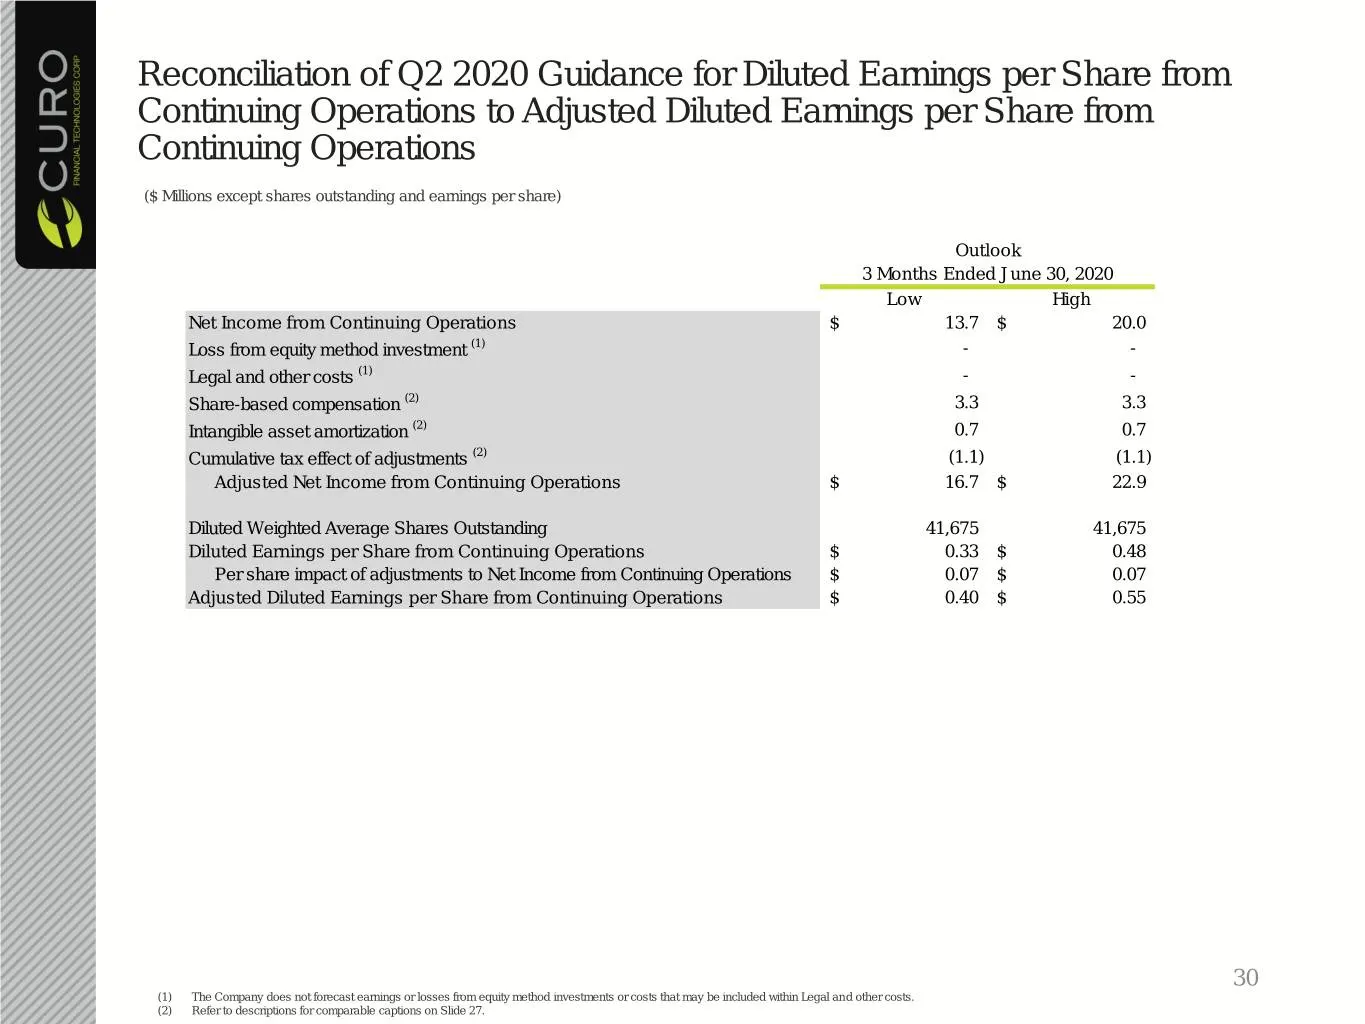
Slide 30: Reconciliation of Q2 2020 Guidance for Diluted Earnings per Share
Reconciliation of Q2 2020 Guidance for Diluted Earnings per Share from Continuing Operations to Adjusted Diluted Earnings per Share from Continuing Operations ($ Millions except shares outstanding and earnings per share) Outlook 3 Months Ended June 30, 2020 Low High Net Income from Continuing Operat
Source: SEC EDGAR · 8-K filed Jun 10, 2020
More decks from Curo Group Holdings Corp
 Q4 2023 Earnings Presentation21 slides · Feb 12, 2024
 Investor Presentation (November 2023)15 slides · Nov 13, 2023
 Q3 2023 Earnings Presentation20 slides · Nov 2, 2023
 Debt Investor Presentation (October 2023)21 slides · Oct 23, 2023
 Investor Presentation (September 2023)15 slides · Sep 25, 2023
 Q2 2023 Earnings Presentation21 slides · Aug 3, 2023