Curo — Q2 2023 Earnings Presentation
21 slides from Curo's earnings presentation, Aug 3, 2023

Slide 1: Q2 2023 Earnings Presentation
Q2 2023 Earnings Presentation August 3, 2023
Slide 2: Disclaimer
Disclaimer IMPORTANT: You must read the following information before continuing to the rest of the presentation, which is being provided to you for informational purposes only. Forward-Looking Statements This presentation contains forward-looking statements. These forward-looking statements include
Slide 3: 2Q23 Highlights - Steady progress across our three pillars
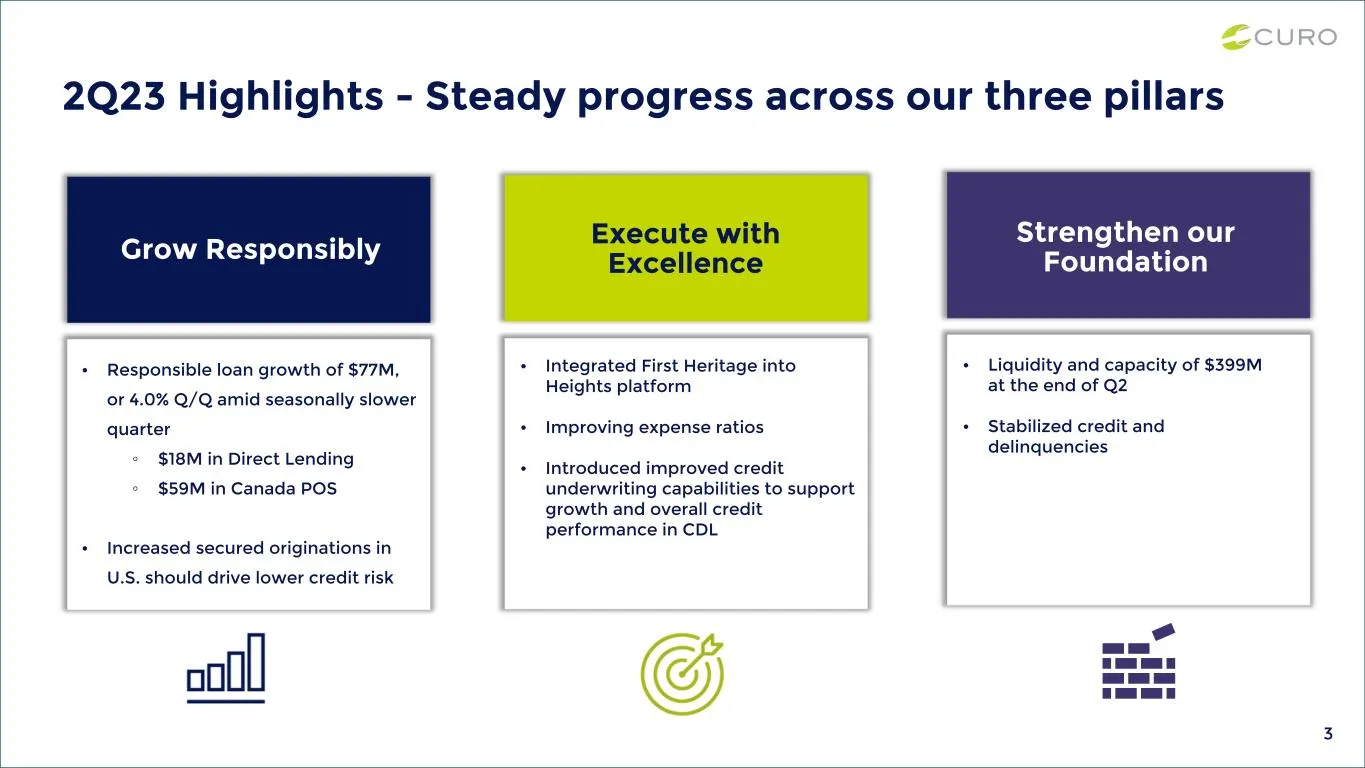
2Q23 Highlights - Steady progress across our three pillars Strengthen our Foundation Execute with ExcellenceGrow Responsibly 3 • Responsible loan growth of $77M, or 4.0% Q/Q amid seasonally slower quarter ◦ $18M in Direct Lending ◦ $59M in Canada POS • Increased secured originations in U.S. should d
Slide 4: Gross Loans Receivable
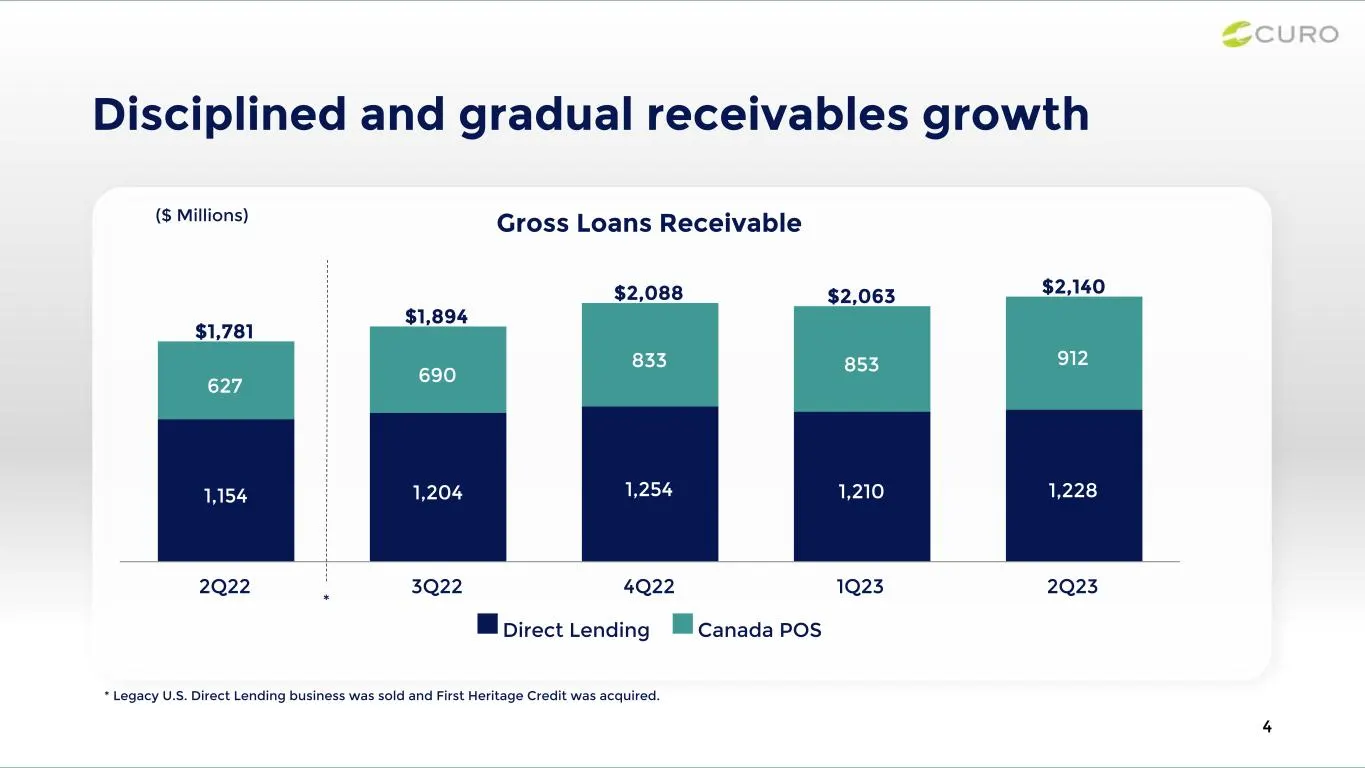
Gross Loans Receivable $1,781 $1,894 $2,088 $2,063 $2,140 1,154 1,204 1,254 1,210 1,228 627 690 833 853 912 Direct Lending Canada POS 2Q22 3Q22 4Q22 1Q23 2Q23 Disciplined and gradual receivables growth 4 ($ Millions) * Legacy U.S. Direct Lending business was sold and First Heritage Credit was acquir
Slide 5: Credit quality improving: Total Direct Lending NCOs
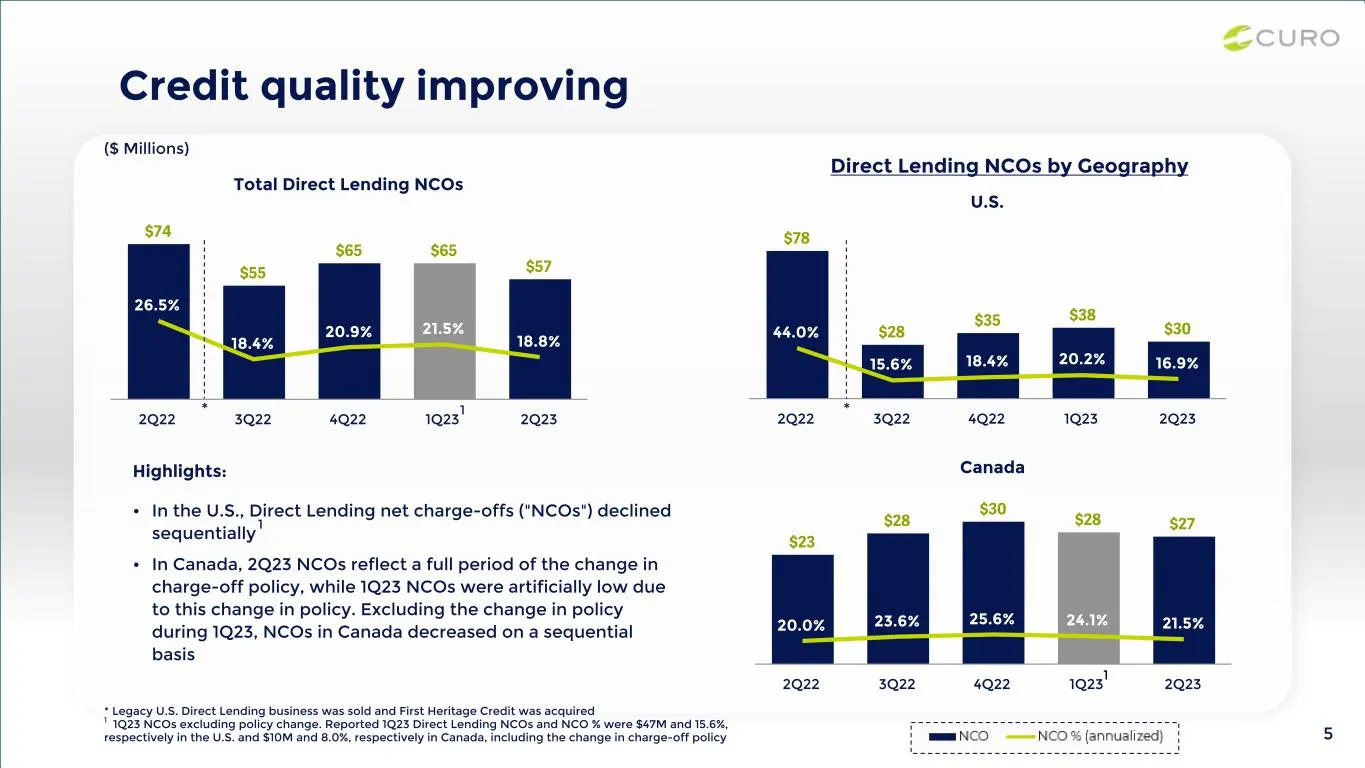
Total Direct Lending NCOs $74 $55 $65 $65 $57 26.5% 18.4% 20.9% 21.5% 18.8% 2Q22 3Q22 4Q22 1Q23 2Q23 Canada $23 $28 $30 $28 $27 20.0% 23.6% 25.6% 24.1% 21.5% 2Q22 3Q22 4Q22 1Q23 2Q23 U.S. $78 $28 $35 $38 $3044.0% 15.6% 18.4% 20.2% 16.9% 2Q22 3Q22 4Q22 1Q23 2Q23 Credit quality improving Highlights: •
Slide 6: Delinquency rates remain relatively stable
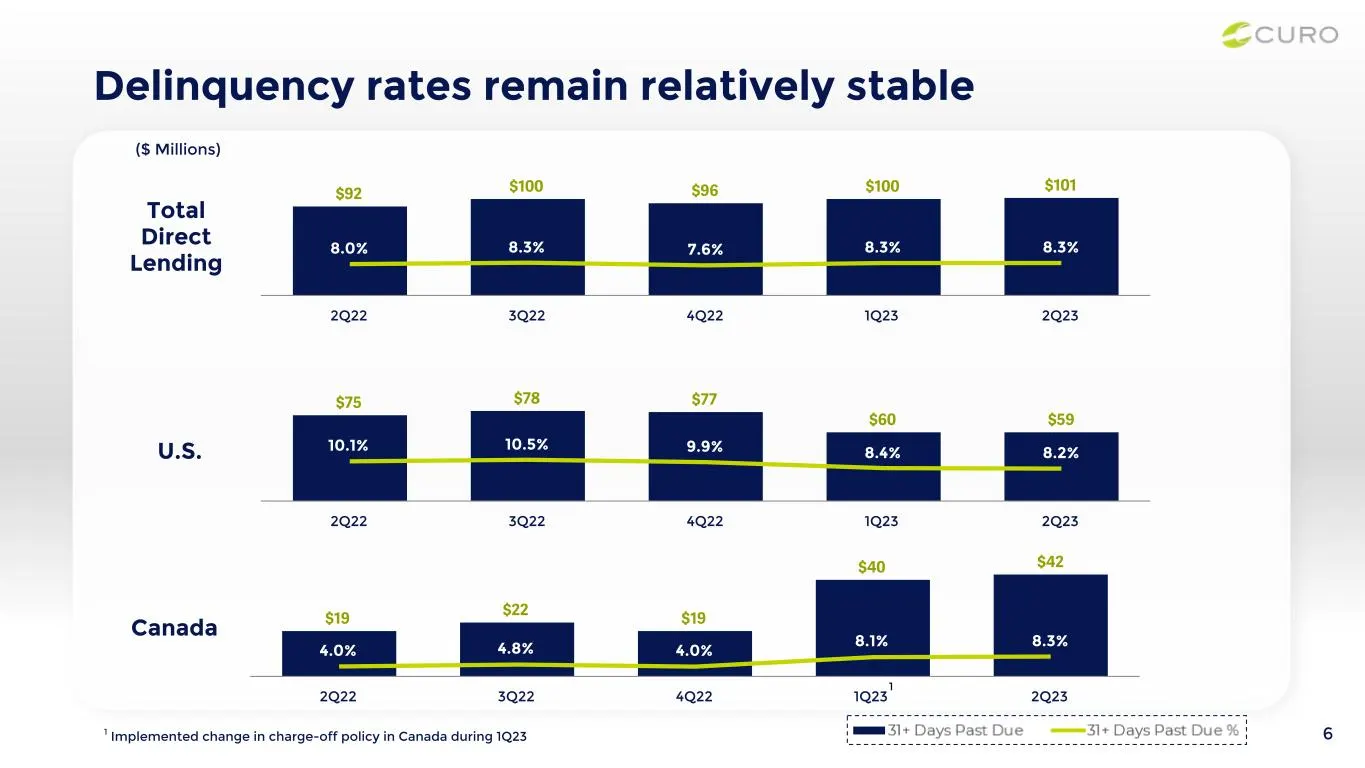
Delinquency rates remain relatively stable ($ Millions) 6 Canada U.S. Total Direct Lending $75 $78 $77 $60 $59 10.1% 10.5% 9.9% 8.4% 8.2% 2Q22 3Q22 4Q22 1Q23 2Q23 $19 $22 $19 $40 $42 4.0% 4.8% 4.0% 8.1% 8.3% 2Q22 3Q22 4Q22 1Q23 2Q23 $92 $100 $96 $100 $101 8.0% 8.3% 7.6% 8.3% 8.3% 2Q22 3Q22 4Q22 1Q23
Slide 7: Canada POS NCOs remain stable as portfolio continues to season and mature
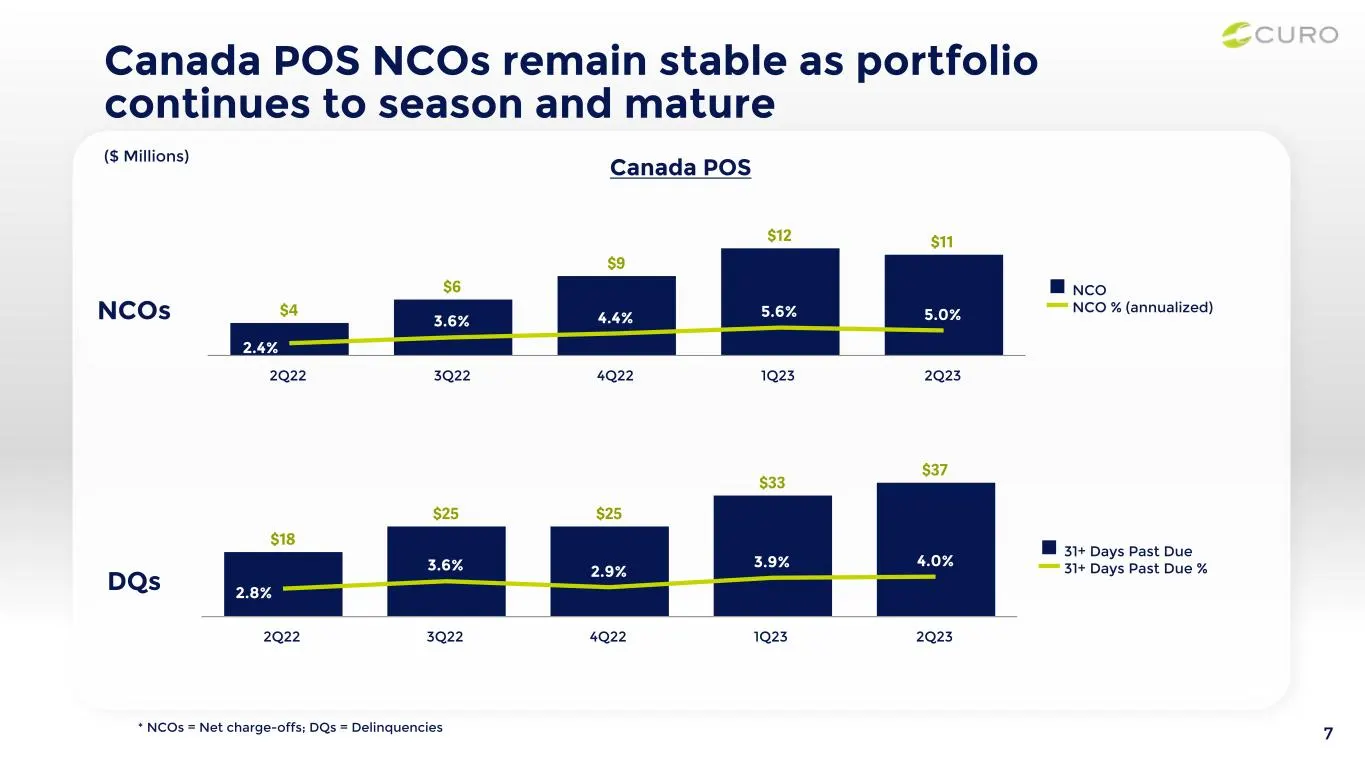
Canada POS NCOs remain stable as portfolio continues to season and mature NCOs DQs ($ Millions) 7* NCOs = Net charge-offs; DQs = Delinquencies Canada POS $4 $6 $9 $12 $11 2.4% 3.6% 4.4% 5.6% 5.0% NCO NCO % (annualized) 2Q22 3Q22 4Q22 1Q23 2Q23 $18 $25 $25 $33 $37 2.8% 3.6% 2.9% 3.9% 4.0% 31+ Days Pa
Slide 8: Consolidated financial results
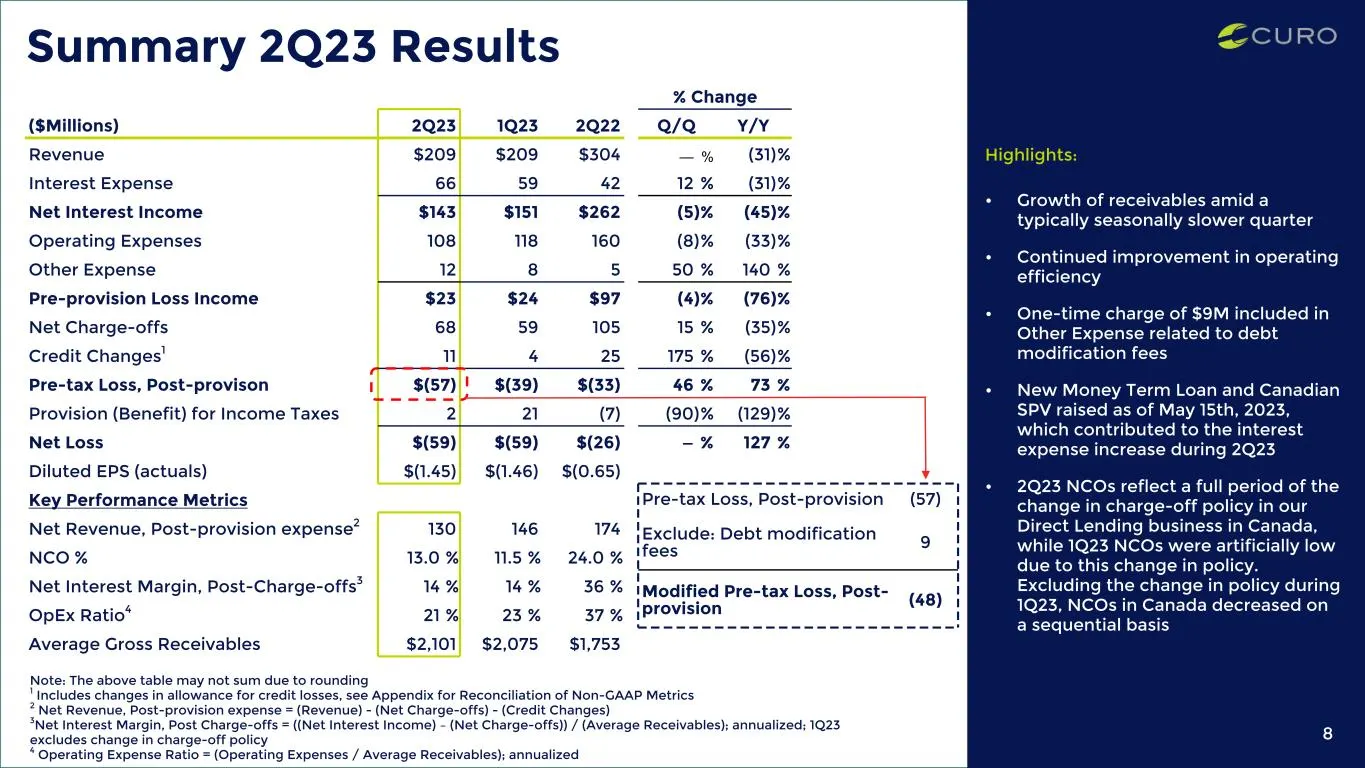
% Change ($Millions) 2Q23 1Q23 2Q22 Q/Q Y/Y Revenue $209 $209 $304 — % (31) % Interest Expense 66 59 42 12 % (31) % Net Interest Income $143 $151 $262 (5) % (45) % Operating Expenses 108 118 160 (8) % (33) % Other Expense 12 8 5 50 % 140 % Pre-provision Loss Income $23 $24 $97 (4) % (76) % Net Charg
Slide 9: 2Q23 Segment Results
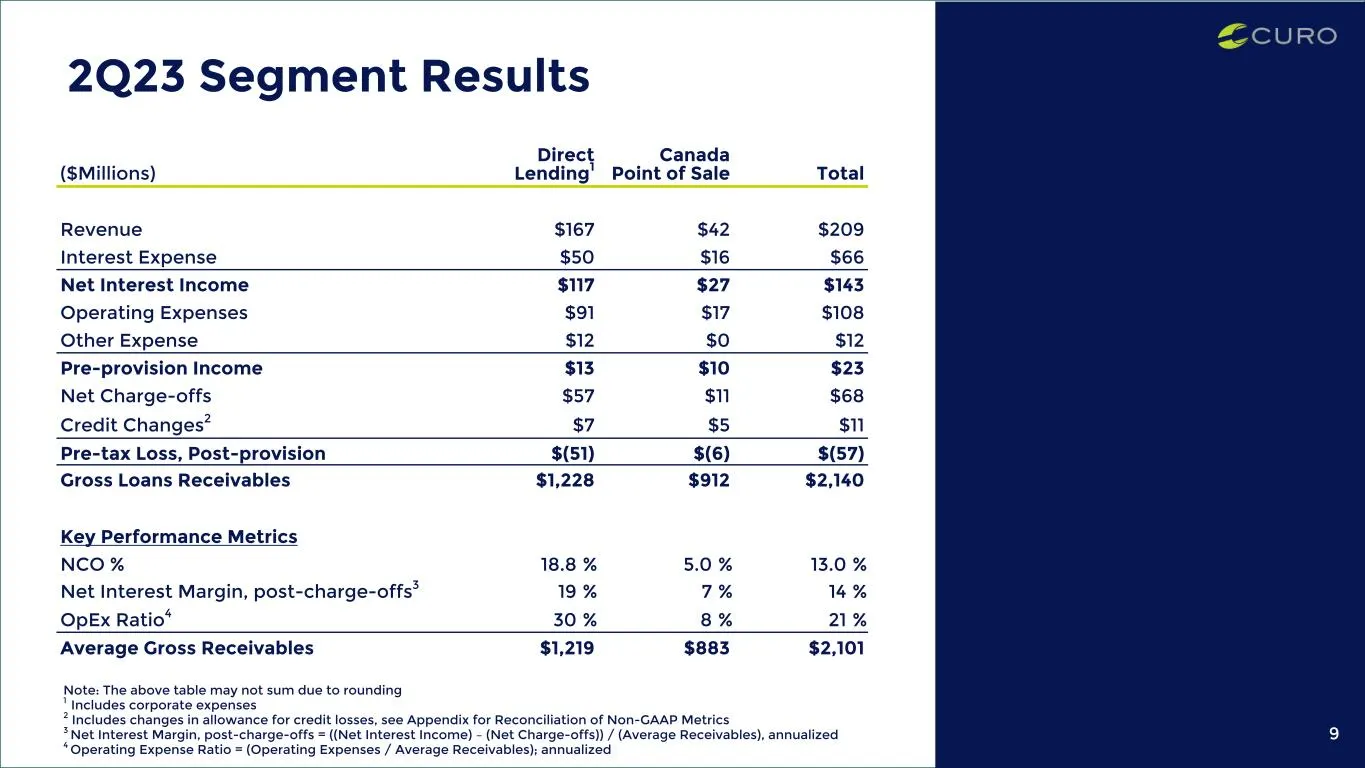
2Q23 Segment Results 9 Note: The above table may not sum due to rounding 1 Includes corporate expenses 2 Includes changes in allowance for credit losses, see Appendix for Reconciliation of Non-GAAP Metrics 3 Net Interest Margin, post-charge-offs = ((Net Interest Income) – (Net Charge-offs)) / (Avera
Slide 10: Increased allowance due to loan growth and conservative macro outlook
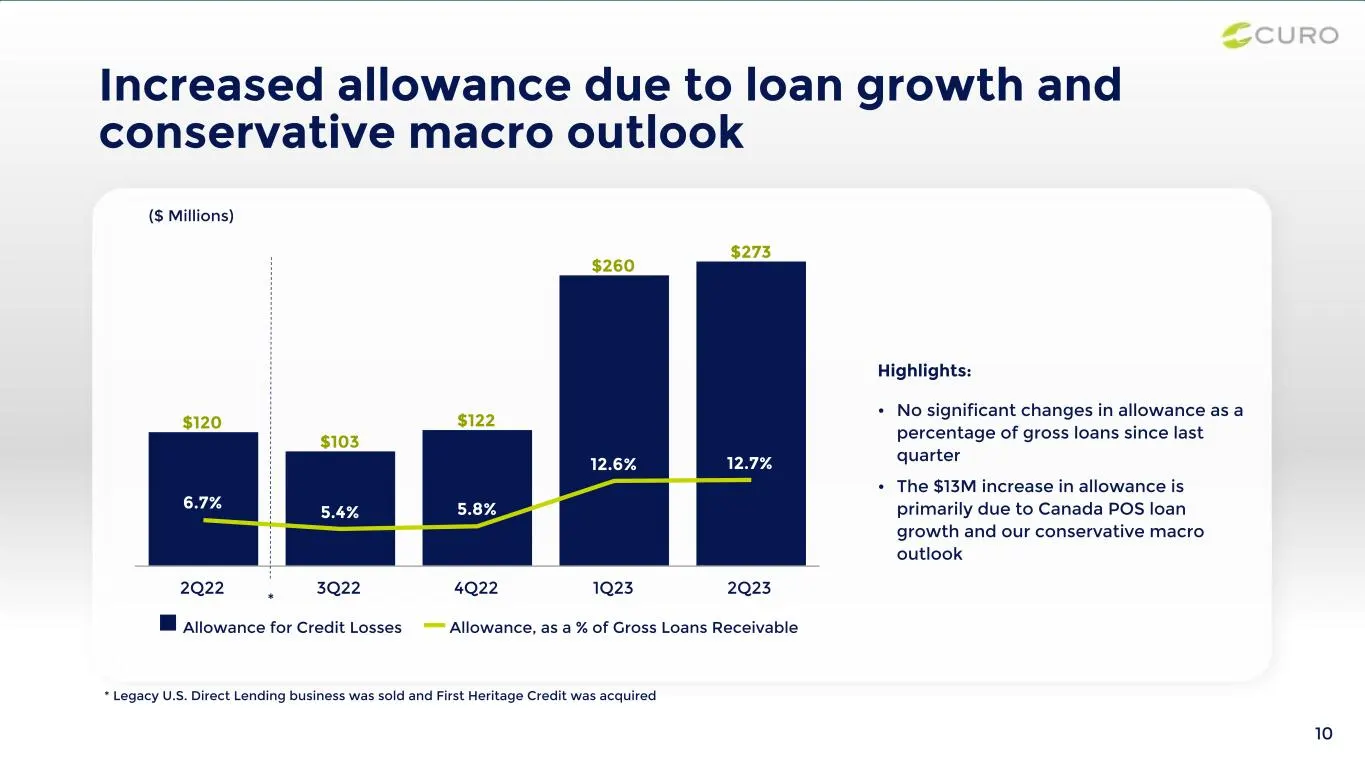
10 Increased allowance due to loan growth and conservative macro outlook Highlights: • No significant changes in allowance as a percentage of gross loans since last quarter • The $13M increase in allowance is primarily due to Canada POS loan growth and our conservative macro outlook $120 $103 $122 $
Slide 11: Net Interest Income increased sequentially
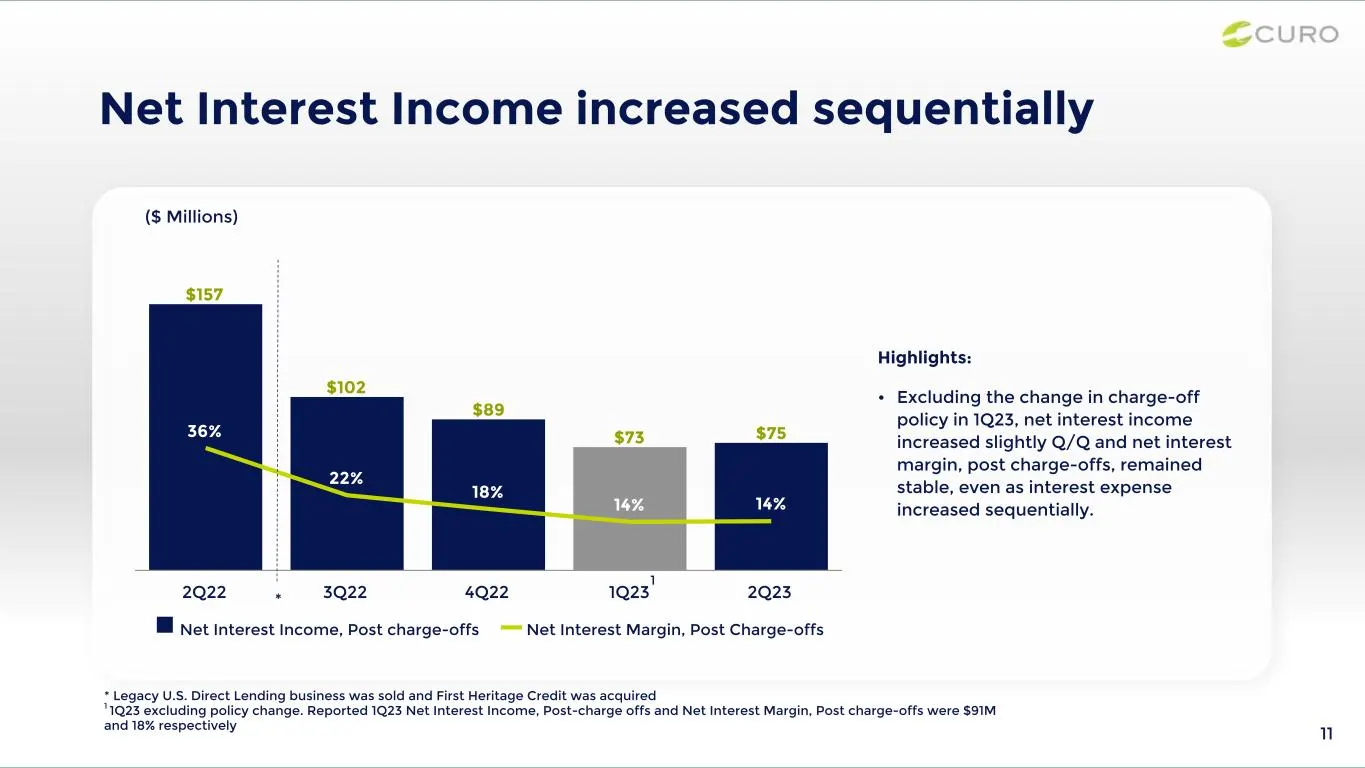
11 Net Interest Income increased sequentially $157 $102 $89 $73 $7536% 22% 18% 14% 14% Net Interest Income, Post charge-offs Net Interest Margin, Post Charge-offs 2Q22 3Q22 4Q22 1Q23 2Q23 ($ Millions) Highlights: • Excluding the change in charge-off policy in 1Q23, net interest income increased slig
Slide 12: Continued progress in managing expenses
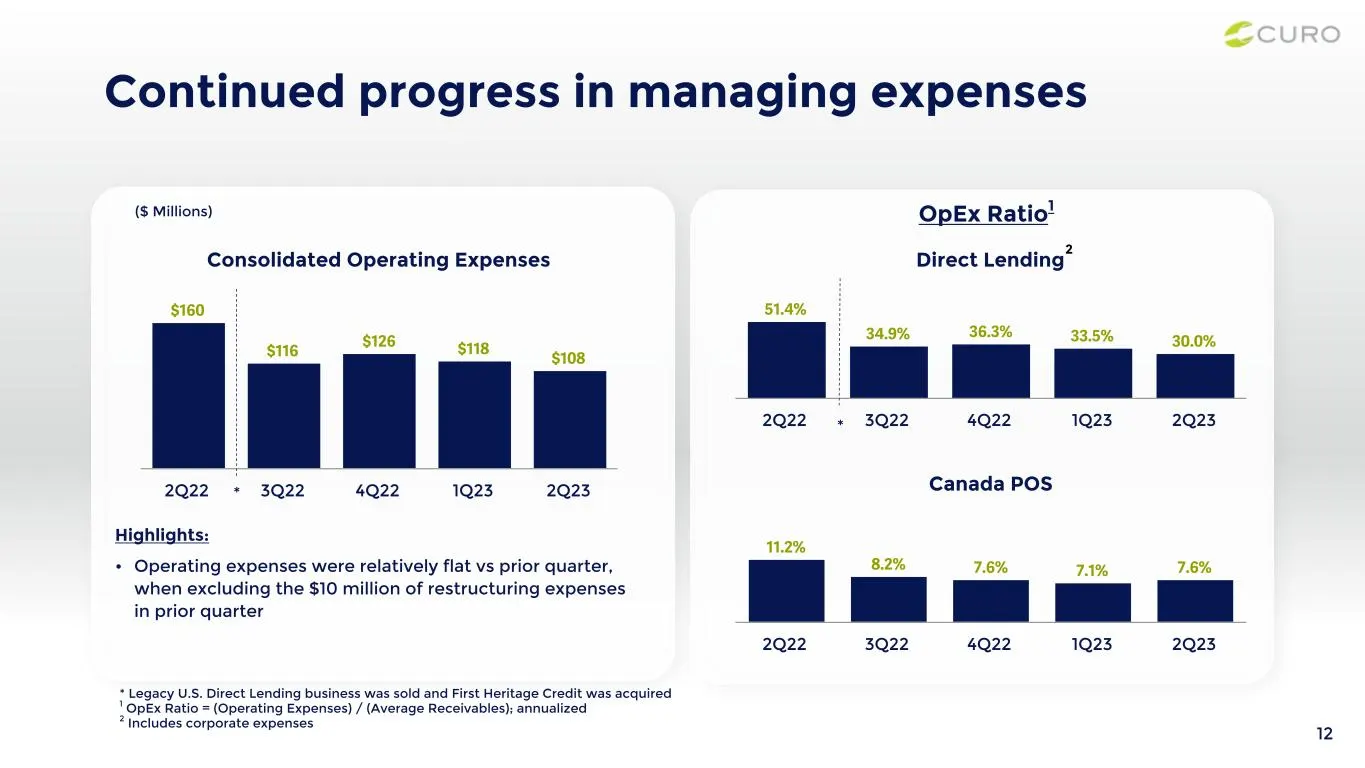
Continued progress in managing expenses Highlights: • Operating expenses were relatively flat vs prior quarter, when excluding the $10 million of restructuring expenses in prior quarter OpEx Ratio1($ Millions) 12 Consolidated Operating Expenses $160 $116 $126 $118 $108 2Q22 3Q22 4Q22 1Q23 2Q23 Direc
Slide 13: Net Leverage & Interest Coverage; Liquidity and Capacity
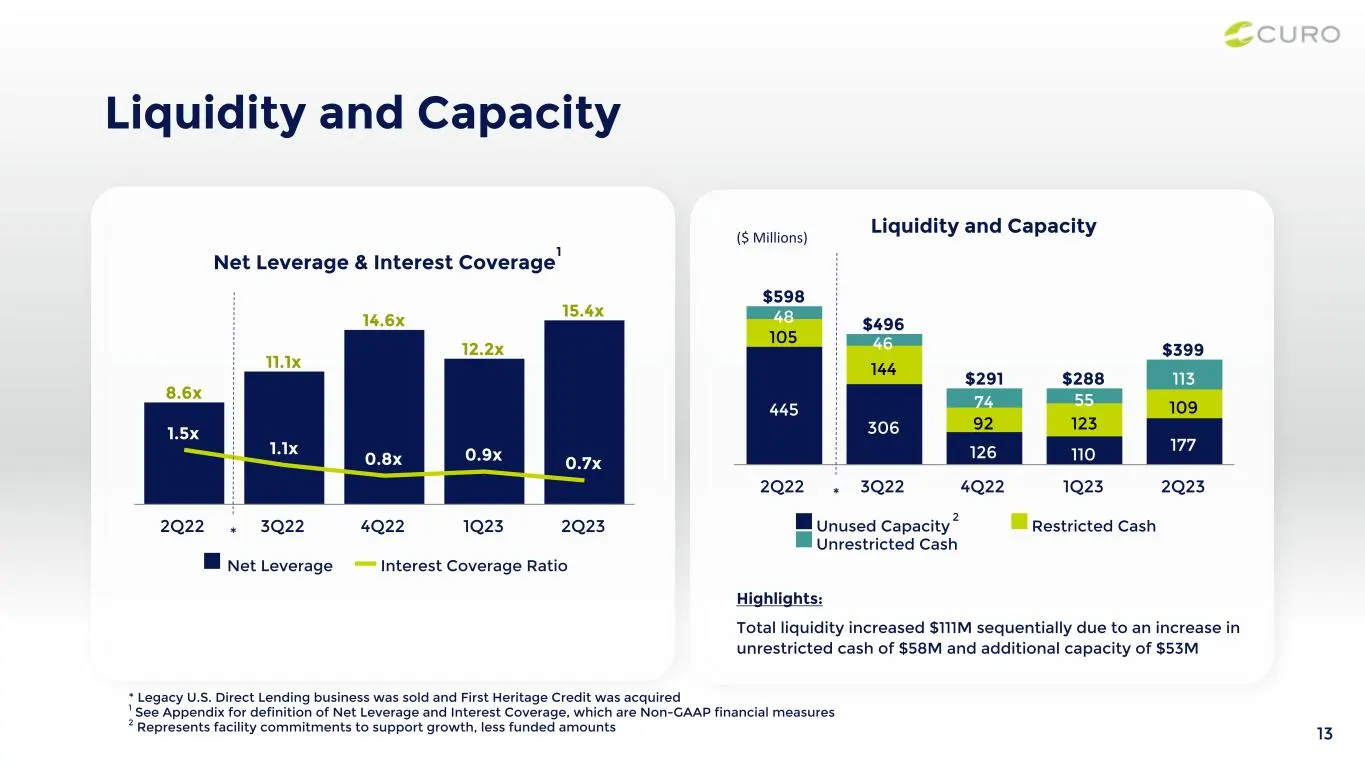
Net Leverage & Interest Coverage 8.6x 11.1x 14.6x 12.2x 15.4x 1.5x 1.1x 0.8x 0.9x 0.7x Net Leverage Interest Coverage Ratio 2Q22 3Q22 4Q22 1Q23 2Q23 Liquidity and Capacity $598 $496 $291 $288 $399 445 306 126 110 177 105 144 92 123 109 48 46 74 55 113 Unused Capacity Restricted Cash Unrestricted Cas
Slide 14: 3Q 2023 Outlook
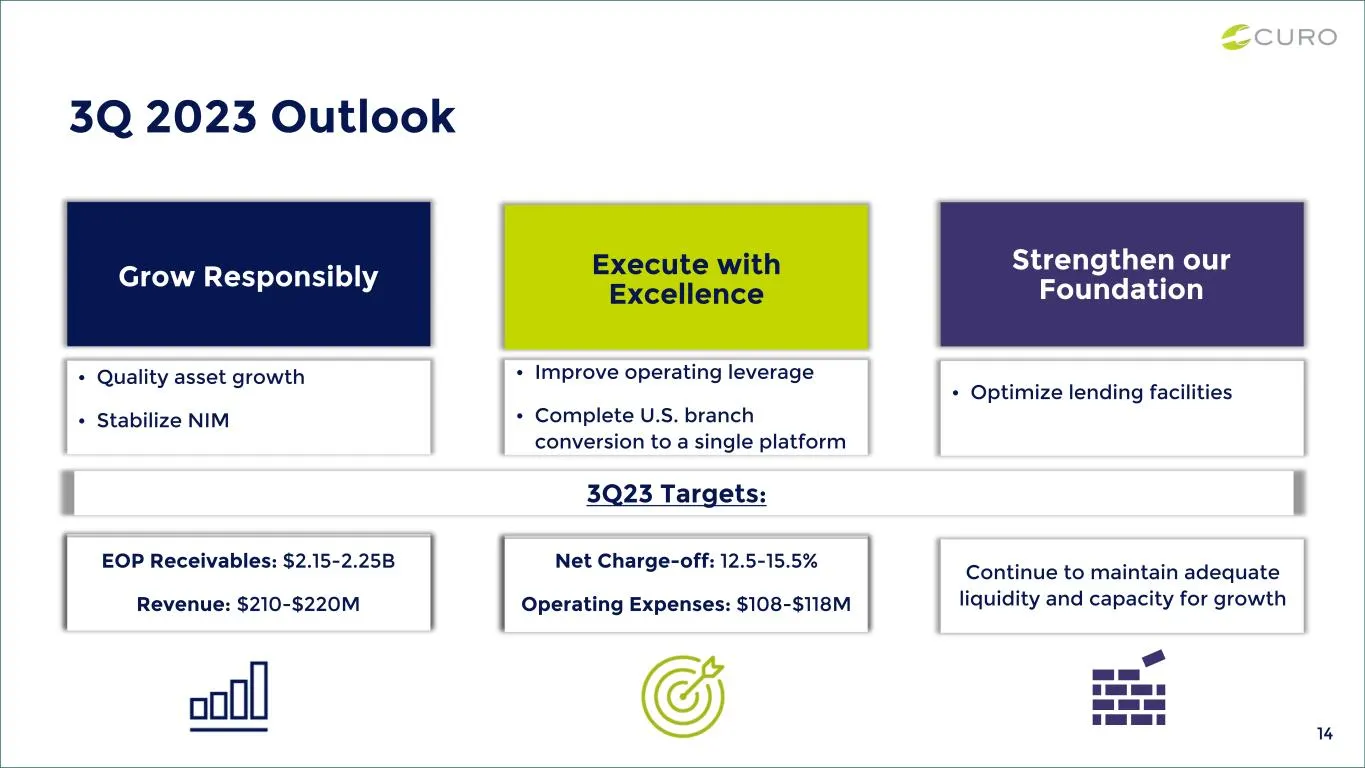
3Q 2023 Outlook Strengthen our Foundation • Optimize lending facilities Execute with Excellence • Improve operating leverage • Complete U.S. branch conversion to a single platform Grow Responsibly • Quality asset growth • Stabilize NIM Receivables: $XX-$XX OpEx Ratio: $XX-$XX Continue to maintain ad

Slide 15: xx = o 2. 2. <
xx 3 = o 2. 2. < 15
Slide 16: Growth framework through-the-cycle
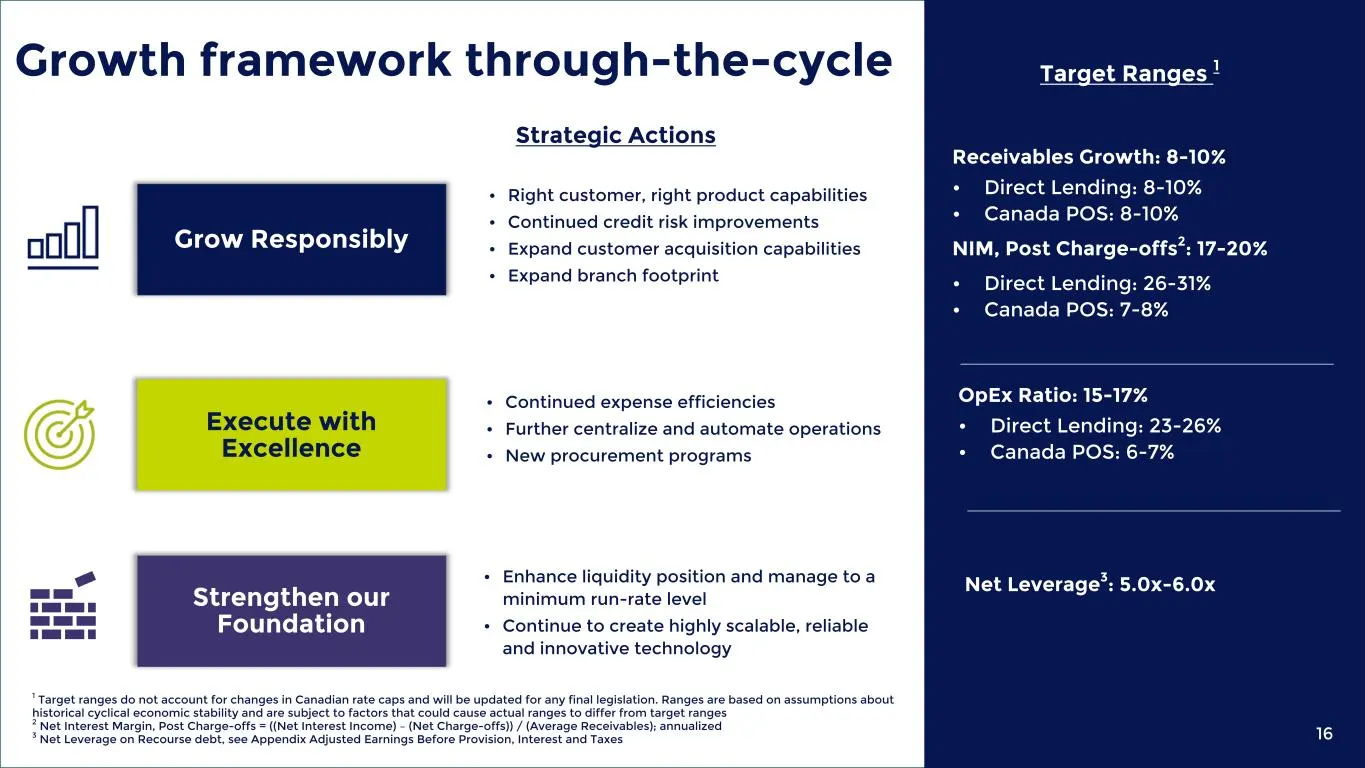
Growth framework through-the-cycle Strengthen our Foundation Execute with Excellence Grow Responsibly Receivables Growth: 8-10% • Direct Lending: 8-10% • Canada POS: 8-10% NIM, Post Charge-offs2: 17-20% • Direct Lending: 26-31% • Canada POS: 7-8% 1 Target ranges do not account for changes in Canadia
Slide 17: Reconciliation of Non-GAAP Metrics: Credit Changes
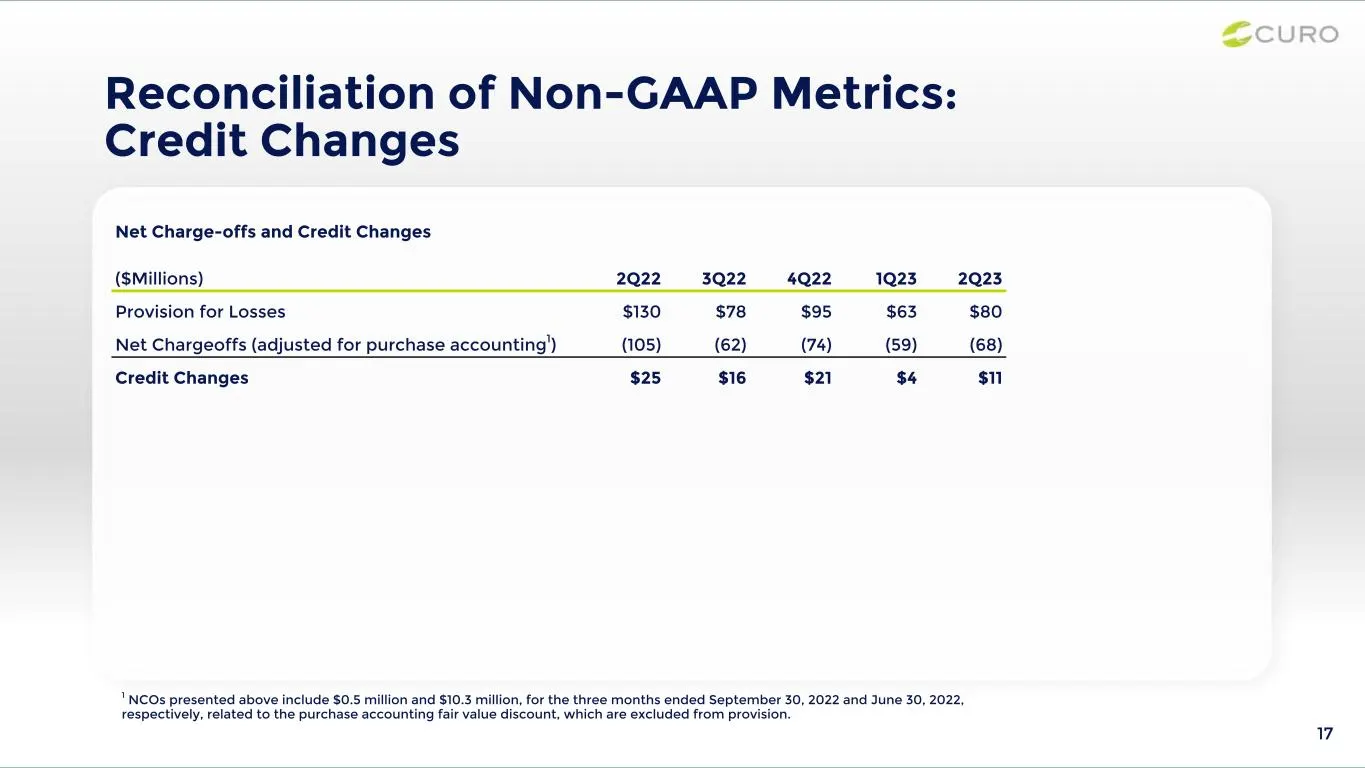
17 Reconciliation of Non-GAAP Metrics: Credit Changes 1 NCOs presented above include $0.5 million and $10.3 million, for the three months ended September 30, 2022 and June 30, 2022, respectively, related to the purchase accounting fair value discount, which are excluded from provision. Net Charge-of
Slide 18: Direct Lending Revenue and Receivables by Geography
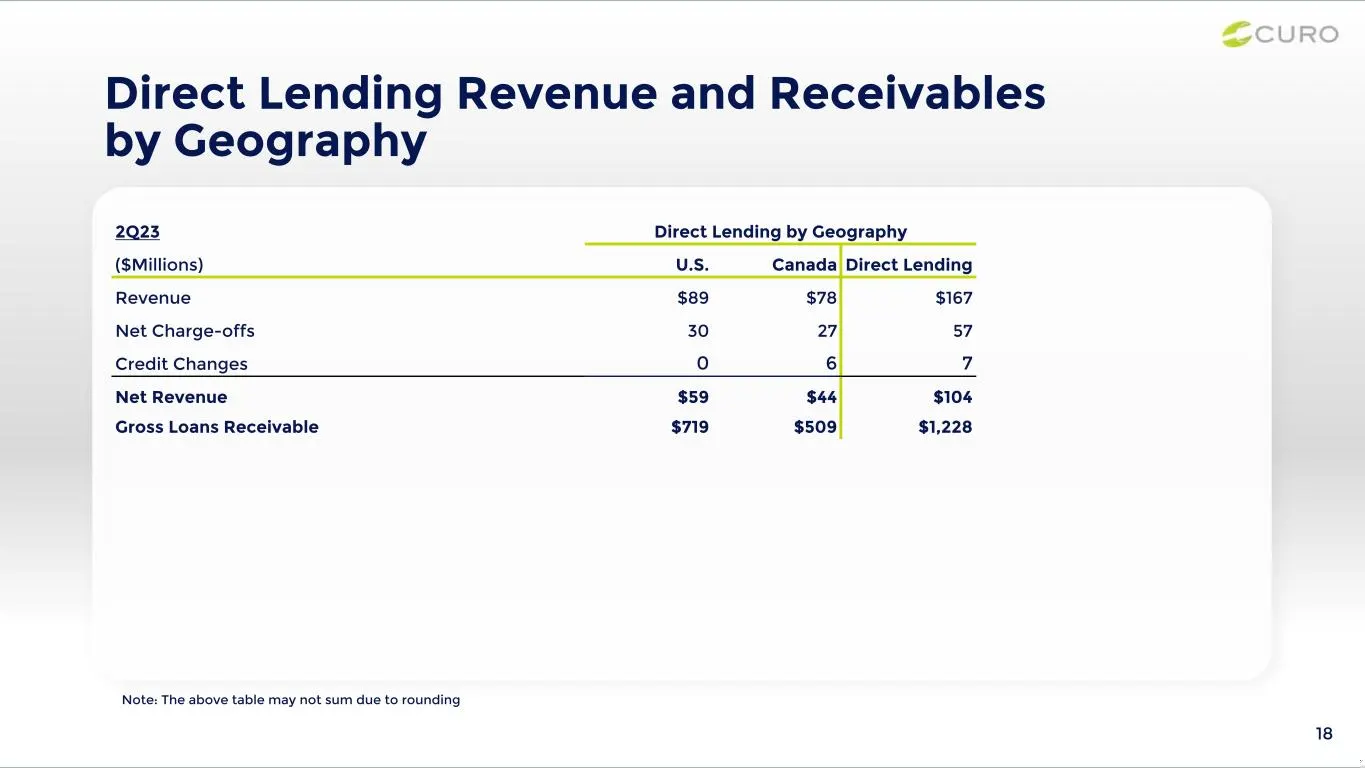
18 Direct Lending Revenue and Receivables by Geography Note: The above table may not sum due to rounding 2Q23 Direct Lending by Geography ($Millions) U.S. Canada Direct Lending Revenue $89 $78 $167 Net Charge-offs 30 27 57 Credit Changes 0 6 7 Net Revenue $59 $44 $104 Gross Loans Receivable $719 $50
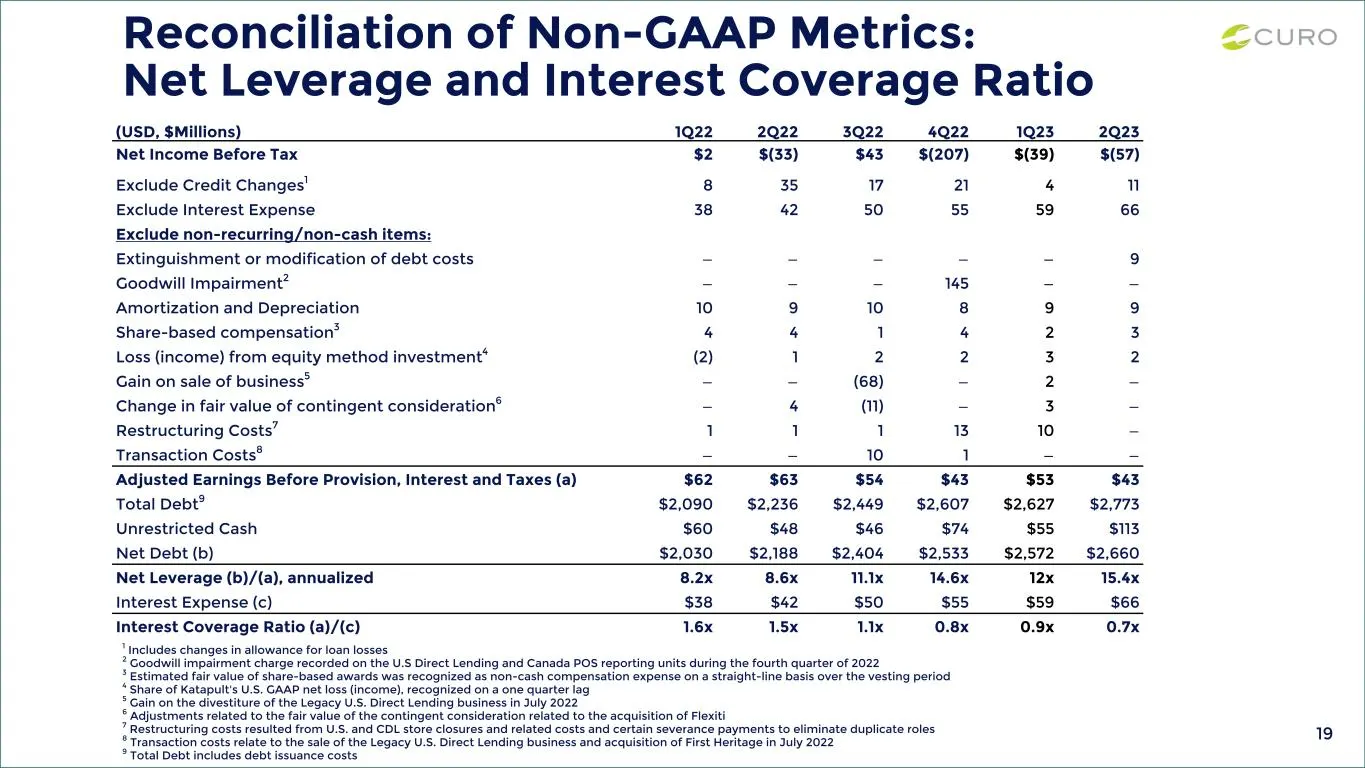
Slide 19: Reconciliation of Non-GAAP Metrics: Net Leverage and Interest Coverage Ratio
19 Reconciliation of Non-GAAP Metrics: Net Leverage and Interest Coverage Ratio 1 Includes changes in allowance for loan losses 2 Goodwill impairment charge recorded on the U.S Direct Lending and Canada POS reporting units during the fourth quarter of 2022 3 Estimated fair value of share-based award
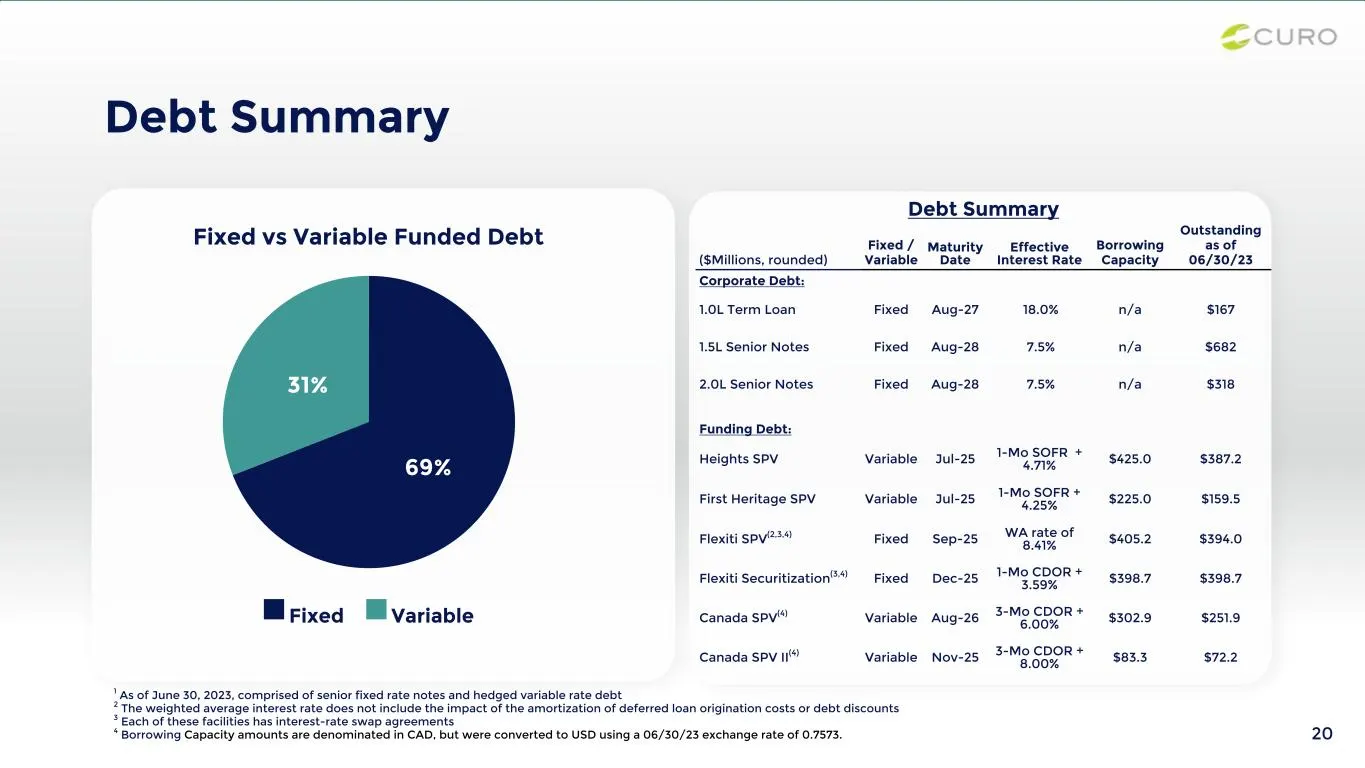
Slide 20: Debt Summary
20 Debt Summary ($Millions, rounded) Fixed / Variable Maturity Date Effective Interest Rate Borrowing Capacity Outstanding as of 06/30/23 Corporate Debt: 1.0L Term Loan Fixed Aug-27 18.0% n/a $167 1.5L Senior Notes Fixed Aug-28 7.5% n/a $682 2.0L Senior Notes Fixed Aug-28 7.5% n/a $318 Funding Debt:

Slide 21
Source: SEC EDGAR · 8-K filed Aug 3, 2023
More decks from Curo Group Holdings Corp
 Q4 2023 Earnings Presentation21 slides · Feb 12, 2024
 Investor Presentation (November 2023)15 slides · Nov 13, 2023
 Q3 2023 Earnings Presentation20 slides · Nov 2, 2023
 Debt Investor Presentation (October 2023)21 slides · Oct 23, 2023
 Investor Presentation (September 2023)15 slides · Sep 25, 2023
 Q1 2023 Earnings Presentation21 slides · May 10, 2023