Wockhardt Limited · NSE:WOCKPHARMA
Wockhardt — Q3 FY2014 Earnings Presentation
23 slides from Wockhardt's earnings presentation, February 2014
Slide 1: Wockhardt Limited Investor Presentation
Wockhardt Limited Investor Presentation By Dr. Murtaza Khorakiwala Managing Director Feb 2014
Slide 2: Safe Harbor Statement
Safe Harbor Statement • Except for historical information contained herein, statements in this communication, which include words or phrases such as “will”, “aim”, “will likely result”, “would”, “believe”, “may”, “expect”, “will continue”, “anticipate”, “estimate”, “intend”, “plan”, “contemplate”, “
Slide 3: Introduction to Wockhardt
Introduction to Wockhardt Key Business Dynamics
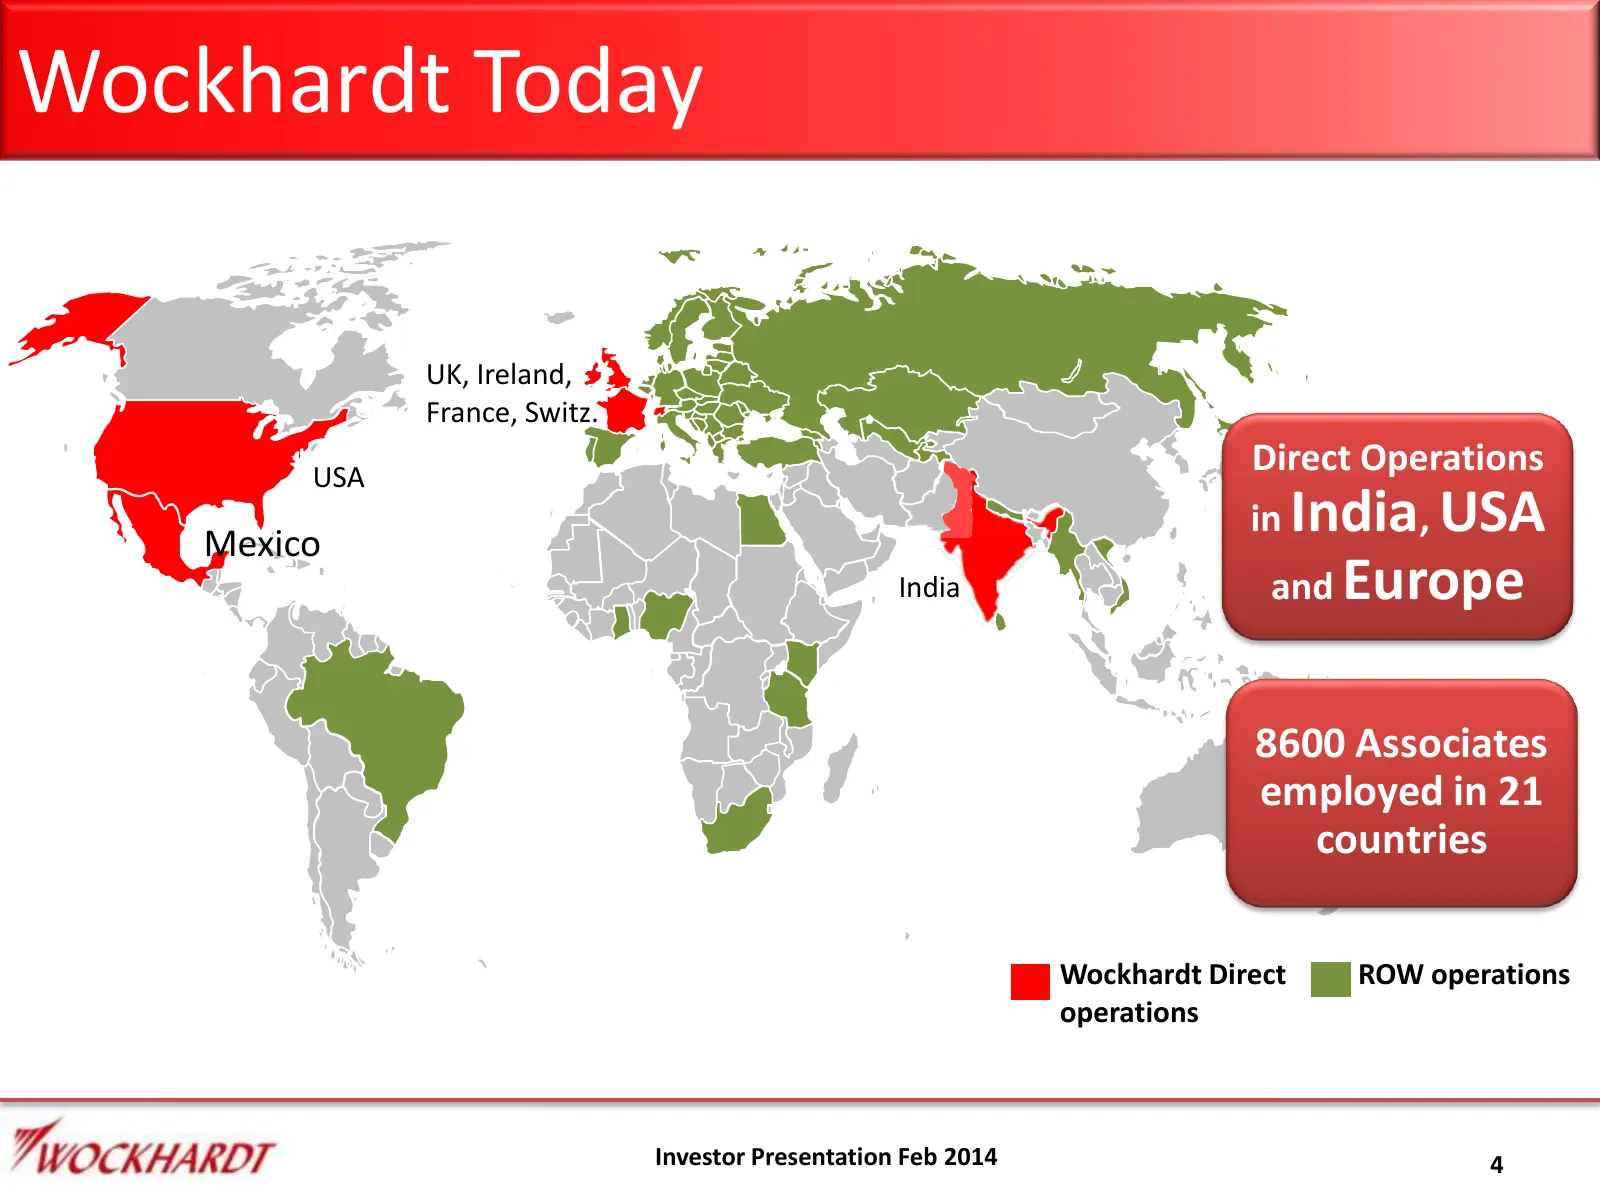
Slide 4: Wockhardt Today
Wockhardt Today UK, Ireland, France, Switz. USA Direct Operations in India, USA Mexico India and Europe 8600 Associates employed in 21 countries Wockhardt Direct ROW operations operations Investor Presentation Feb 2014 4
Slide 5: Wockhardt Today
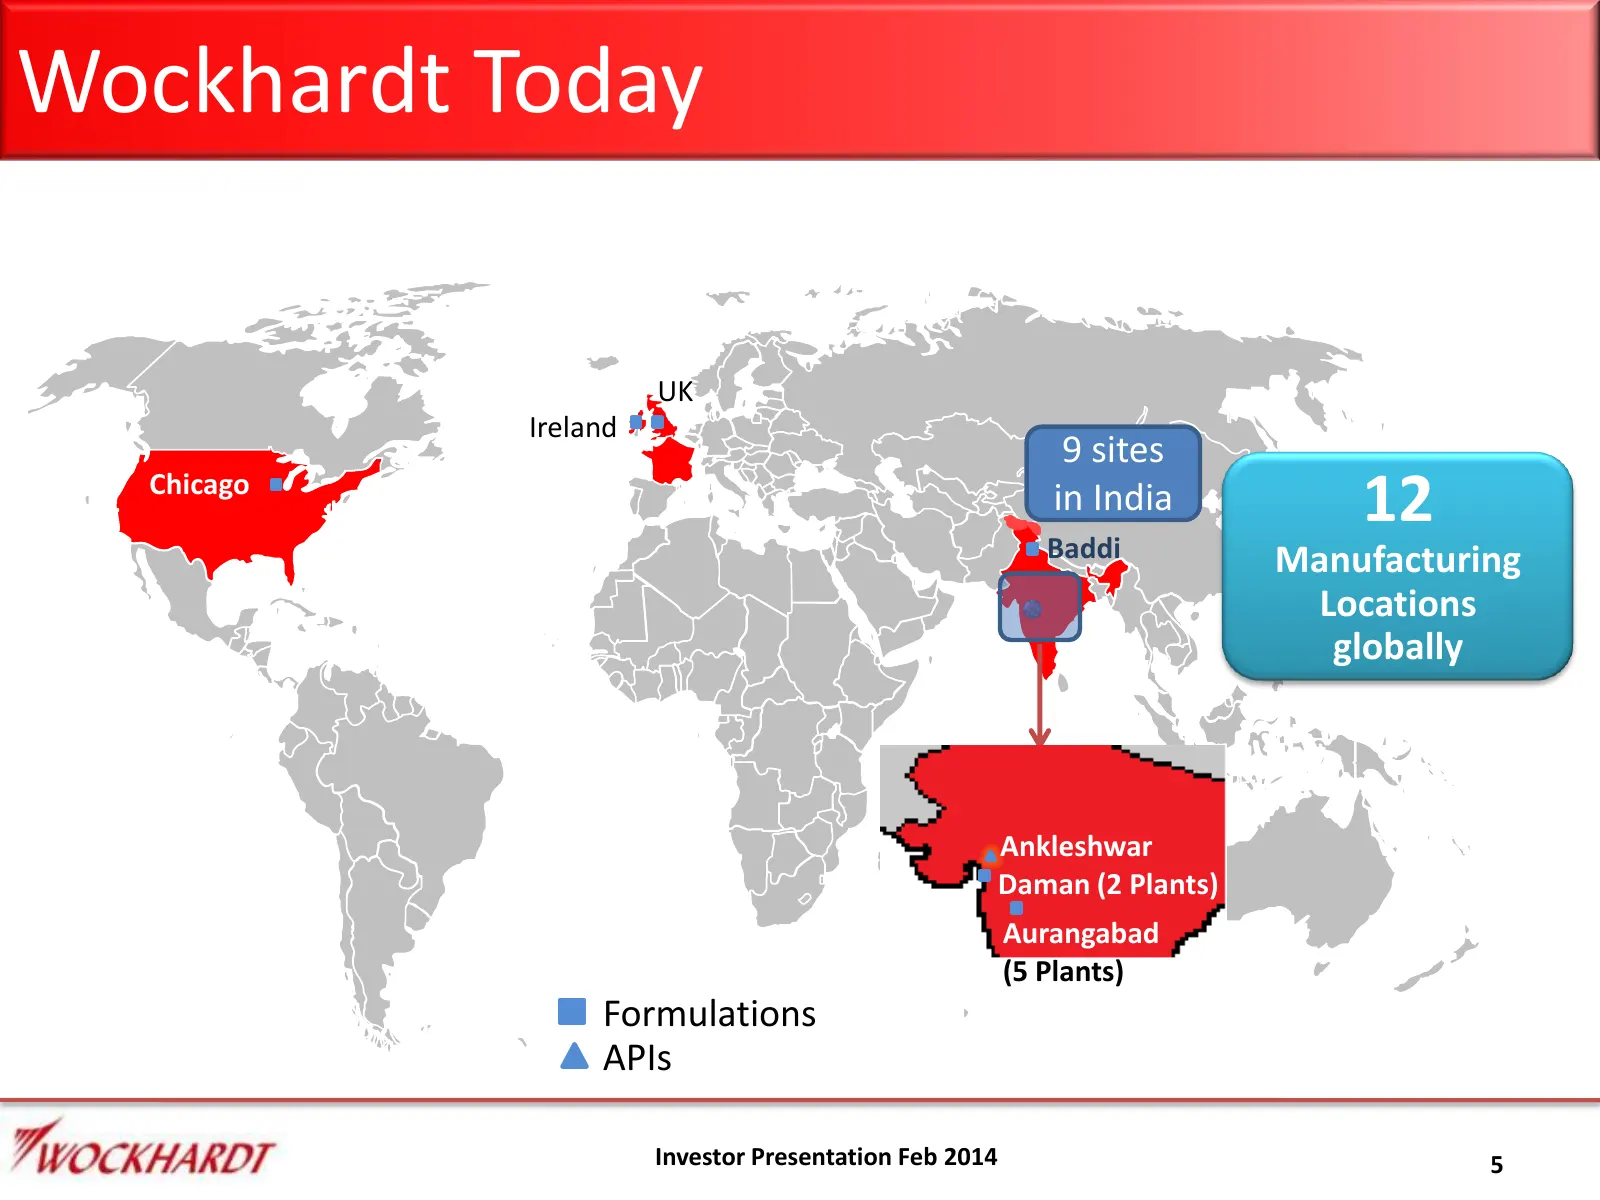
Wockhardt Today UK Ireland 9 sites Chicago in India 12 Baddi Manufacturing Locations globally Ankleshwar Daman (2 Plants) Aurangabad (5 Plants) Formulations APIs Investor Presentation Feb 2014 5
Slide 6: Wockhardt Today R&D Centers
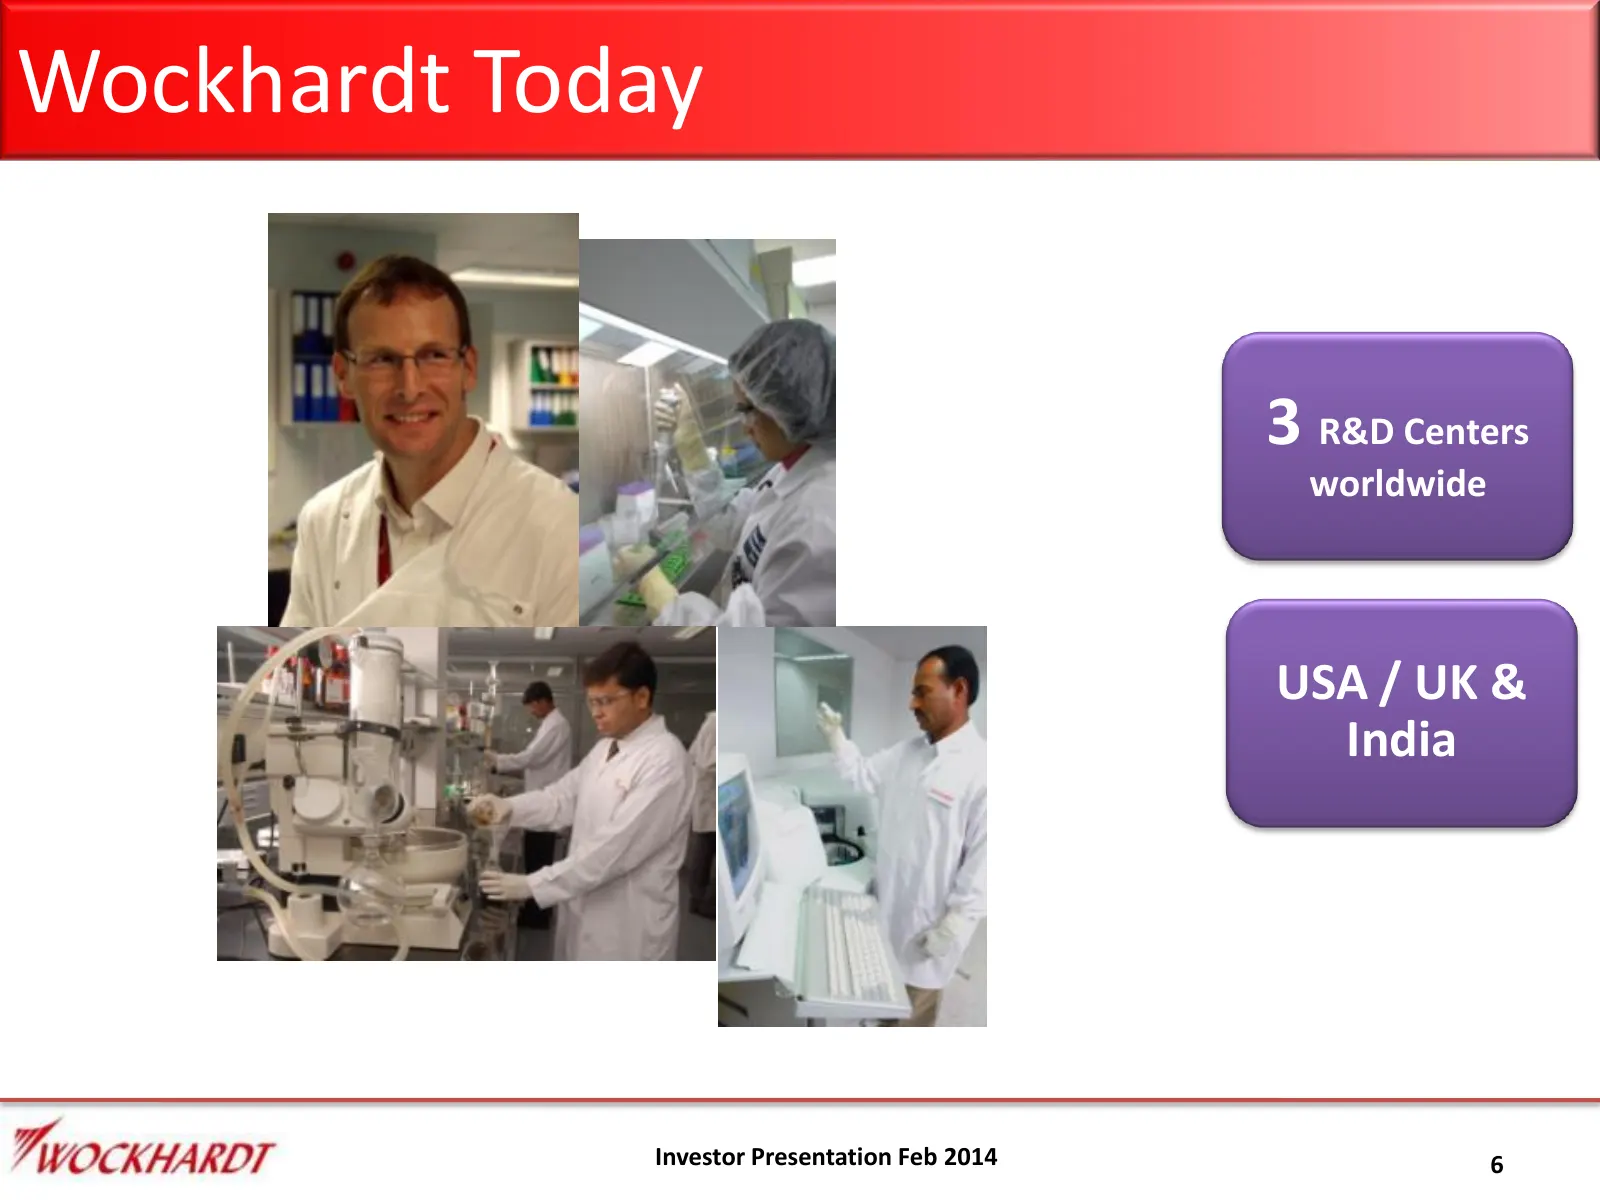
Wockhardt Today 3 R&D Centers worldwide USA / UK & India Investor Presentation Feb 2014 6
Slide 7: Update on Recent Events
Update on Recent Events TWOCKHARDT
Slide 8: Regulatory Inspections
Regulatory Inspections TWOCKHARDT
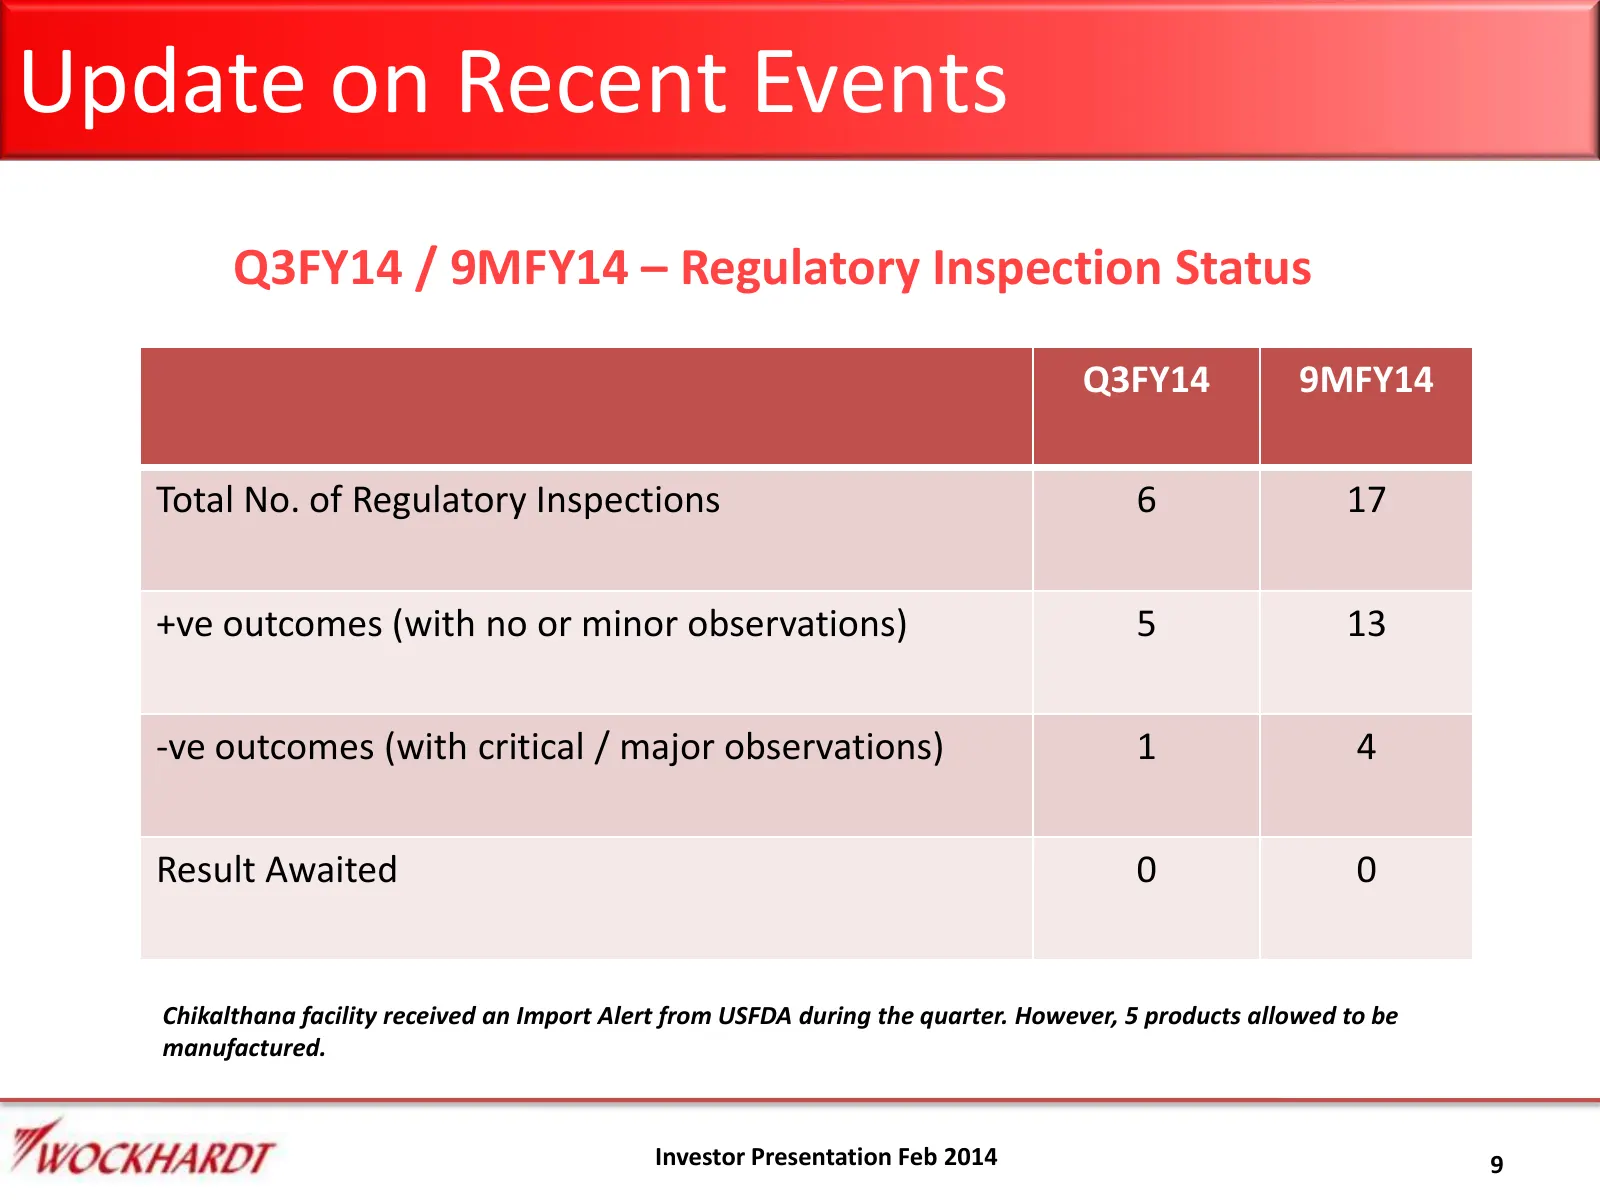
Slide 9: Q3FY14 / 9MFY14 Regulatory Inspection Status
Update on Recent Events Q3FY14 / 9MFY14 – Regulatory Inspection Status Q3FY14 9MFY14 Total No. of Regulatory Inspections 6 17 +ve outcomes (with no or minor observations) 5 13 -ve outcomes (with critical / major observations) 1 4 Result Awaited 0 0 Chikalthana facility received an Import Alert from
Slide 10: Q3FY14 Results
Q3FY14 Results TWOCKHARDT
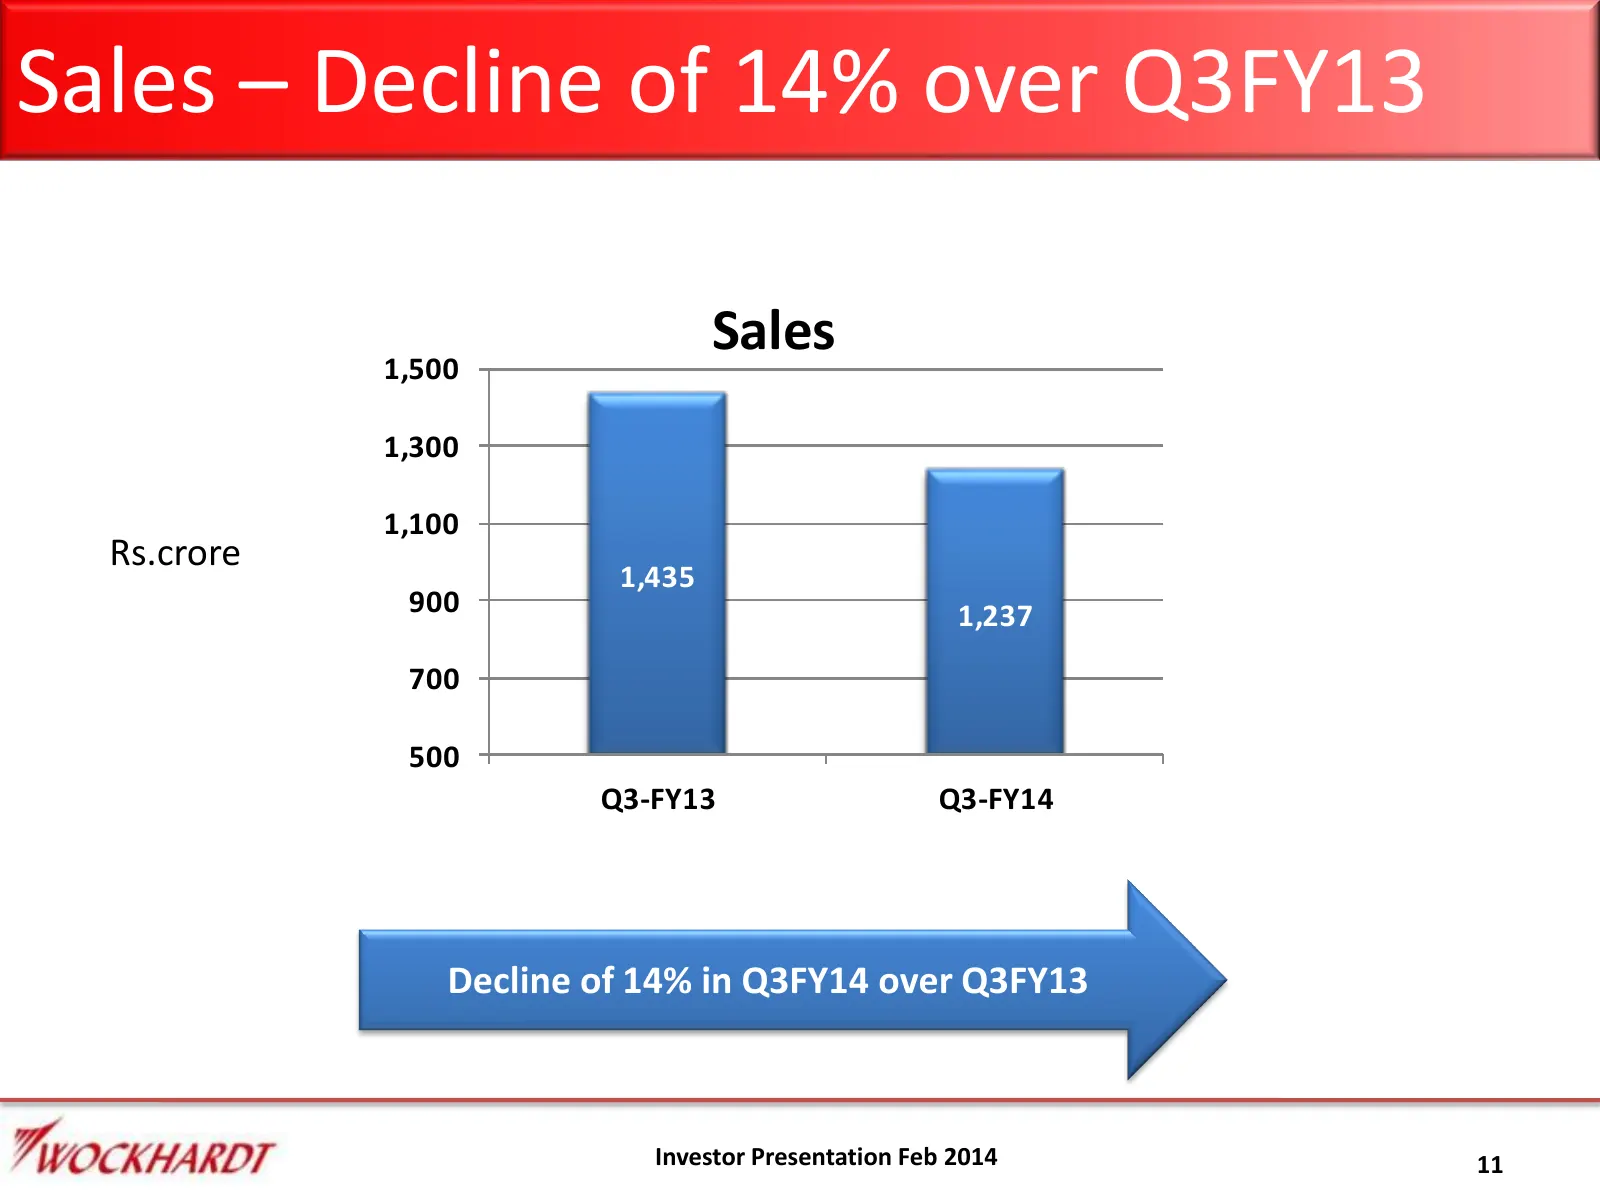
Slide 11: Sales – Decline of 14% over Q3FY13
Sales – Decline of 14% over Q3FY13 Sales 1,500 1,300 1,100 Rs.crore 1,435 900 1,237 700 500 Q3-FY13 Q3-FY14 Decline of 14% in Q3FY14 over Q3FY13 Investor Presentation Feb 2014 11
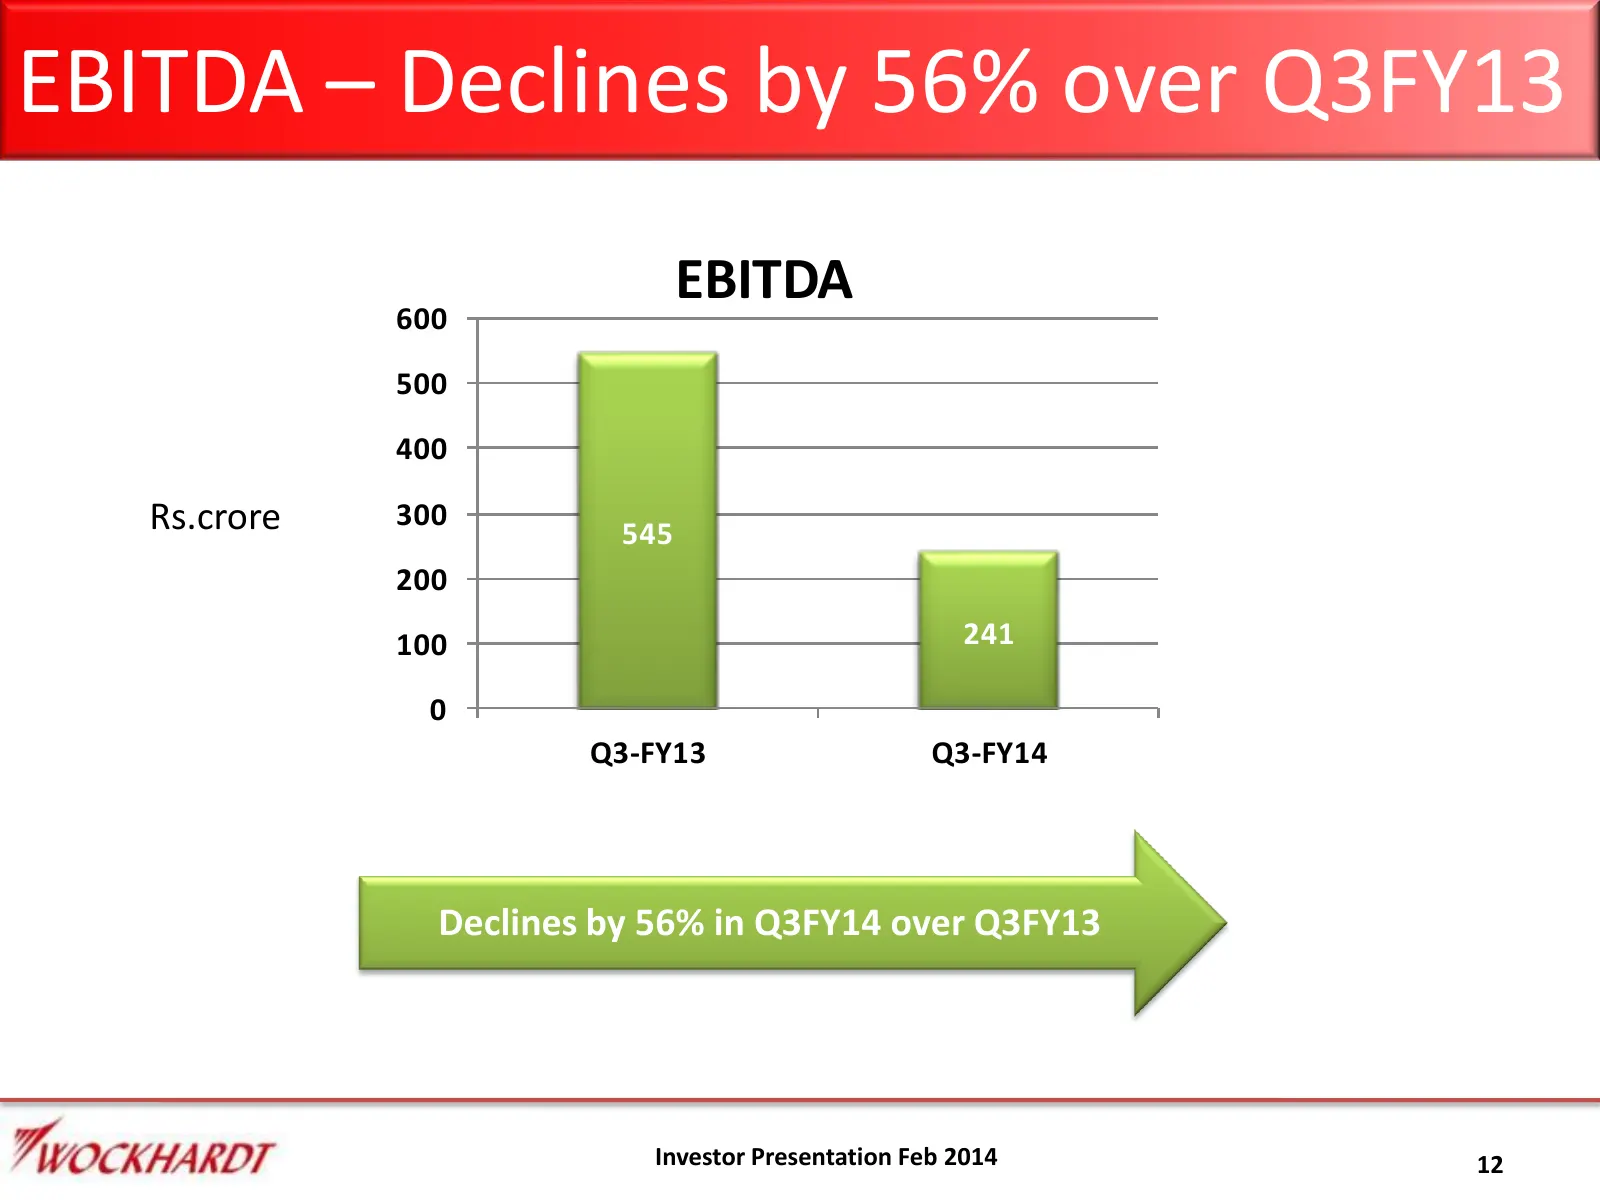
Slide 12: EBITDA – Declines by 56% over Q3FY13
EBITDA – Declines by 56% over Q3FY13 EBITDA 600 500 400 Rs.crore 300 545 200 100 241 0 Q3-FY13 Q3-FY14 Declines by 56% in Q3FY14 over Q3FY13 Investor Presentation Feb 2014 12
Slide 13: Adj. PAT – Declines by 40%
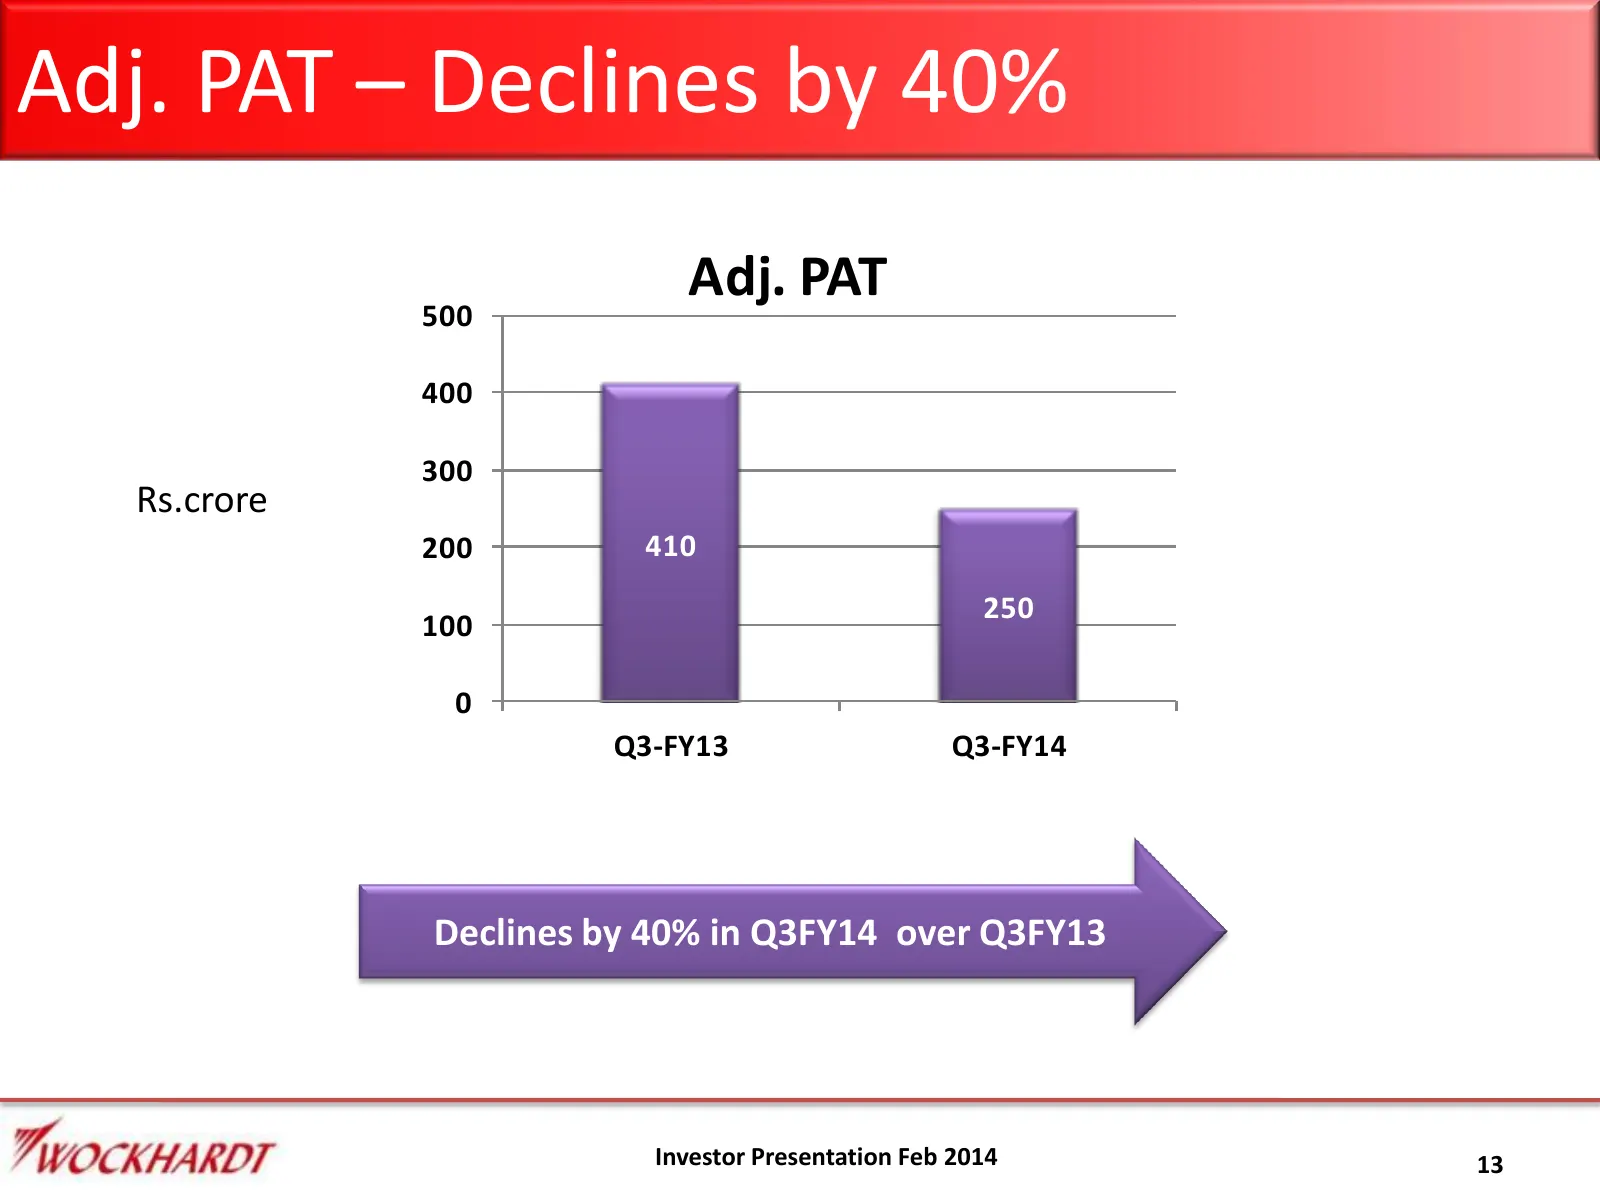
Adj. PAT – Declines by 40% Adj. PAT 500 400 300 Rs.crore 200 410 250 100 0 Q3-FY13 Q3-FY14 Declines by 40% in Q3FY14 over Q3FY13 Investor Presentation Feb 2014 13
Slide 14: Research – 9.2% of Sales
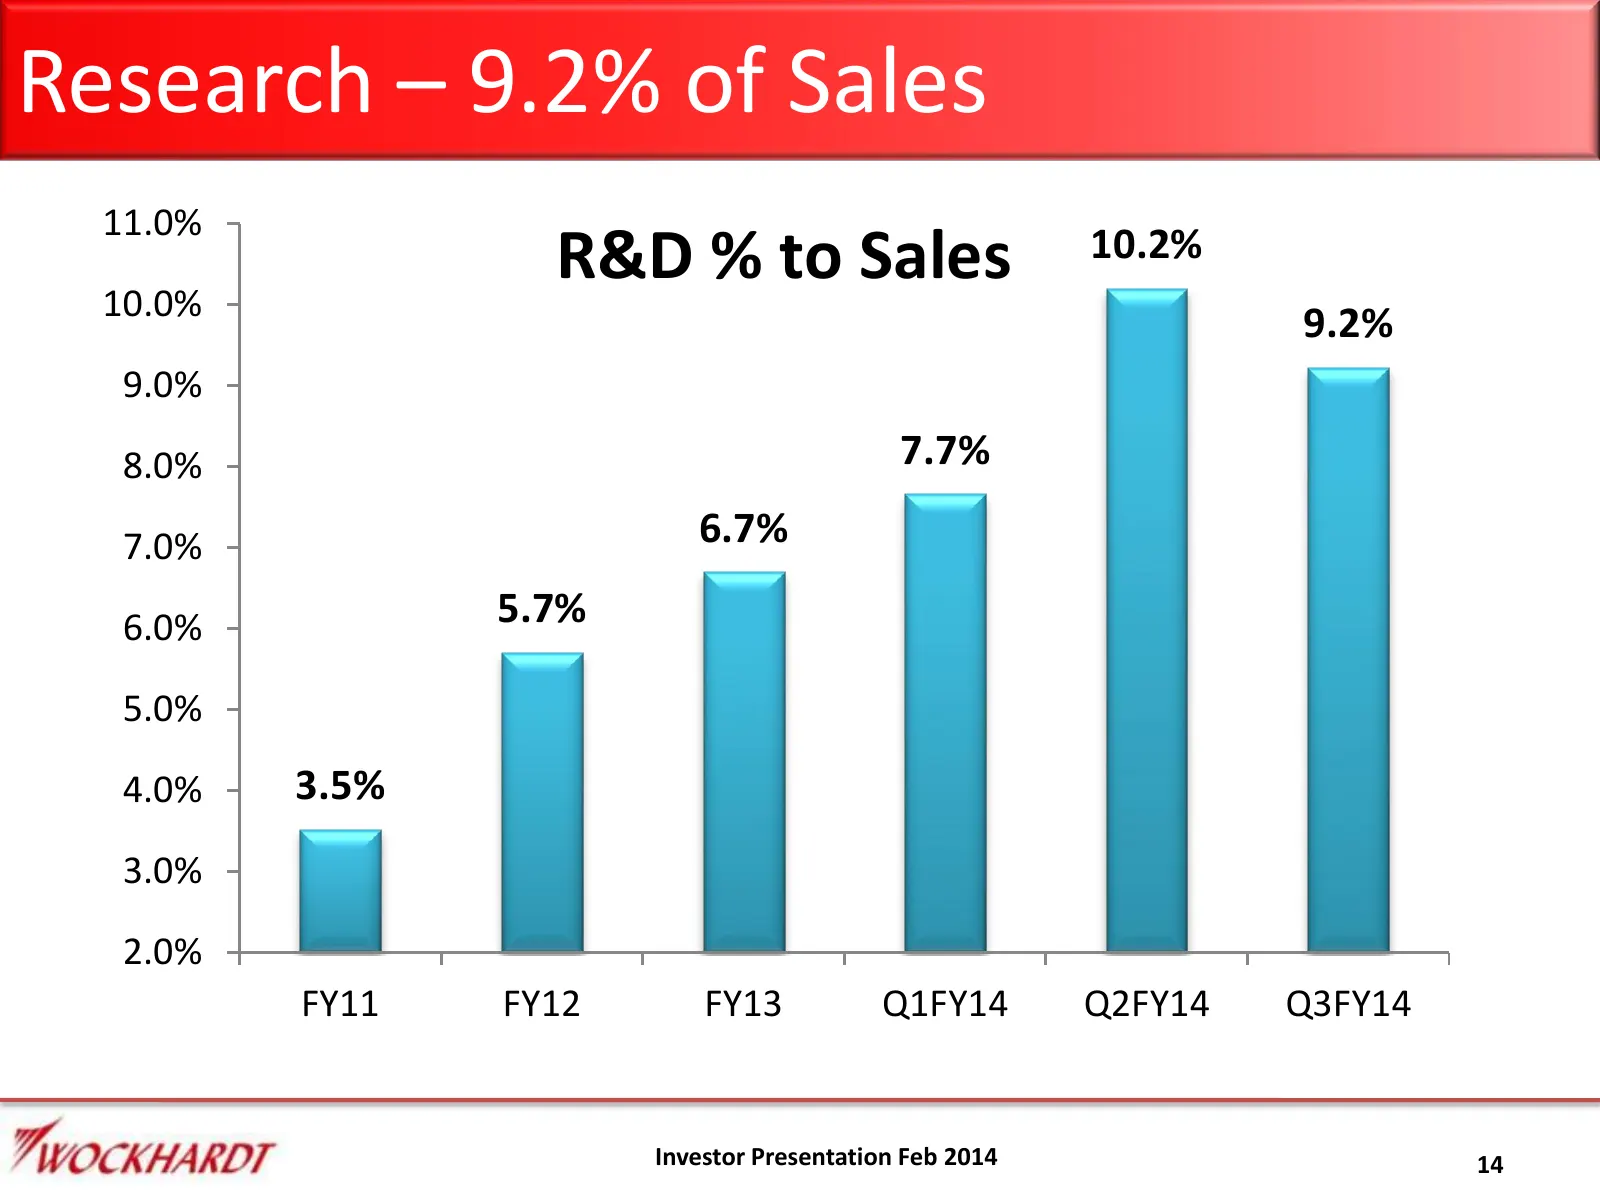
Research – 9.2% of Sales 11.0% R&D % to Sales 10.2% 10.0% 9.2% 9.0% 8.0% 7.7% 7.0% 6.7% 6.0% 5.7% 5.0% 4.0% 3.5% 3.0% 2.0% FY11 FY12 FY13 Q1FY14 Q2FY14 Q3FY14 Investor Presentation Feb 2014 14
Slide 15: 9MFY14 Results
OMFY14 Results TWOCKHARDT
Slide 16: Sales – Decline of 8% over 9MFY13
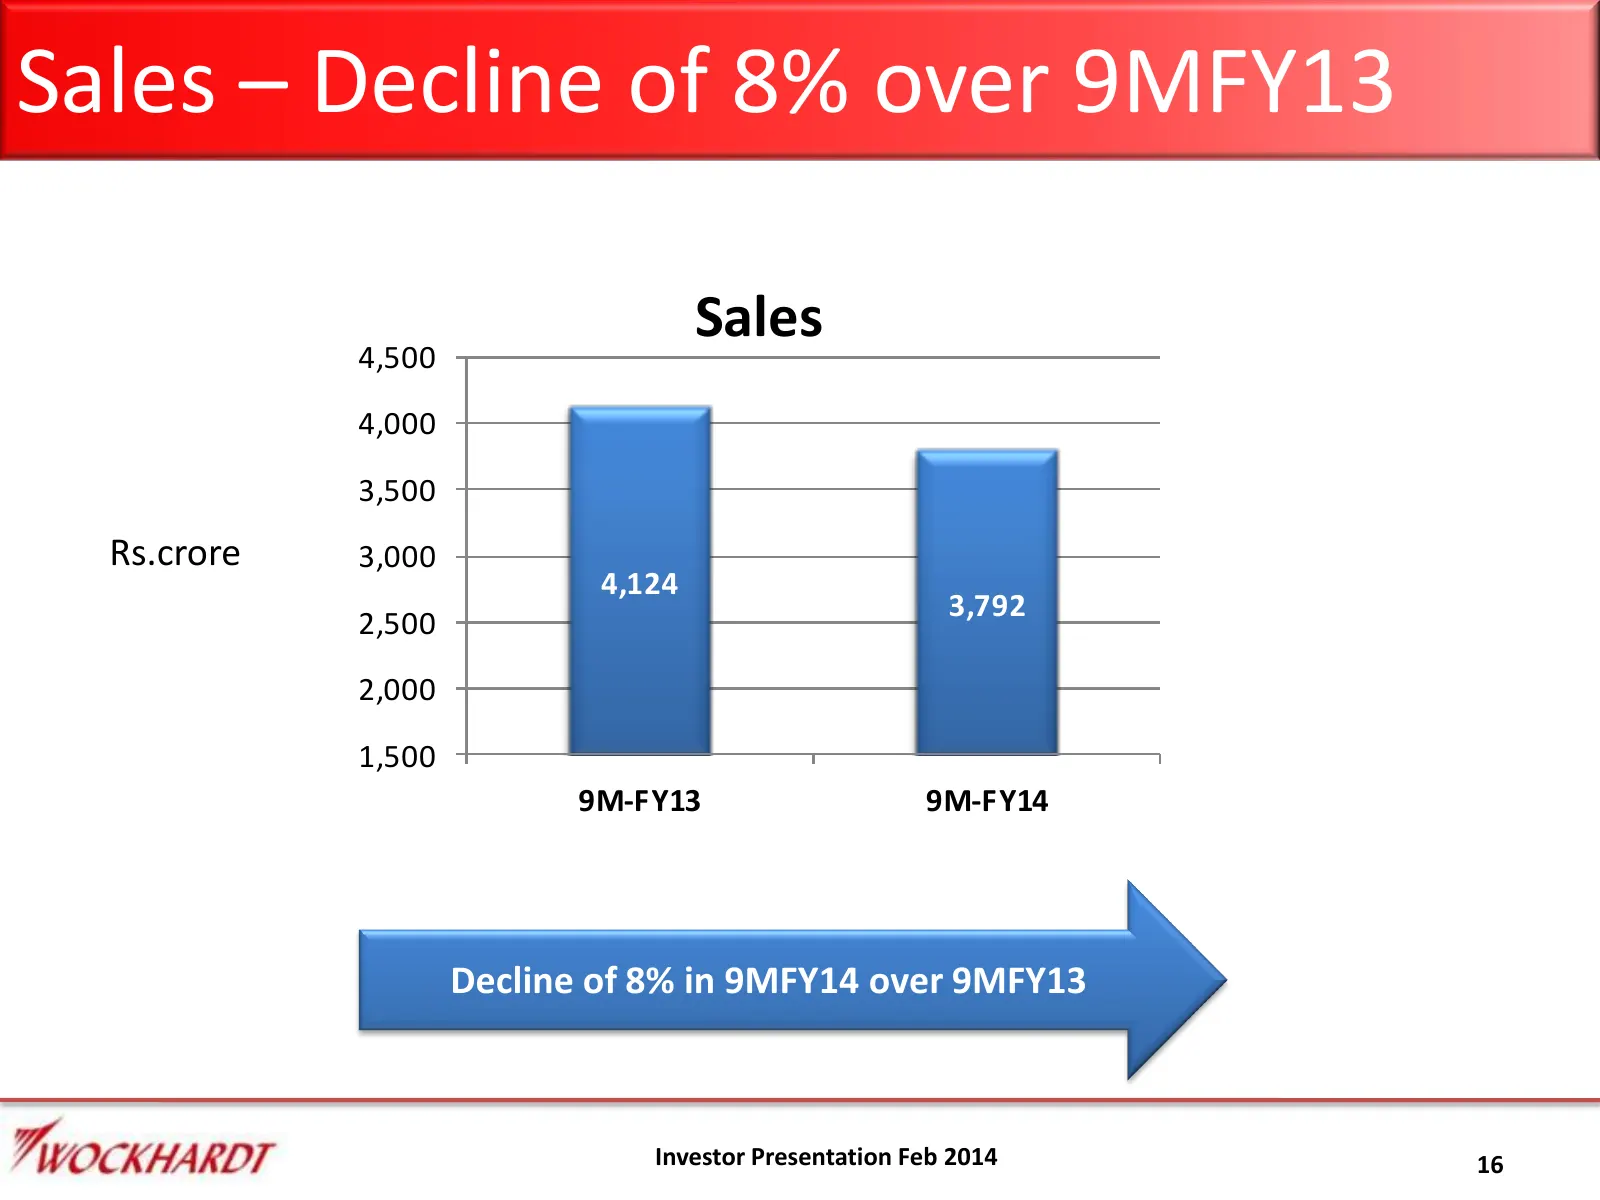
Sales – Decline of 8% over 9MFY13 Sales 4,500 4,000 3,500 Rs.crore 3,000 4,124 3,792 2,500 2,000 1,500 9M-FY13 9M-FY14 Decline of 8% in 9MFY14 over 9MFY13 Investor Presentation Feb 2014 16
Slide 17: EBITDA – Declines by 43% over 9MFY13
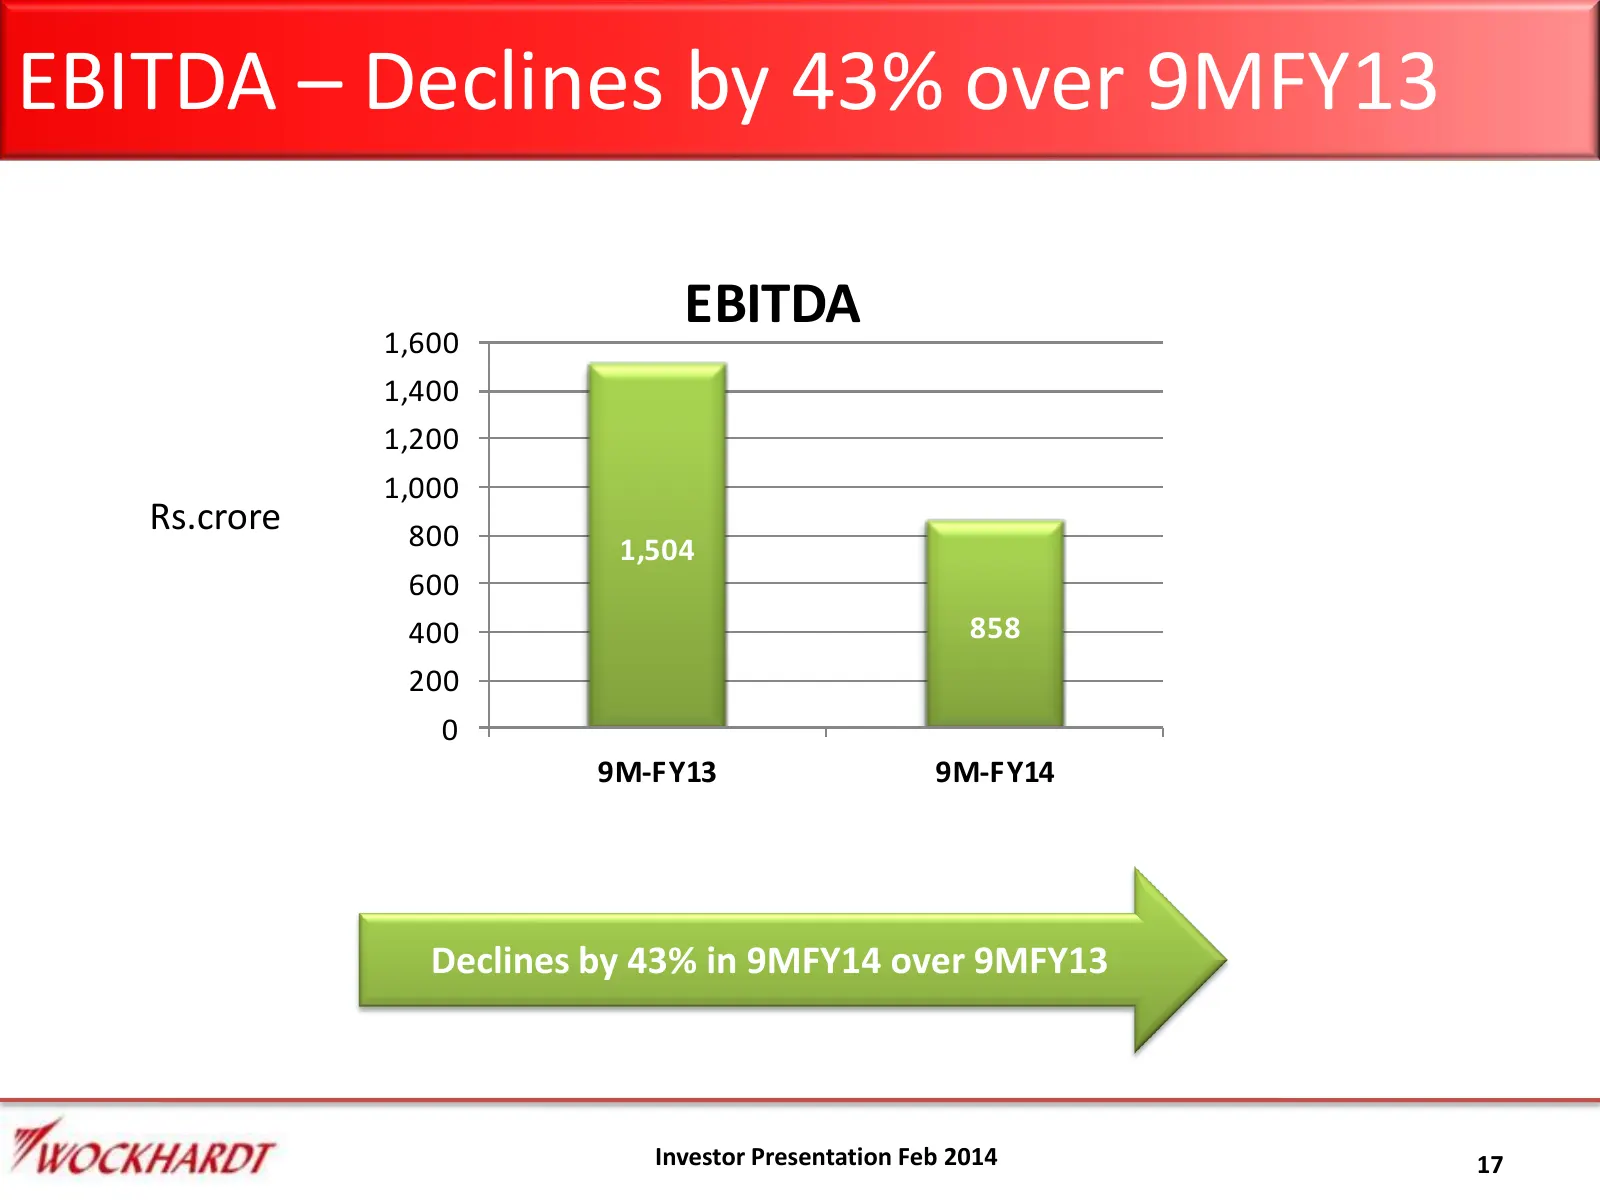
EBITDA – Declines by 43% over 9MFY13 EBITDA 1,600 1,400 1,200 1,000 Rs.crore 800 1,504 600 400 858 200 0 9M-FY13 9M-FY14 Declines by 43% in 9MFY14 over 9MFY13 Investor Presentation Feb 2014 17
Slide 18: Adj. PAT – Declines by 40%
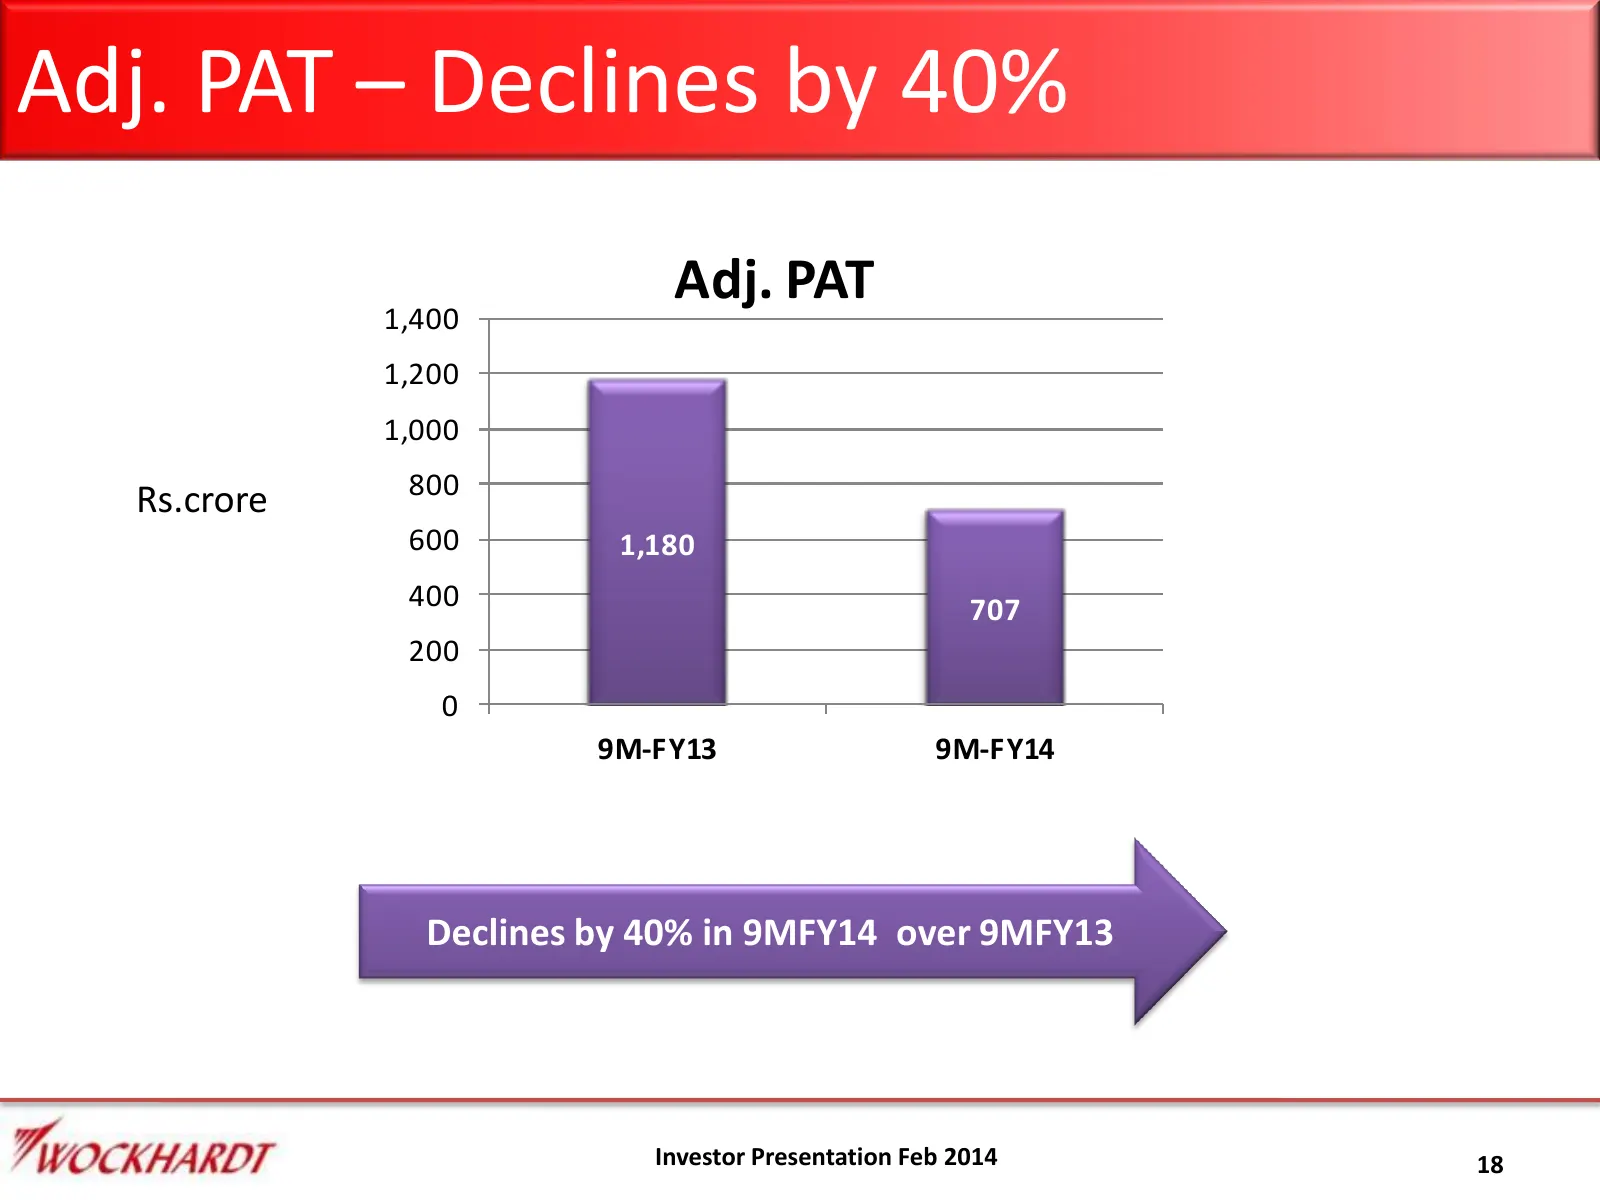
Adj. PAT – Declines by 40% Adj. PAT 1,400 1,200 1,000 800 Rs.crore 600 1,180 400 707 200 0 9M-FY13 9M-FY14 Declines by 40% in 9MFY14 over 9MFY13 Investor Presentation Feb 2014 18
Slide 19: Key Financial Highlights
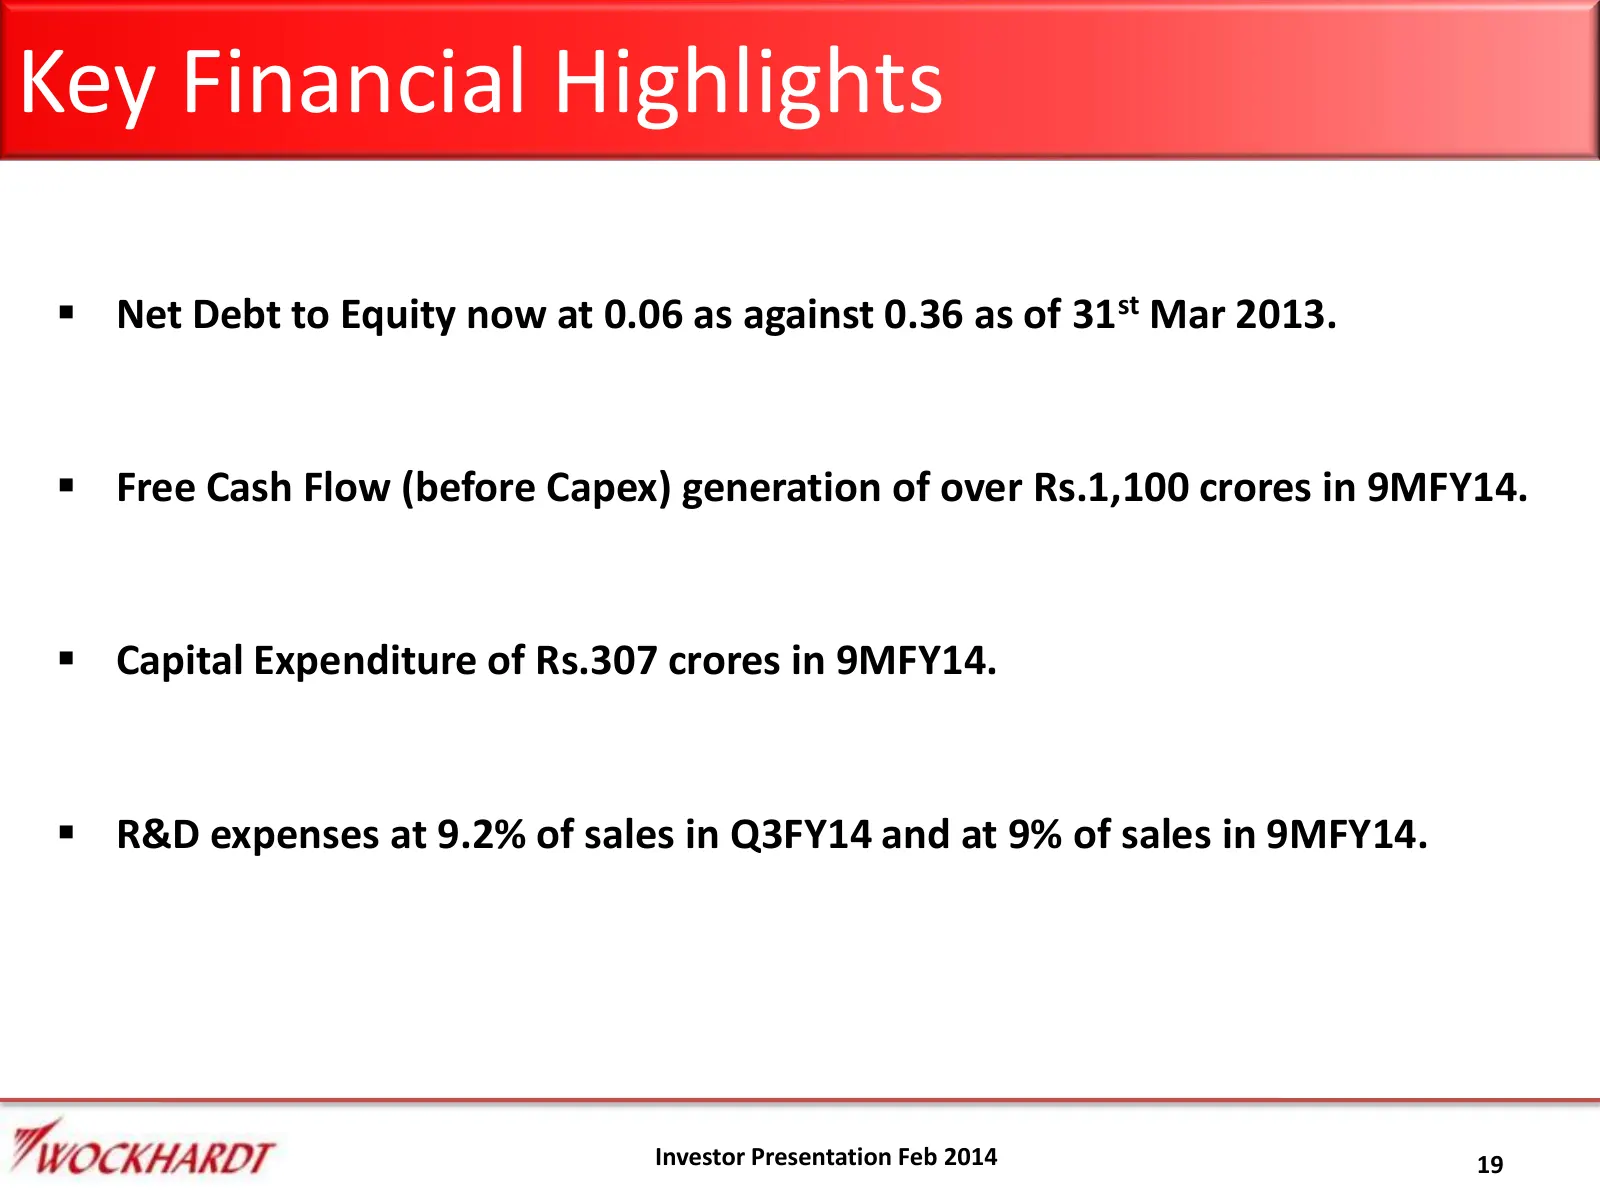
Key Financial Highlights Net Debt to Equity now at 0.06 as against 0.36 as of 31st Mar 2013. Free Cash Flow (before Capex) generation of over Rs.1,100 crores in 9MFY14. Capital Expenditure of Rs.307 crores in 9MFY14. R&D expenses at 9.2% of sales in Q3FY14 and at 9% of sales in 9MFY14. Inves
Slide 20: US Business
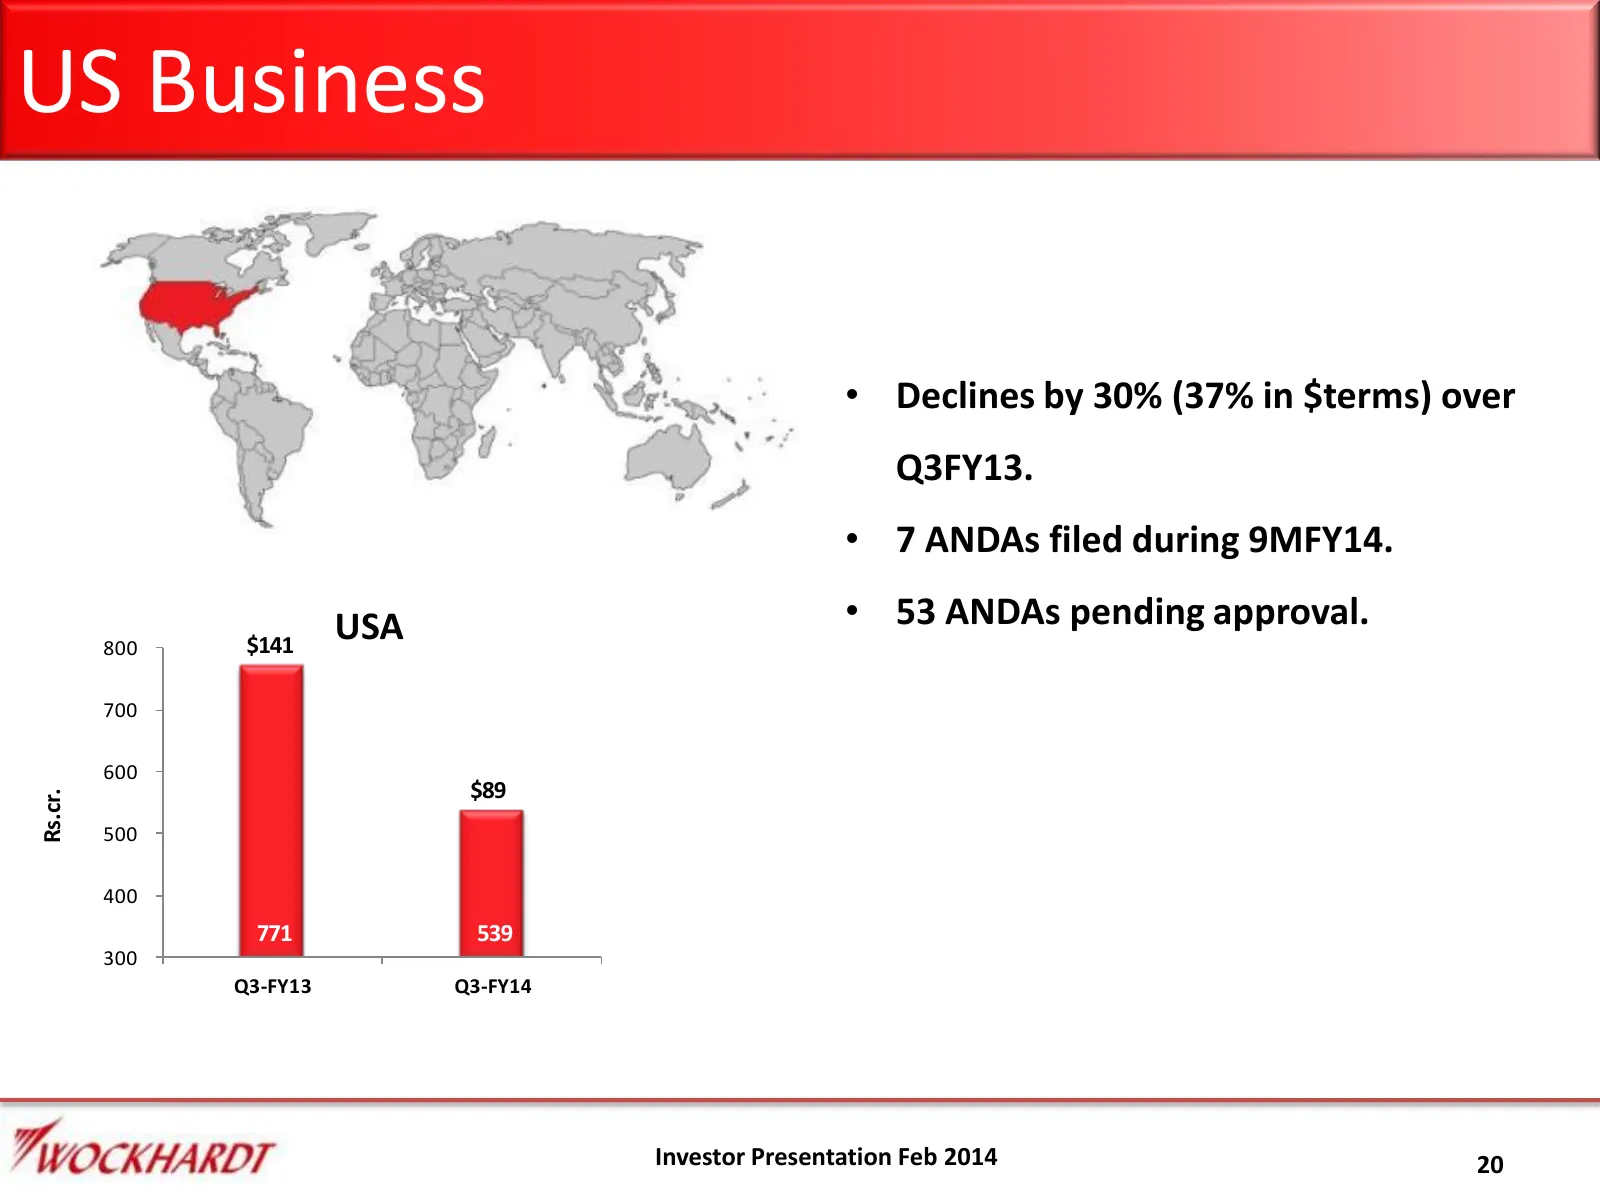
US Business • Declines by 30% (37% in $terms) over Q3FY13. • 7 ANDAs filed during 9MFY14. USA • 53 ANDAs pending approval. 800 $141 700 600 $89 Rs.cr. 500 400 771 539 300 Q3-FY13 Q3-FY14 Investor Presentation Feb 2014 20
Slide 21: EU Operations
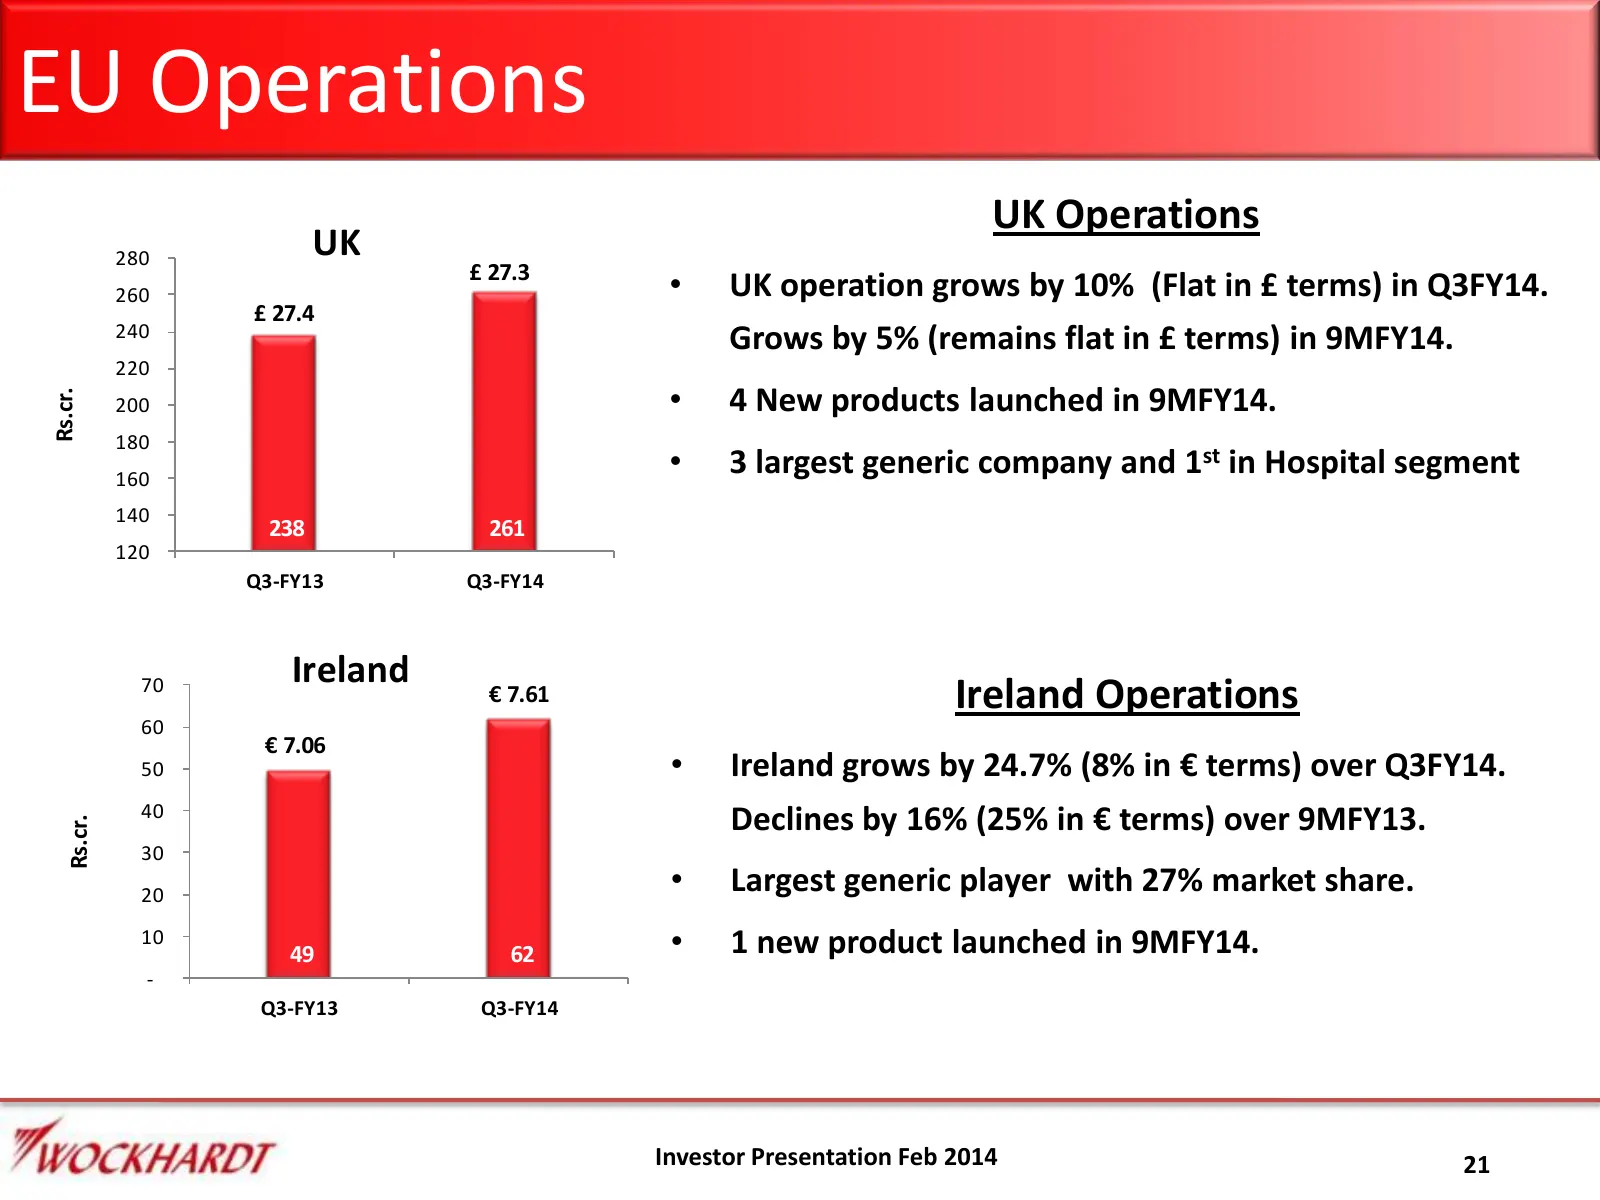
EU Operations UK Operations 280 UK £ 27.3 260 • UK operation grows by 10% (Flat in £ terms) in Q3FY14. £ 27.4 240 Grows by 5% (remains flat in £ terms) in 9MFY14. 220 • 4 New products launched in 9MFY14. Rs.cr. 200 180 160 • 3 largest generic company and 1st in Hospital segment 140 238 261 120 Q3-FY
Slide 22: Emerging Markets
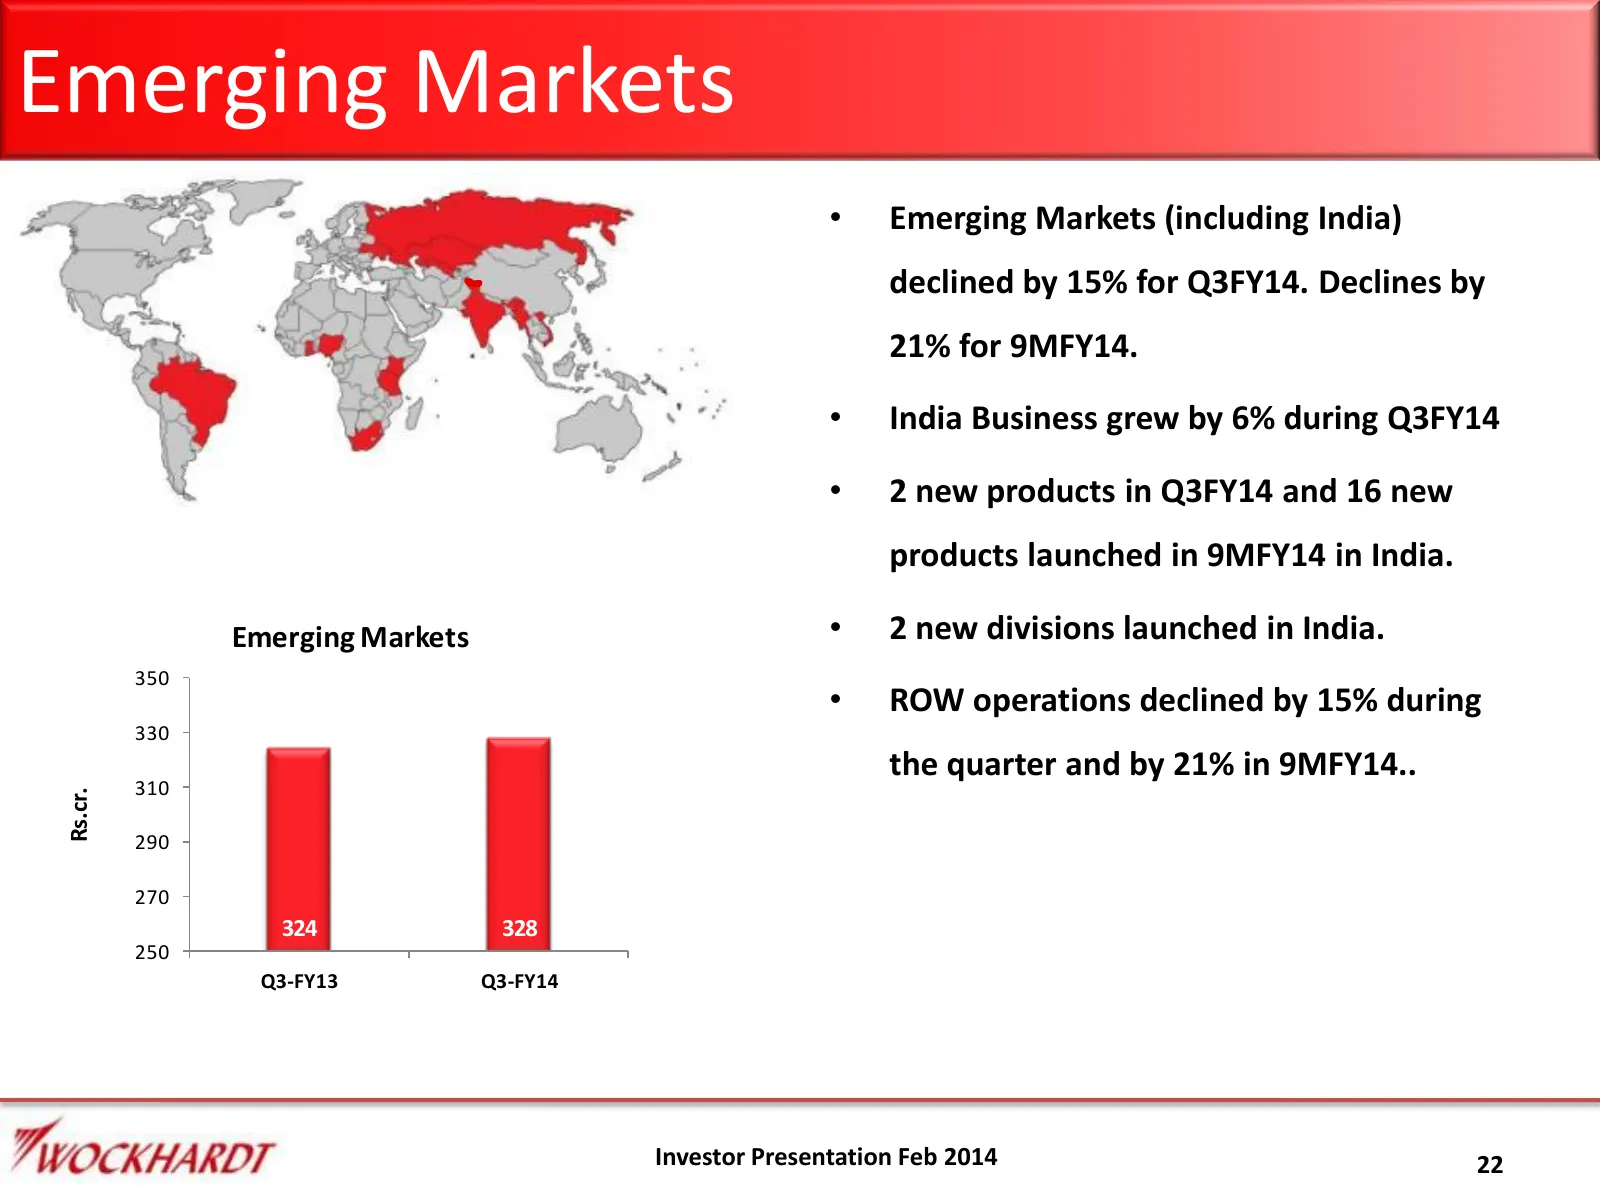
Emerging Markets • Emerging Markets (including India) declined by 15% for Q3FY14. Declines by 21% for 9MFY14. • India Business grew by 6% during Q3FY14 • 2 new products in Q3FY14 and 16 new products launched in 9MFY14 in India. Emerging Markets • 2 new divisions launched in India. 350 • ROW operatio
Slide 23: Investor updates and contact information
For investor updates and communication please visit www.wockhardt.com For Information please contact Tushar Mistry Tel.: +91 22 26596210 tmistry@wockhardt.com 23 Investor Presentation Feb 2014
Source: Internet Archive copy of wockhardt.com
More decks from Wockhardt Limited
 Investor Presentation (June 2026)36 slides · Jun 4, 2026
 Investor Presentation (June 2025)34 slides · Jun 5, 2025
 Investor Presentation (October 2024)44 slides · Oct 21, 2024
 Investor Presentation (October 2024)43 slides · October 2024
 Investor Presentation (February 2024)29 slides · Feb 26, 2024
 Investor Presentation (February 2024)28 slides · February 2024