Videndum PLC · LSE:VID
Videndum — H1 2022 Earnings Presentation
38 slides from Videndum's earnings presentation, Aug 11, 2022
Slide 1: Half Year Results 2022
Enabling the capture and sharing of exceptional content. Half Year Results 2022 11 August 2022 Capture. Share.
Slide 2: Agenda
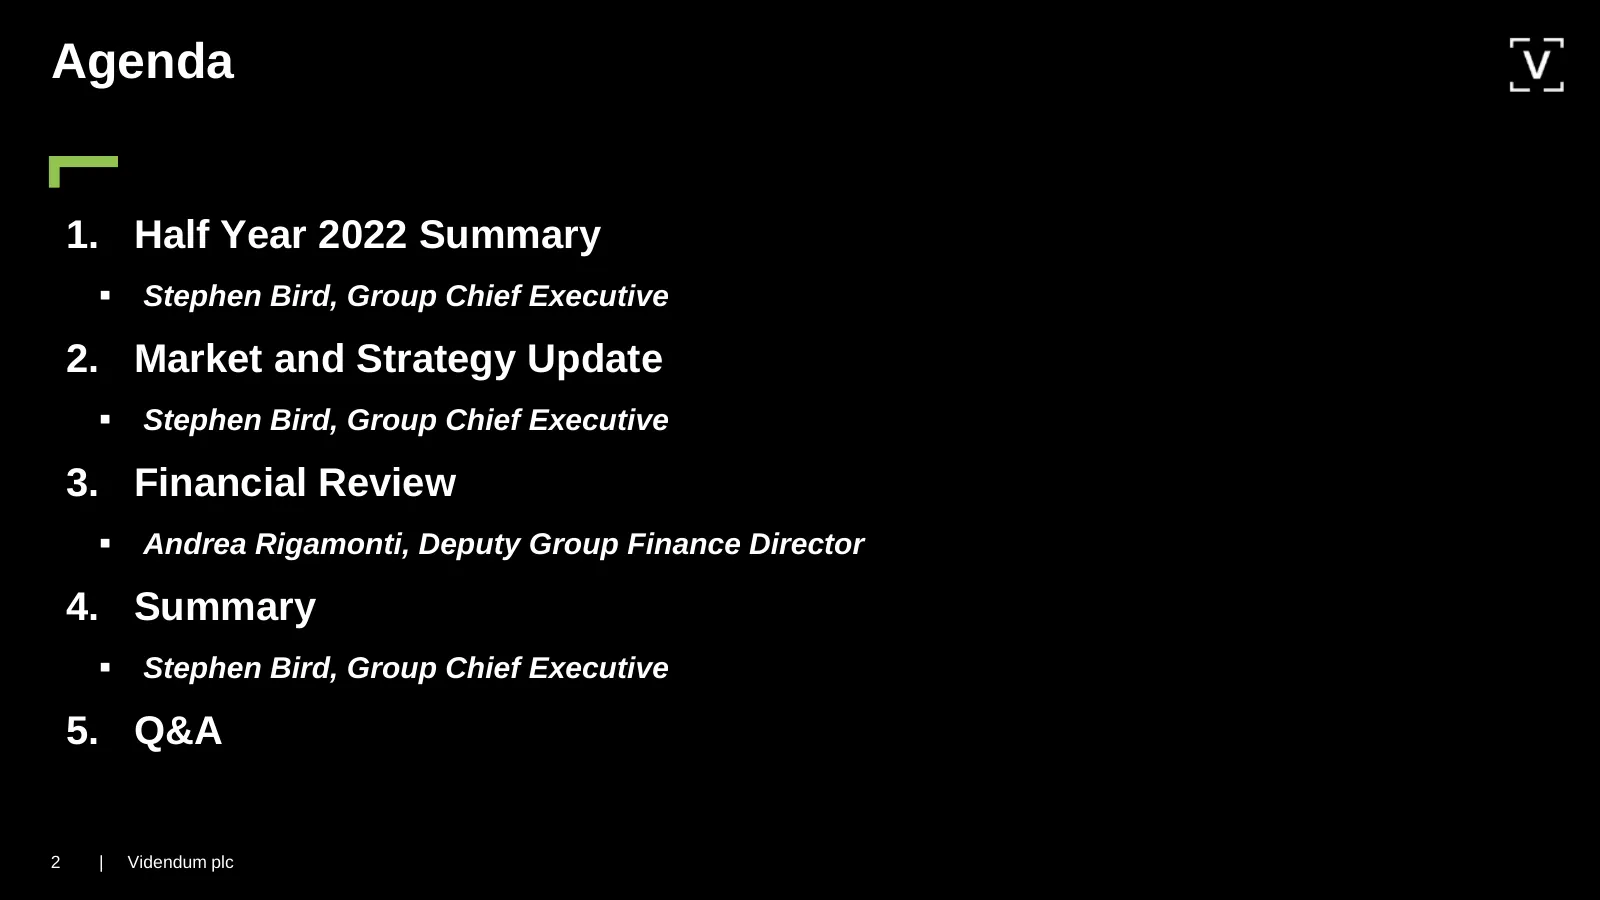
Agenda 1. Half Year 2022 Summary ▪ Stephen Bird, Group Chief Executive 2. Market and Strategy Update ▪ Stephen Bird, Group Chief Executive 3. Financial Review ▪ Andrea Rigamonti, Deputy Group Finance Director 4. Summary ▪ Stephen Bird, Group Chief Executive 5. Q&A 2 | Videndum plc
Slide 3: Summary
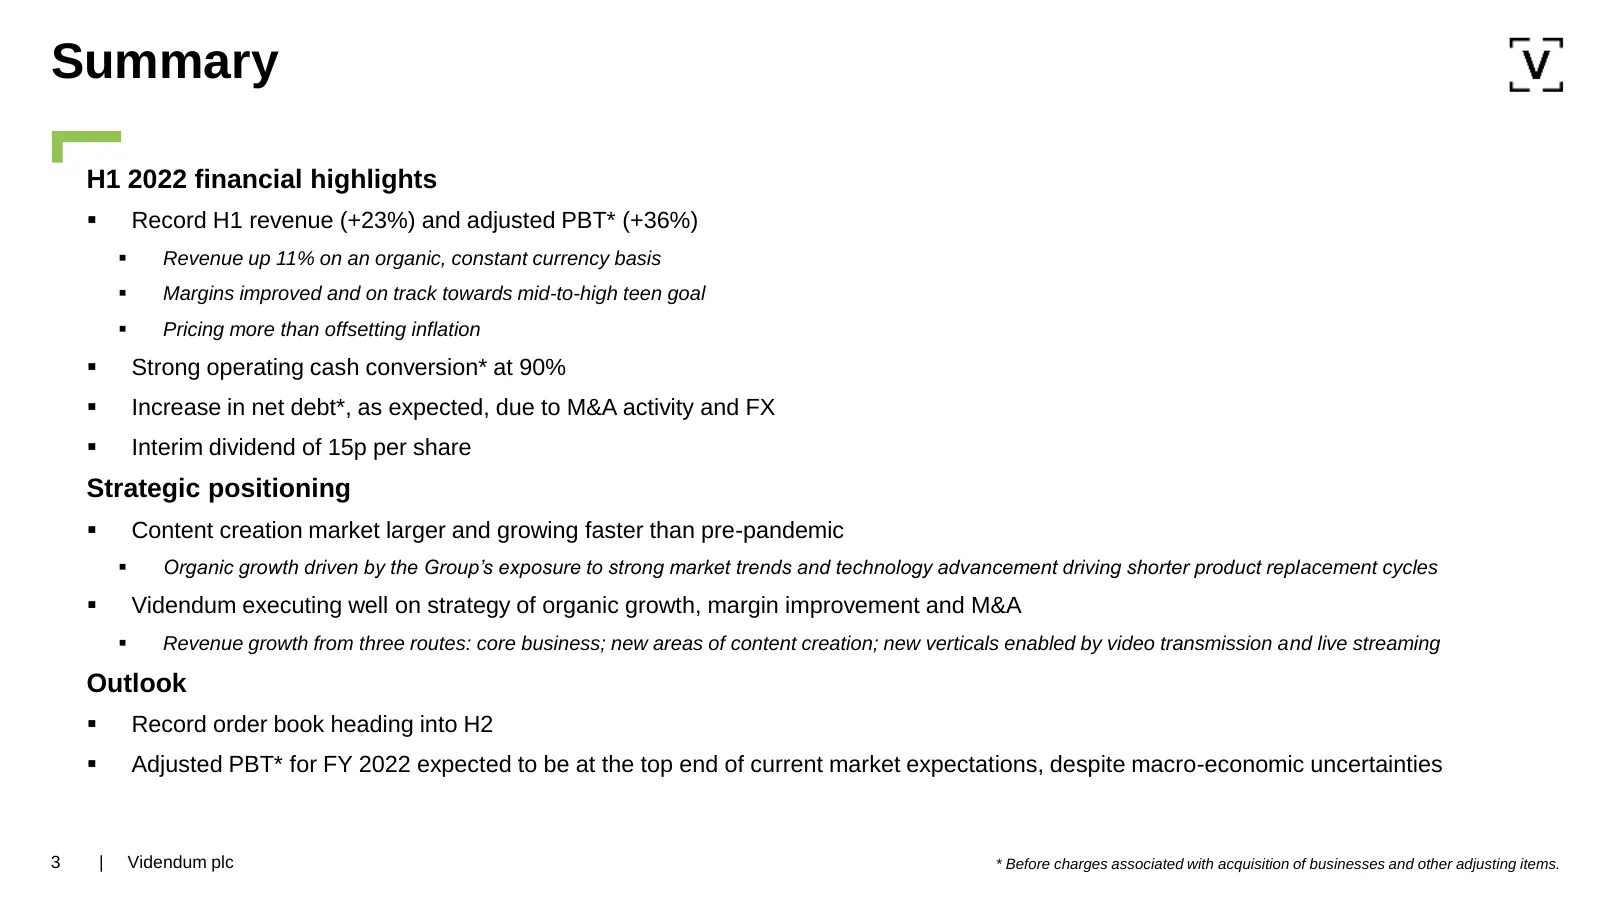
Summary H1 2022 financial highlights ▪ Record H1 revenue (+23%) and adjusted PBT* (+36%) ▪ Revenue up 11% on an organic, constant currency basis ▪ Margins improved and on track towards mid-to-high teen goal ▪ Pricing more than offsetting inflation ▪ Strong operating cash conversion* at 90% ▪ Increas

Slide 4: Market & strategy update
Market & strategy update 4 | Videndum plc
Slide 5: 2025 organic strategic ambition
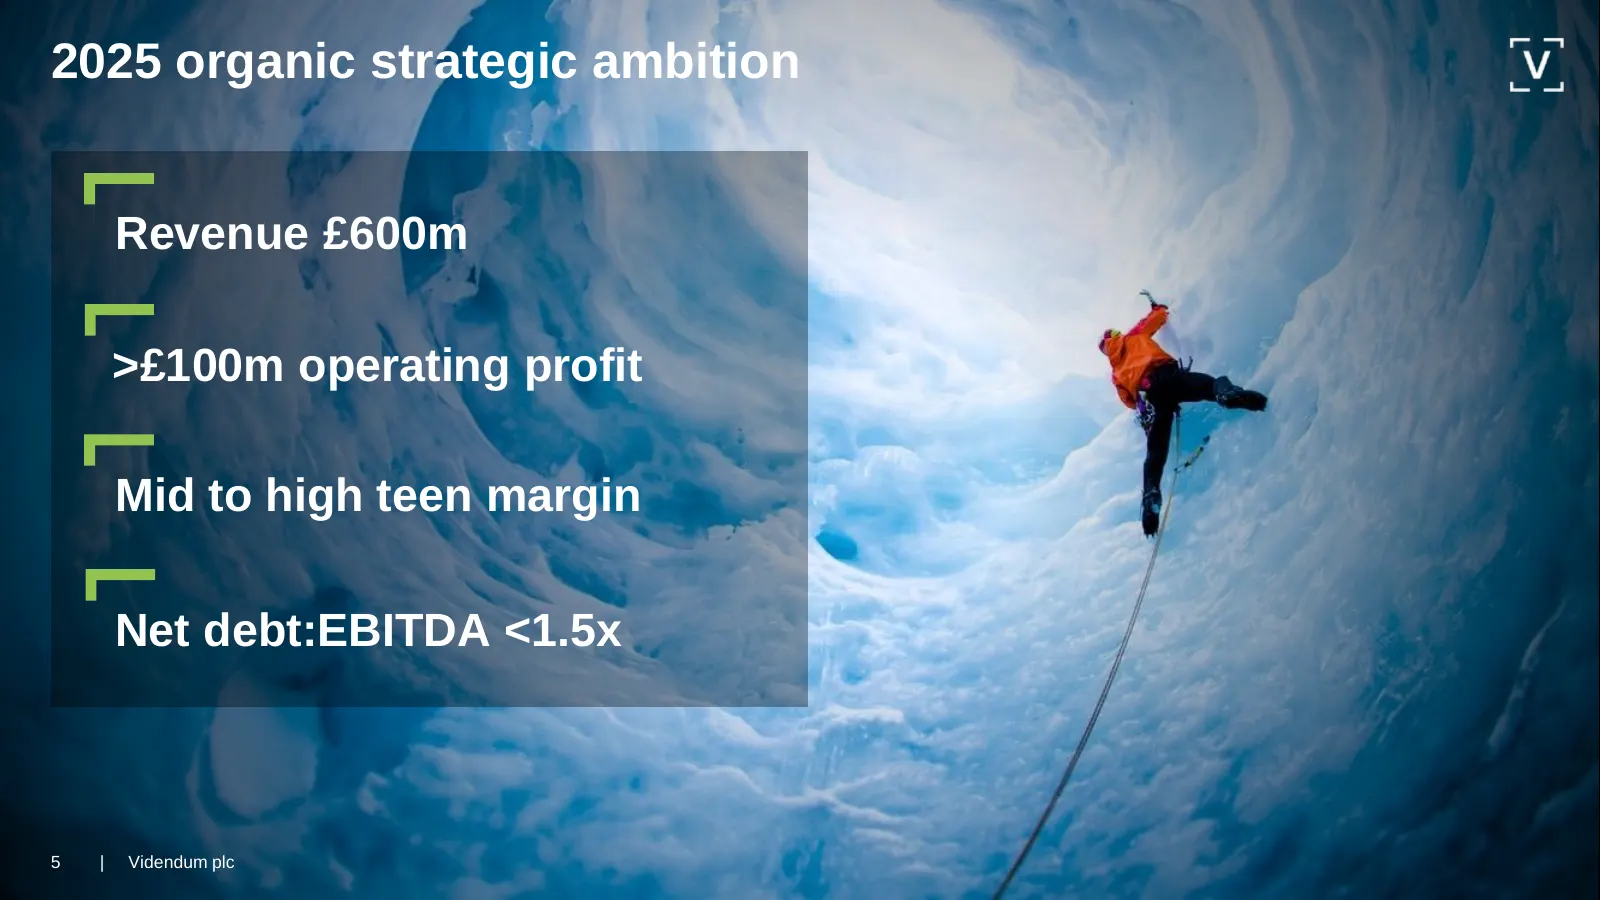
2025 organic strategic ambition Revenue £600m >£100m operating profit Mid to high teen margin Net debt:EBITDA <1.5x 5 | Videndum plc
Slide 6: A sizeable and growing market
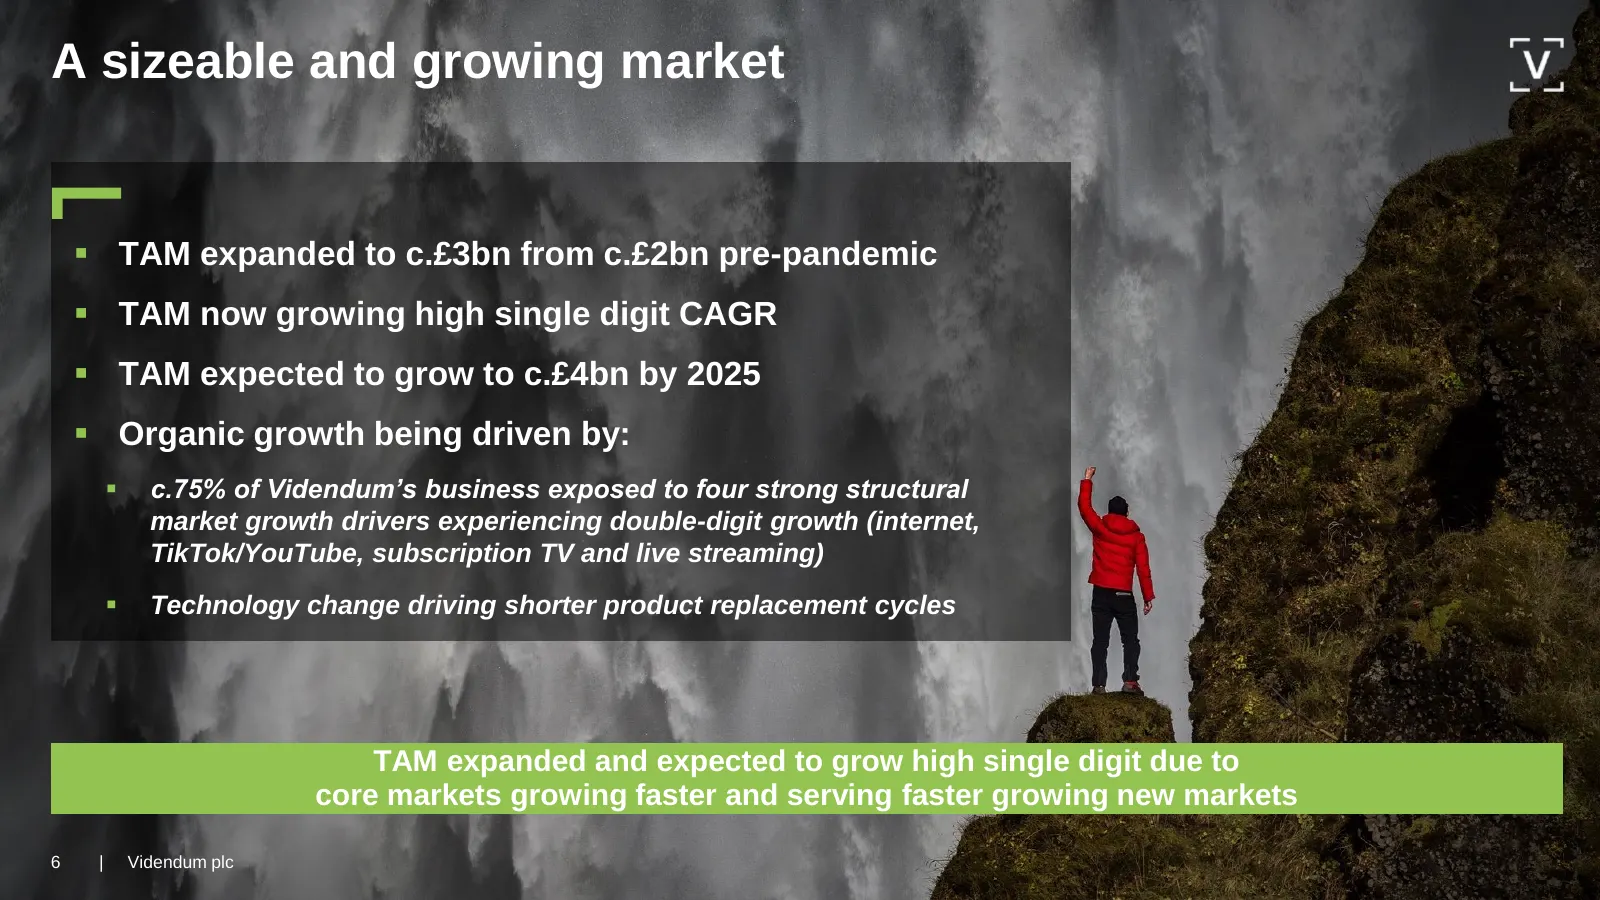
A sizeable and growing market ▪ TAM expanded to c.£3bn from c.£2bn pre-pandemic ▪ TAM now growing high single digit CAGR ▪ TAM expected to grow to c.£4bn by 2025 ▪ Organic growth being driven by: ▪ c.75% of Videndum’s business exposed to four strong structural market growth drivers experiencing doub
Slide 7: Media Solutions (formerly Imaging Solutions)
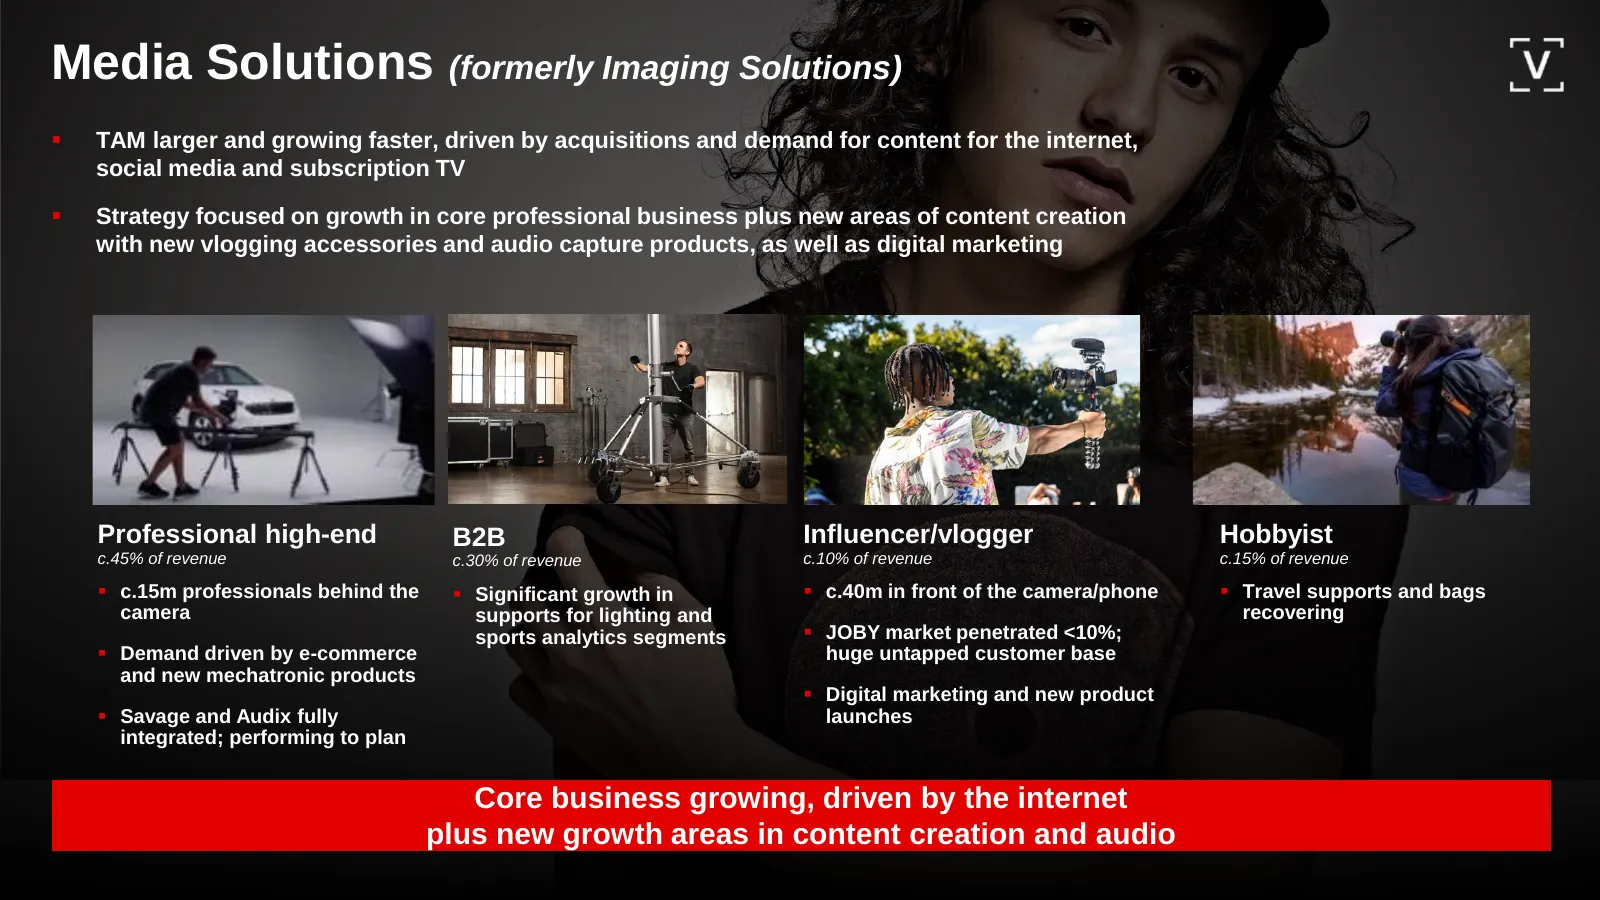
Media Solutions (formerly Imaging Solutions) ▪ TAM larger and growing faster, driven by acquisitions and demand for content for the internet, social media and subscription TV ▪ Strategy focused on growth in core professional business plus new areas of content creation with new vlogging accessories a
Slide 8: Production Solutions
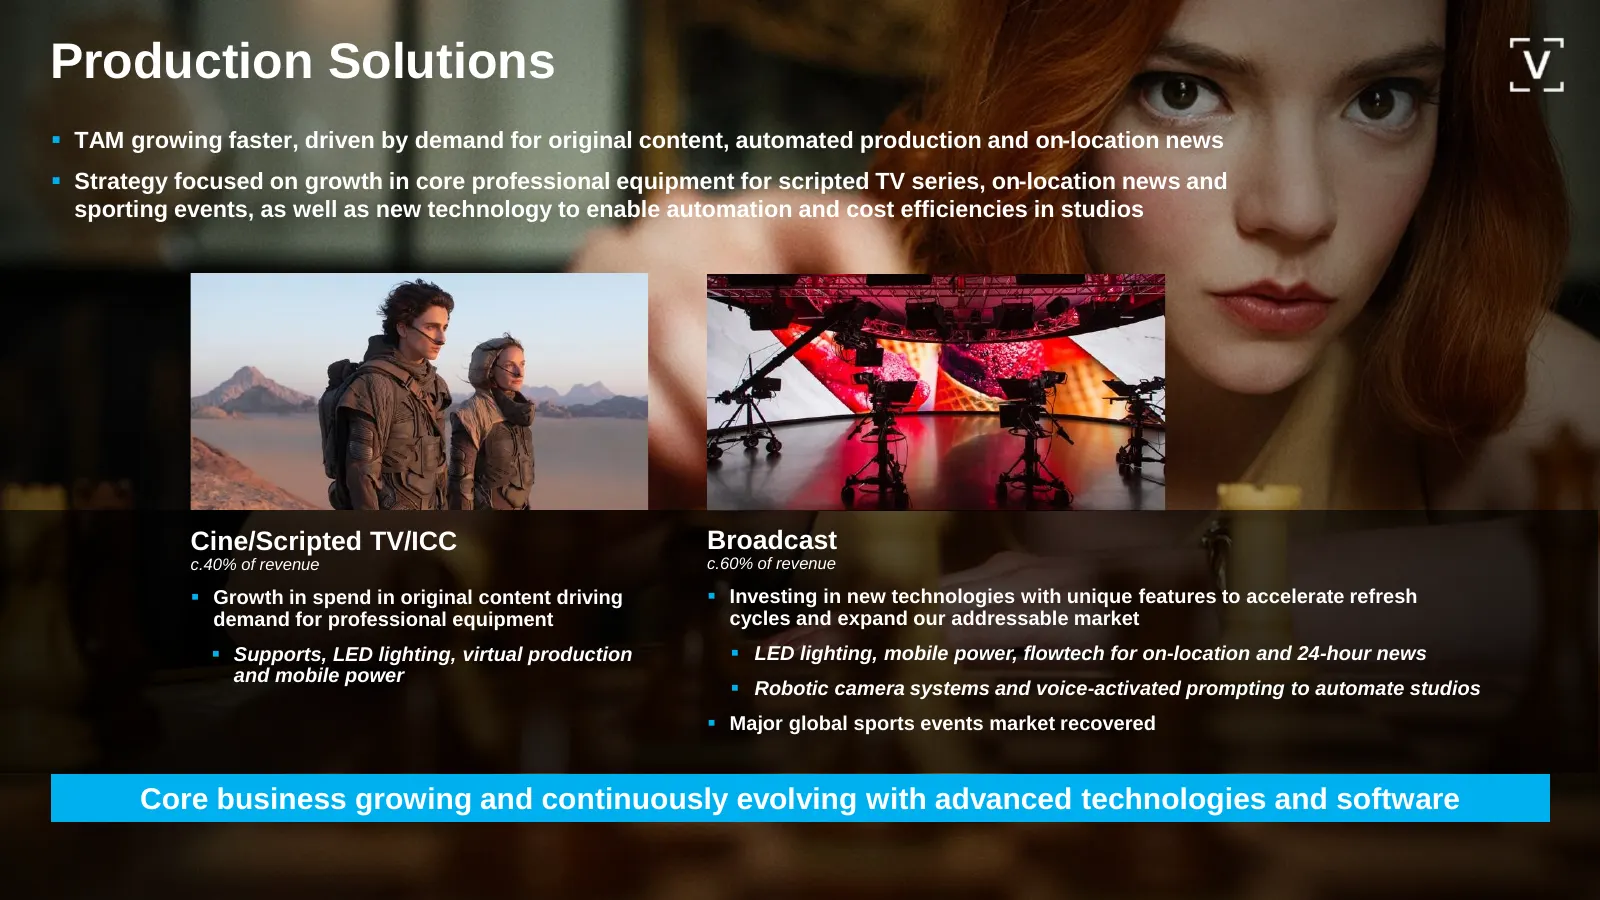
Production Solutions ▪ TAM growing faster, driven by demand for original content, automated production and on-location news ▪ Strategy focused on growth in core professional equipment for scripted TV series, on-location news and sporting events, as well as new technology to enable automation and cos
Slide 9: Creative Solutions
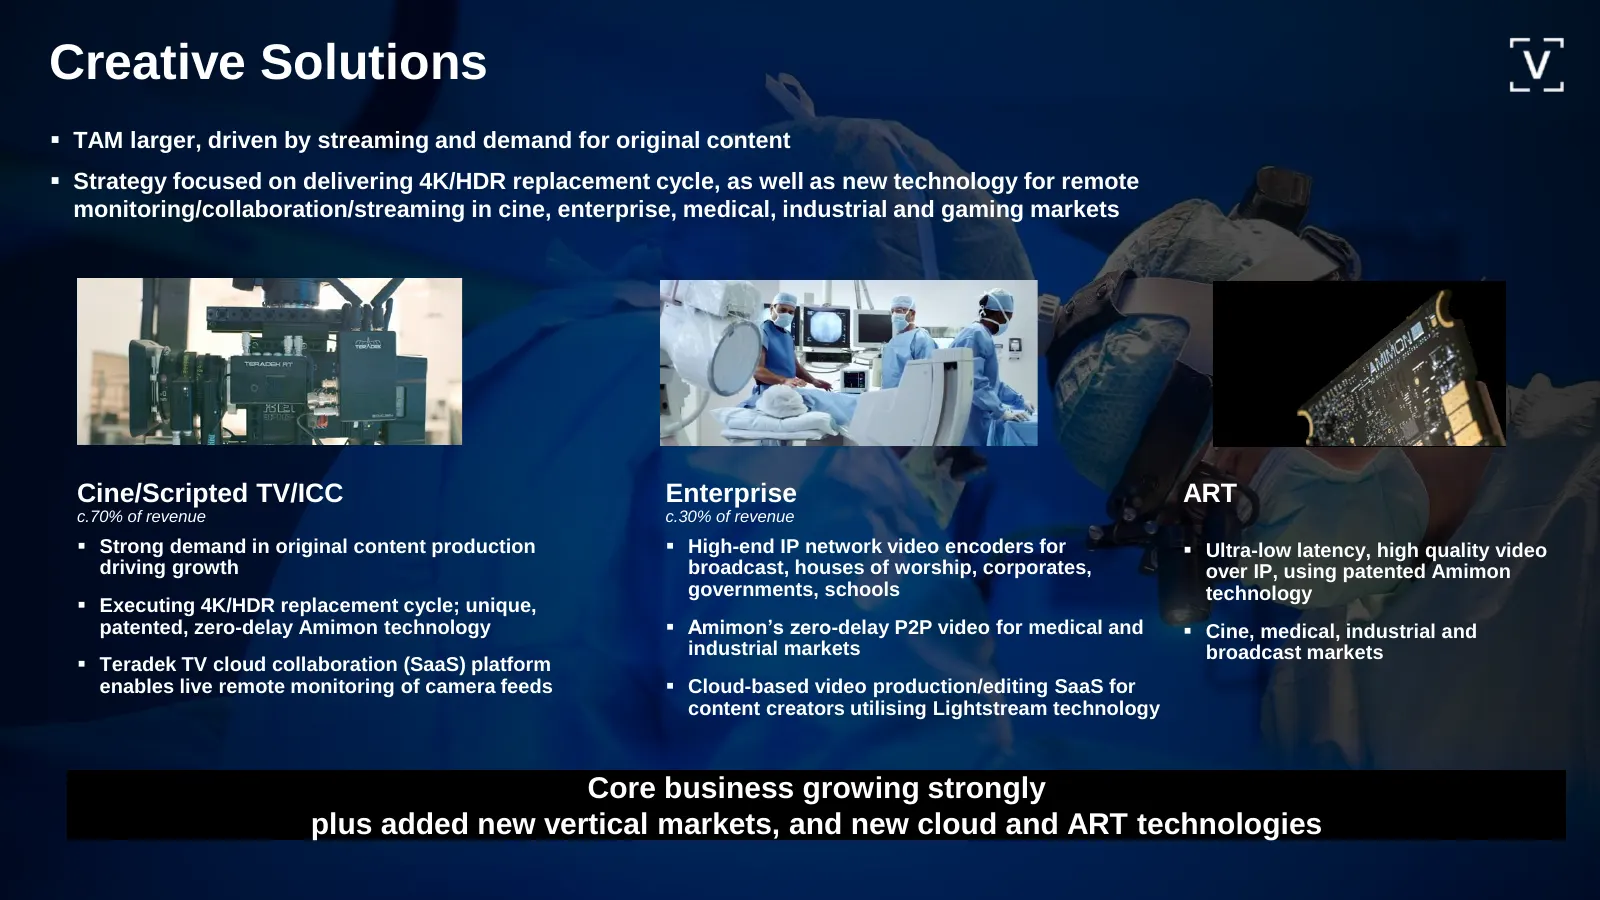
Creative Solutions ▪ TAM larger, driven by streaming and demand for original content ▪ Strategy focused on delivering 4K/HDR replacement cycle, as well as new technology for remote monitoring/collaboration/streaming in cine, enterprise, medical, industrial and gaming markets Cine/Scripted TV/ICC Ent
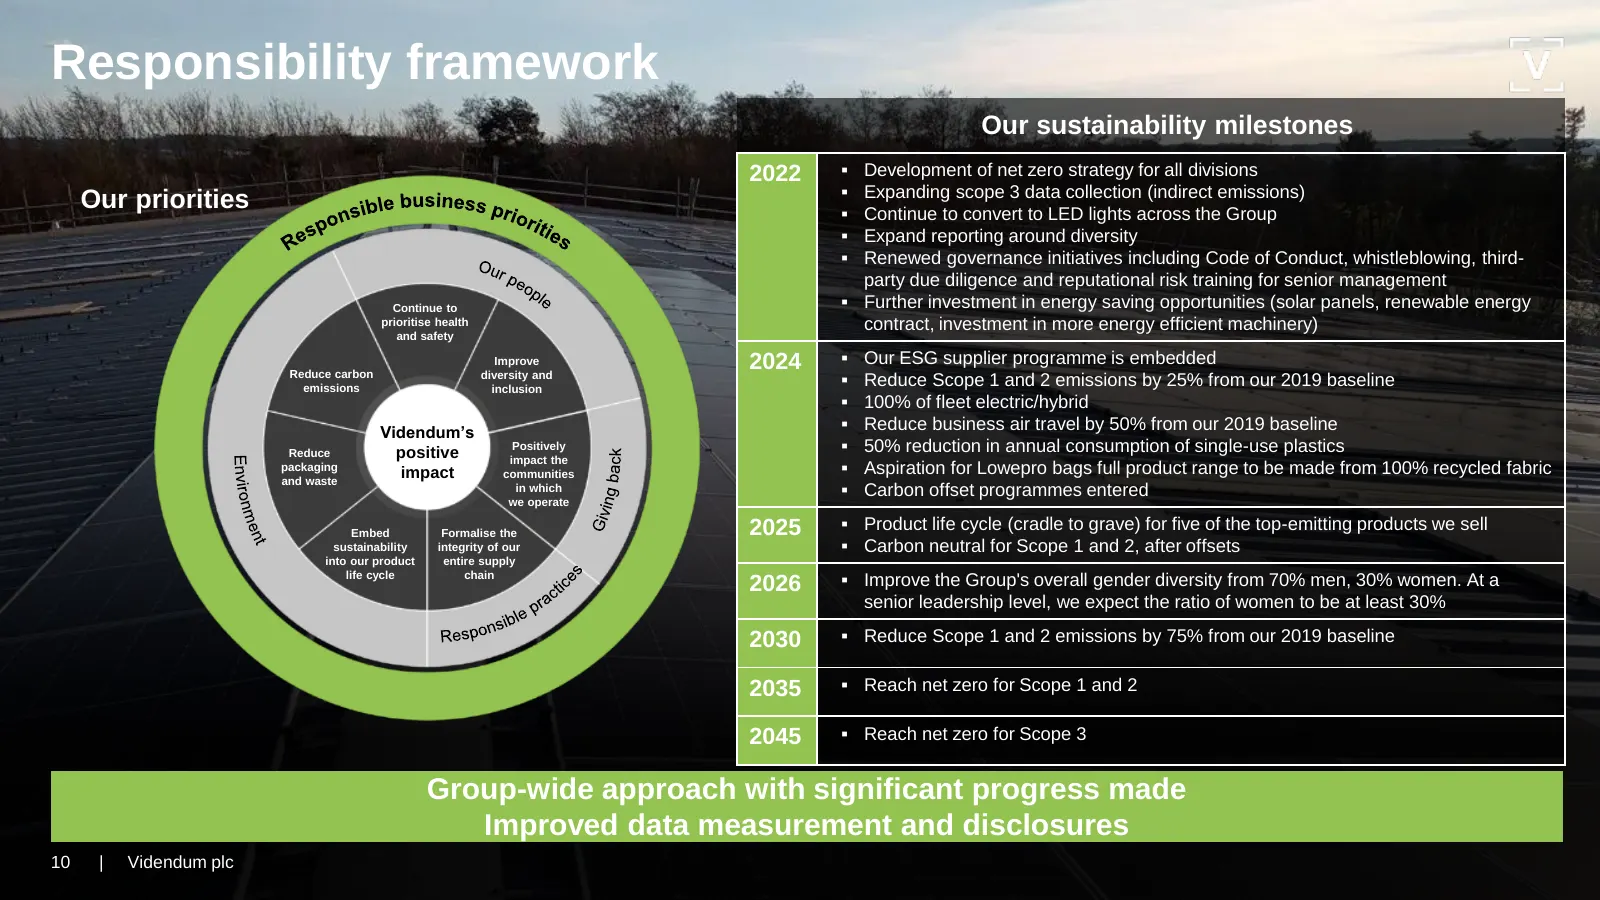
Slide 10: Responsibility framework
Responsibility framework Our sustainability milestones 2022 ▪ Development of net zero strategy for all divisions ▪ Expanding scope 3 data collection (indirect emissions) Our priorities ▪ Continue to convert to LED lights across the Group ▪ Expand reporting around diversity ▪ Renewed governance initi

Slide 11: Financial review
Financial review 11 | Videndum plc
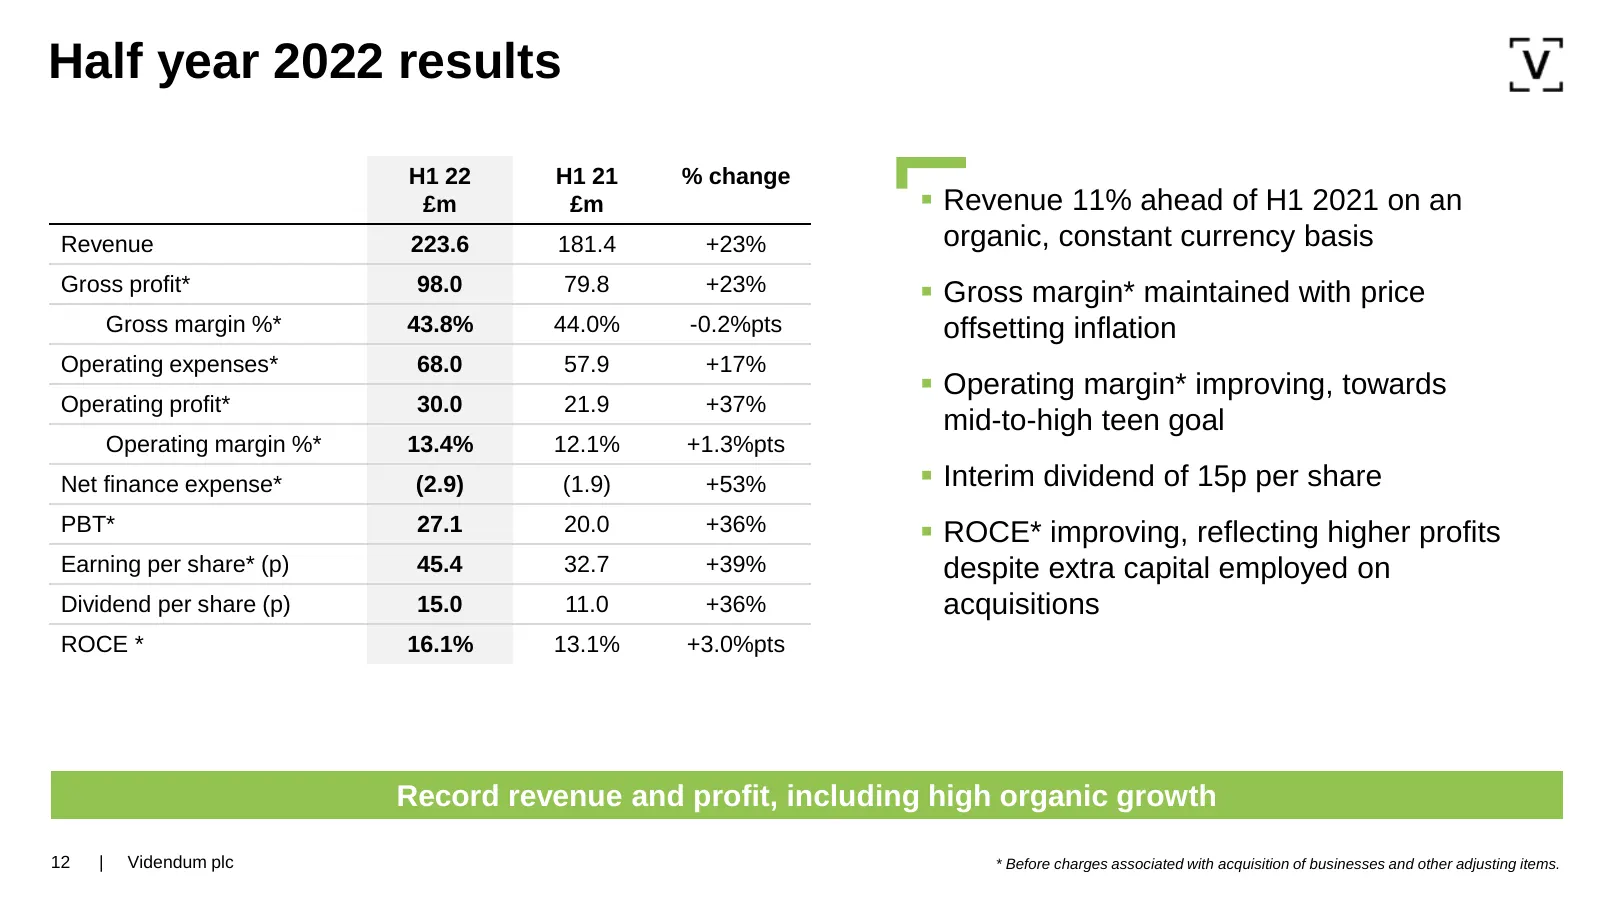
Slide 12: Half year 2022 results
Half year 2022 results H1 22 H1 21 % change £m £m ▪ Revenue 11% ahead of H1 2021 on an Revenue 223.6 181.4 +23% organic, constant currency basis Gross profit* 98.0 79.8 +23% ▪ Gross margin* maintained with price Gross margin %* 43.8% 44.0% -0.2%pts offsetting inflation Operating expenses* 68.0 57.9
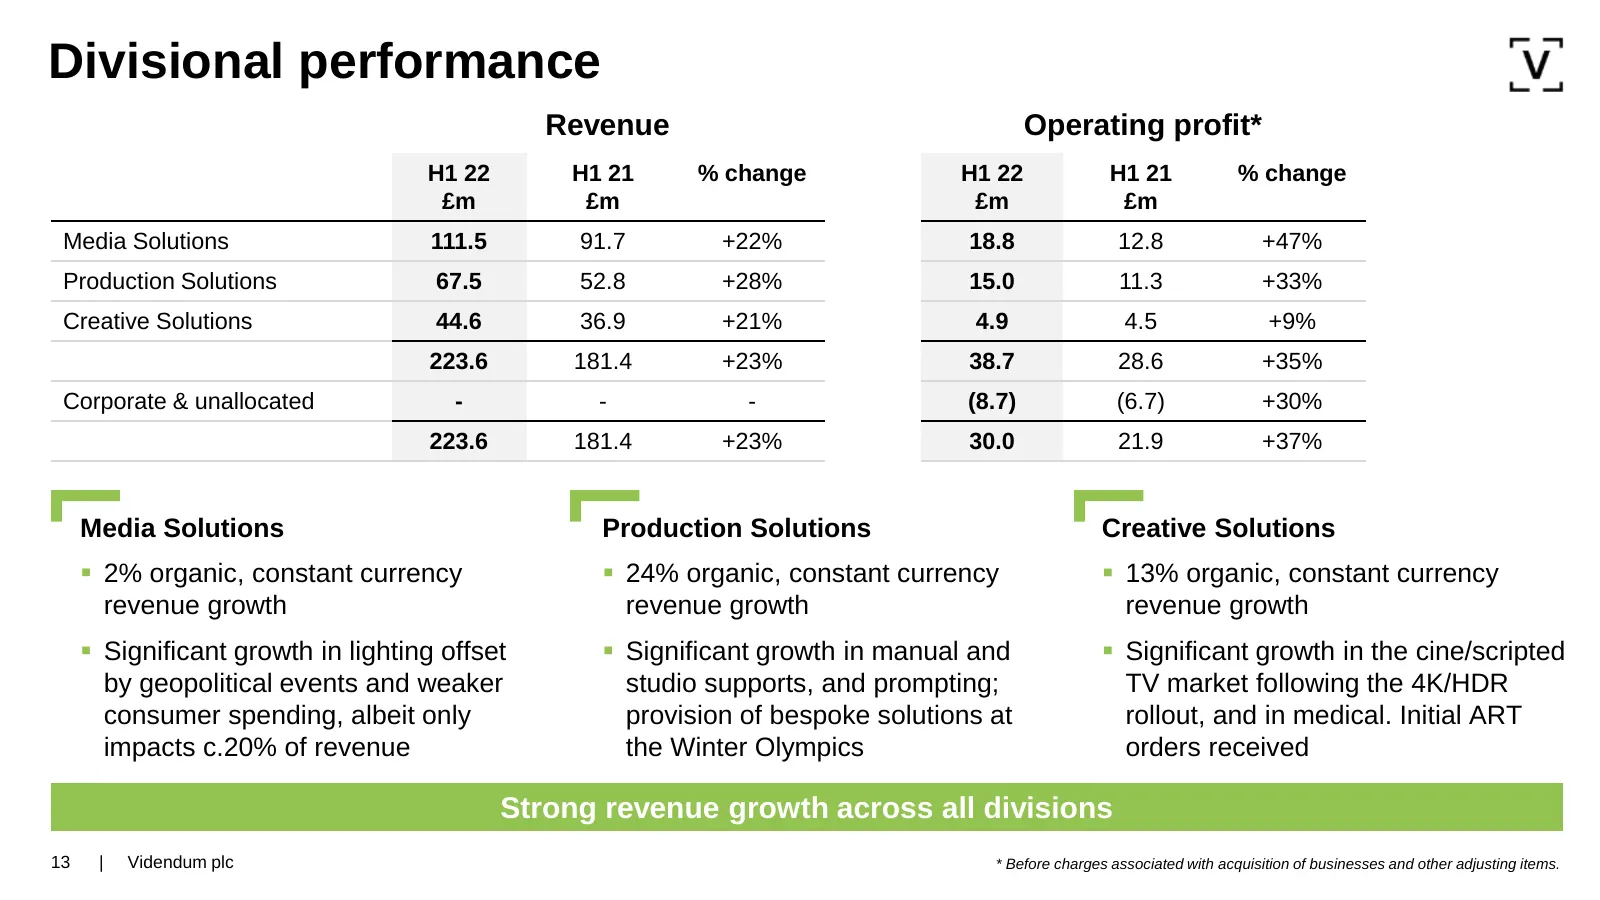
Slide 13: Divisional performance
Divisional performance Revenue Operating profit* H1 22 H1 21 % change H1 22 H1 21 % change £m £m £m £m Media Solutions 111.5 91.7 +22% 18.8 12.8 +47% Production Solutions 67.5 52.8 +28% 15.0 11.3 +33% Creative Solutions 44.6 36.9 +21% 4.9 4.5 +9% 223.6 181.4 +23% 38.7 28.6 +35% Corporate & unallocat
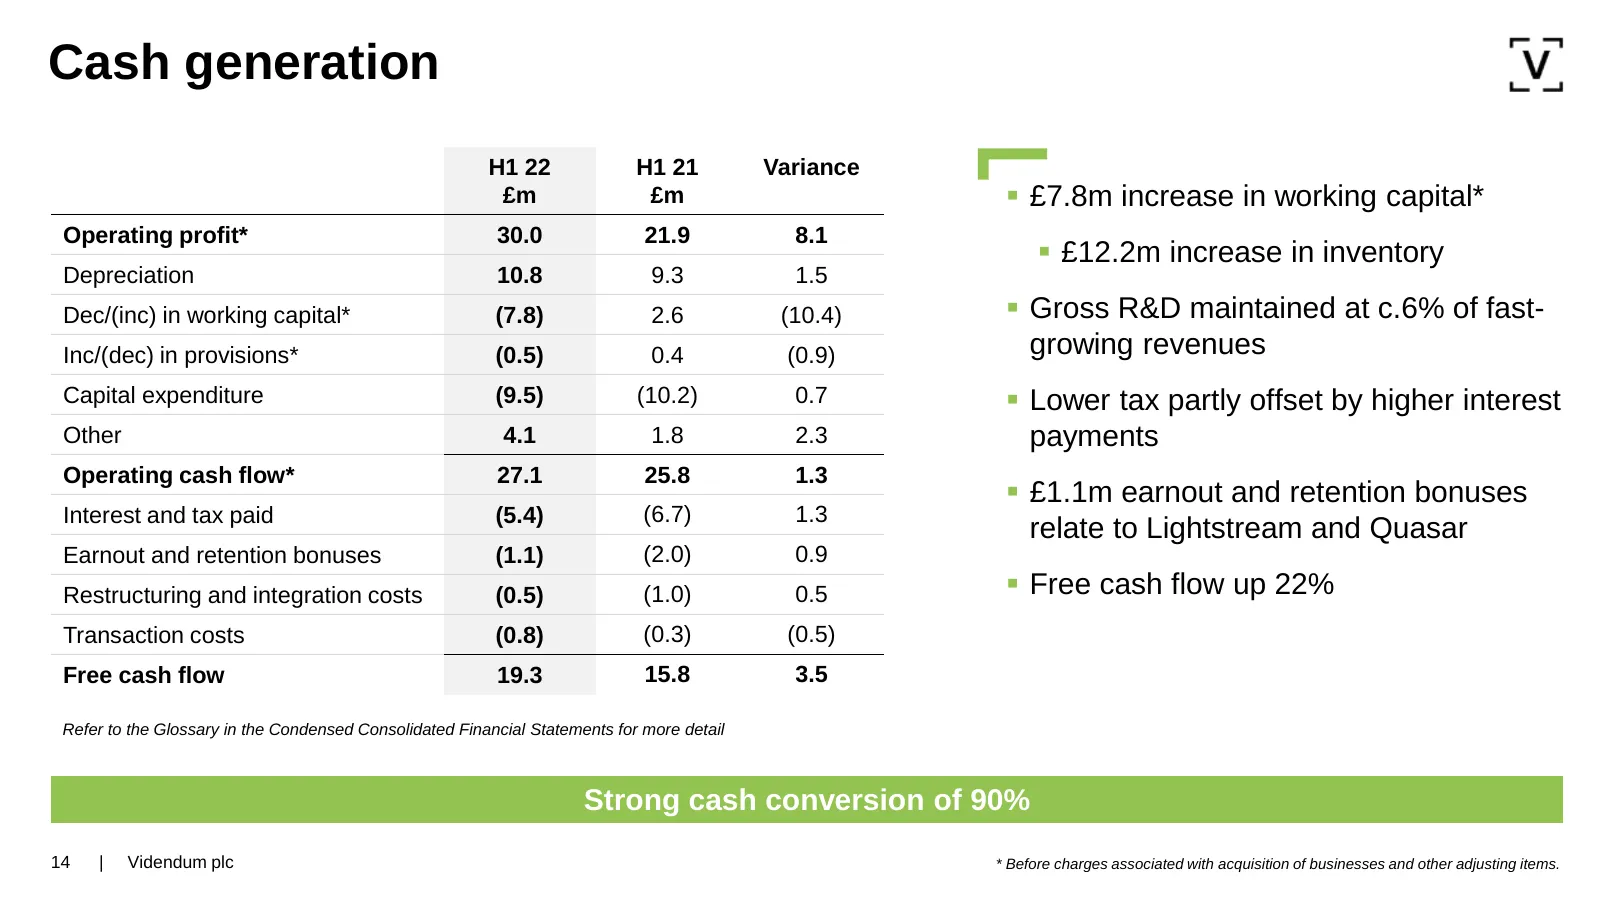
Slide 14: Cash generation
Cash generation H1 22 H1 21 Variance £m £m ▪ £7.8m increase in working capital* Operating profit* 30.0 21.9 8.1 ▪ £12.2m increase in inventory Depreciation 10.8 9.3 1.5 Dec/(inc) in working capital* (7.8) 2.6 (10.4) ▪ Gross R&D maintained at c.6% of fast- Inc/(dec) in provisions* (0.5) 0.4 (0.9) gro
Slide 15: Net debt
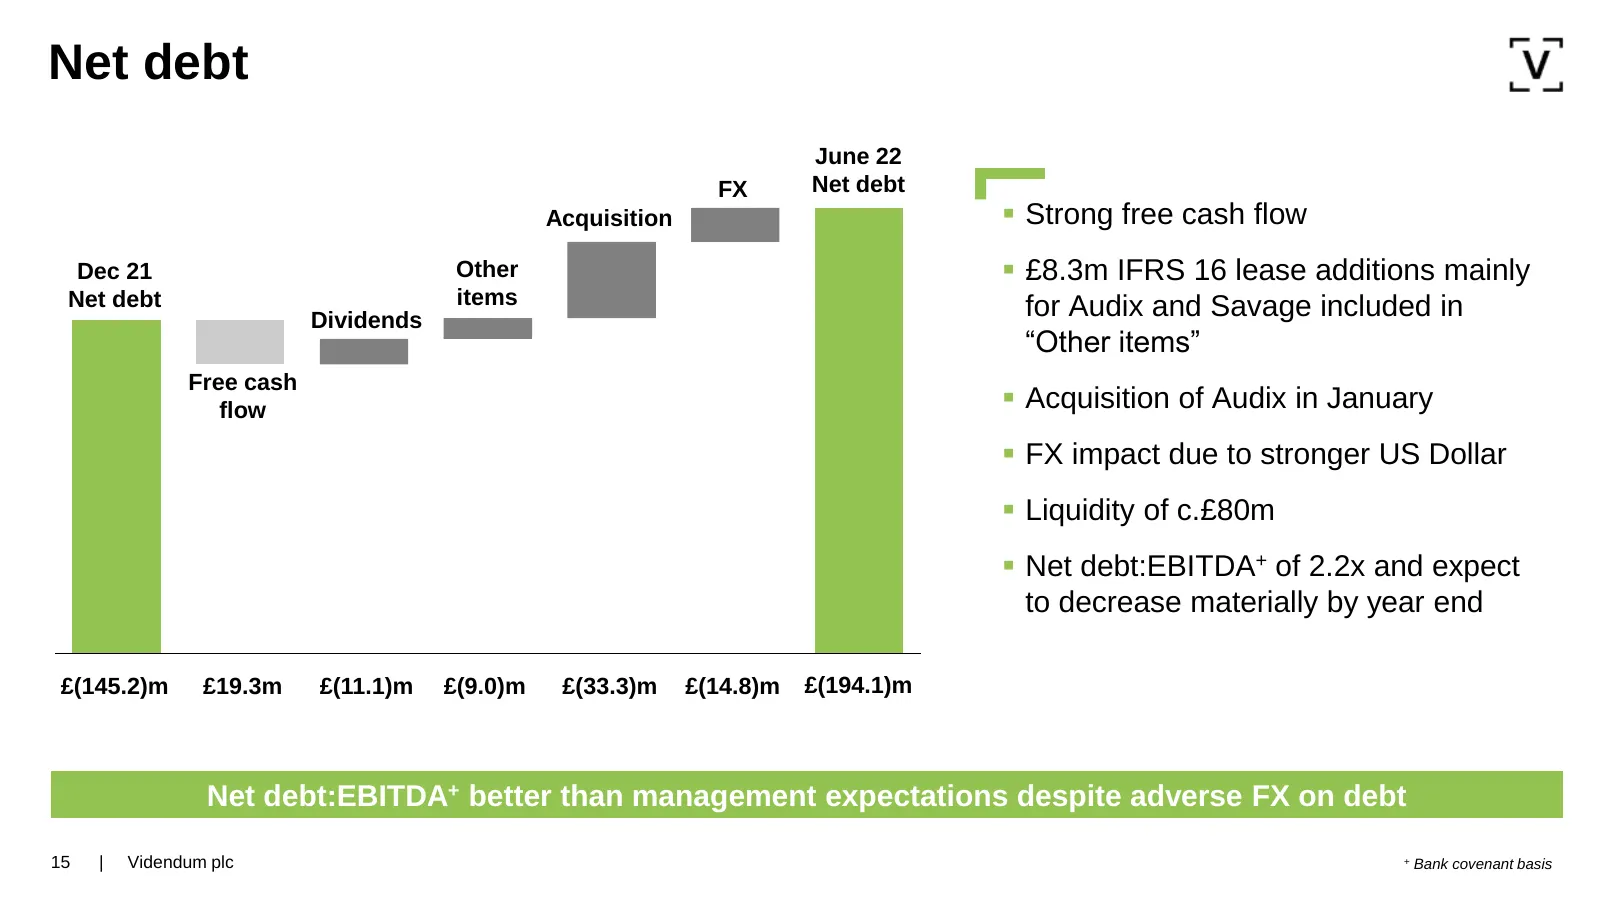
Net debt June 22 FX Net debt Acquisition ▪ Strong free cash flow Dec 21 Other ▪ £8.3m IFRS 16 lease additions mainly Net debt items for Audix and Savage included in Dividends “Other items” Free cash flow ▪ Acquisition of Audix in January ▪ FX impact due to stronger US Dollar ▪ Liquidity of c.£80m ▪
Slide 16: Selected FY 2022 Guidance
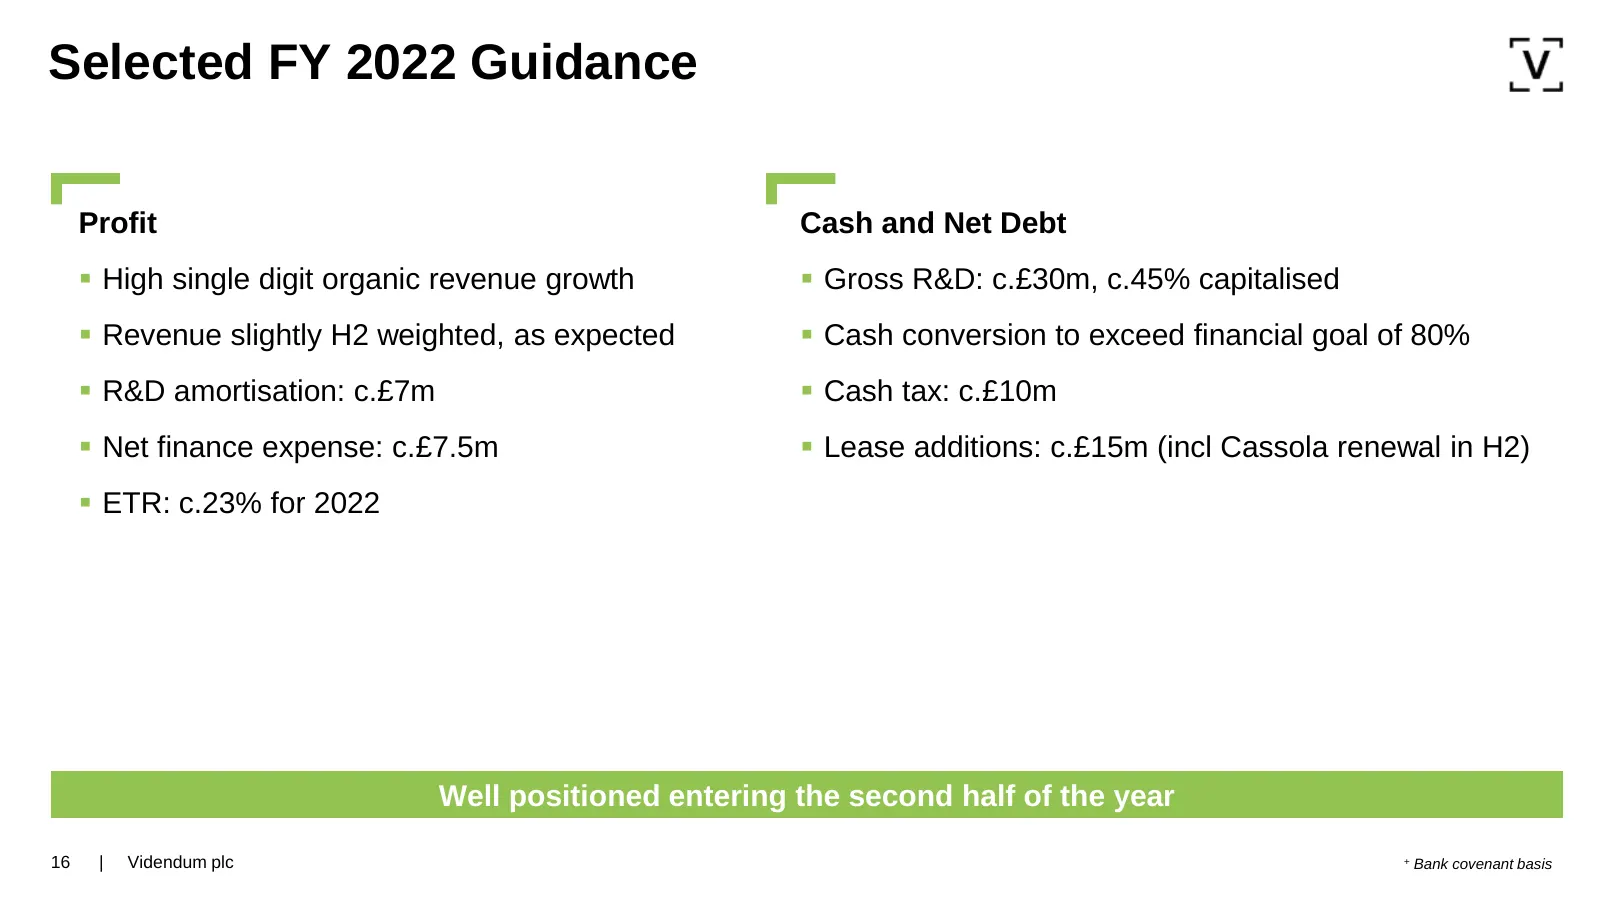
Selected FY 2022 Guidance Profit Cash and Net Debt ▪ High single digit organic revenue growth ▪ Gross R&D: c.£30m, c.45% capitalised ▪ Revenue slightly H2 weighted, as expected ▪ Cash conversion to exceed financial goal of 80% ▪ R&D amortisation: c.£7m ▪ Cash tax: c.£10m ▪ Net finance expense: c.£7.

Slide 17: Summary
re oe | Videndum Summary
Slide 18: Summary
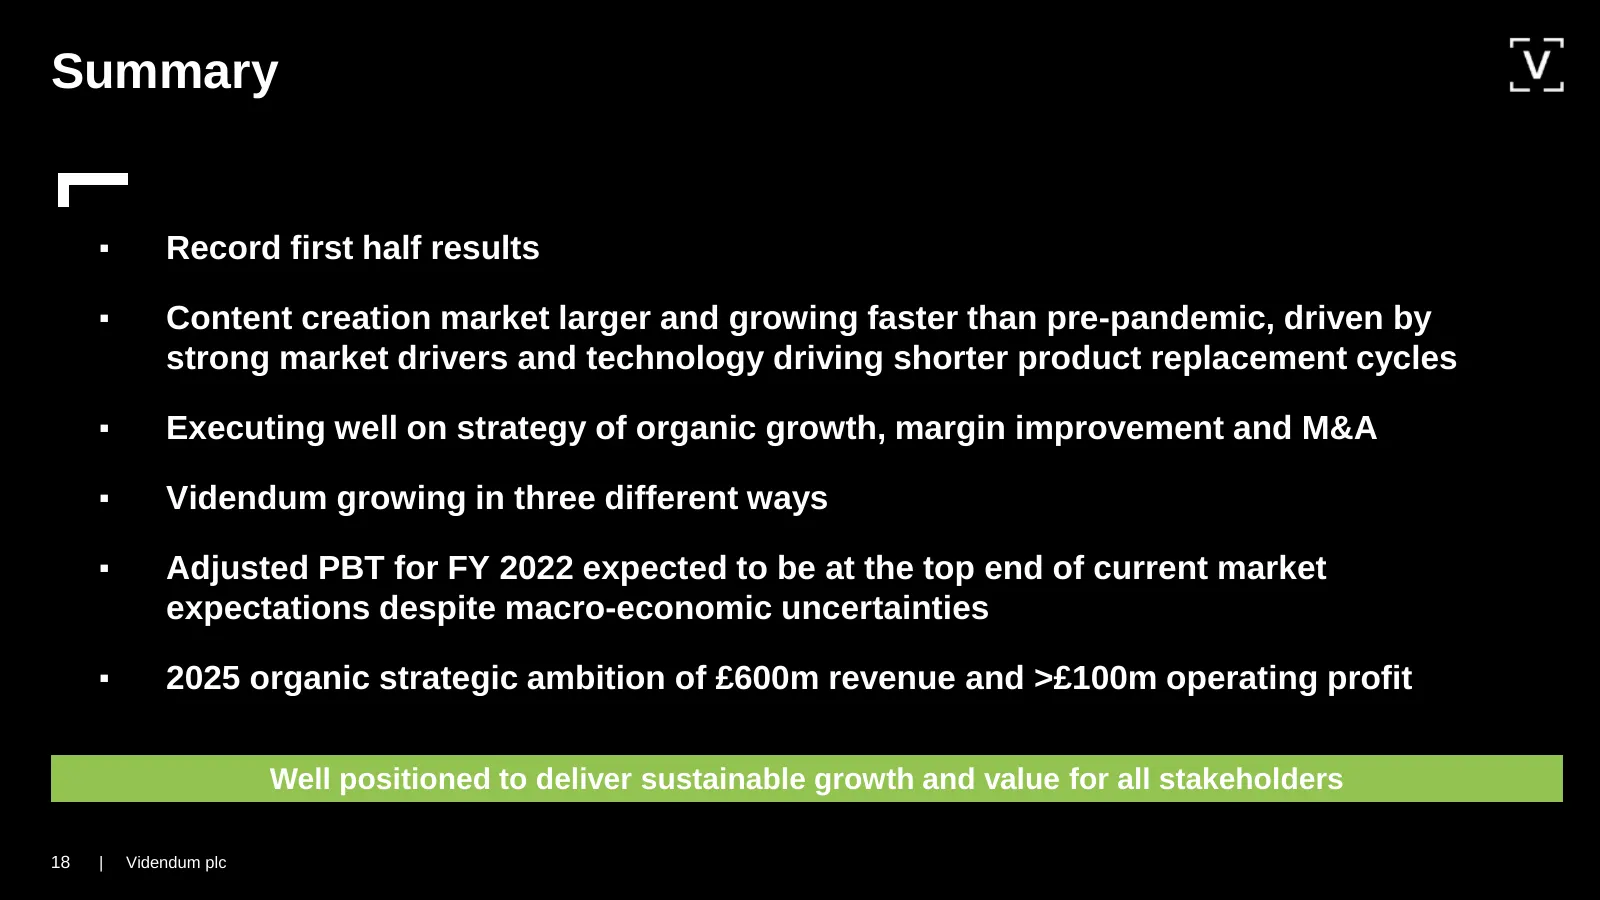
Summary ▪ Record first half results ▪ Content creation market larger and growing faster than pre-pandemic, driven by strong market drivers and technology driving shorter product replacement cycles ▪ Executing well on strategy of organic growth, margin improvement and M&A ▪ Videndum growing in three

Slide 19: Q&A
Q&A Phone number: 0800 640 6441 Confirmation code: 499393 Press *1 to ask a question Press *2 to withdraw your question Press *0 for operator assistance 19 | Videndum plc

Slide 20: Appendices
20 =| Videndum pic | oe | Videndum
Slide 21: Financial goals
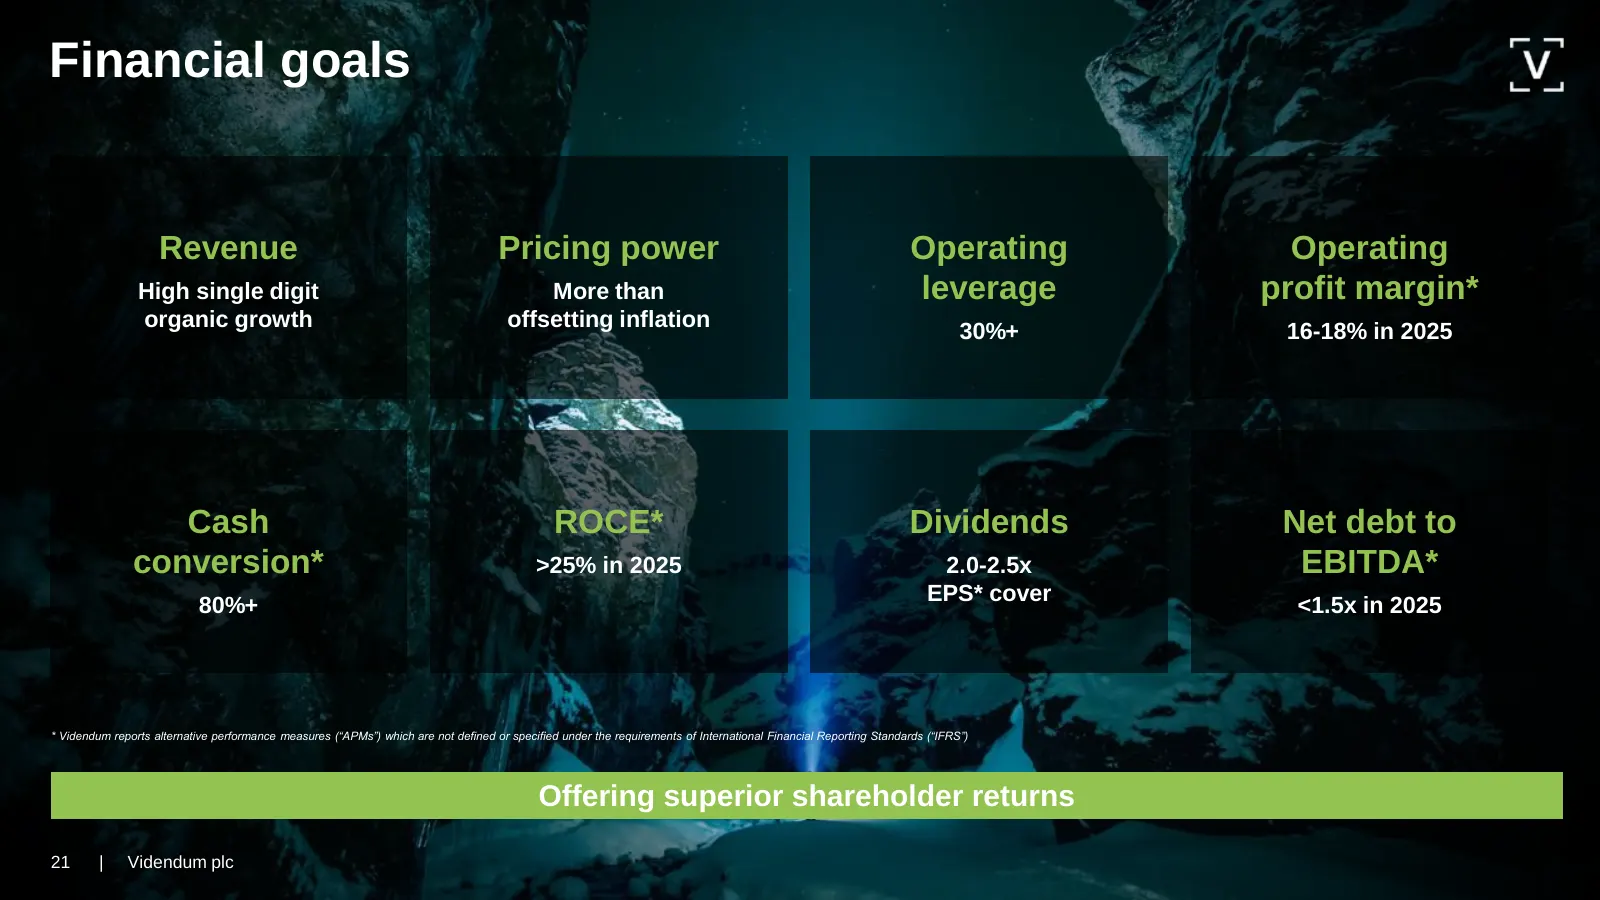
Financial goals Revenue Pricing power Operating Operating High single digit More than leverage profit margin* organic growth offsetting inflation 30%+ 16-18% in 2025 Cash ROCE* Dividends Net debt to conversion* >25% in 2025 2.0-2.5x EBITDA* EPS* cover 80%+ <1.5x in 2025 * Videndum reports alternativ
Slide 22: Organic growth – Group profit ambition
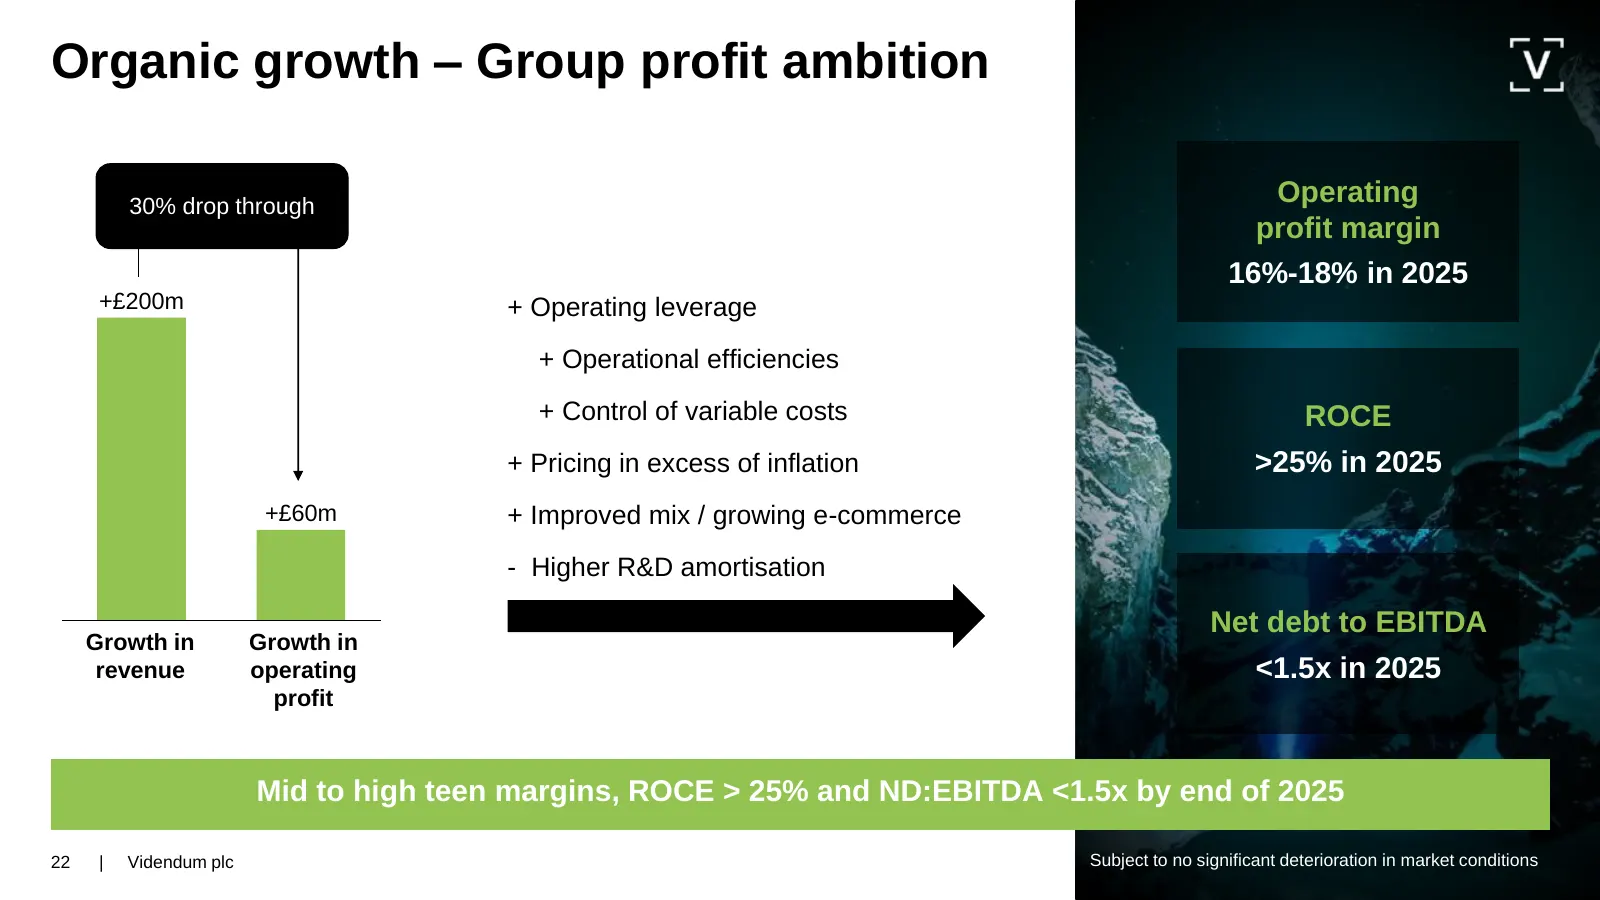
Organic growth – Group profit ambition 30% drop through Operating profit margin 16%-18% in 2025 +£200m + Operating leverage + Operational efficiencies + Control of variable costs ROCE + Pricing in excess of inflation >25% in 2025 +£60m + Improved mix / growing e-commerce - Higher R&D amortisation Ne
Slide 23: Capital allocation and priorities
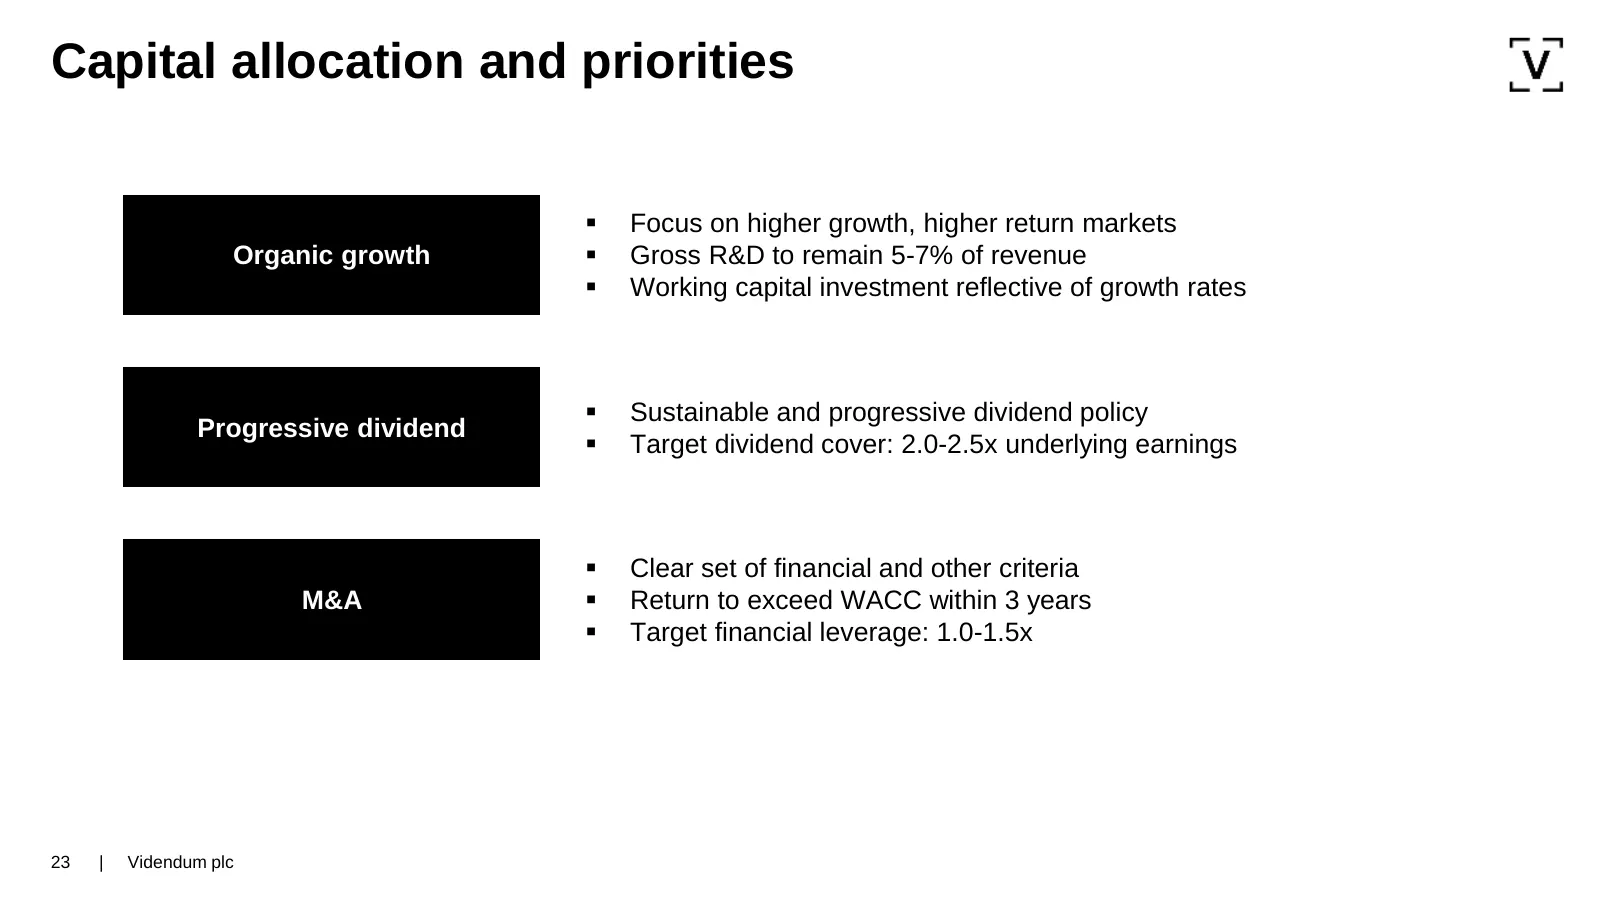
Capital allocation and priorities ▪ Focus on higher growth, higher return markets Organic growth ▪ Gross R&D to remain 5-7% of revenue ▪ Working capital investment reflective of growth rates ▪ Sustainable and progressive dividend policy Progressive dividend ▪ Target dividend cover: 2.0-2.5x underlyi
Slide 24: FX sensitivities
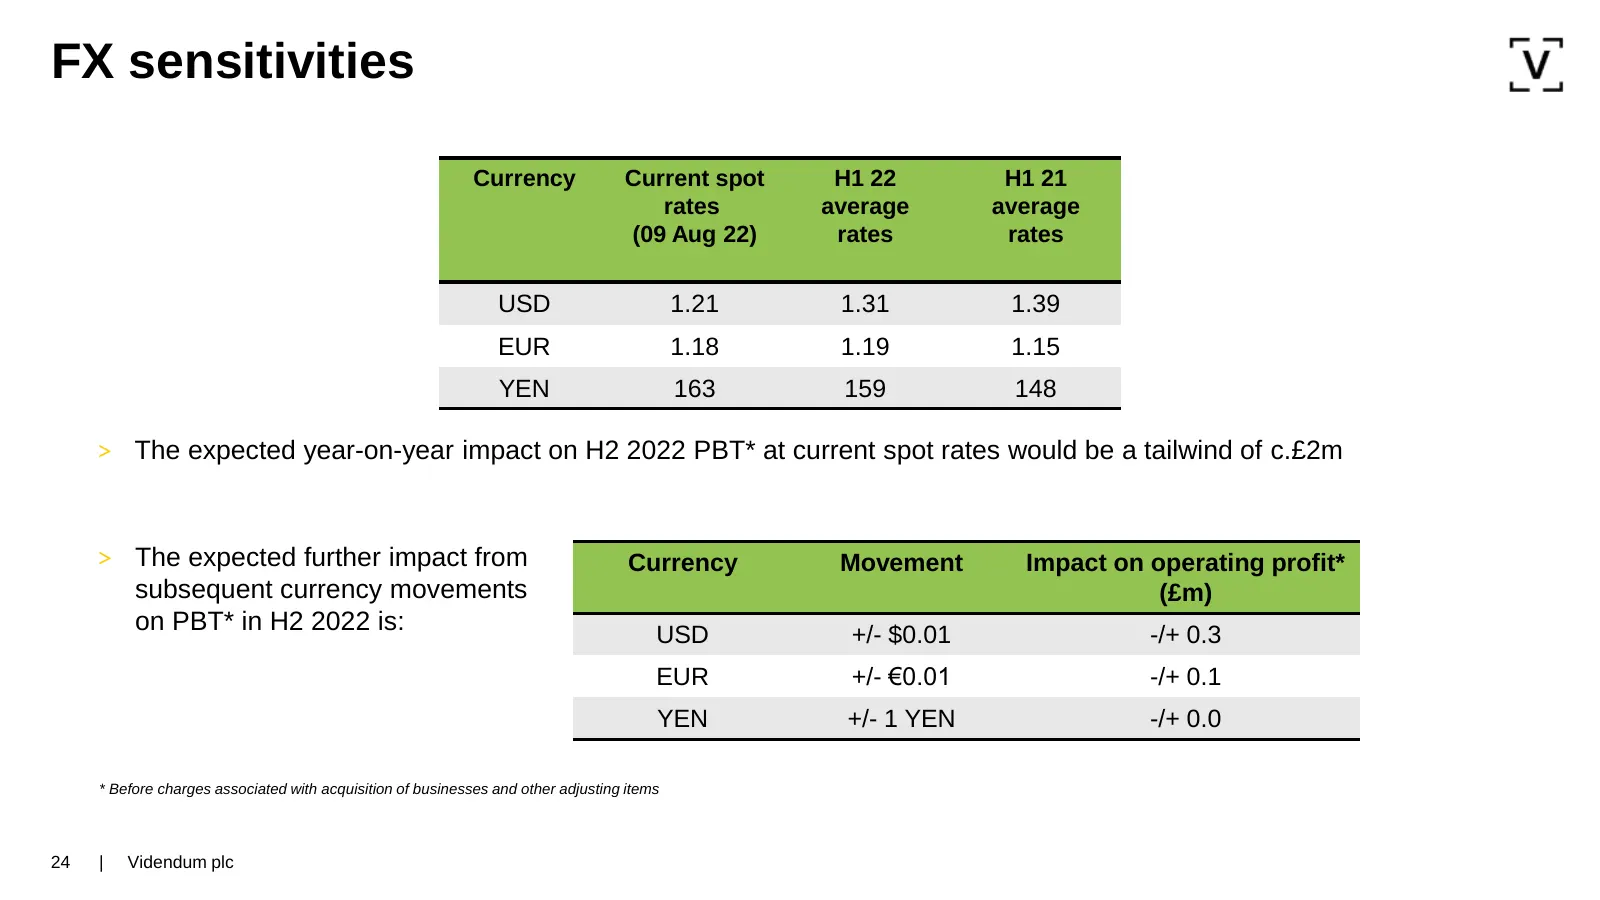
FX sensitivities Currency Current spot H1 22 H1 21 rates average average (09 Aug 22) rates rates USD 1.21 1.31 1.39 EUR 1.18 1.19 1.15 YEN 163 159 148 > The expected year-on-year impact on H2 2022 PBT* at current spot rates would be a tailwind of c.£2m > The expected further impact from Currency Mov
Slide 25: Net Debt:EBITDA
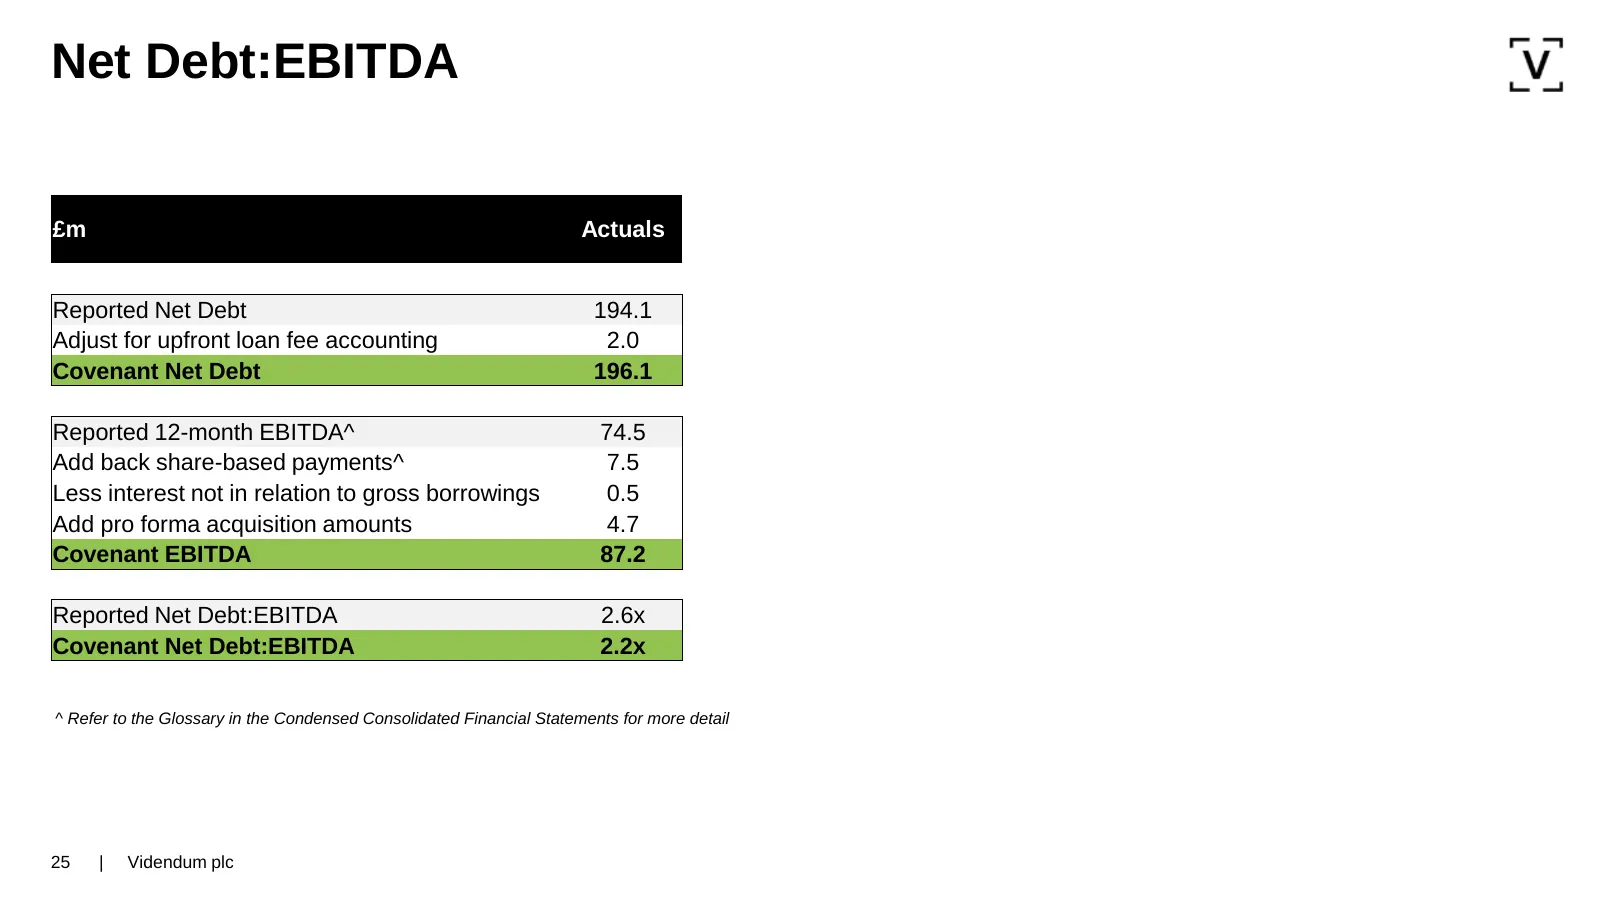
Net Debt:EBITDA £m Actuals Reported Net Debt 194.1 Adjust for upfront loan fee accounting 2.0 Covenant Net Debt 196.1 Reported 12-month EBITDA^ 74.5 Add back share-based payments^ 7.5 Less interest not in relation to gross borrowings 0.5 Add pro forma acquisition amounts 4.7 Covenant EBITDA 87.2 Rep
Slide 26: Five-year summary
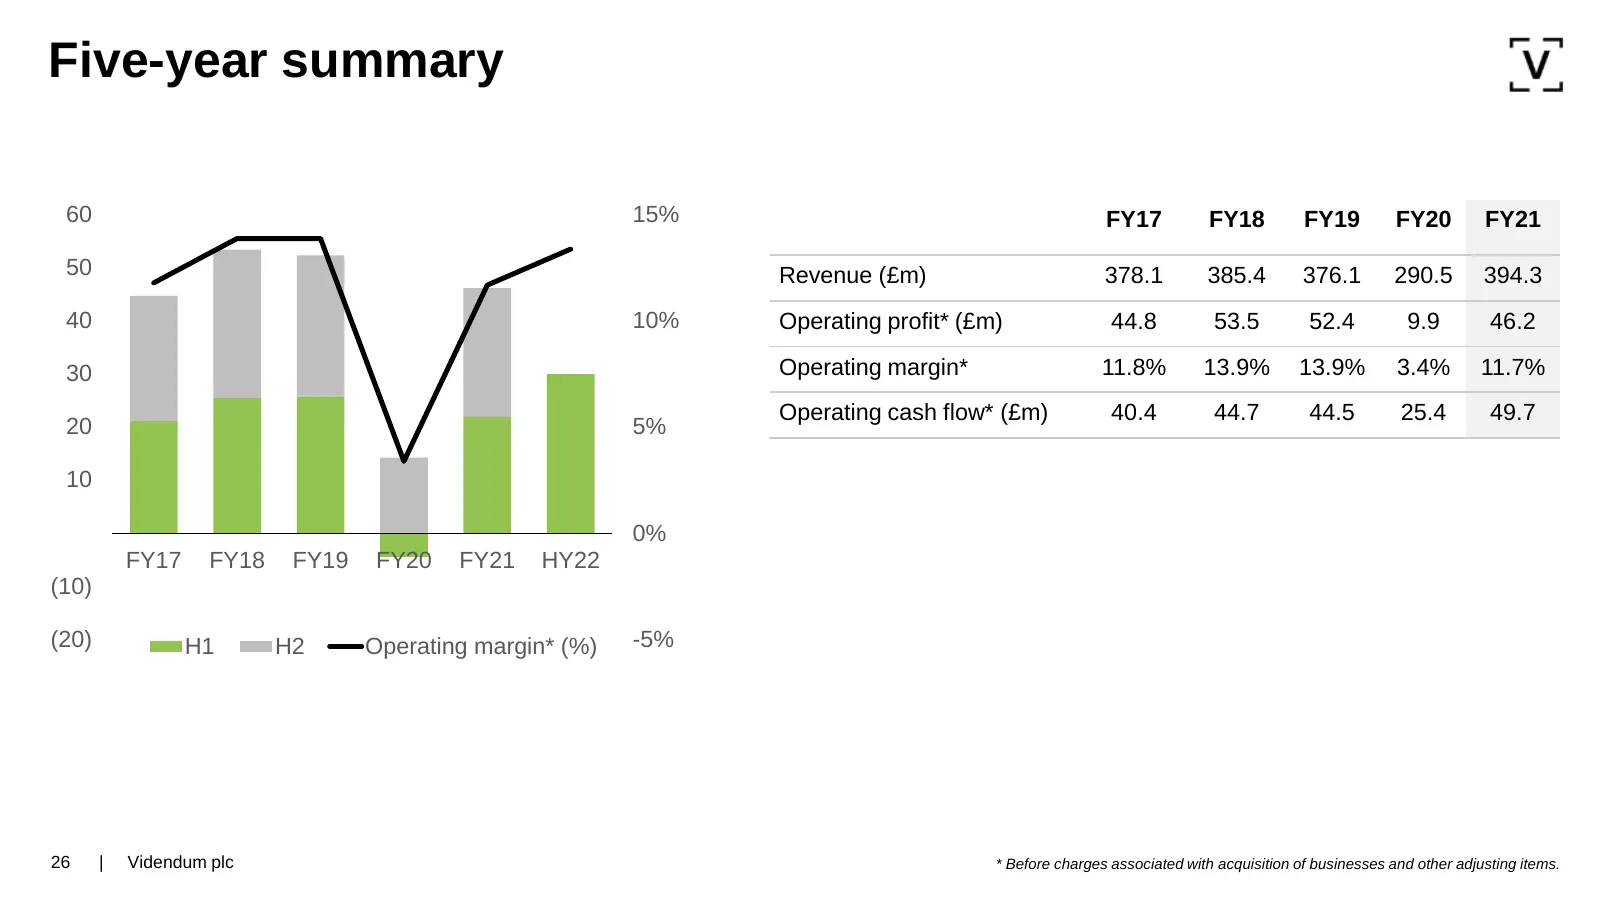
Five-year summary 60 15% FY17 FY18 FY19 FY20 FY21 50 Revenue (£m) 378.1 385.4 376.1 290.5 394.3 40 10% Operating profit* (£m) 44.8 53.5 52.4 9.9 46.2 30 Operating margin* 11.8% 13.9% 13.9% 3.4% 11.7% Operating cash flow* (£m) 40.4 44.7 44.5 25.4 49.7 20 5% 10 0% FY17 FY18 FY19 FY20 FY21 HY22 (10) (2
Slide 27: Responsibility – H1 2022 progress
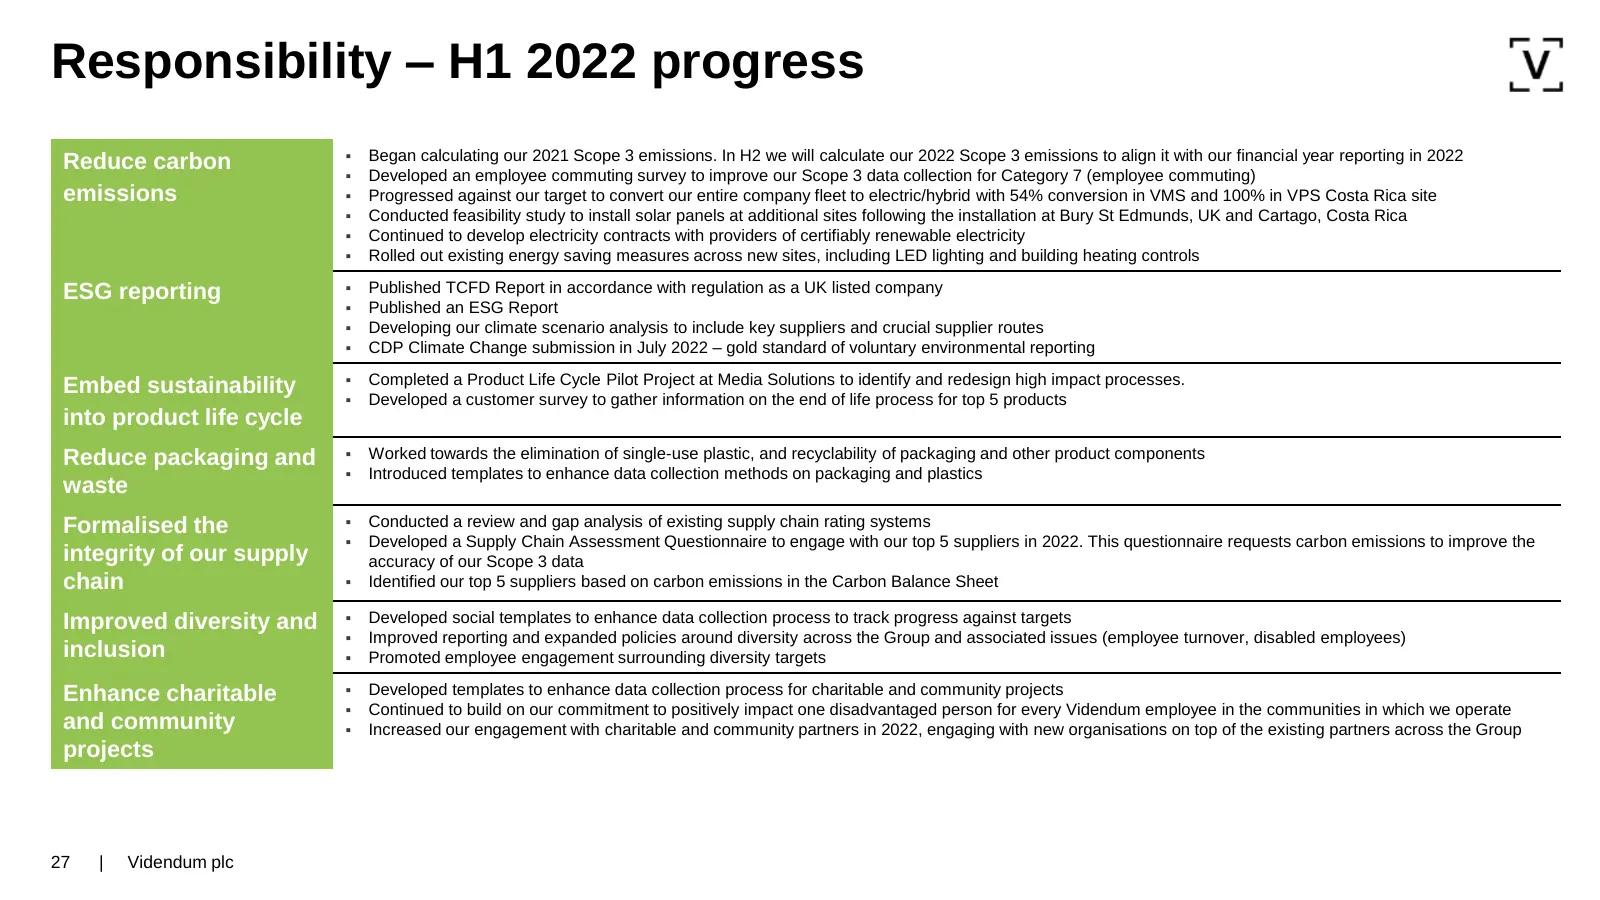
Responsibility – H1 2022 progress ▪ Began calculating our 2021 Scope 3 emissions. In H2 we will calculate our 2022 Scope 3 emissions to align it with our financial year reporting in 2022 Reduce carbon ▪ Developed an employee commuting survey to improve our Scope 3 data collection for Category 7 (emp
Slide 28: Group strategic priorities
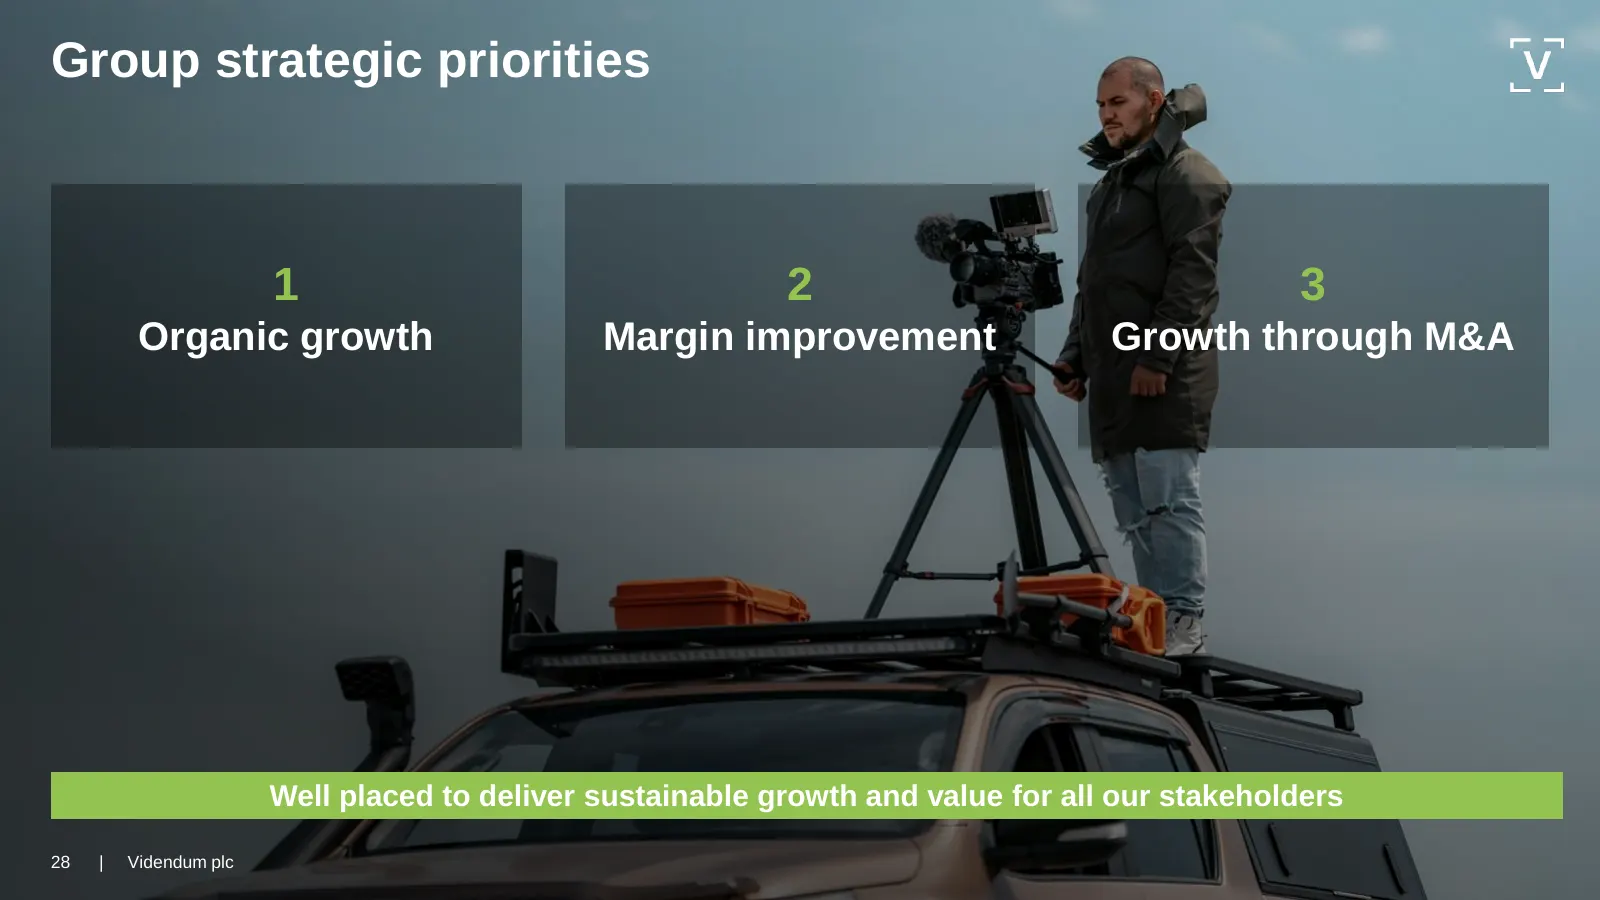
Group strategic priorities 1 2 3 Organic growth Margin improvement Growth through M&A Well placed to deliver sustainable growth and value for all our stakeholders 28 | Videndum plc
Slide 29: Four key structural market growth drivers
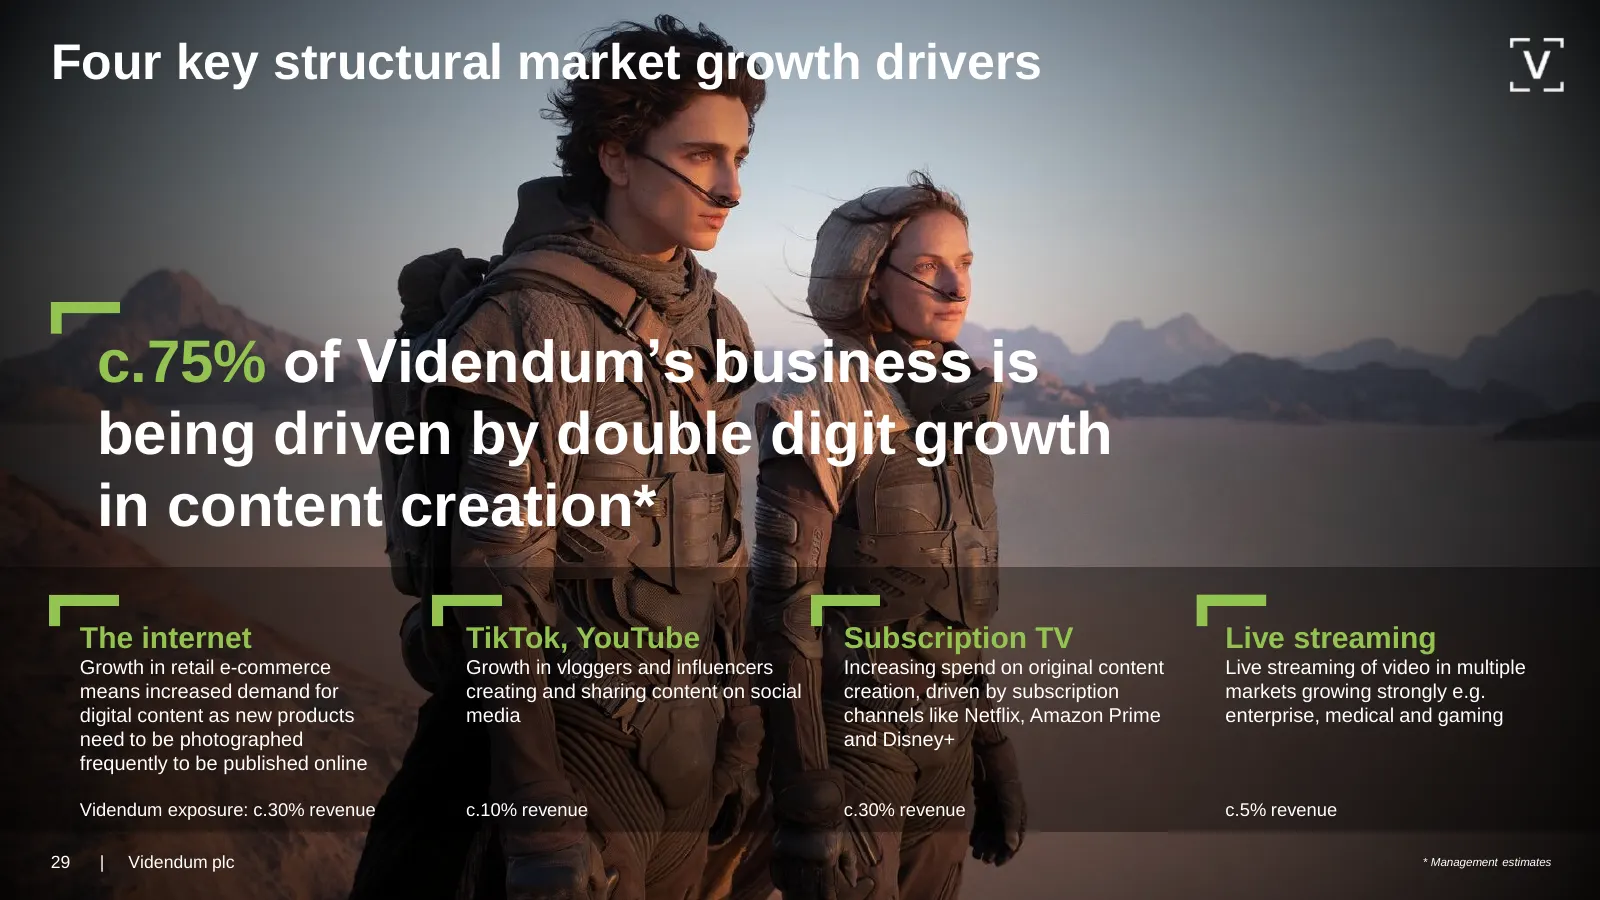
Four key structural market growth drivers c.75% of Videndum’s business is being driven by double digit growth in content creation* The internet TikTok, YouTube Subscription TV Live streaming Growth in retail e-commerce Growth in vloggers and influencers Increasing spend on original content Live stre
Slide 30: Technology change driving shorter replacement cycles
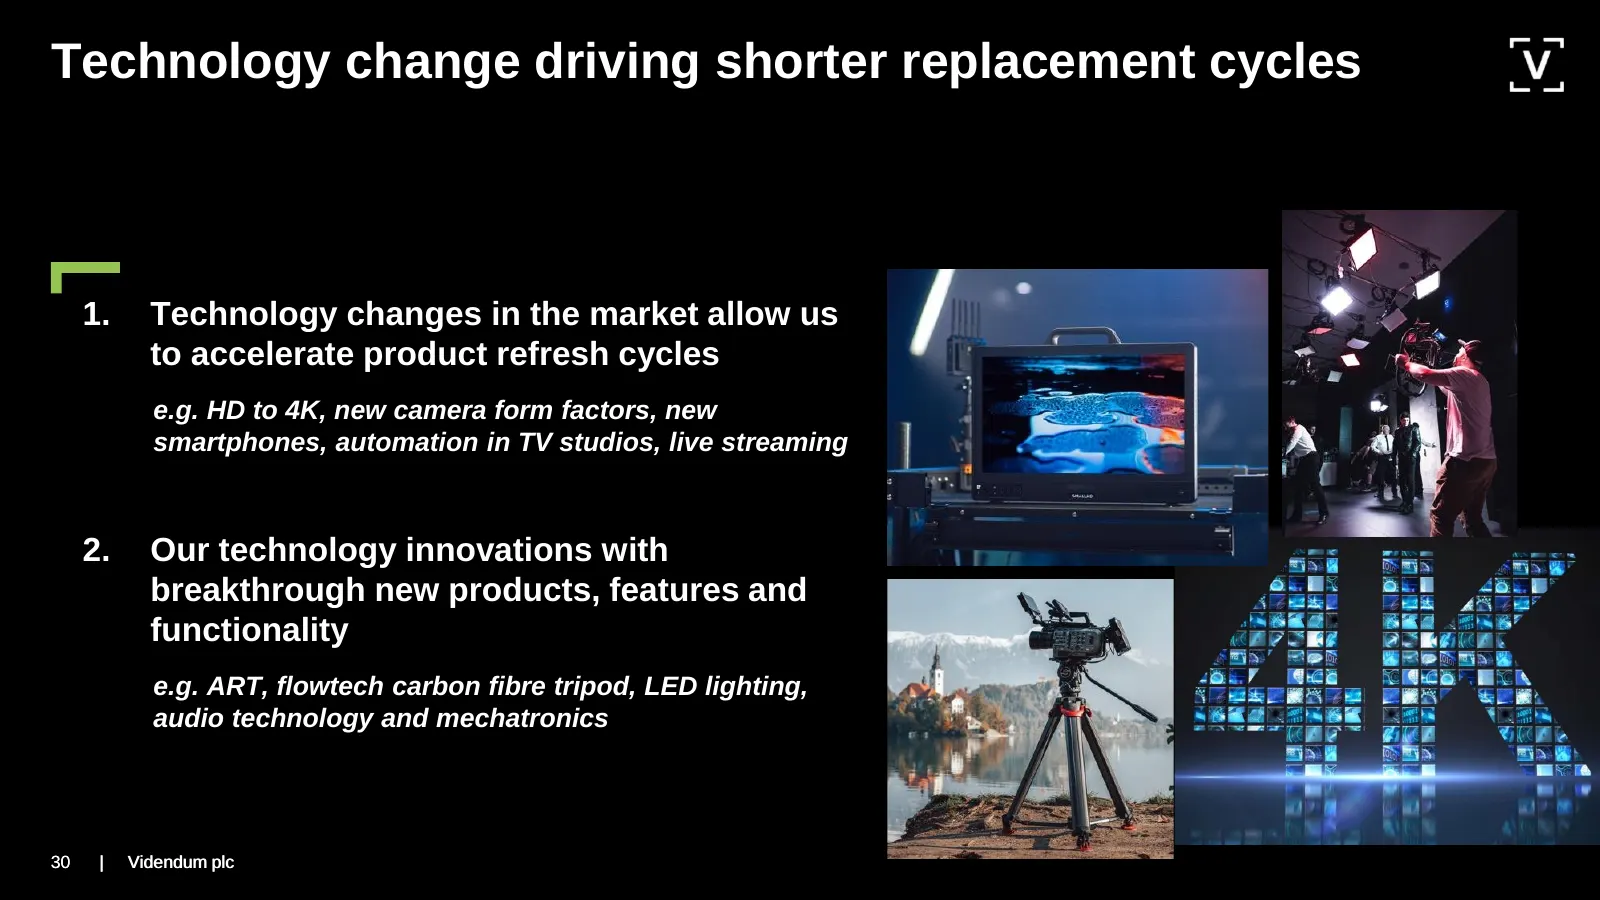
Technology change driving shorter replacement cycles 1. Technology changes in the market allow us to accelerate product refresh cycles e.g. HD to 4K, new camera form factors, new smartphones, automation in TV studios, live streaming 2. Our technology innovations with breakthrough new products, featu
Slide 31: Videndum is growing in three different ways
Videndum is growing in three different ways 1. 2. 3. Growth in our core Growth in new Growth in new businesses areas of content verticals enabled by e.g. professional photography, creation video transmission Broadcast TV and on-set e.g. influencers, vloggers and live streaming monitoring and audio e
Slide 32: Our structure
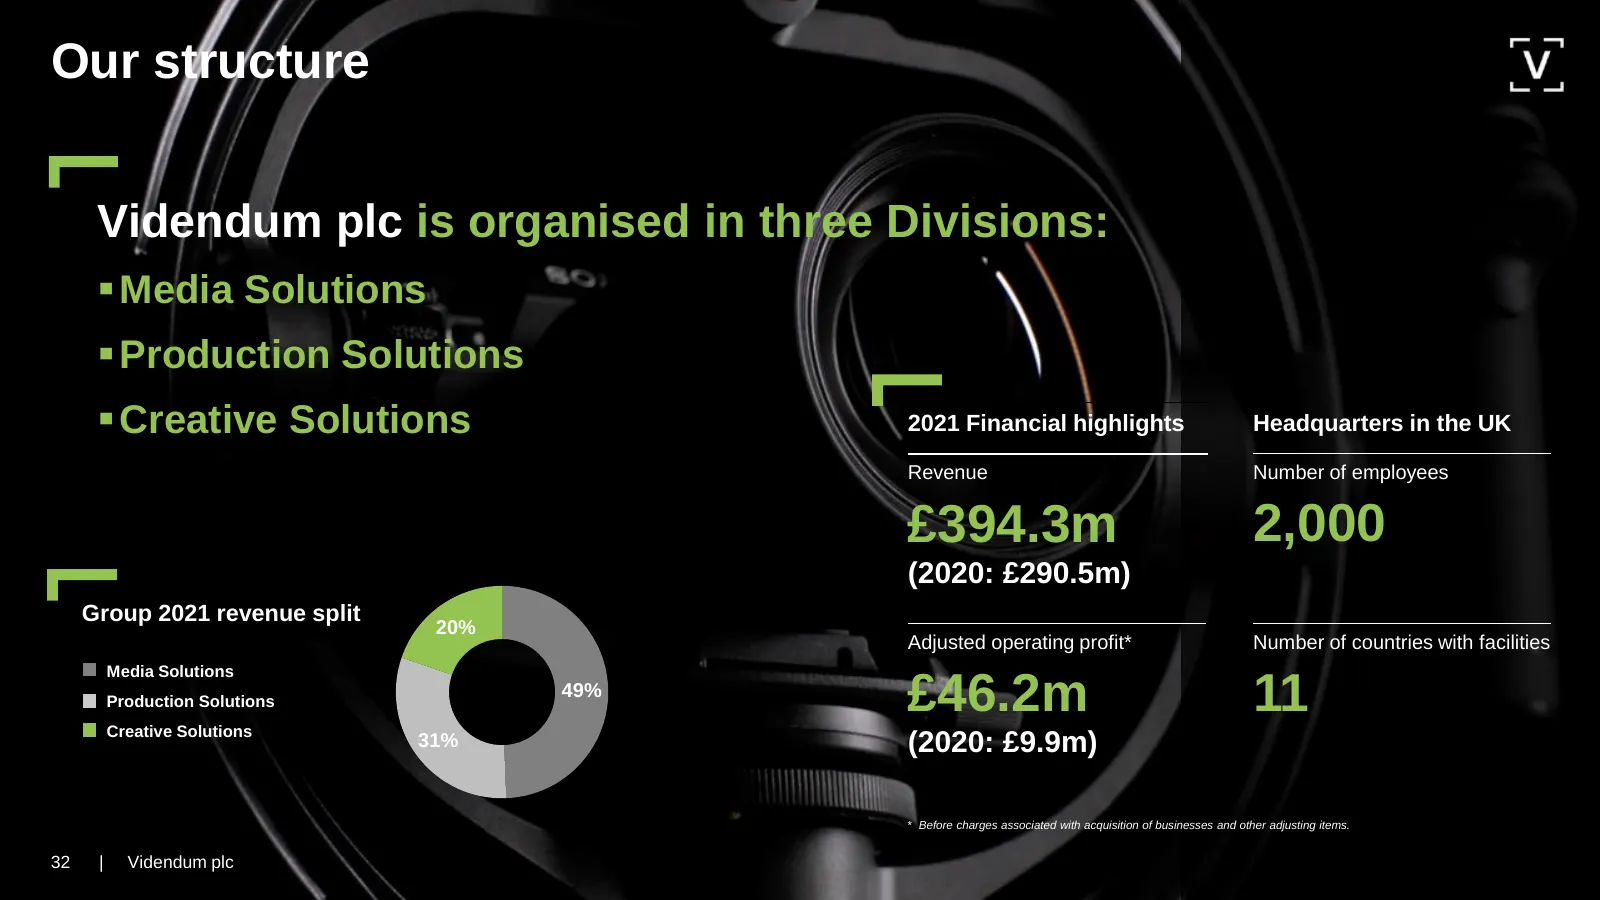
Our structure Videndum plc is organised in three Divisions: ▪ Media Solutions ▪ Production Solutions ▪ Creative Solutions 2021 Financial highlights Headquarters in the UK Revenue Number of employees £394.3m 2,000 (2020: £290.5m) Group 2021 revenue split 20% Adjusted operating profit* Number of count
Slide 33: Media Solutions Products for Professional Photography/Videography and Influencer/Vlogger
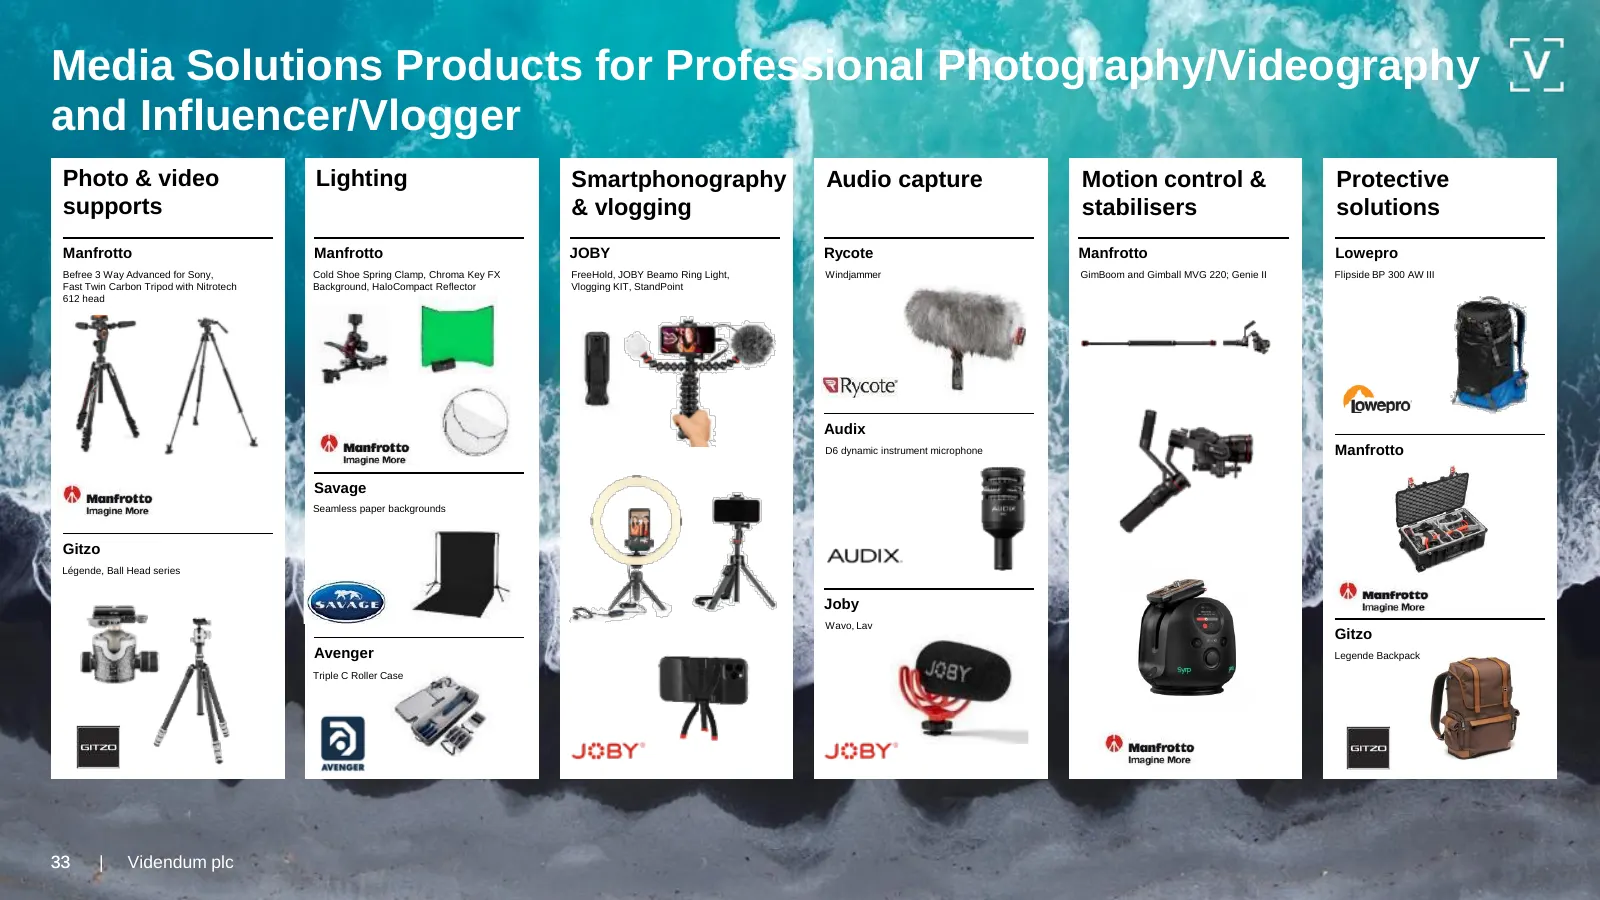
Media Solutions Products for Professional Photography/Videography and Influencer/Vlogger Photo & video Lighting Smartphonography Audio capture Motion control & Protective supports & vlogging stabilisers solutions Manfrotto Manfrotto JOBY Rycote Manfrotto Lowepro Befree 3 Way Advanced for Sony, Cold
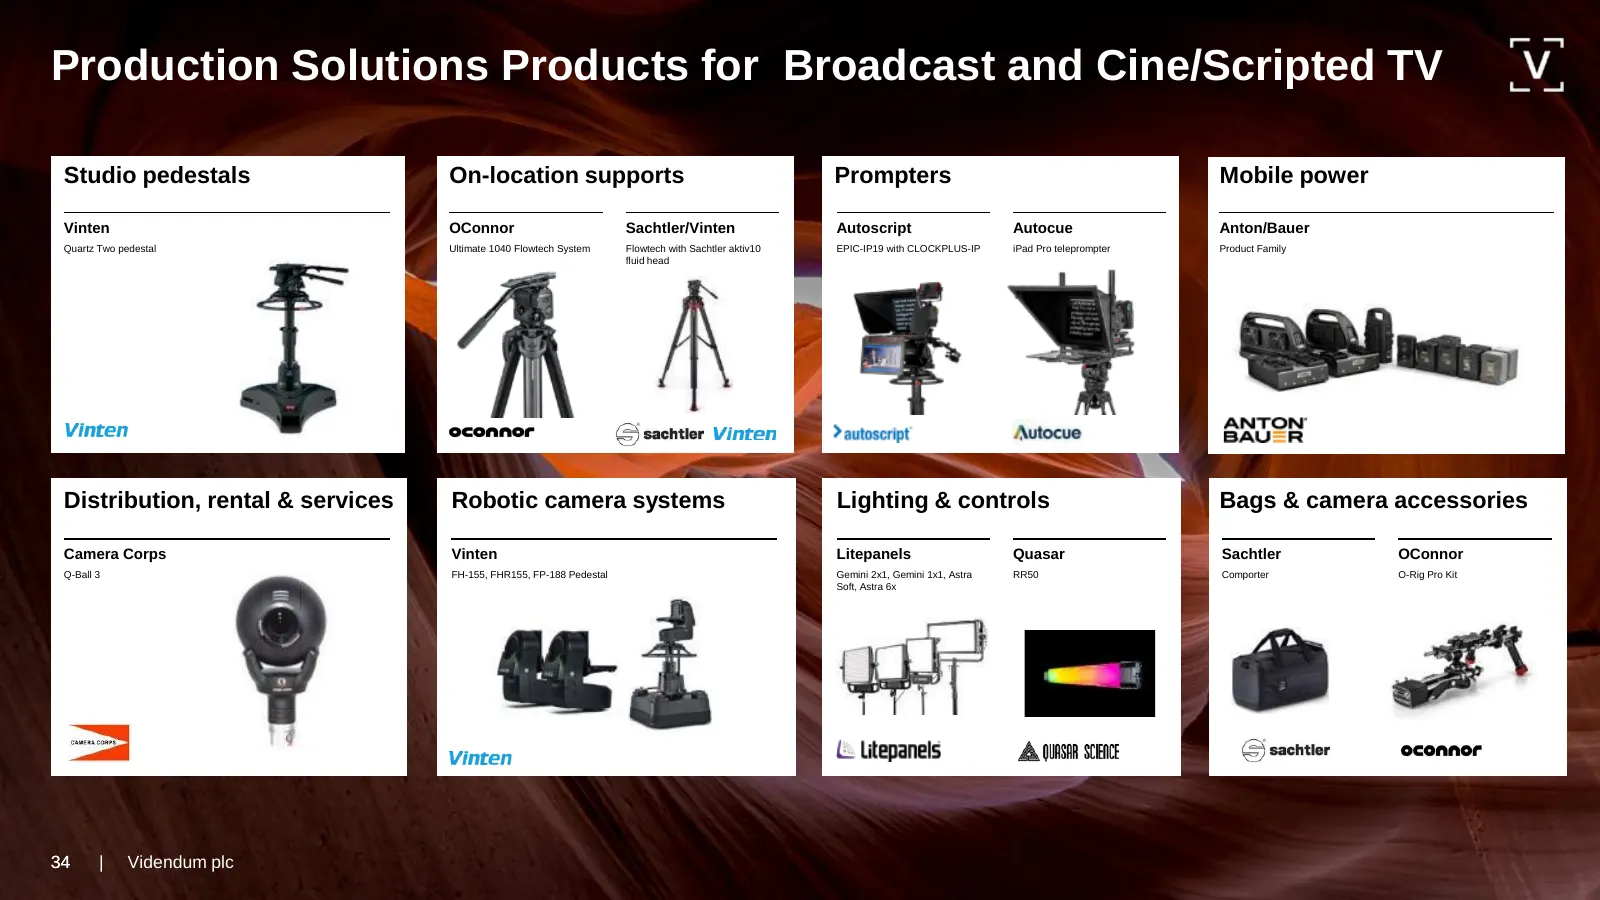
Slide 34: Production Solutions Products for Broadcast and Cine/Scripted TV
Production Solutions Products for Broadcast and Cine/Scripted TV Studio pedestals On-location supports Prompters Mobile power Vinten OConnor Sachtler/Vinten Autoscript Autocue Anton/Bauer Quartz Two pedestal Ultimate 1040 Flowtech System Flowtech with Sachtler aktiv10 EPIC-IP19 with CLOCKPLUS-IP iPa
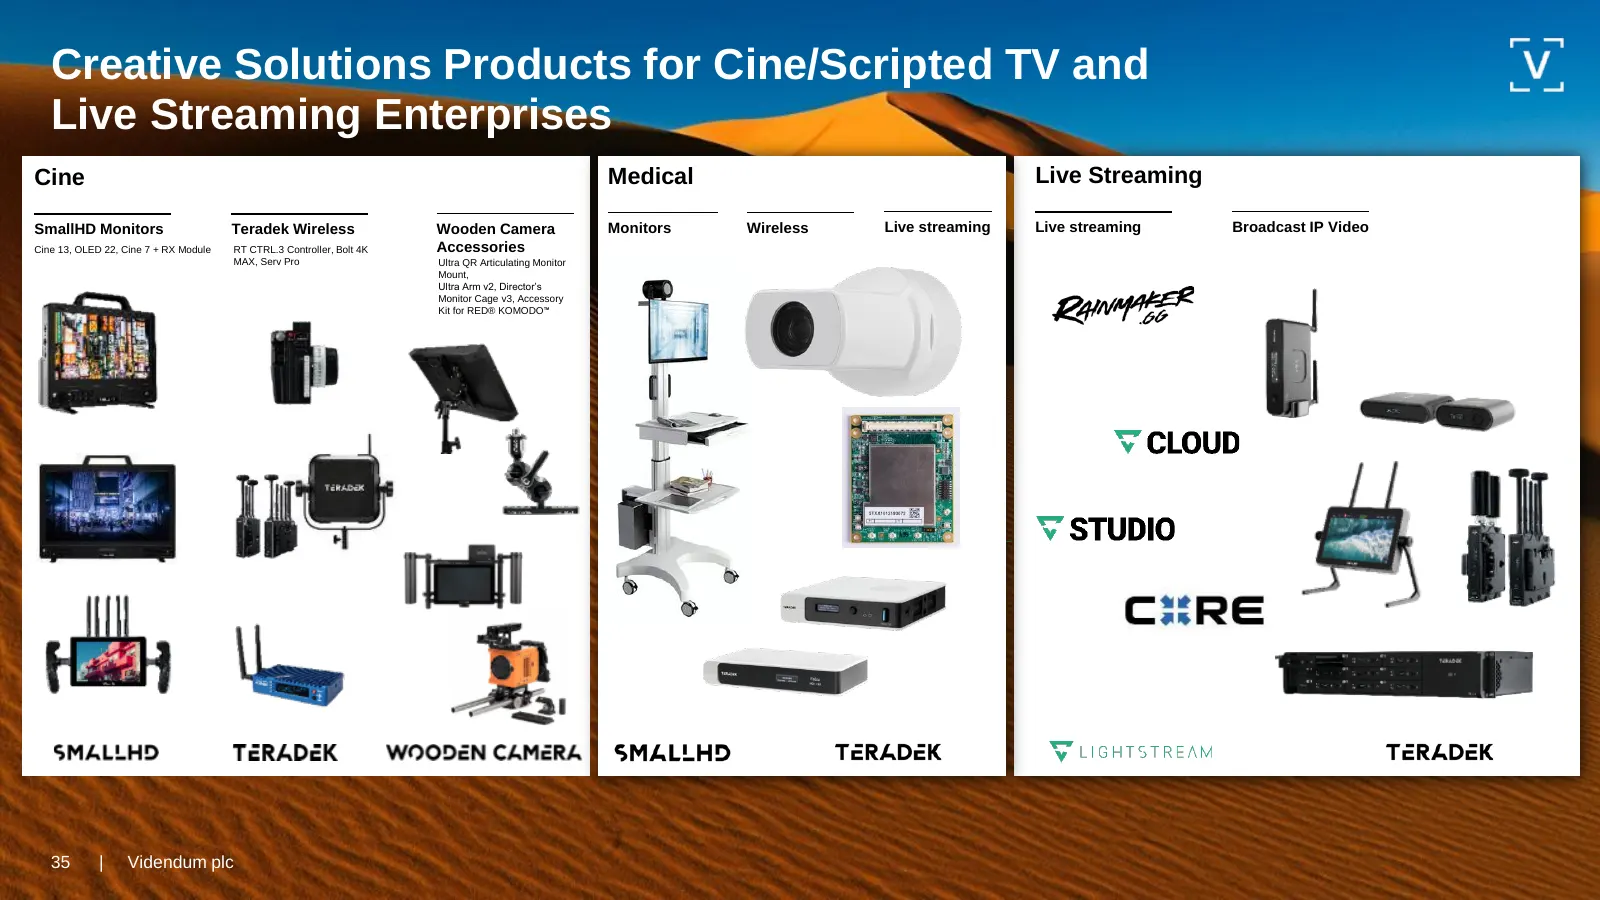
Slide 35: Creative Solutions Products for Cine/Scripted TV and Live Streaming Enterprises
Creative Solutions Products for Cine/Scripted TV and Live Streaming Enterprises Cine Medical Live Streaming SmallHD Monitors Teradek Wireless Wooden Camera Monitors Wireless Live streaming Live streaming Broadcast IP Video Cine 13, OLED 22, Cine 7 + RX Module RT CTRL.3 Controller, Bolt 4K Accessorie
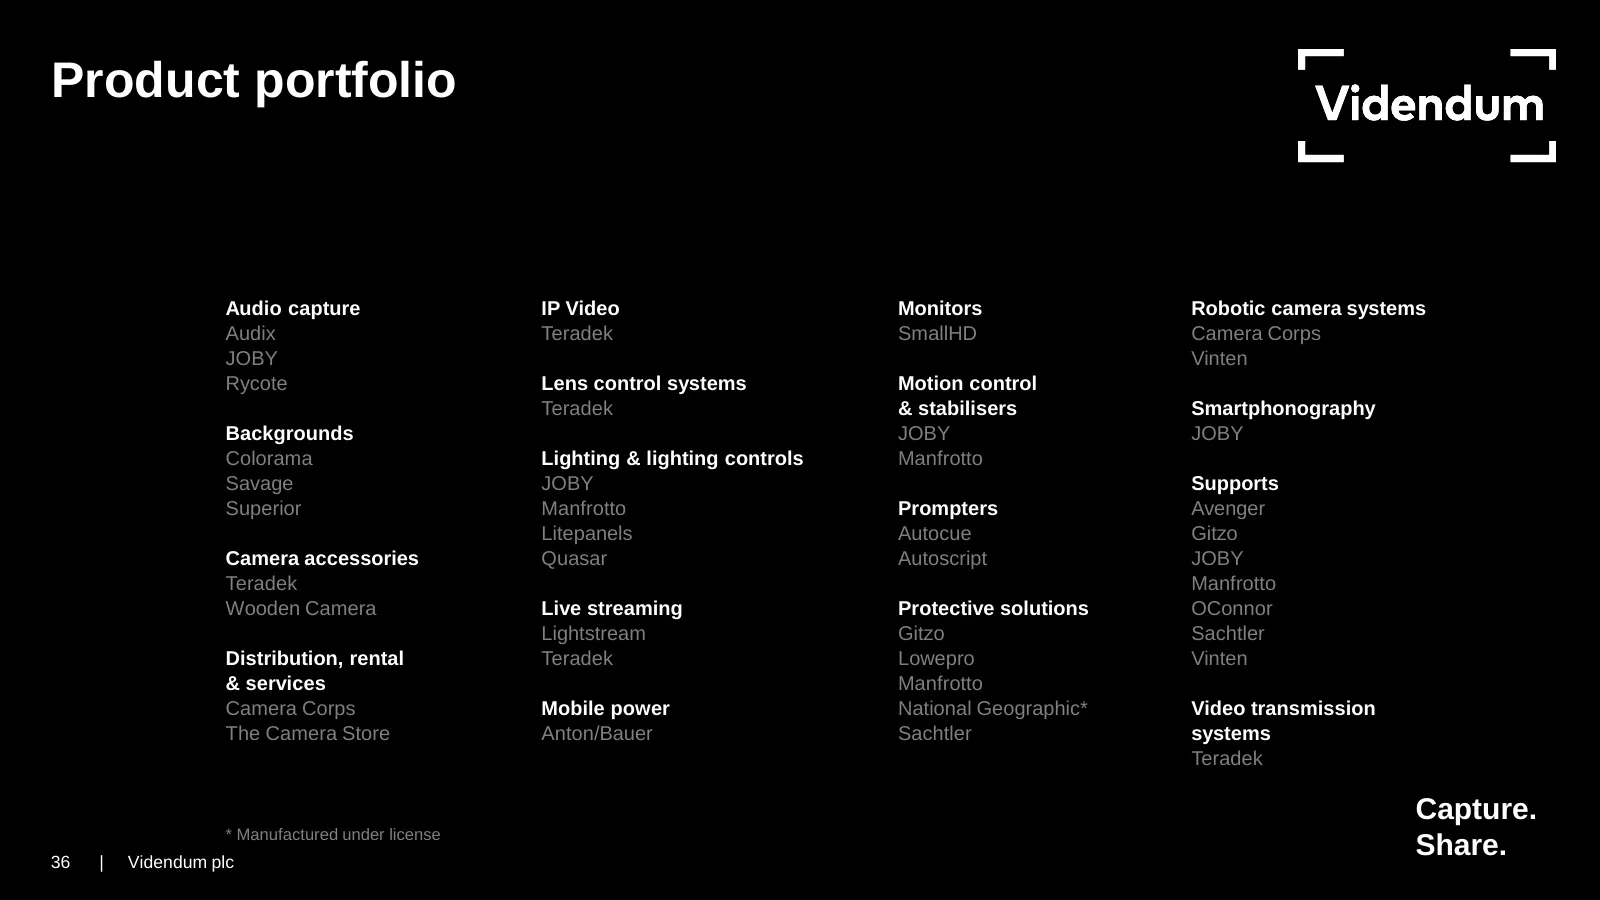
Slide 36: Product portfolio
Product portfolio Audio capture IP Video Monitors Robotic camera systems Audix Teradek SmallHD Camera Corps JOBY Vinten Rycote Lens control systems Motion control Teradek & stabilisers Smartphonography Backgrounds JOBY JOBY Colorama Lighting & lighting controls Manfrotto Savage JOBY Supports Superio
Slide 37: Important notice
Important notice Forward-looking statements This presentation contains forward-looking statements with respect to the financial condition, performance, position, strategy, results and plans of Videndum plc (the “Group”, “Videndum”, or the “Company”) based on Management’s current expectations or beli
Slide 38: Thank you
Thank you Videndum plc Bridge House, Heron Square, Richmond, TW9 1EN United Kingdom T +44 (0)20 8332 4600 info@videndum.com videndum.com Capture. Share.
Source: Internet Archive copy of videndum.com
More decks from Videndum PLC
 H1 2026 Earnings Presentation23 slides · Aug 5, 2026
 H1 2025 Earnings Presentation34 slides · Aug 6, 2025
 FY2024 Earnings Presentation30 slides · Apr 30, 2025
 FY2023 Earnings Presentation40 slides · Apr 23, 2024
 H1 2023 Earnings Presentation37 slides · Sep 26, 2023
 FY2022 Earnings Presentation41 slides · Feb 28, 2023