Bridge Capital — Q1 2013 Earnings Presentation
23 slides from Bridge Capital's earnings presentation, May 8, 2013

Slide 1: Investor Update First Quarter 2013
Investor Update First Quarter 2013 Daniel P. Myers President Chief Executive Officer Thomas A. Sa Executive Vice President Chief Financial Officer Chief Strategy Officer NASDAQ: BBNK www.bridgecapitalholdings.com
Slide 2: Forward Looking Statements
Forward Looking Statements Certain matters discussed herein constitute forward - looking statements within the meaning of the Private Securities Litigation Reform Act of 1995, and are subject to the safe harbors created by that Act. Forward - looking statements describe future plans, strategies, and
Slide 3: Financial Highlights
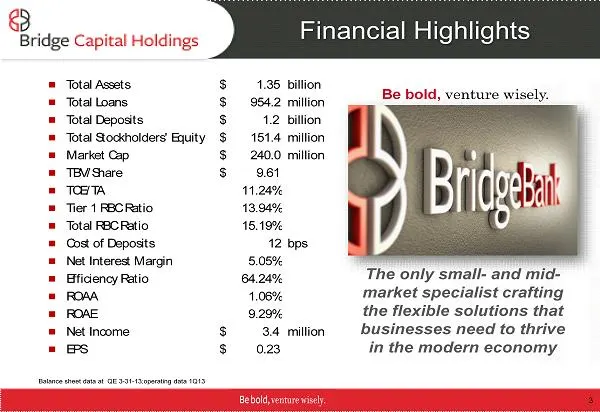
■ Total Assets $ 1.35 billion ■ Total Loans $ 954.2 m illion ■ Total Deposits $ 1.2 billion ■ Total Stockholders' Equity $ 151.4 million ■ Market Cap $ 240.0 million ■ TBV/Share $ 9.61 ■ TCE/TA 11.24% ■ Tier 1 RBC Ratio 13.94% ■ Total RBC Ratio 15.19% ■ Cost of Deposits 12 bps ■ Net Interest Margin
Slide 4: Bridge Bank Franchise
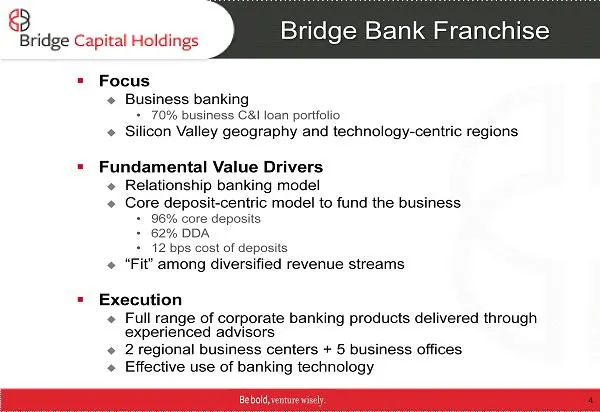
Bridge Bank Franchise ▪ Focus Business banking • 70% business C&I loan portfolio Silicon Valley geography and technology - centric regions ▪ Fundamental Value Drivers Relationship banking model Core deposit - centric model to fund the business • 96% core deposits • 62% DDA • 12 bps cost of d
Slide 5: Attractive Market Potential
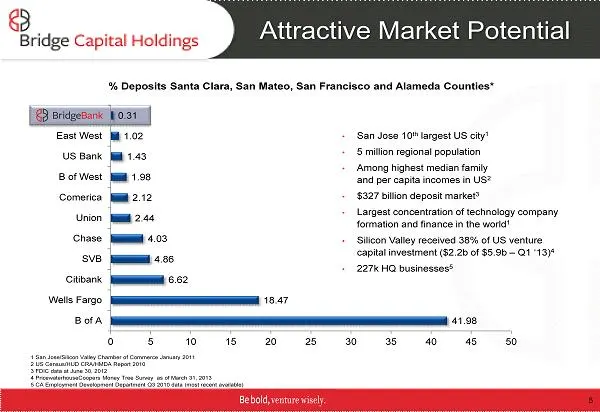
Attractive Market Potential 41.98 18.47 6.62 4.86 4.03 2.44 2.12 1.98 1.43 1.02 0.31 0 5 10 15 20 25 30 35 40 45 50 B of A Wells Fargo Citibank SVB Chase Union Comerica B of West US Bank East West • San Jose 10 th largest US city 1 • 5 million regional population • Among highest median family and pe
Slide 6: Core Market: Silicon Valley
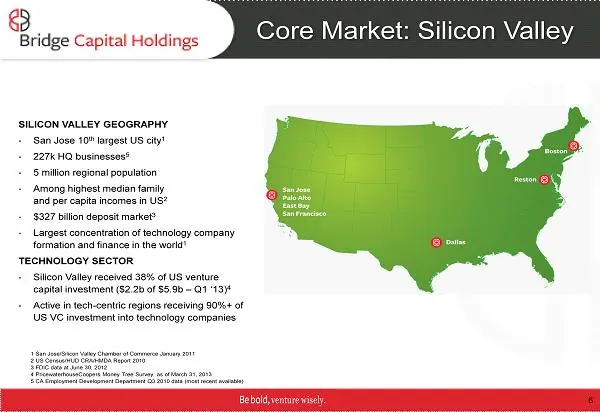
Core Market: Silicon Valley SILICON VALLEY GEOGRAPHY • San Jose 10 th largest US city 1 • 227k HQ businesses 5 • 5 million regional population • Among highest median family and per capita incomes in US 2 • $327 billion deposit market 3 • Largest concentration of technology company formation and fina
Slide 7: Comprehensive Products & Services
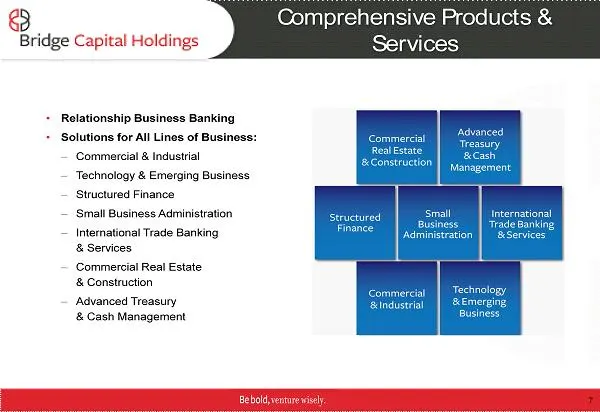
Comprehensive Products & Services • Relationship Business Banking • Solutions for All Lines of Business: – Commercial & Industrial – Technology & Emerging Business – Structured Finance – Small Business Administration – I nternational Trade Banking & Services – Commercial Real Estate & Construction –
Slide 8: Bridge Capital Holdings Value Proposition
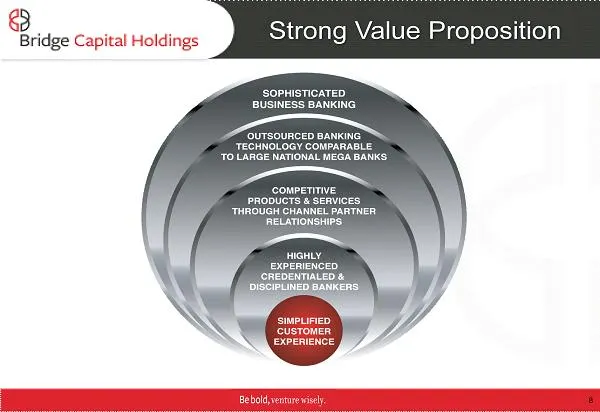
i) Bridge Capital Holdings Ss Value Propositio ‘SOPHISTICATED BUSINESS BANKING ‘TECHNOLOGY COMPARABLE TO LARGE NATIONAL MEGA BANKS > COMPETITIVE PRODUCTS & SERVICES ‘THROUGH CHANNEL PARTNER. RELATIONSHIPS — HGH, (CREDENTIALED &
Slide 9: Straightforward Growth Strategy
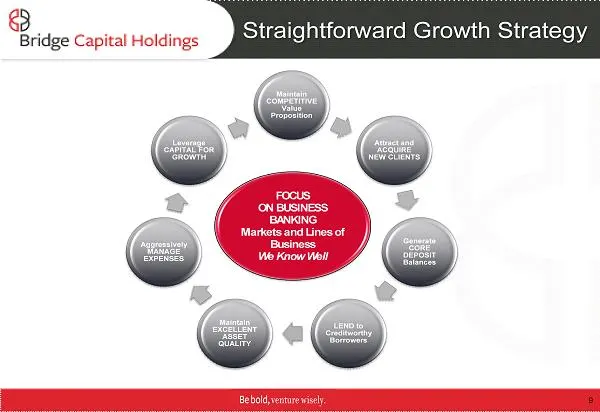
Maintain COMPETITIVE Value Proposition Attract and ACQUIRE NEW CLIENTS Generate CORE DEPOSIT Balances LEND to Creditworthy Borrowers Maintain EXCELLENT ASSET QUALITY Aggressively MANAGE EXPENSES Leverage CAPITAL FOR GROWTH FOCUS ON BU SINESS BANKING Markets and Lines of Business We Know Well Straigh
Slide 10: Q1 2013 Summary
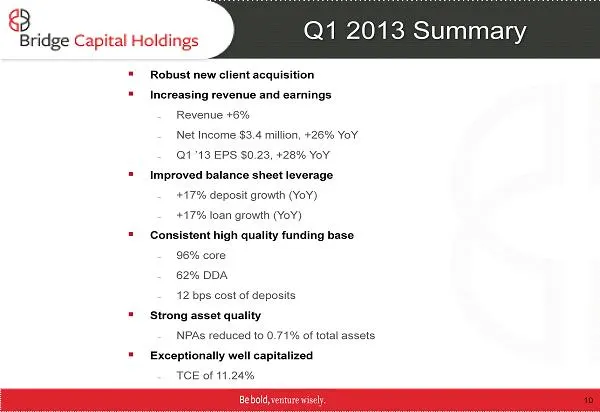
Q1 2013 Summary ▪ Robust new client acquisition ▪ Increasing revenue and earnings – Revenue +6% – Net Income $3.4 million, +26% YoY – Q1 ’13 EPS $0.23, +28% YoY ▪ Improved balance sheet leverage – +17% deposit growth ( YoY ) – +17% loan growth ( YoY ) ▪ Consistent high quality funding base – 96% cor
Slide 11: Expanding Market Presence
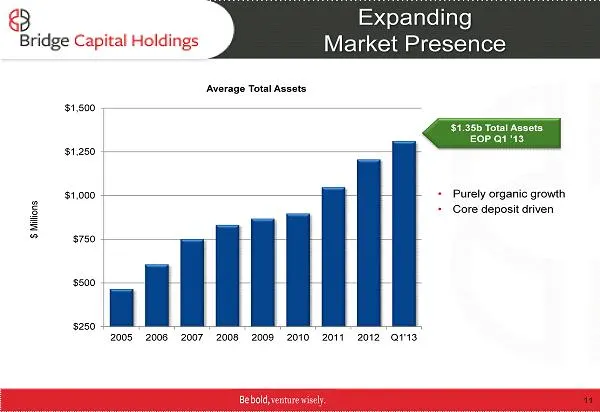
Expanding Market Presence $250 $500 $750 $1,000 $1,250 $1,500 2005 2006 2007 2008 2009 2010 2011 2012 Q1'13 $ Millions Average Total Assets • Purely organic growth • Core deposit driven $ 1.35b Total Assets EOP Q1 ’13 11
Slide 12: Focus on Core Deposits
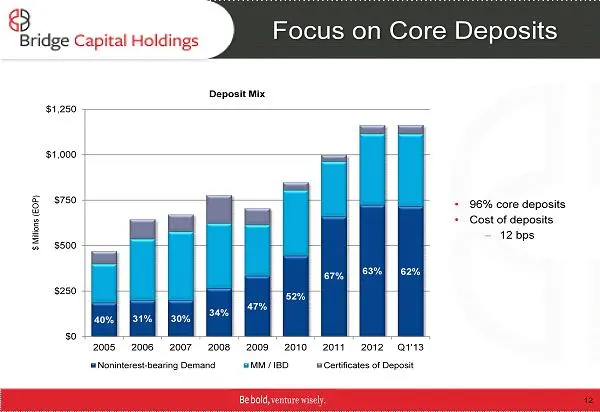
Focus on Core Deposits 40% 31% 30% 34% 47% 52% 67% 63% 62% $0 $250 $500 $750 $1,000 $1,250 2005 2006 2007 2008 2009 2010 2011 2012 Q1'13 $ Millions (EOP) Deposit Mix Noninterest-bearing Demand MM / IBD Certificates of Deposit • 96% core deposits • Cost of deposits – 12 bps 12
Slide 13: True Business Focus
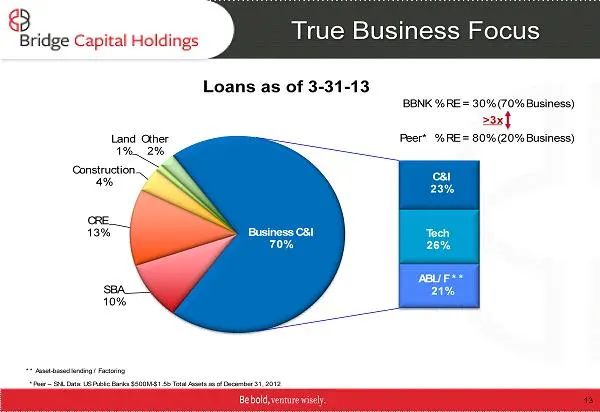
SBA 10% CRE 13% Construction 4% Land 1% Other 2% C&I 23% Tech 26% ABL/F ** 21% Business C&I 70% Loans as of 3 - 31 - 13 True Business Focus BBNK % RE = 30% (70% Business) Peer* % RE = 80% (20% Business) * Peer – SNL Data: US Public Banks $500M - $1.5b Total Assets as of December 31, 2012 ** Asset -
Slide 14: True C&I Focus
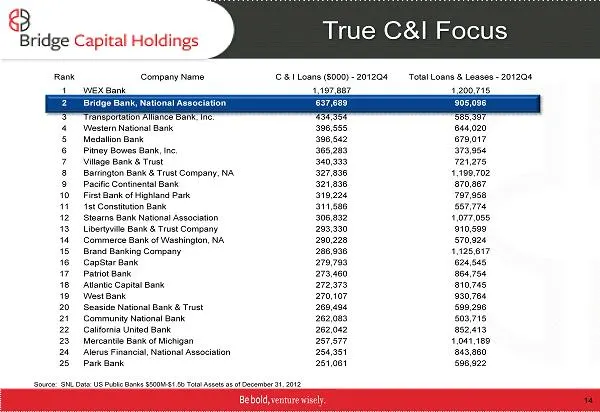
True C&I Focus Source: SNL Data: US Public Banks $500M - $1.5b Total Assets as of December 31, 2012 Rank Company Name C & I Loans ($000) - 2012Q4 Total Loans & Leases - 2012Q4 1 WEX Bank 1,197,887 1,200,715 2 Bridge Bank, National Association 637,689 905,096 3 Transportation Alliance Bank, Inc. 434,
Slide 15: Net Interest Margin
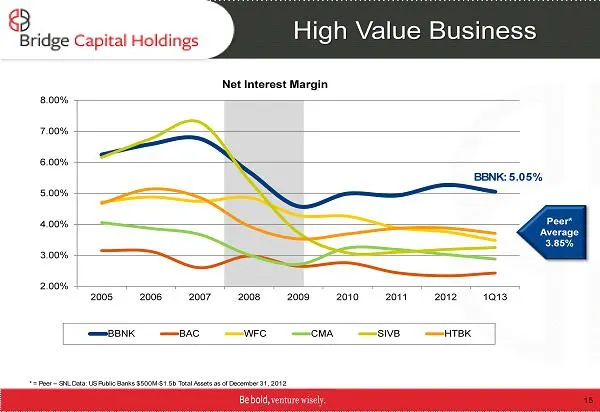
2.00% 3.00% 4.00% 5.00% 6.00% 7.00% 8.00% 2005 2006 2007 2008 2009 2010 2011 2012 1Q13 Net Interest Margin BBNK BAC WFC CMA SIVB HTBK High Value Business BBNK: 5.05% *= Peer – SNL Data: US Public Banks $500M - $1.5b Total Assets as of December 31, 2012 Peer* Average 3.85% 15
Slide 16: Improving Operating Leverage
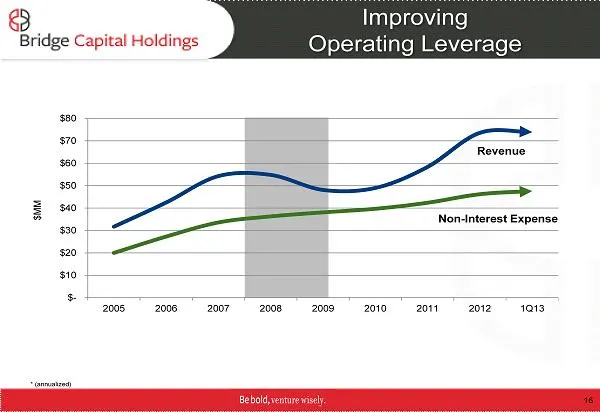
$- $10 $20 $30 $40 $50 $60 $70 $80 2005 2006 2007 2008 2009 2010 2011 2012 1Q13 $MM Improving Operating Leverage Revenue Non - Interest Expense * (annualized) 16
Slide 17: Effective Revenue Generation
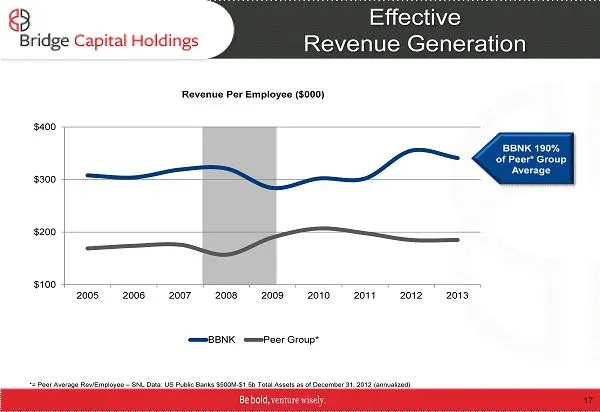
$100 $200 $300 $400 2005 2006 2007 2008 2009 2010 2011 2012 2013 Revenue Per Employee ( $000) BBNK Peer Group* Effective Revenue Generation *= Peer Average Rev/Employee – SNL Data: US Public Banks $500M - $1.5b Total Assets as of December 31, 2012 (annualized) BBNK 190% of Peer* Group Average 17
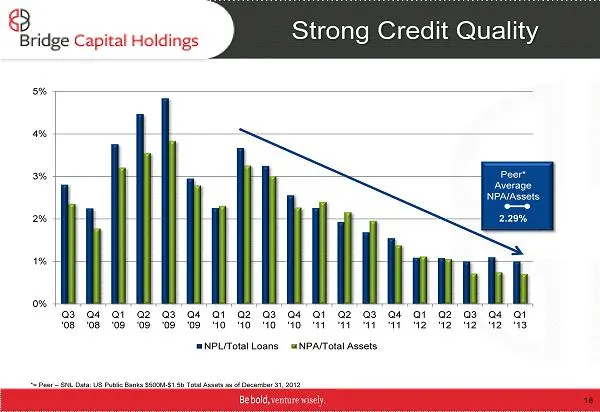
Slide 18: Strong Credit Quality
0% 1% 2% 3% 4% 5% Q3 '08 Q4 '08 Q1 '09 Q2 '09 Q3 '09 Q4 '09 Q1 '10 Q2 '10 Q3 '10 Q4 '10 Q1 '11 Q2 '11 Q3 '11 Q4 '11 Q1 '12 Q2 '12 Q3 '12 Q4 '12 Q1 '13 NPL/Total Loans NPA/Total Assets Strong Credit Quality Peer* Average NPA/Assets 2.29% *= Peer – SNL Data: US Public Banks $500M - $1.5b Total Assets
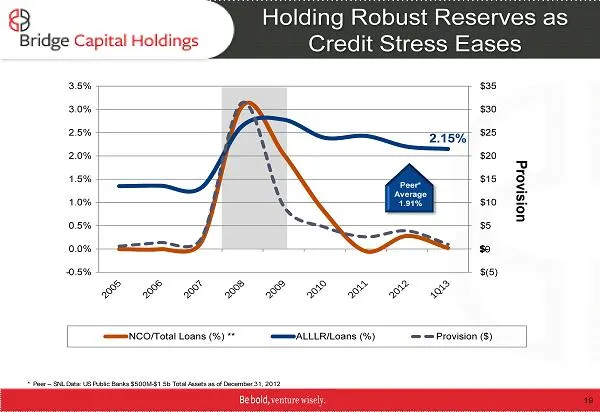
Slide 19: Holding Robust Reserves as Credit Stress Eases
$(5) $- $5 $10 $15 $20 $25 $30 $35 -0.5% 0.0% 0.5% 1.0% 1.5% 2.0% 2.5% 3.0% 3.5% Provision NCO/Total Loans (%) ** ALLLR/Loans (%) Provision ($) Holding Robust Reserves as Credit Stress Eases 2.15% * Peer – SNL Data: US Public Banks $500M - $1.5b Total Assets as of December 31, 2012 $0 Peer* Average
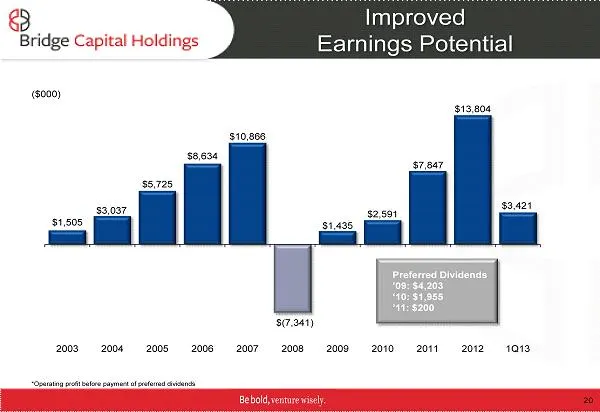
Slide 20: Improved Earnings Potential
$(7,341) $1,505 $3,037 $5,725 $8,634 $10,866 $ 1,435 $2,591 $ 7,847 $13,804 $3,421 2003 2004 2005 2006 2007 2008 2009 2010 2011 2012 1Q13 Improved Earnings Potential Preferred Dividends ’09: $4,203 ‘ 10: $ 1,955 ’11: $200 ($000) *Operating profit before payment of preferred dividends 20
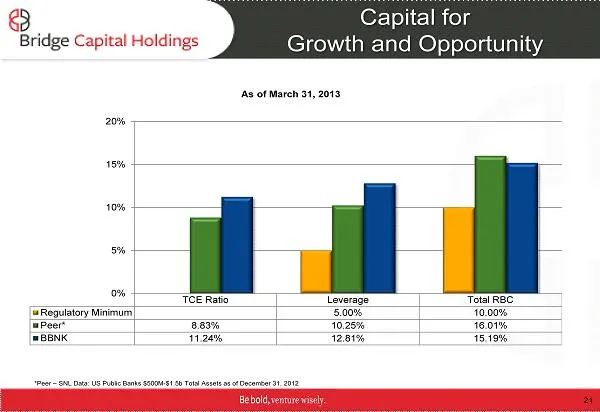
Slide 21: Capital for Growth and Opportunity
Capital for Growth and Opportunity * Peer – SNL Data: US Public Banks $500M - $1.5b Total Assets as of December 31, 2012 TCE Ratio Leverage Total RBC Regulatory Minimum 5.00% 10.00% Peer* 8.83% 10.25% 16.01% BBNK 11.24% 12.81% 15.19% 0% 5% 10% 15% 20% As of March 31, 2013 21
Slide 22: Catalysts for Earnings Growth
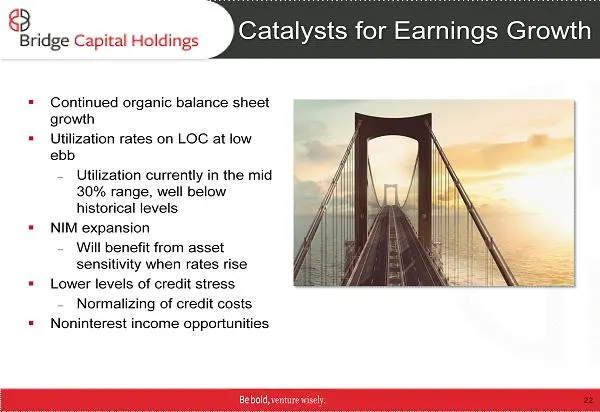
Catalysts for Earnings Growth ▪ Continued organic balance sheet growth ▪ Utilization rates on LOC at low ebb – Utilization currently in the mid 30% range, well below historical levels ▪ NIM expansion – Will benefit from asset sensitivity when rates rise ▪ Lower levels of credit stress – Normalizing
Slide 23: Contact Information
Contact Information Investor Relations Contact Thomas A. Sa Bridge Capital Holdings 55 Almaden Blvd., Suite 100 San Jose, CA 95113 (408) 423 - 8500 ir@bridgebank.com 23
Source: SEC EDGAR · 8-K filed May 8, 2013
More decks from Bridge Capital Holdings
 Merger or Acquisition (March 2015)11 slides · Mar 9, 2015
 Q4 2014 Earnings Presentation22 slides · Feb 4, 2015
 Q2 2014 Earnings Presentation23 slides · Jul 29, 2014
 Shareholder Meeting (May 2014)19 slides · May 28, 2014
 Q1 2014 Earnings Presentation23 slides · May 13, 2014
 Q4 2013 Earnings Presentation24 slides · Feb 5, 2014