Chittenden — Merger or Acquisition (February 2003)
27 slides from Chittenden's merger presentation, Feb 3, 2003
Slide 1: Chittenden Corporation
Chiltan CORPORATION As of December 31, 2002 Chitteridene bs BE FLAGSHIP BANK UNE BANK TRLST Ocean,
Slide 2: A Compelling Story
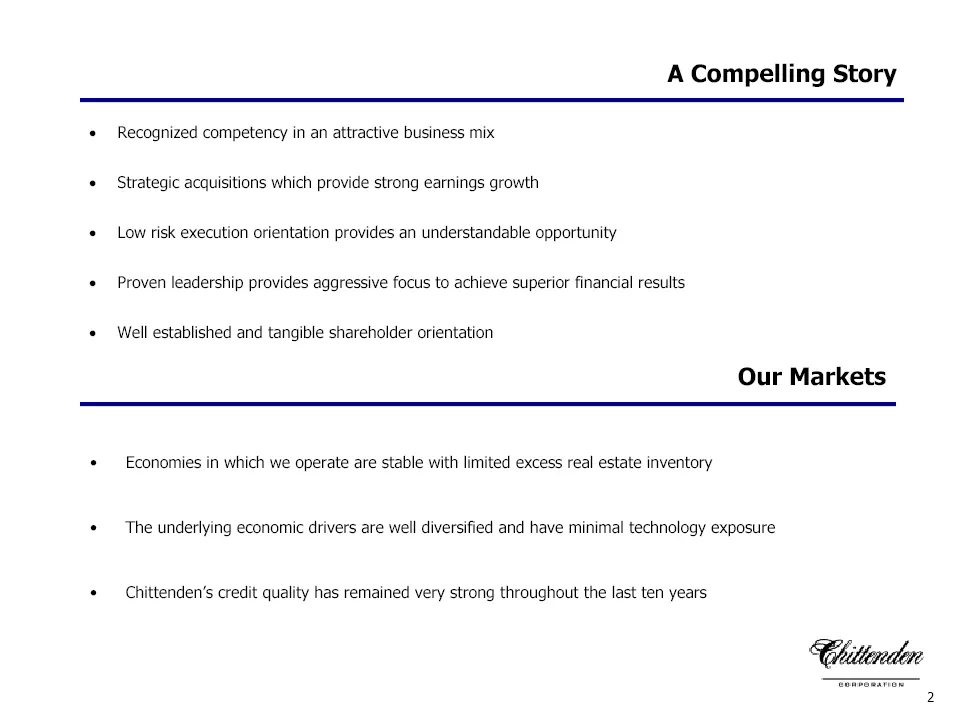
A Compelling Story «Recognized competency in an attractive business mix * Strategic acquisitions which provide strong earnings growth * Low risk execution orientation provides an understandable opportunity * Proven leadership provides aggressive focus to achieve superior financial results + Well est
Slide 3: Loans and Deposits by State
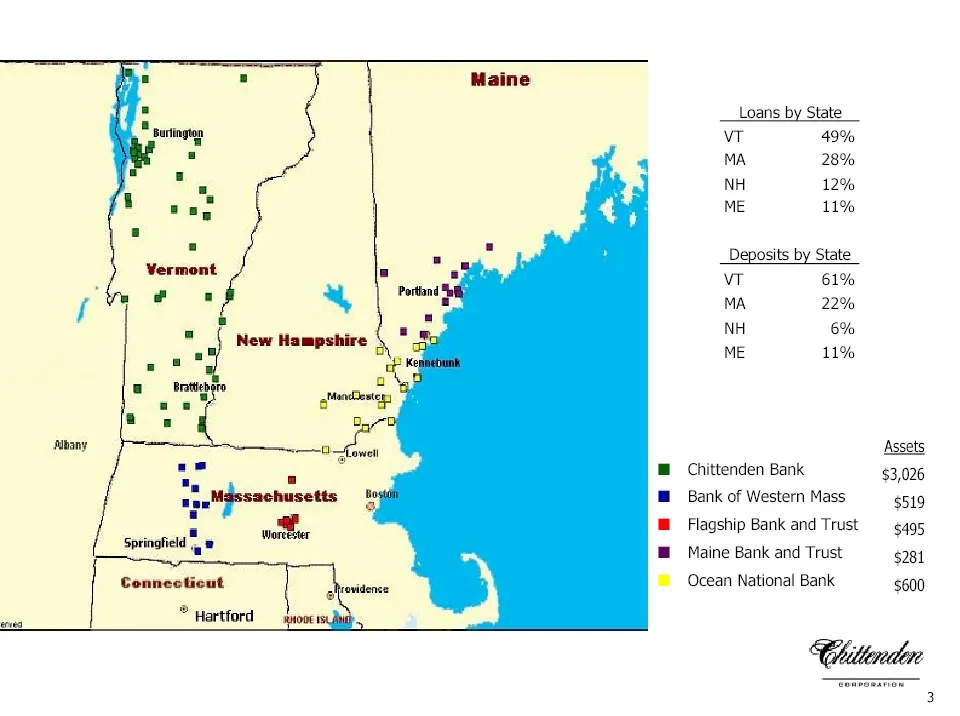
Loans by State. VT 49% MA 28% NH 12% ME 11% Deposits by State vT 61% MA 22% NH 6% ME 11% Assets Chittenden Bank $3,026 Bank of Western Mass $519 Flagship Bank and Trust g495 Maine Bank and Trust $281 . Ocean National Bank $600
Slide 4: Strategic Direction
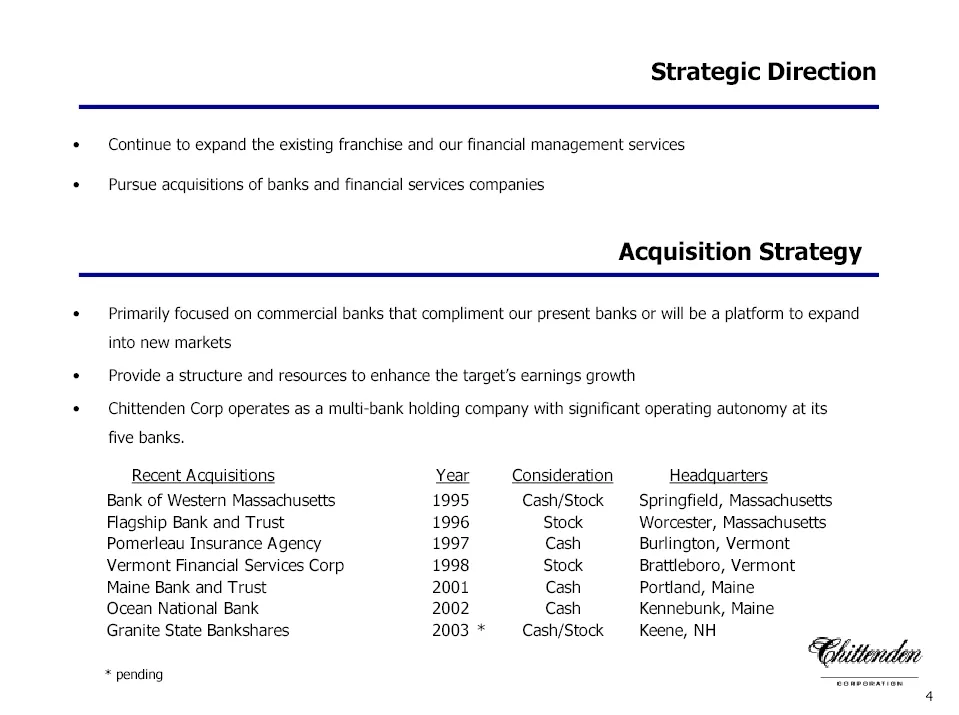
Strategic Direction * Continue to expand the existing franchise and our financial management services * Pursue acquisitions of banks and financial services companies Acquisition Strategy + Primarily focused on commercial banks that compliment our present banks or will be a platform to expand into ne
Slide 5: Business Approach
Business Approach Deep relationships with worthwhile customers Focus on small and mid-sized businesses Maintain conservative underwriting standards and discipline Offer a complete range of banking products and services Geographically diverse branch franchise with both a consumer and small business f
Slide 6: Business Services
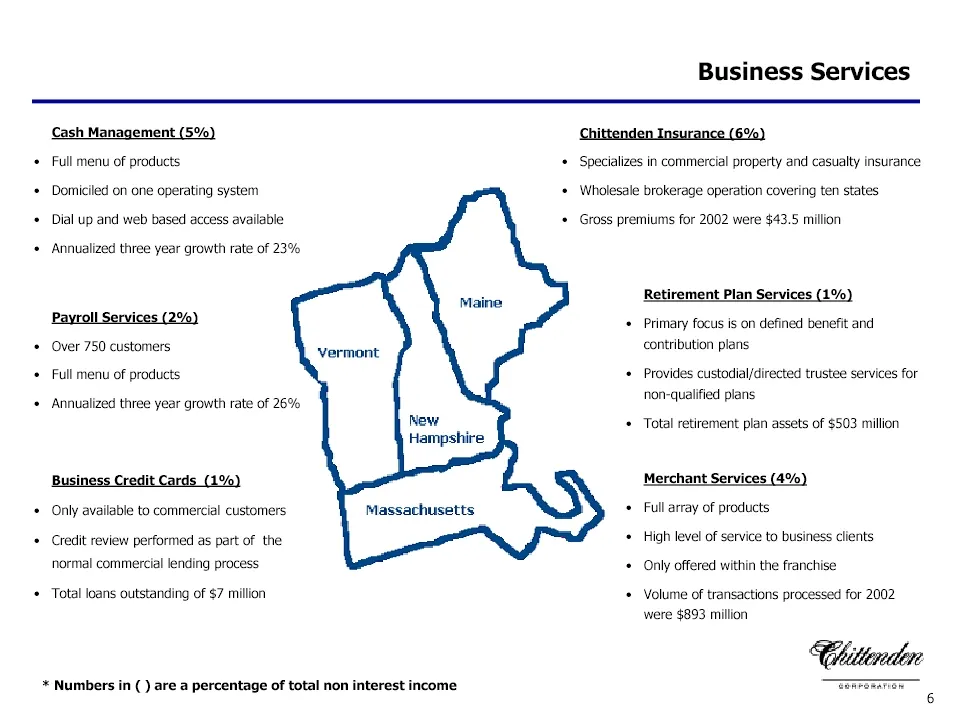
Business Services Cash Management (5%) Chittenden Insurance (6%) ‘+ Full menu of products ‘+ Specializes in commercial property and casualty insurance ‘+ Domiciled on one operating system ‘+ Wholesale brokerage operation covering ten states + Dial up and web based access available Gross premiums for
Slide 7: Financial Management Services
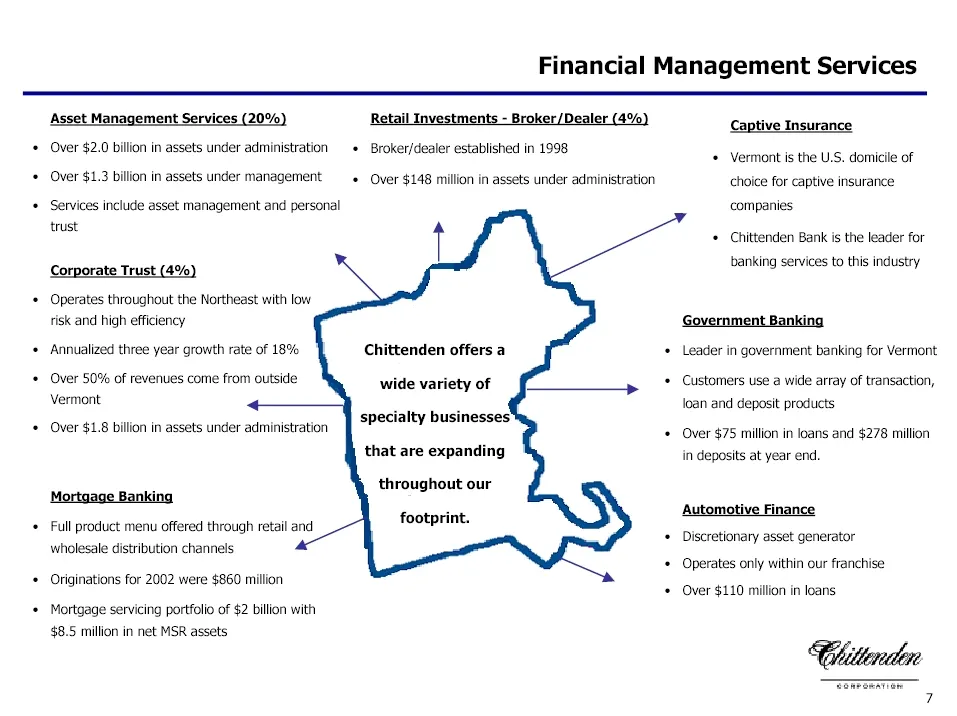
Financial Management Services Asset Management Services (20%) Retail Investments - Broker /Dealer (4%! Captive Insurance Over $2.0 billion in assets under administration + Broker/dealer established in 1998 «Vermont is the US, domicile of Over $1.3 billion in assets under management + Qver $148 milio
Slide 8: Consistent Superior Financial Performance
Consistent Superior Financial Performance Strong net interest margin Low cost stable sources of funding Strong fee based revenues in targeted businesses Efficient cost structure Strong capital Conservative reserves and excellent credit quality
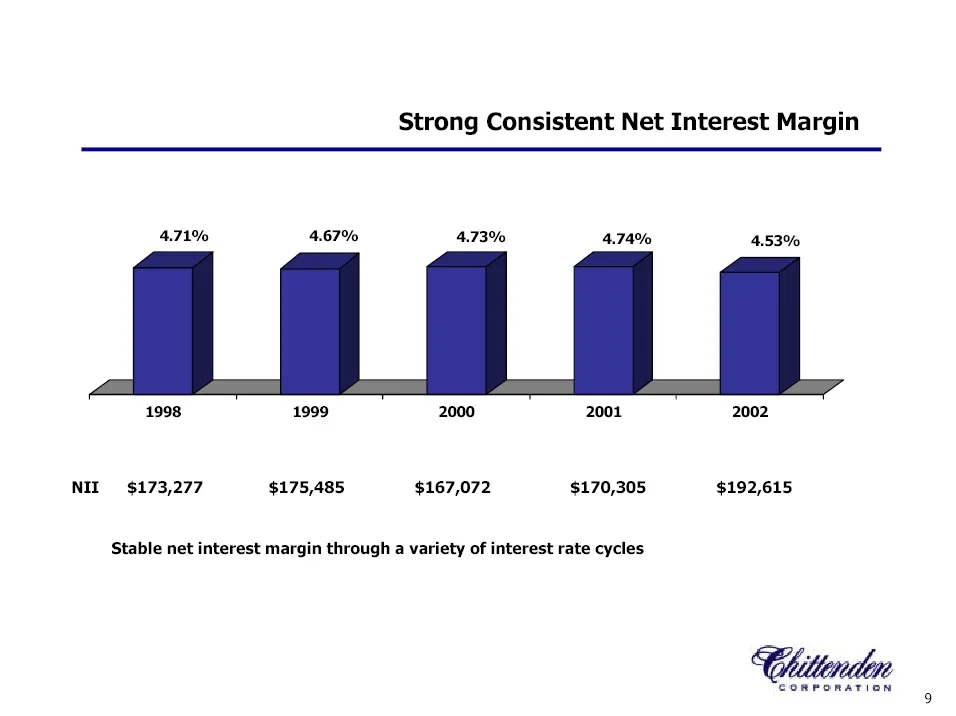
Slide 9: Strong Consistent Net Interest Margin
Strong Consistent Net Interest Margin 4.71% 4.67% 4.73% 4.74% 4.53% 1998 1999 2000 2001 2002 NIL $173,277 $175,485 $167,072 $170,305 $192,615 Stable net interest margin through a variety of interest rate cycles ‘CORPORATION
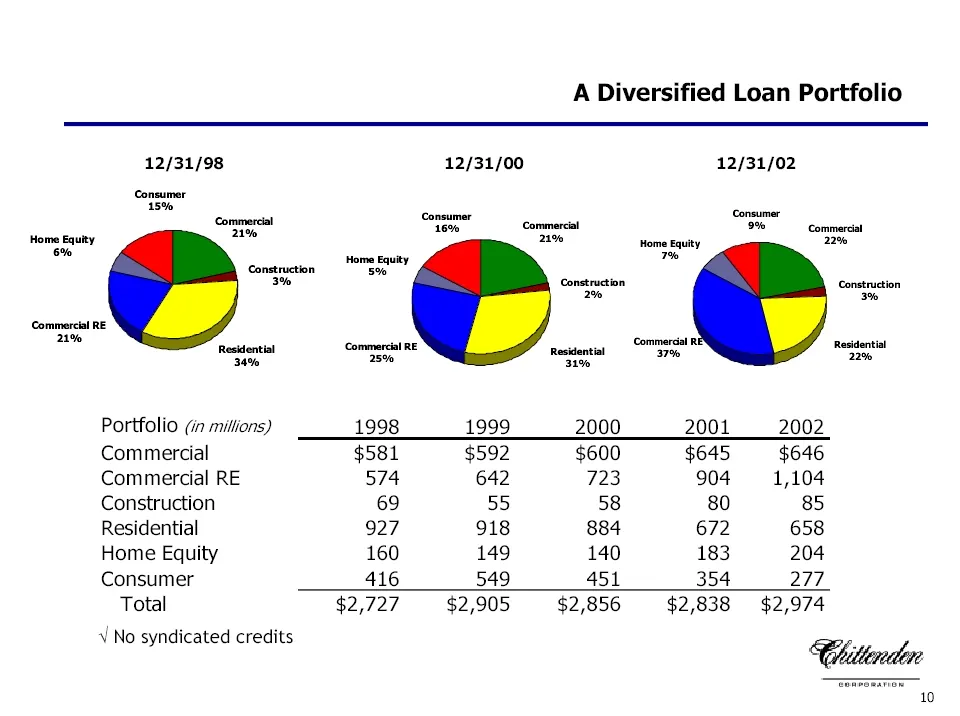
Slide 10: A Diversified Loan Portfolio
A Diversified Loan Portfolio 12/31/98 12/31/00 12/31/02 ose Commercial one Conc Fe commas Home Equity 21% 21% some Equtty 22% constrain mest ™ 3% Construction Construction 3 3 Commercial RE 21% on comma vt Commas Reser Portfolio (in millions) 1998 1999 2000 2001 2002 Commercial $581 $592 $600 $645 $
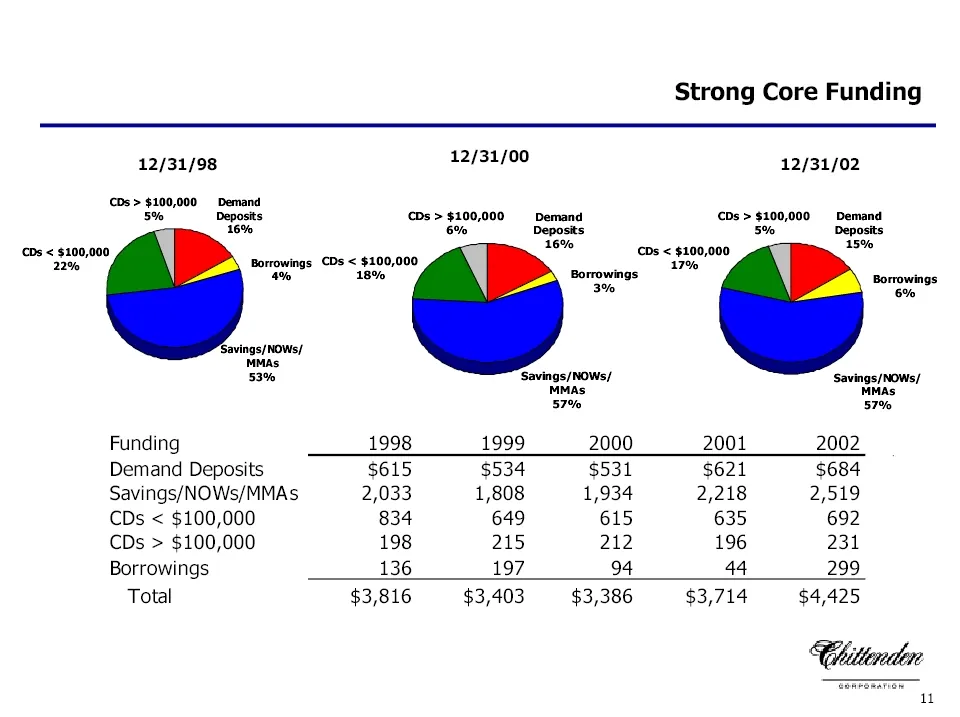
Slide 11: Strong Core Funding
Strong Core Funding 12/31/98 12/31/00 12/31/02 s> $100,000 Demand oe Deposts eps > $100,000 pemand Ds > $100,000 Demand To be Deposts 50 Deposits Te% 15% (CDs < $100,000 Ds < $100,000 22% Borrowings CDs < $100,000 a0 2% 18% Borrowings Borrowings 3% "oon 'Savings/NOWs/ MMAS 53% ‘Savings/NOWs/ Savings
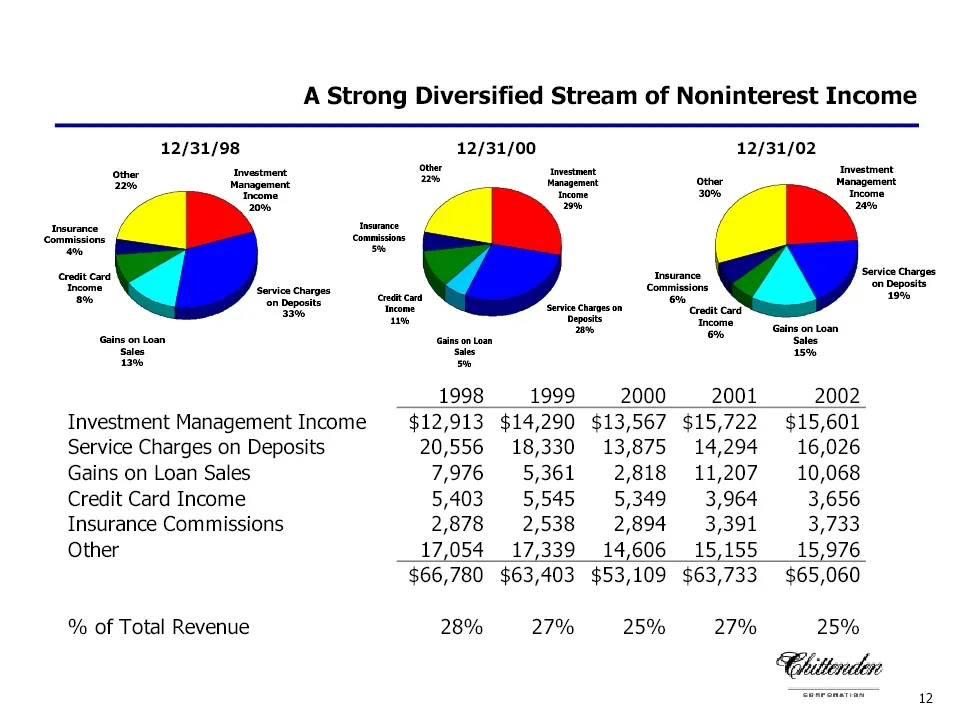
Slide 12: A Strong Diversified Stream of Noninterest Income
A Strong Diversified Stream of Noninterest Income 12/31/98 other Investment 226 Management 20% Insurance commissions os crecit card "income Service Charges Investment Management Income Service Charges on Deposits Gains on Loan Sales Credit Card Income Insurance Commissions Other % of Total Revenue 1
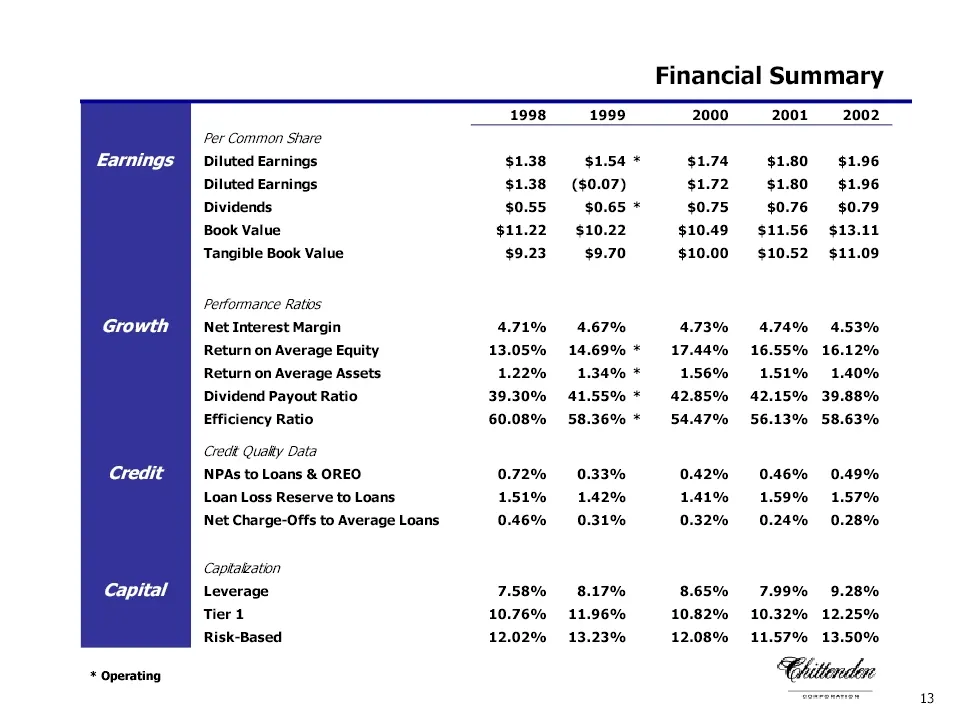
Slide 13: Earnings
Earnings Per Common Share Diluted Earnings Diluted Earnings Dividends Book Value Tangible Book Value Performance Ratios Net Interest Margin Return on Average Equity Return on Average Assets Dividend Payout Ratio Efficiency Ratio Credé Qualty Data NPAs to Loans & OREO Loan Loss Reserve to Loans Net C
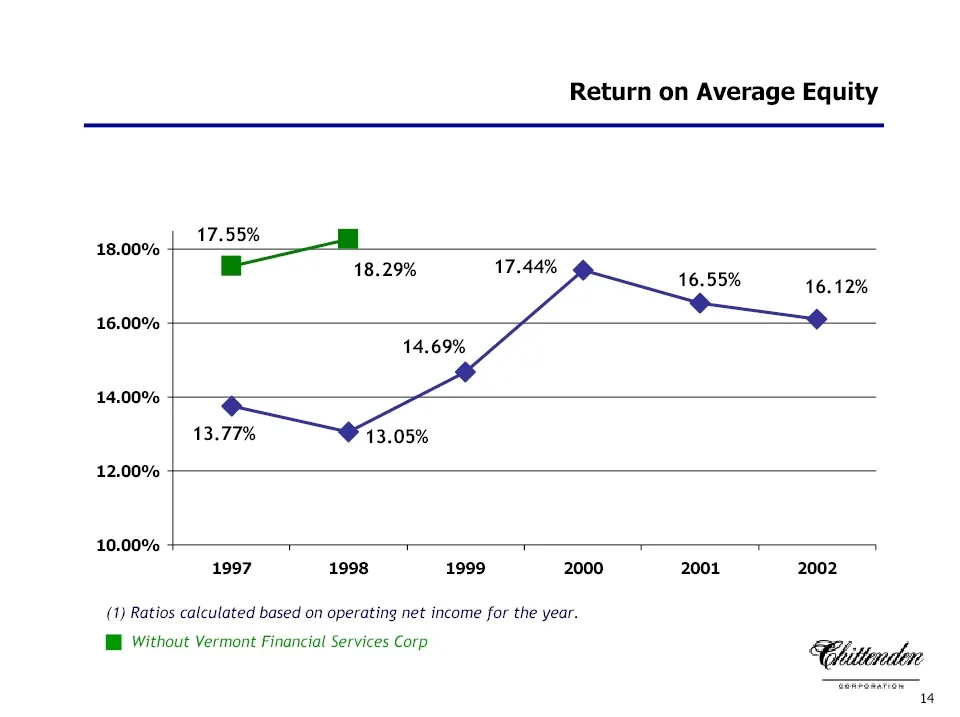
Slide 14: Return on Average Equity
18.00% 16.00% 14.00% 12.00% 10.00% Return on Average Equity [——* 18.29% 17.44% 16.12% 14.69% 13.77% 13.05% 2000 2001 2002 (1) Ratios calculated based on operating net income for the year. I Without Vermont Financial Services Corp Chittenden 14
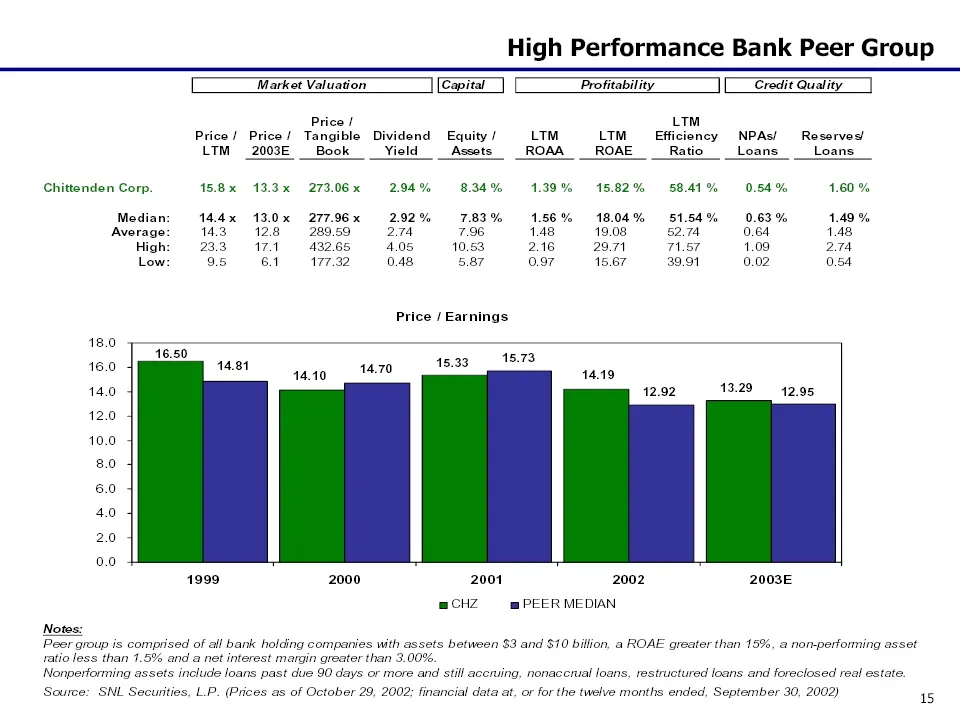
Slide 15: High Performance Bank Peer Group
High Performance Bank Peer Group [ Market Valuation | (Capital [ Profitability | [Credit Quality | Price / u™ Price! Price/ Tangible Dividend Equity/ LTM LTM_ Efficiency NPAs! Reserves! LTM 2003E Book _Yield __Assets_ ROAA _ROAE Ratio __Loans__Loans, Chittenden Corp. 15.8x 13.3% 273.06x 2.94% 8.34%
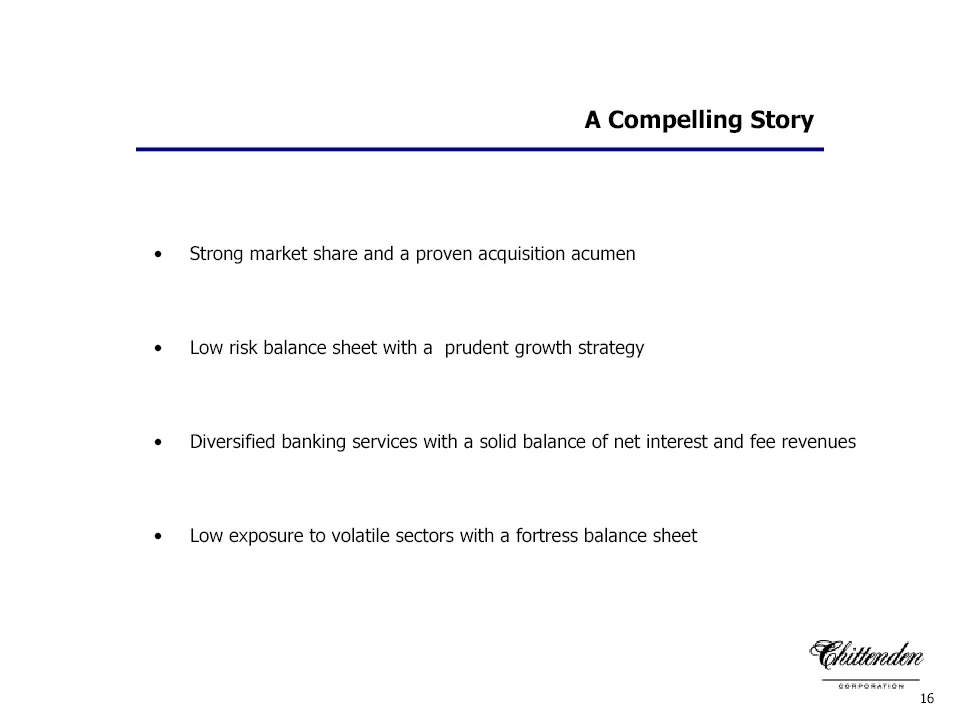
Slide 16: A Compelling Story
A Compelling Story Strong market share and a proven acquisition acumen Low risk balance sheet with a prudent growth strategy Diversified banking services with a solid balance of net interest and fee revenues Low exposure to volatile sectors with a fortress balance sheet Whilindin 16
Slide 17: Acquisition of Granite State Bankshares
Chitenlen CORPORATION Acquisition of We GRANITE STATE ( BANKSHARES ME The Power of Local Banking Chittoradon Ln FEFLAGSHP BANK vayencatut — Becca
Slide 18: Summary of Significant Terms
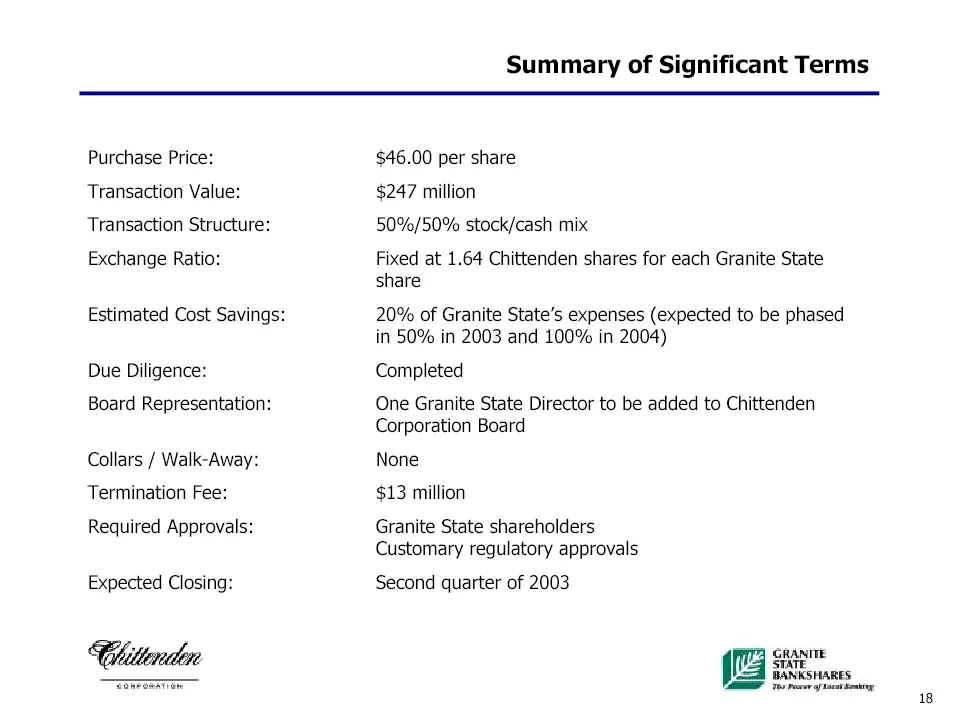
Purchase Price: Transaction Value: Transaction Structure: Exchange Ratio: Estimated Cost Savings: Due Diligence: Board Representation: Collars / Walk-Away: Termination Fee: Required Approvals: Expected Closing: Chittenden Summary of Significant Terms $46.00 per share $247 million 50%/50% stock/cash
Slide 19: Snapshot of Granite State
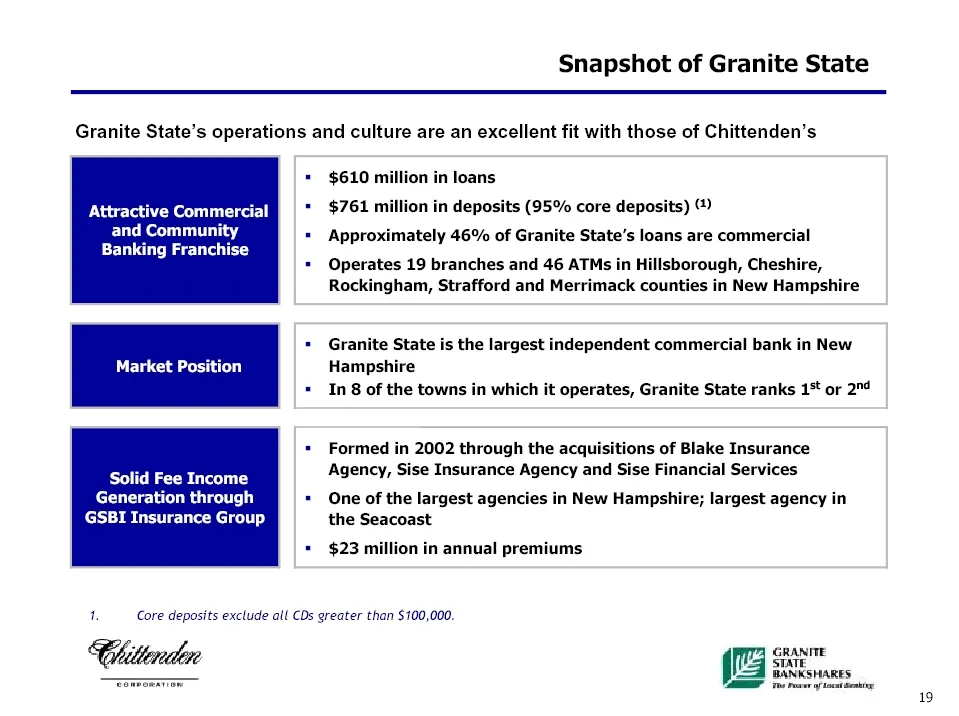
Snapshot of Granite State Granite State’s operations and culture are an excellent fit with those of Chittenden’s Attractive Commercial and Community Banking Franchise Solid Fee Income Generation through GSBI Insurance Group $610 million in loans $761 million in deposits (95% core deposits) () Approx
Slide 20: Franchise Enhancing
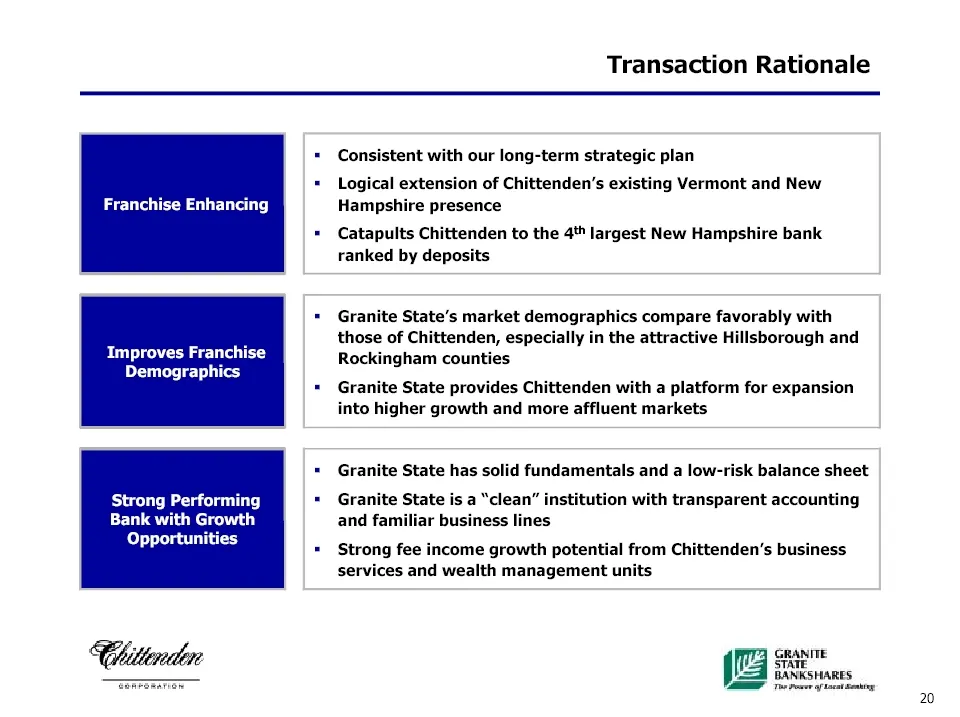
Franchise Enhancing Improves Franchise Demographics Strong Performing Bank with Growth Opportunities Chittenden Transaction Rationale Consistent with our long-term strategic plan Logical extension of Chittenden’s existing Vermont and New Hampshire presence Catapults Chittenden to the 4" largest New
Slide 21: Attractive Financial Results
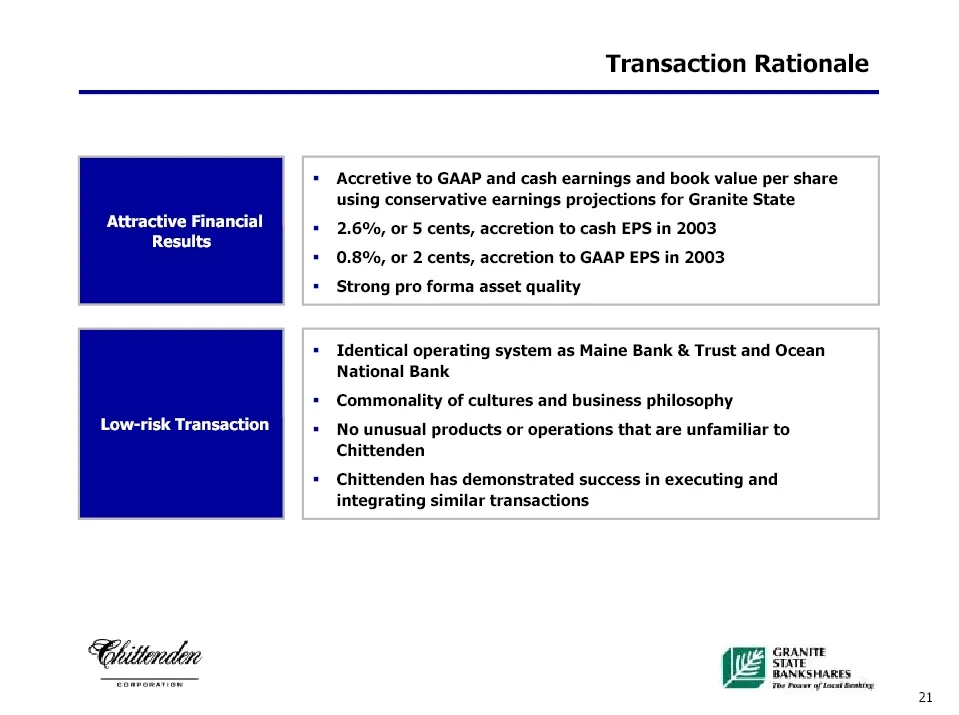
Attractive Financial Results Transaction Rationale Accretive to GAAP and cash earnings and book value per share using conservative earnings projections for Granite State 2.6%, or 5 cents, accretion to cash EPS in 2003 0.8%, or 2 cents, accretion to GAAP EPS in 2003 Strong pro forma asset quality Ide
Slide 22: Building a Strong Commercial Banking Franchise in New Hampshire
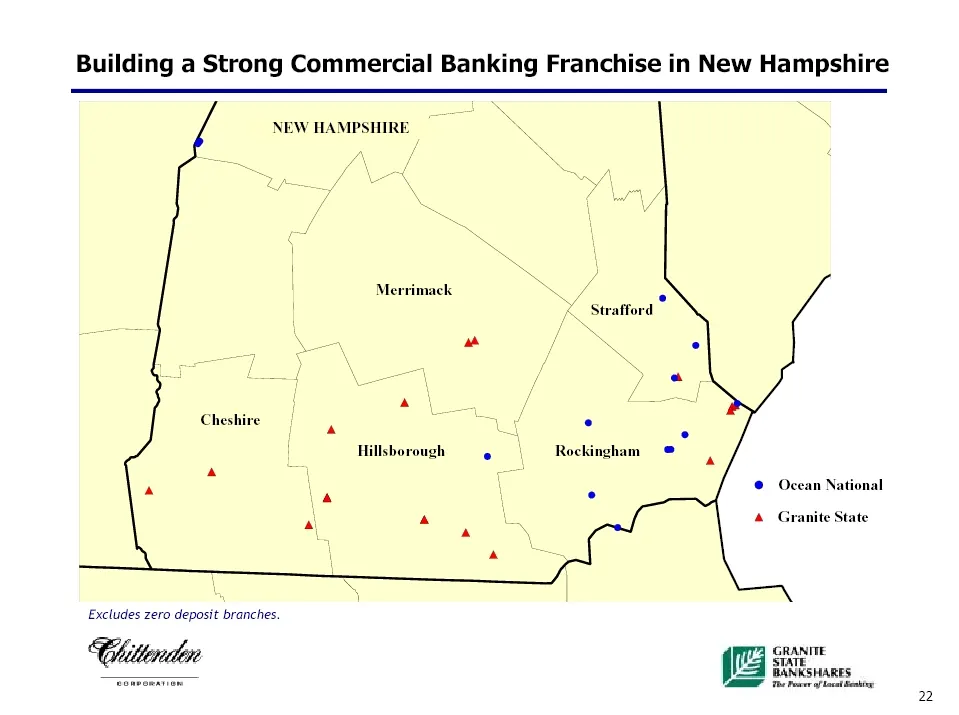
Building a Strong Commercial Banking Franchise in New Hampshire NEW HAMPSHIRE Merrimack Rockingham © Ocean National ° A Granite State Excludes zero deposit branches. ‘f (GRANITE Chittenden onan BANKSHARES — ne ac 22
Slide 23: Strong Financial Position
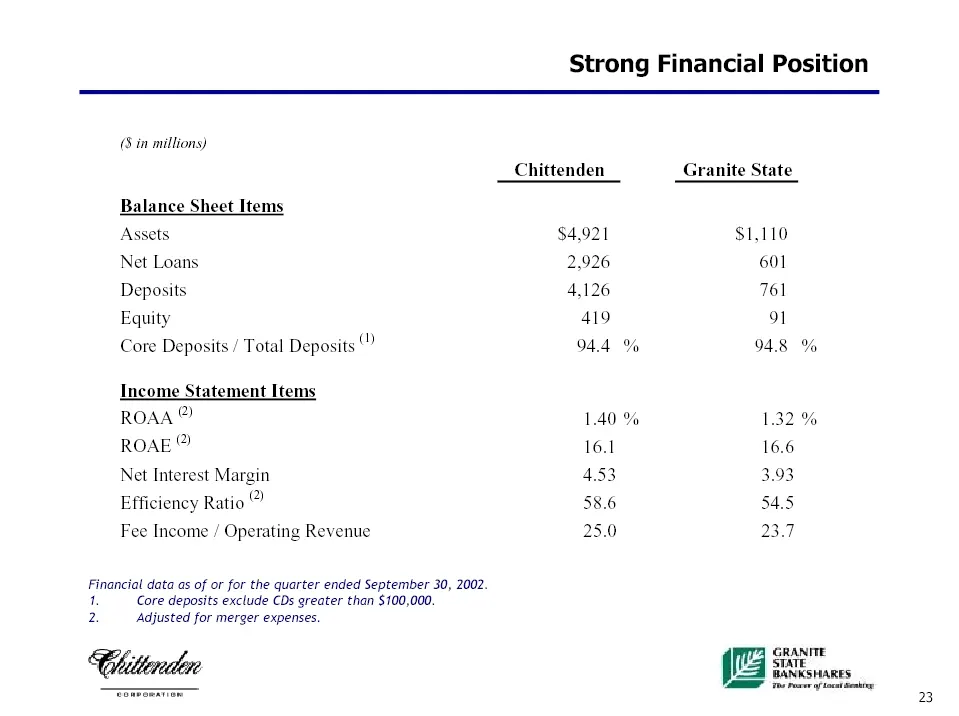
(8 in millions) Balance Sheet Items Assets Net Loans Deposits Equity Core Deposits / Total Deposits Income Statement Items ROAA® ROAE” Net Interest Margin Efficiency Ratio ? Fee Income / Operating Revenue Financial data as of or for the quarter ended September 30, 1 Core deposits exclude CDs greater
Slide 24: Loan Composition Remains Diversified
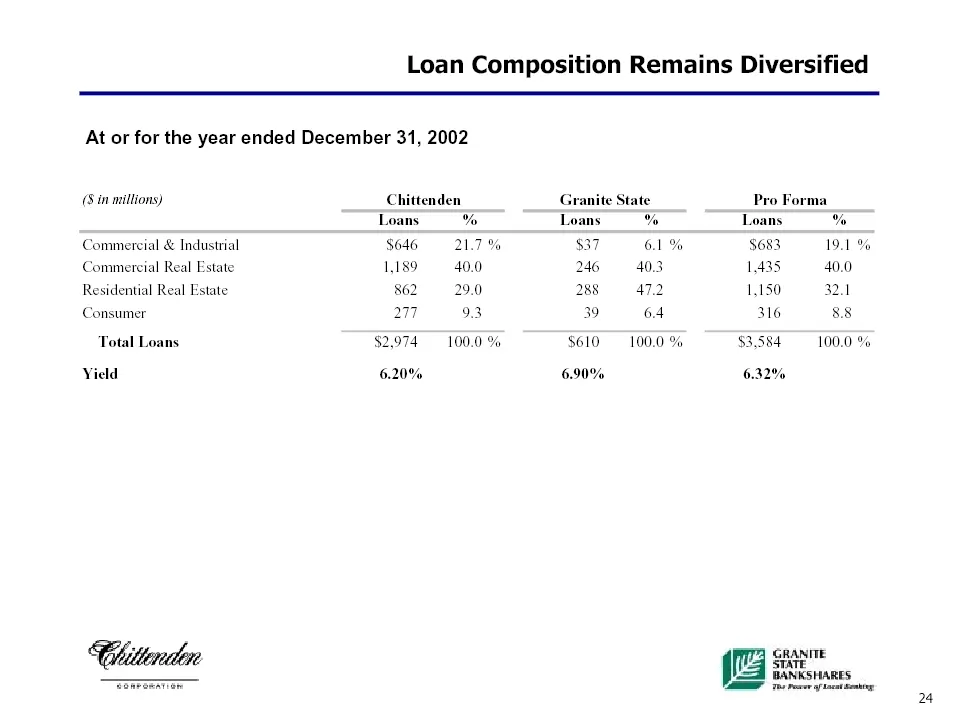
Loan Composition Remains Diversified At or for the year ended December 31, 2002 (8 in millions) 1 & Industrial al Real Estate Residential Real Estate Commere Commere Consumer Total Loans Yield Chittenden Chittenden Loans % $046 21 61% 1189 40.0 246° 40.3 862 29.0 288 47.2 aT 93 39 64 $2,974 100.0 %
Slide 25: Maintains Excellent Asset Quality
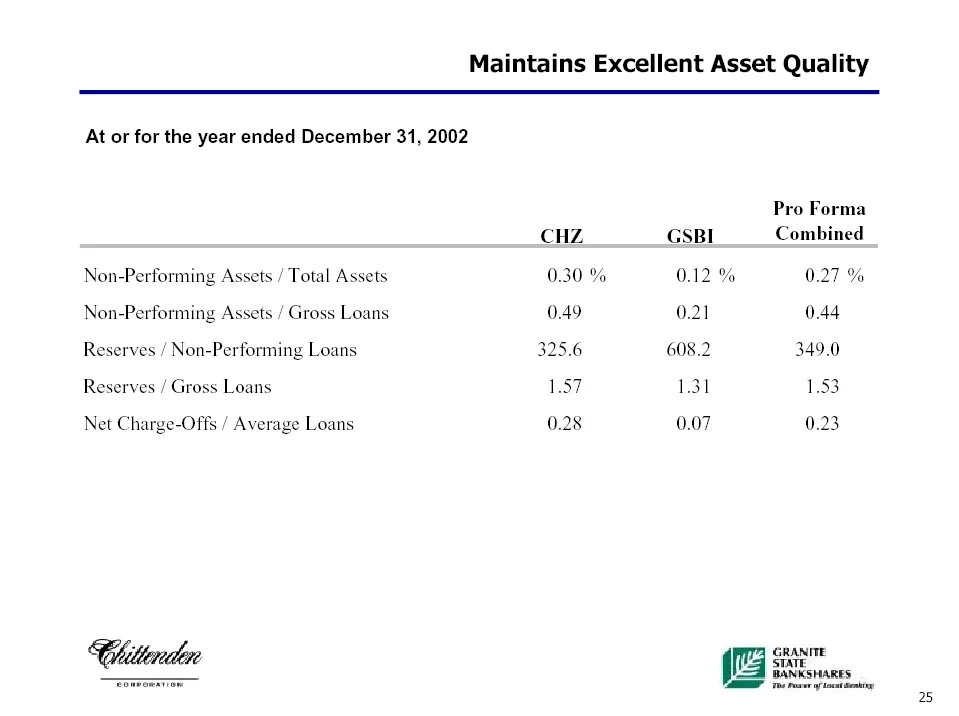
Maintains Excellent Asset Quality At or for the year ended December 31, 2002 Pro Forma CHZ GSBI Combined Non-Performing Assets / Total Assets 0.30 % 0.12 % 0.27 % Non-Performing Assets / Gross Loans 0.49 0.21 0.44 Reserves / Non-Performing Loans 325.6 608.2 349.0 Reserves / Gross Loans 1.57 131 1.53
Slide 26: Deposit Mix
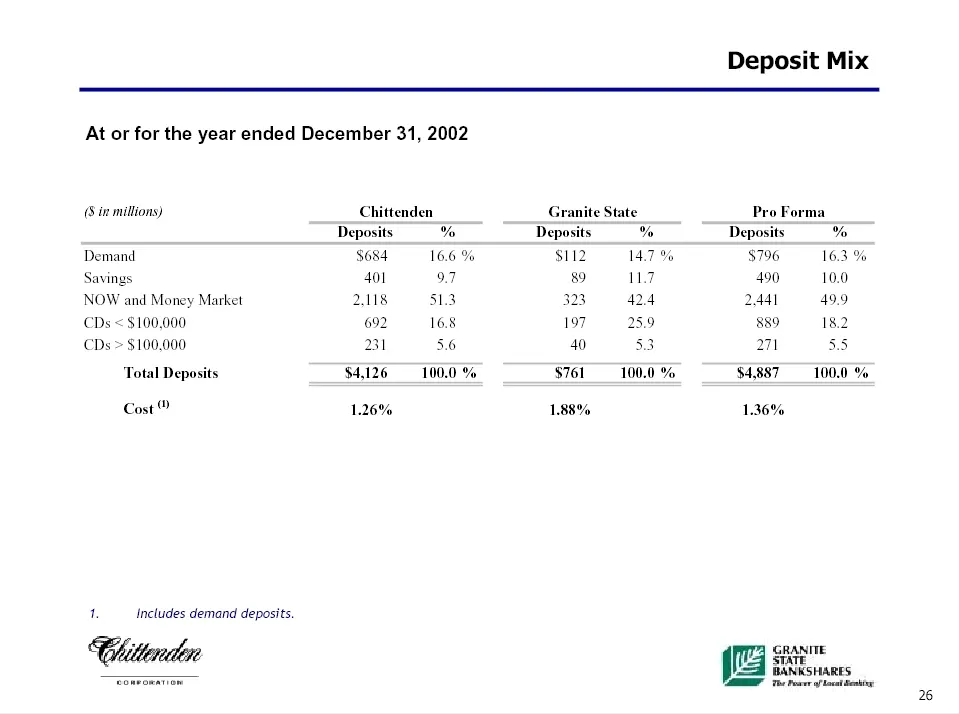
At or for the year ended December 31, 2002 (3 in millions) Demand Savings NOW and Money Market CDs < $100,000 CDs > $100,000 Total Deposits Cost 1 Includes demand deposits. Chiteniln Chittenden Depos % SO84 16.6 % 401 97 2.18 513 692 16.8 231 5.6 $4,126 100.0 % 1.26% Deposit Mix Granite State Pro Fo
Slide 27: Chittenden Corporation
Chiltnidlen CORPORATION Visit our website for a wide range of products, latest financial reports and many other interactive services: www.chittendencorp.com This presentation contains “forward-looking statements” which may describe future plans and strategic initiatives. These forward- looking state
Source: SEC EDGAR · 8-K filed Feb 3, 2003
More decks from Chittenden Corp
 Investor Presentation (September 2007)38 slides · Sep 7, 2007
 Merger or Acquisition (June 2007)27 slides · Jun 27, 2007
 Chittenden — Merger or Acquisition (June 2007)25 slides · Jun 27, 2007
 Merger or Acquisition (June 2007)9 slides · Jun 5, 2007
 Investor Presentation (May 2007)36 slides · May 14, 2007
 Investor Presentation (February 2007)37 slides · Feb 16, 2007