Rockwool A/S Class A · OMXCOP:ROCK_A
Rockwool A/S Class A — Rockwool International — Non-Deal Roadshow (January 2010)
57 slides from Rockwool A/S Class A's roadshow presentation, Jan 22, 2010
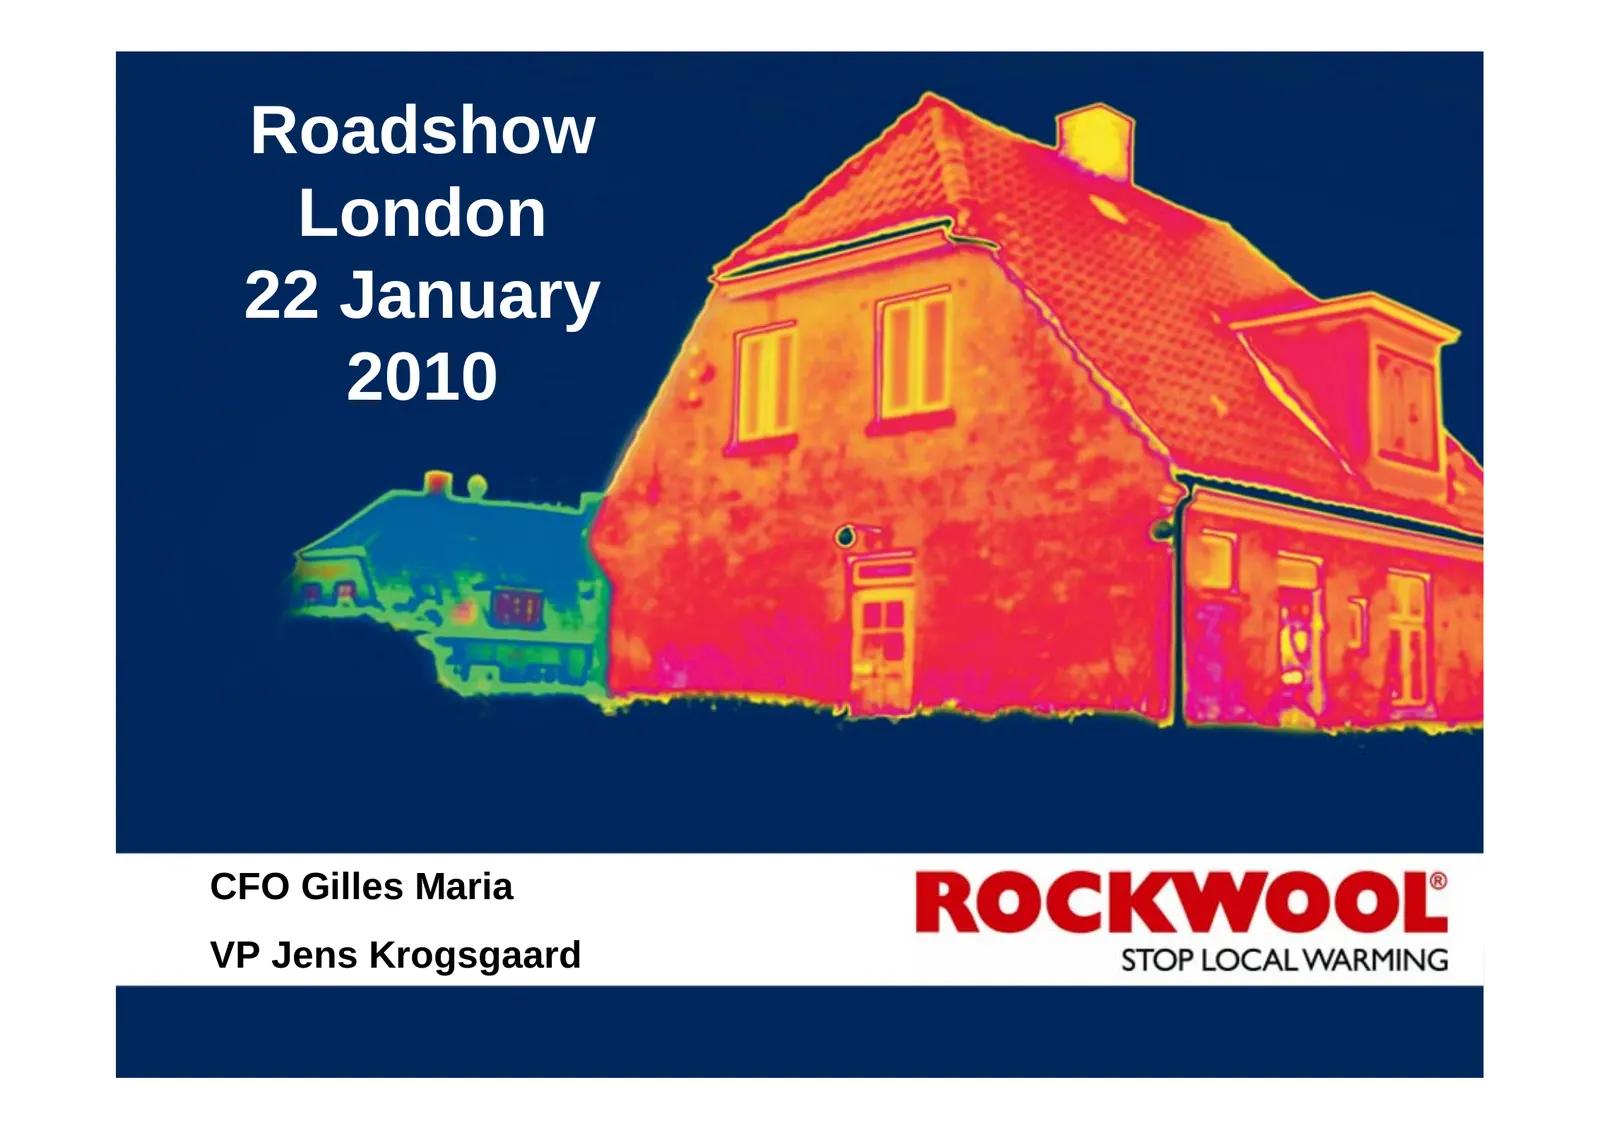
Slide 1: Roadshow London
Roadshow XXX London XX 22 January XXXXX 2009 2010 CFO TitleGilles Presenter Maria1 VP Title JensPresenter Krogsgaard 2 1 1
Slide 2: Forward-looking statement
Forward-looking statement The statements on the future in this presentation, including expected sales and earnings, are associated with risks and uncertainties and may be affected by factors influencing the activities of the group, e.g. the global economic environment, including interest and exchang
Slide 3: Agenda
Agenda 1. The Rockwool Group 2. Financials 3. Market situation 4. Energy and climate as growth drivers 5. Q&A 3 3
Slide 4: The Rockwool Group
The Rockwool Group 4 4
Slide 5: The Rockwool Group
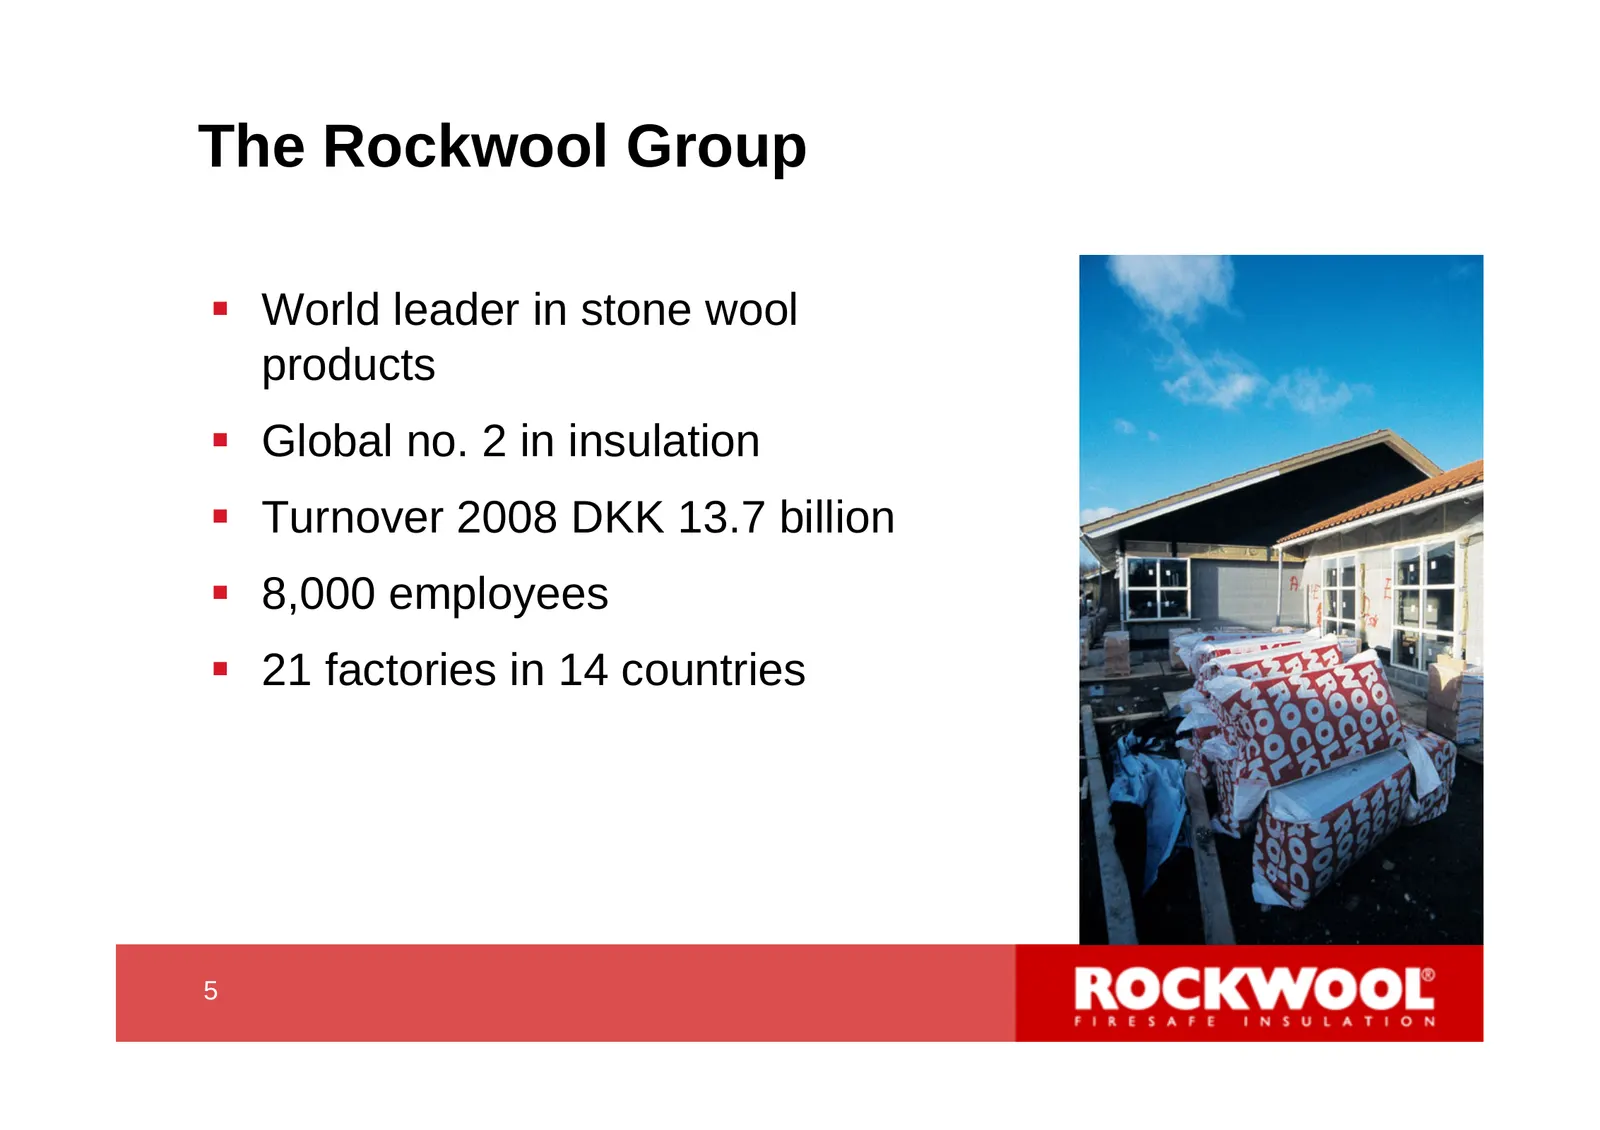
The Rockwool Group World leader in stone wool products Global no. 2 in insulation Turnover 2008 DKK 13.7 billion 8,000 employees 21 factories in 14 countries 5 5
Slide 6: Sales distributed on business area
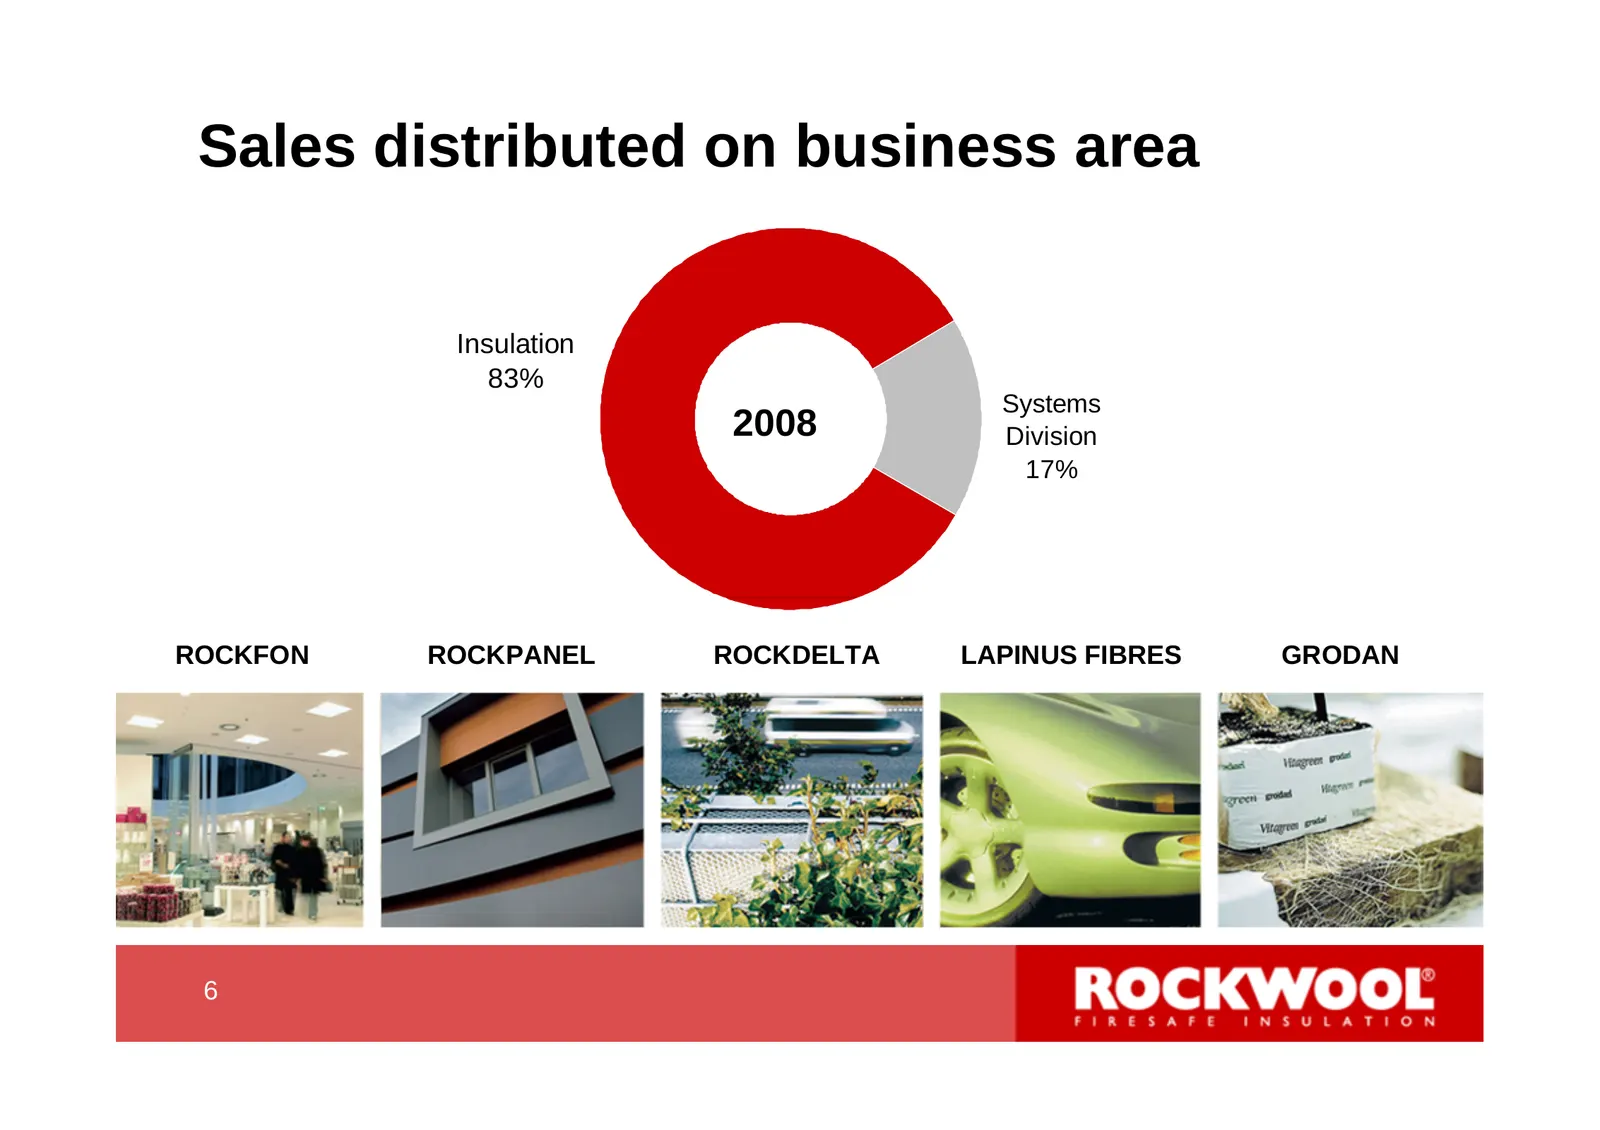
Sales distributed on business area Insulation 83% Systems 2008 Division 17% ROCKFON ROCKPANEL ROCKDELTA LAPINUS FIBRES GRODAN 6 6
Slide 7: Sales distributed on countries
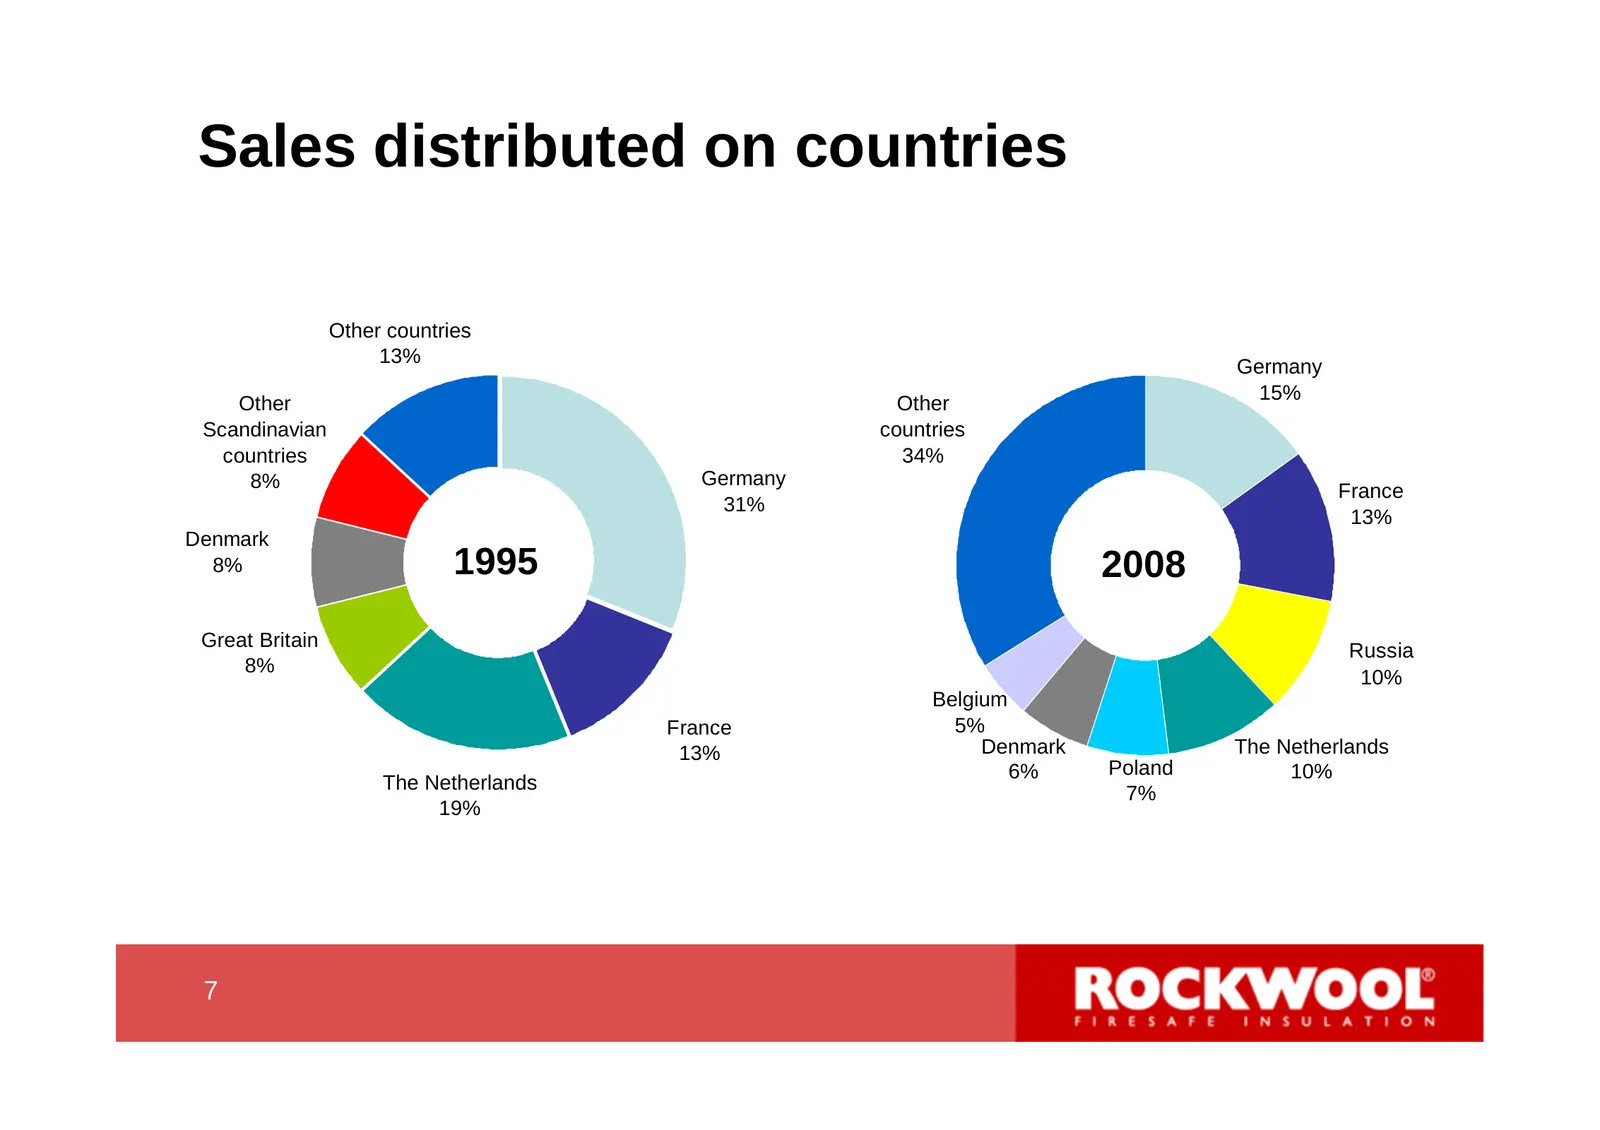
Sales distributed on countries Other countries 13% Germany Other 15% Other Scandinavian countries countries 34% 8% Germany France 31% 13% Denmark 8% 1995 2008 Great Britain Russia 8% 10% Belgium France 5% 13% Denmark The Netherlands 6% Poland 10% The Netherlands 7% 19% 7 7
Slide 8: Rockwool production is capital intensive – a new plant costs €130 mill.
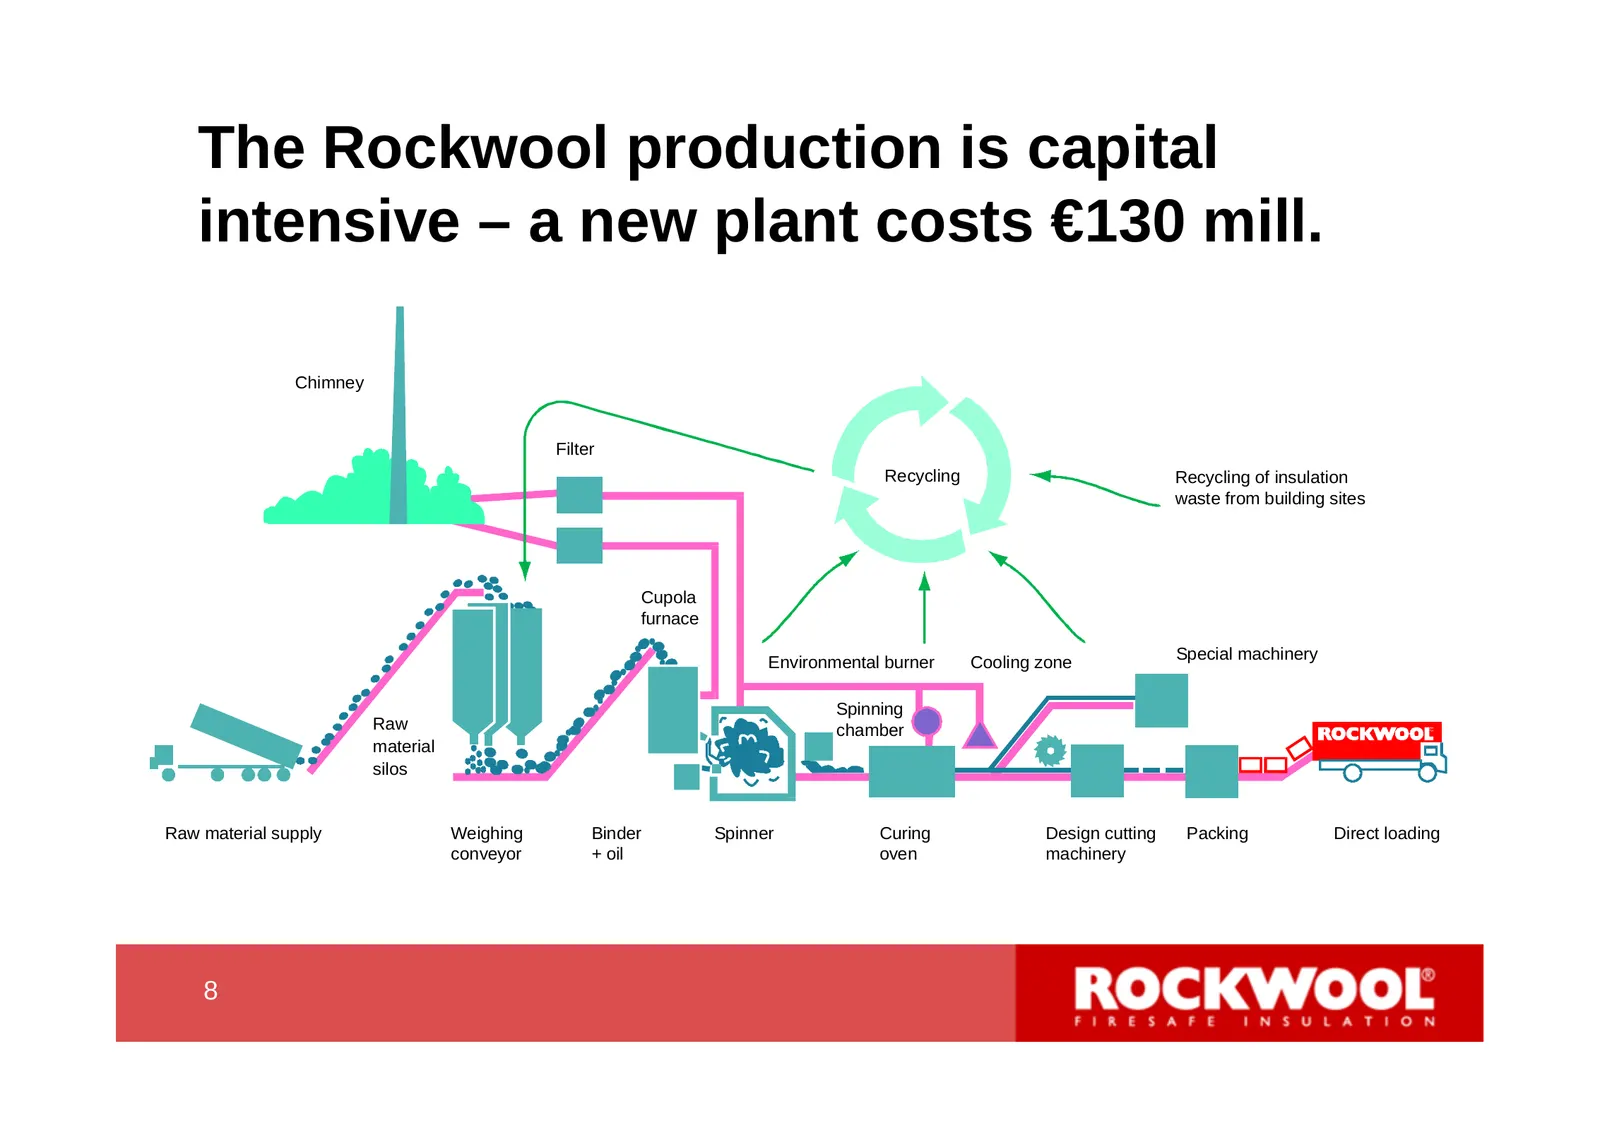
The Rockwool production is capital intensive – a new plant costs €130 mill. Chimney Filter Recycling Recycling of insulation waste from building sites Cupola furnace Environmental burner Cooling zone Special machinery Spinning Raw chamber material silos Raw material supply Weighing Binder Spinner Cu
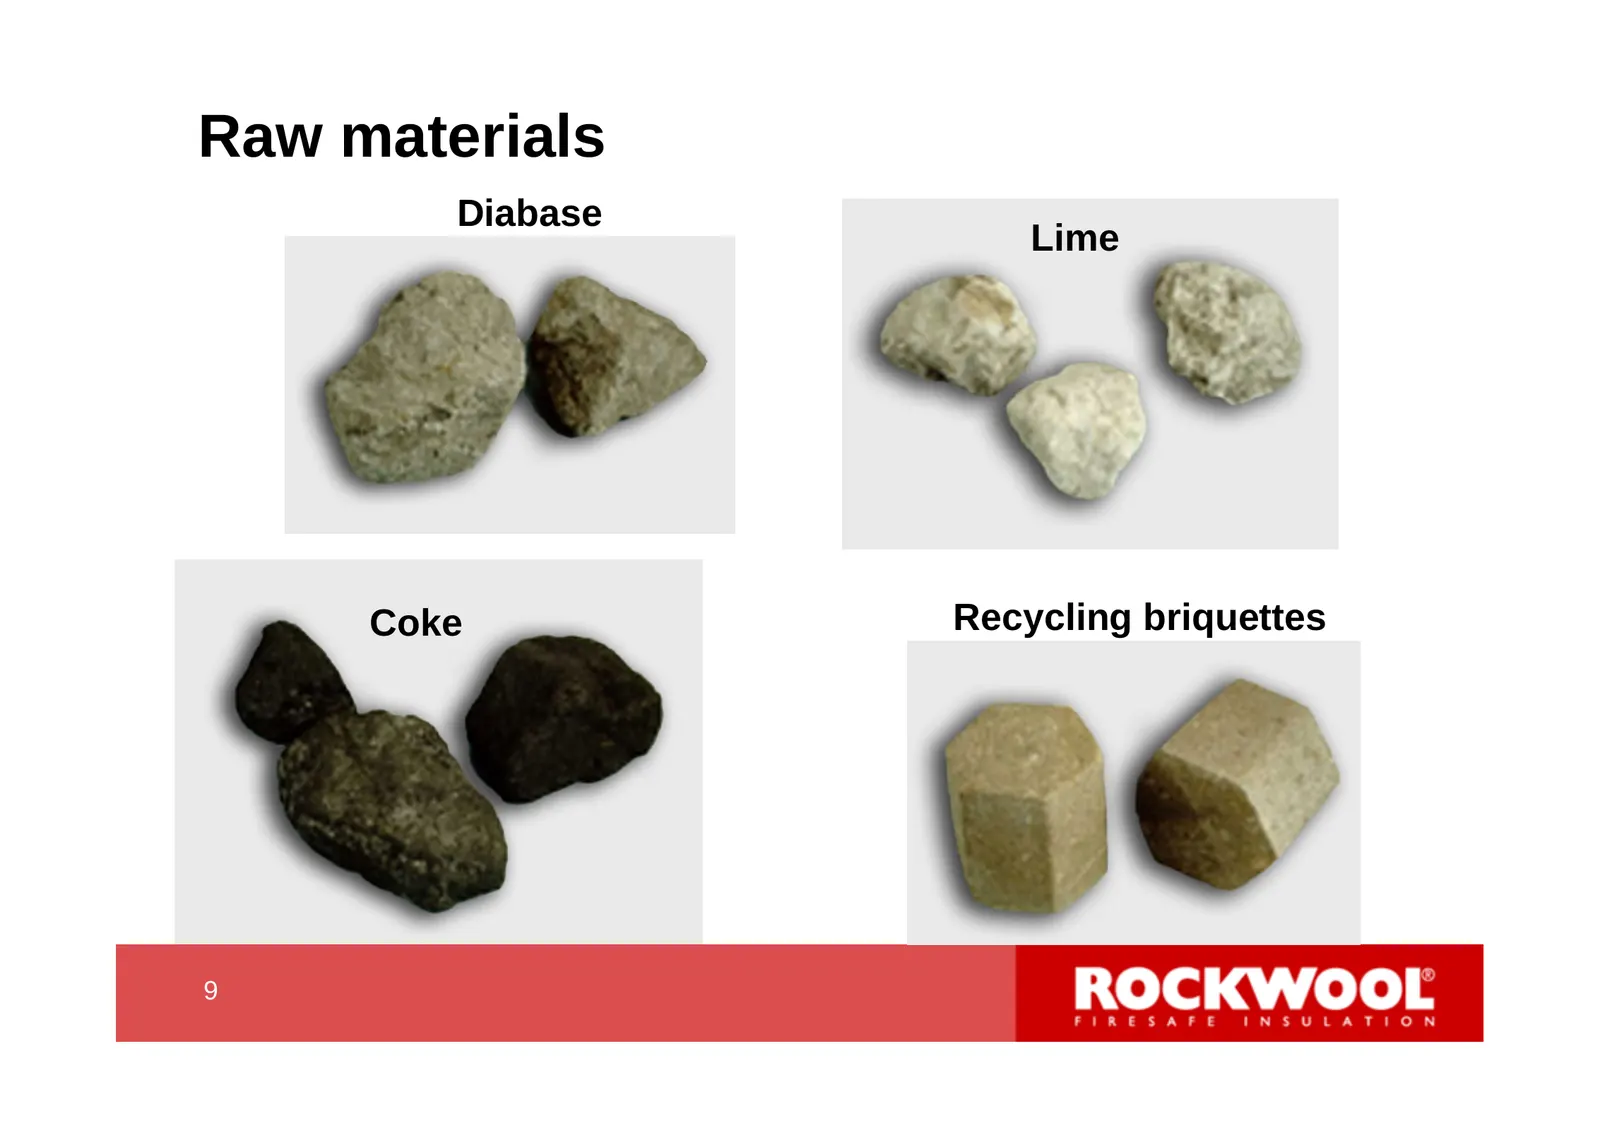
Slide 9: Raw materials
Raw materials Diabase Lime Coke Recycling briquettes 9 9
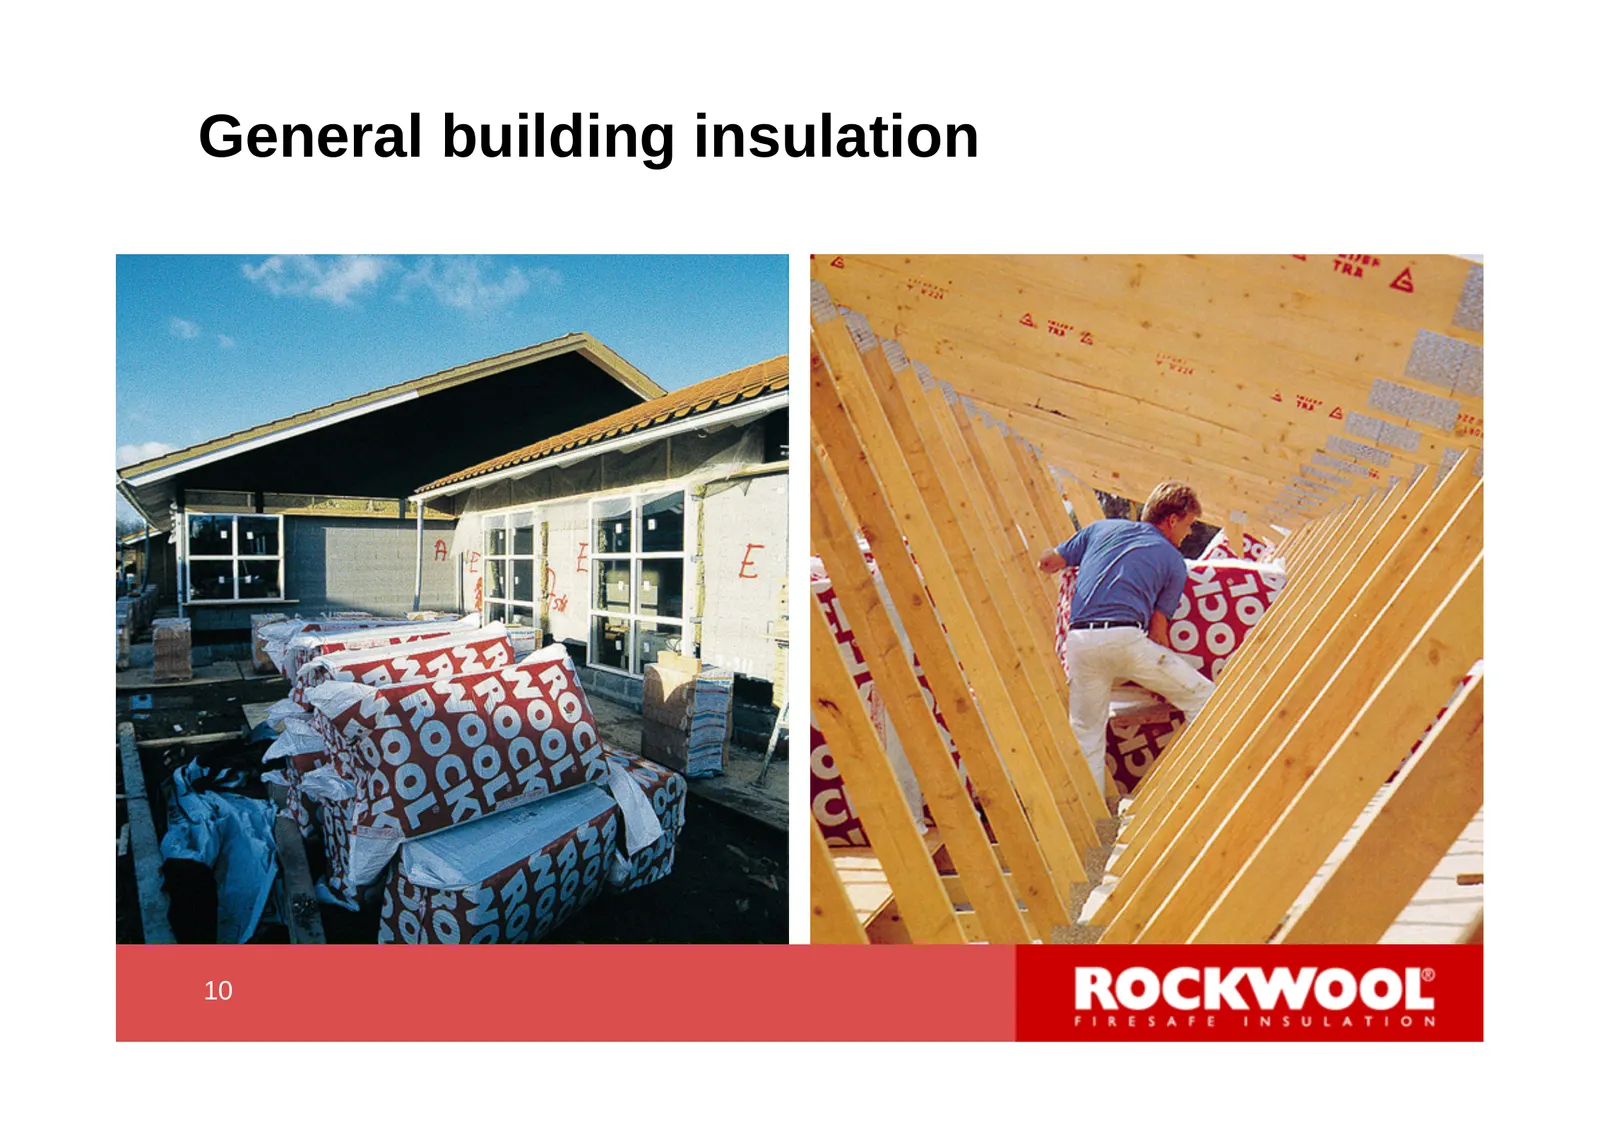
Slide 10: General building insulation
General building insulation 10 10
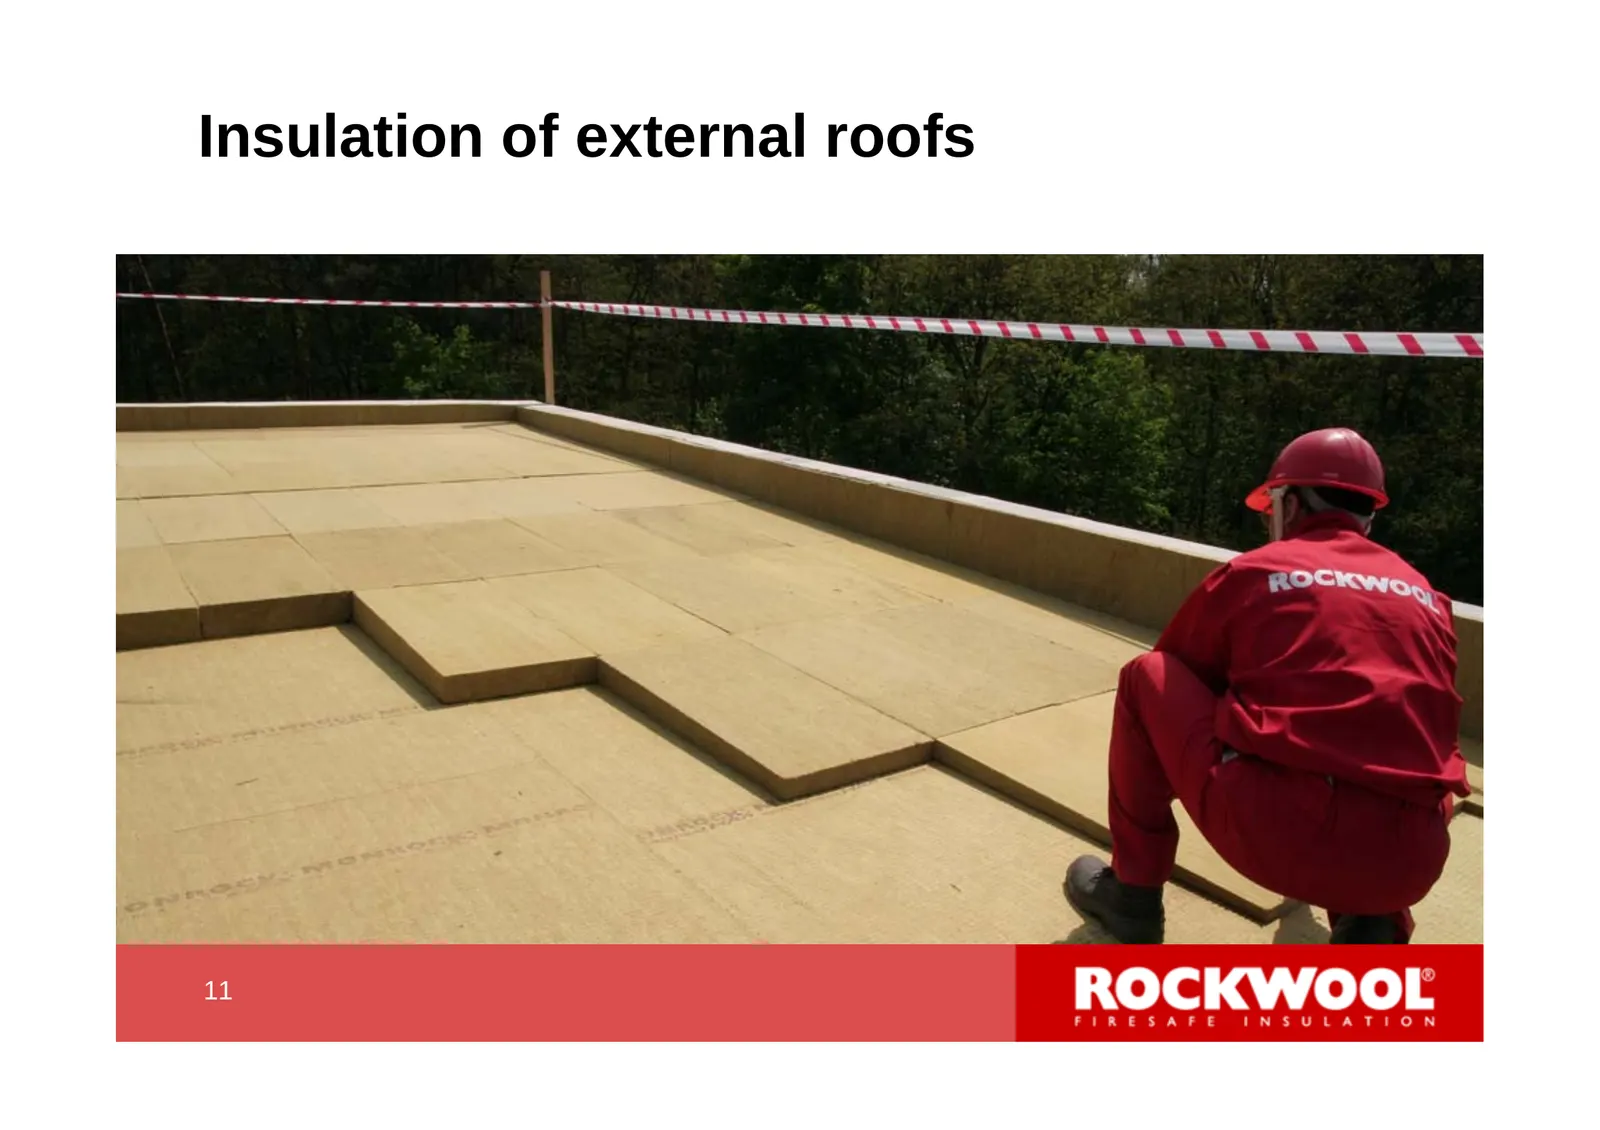
Slide 11: Insulation of external roofs
Insulation of external roofs 11 11
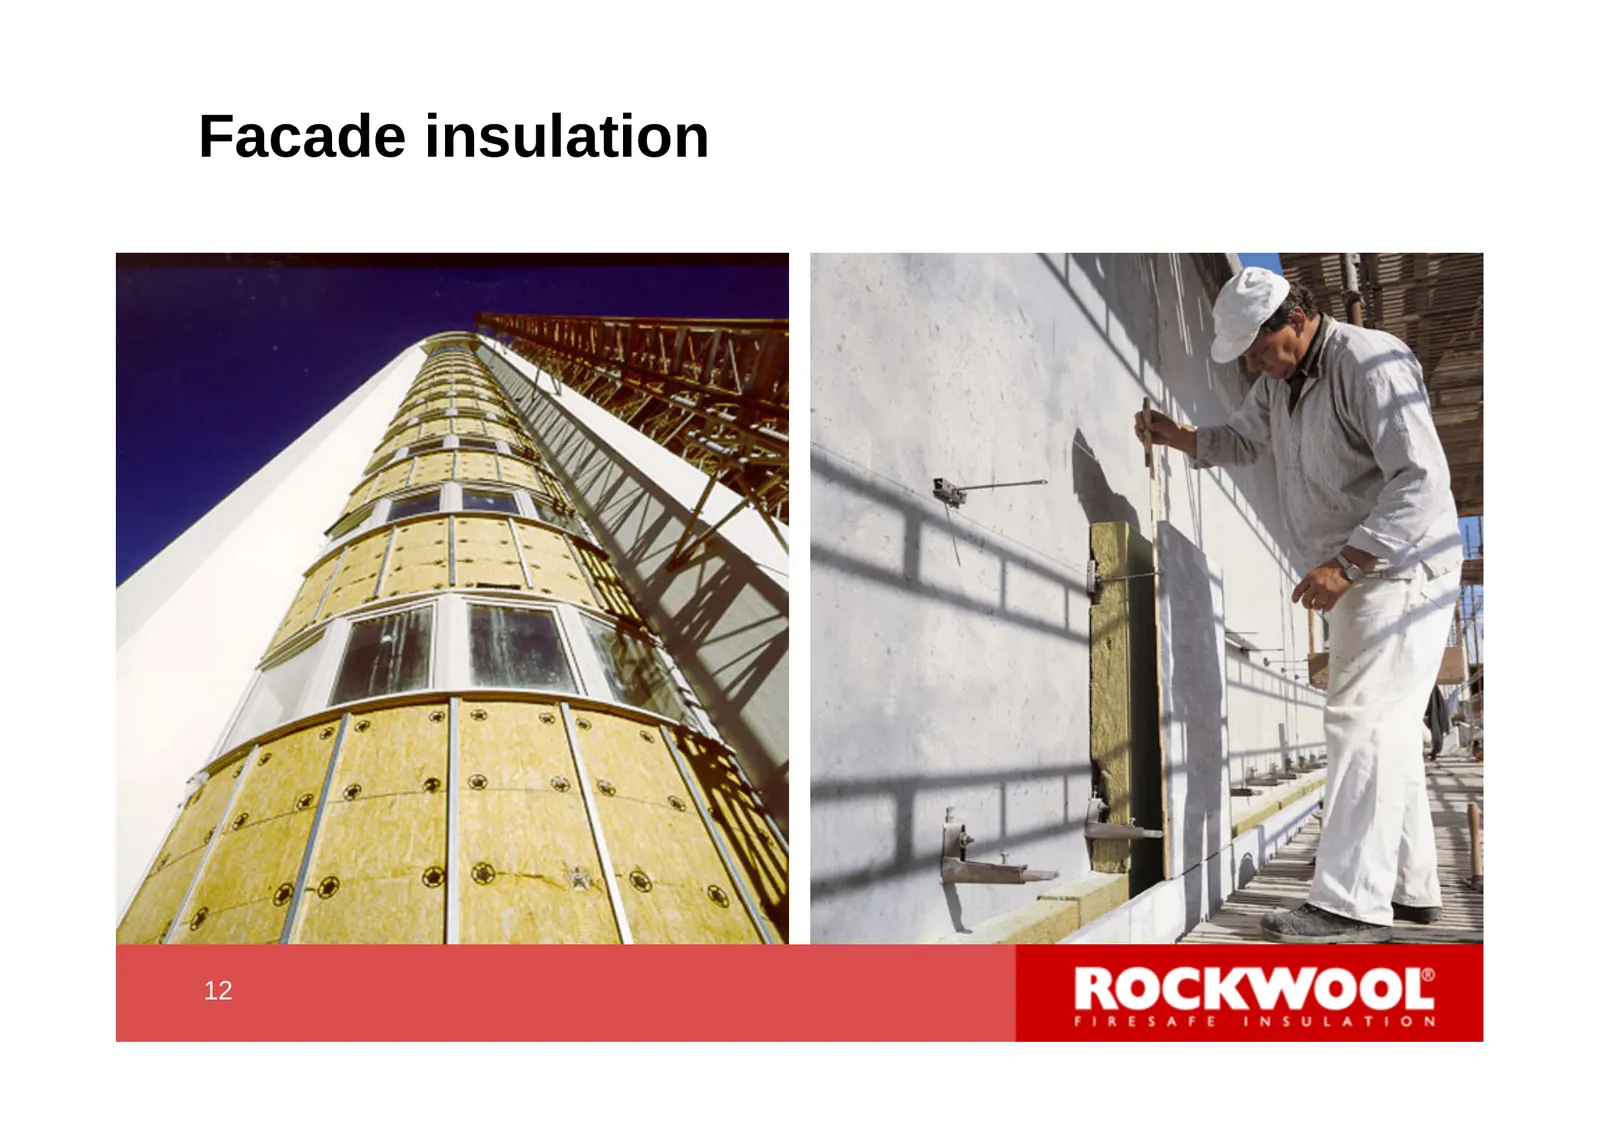
Slide 12: Facade insulation
Facade insulation 12 12
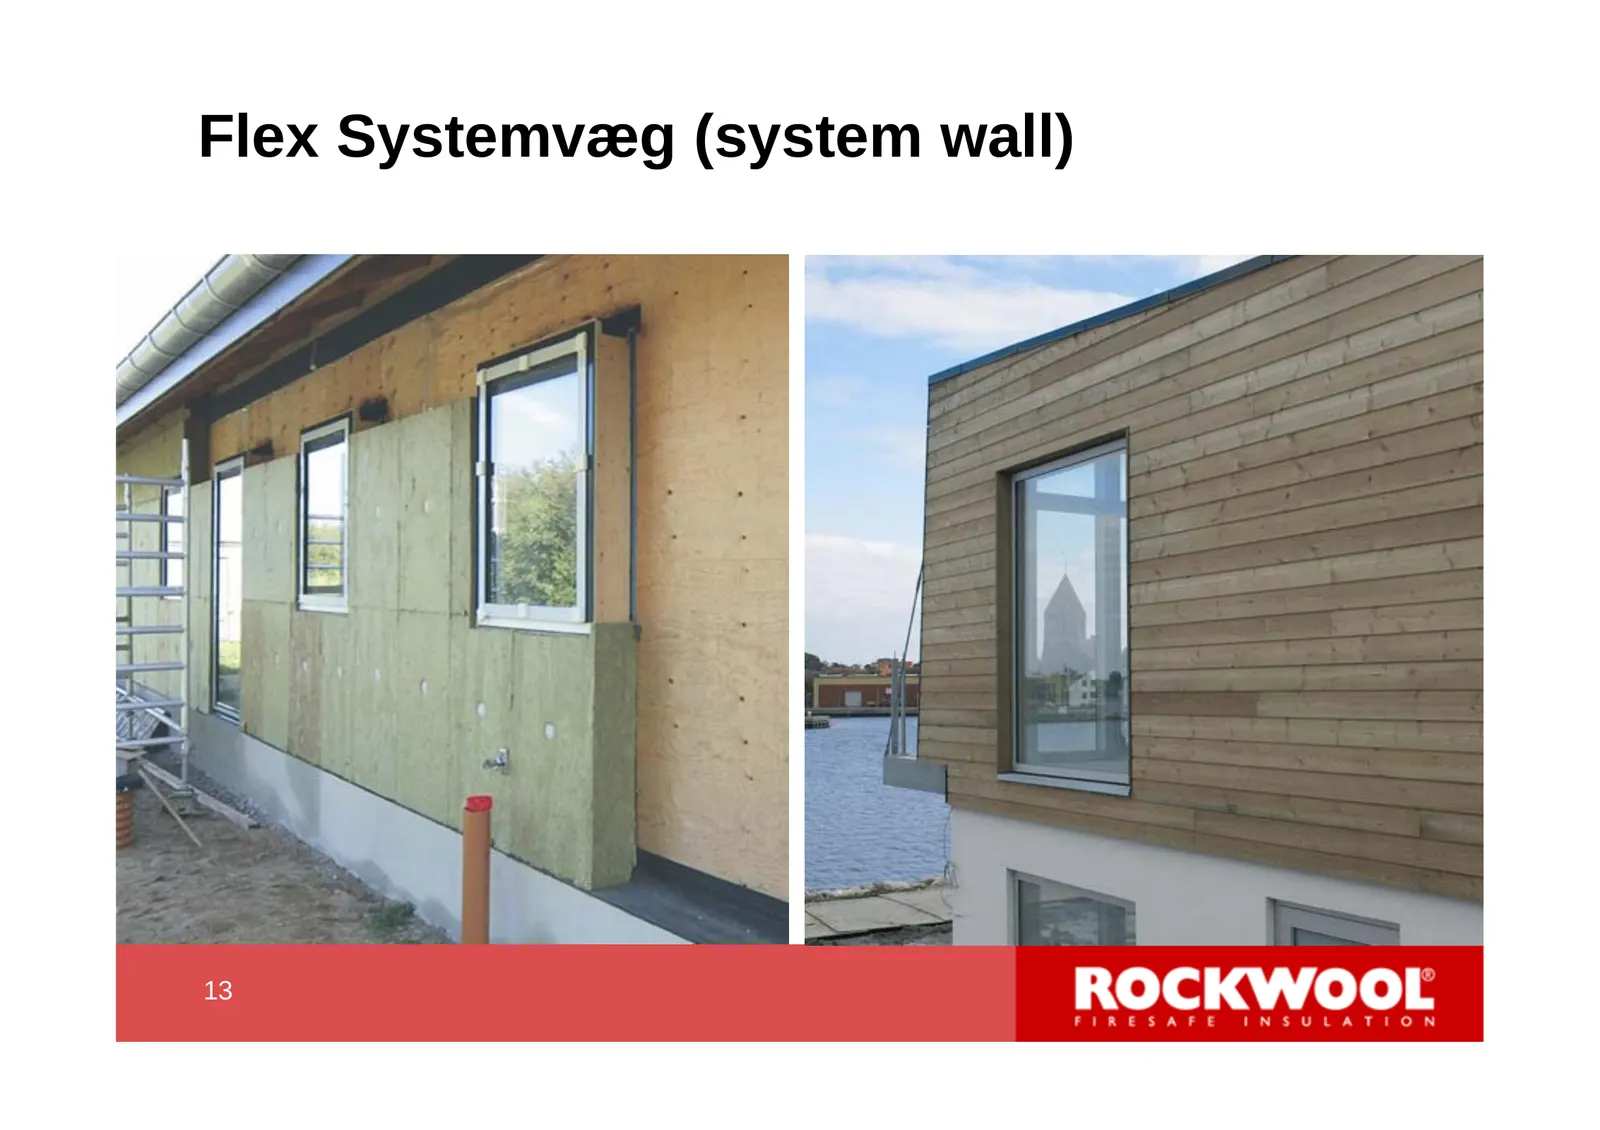
Slide 13: Flex Systemvæg (system wall)
Flex Systemvæg (system wall) 13 13
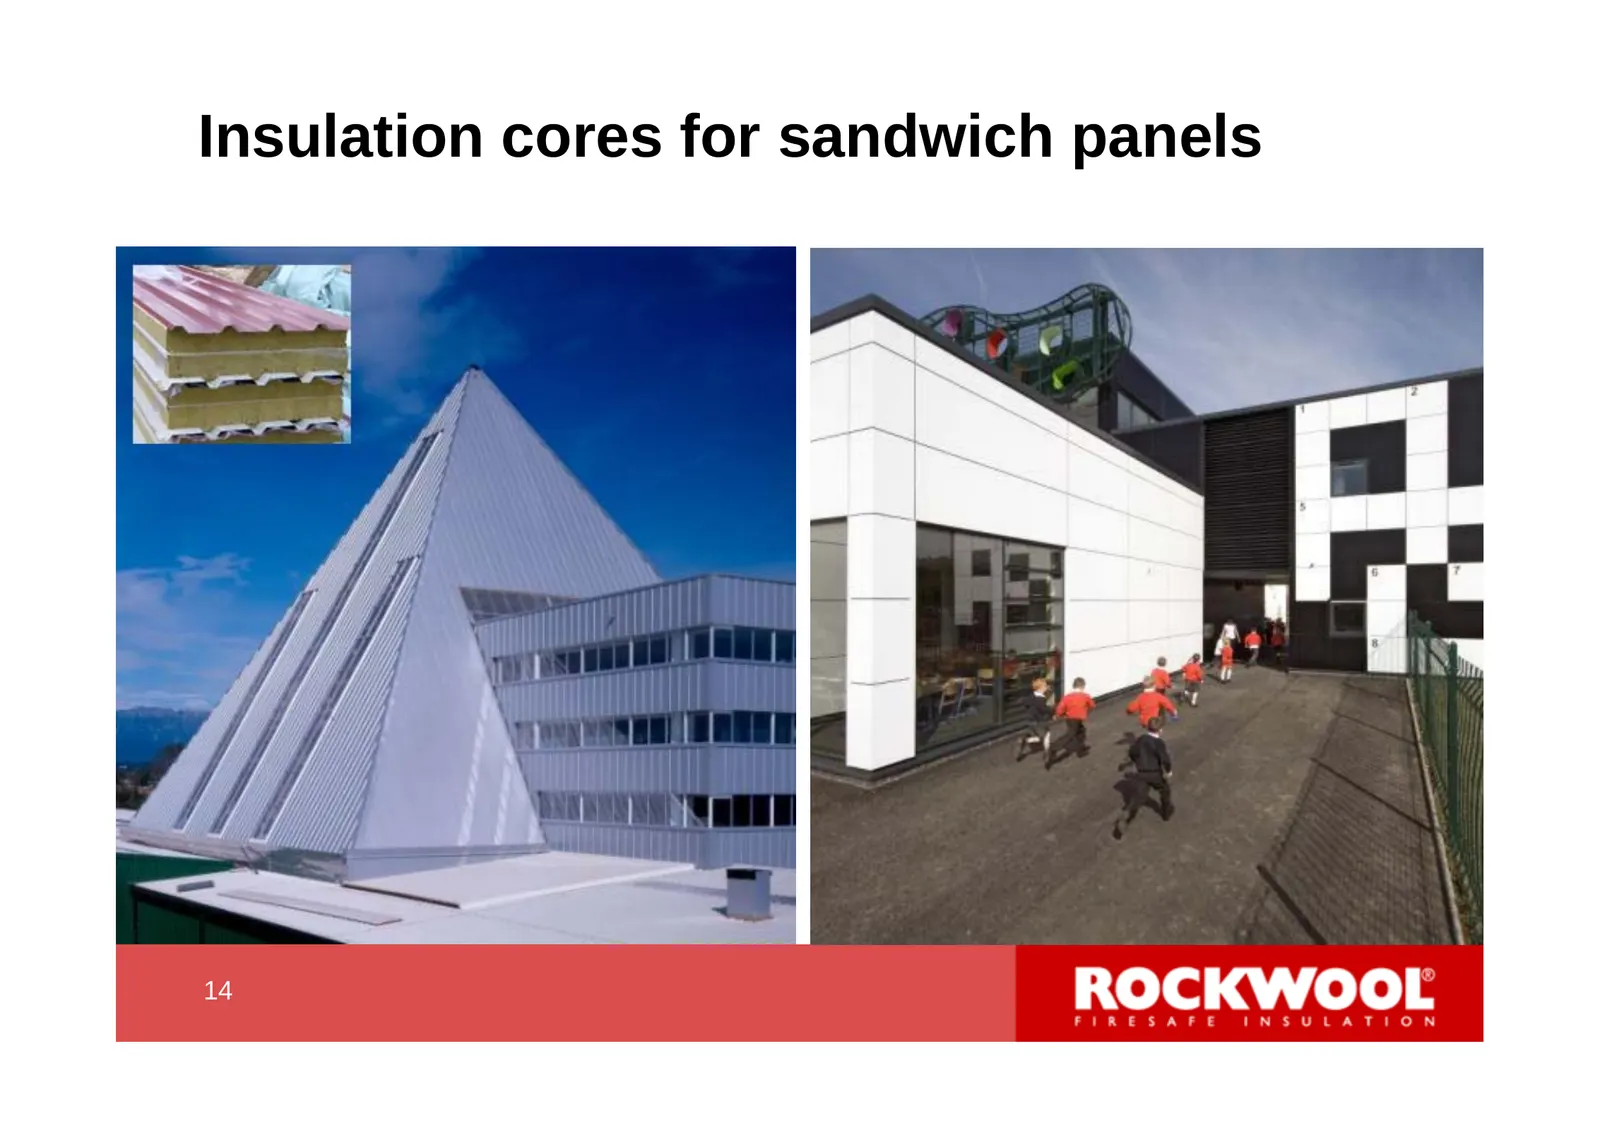
Slide 14: Insulation cores for sandwich panels
Insulation cores for sandwich panels 14 14
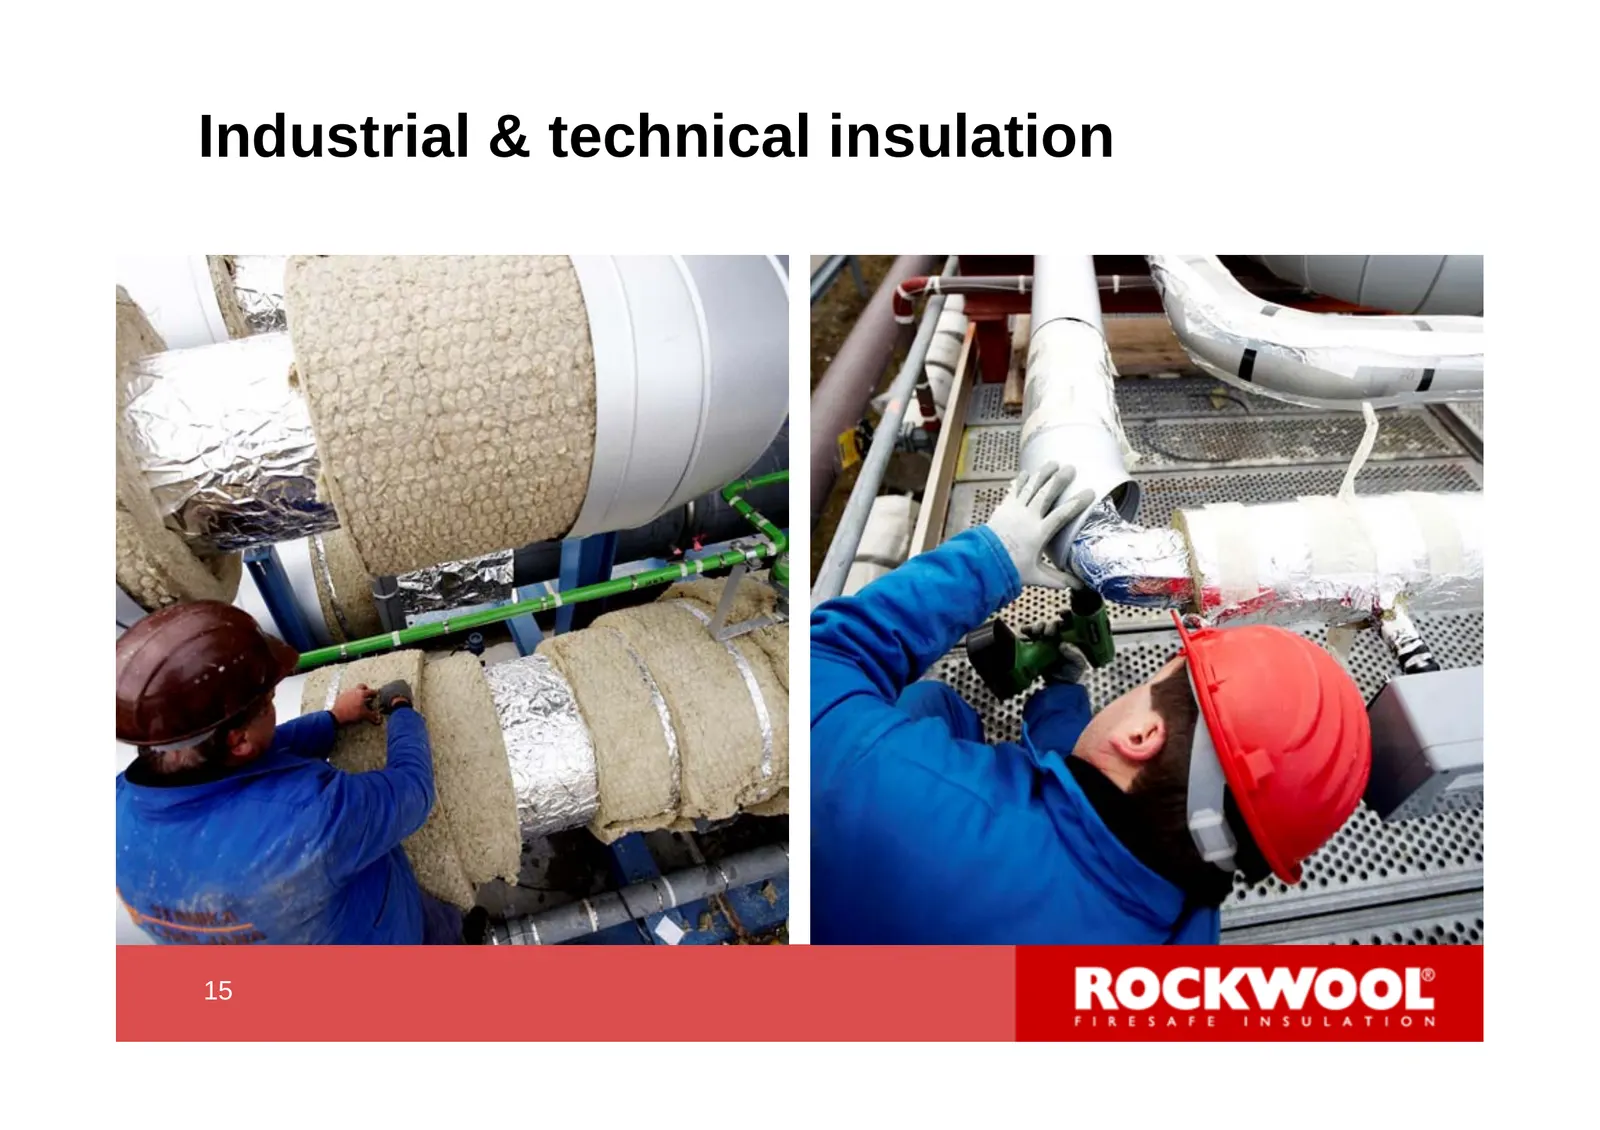
Slide 15: Industrial & technical insulation
Industrial & technical insulation 15 15
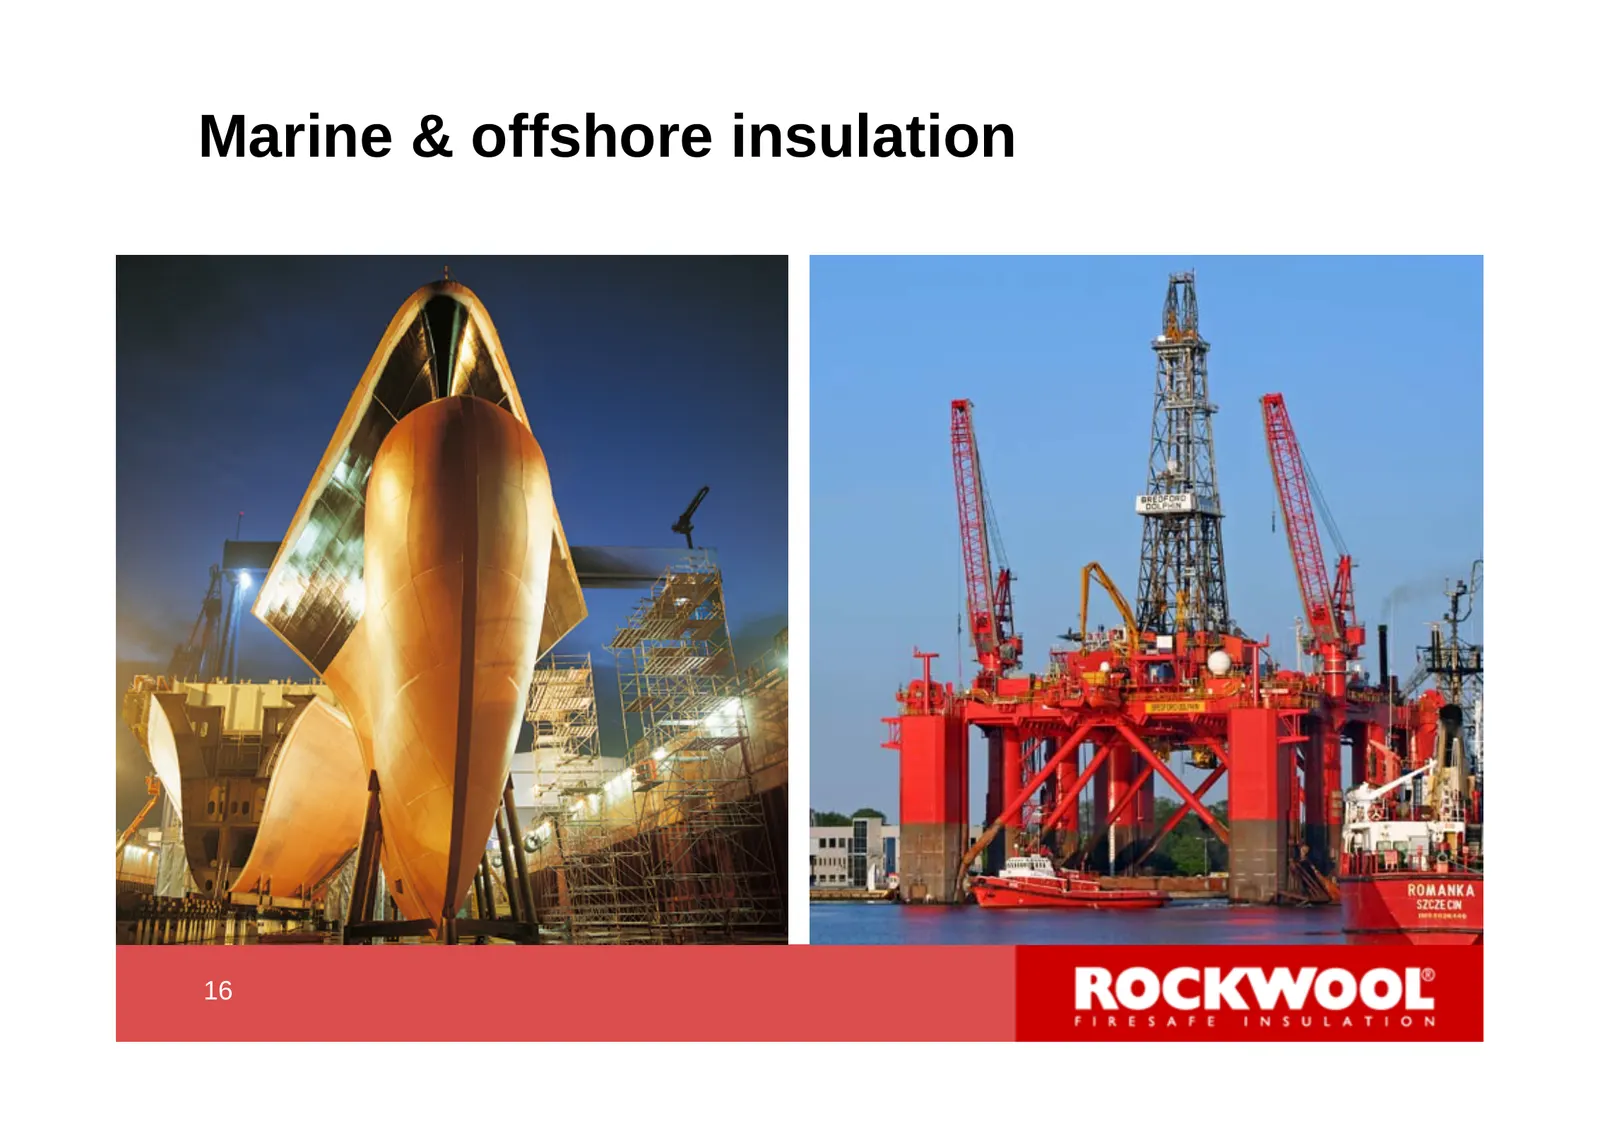
Slide 16: Marine & offshore insulation
Marine & offshore insulation 16 16
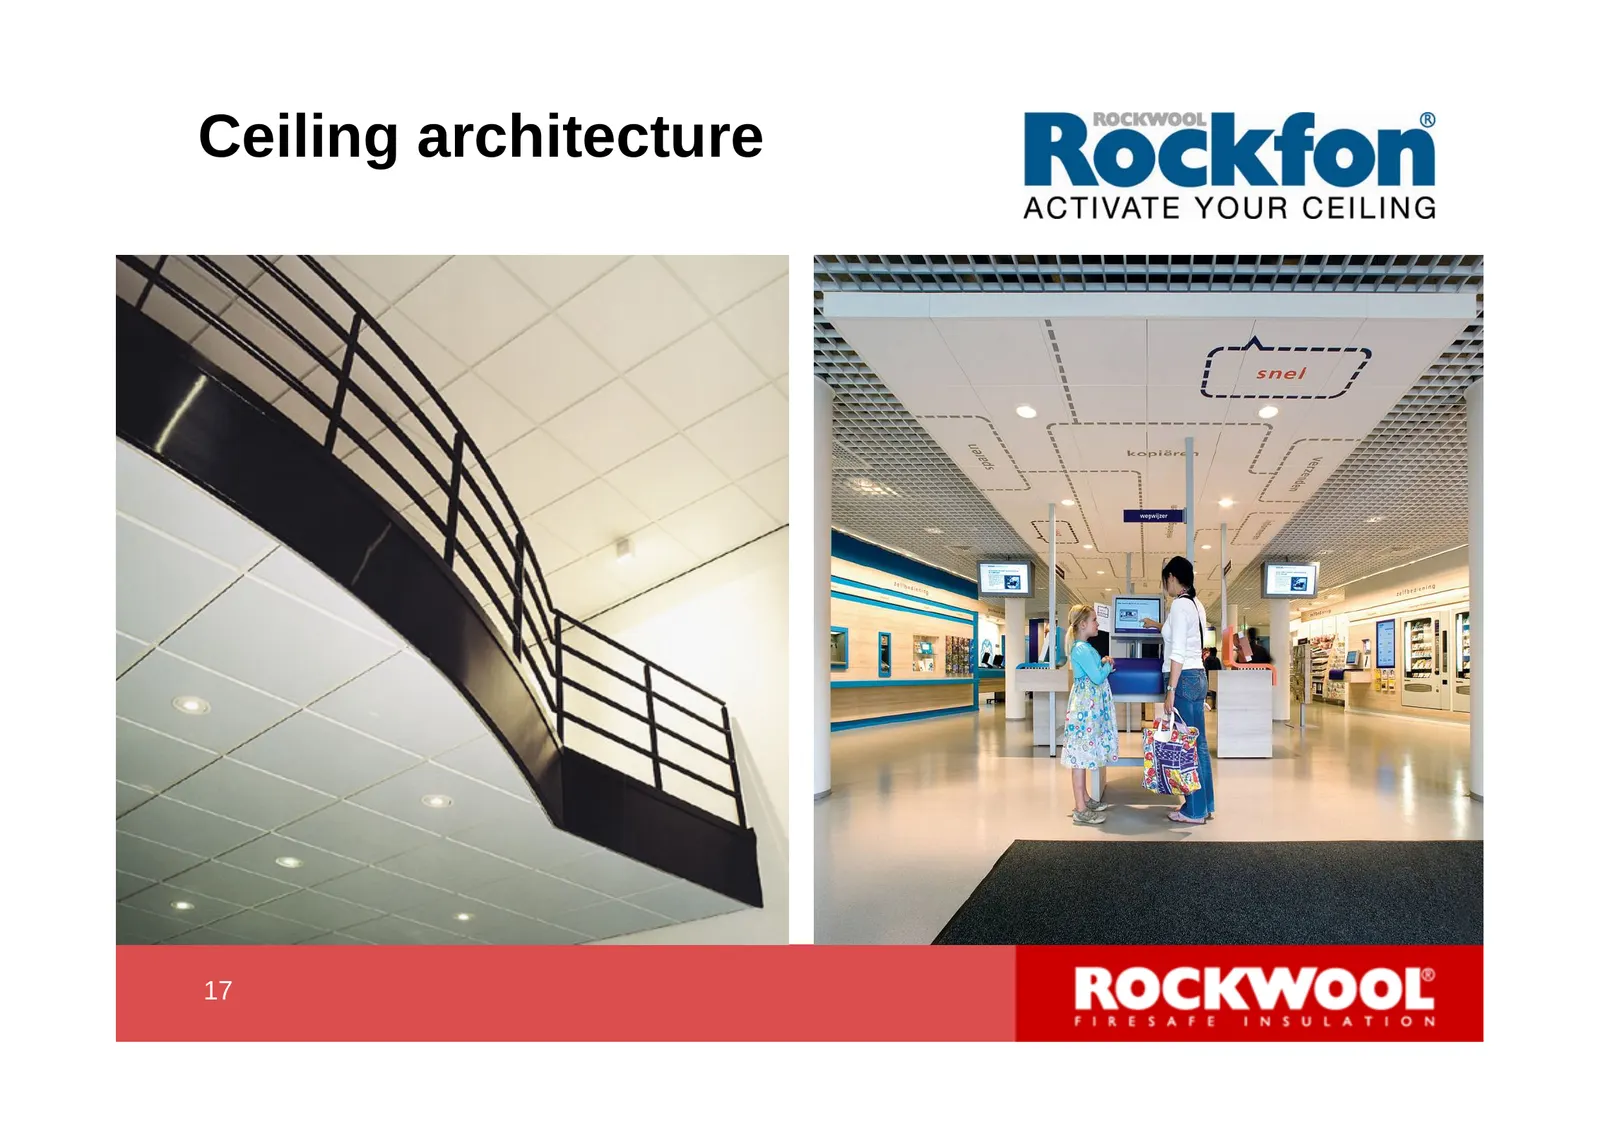
Slide 17: Ceiling architecture
Ceiling architecture Rockfon ACTIVATE YOUR CEILING
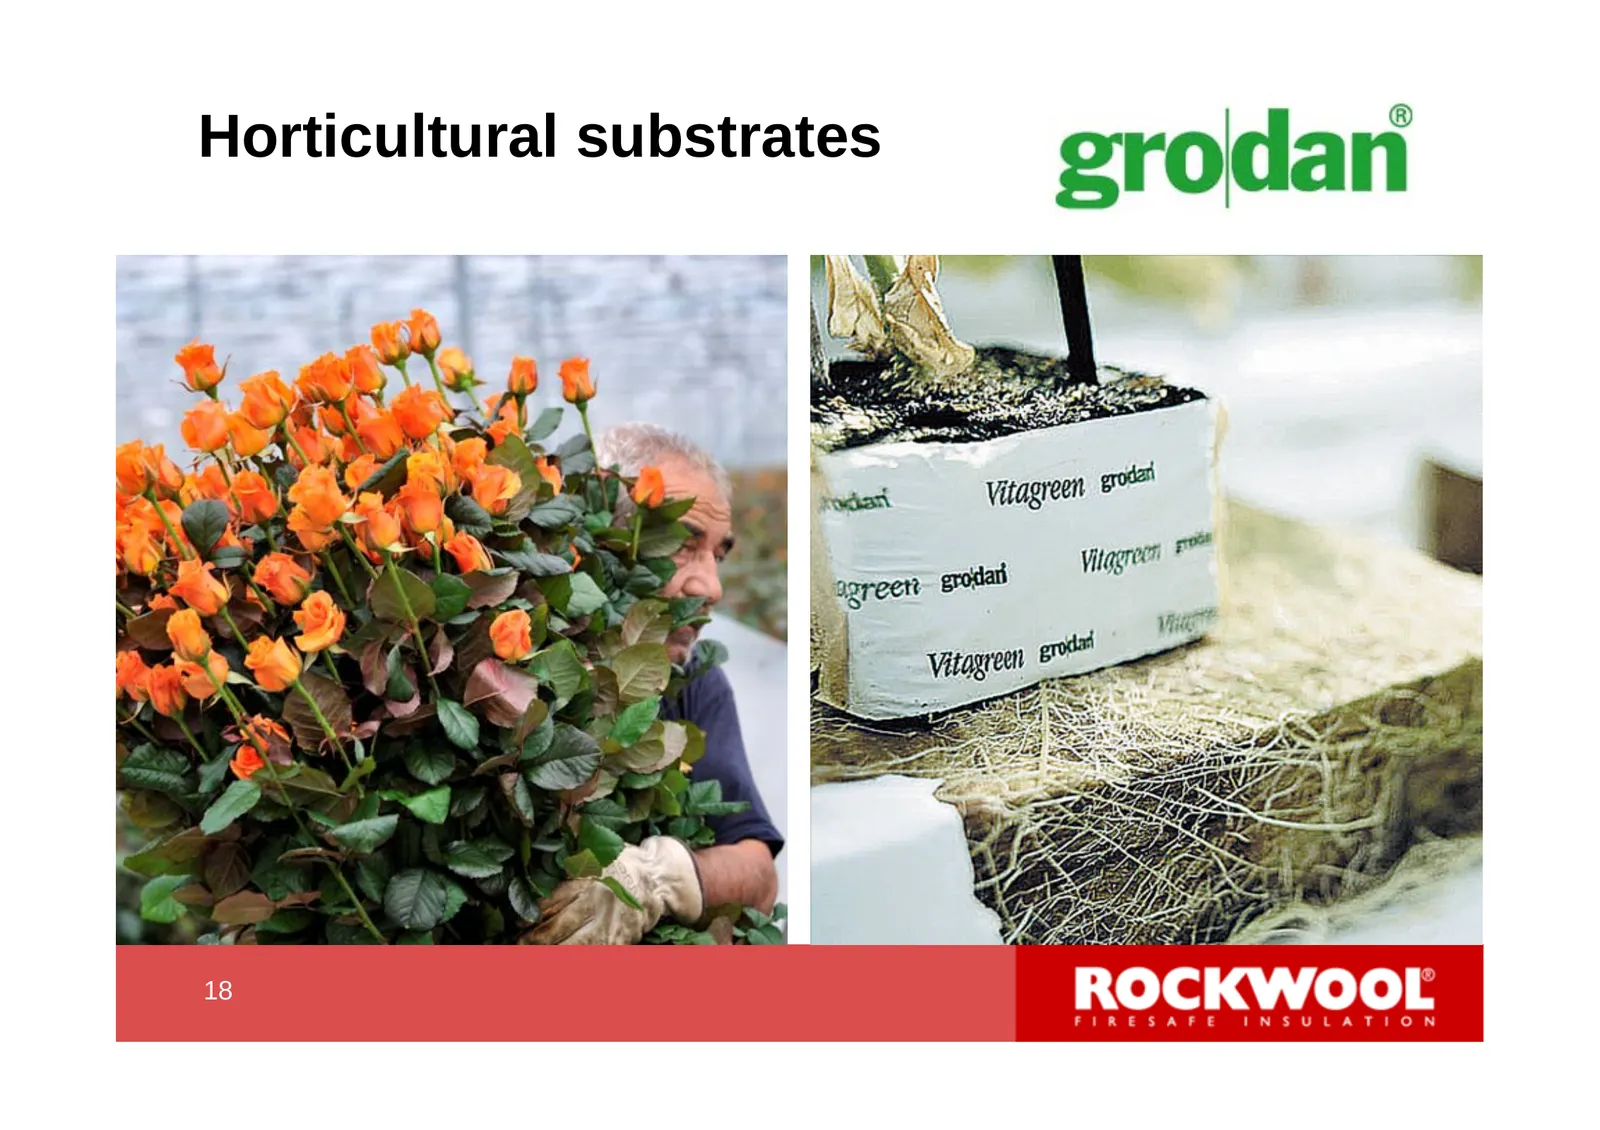
Slide 18: Horticultural substrates
Horticultural substrates 18 18
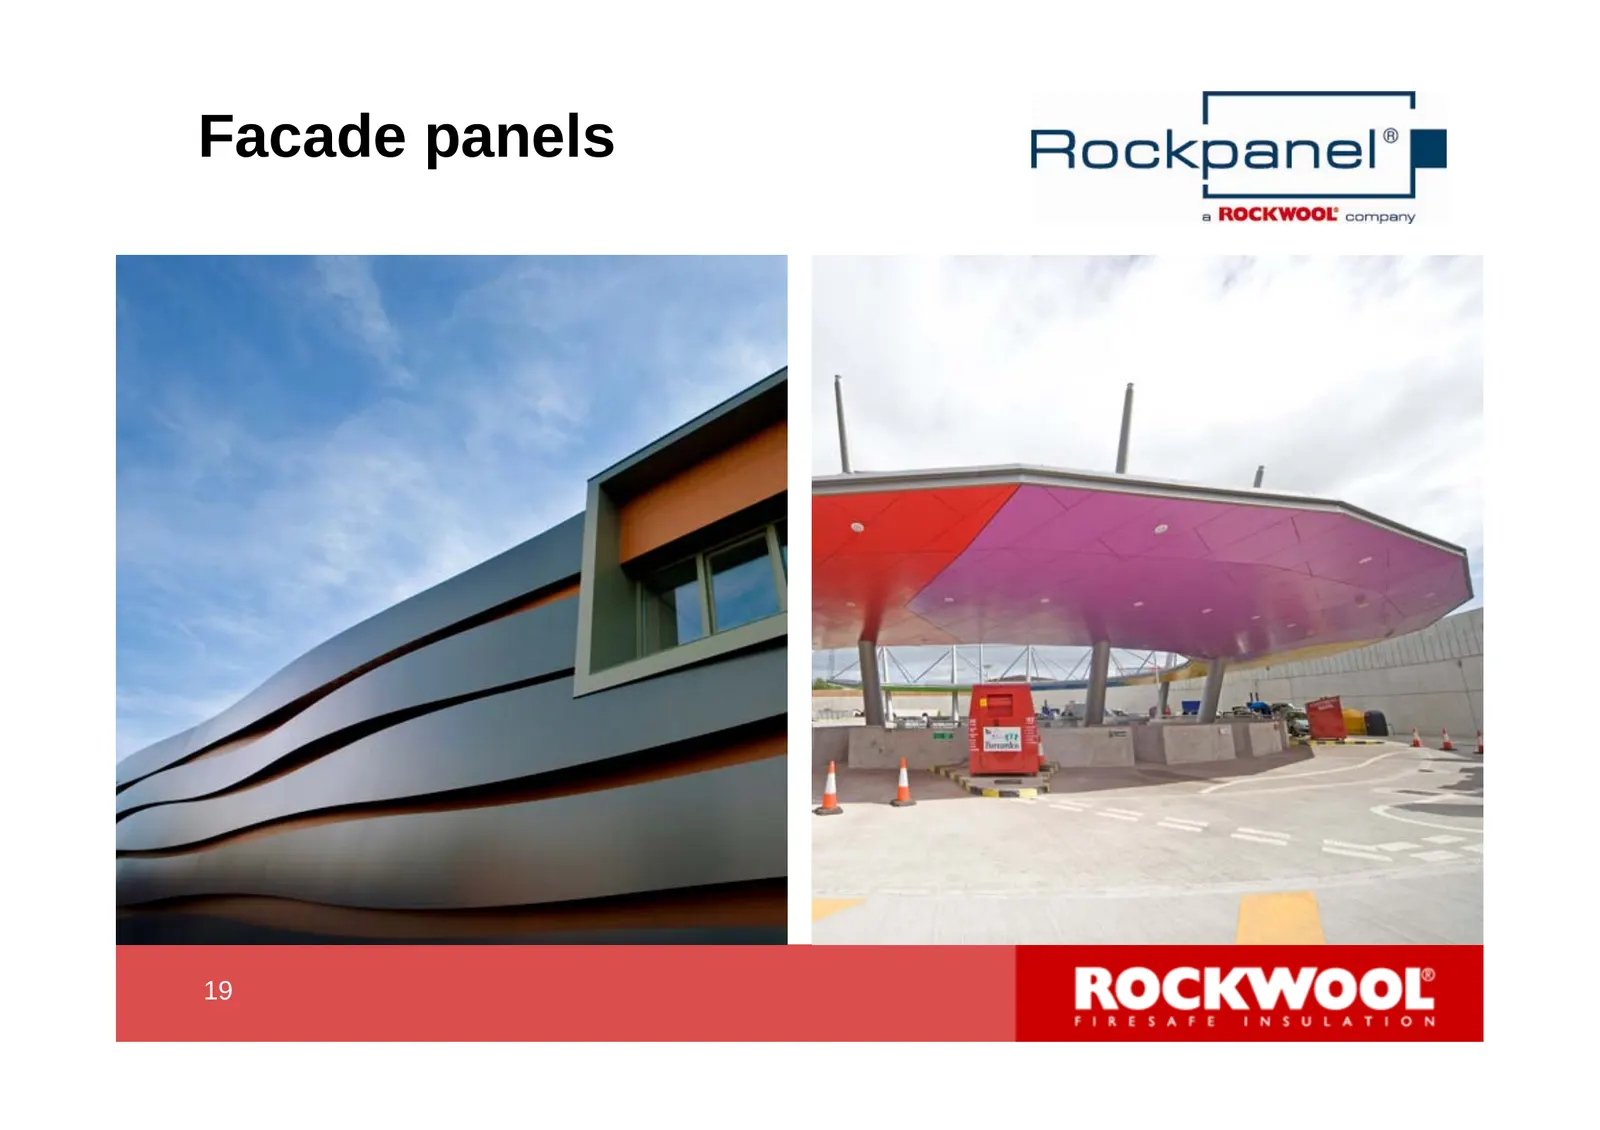
Slide 19: Facade panels
| Lf Facade panels ockpanel’™ ROCKWOOL company ROCKWOOL
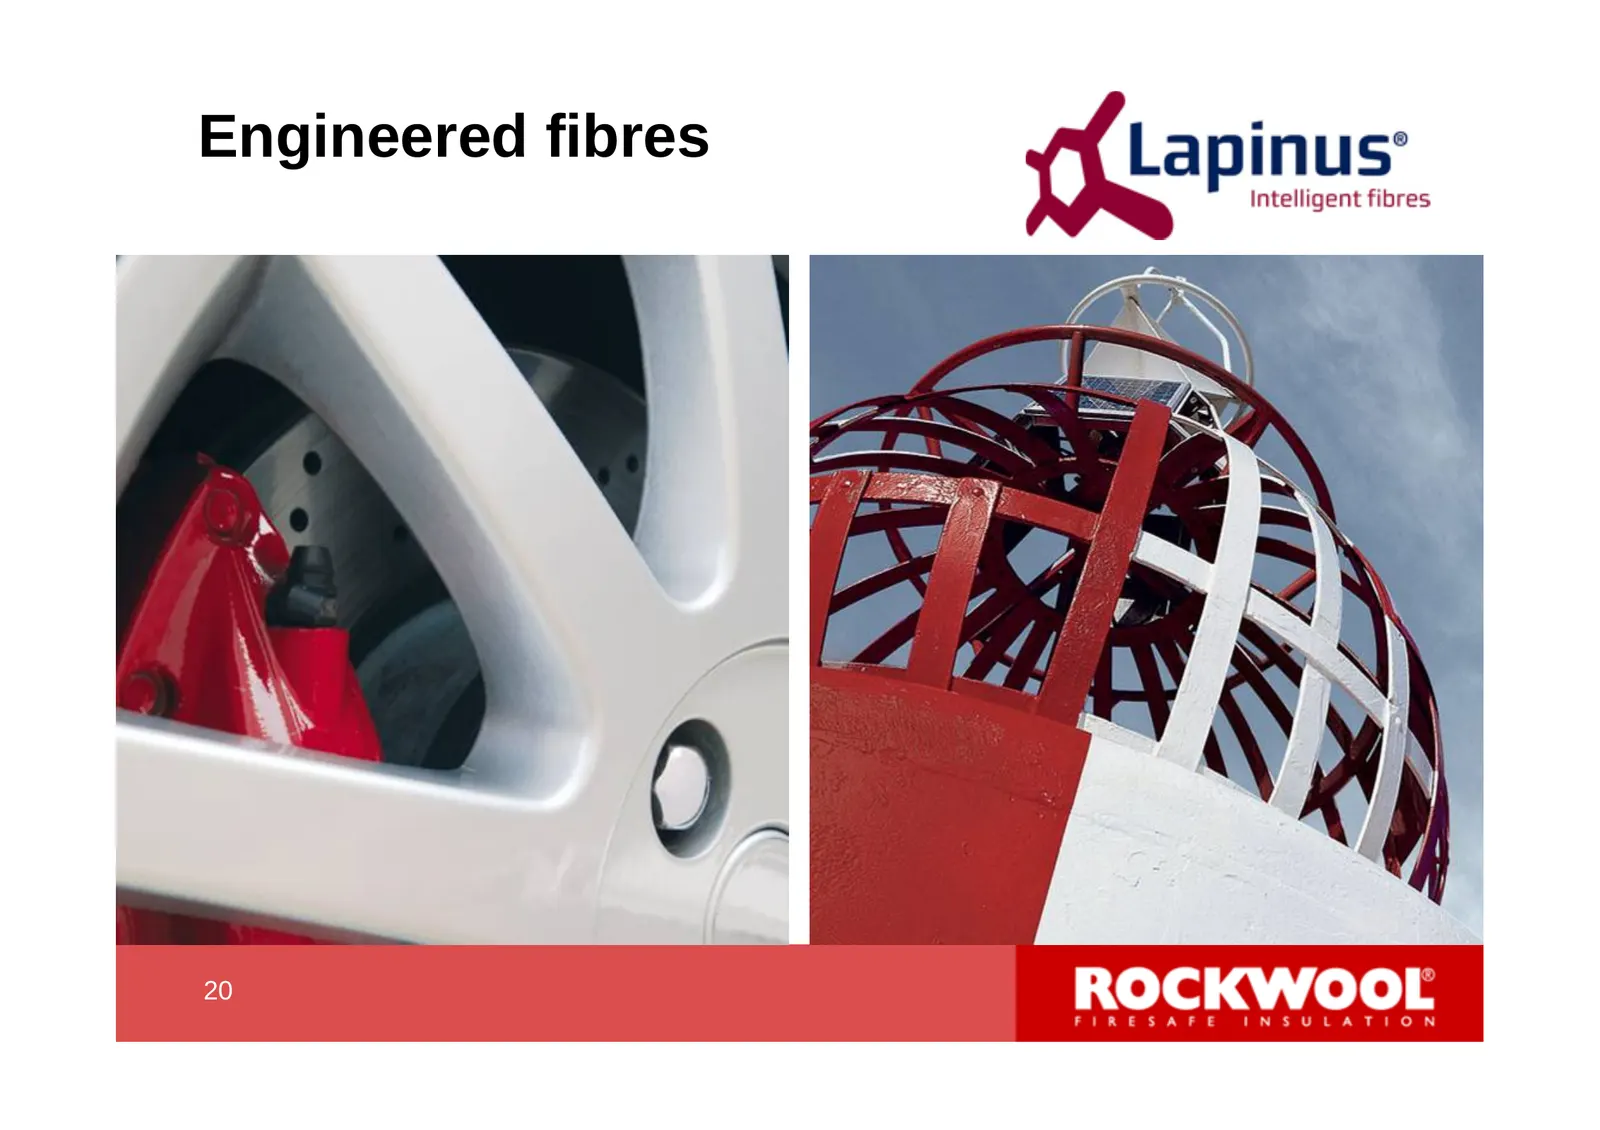
Slide 20: Engineered fibres
Intelligent fibres Engineered fibres gf Lapinus’
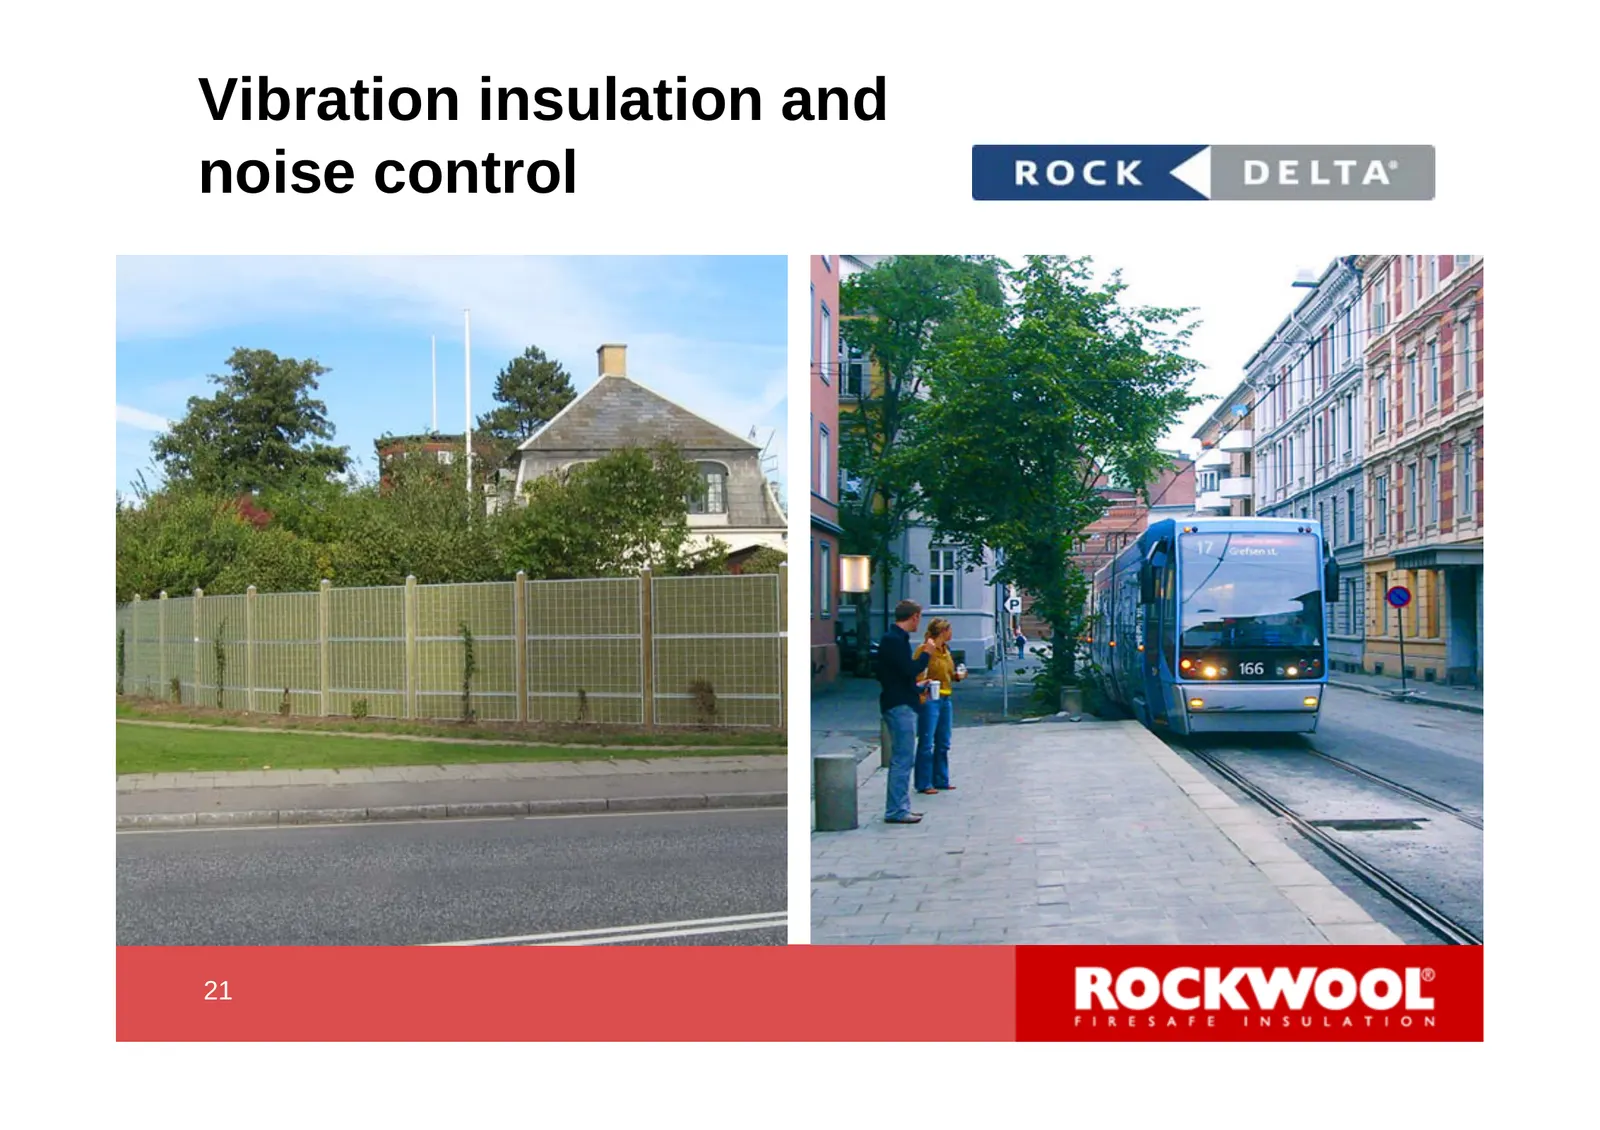
Slide 21: Vibration insulation and noise control
Vibration insulation and noise control 21 21
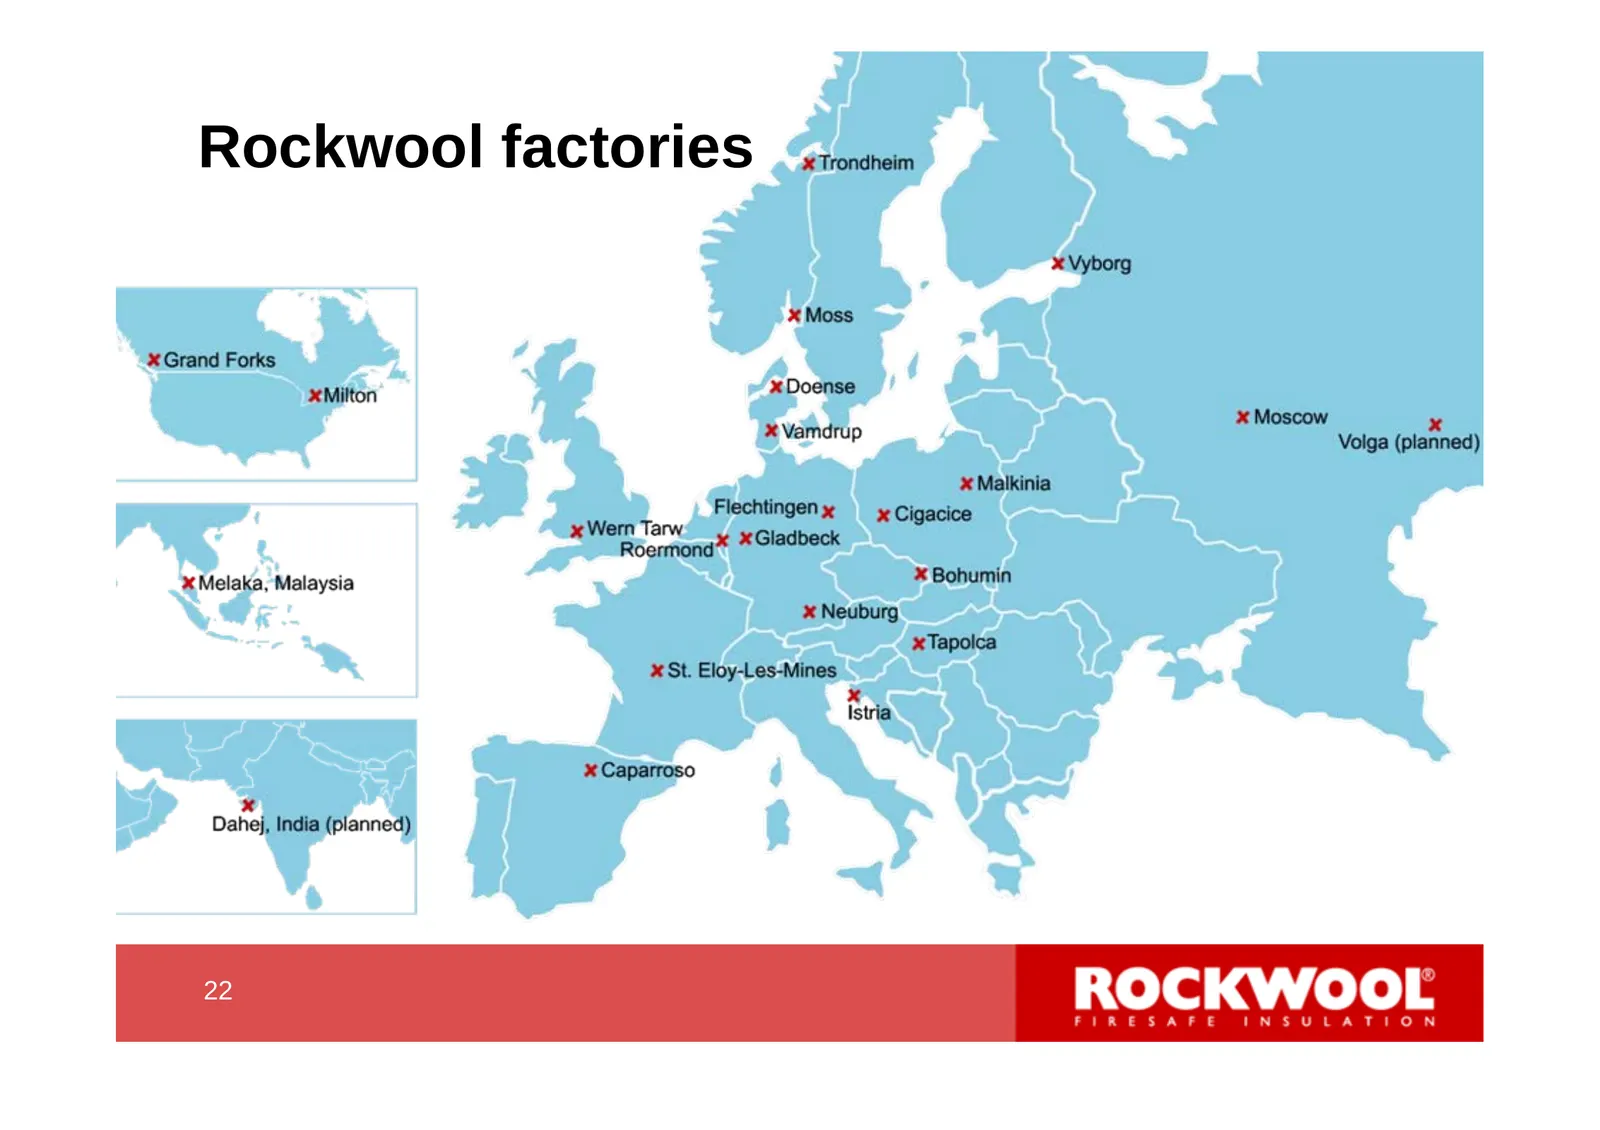
Slide 22: Rockwool factories
Rockwool factOrieS “rorem x Vyborg * Moss * Grand Forks X Milton x Doense x Moscow x gemctup Volga (planned) Malkinia Flechtingen x x Cigacice x Wern Tarw Roentiond* x Gladbeck * Melaka, Malaysia * Bohumin * Neuburg xTapoica * St. Eloy-Les-Mines x. Istria * Caparroso * Dahej, India (planned) ROCKWOO
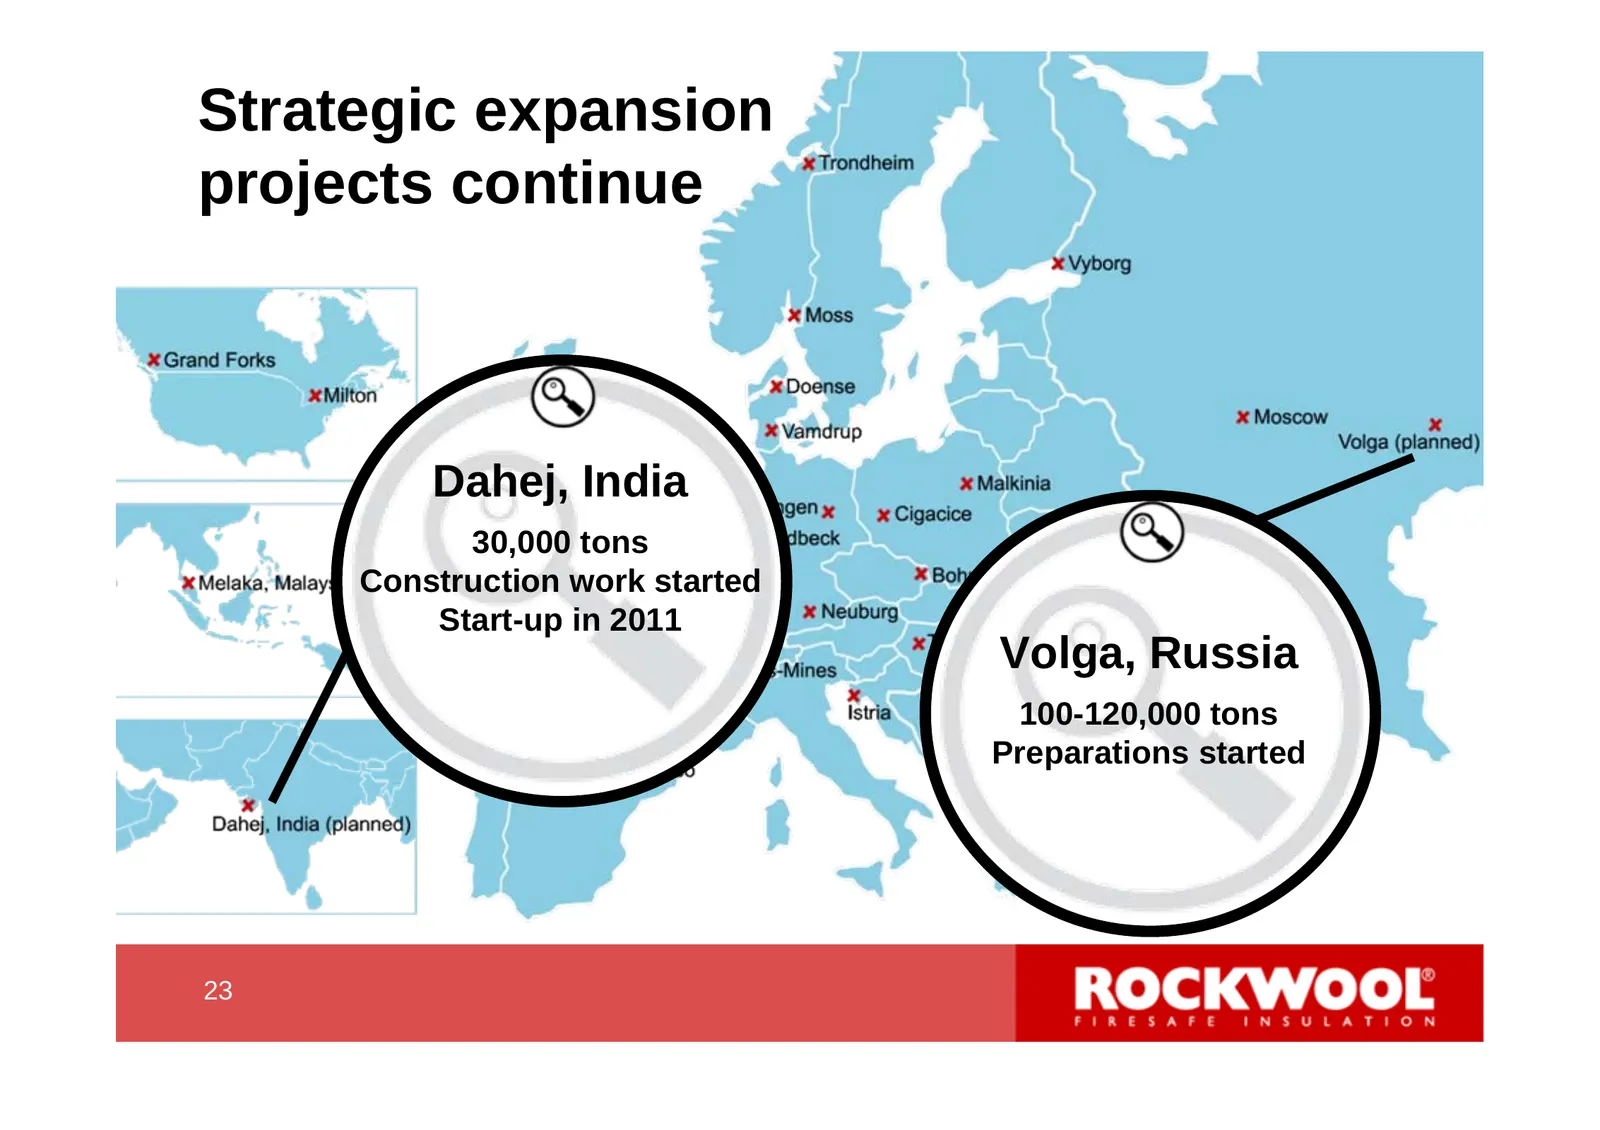
Slide 23: Strategic expansion projects continue
Strategic expansion projects continue Dahej, India 30,000 tons Construction work started Start-up in 2011 Volga, Russia 100-120,000 tons Preparations started 23 23
Slide 24: Financials
Financials 24 24
Slide 25: Net sales acc. Q3
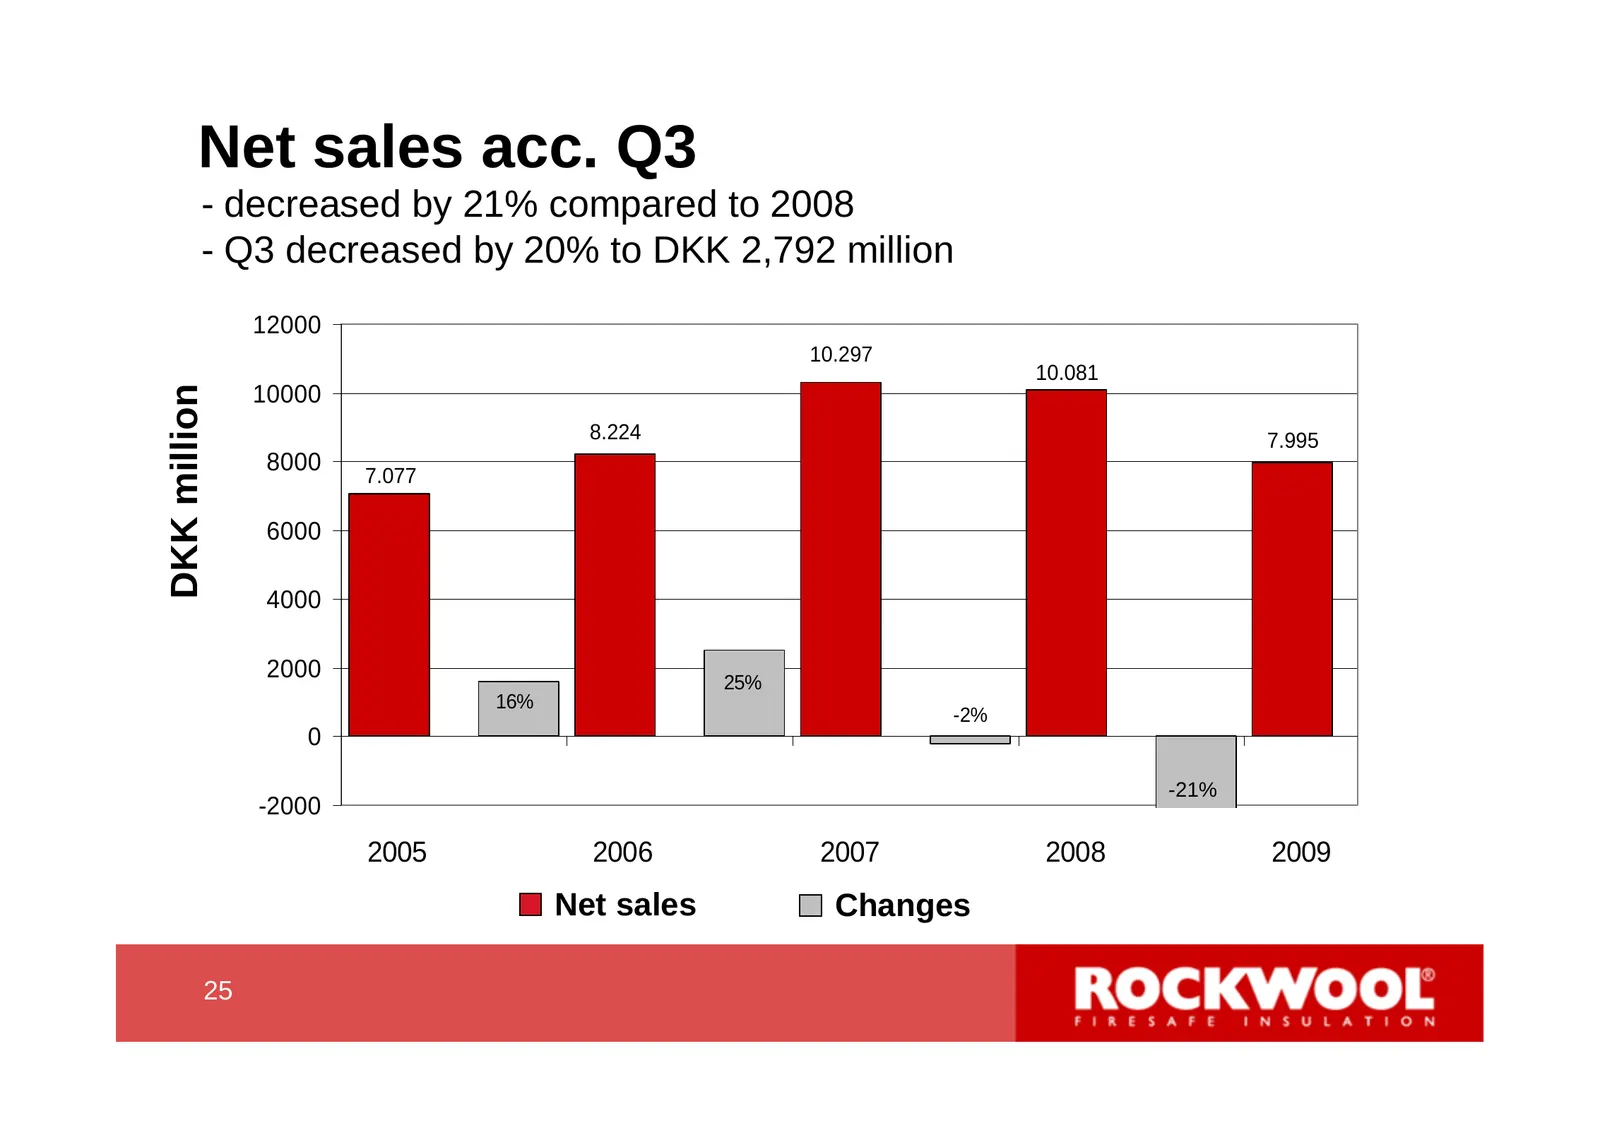
Net sales acc. Q3 - decreased by 21% compared to 2008 - Q3 decreased by 20% to DKK 2,792 million 12000 10.297 10.081 DKK million 10000 8.224 7.995 8000 7.077 6000 4000 2000 25% 16% -2% 0 -21% -2000 2005 2006 2007 2008 2009 Net sales Changes 25 25
Slide 26: Long term sales development 1984-2009e
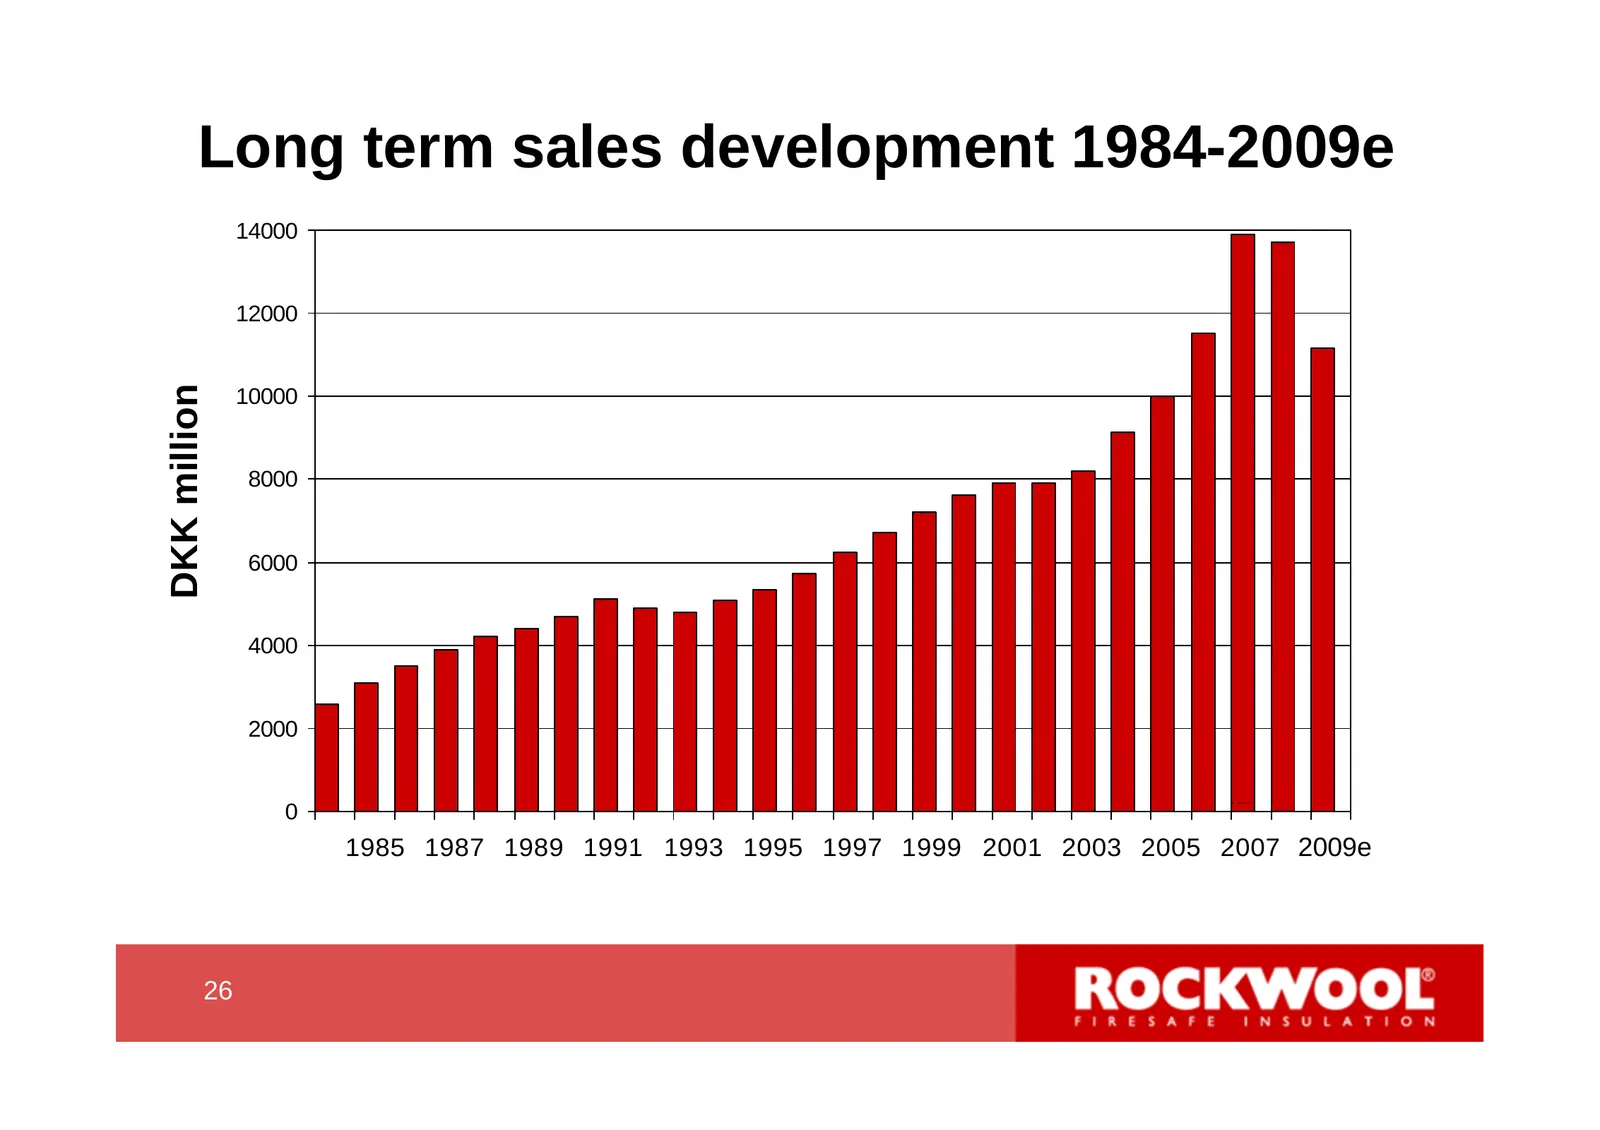
Long term sales development 1984-2009e 14000 12000 DKK million 10000 8000 6000 4000 2000 0 2009e 1985 1987 1989 1991 1993 1995 1997 1999 2001 2003 2005 2007 2009e 26 26
Slide 27: Sales trends
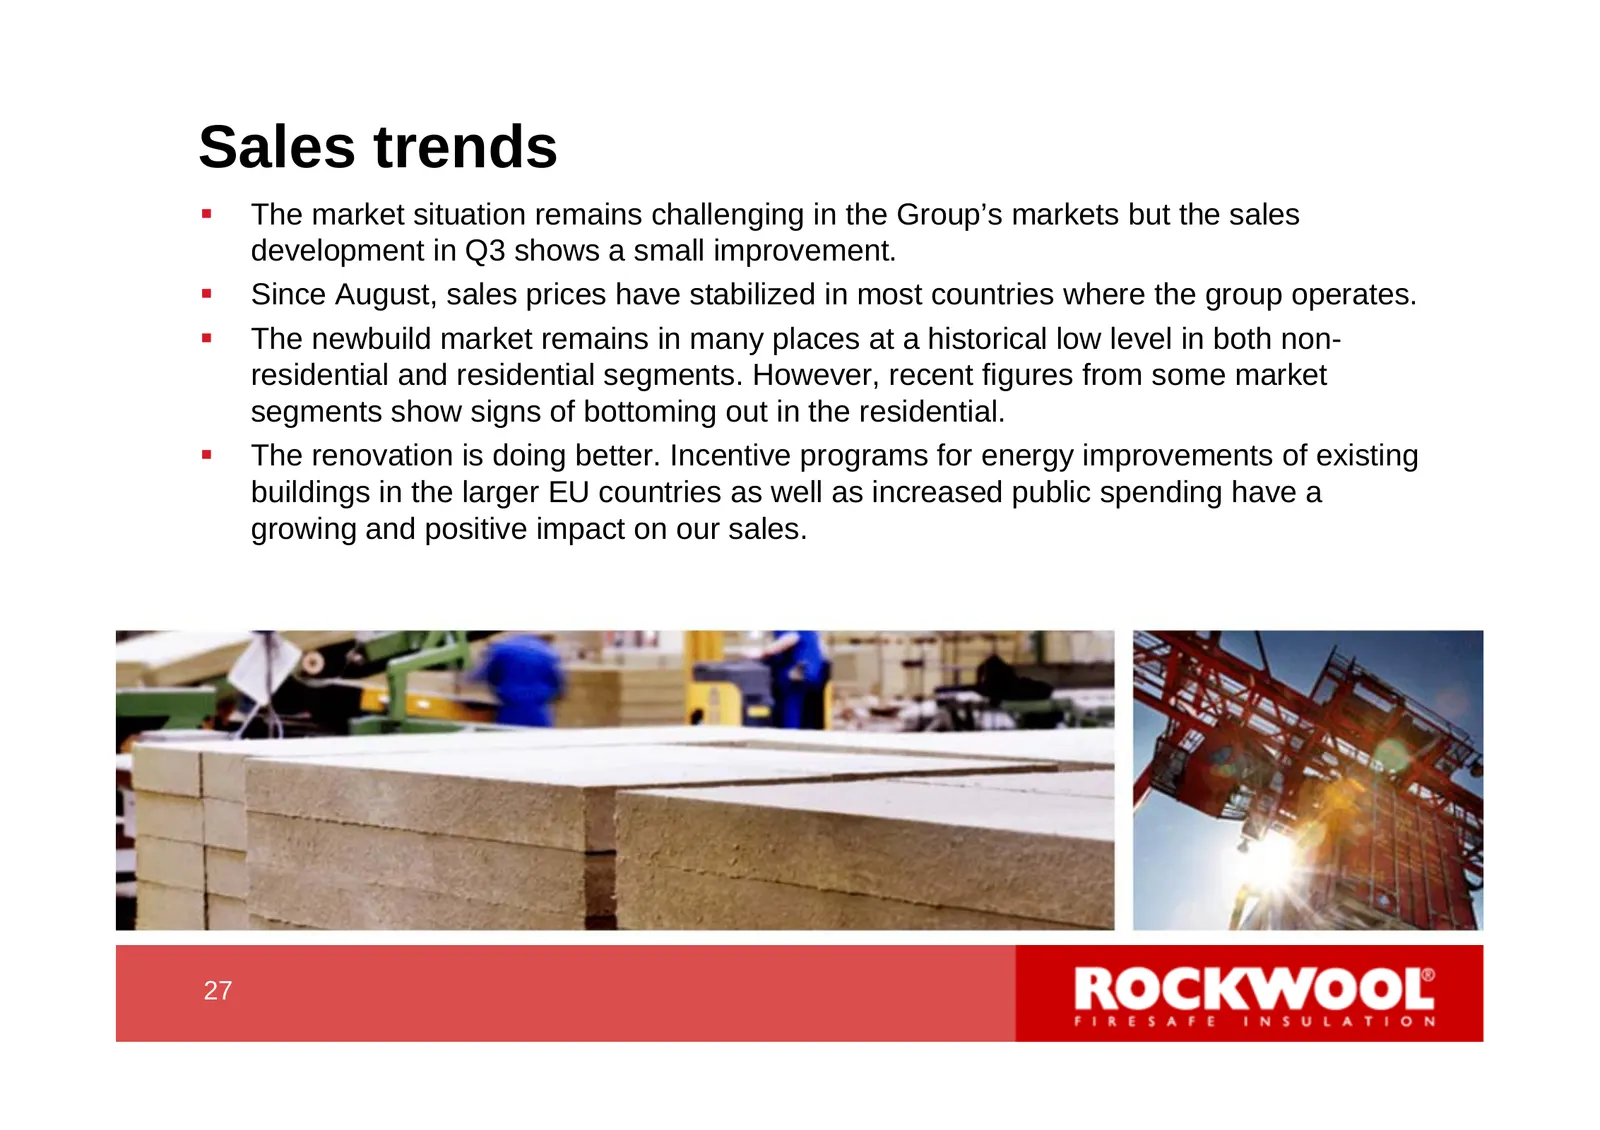
Sales trends The market situation remains challenging in the Group’s markets but the sales development in Q3 shows a small improvement. Since August, sales prices have stabilized in most countries where the group operates. The newbuild market remains in many places at a historical low level in
Slide 28: Construction indicators
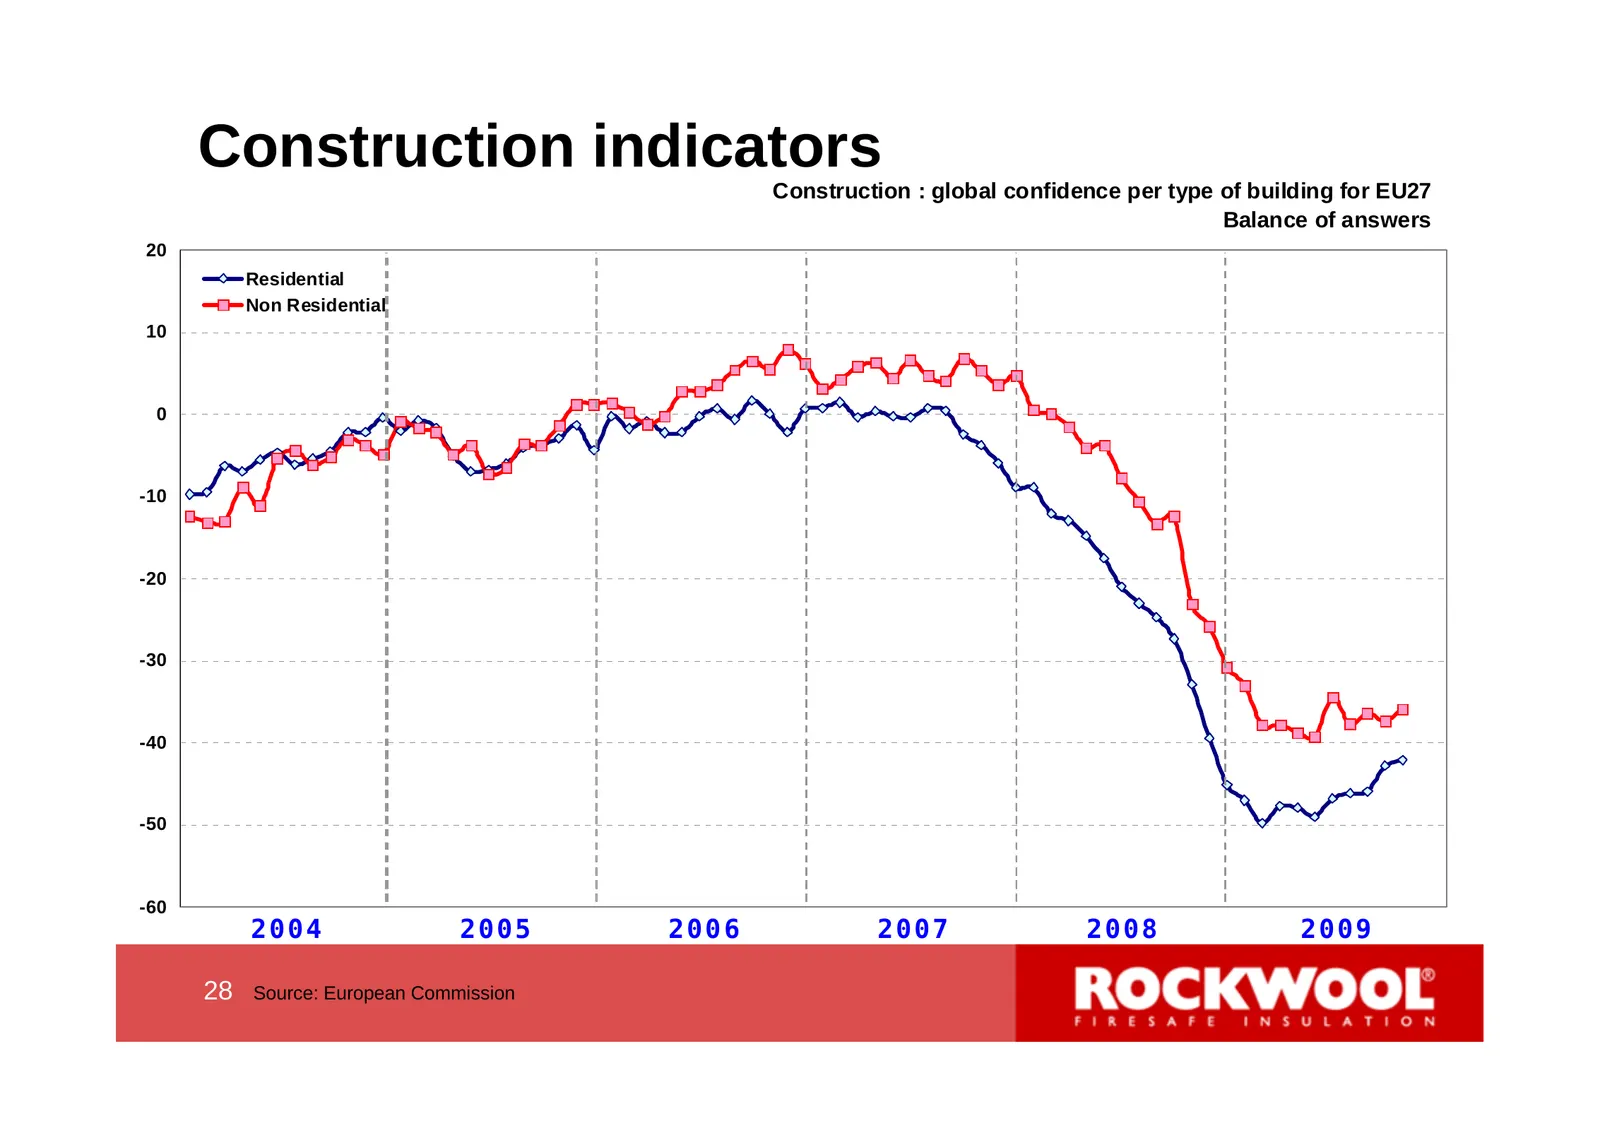
Construction indicators Construction : global confidence per type of building for EU27 Balance of answers 20 Residential Non Residential 10 0 -10 -20 -30 -40 -50 -60 2004 2005 2006 2007 2008 2009 28 Source: European Commission 28
Slide 29: Profit acc. Q3 after minority interests
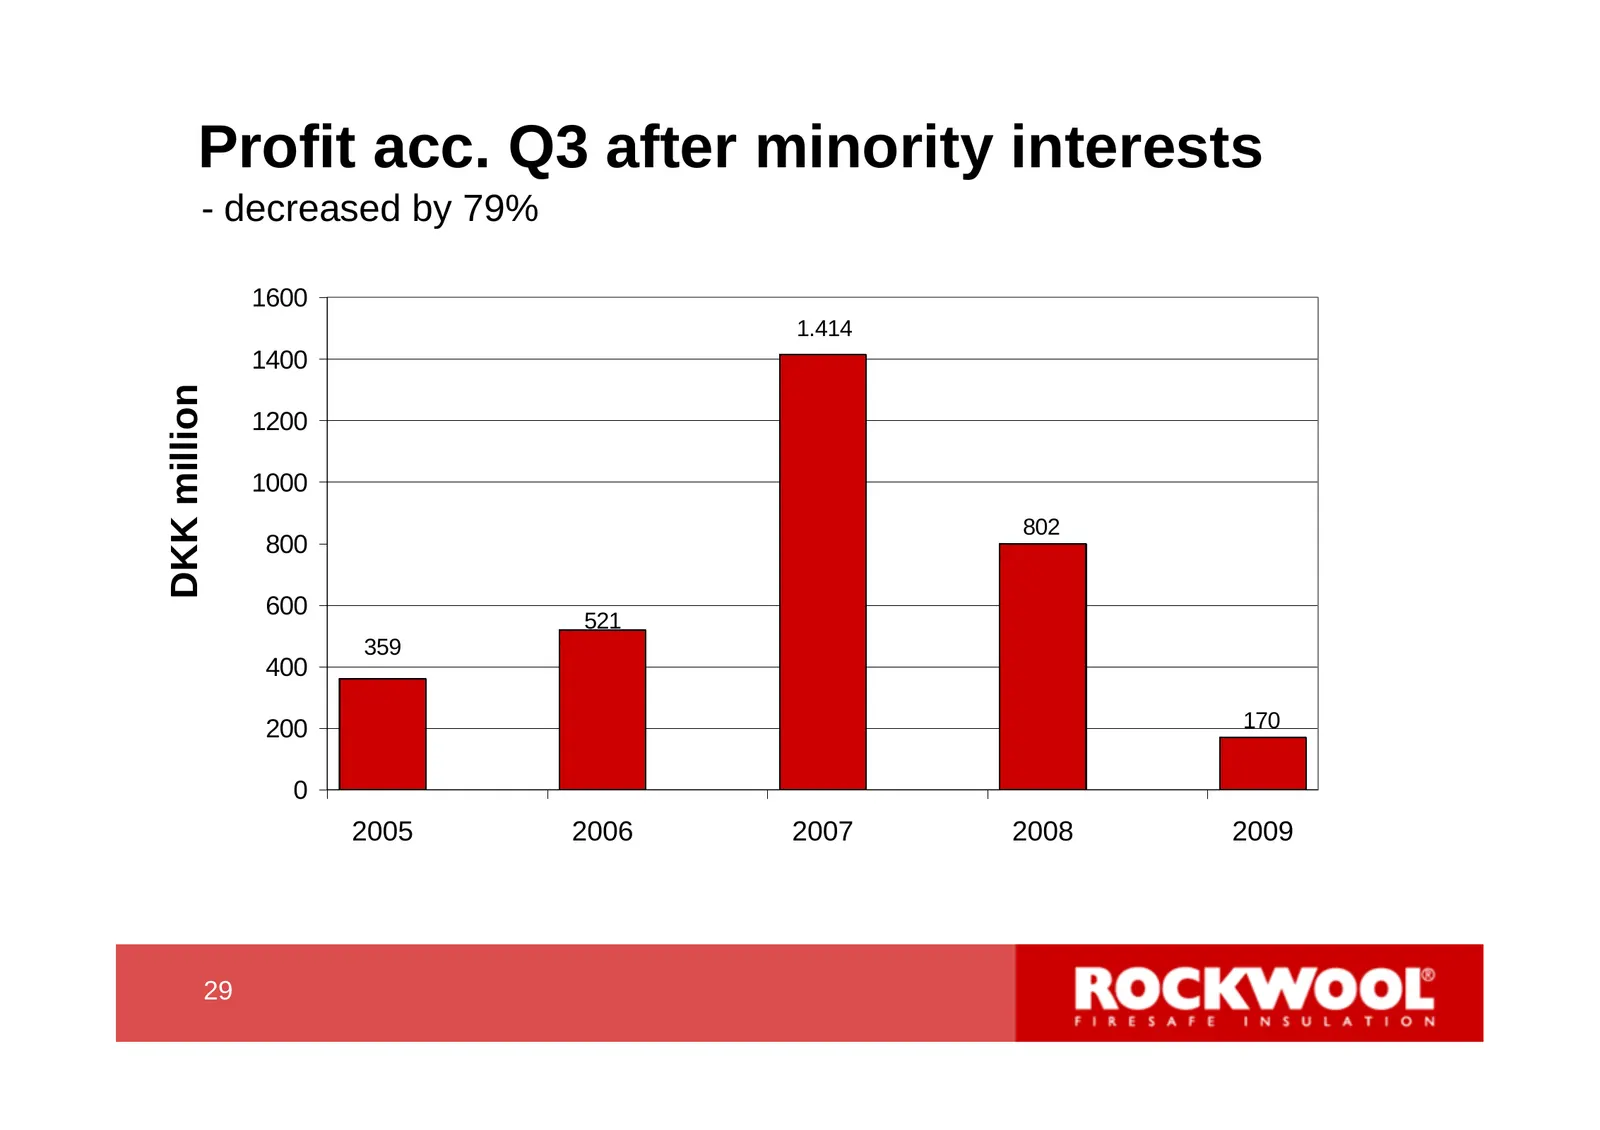
Profit acc. Q3 after minority interests - decreased by 79% 1600 1.414 1400 DKK million 1200 1000 802 800 600 521 359 400 200 170 0 2005 2006 2007 2008 2009 29 29
Slide 30: Long term EBIT ratio 1984-2009e
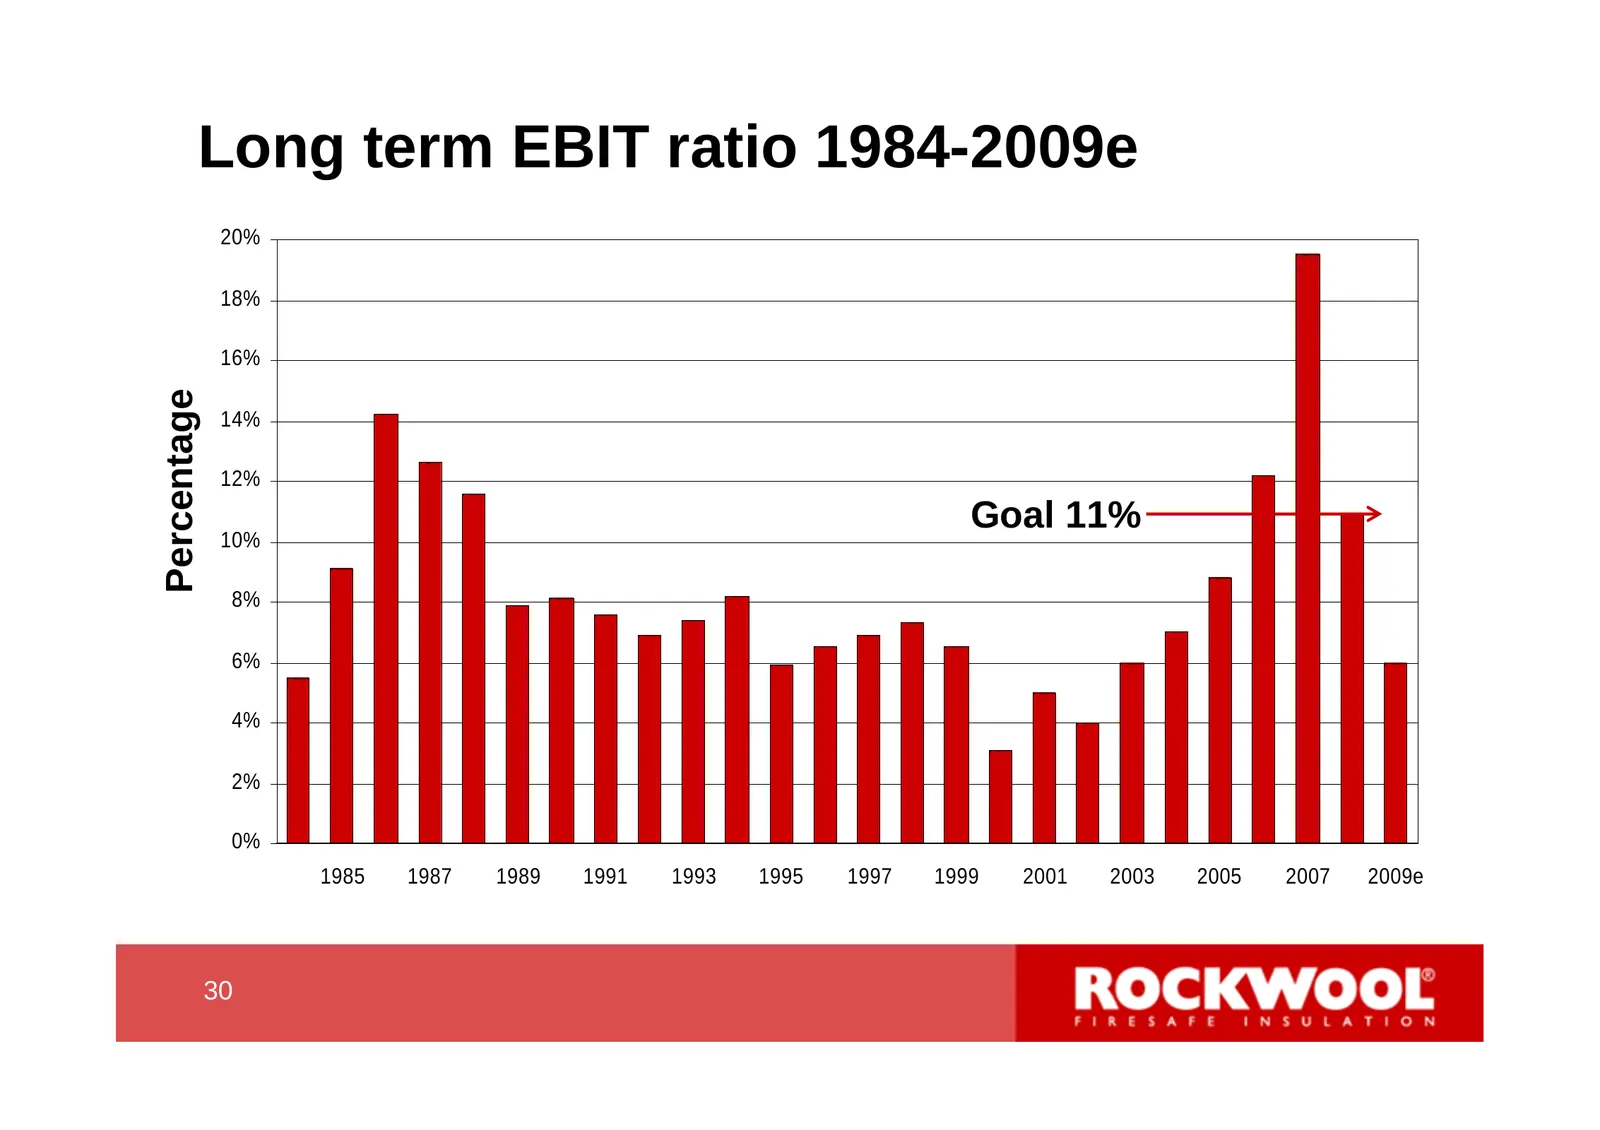
Long term EBIT ratio 1984-2009e 20% 18% 16% Percentage 14% 12% Goal 11% 10% 8% 6% 4% 2% 0% 1985 1987 1989 1991 1993 1995 1997 1999 2001 2003 2005 2007 2009e 30 30
Slide 31: Cost reduction programme
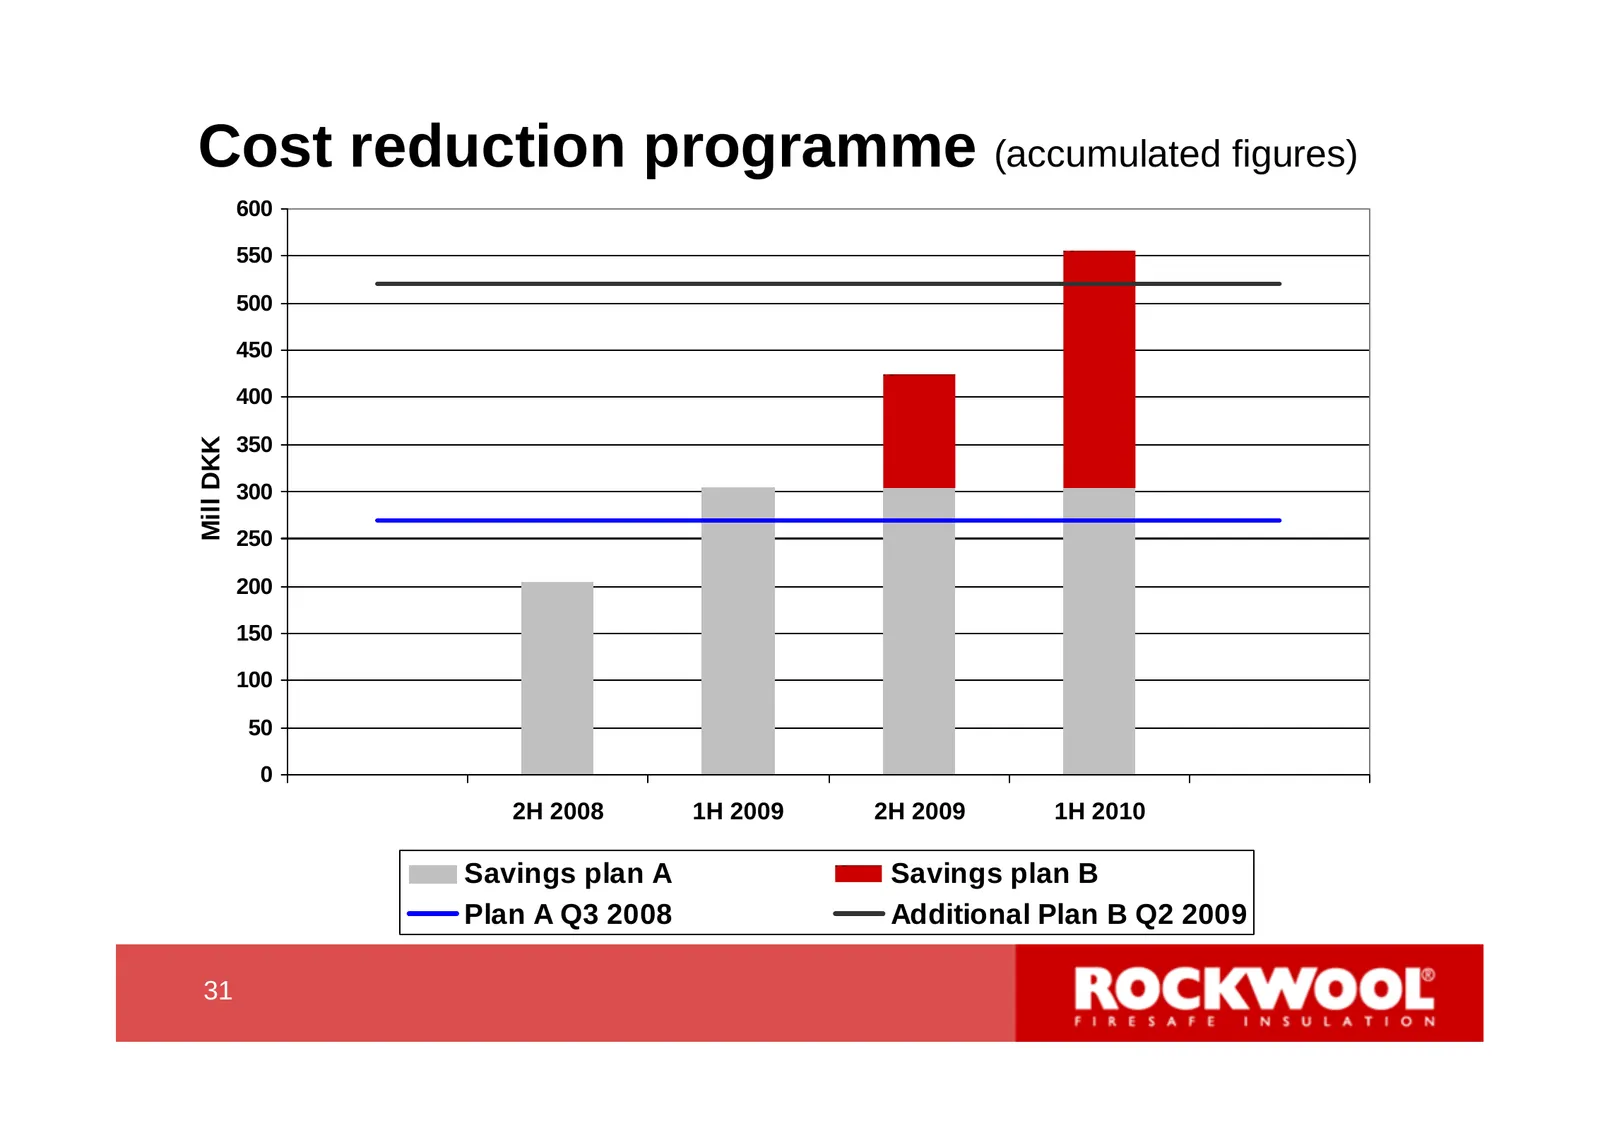
Cost reduction programme (accumulated figures) 600 550 500 450 400 Mill DKK 350 300 250 200 150 100 50 0 2H 2008 1H 2009 2H 2009 1H 2010 Savings plan A Savings plan B Plan A Q3 2008 Additional Plan B Q2 2009 31 31
Slide 32: Investments and acquisitions Q3
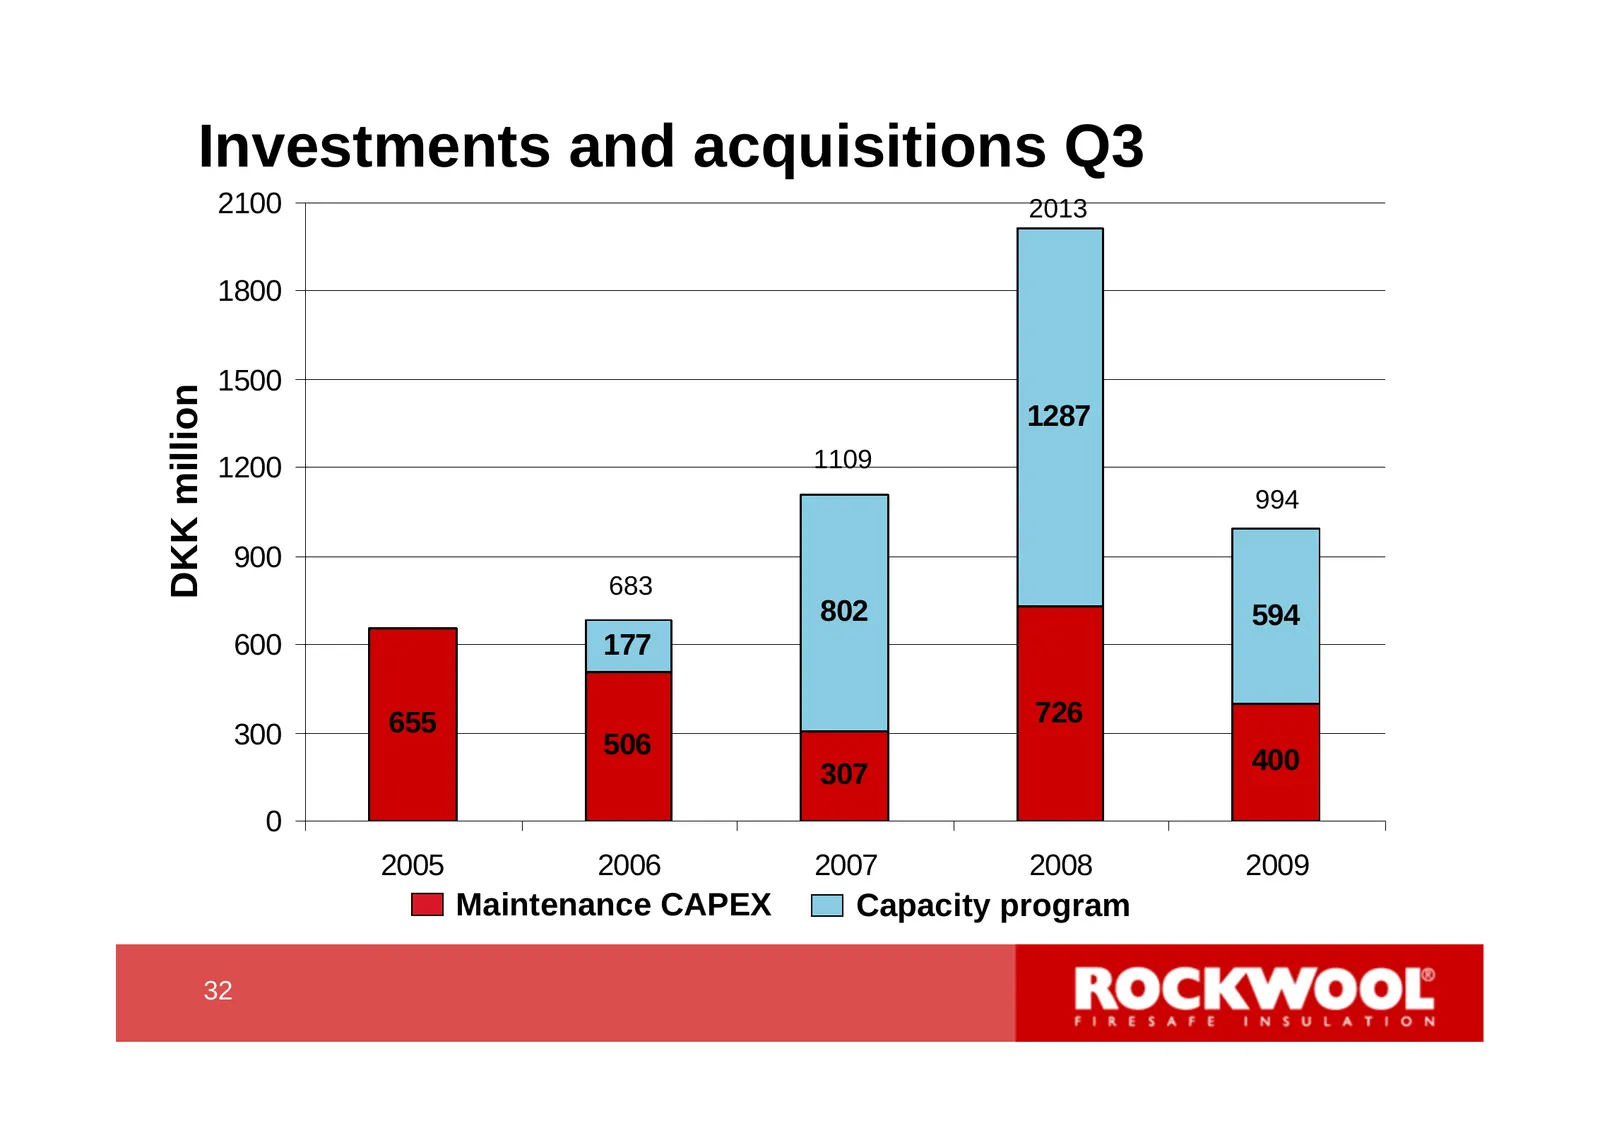
Investments and acquisitions Q3 2100 2013 1800 1500 DKK million 1287 1200 1109 994 900 683 802 594 600 177 655 726 300 506 307 400 0 2005 2006 2007 2008 2009 Maintenance CAPEX Capacity program 32 32
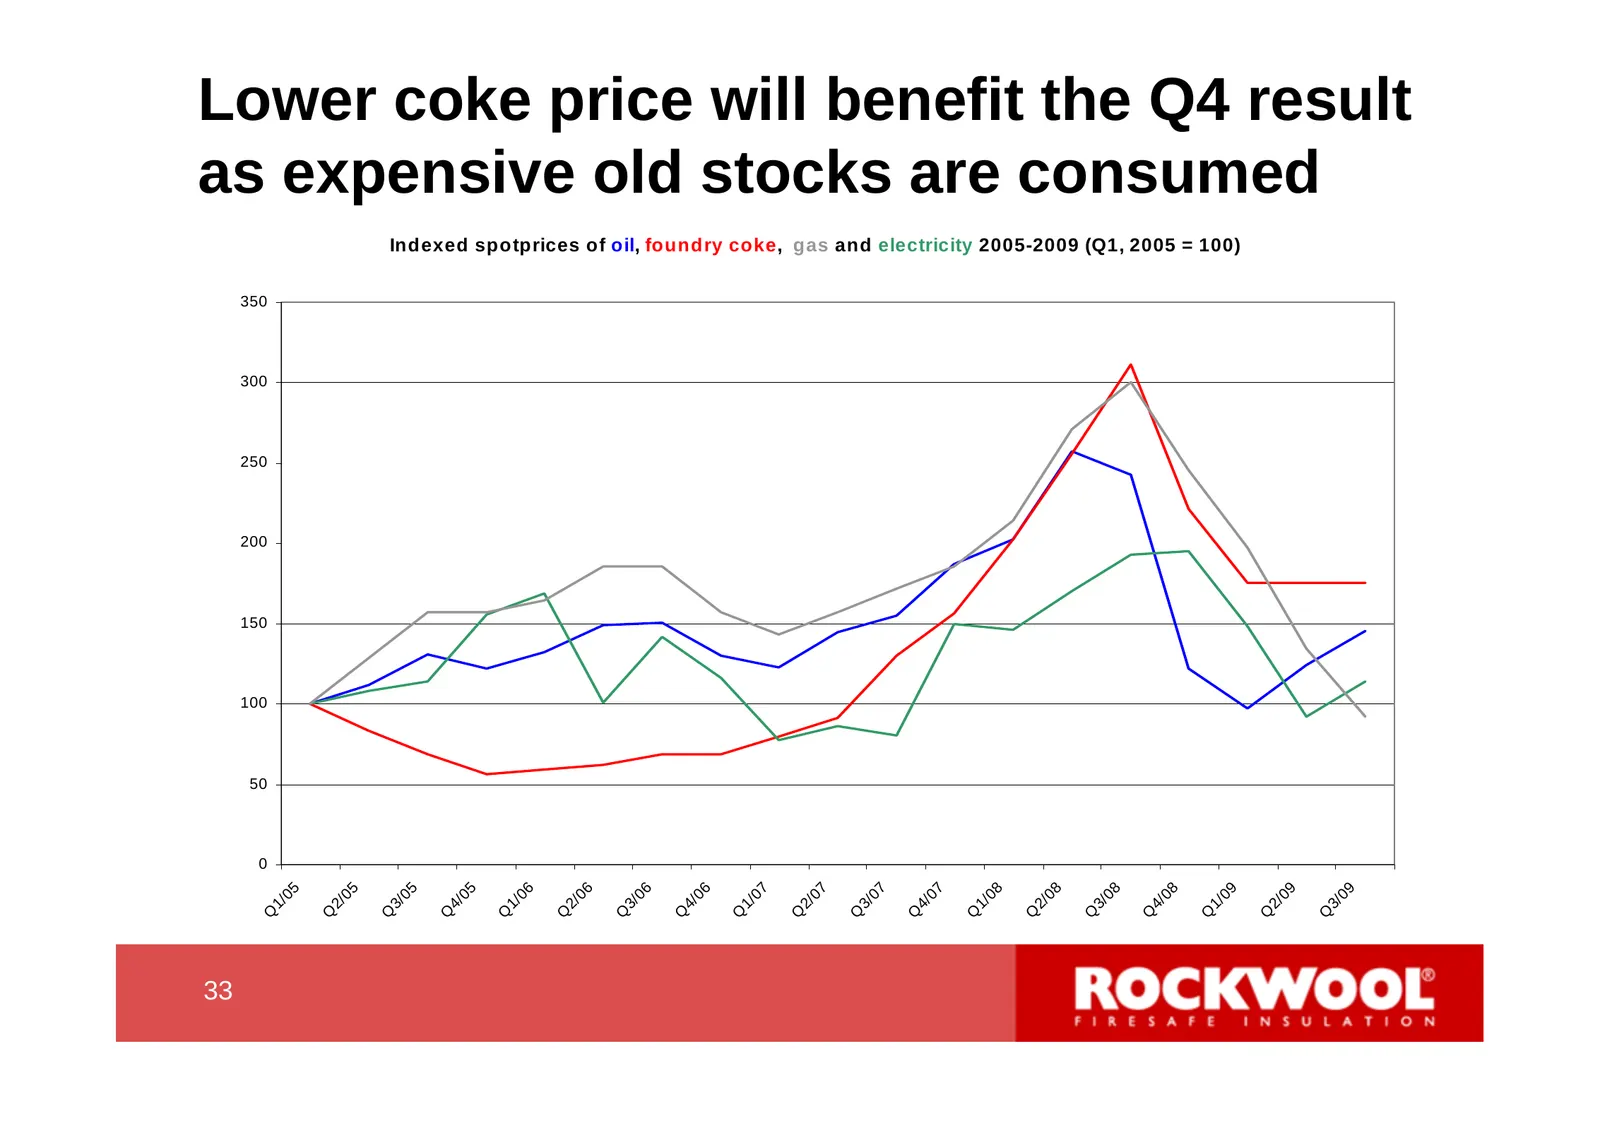
Slide 33: Lower coke price will benefit the Q4 result
Lower coke price will benefit the Q4 result as expensive old stocks are consumed Indexed spotprices of oil, foundry coke, gas and electricity 2005-2009 (Q1, 2005 = 100) 350 300 250 200 150 100 50 0 05 05 05 05 06 06 06 06 07 07 07 07 08 08 08 08 09 09 09 1/ 2/ 3/ 4/ 1/ 2/ 3/ 4/ 1/ 2/ 3/ 4/ 1/ 2/ 3/
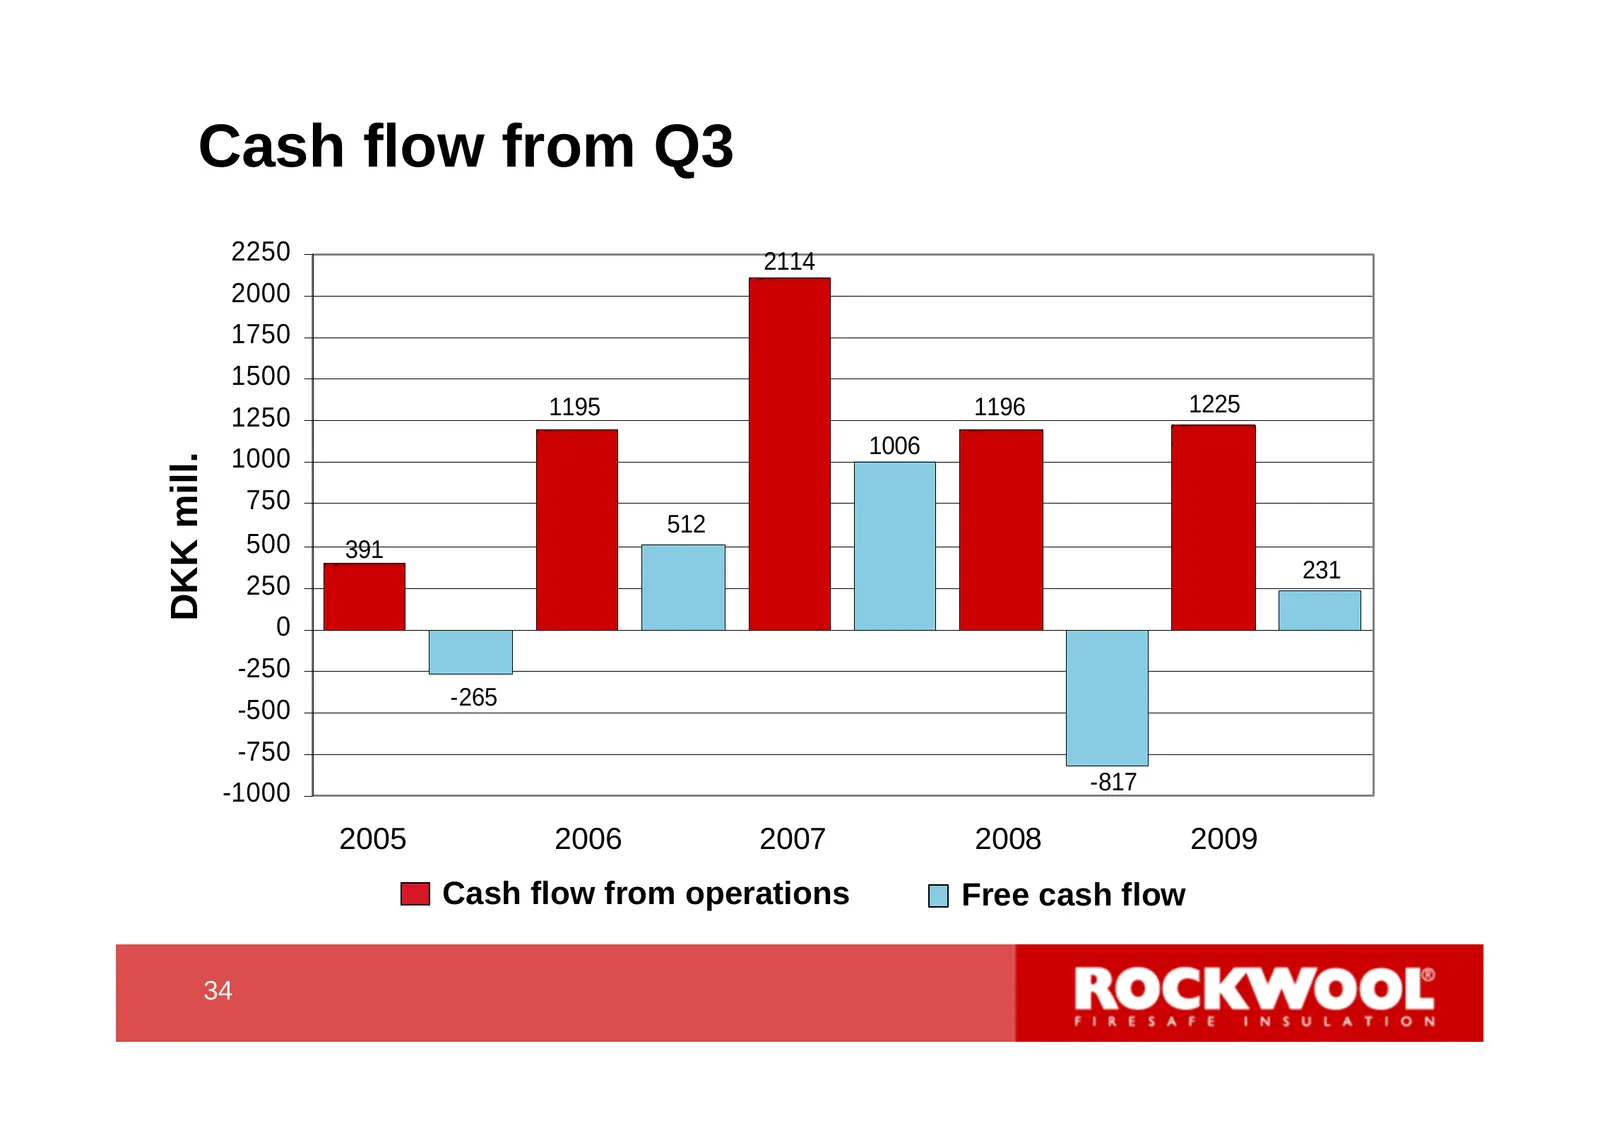
Slide 34: Cash flow from Q3
Cash flow from Q3 2250 2114 2000 1750 1500 1195 1196 1225 1250 1006 1000 DKK mill. 750 512 500 391 231 250 0 -250 -265 -500 -750 -1000 -817 2005 2006 2007 2008 2009 Cash flow from operations Free cash flow 34 34
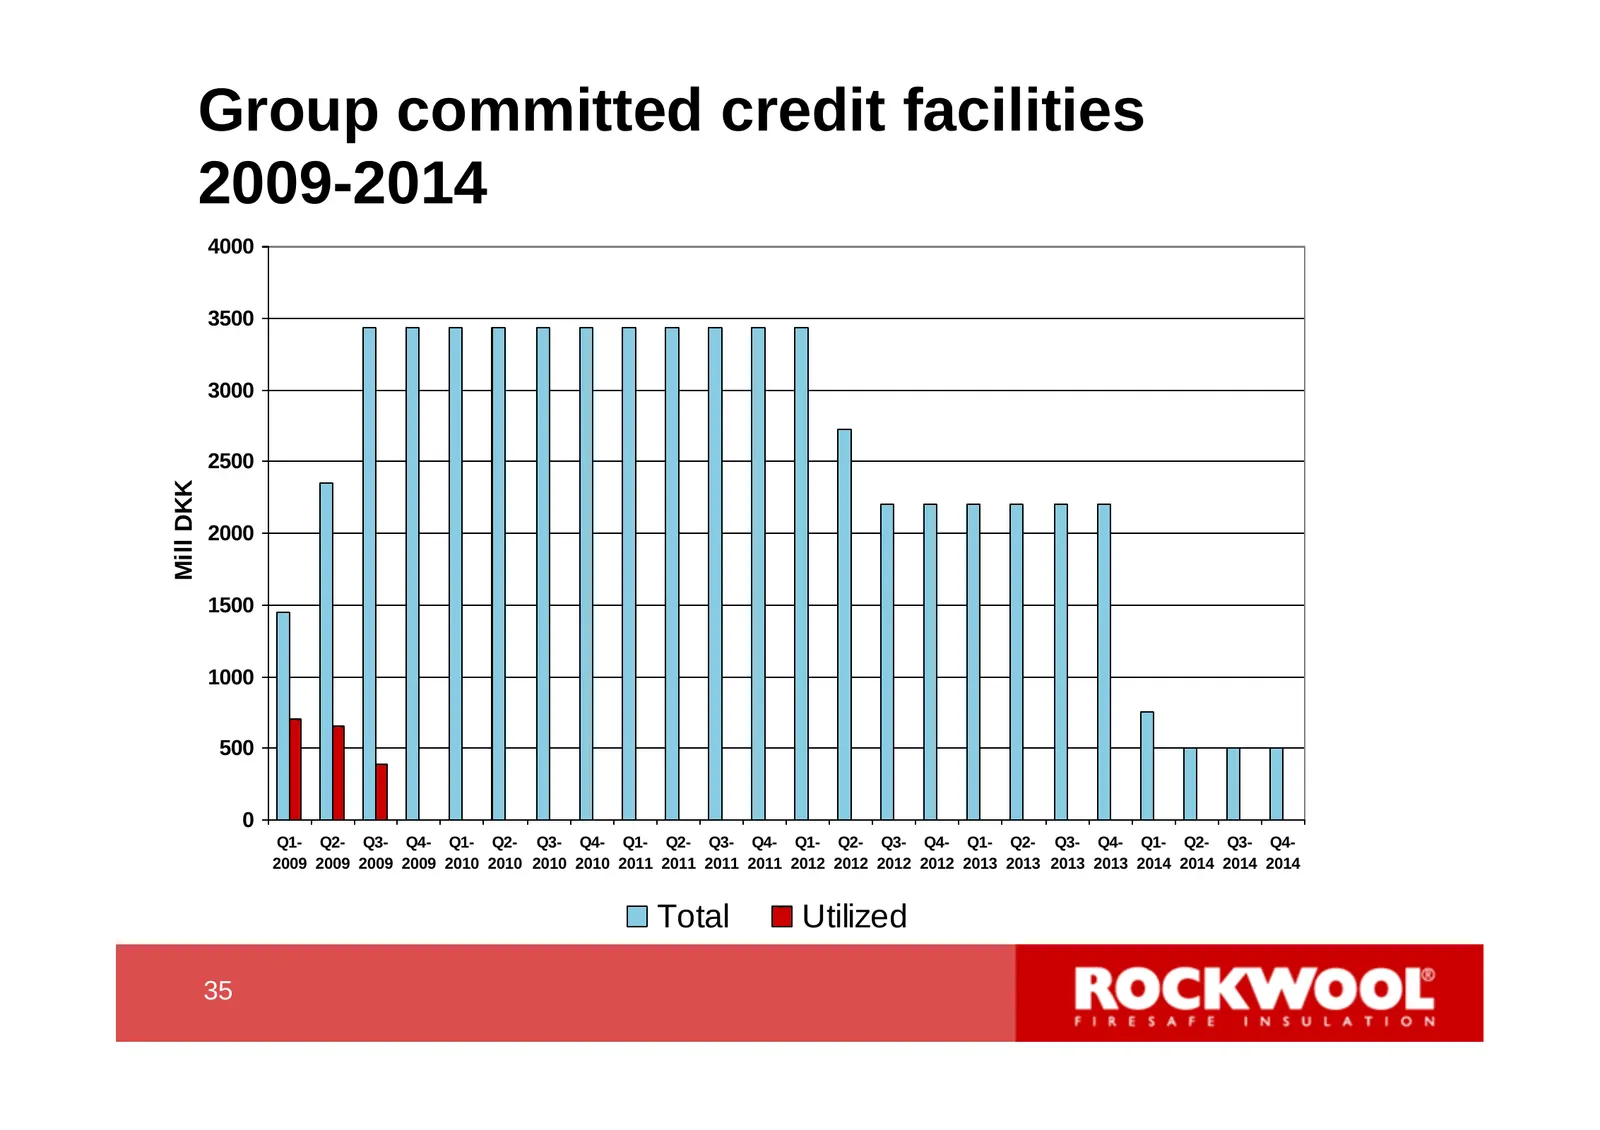
Slide 35: Group committed credit facilities 2009-2014
Group committed credit facilities 2009-2014 4000 3500 3000 2500 Mill DKK 2000 1500 1000 500 0 Q1- Q2- Q3- Q4- Q1- Q2- Q3- Q4- Q1- Q2- Q3- Q4- Q1- Q2- Q3- Q4- Q1- Q2- Q3- Q4- Q1- Q2- Q3- Q4- 2009 2009 2009 2009 2010 2010 2010 2010 2011 2011 2011 2011 2012 2012 2012 2012 2013 2013 2013 2013 2014 2014
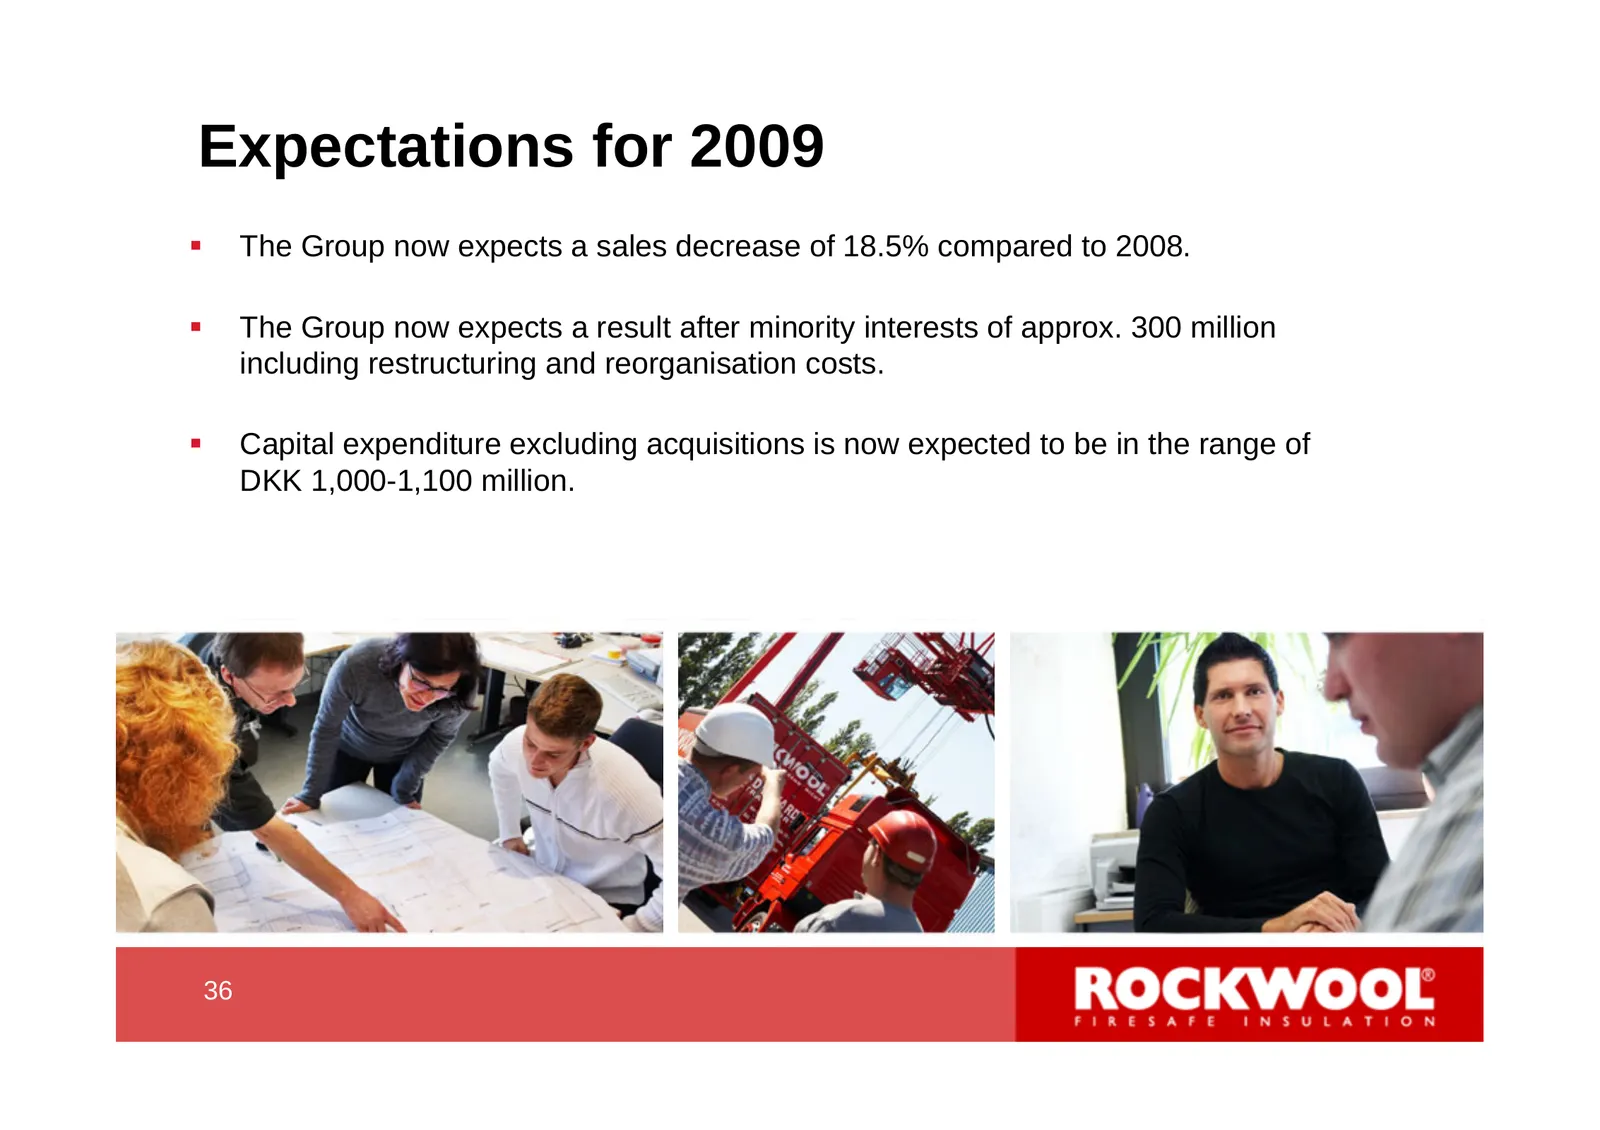
Slide 36: Expectations for 2009
Expectations for 2009 The Group now expects a sales decrease of 18.5% compared to 2008. The Group now expects a result after minority interests of approx. 300 million including restructuring and reorganisation costs. Capital expenditure excluding acquisitions is now expected to be in the range
Slide 37: Market situation
Market situation 37 37
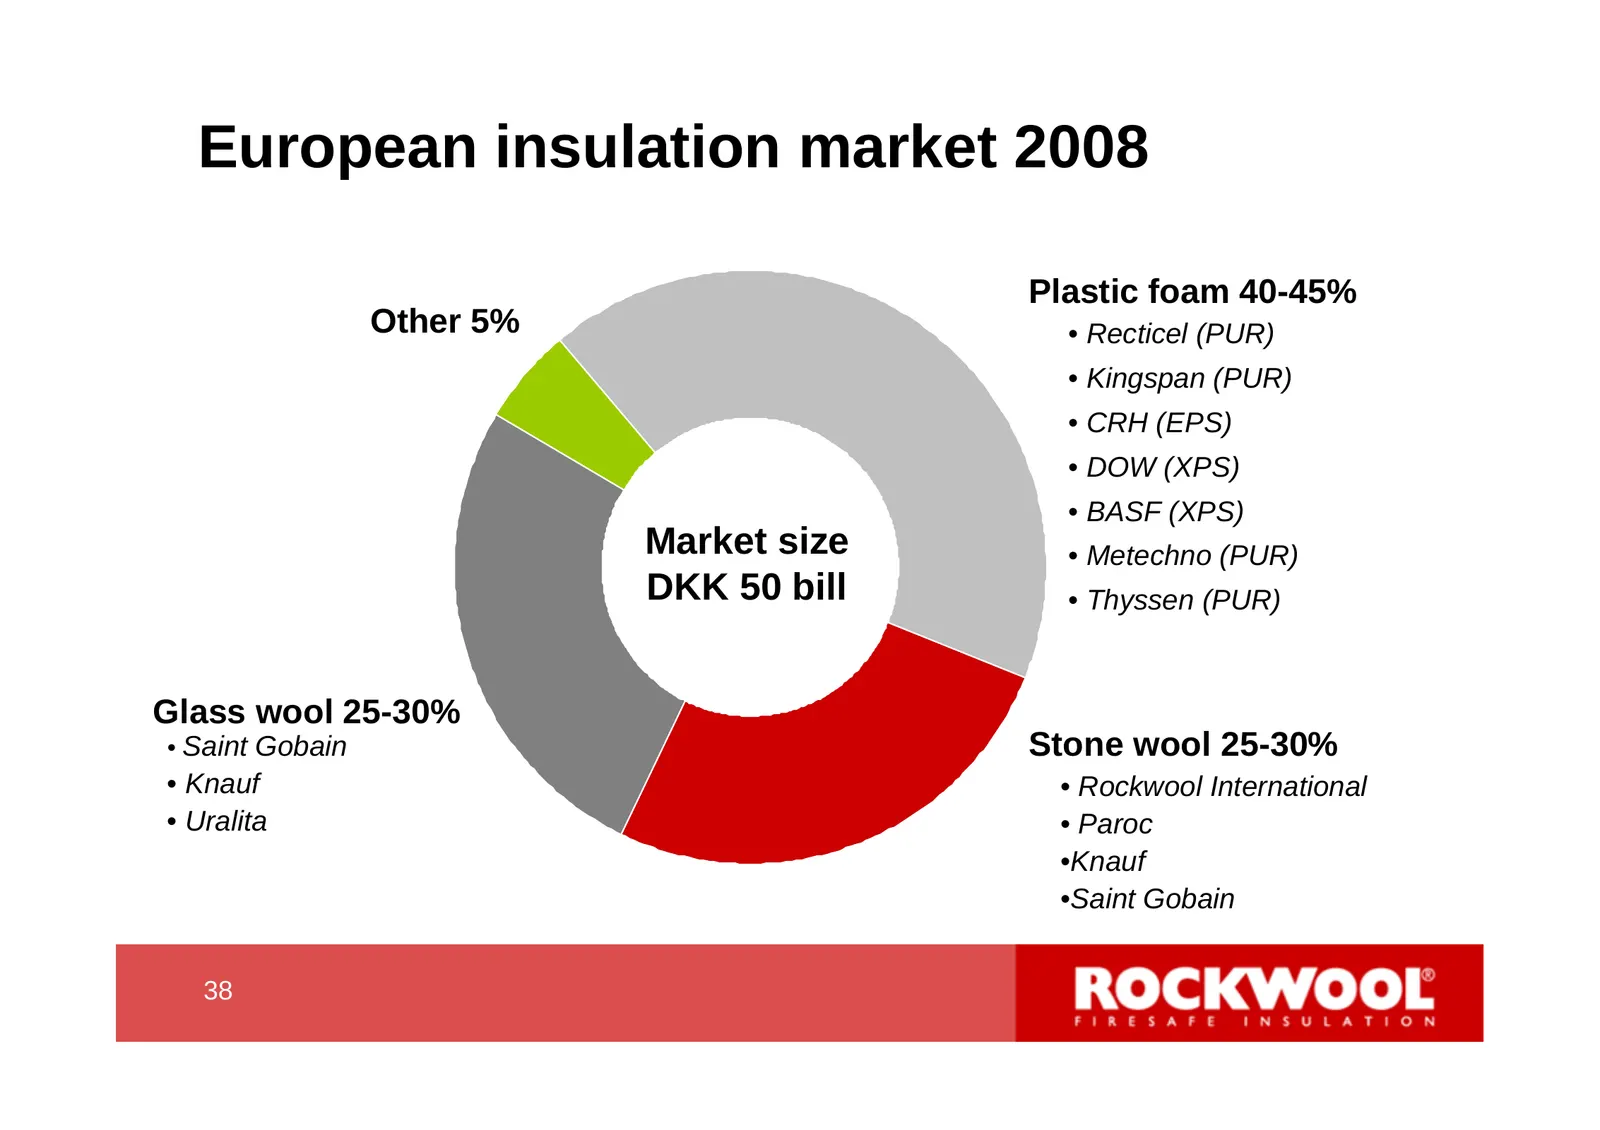
Slide 38: European insulation market 2008
European insulation market 2008 Plastic foam 40-45% Other 5% • Recticel (PUR) • Kingspan (PUR) • CRH (EPS) • DOW (XPS) • BASF (XPS) Market size • Metechno (PUR) DKK 50 bill • Thyssen (PUR) Glass wool 25-30% • Saint Gobain Stone wool 25-30% • Knauf • Rockwool International • Uralita • Paroc •Knauf •S
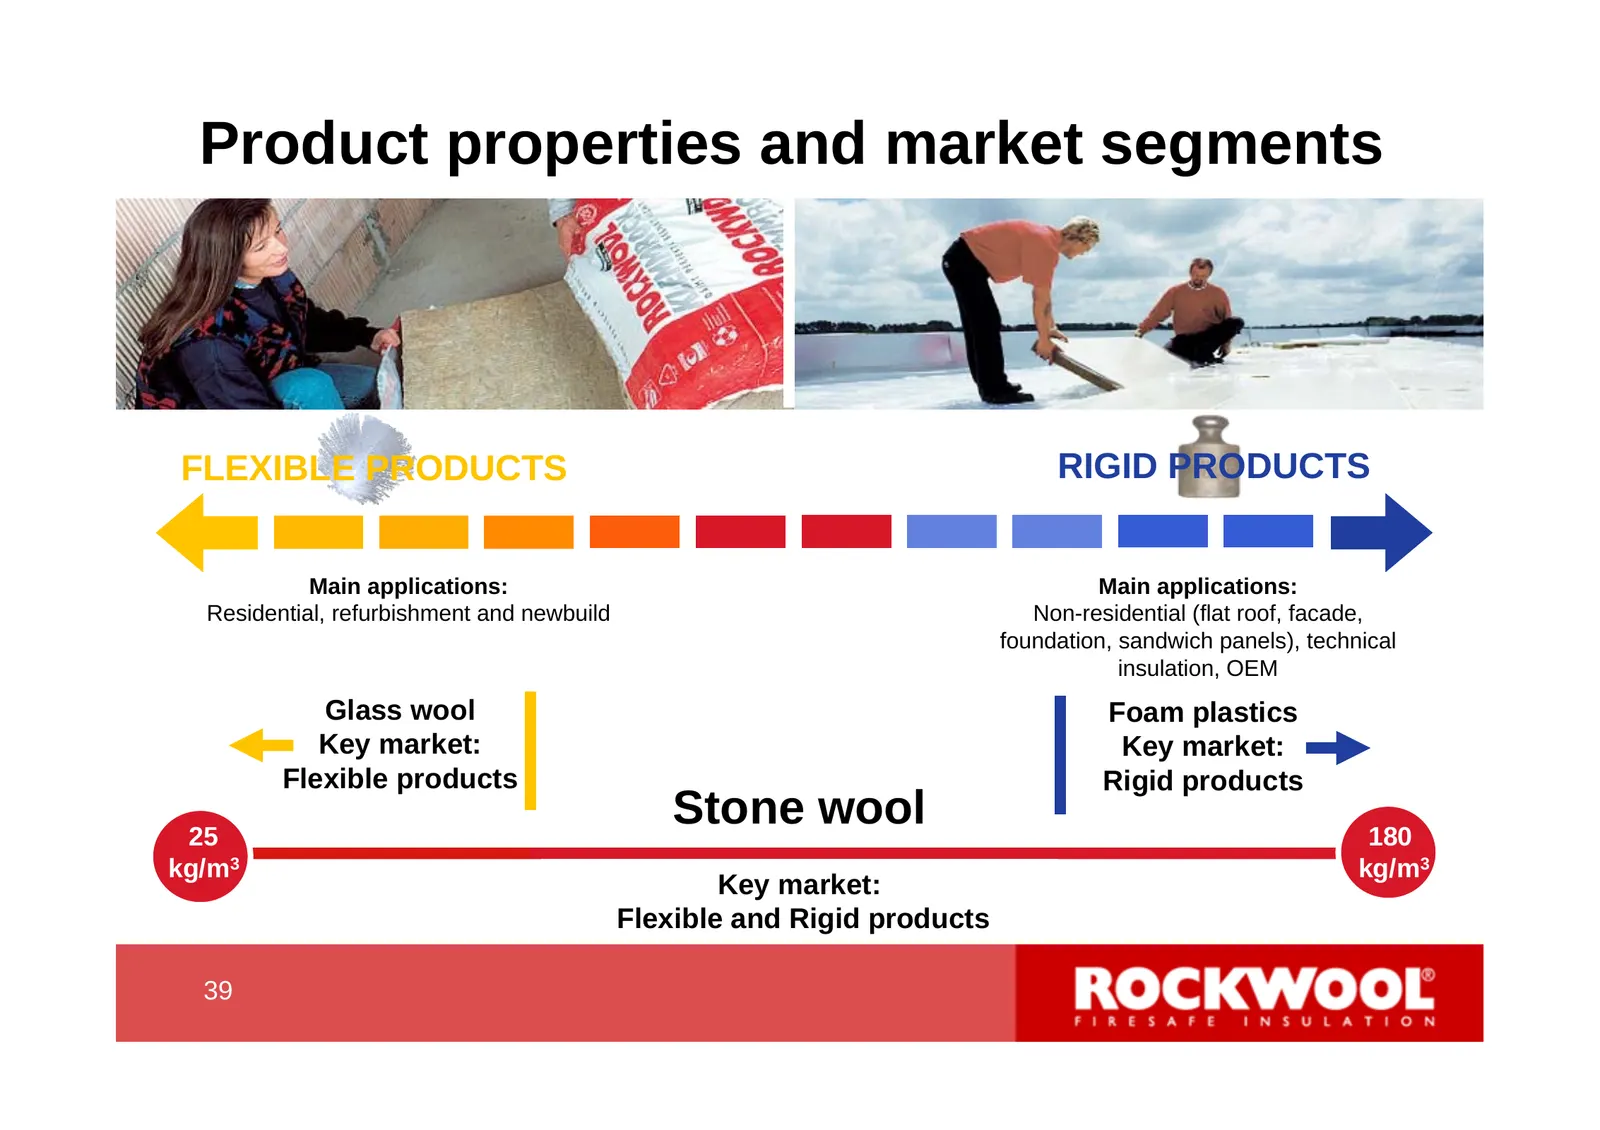
Slide 39: Product properties and market segments
Product properties and market segments FLEXIBLE PRODUCTS RIGID PRODUCTS Main applications: Main applications: Residential, refurbishment and newbuild Non-residential (flat roof, facade, foundation, sandwich panels), technical insulation, OEM Glass wool Foam plastics Key market: Key market: Flexible
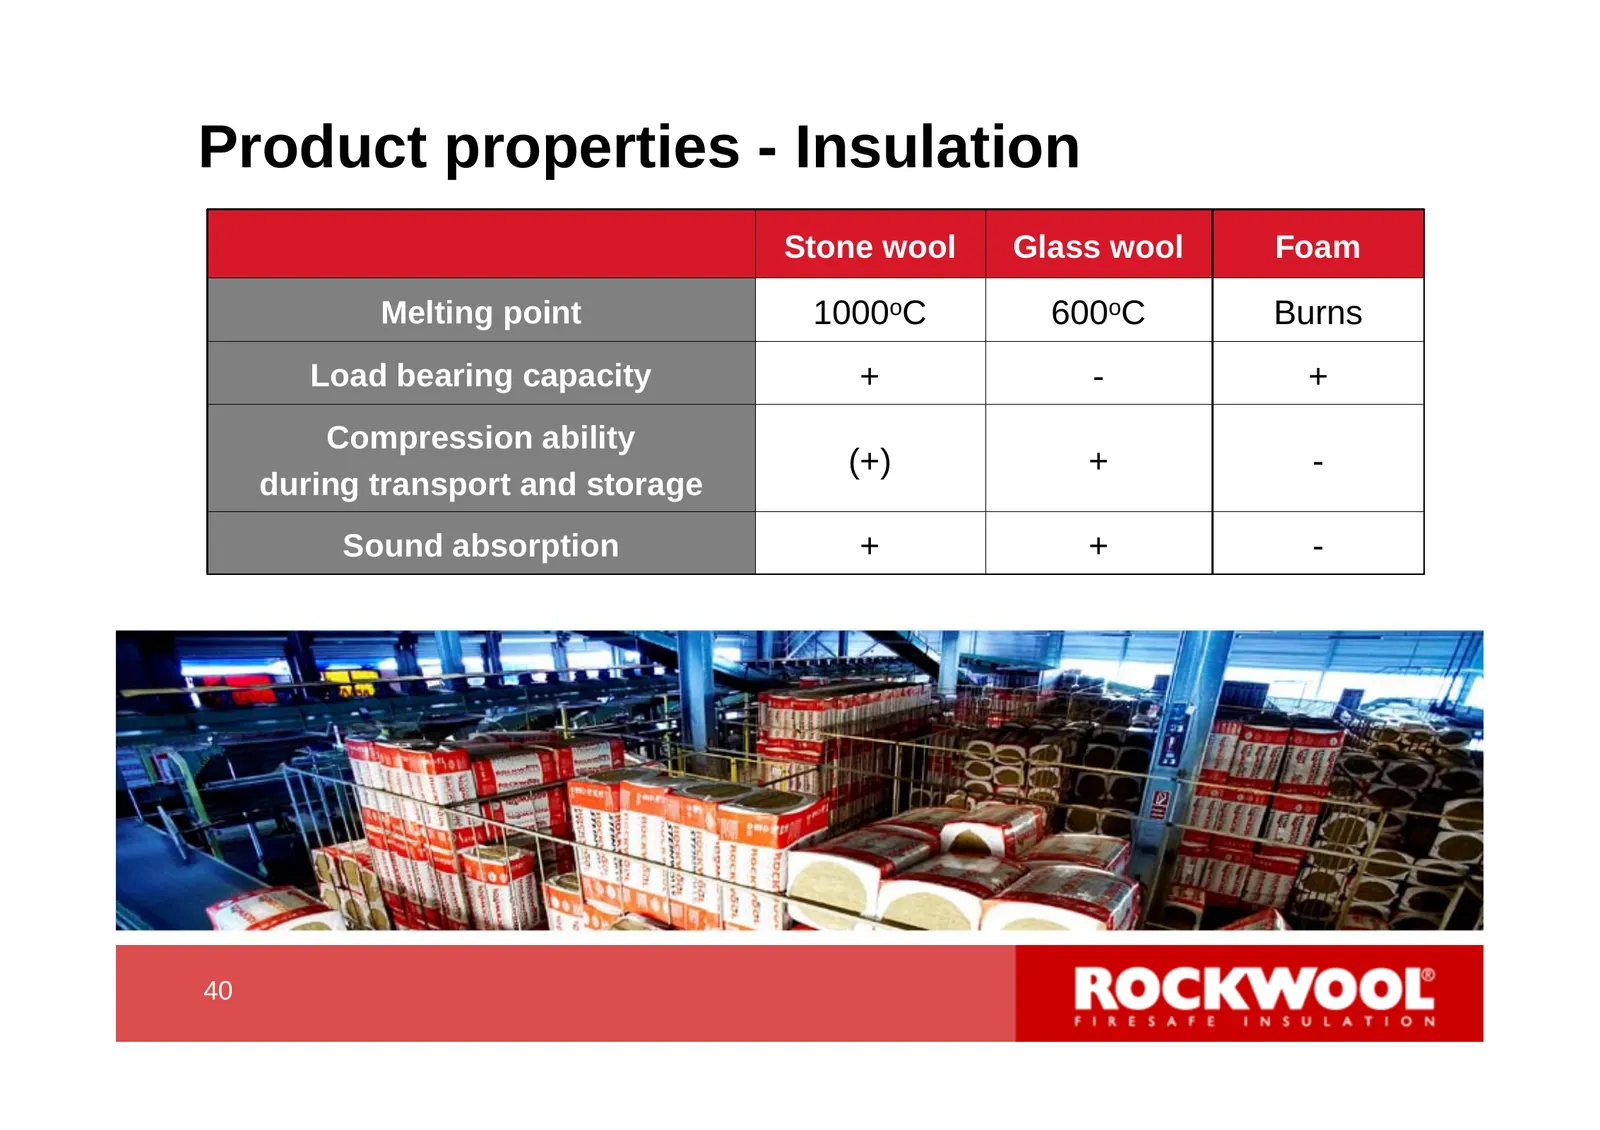
Slide 40: Product properties - Insulation
Product properties - Insulation Stone wool Glass wool Foam Melting point 1000oC 600oC Burns Load bearing capacity + - + Compression ability (+) + - during transport and storage Sound absorption + + - 40 40
Slide 41: Construction region 1: No signs of recovery
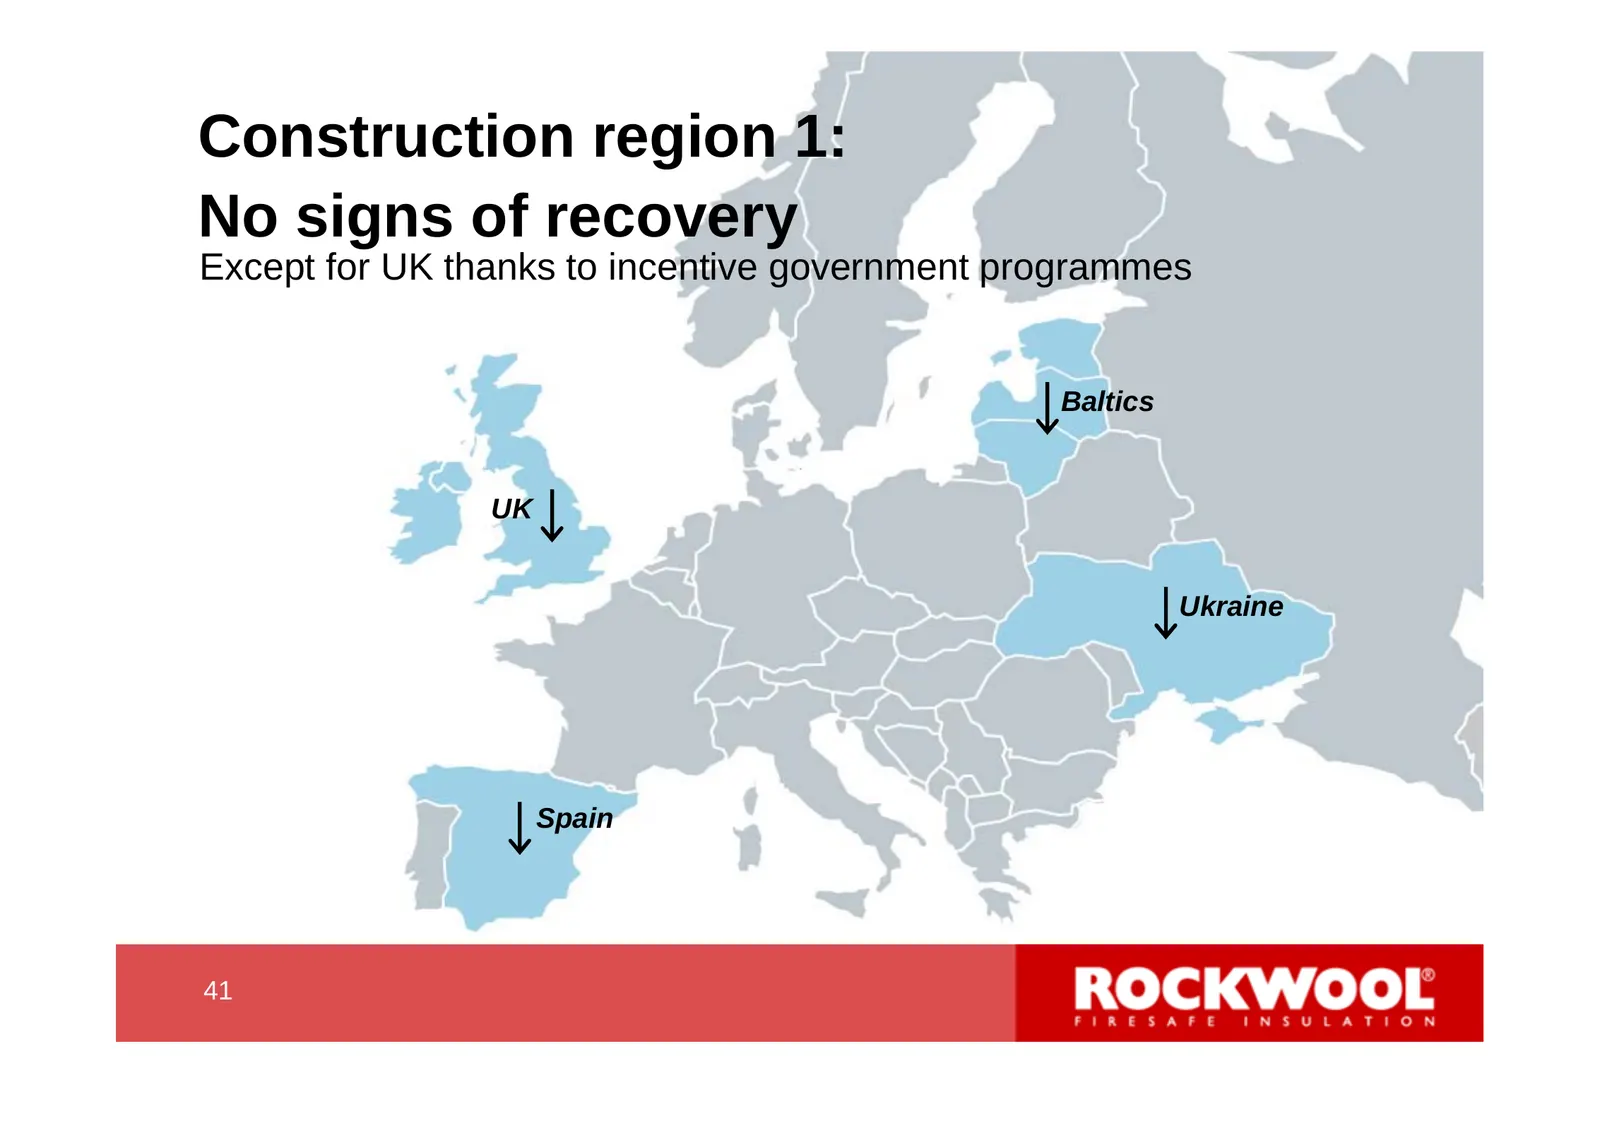
Construction region 1: No signs of recovery Except for UK thanks to incentive government programmes Baltics UK Ukraine Spain 41 41
Slide 42: Construction region 2: More resilient markets in Western Europe
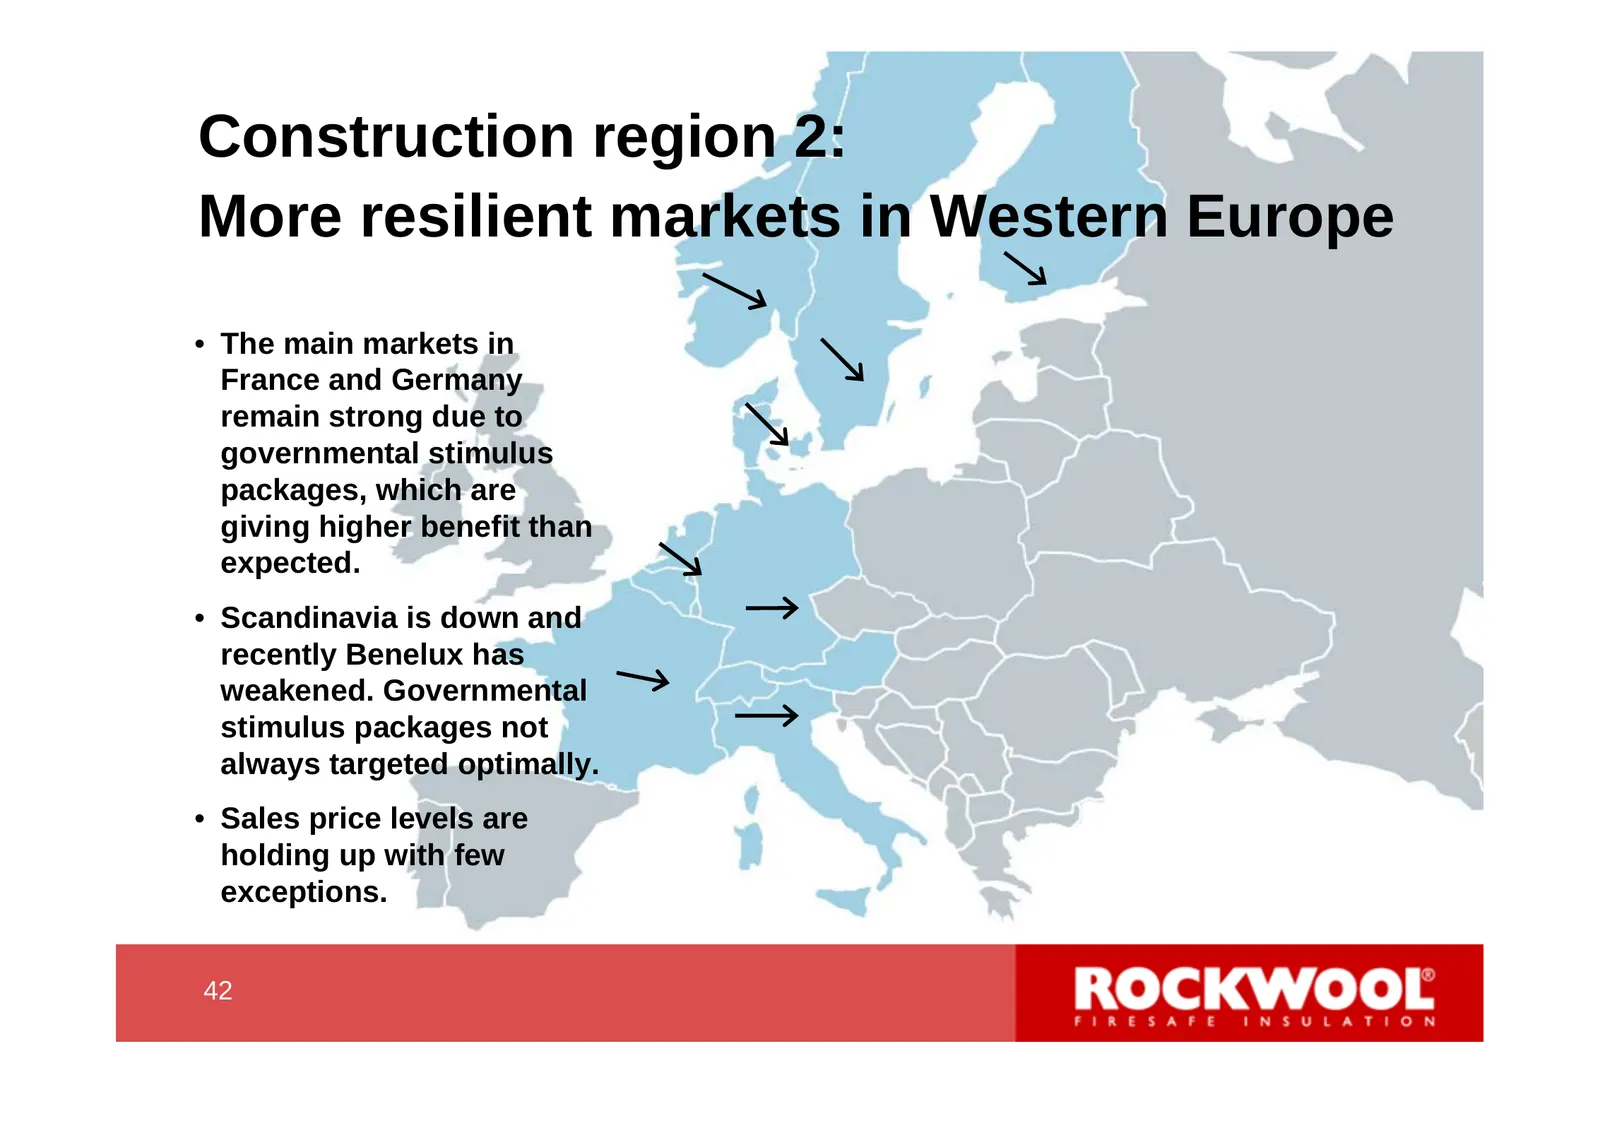
Construction region 2: More resilient markets in Western Europe • The main markets in France and Germany remain strong due to governmental stimulus packages, which are giving higher benefit than expected. • Scandinavia is down and recently Benelux has weakened. Governmental stimulus packages not alw
Slide 43: Construction region 3: Eastern Europe still down
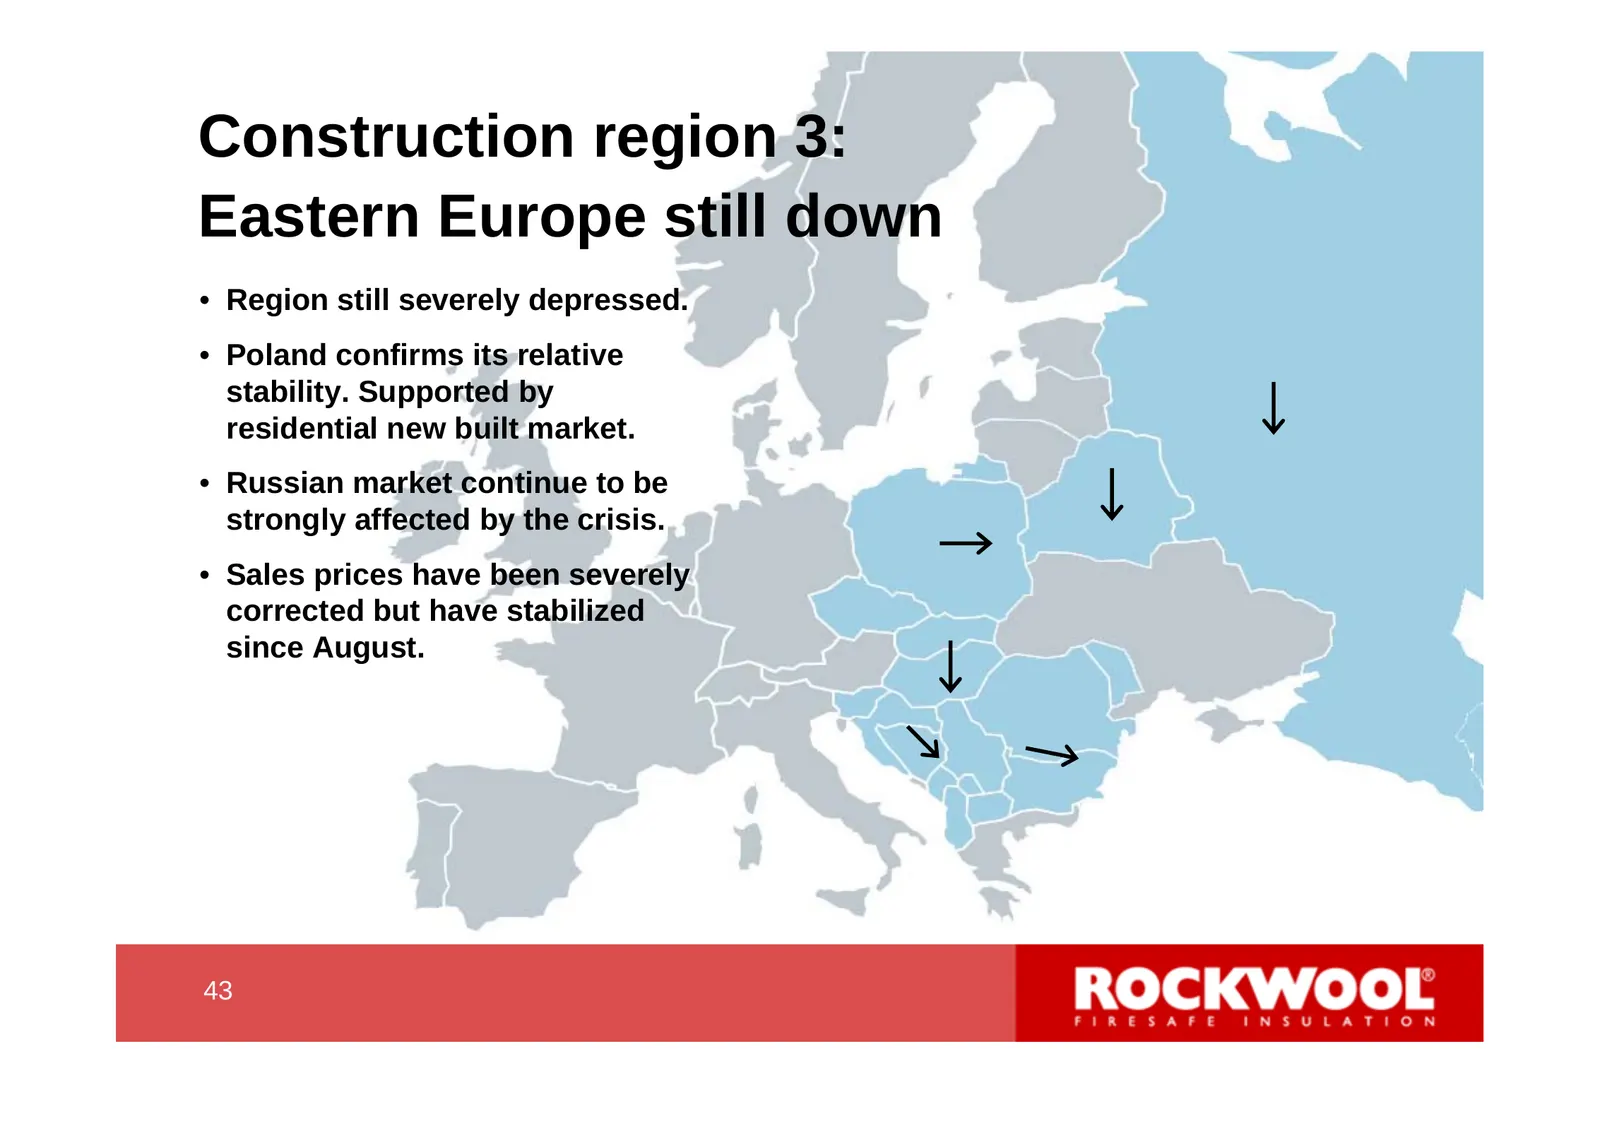
Construction region 3: Eastern Europe still down • Region still severely depressed. • Poland confirms its relative stability. Supported by residential new built market. • Russian market continue to be strongly affected by the crisis. • Sales prices have been severely corrected but have stabilized si
Slide 44: Good performance outside Europe
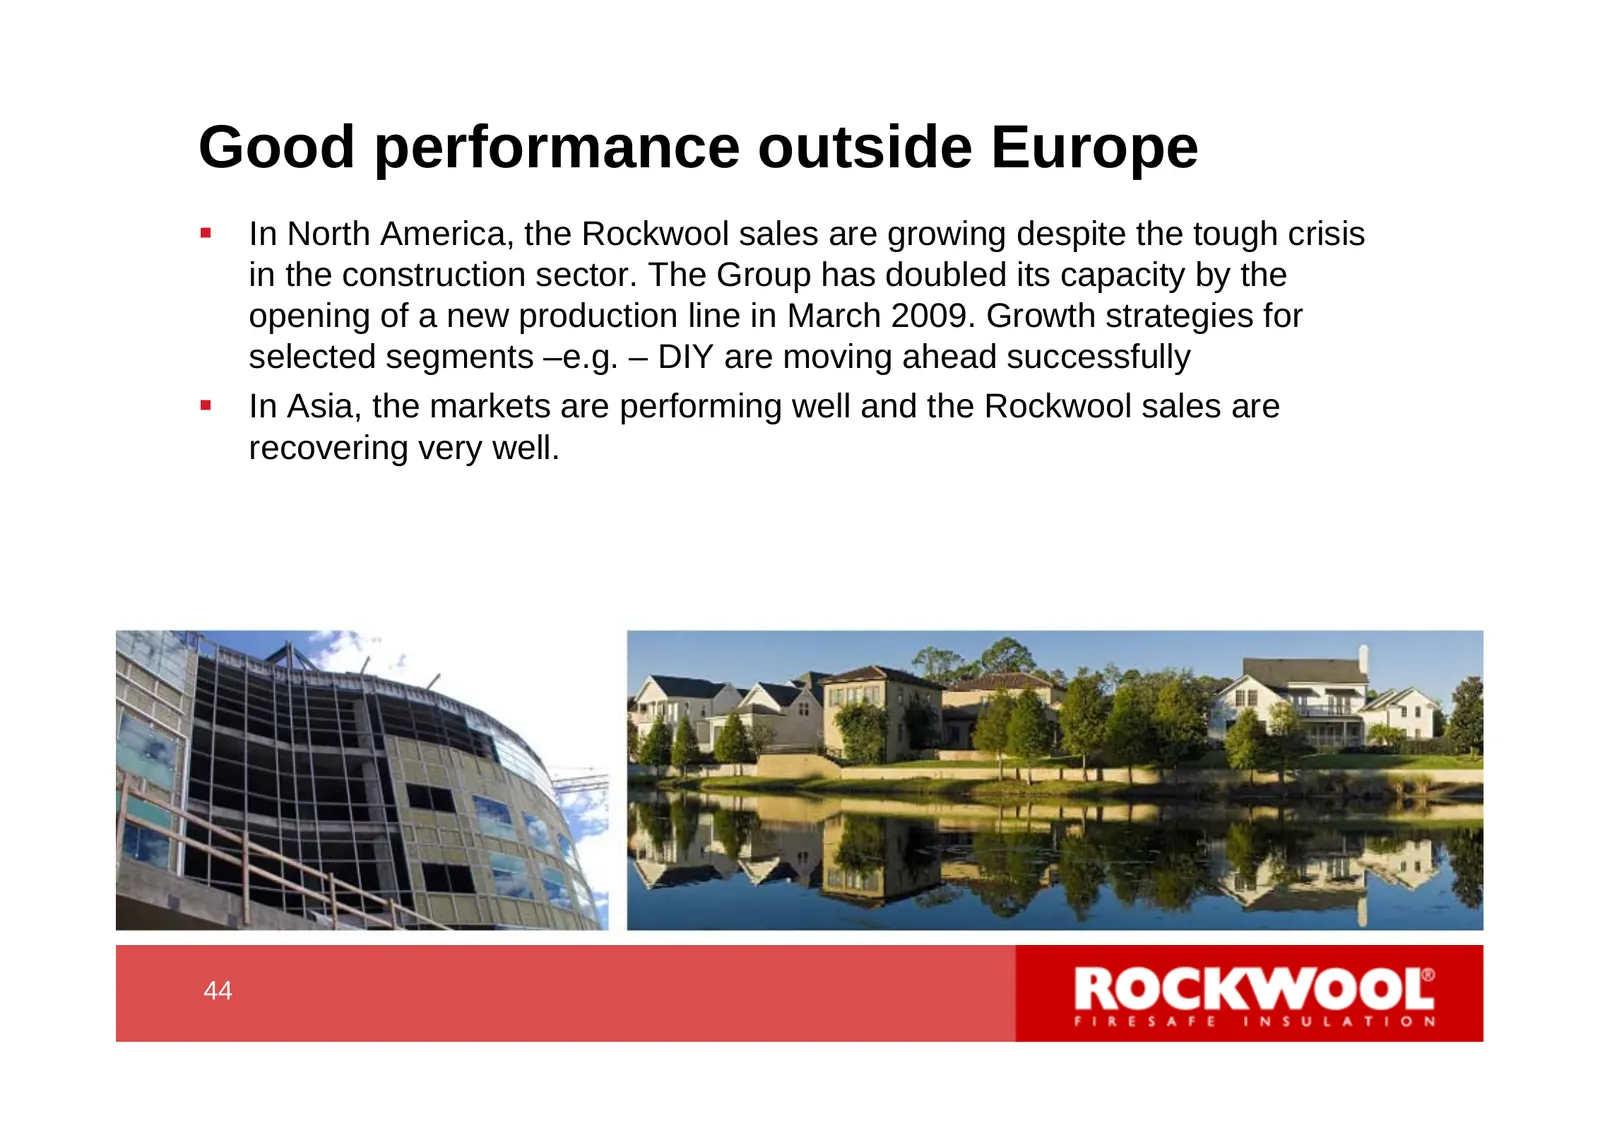
Good performance outside Europe In North America, the Rockwool sales are growing despite the tough crisis in the construction sector. The Group has doubled its capacity by the opening of a new production line in March 2009. Growth strategies for selected segments –e.g. – DIY are moving ahead succe
Slide 45: Systems Division sales
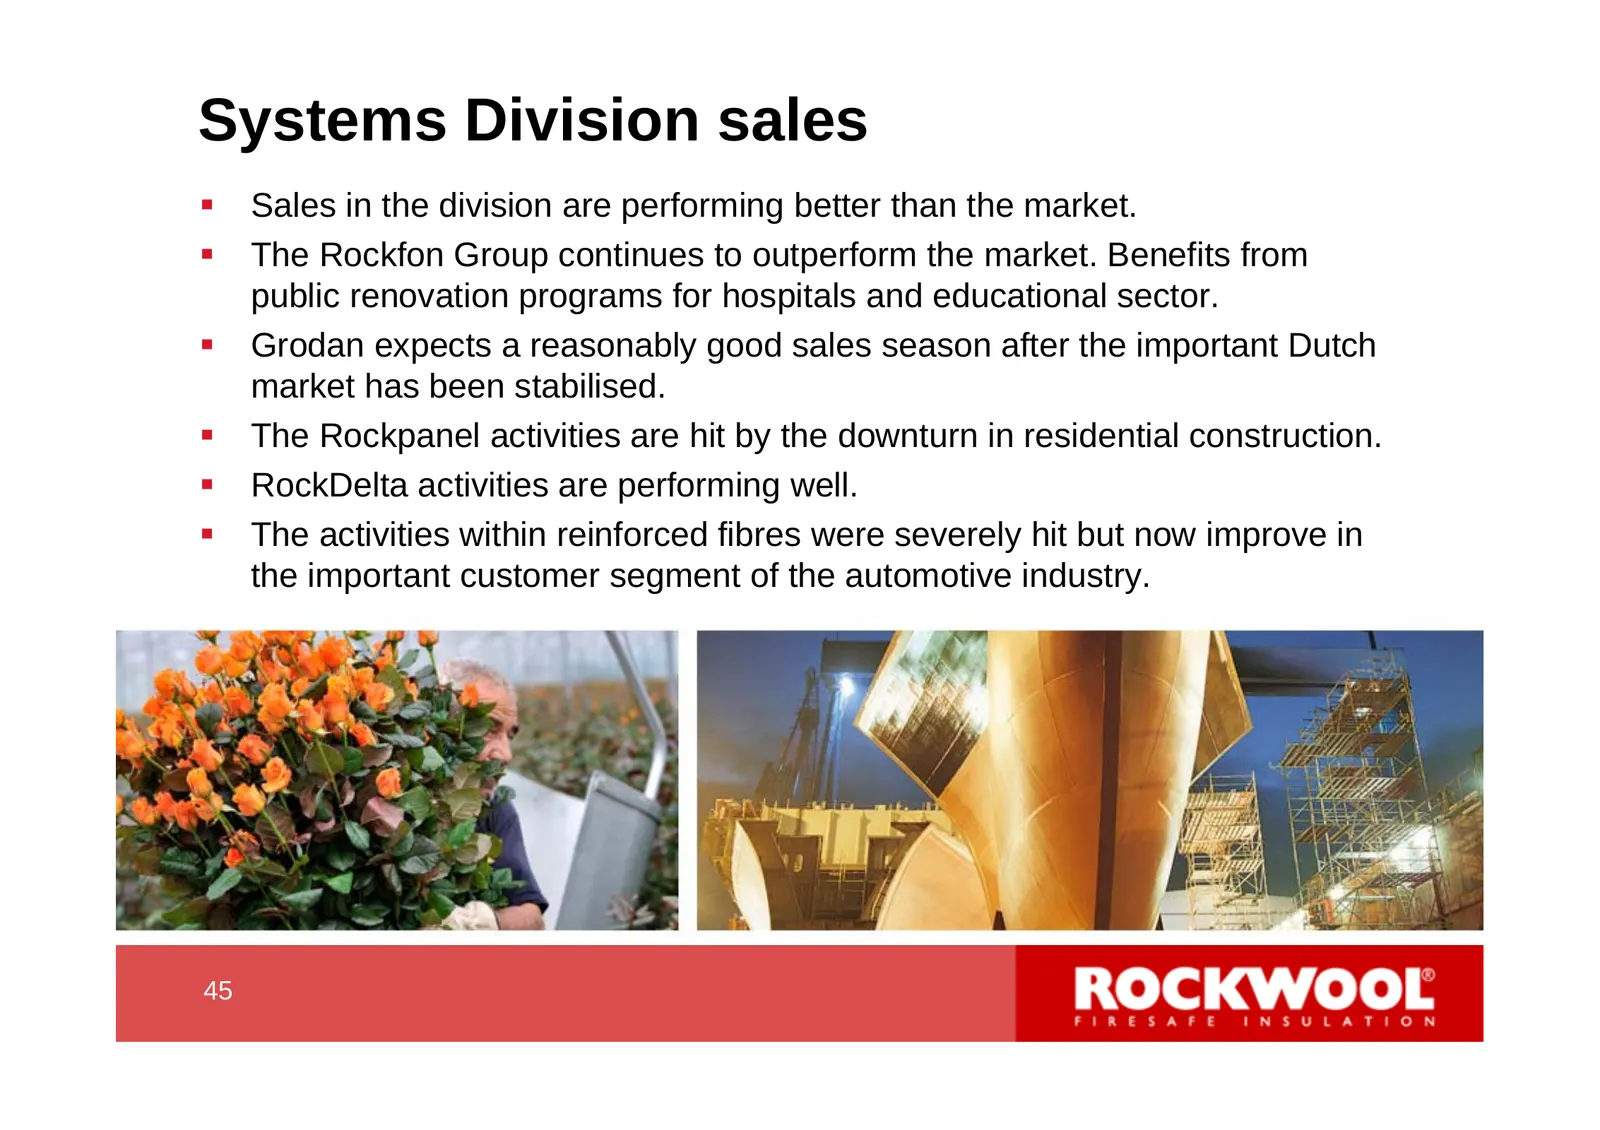
Systems Division sales Sales in the division are performing better than the market. The Rockfon Group continues to outperform the market. Benefits from public renovation programs for hospitals and educational sector. Grodan expects a reasonably good sales season after the important Dutch marke
Slide 46: Energy and climate as growth drivers
Energy and climate as growth drivers 46 46
Slide 47: Energy efficiency of buildings - status
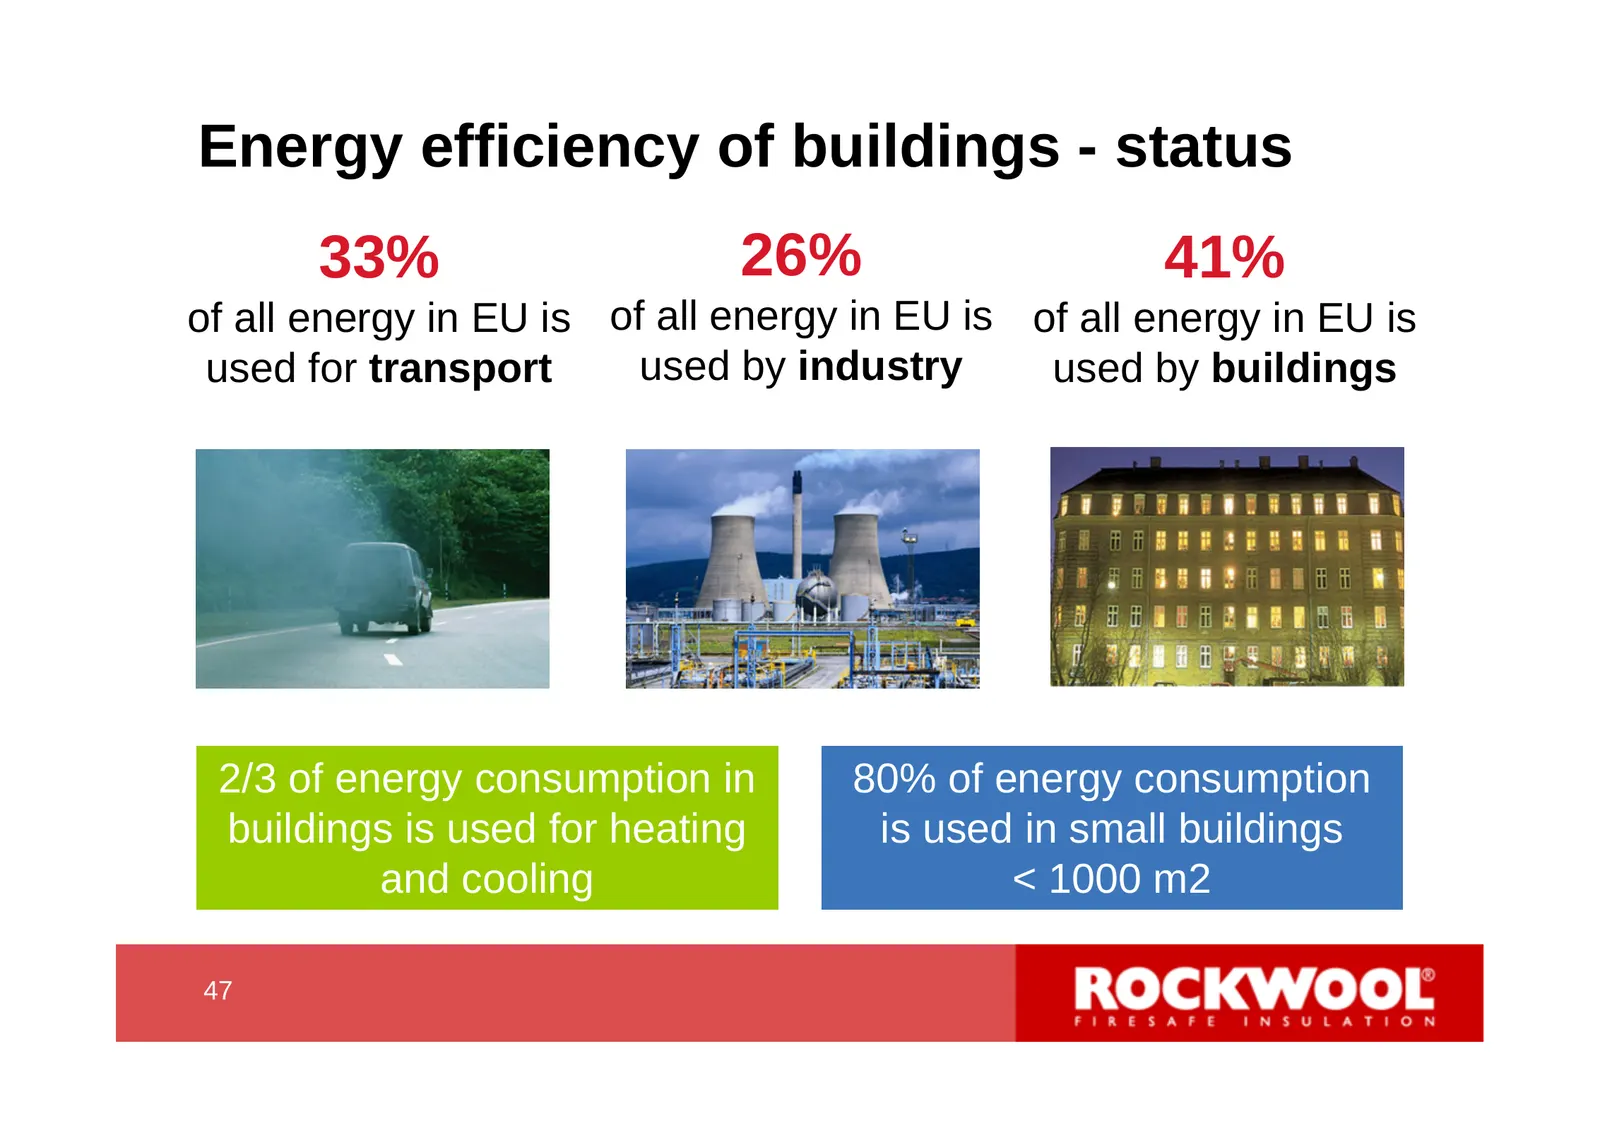
Energy efficiency of buildings - status 33% 26% 41% of all energy in EU is of all energy in EU is of all energy in EU is used for transport used by industry used by buildings 2/3 of energy consumption in 80% of energy consumption buildings is used for heating is used in small buildings and cooling <
Slide 48: Energy used for heating of buildings in DK
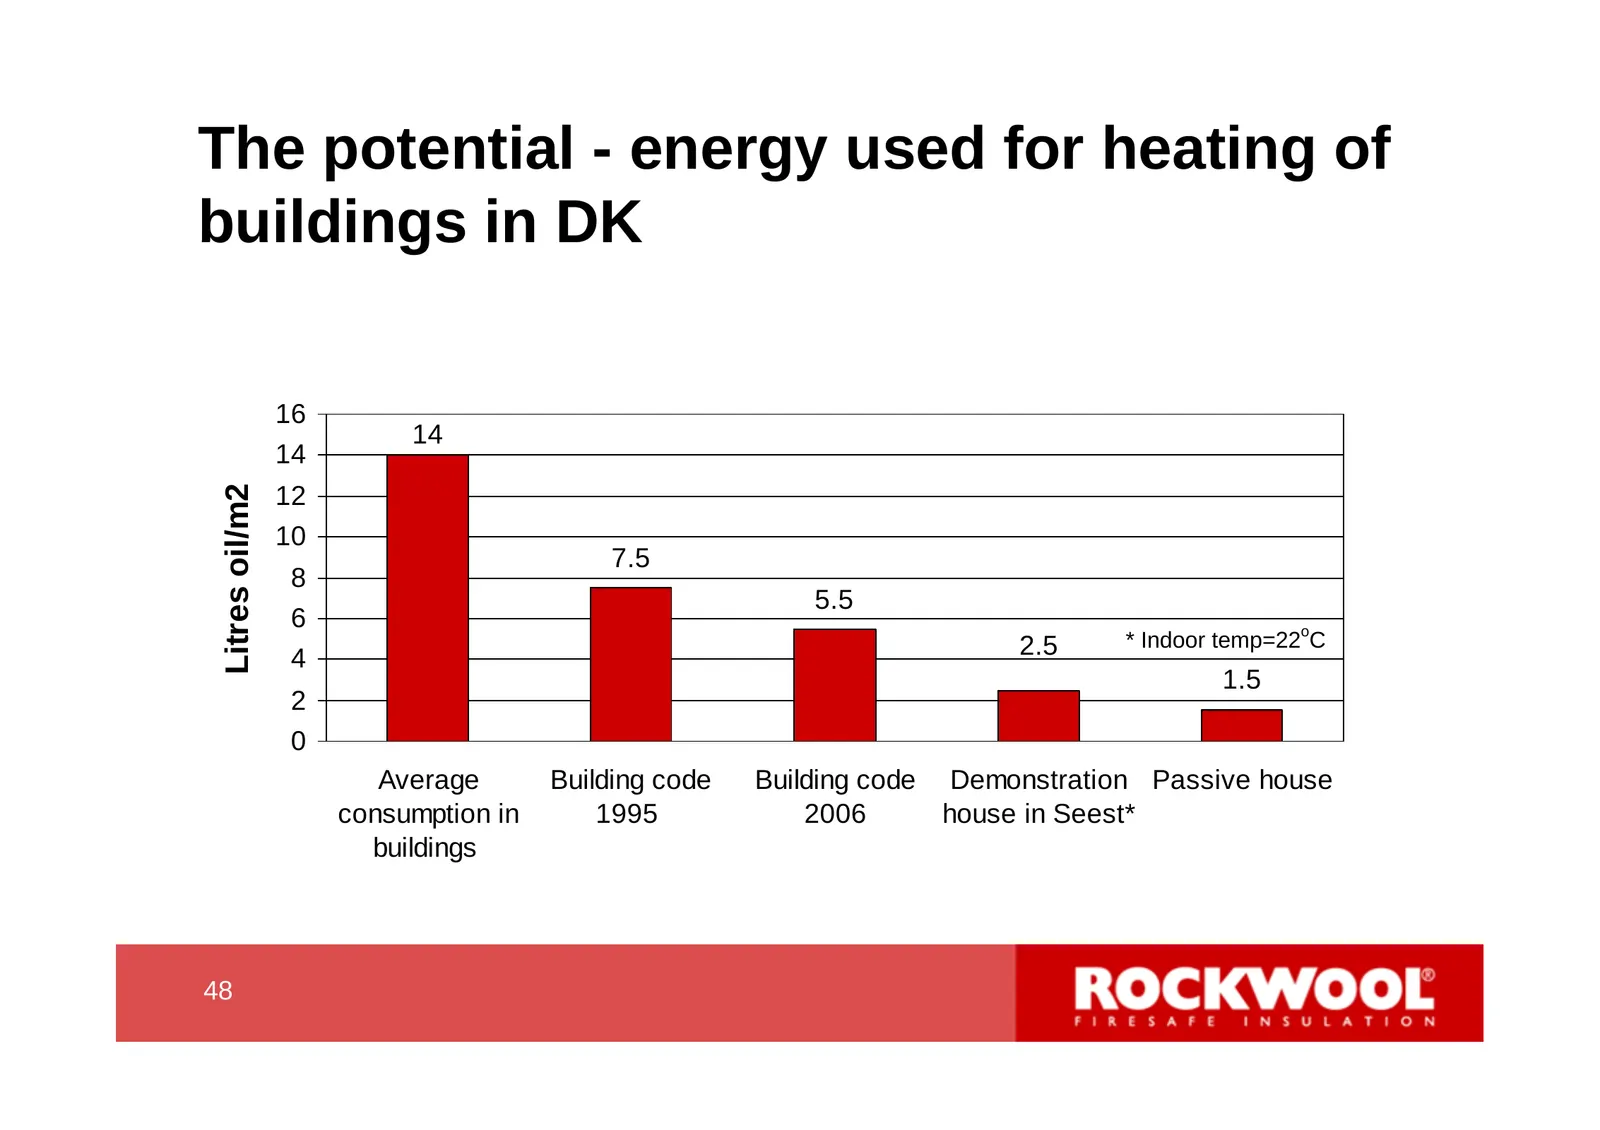
The potential - energy used for heating of buildings in DK 16 14 14 Litres oil/m2 12 10 7.5 8 5.5 6 2.5 * Indoor temp=22oC 4 1.5 2 0 Average Building code Building code Demonstration Passive house consumption in 1995 2006 house in Seest* buildings 48 48
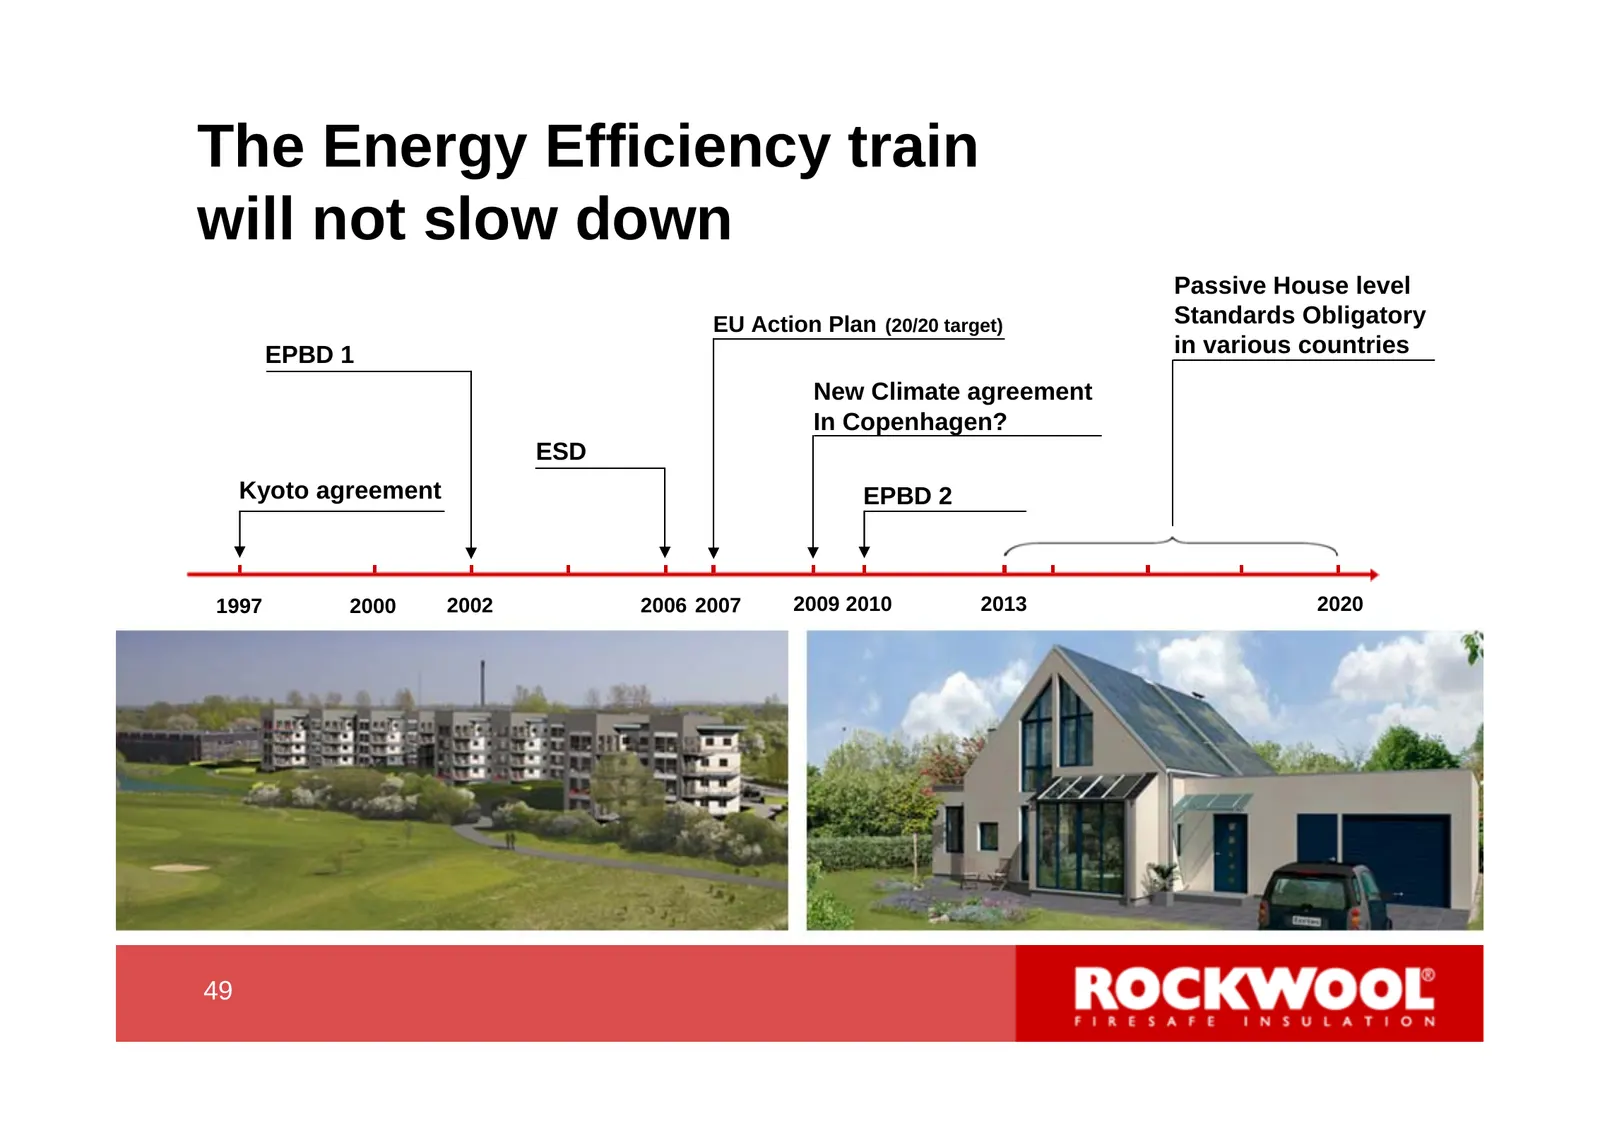
Slide 49: The Energy Efficiency train will not slow down
The Energy Efficiency train will not slow down Passive House level EU Action Plan (20/20 target) Standards Obligatory EPBD 1 in various countries New Climate agreement In Copenhagen? ESD Kyoto agreement EPBD 2 1997 2000 2002 2006 2007 2009 2010 2013 2020 49 49
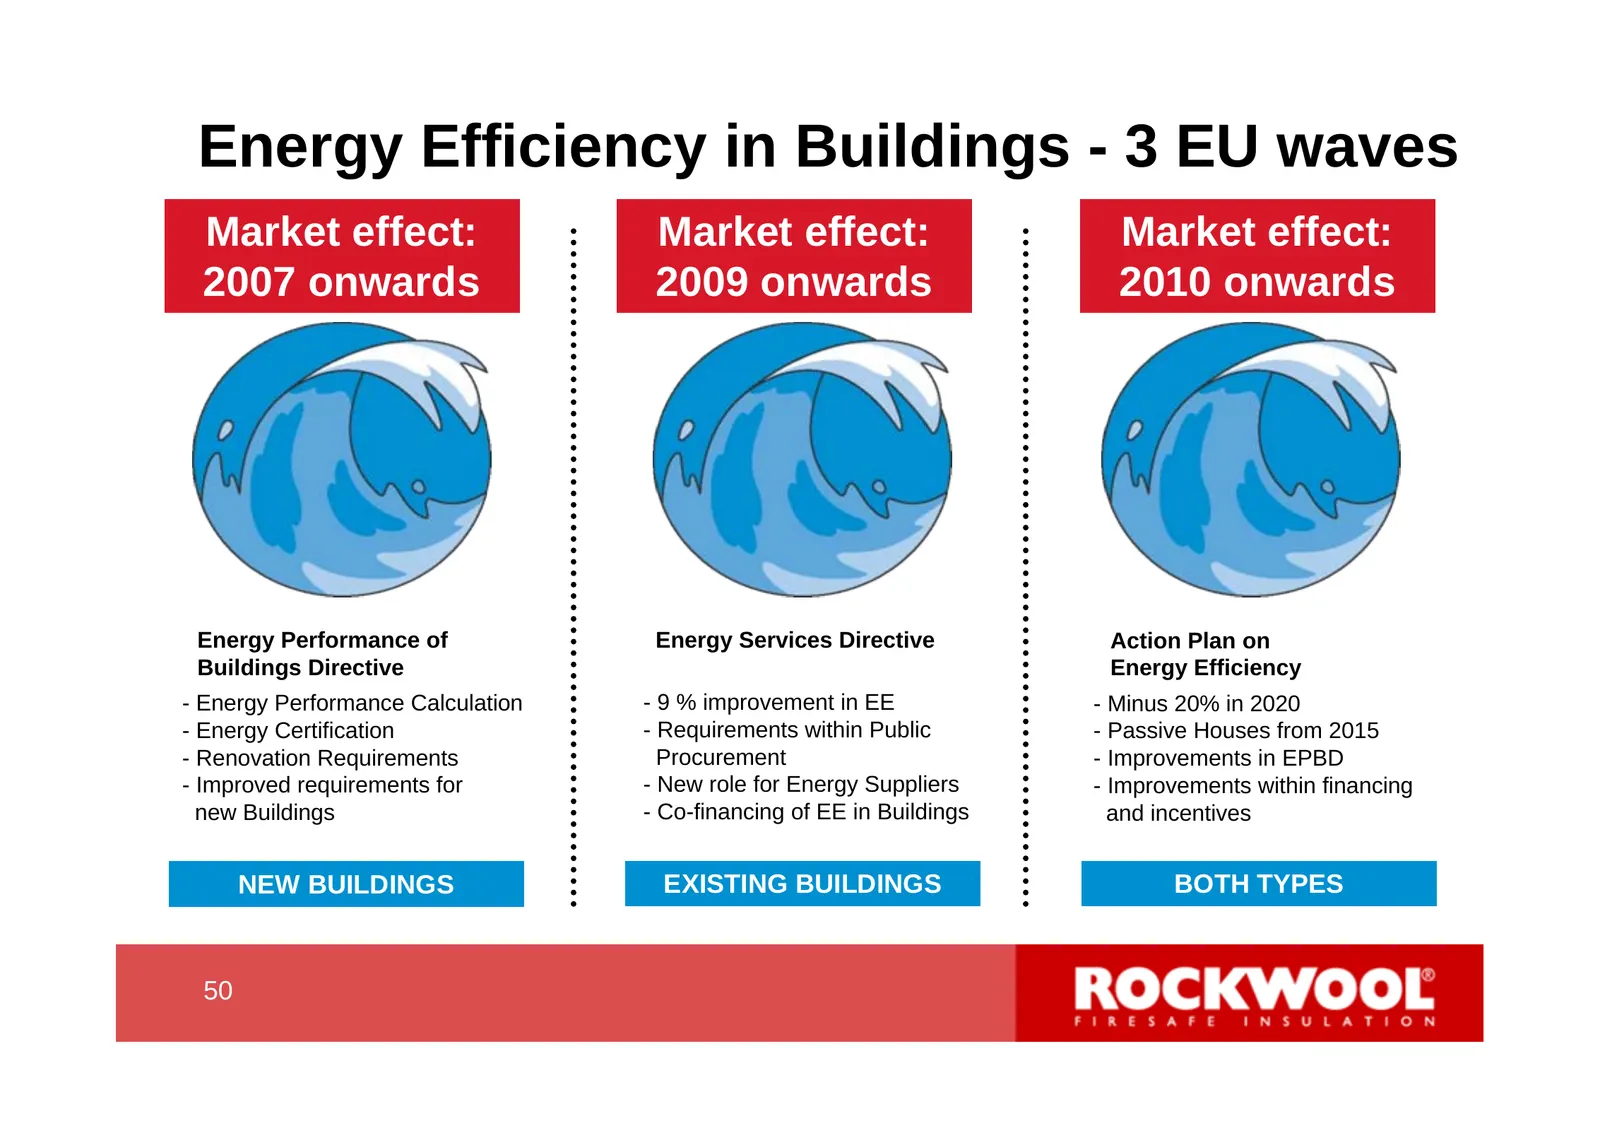
Slide 50: Energy Efficiency in Buildings - 3 EU waves
Energy Efficiency in Buildings - 3 EU waves Market effect: Market effect: Market effect: 2007 onwards 2009 onwards 2010 onwards Energy Performance of Energy Services Directive Action Plan on Buildings Directive Energy Efficiency - Energy Performance Calculation - 9 % improvement in EE - Minus 20% in
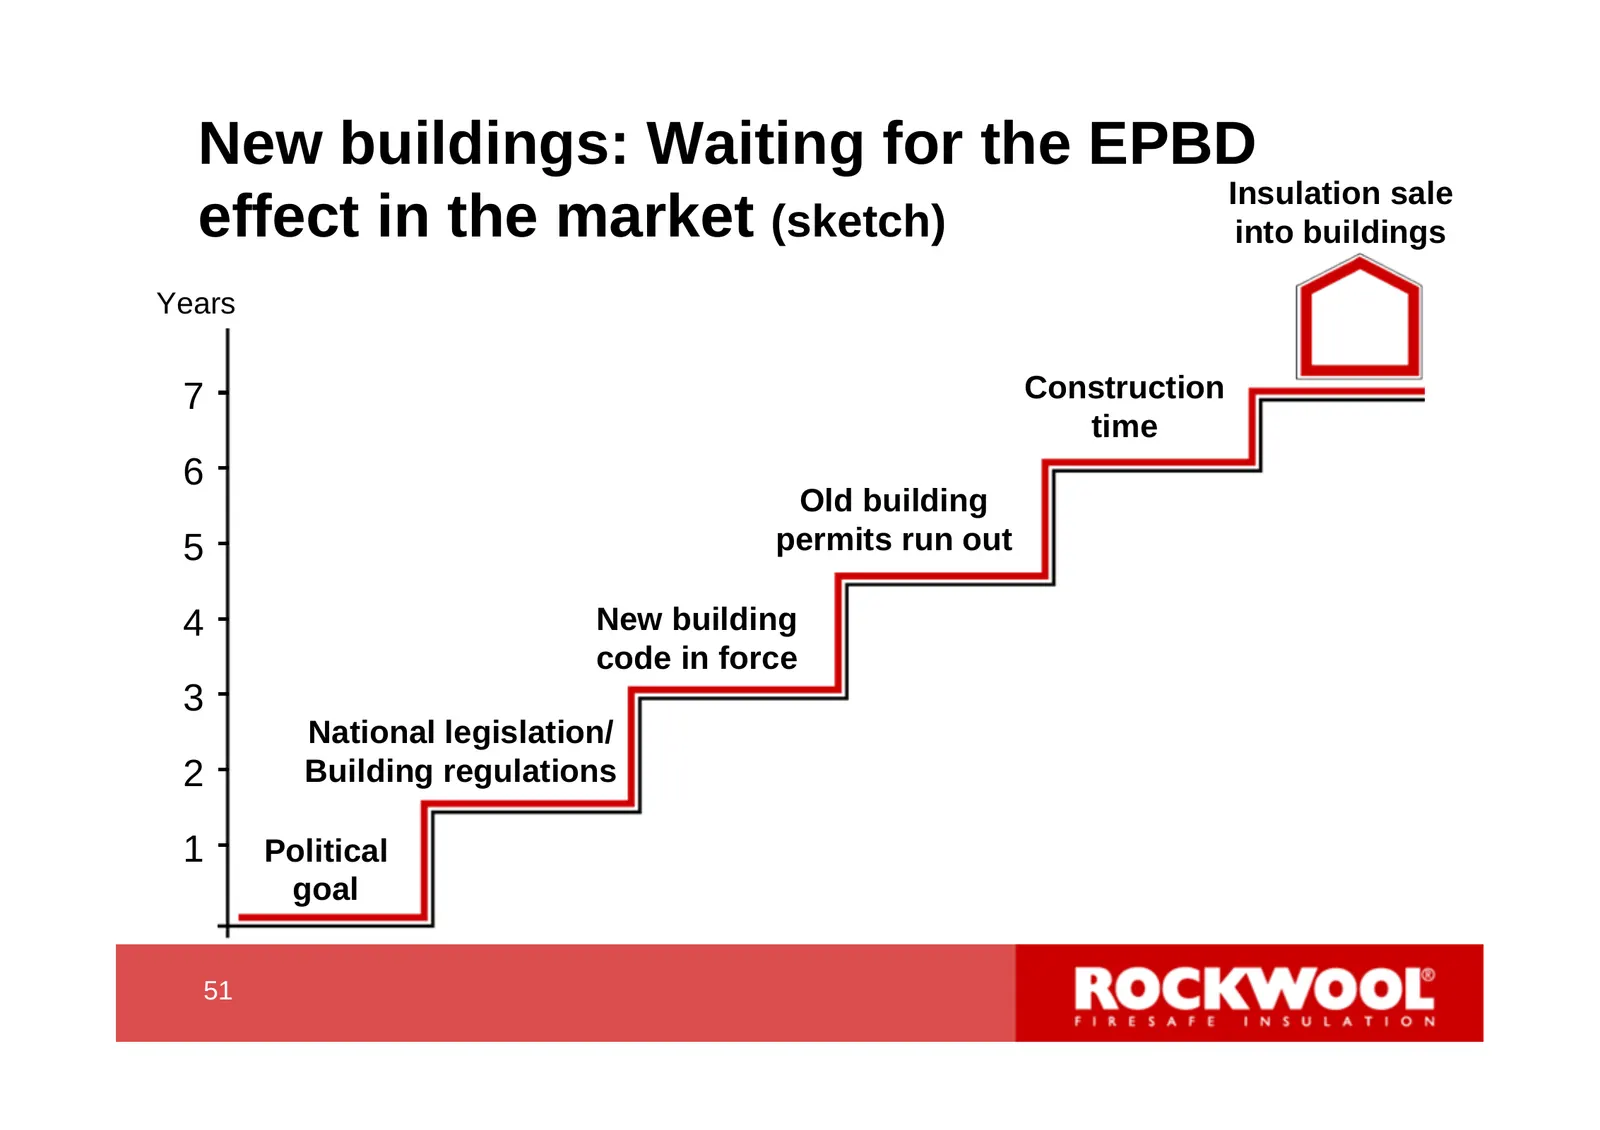
Slide 51: New buildings: Waiting for the EPBD effect in the market
New buildings: Waiting for the EPBD Insulation sale effect in the market (sketch) into buildings Years 7 Construction time 6 Old building 5 permits run out 4 New building code in force 3 National legislation/ 2 Building regulations 1 Political goal 51 51
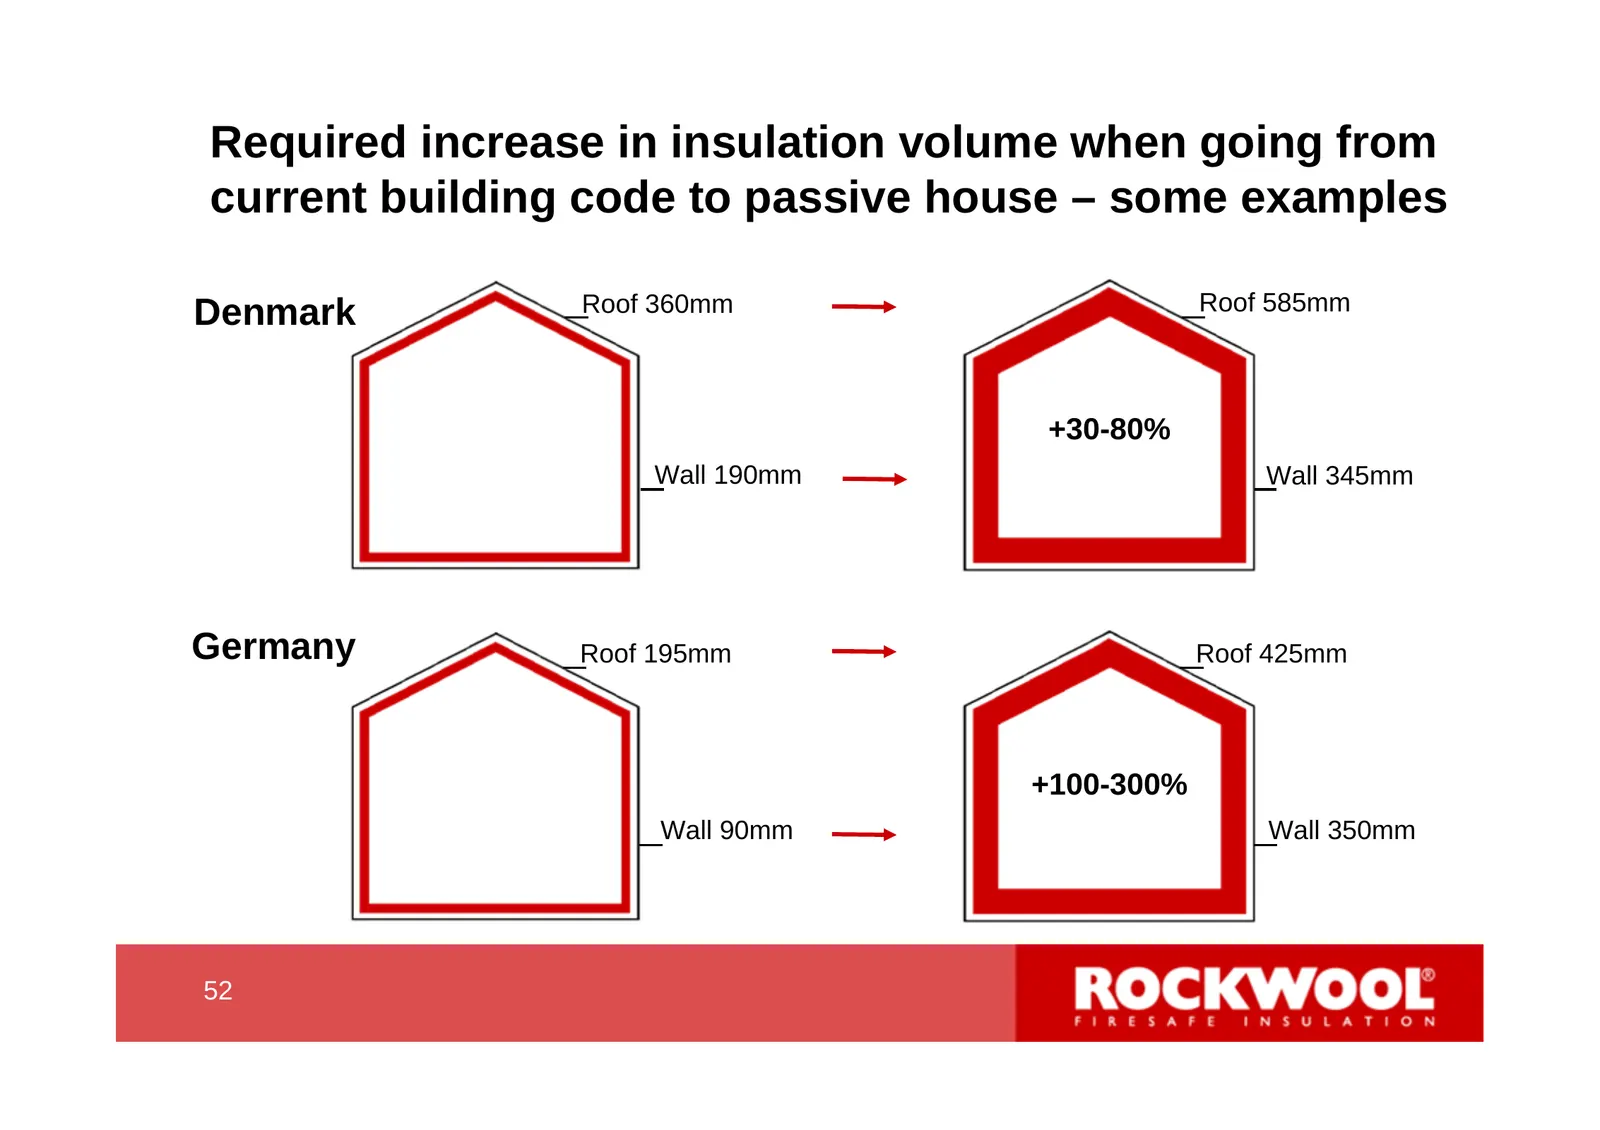
Slide 52: Required increase in insulation volume for passive house
Required increase in insulation volume when going from current building code to passive house – some examples Roof 360mm Roof 585mm Denmark +30-80% Wall 190mm Wall 345mm Germany Roof 195mm Roof 425mm +100-300% Wall 90mm Wall 350mm 52 52
Slide 53: Renovation in Germany: package 1
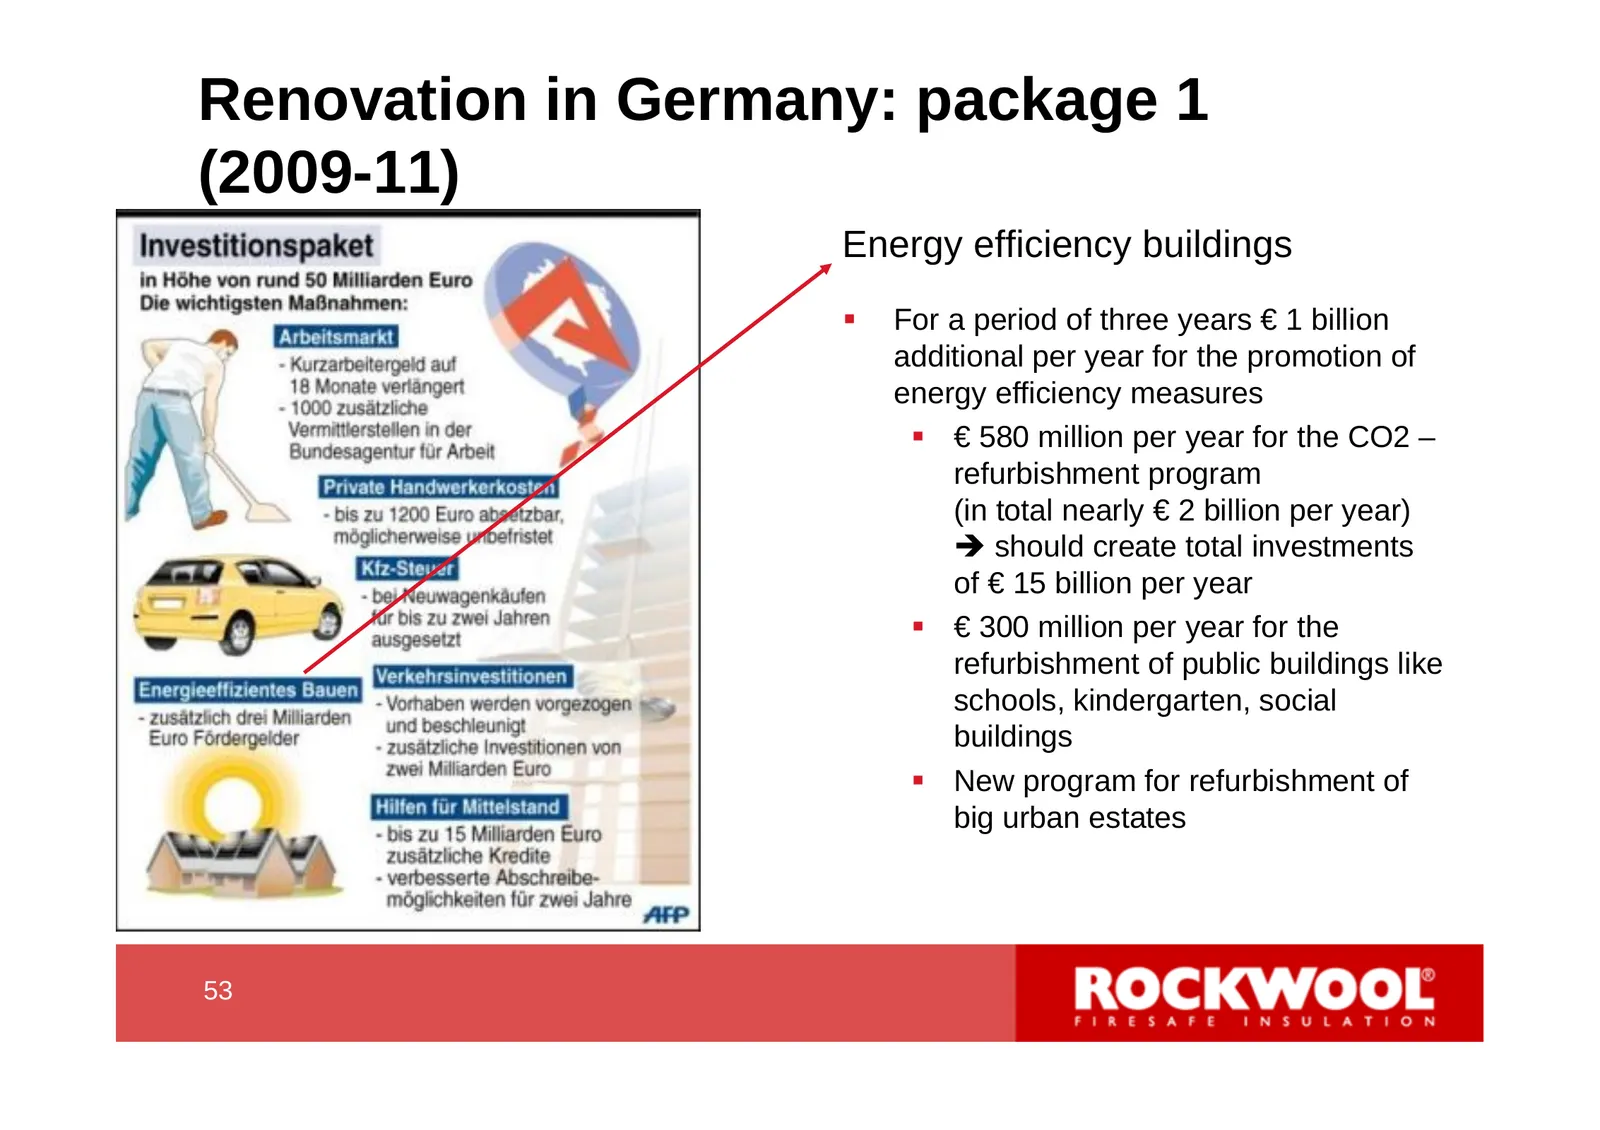
Renovation in Germany: package 1 (2009-11) Energy efficiency buildings For a period of three years € 1 billion additional per year for the promotion of energy efficiency measures € 580 million per year for the CO2 – refurbishment program (in total nearly € 2 billion per year) should create tot
Slide 54: Renovation in Germany: Package 2
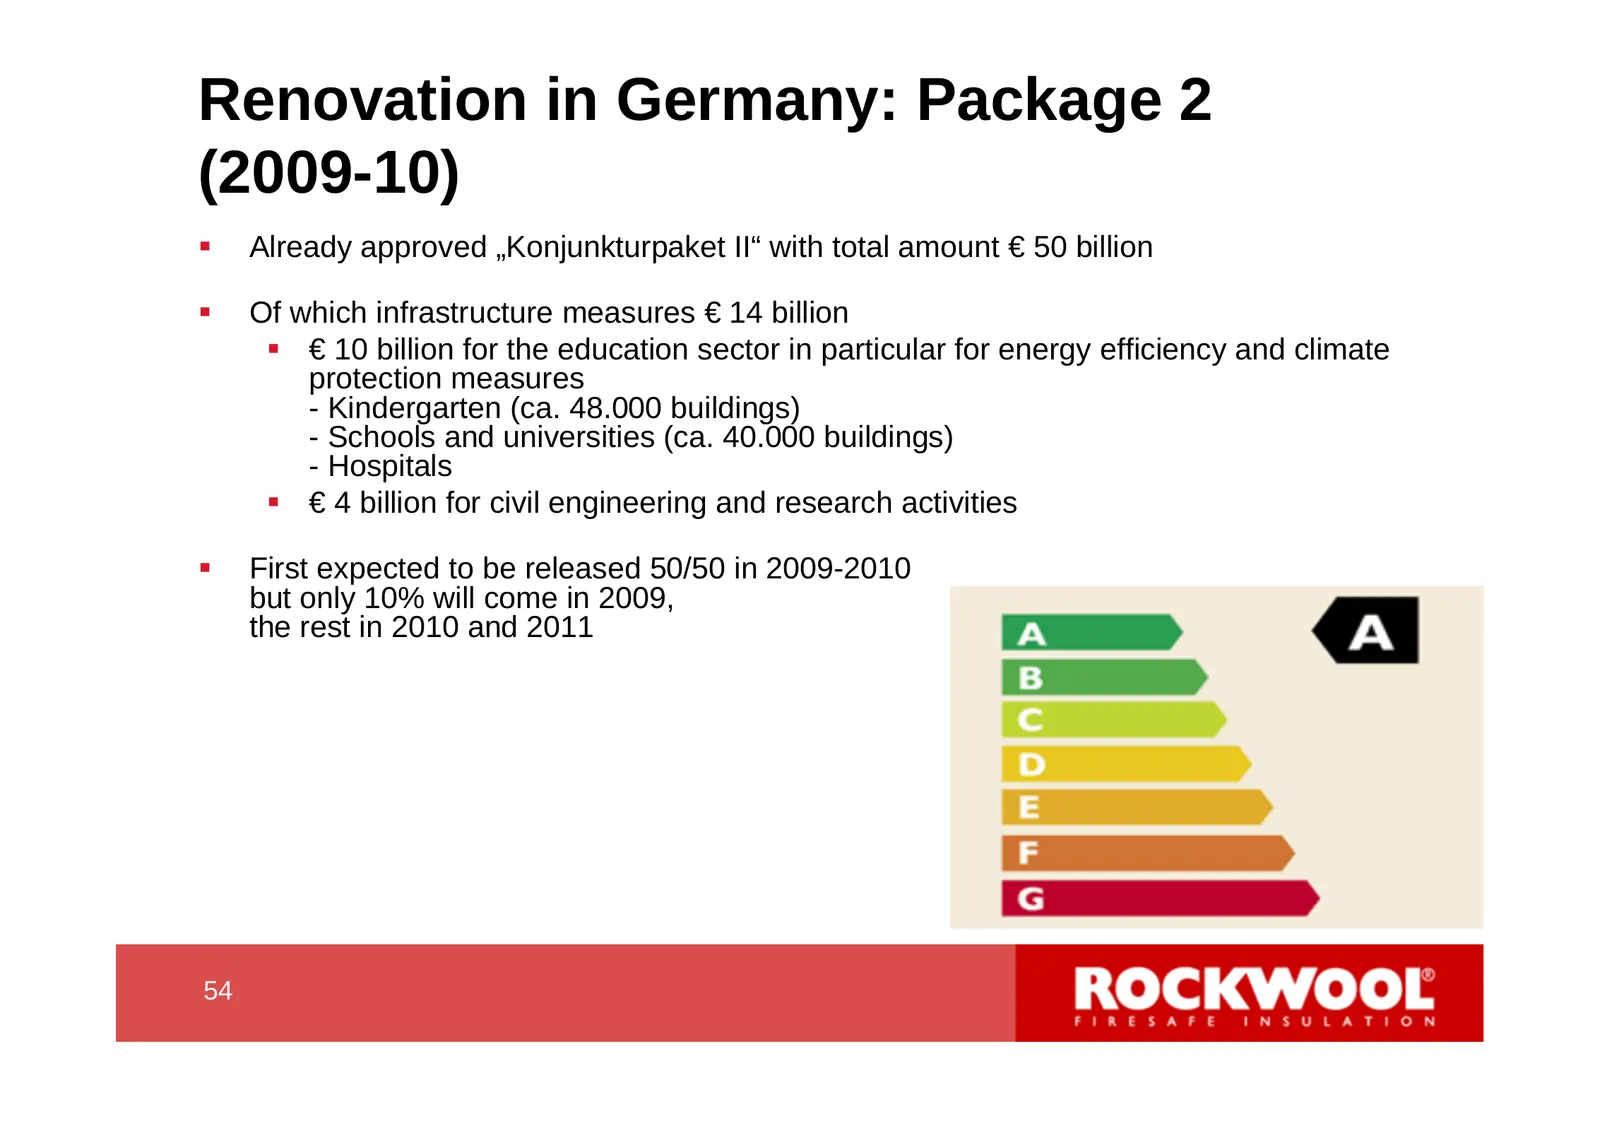
Renovation in Germany: Package 2 (2009-10) Already approved „Konjunkturpaket II“ with total amount € 50 billion Of which infrastructure measures € 14 billion € 10 billion for the education sector in particular for energy efficiency and climate protection measures - Kindergarten (ca. 48.000 bui
Slide 55: UK energy efficiency schemes
UK energy efficiency schemes Government CO2 reduction targets for electricity and gas companies, to be achieved by helping householders improve their energy efficiency. The penalty for not reaching reduction targets can be as high as 10% of the utility company’s turn-over. In the current schem
Slide 56: Russian government programme
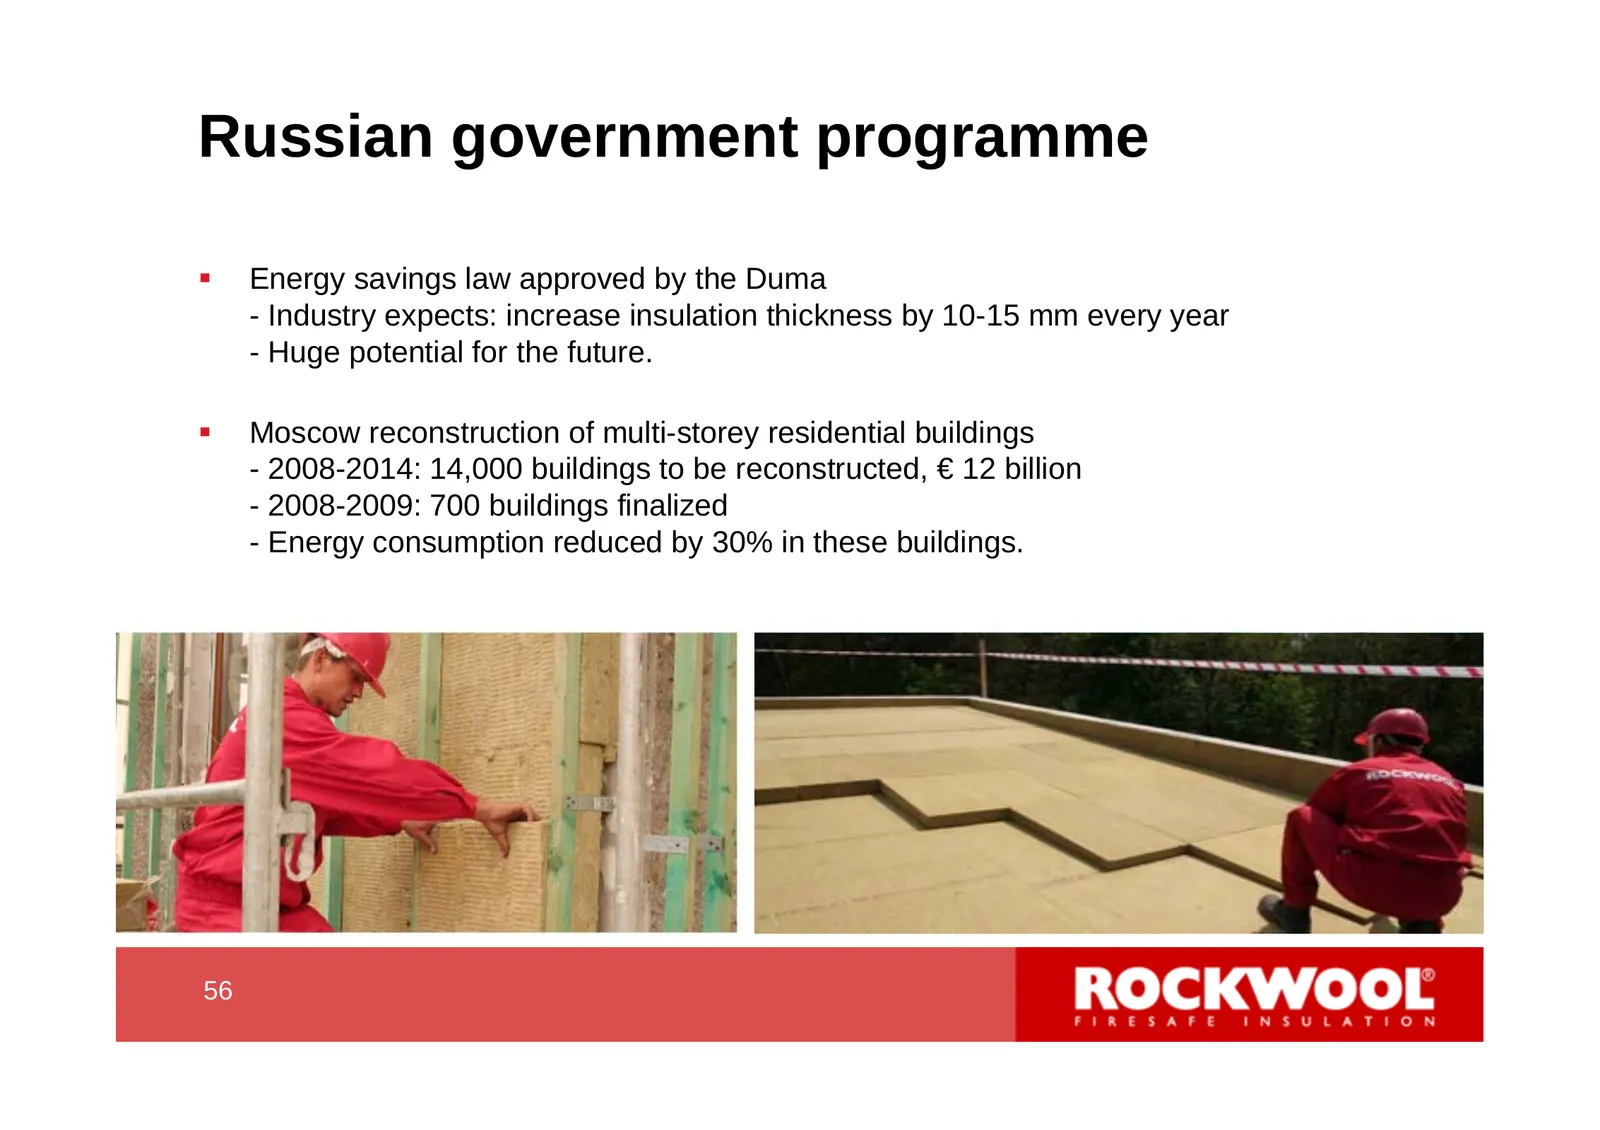
Russian government programme Energy savings law approved by the Duma - Industry expects: increase insulation thickness by 10-15 mm every year - Huge potential for the future. Moscow reconstruction of multi-storey residential buildings - 2008-2014: 14,000 buildings to be reconstructed, € 12 billi
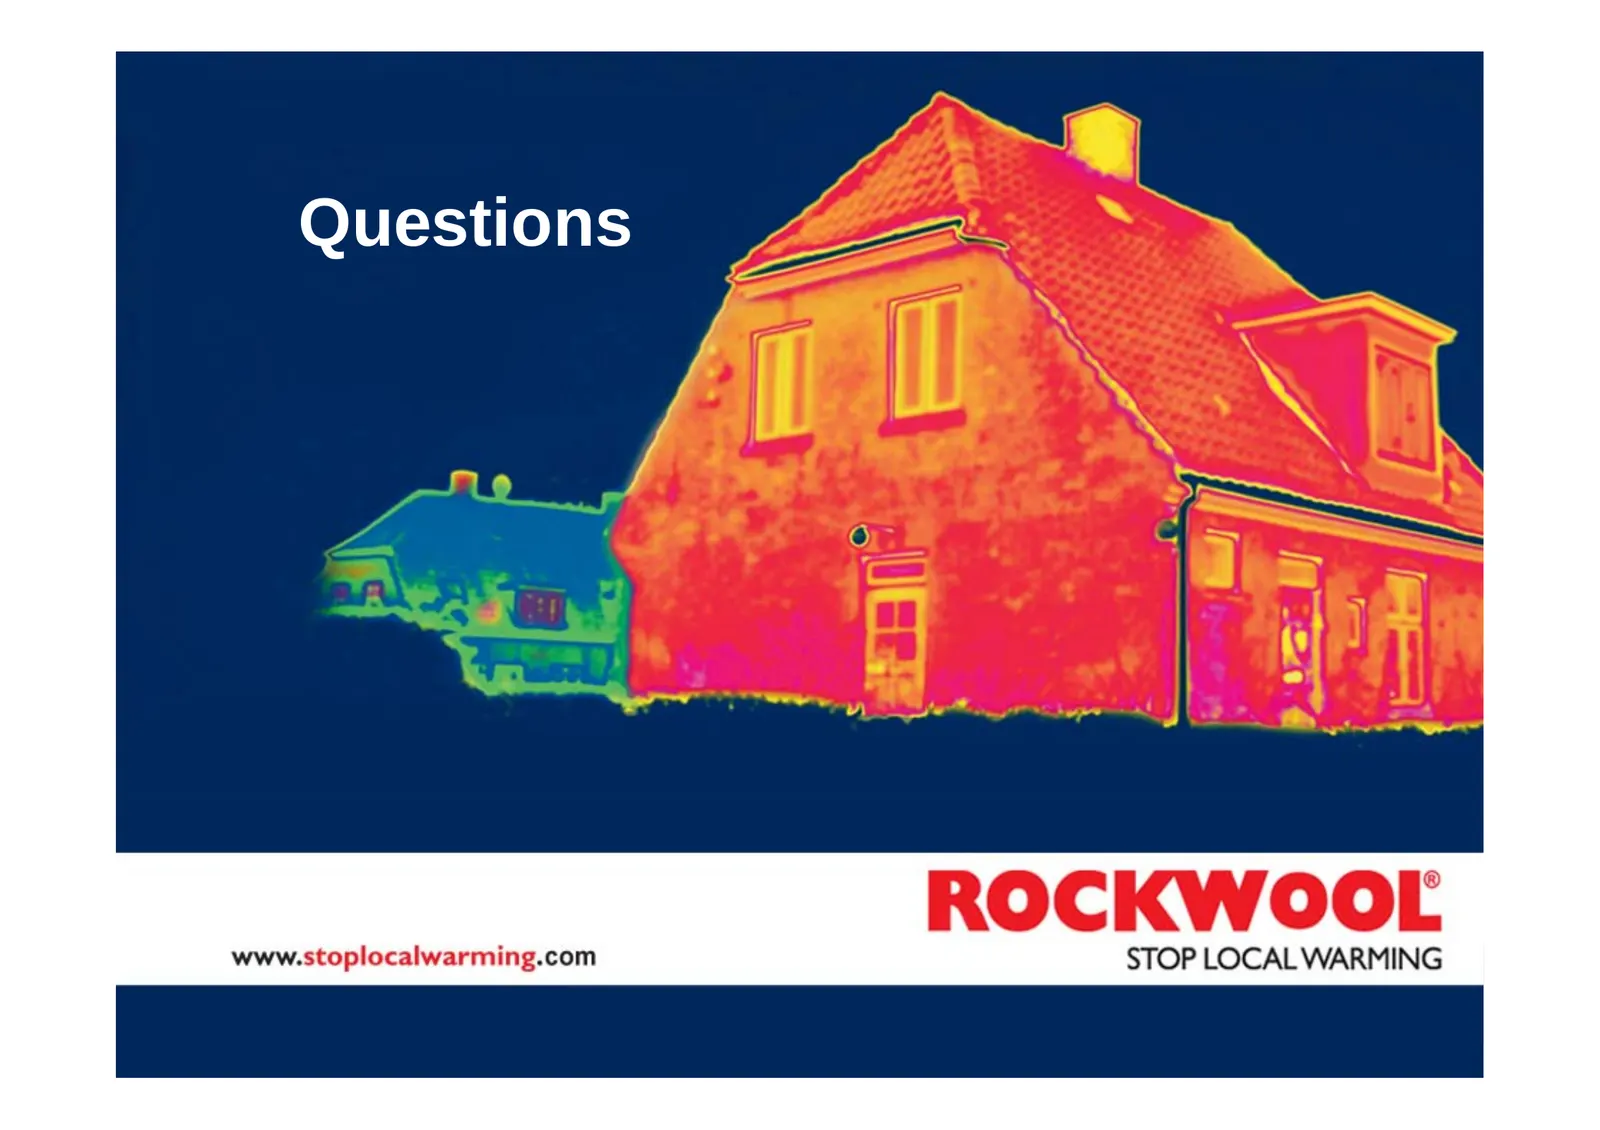
Slide 57: Questions
Questions ROCKWOOL www.stoplocalwarming.com STOP LOCAL WARMING
Source: Internet Archive copy of rockwool.com
More decks from Rockwool A/S Class A
 Q2 2026 Earnings Presentation19 slides · Aug 20, 2026
 Q1 2026 Earnings Presentation15 slides · May 20, 2026
 Shareholder Meeting (2026)10 slides · Apr 15, 2026
 Shareholder Meeting (April 2026)46 slides · Apr 15, 2026
 Q4 2025 Earnings Presentation19 slides · Feb 5, 2026
 Q2 2025 Earnings Presentation17 slides · Aug 21, 2025