United Western Bancorp — IPO Roadshow (September 2009)
38 slides from United Western Bancorp's IPO roadshow presentation, Sep 8, 2009
Slide 1: Common Stock Offering September 2009
Common Stock Offering September 2009 Guy A. Gibson-Chairman of the Board Scot T. Wetzel - President and Chief Executive Officer William D. Snider - Vice Chairman and Chief Financial Officer
Slide 2: Forward-looking Statement Disclaimer and Prospectus Disclosure
2 Forward-looking Statement Disclaimer and Prospectus Disclosure Certain statements contained in this presentation are "forward-looking statements" within the meaning of the Private Securities Litigation Reform Act of 1995 that are subject to significant risks and uncertainties. Forward-looking stat
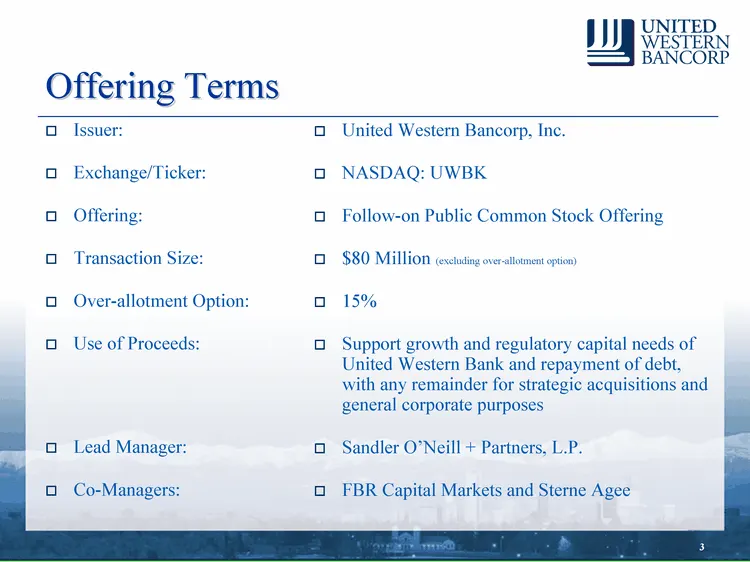
Slide 3: Follow-on Public Common Stock Offering Terms
United Western Bancorp, Inc. NASDAQ: UWBK Follow-on Public Common Stock Offering $80 Million (excluding over-allotment option) 15% Support growth and regulatory capital needs of United Western Bank and repayment of debt, with any remainder for strategic acquisitions and general corporate purposes Sa
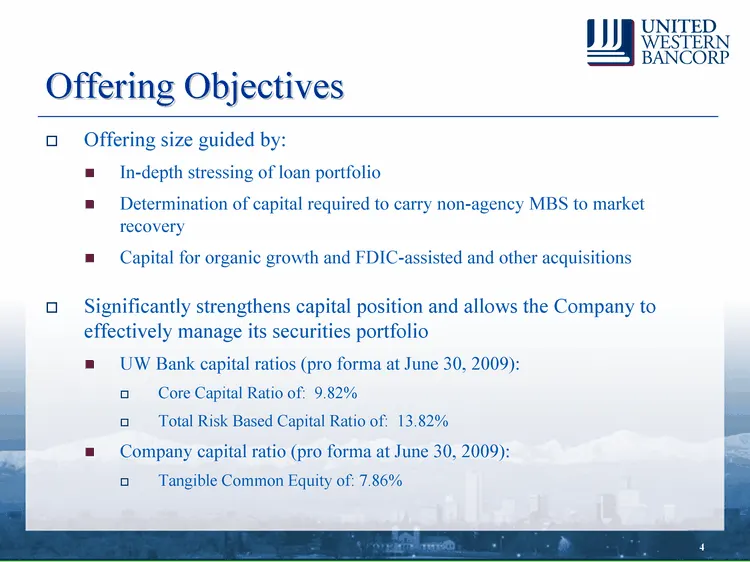
Slide 4: Offering Objectives
Offering Objectives Offering size guided by: In-depth stressing of loan portfolio Determination of capital required to carry non-agency MBS to market recovery Capital for organic growth and FDIC-assisted and other acquisitions Significantly strengthens capital position and allows the Company to effe
Slide 5: Investment Highlights
Investment Highlights Leading community bank franchise in demographically attractive state Experienced management team 14 consecutive quarters of profitability for shareholders Attractive valuation
Slide 6: Franchise Overview
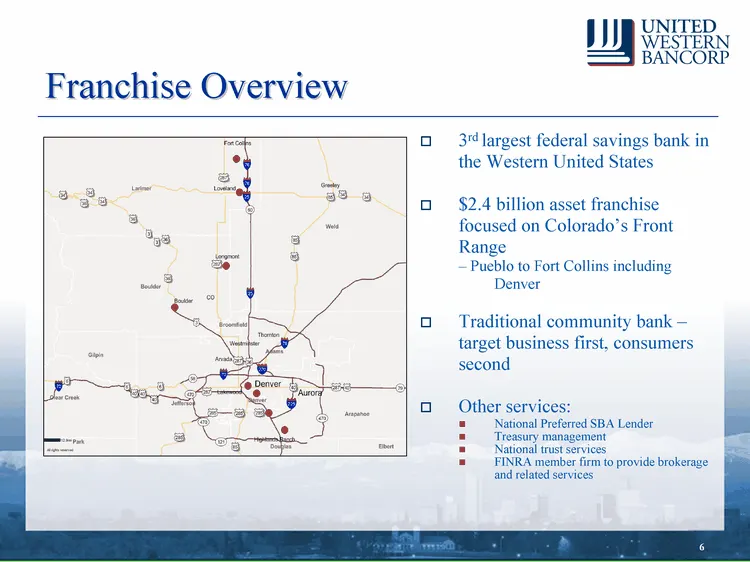
Franchise Overview 3rd largest federal savings bank in the Western United States $2.4 billion asset franchise focused on Colorado's Front Range - - Pueblo to Fort Collins including Denver Traditional community bank - target business first, consumers second Other services: National Preferred SBA Lend
Slide 7: Deposit Franchise Overview
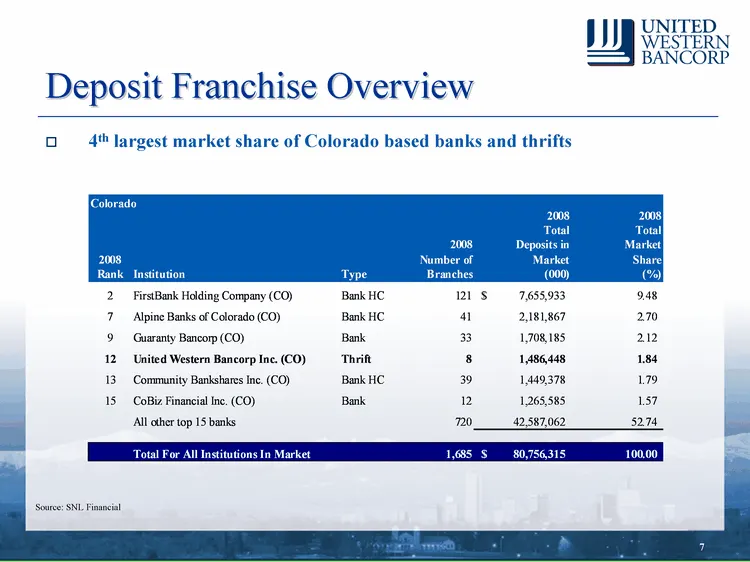
Deposit Franchise Overview 4th largest market share of Colorado based banks and thrifts Source: SNL Financial
Slide 8: Colorado: Among Strongest Economies in US
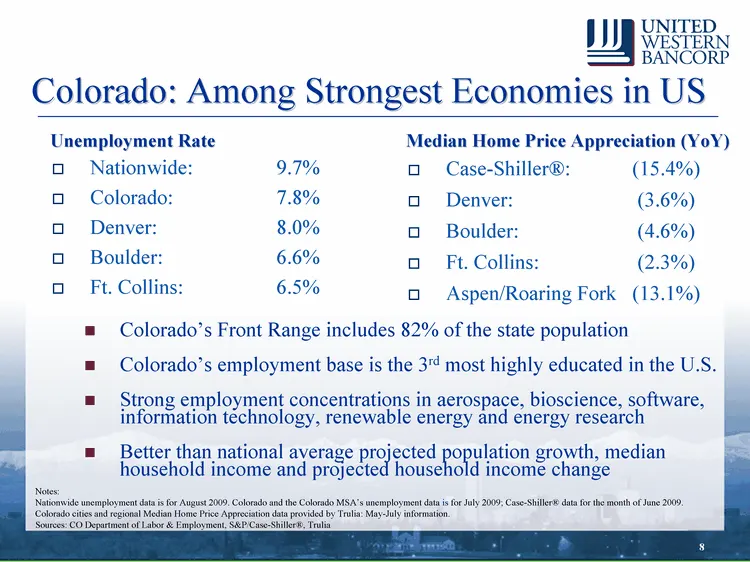
8 8 Colorado: Among Strongest Economies in US Unemployment Rate Median Home Price Appreciation (YoY) Case-Shiller(r): (15.4%) Denver: (3.6%) Boulder: (4.6%) Ft. Collins: (2.3%) Aspen/Roaring Fork (13.1%) Nationwide: 9.7% Colorado: 7.8% Denver: 8.0% Boulder: 6.6% Ft. Collins: 6.5% Notes: Nationwide u
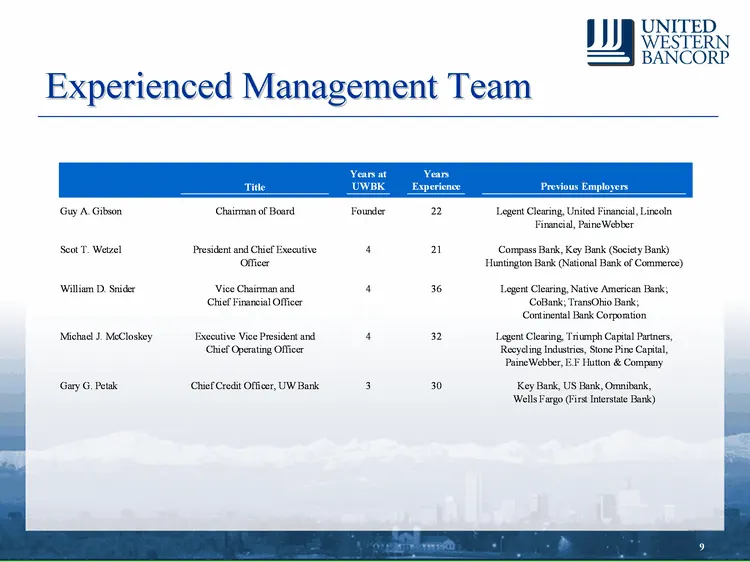
Slide 9: Experienced Management Team
Experienced Management Team Experienced Management Team
Slide 10: Proven Execution of Business Model
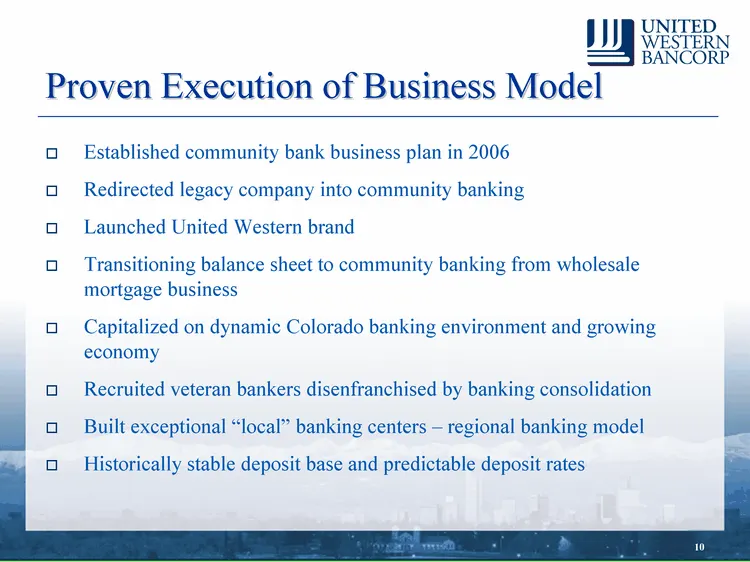
Proven Execution of Business Model Established community bank business plan in 2006 Redirected legacy company into community banking Launched United Western brand Transitioning balance sheet to community banking from wholesale mortgage business Capitalized on dynamic Colorado banking environment and
Slide 11: Proven Execution of Business Model: Assets, Loans, ROAA, ROAE
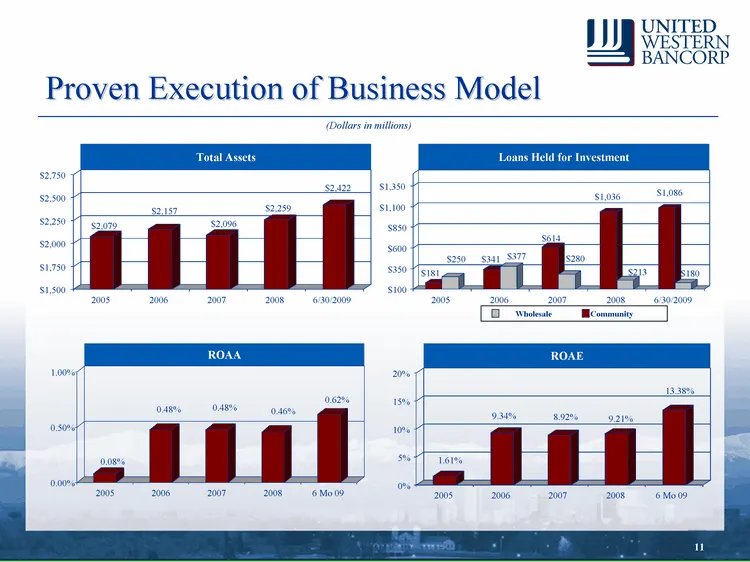
ROAA ROAE Proven Execution of Business Model Total Assets Loans Held for Investment Wholesale Community (Dollars in millions) $181 $250 $341 $377 $614 $280 $1,036 $213 $1,086 $180 $100 $350 $600 $850 $1,100 $1,350 2005 2006 2007 2008 6/30/2009 $2,079 $2,157 $2,096 $2,259 $2,422 $1,500 $1,750 $2,000
Slide 12: Net Interest Margin
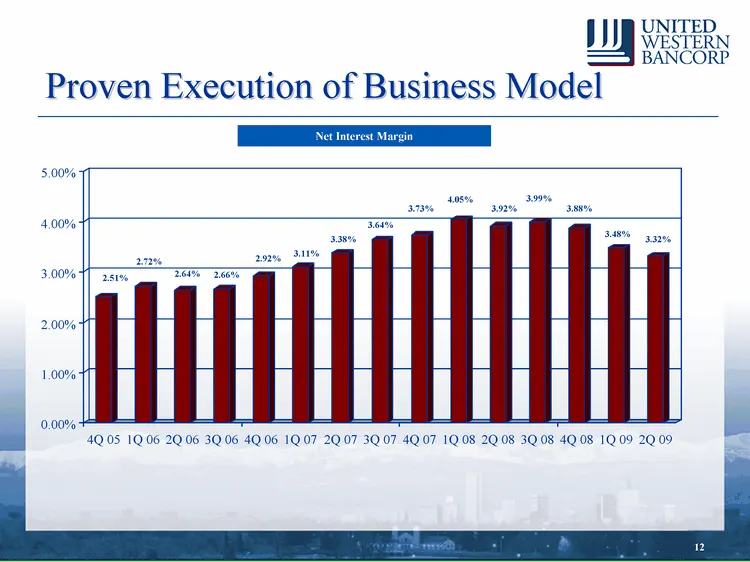
Net Interest Margin Proven Execution of Business Model 2.51% 2.72% 2.64% 2.66% 2.92% 3.11% 3.38% 3.64% 3.73% 4.05% 3.92% 3.99% 3.88% 3.48% 3.32% 0.00% 1.00% 2.00% 3.00% 4.00% 5.00% 4Q 05 1Q 06 2Q 06 3Q 06 4Q 06 1Q 07 2Q 07 3Q 07 4Q 07 1Q 08 2Q 08 3Q 08 4Q 08 1Q 09 2Q 09
Slide 13: Focused Branch Network
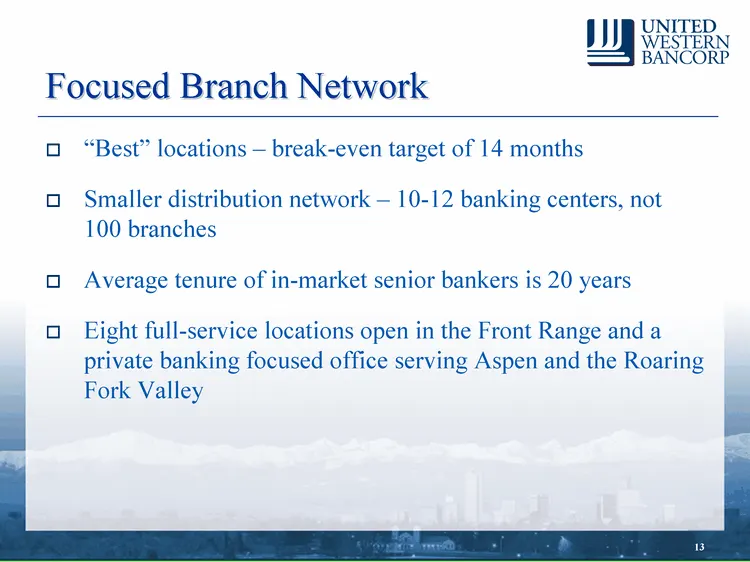
13 Focused Branch Network "Best" locations - break-even target of 14 months Smaller distribution network - 10-12 banking centers, not 100 branches Average tenure of in-market senior bankers is 20 years Eight full-service locations open in the Front Range and a private banking focused office serving
Slide 14: Deposit Franchise Overview
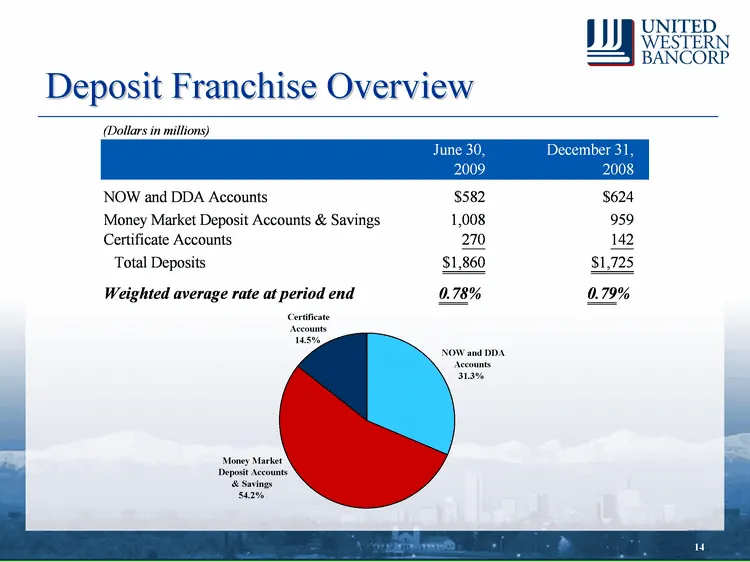
Deposit Franchise Overview NOW and DDA Accounts 31.3% Certificate Accounts 14.5% Money Market Deposit Accounts & Savings 54.2%
Slide 15: Source of Deposits
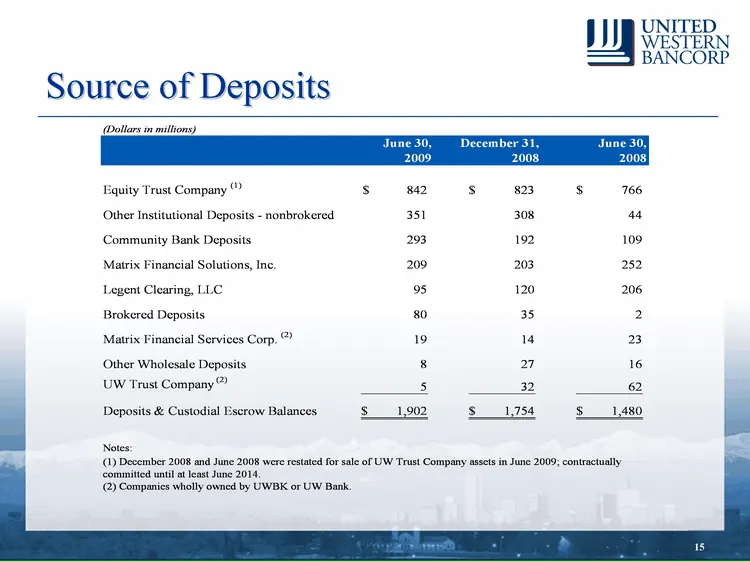
J J UNITED. WESTERN BANCORP Source of Deposits ‘Dollars in milion 2009 2008 Equity Trust Company ? S82 SS 7665, (Other Institutional Deposits - nonbrokered 351 308 44 ‘Community Bank Deposits 293 192 109 Matrix Financial Solutions, Inc. 209 203 252 Legent Clearing, LLC 95 120 206 Brokered Deposits 8
Slide 16: Disciplined Credit Culture
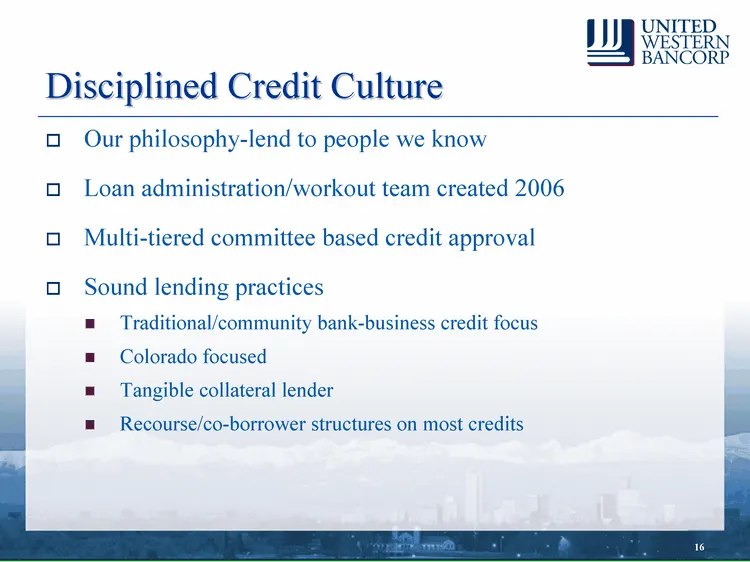
16 Disciplined Credit Culture Our philosophy-lend to people we know Loan administration/workout team created 2006 Multi-tiered committee based credit approval Sound lending practices Traditional/community bank-business credit focus Colorado focused Tangible collateral lender Recourse/co-borrower str
Slide 17: Loan Portfolio Summary
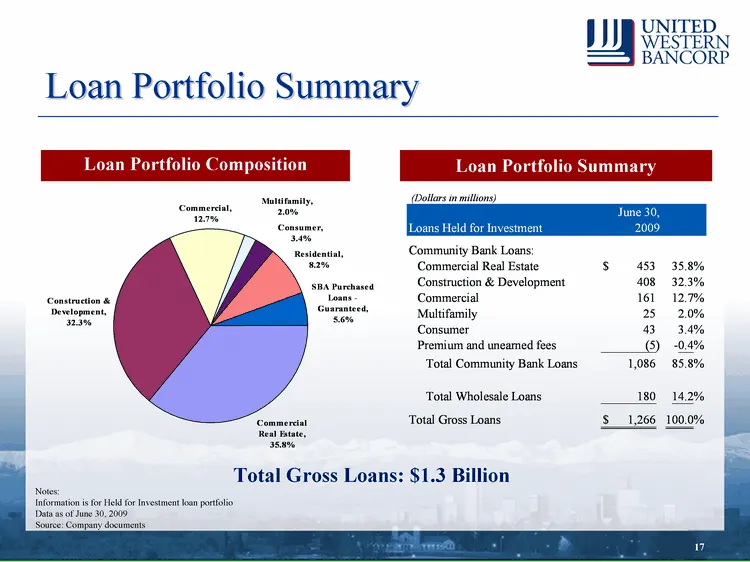
Loan Portfolio Summary Loan Portfolio Composition Loan Portfolio Summary Total Gross Loans: $1.3 Billion Notes: Information is for Held for Investment loan portfolio Data as of June 30, 2009 Source: Company documents
Slide 18: CRE and C&D Loan Portfolio Summary
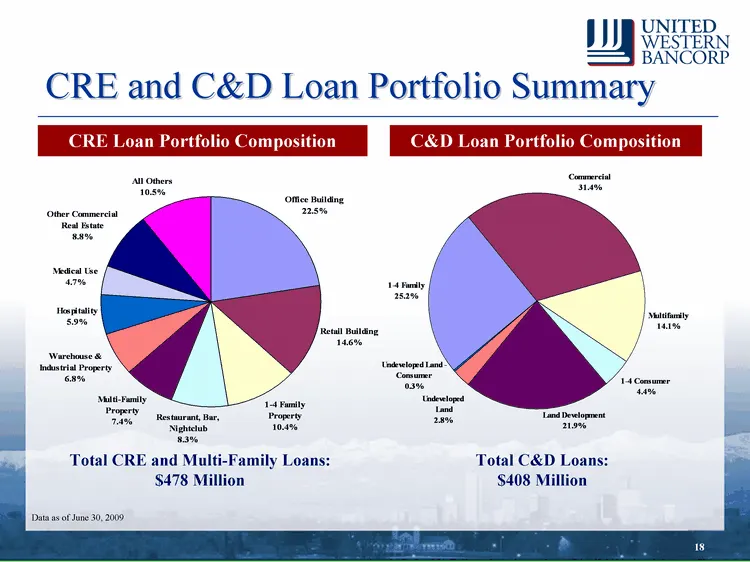
CRE and C&D Loan Portfolio Summary CRE Loan Portfolio Composition Total CRE and Multi-Family Loans: $478 Million Data as of June 30, 2009 C&D Loan Portfolio Composition Total C&D Loans: $408 Million
Slide 19: Commercial Loan Portfolio Summary
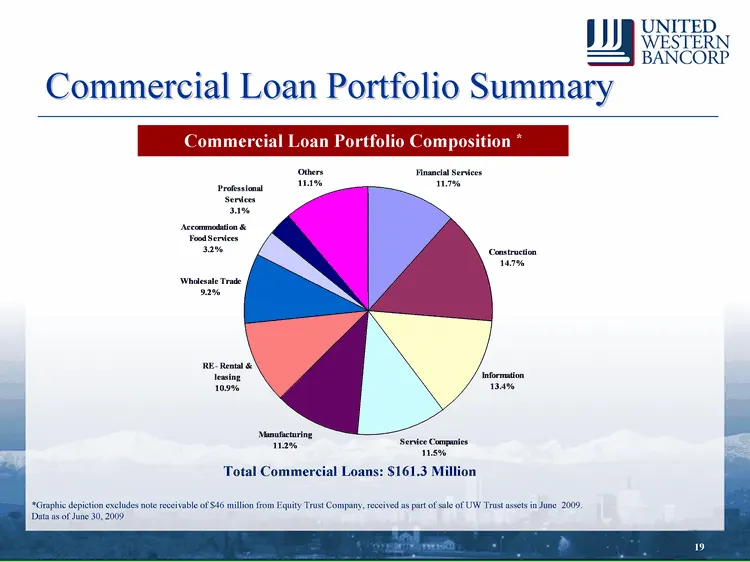
Commercial Loan Portfolio Summary Commercial Loan Portfolio Composition * Total Commercial Loans: $161.3 Million *Graphic depiction excludes note receivable of $46 million from Equity Trust Company, received as part of sale of UW Trust assets in June 2009. Data as of June 30, 2009
Slide 20: Single Family Residential Portfolio
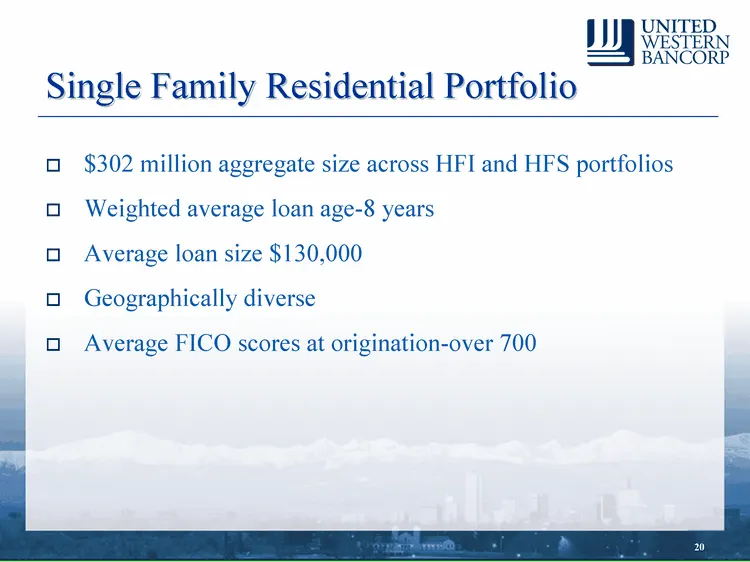
Single Family Residential Portfolio $302 million aggregate size across HFI and HFS portfolios Weighted average loan age-8 years Average loan size $130,000 Geographically diverse Average FICO scores at origination-over 700
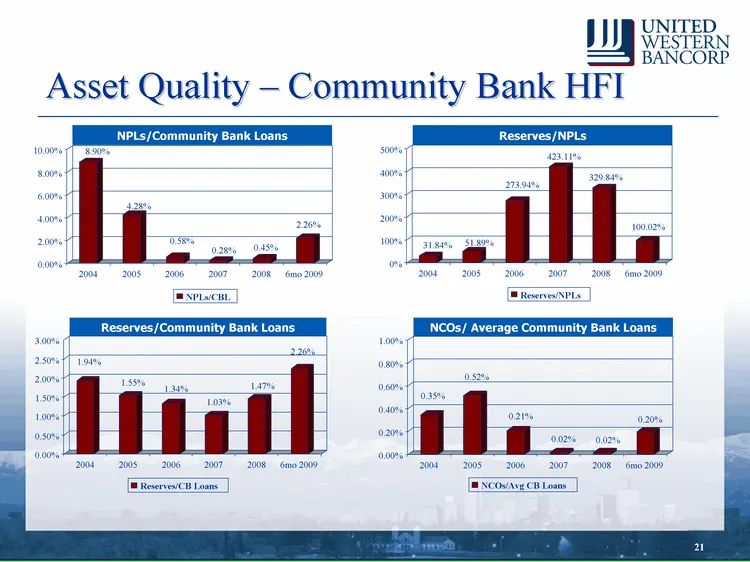
Slide 21: Asset Quality - Community Bank
Asset Quality - Community Bank HFI Reserves/NPLs NCOs/ Average Community Bank Loans NPLs/Community Bank Loans Reserves/Community Bank Loans 1.94% 1.55% 1.34% 1.03% 1.47% 2.26% 0.00% 0.50% 1.00% 1.50% 2.00% 2.50% 3.00% 2004 2005 2006 2007 2008 6mo 2009 Reserves/CB Loans 8.90% 4.28% 0.58% 0.28% 0.45%
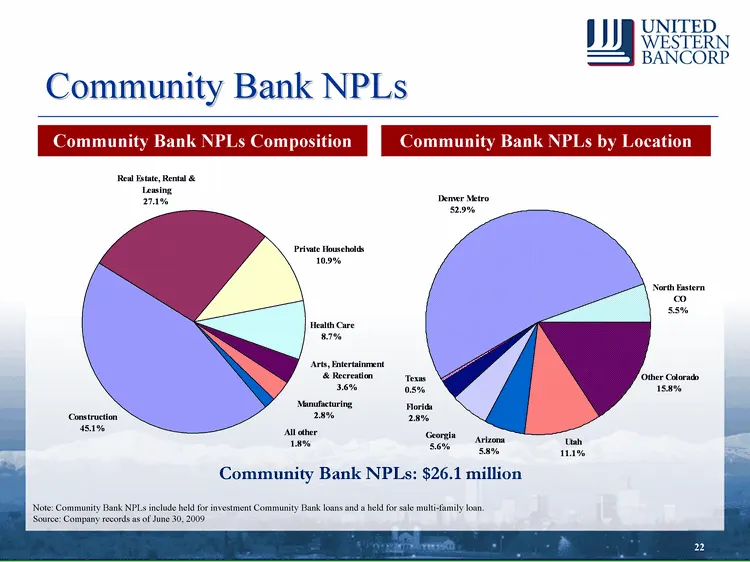
Slide 22: Community Bank NPLs
22 Community Bank NPLs Community Bank NPLs: $26.1 million Note: Community Bank NPLs include held for investment Community Bank loans and a held for sale multi-family loan. Source: Company records as of June 30, 2009 Community Bank NPLs by Location Community Bank NPLs Composition
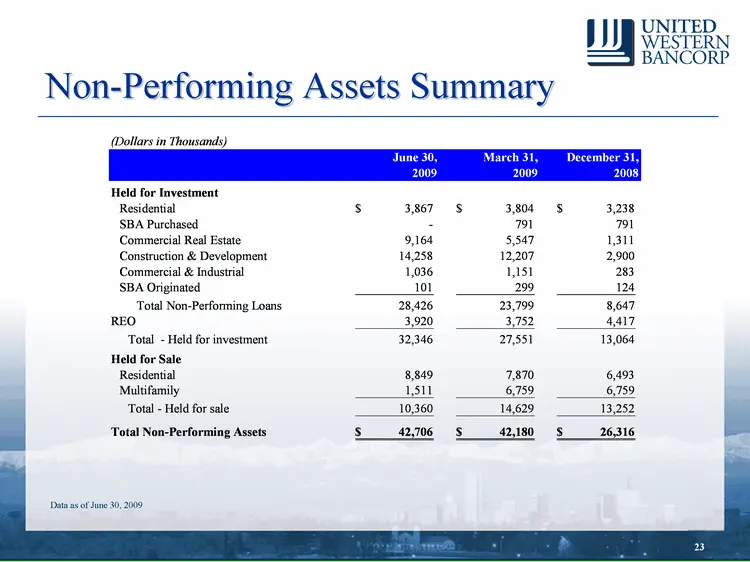
Slide 23: Non-Performing Assets Summary
Non-Performing Assets Summary Data as of June 30, 2009
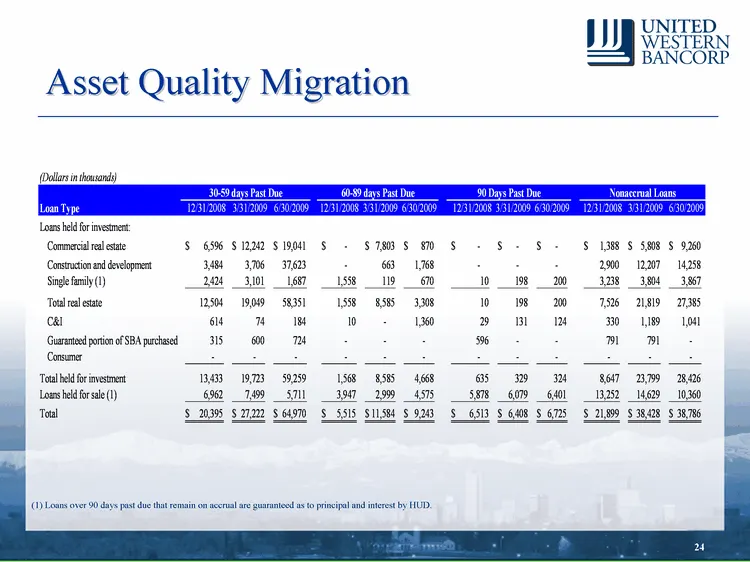
Slide 24: Asset Quality Migration
24 Asset Quality Migration (1) Loans over 90 days past due that remain on accrual are guaranteed as to principal and interest by HUD.
Slide 25: Third Party Loan Review
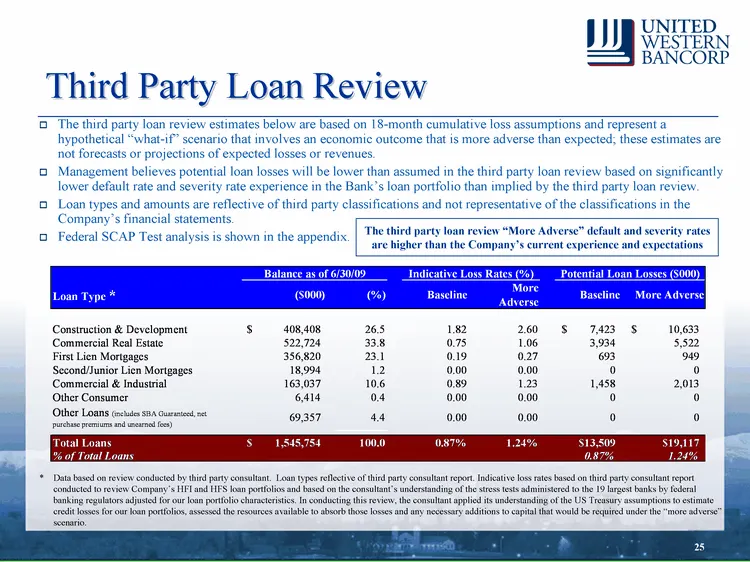
Third Party Loan Review The third party loan review estimates below are based on 18-month cumulative loss assumptions and represent a hypothetical "what-if" scenario that involves an economic outcome that is more adverse than expected; these estimates are not forecasts or projections of expected los
Slide 26: Pro Forma Capital Under Loss Scenarios
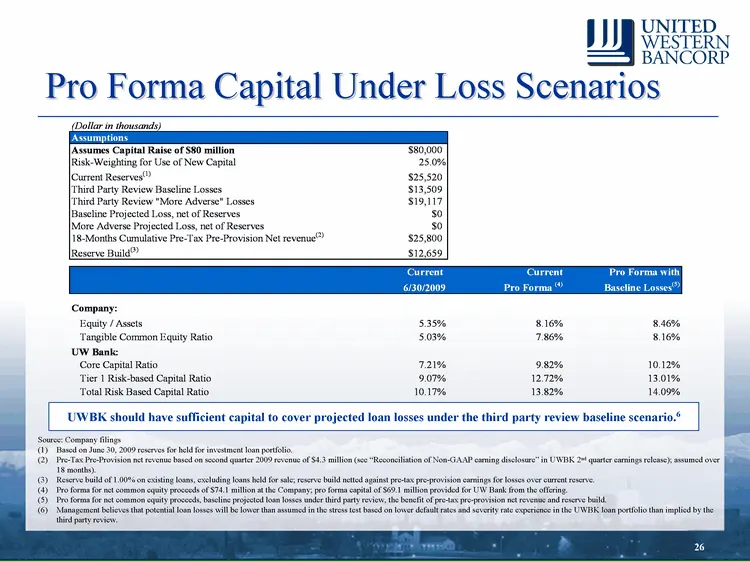
Pro Forma Capital Under Loss Scenarios Source: Company filings (1) Based on June 30, 2009 reserves for held for investment loan portfolio. (2) Pre-Tax Pre-Provision net revenue based on second quarter 2009 revenue of $4.3 million (see "Reconciliation of Non-GAAP earning disclosure" in UWBK 2nd quart
Slide 27: Investment Securities Portfolio
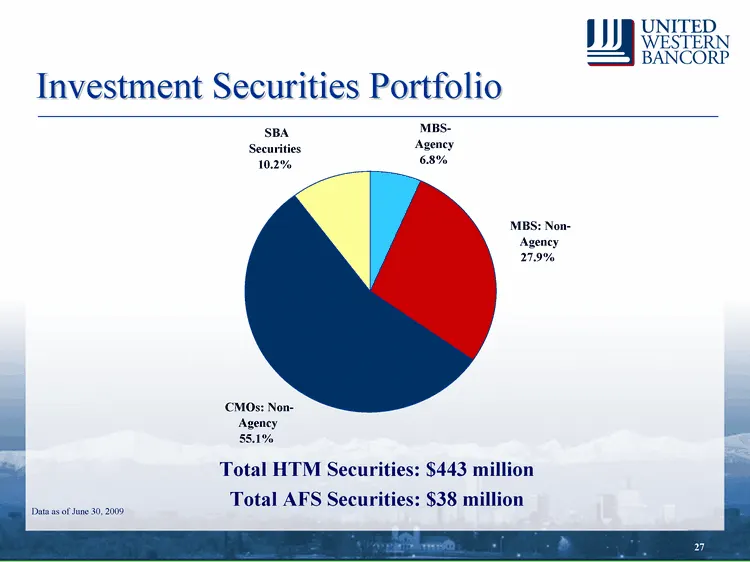
Investment Securities Portfolio Total HTM Securities: $443 million Total AFS Securities: $38 million Data as of June 30, 2009 MBS: Non- Agency 27.9% MBS- Agency 6.8% SBA Securities 10.2% CMOs: Non- Agency 55.1%
Slide 28: Investment Securities Portfolio
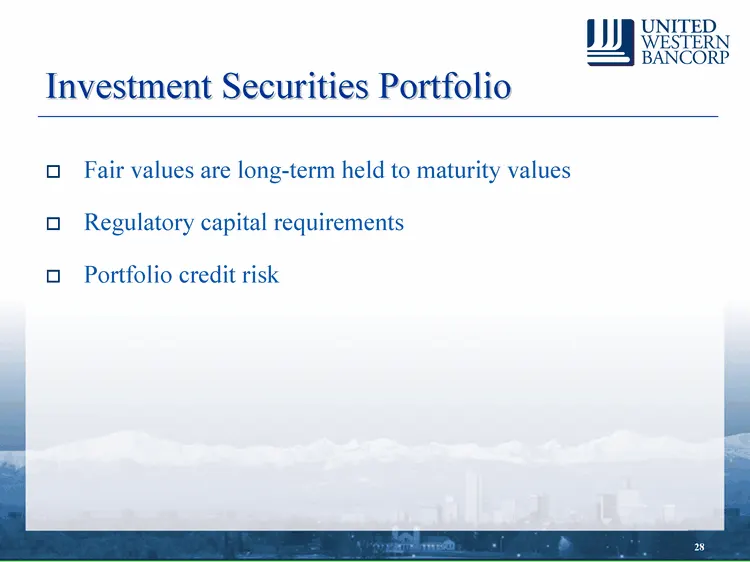
Investment Securities Portfolio Fair values are long-term held to maturity values Regulatory capital requirements Portfolio credit risk
Slide 29: Investment Securities Portfolio
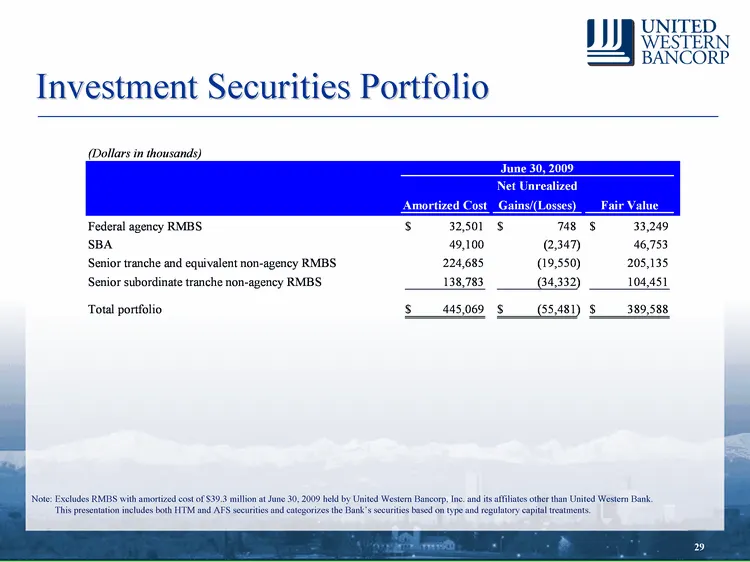
Investment Securities Portfolio Note: Excludes RMBS with amortized cost of $39.3 million at June 30, 2009 held by United Western Bancorp, Inc. and its affiliates other than United Western Bank. This presentation includes both HTM and AFS securities and categorizes the Bank's securities based on type
Slide 30: Regulatory Capital Requirements
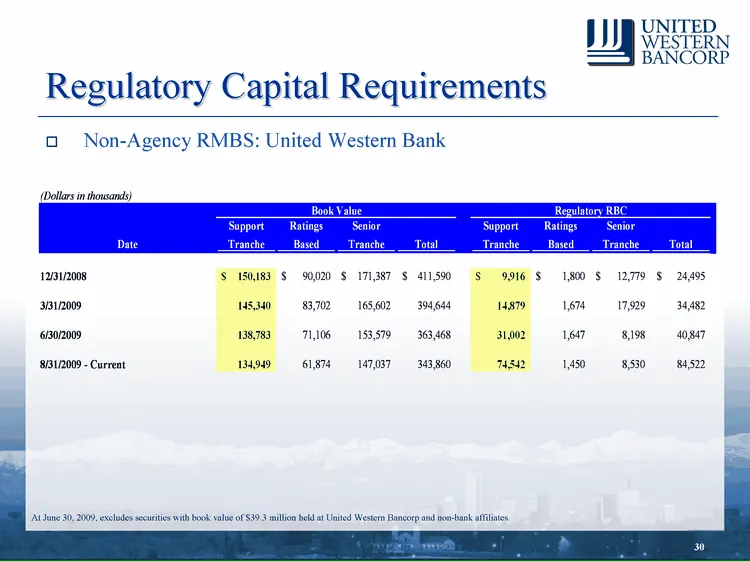
Regulatory Capital Requirements Non-Agency RMBS: United Western Bank At June 30, 2009, excludes securities with book value of $39.3 million held at United Western Bancorp and non-bank affiliates.
Slide 31: Non-Agency RMBS Possible Risk-Based Capital Recovery Scenarios
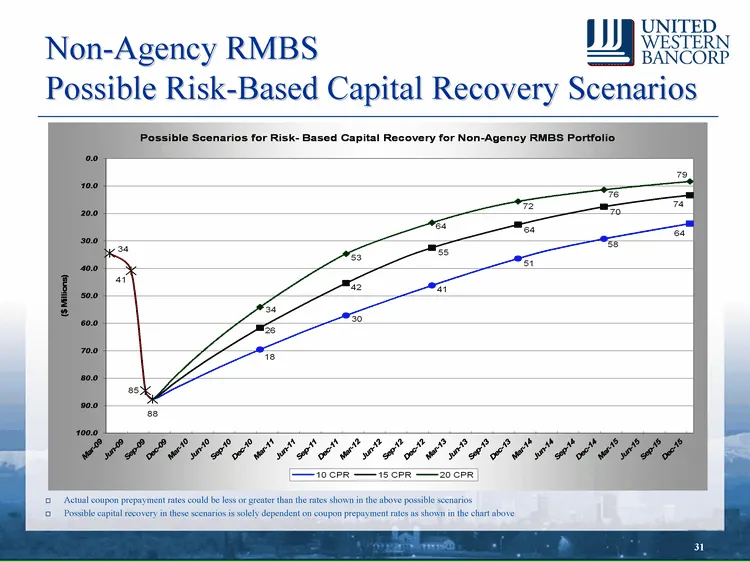
Non-Agency RMBS Possible Risk-Based Capital Recovery Scenarios Actual coupon prepayment rates could be less or greater than the rates shown in the above possible scenarios Possible capital recovery in these scenarios is solely dependent on coupon prepayment rates as shown in the chart above
Slide 32: Investment Securities Portfolio Run-Off
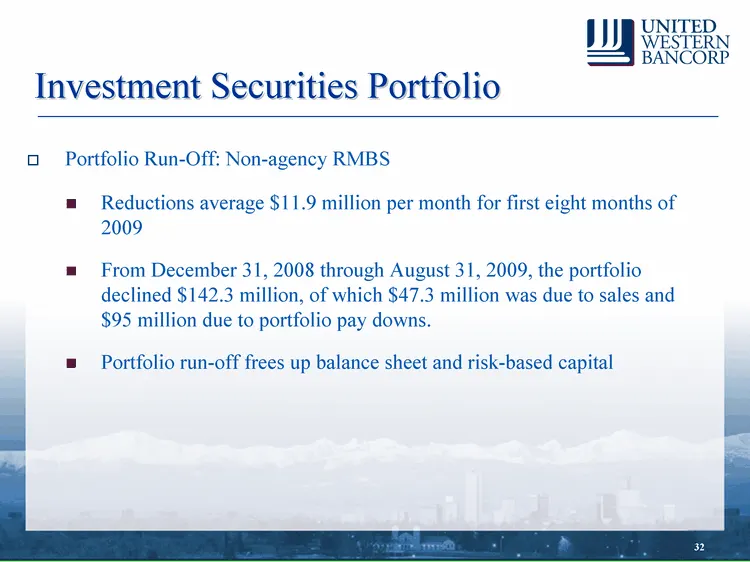
Investment Securities Portfolio Portfolio Run-Off: Non-agency RMBS Reductions average $11.9 million per month for first eight months of 2009 From December 31, 2008 through August 31, 2009, the portfolio declined $142.3 million, of which $47.3 million was due to sales and $95 million due to portfolio
Slide 33: Opportunities for Growth
Opportunities for Growth Selective expansion of branch network within local markets Continued ability to attract "disenfranchised" bankers from larger competitors Branch acquisitions from larger bank overlap/closures Opportunistic acquisitions of troubled institutions, deposit franchises and other a
Slide 34: Investment Considerations
Investment Considerations Top performing bank in attractive market - opportunity to grow Management team track record Temporary support of regulatory capital to hold our performing non-agency RMBS securities portfolio Sticky deposit franchise Performing loan portfolio Attractive valuation to tangibl
Slide 35: J J J UNITED.
J J J UNITED. WESTERN BANCORP DJ Wistery BANCORP
Slide 36: Appendix: SCAP Test Numbers
J J J UNITED. WESTERN BANCORP Appendix: SCAP Test Numbers
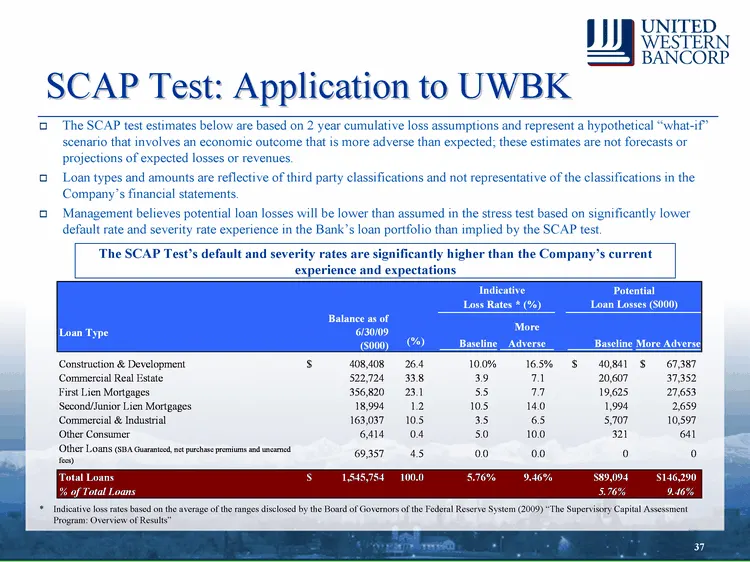
Slide 37: SCAP Test: Application to UWBK
SCAP Test: Application to UWBK The SCAP test estimates below are based on 2 year cumulative loss assumptions and represent a hypothetical "what-if" scenario that involves an economic outcome that is more adverse than expected; these estimates are not forecasts or projections of expected losses or re
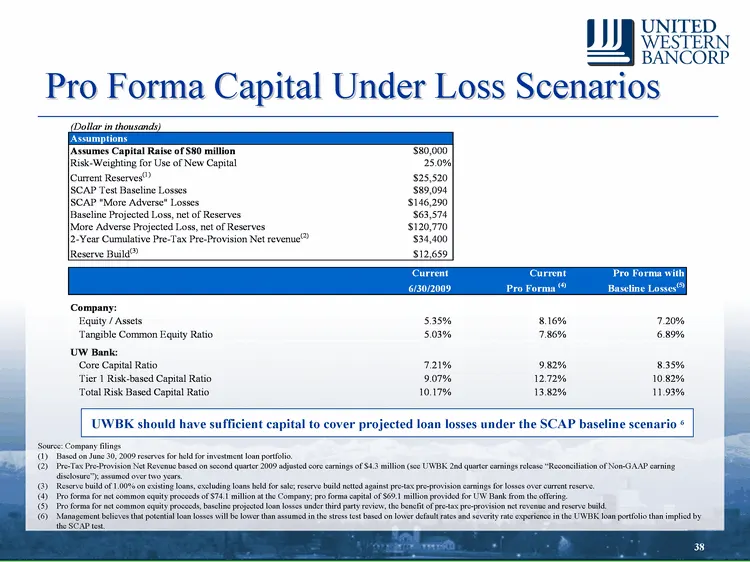
Slide 38: Pro Forma Capital Under Loss Scenarios
Pro Forma Capital Under Loss Scenarios Source: Company filings (1) Based on June 30, 2009 reserves for held for investment loan portfolio. (2) Pre-Tax Pre-Provision Net Revenue based on second quarter 2009 adjusted core earnings of $4.3 million (see UWBK 2nd quarter earnings release "Reconciliation
Source: SEC EDGAR · FWP filed Sep 8, 2009
More decks from United Western Bancorp Inc
 Shareholder Meeting (July 2010)12 slides · Jul 30, 2010
 Merger or Acquisition (June 2010)16 slides · Jun 15, 2010
 Q3 2009 Earnings Presentation29 slides · Nov 10, 2009
 Shareholder Meeting (May 2009)28 slides · May 21, 2009
 Merger or Acquisition (April 2009)6 slides · Apr 10, 2009
 Investor Presentation (March 2009)31 slides · Mar 3, 2009