Transat A.T. Inc. · TSX:TRZ
Transat A.T — Shareholder Meeting (March 2014)
67 slides from Transat A.T's shareholder meeting presentation, Mar 13, 2014

Slide 1: Annual and Special Meeting of Shareholders 2014
yc transat Annual and Special Meeting of Shareholders 2014 1s Geldiniz BIER Benvenuto

Slide 2: Jean-Marc Eustache, President and Chief Executive Officer
Jean-Marc Eustache President and Chief Executive Officer

Slide 3: Annual and Special Meeting of Shareholders 2014
yc transat Annual and Special Meeting of Shareholders 2014 1s Geldiniz BIER Benvenuto
Slide 4: Denis Pétrin
Denis Pétrin Vice-President, Finance & Administration and Chief Financial Officer

Slide 5: Bernard Bussières
Bernard Bussières Vice-President, General Counsel and Corporate Secretary
Slide 6: Agenda
Agenda 1. Appointment of Scrutineers 2. Scrutineers’ Report and Quorum 3. Election of Directors 4. Appointment of Auditors 5. Resolution: Shareholder Rights Plan 6. Resolution: Executive Compensation 7. President’s Message 8. Financial Report 9. Results of the Vote 10. Question Period

Slide 7: Appointment of Scrutineers
ve transat Annual and Special Meeting of Shareholders 2014
Slide 8: Scrutineers' Report and Quorum
SCRUTINEERS’ REPORT AND QUORUM

Slide 9: Annual and Special Meeting of Shareholders 2014
yc transat Annual and Special Meeting of Shareholders 2014 1s Geldiniz BIER Benvenuto

Slide 10: Election of Directors
ve transat Annual and Special Meeting of Shareholders 2014
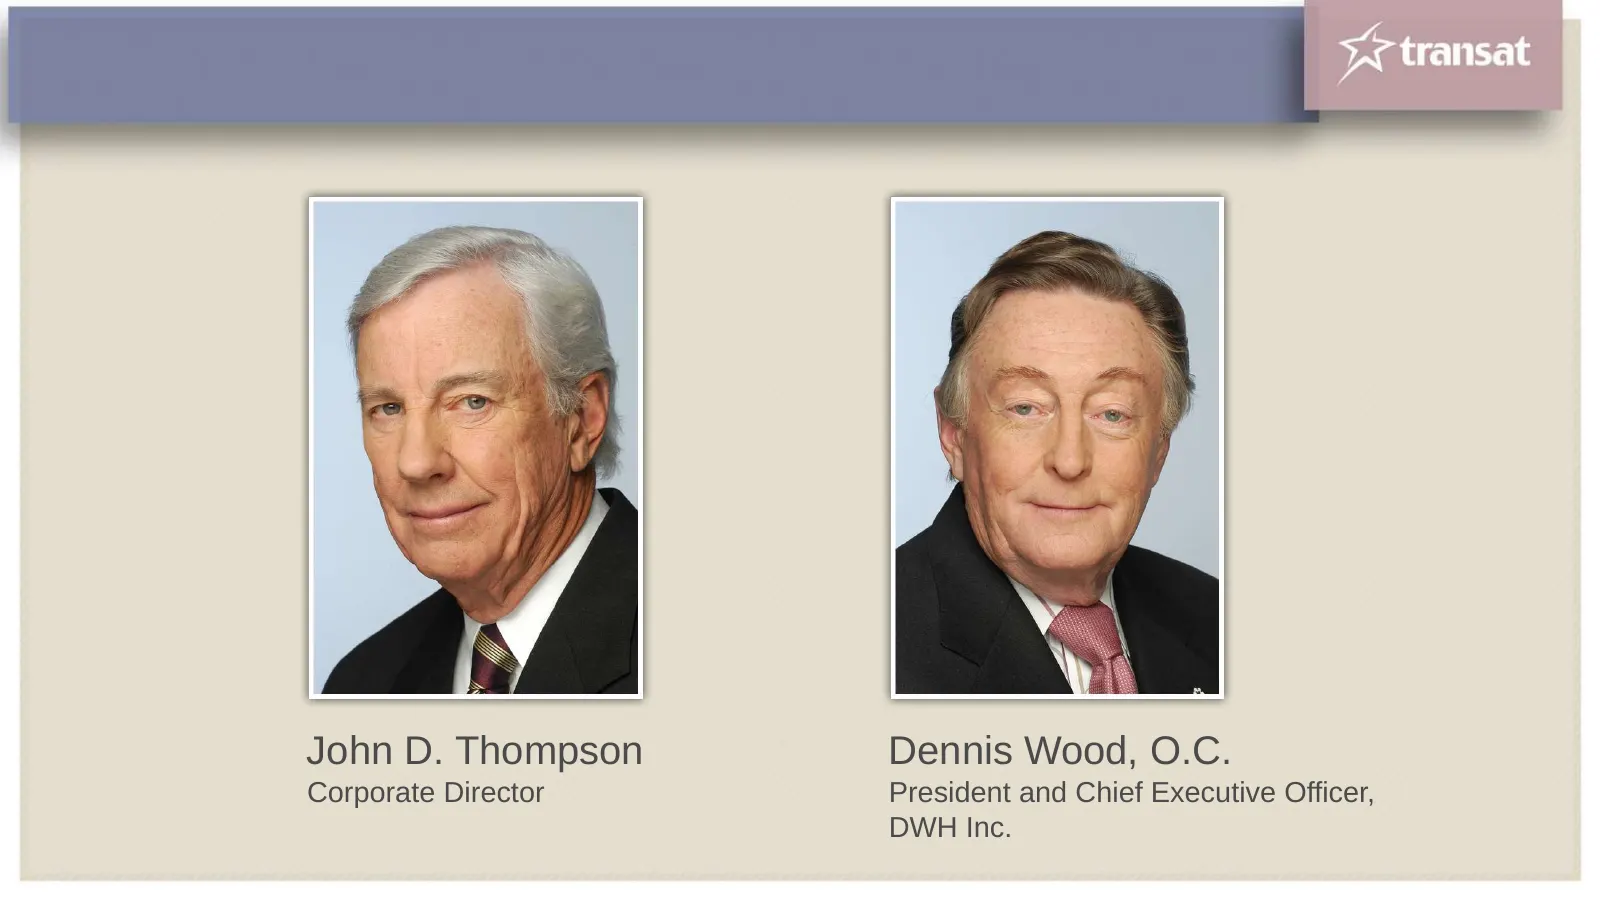
Slide 11: John D. Thompson, Dennis Wood
John D. Thompson Dennis Wood, O.C. Corporate Director President and Chief Executive Officer, DWH Inc.

Slide 12: Election of Directors
ve transat Annual and Special Meeting of Shareholders 2014
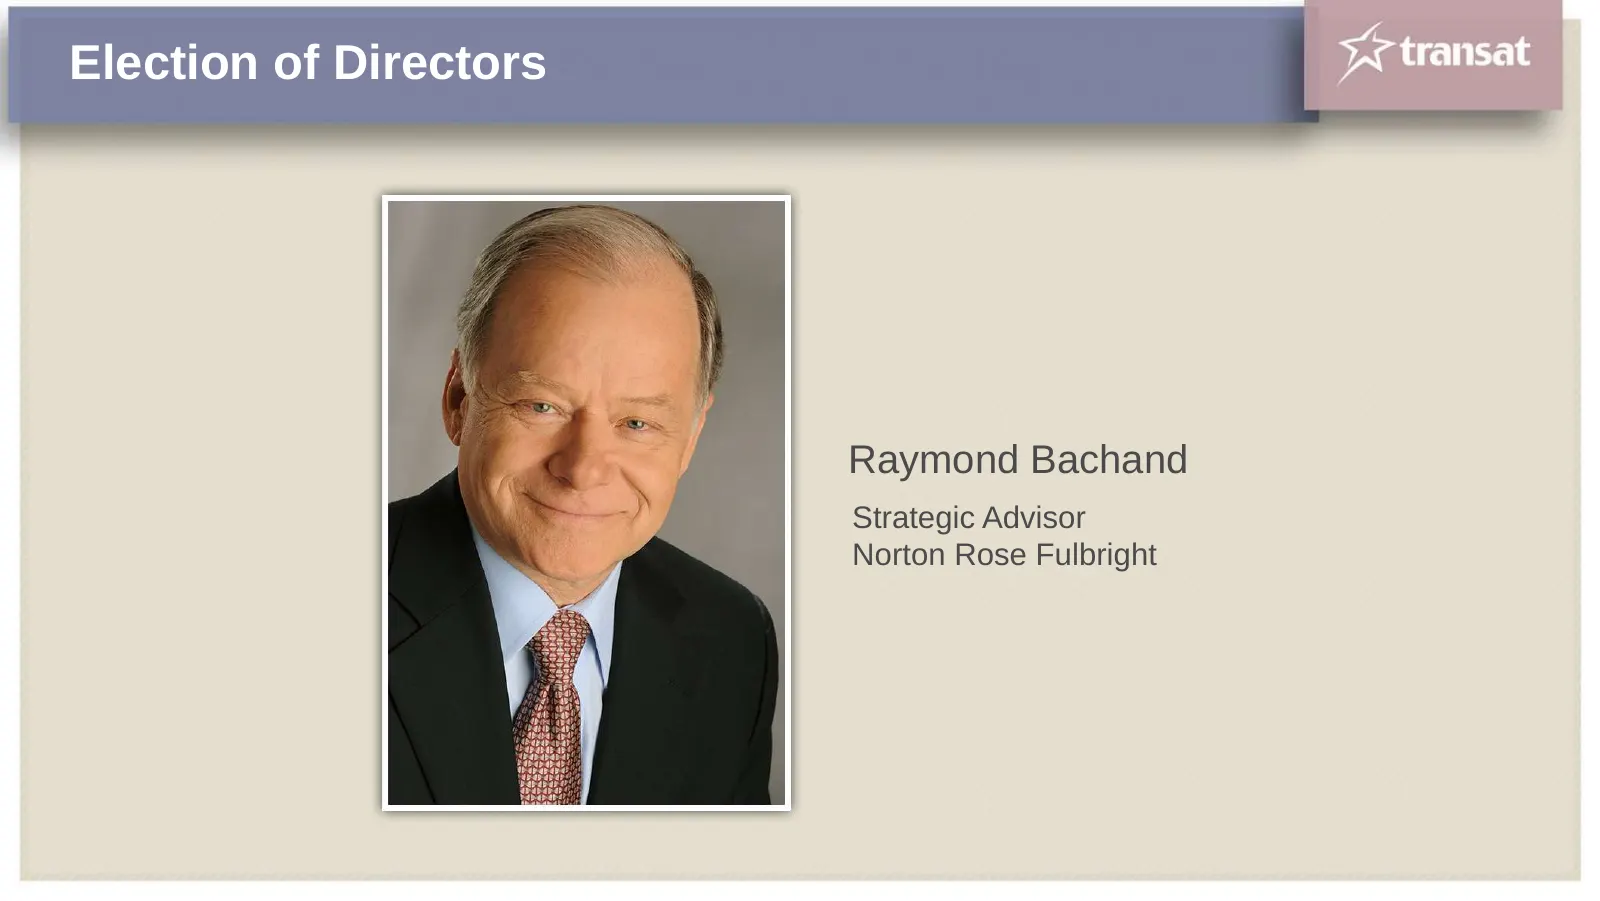
Slide 13: Election of Directors: Raymond Bachand
Election of Directors Raymond Bachand Strategic Advisor Norton Rose Fulbright
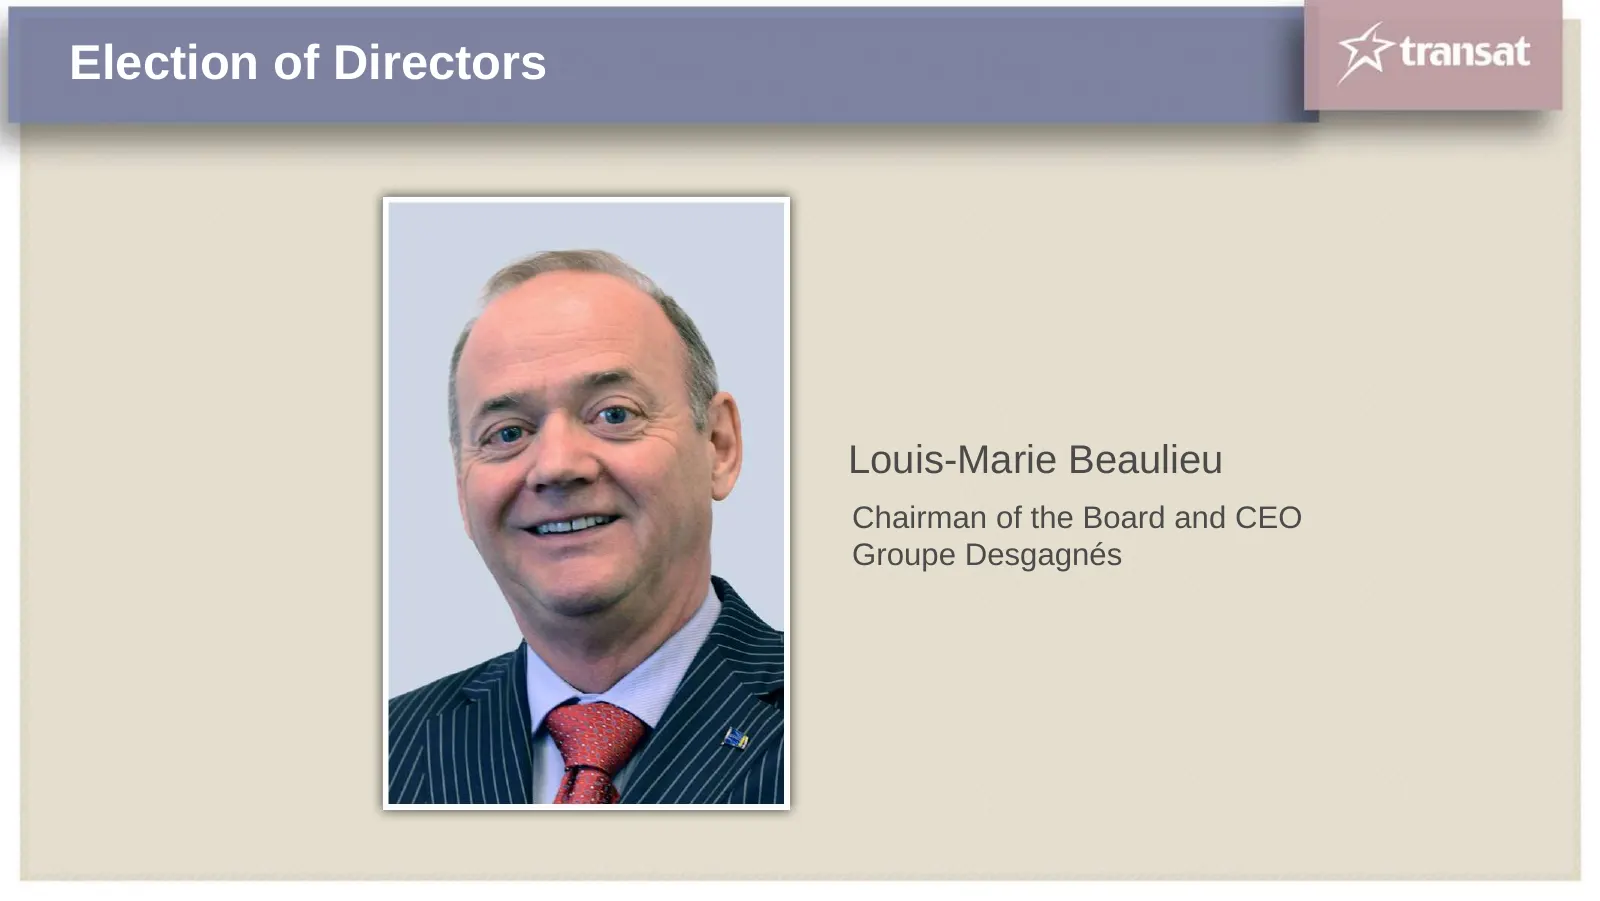
Slide 14: Election of Directors: Louis-Marie Beaulieu
Election of Directors Louis-Marie Beaulieu Chairman of the Board and CEO Groupe Desgagnés
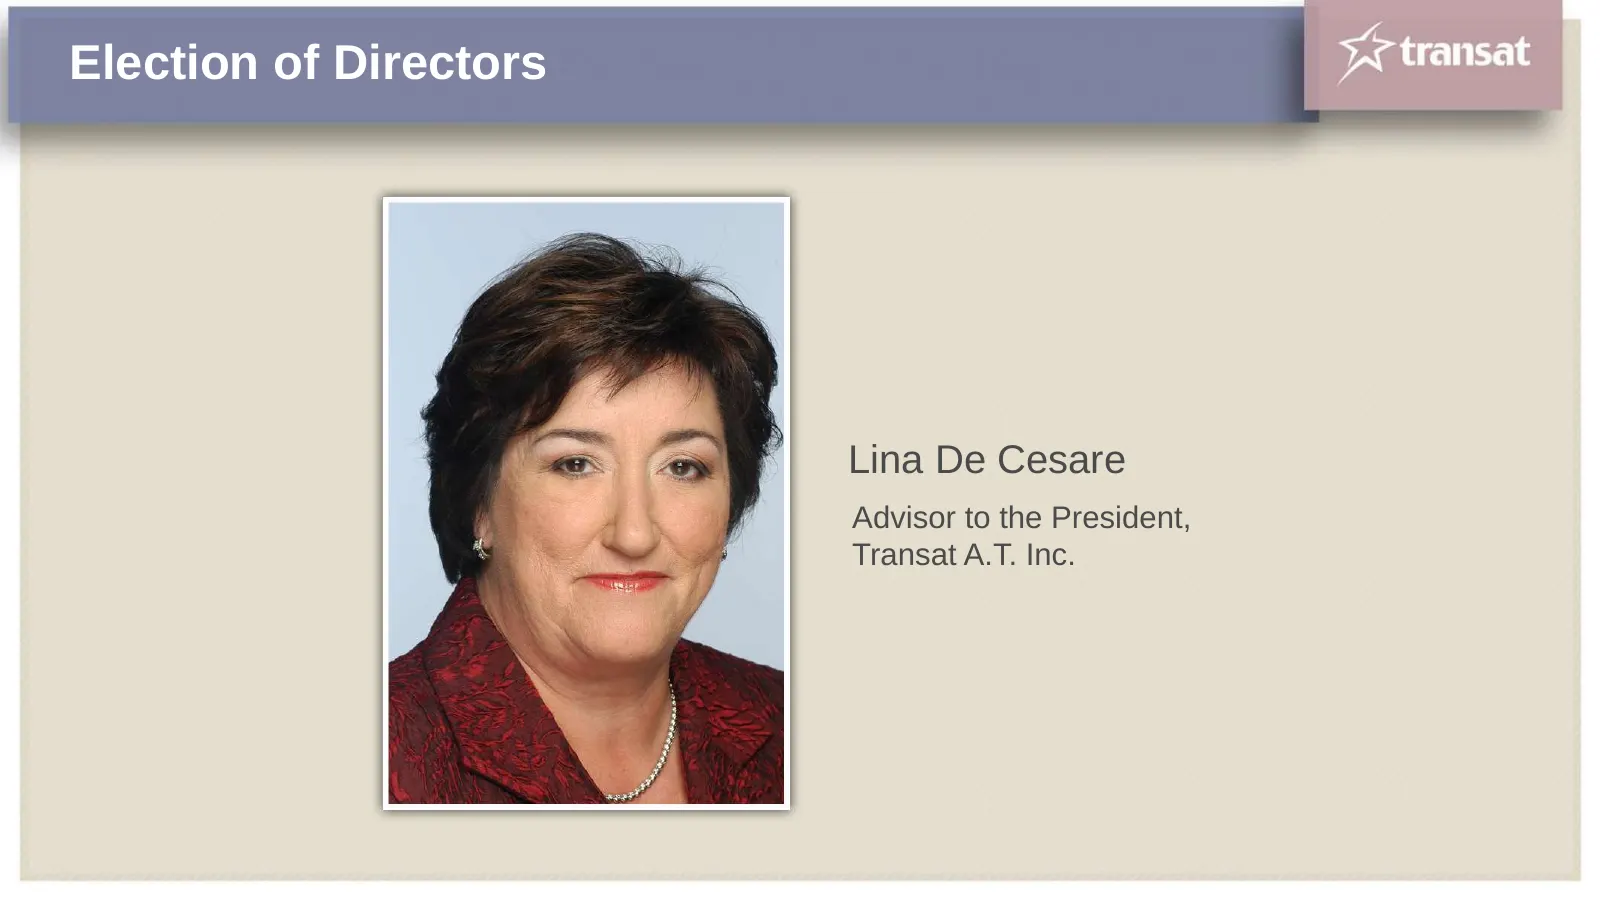
Slide 15: Election of Directors: Lina De Cesare
Election of Directors Lina De Cesare Advisor to the President, Transat A.T. Inc.
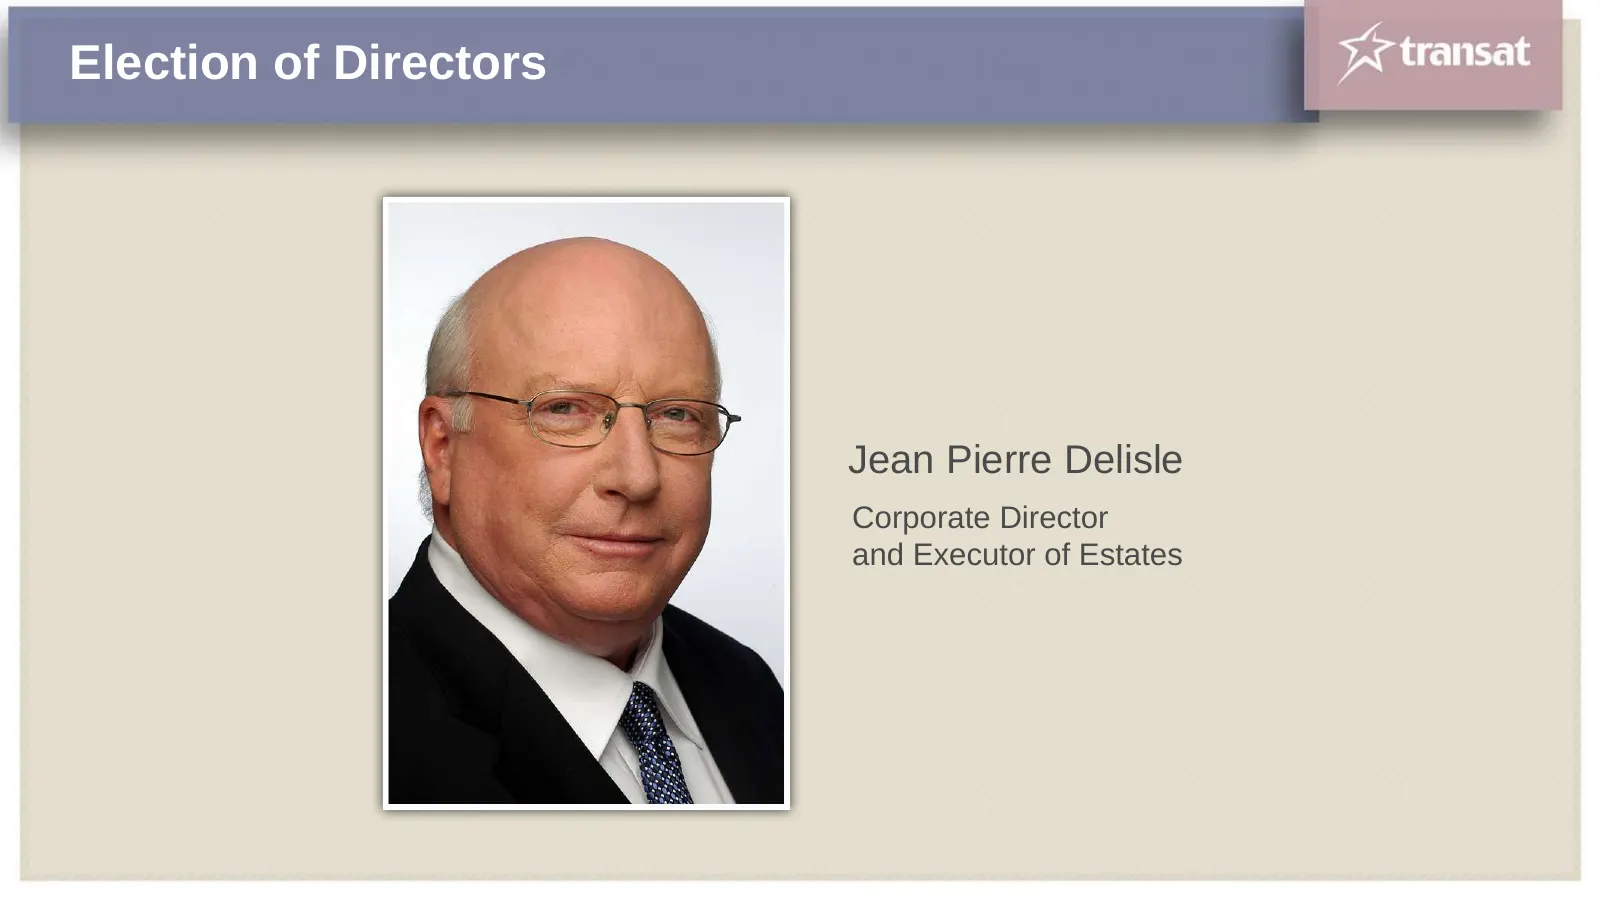
Slide 16: Election of Directors: Jean Pierre Delisle
Election of Directors Jean Pierre Delisle Corporate Director and Executor of Estates
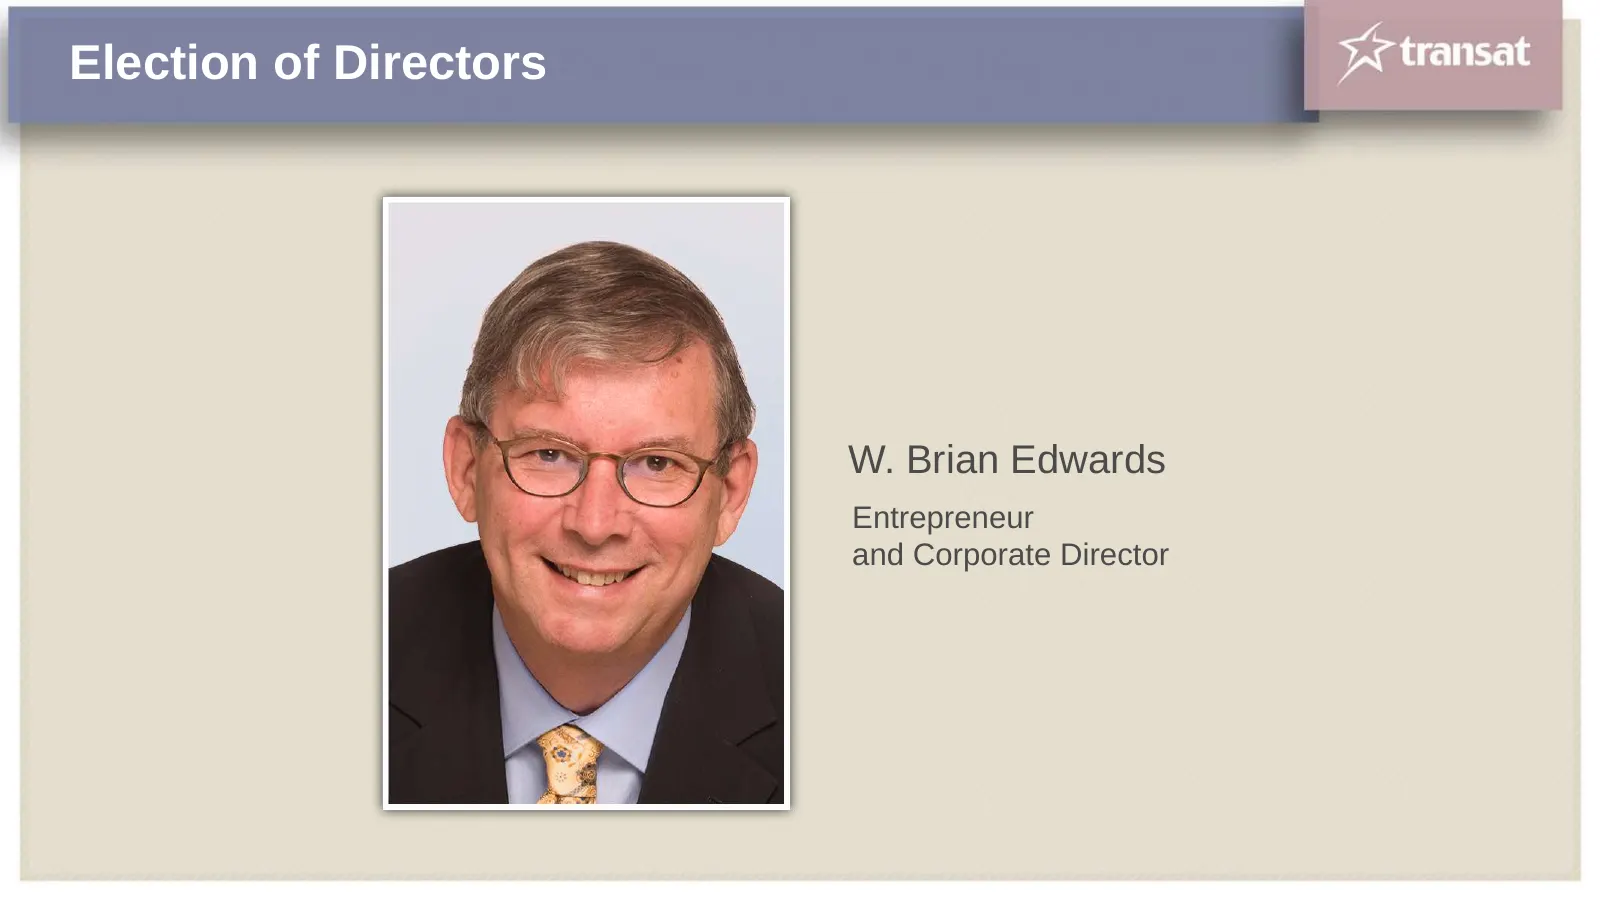
Slide 17: Election of Directors: W. Brian Edwards
Election of Directors W. Brian Edwards Entrepreneur and Corporate Director
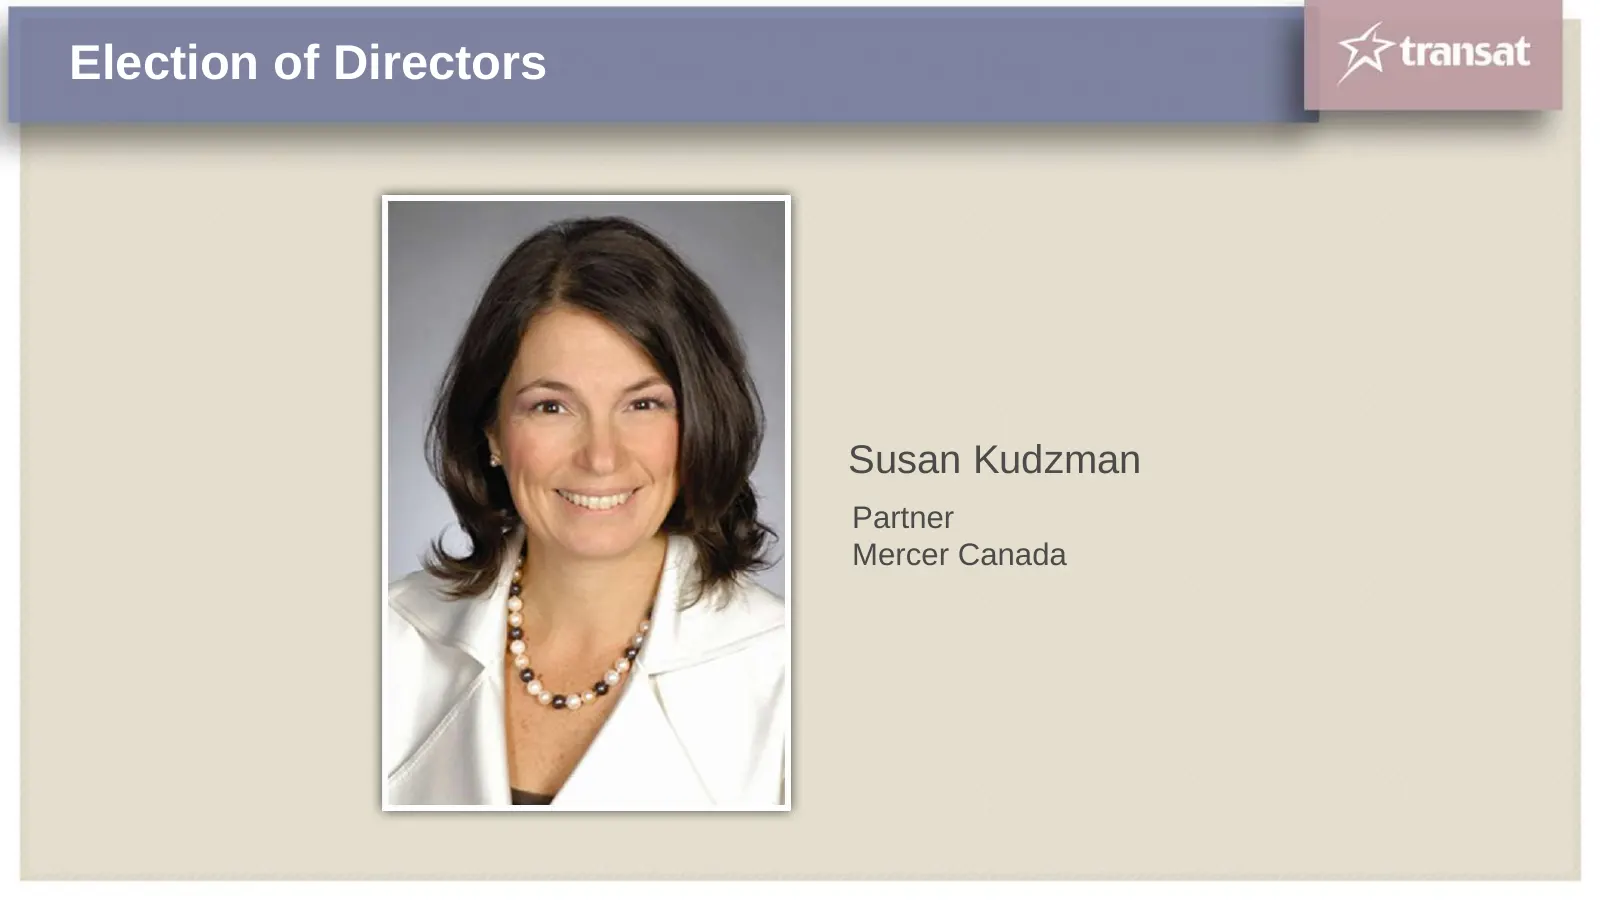
Slide 18: Election of Directors: Susan Kudzman
Election of Directors Susan Kudzman Partner Mercer Canada
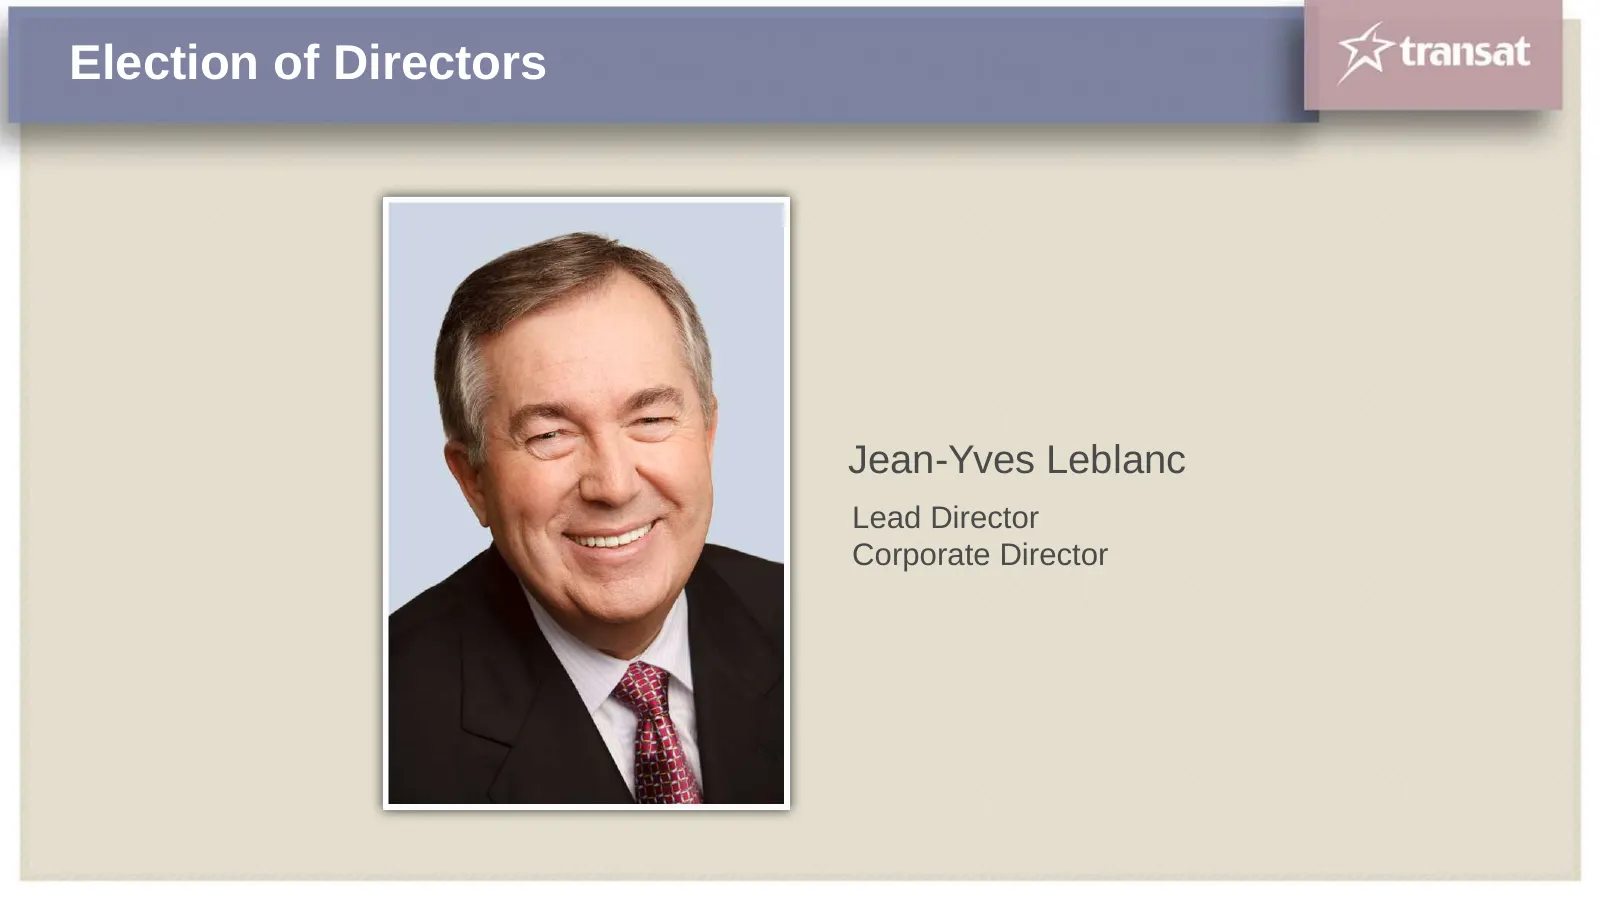
Slide 19: Election of Directors: Jean-Yves Leblanc
Election of Directors Jean-Yves Leblanc Lead Director Corporate Director
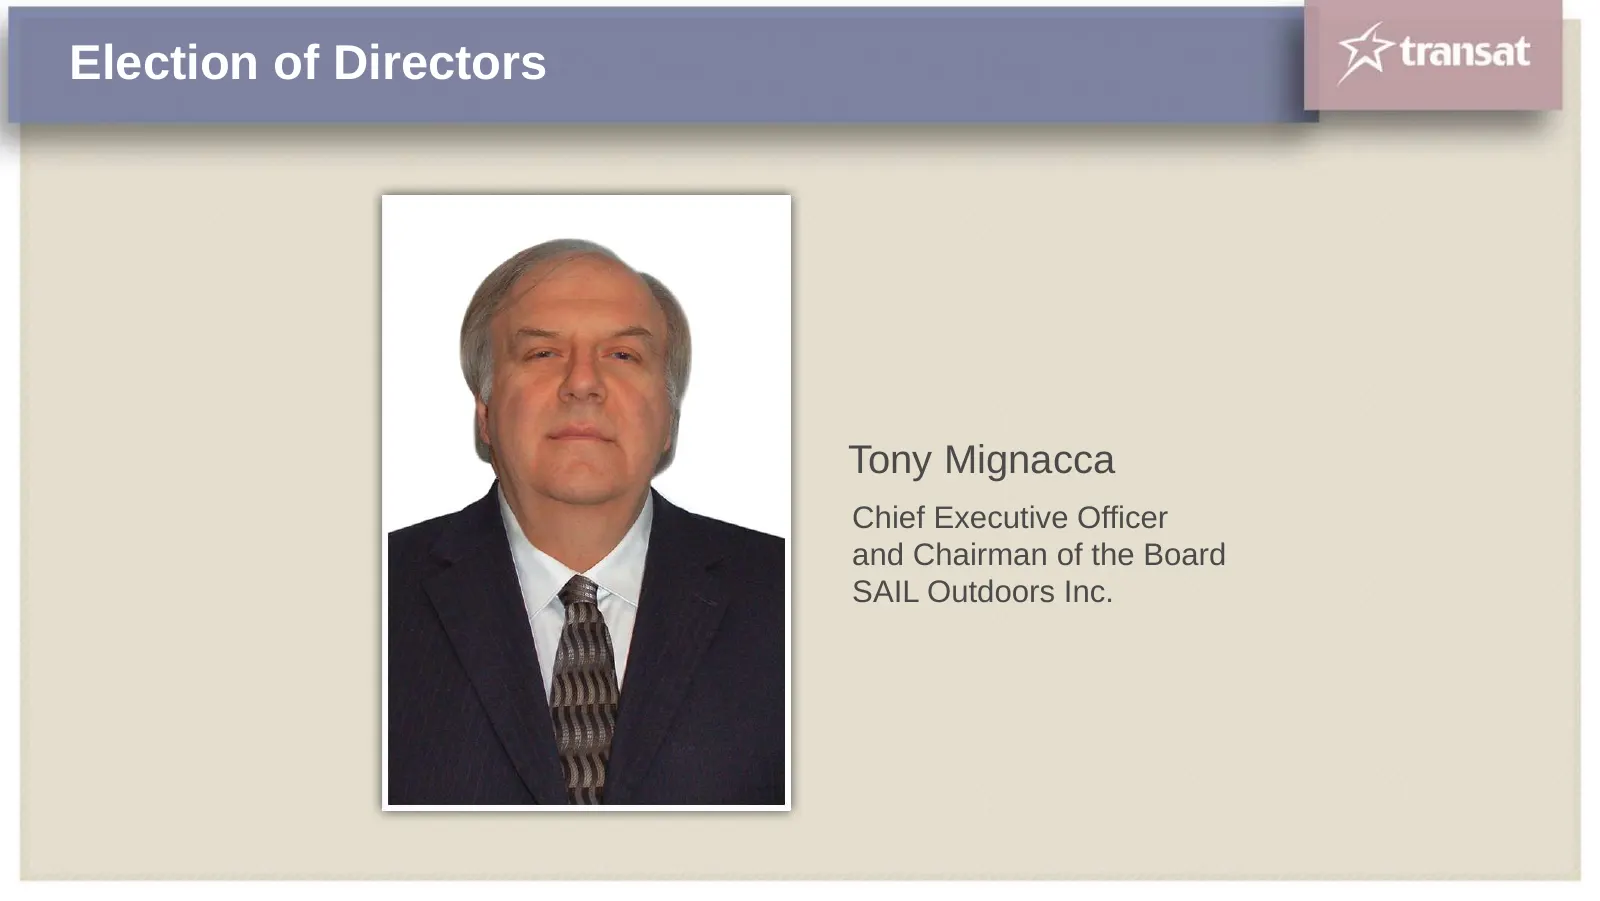
Slide 20: Election of Directors: Tony Mignacca
Election of Directors Tony Mignacca Chief Executive Officer and Chairman of the Board SAIL Outdoors Inc.
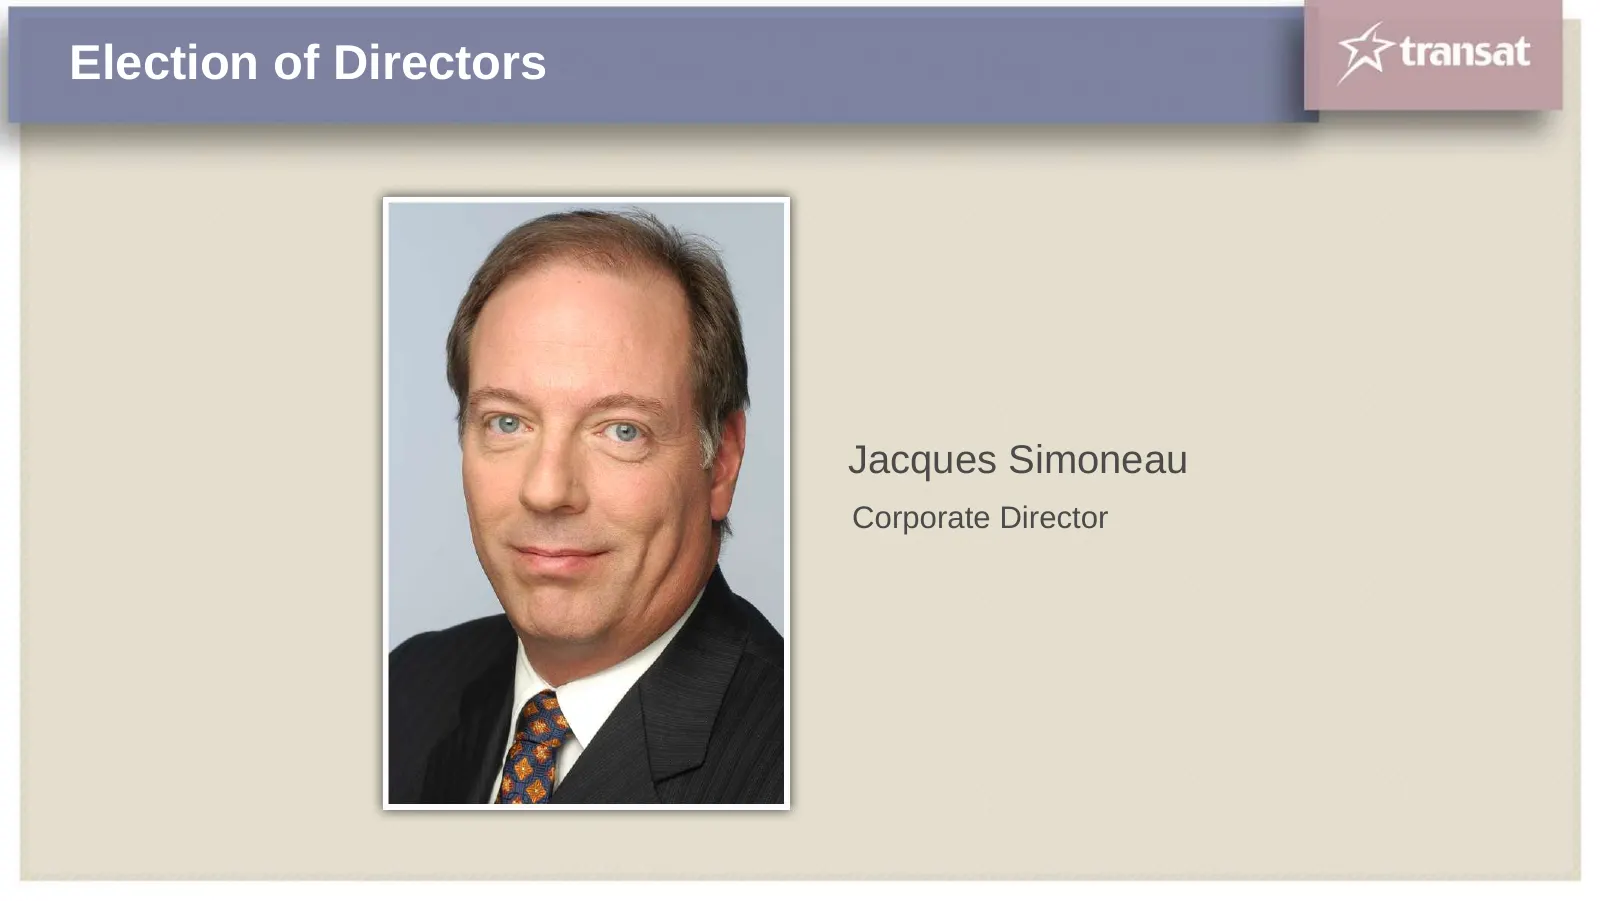
Slide 21: Election of Directors: Jacques Simoneau
Election of Directors Jacques Simoneau Corporate Director
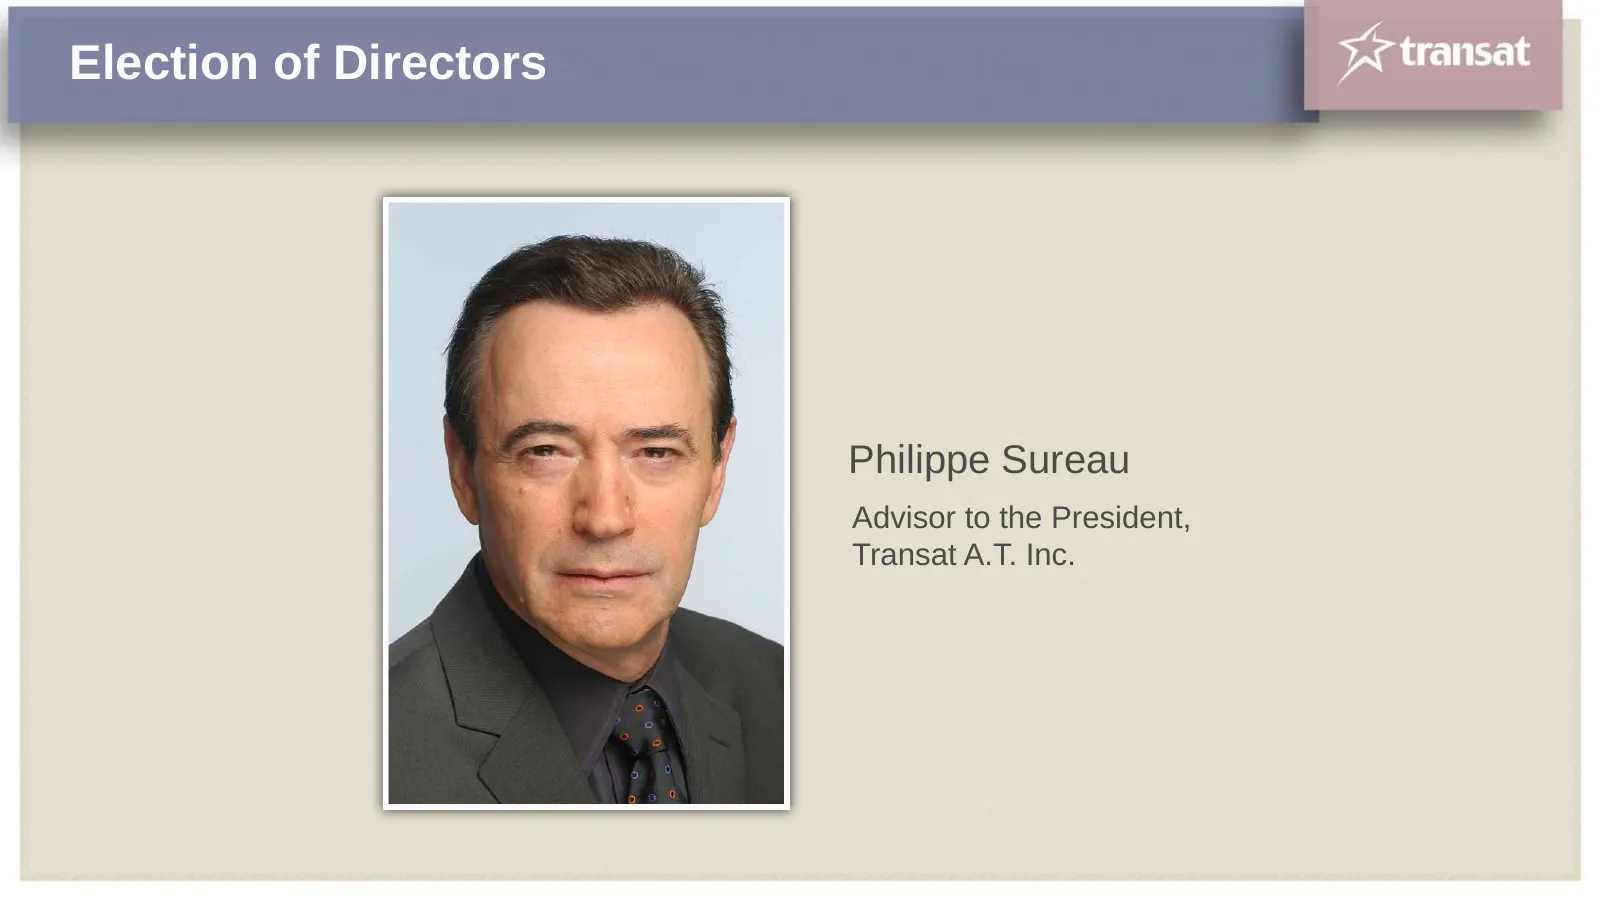
Slide 22: Election of Directors: Philippe Sureau
Election of Directors Philippe Sureau Advisor to the President, Transat A.T. Inc.
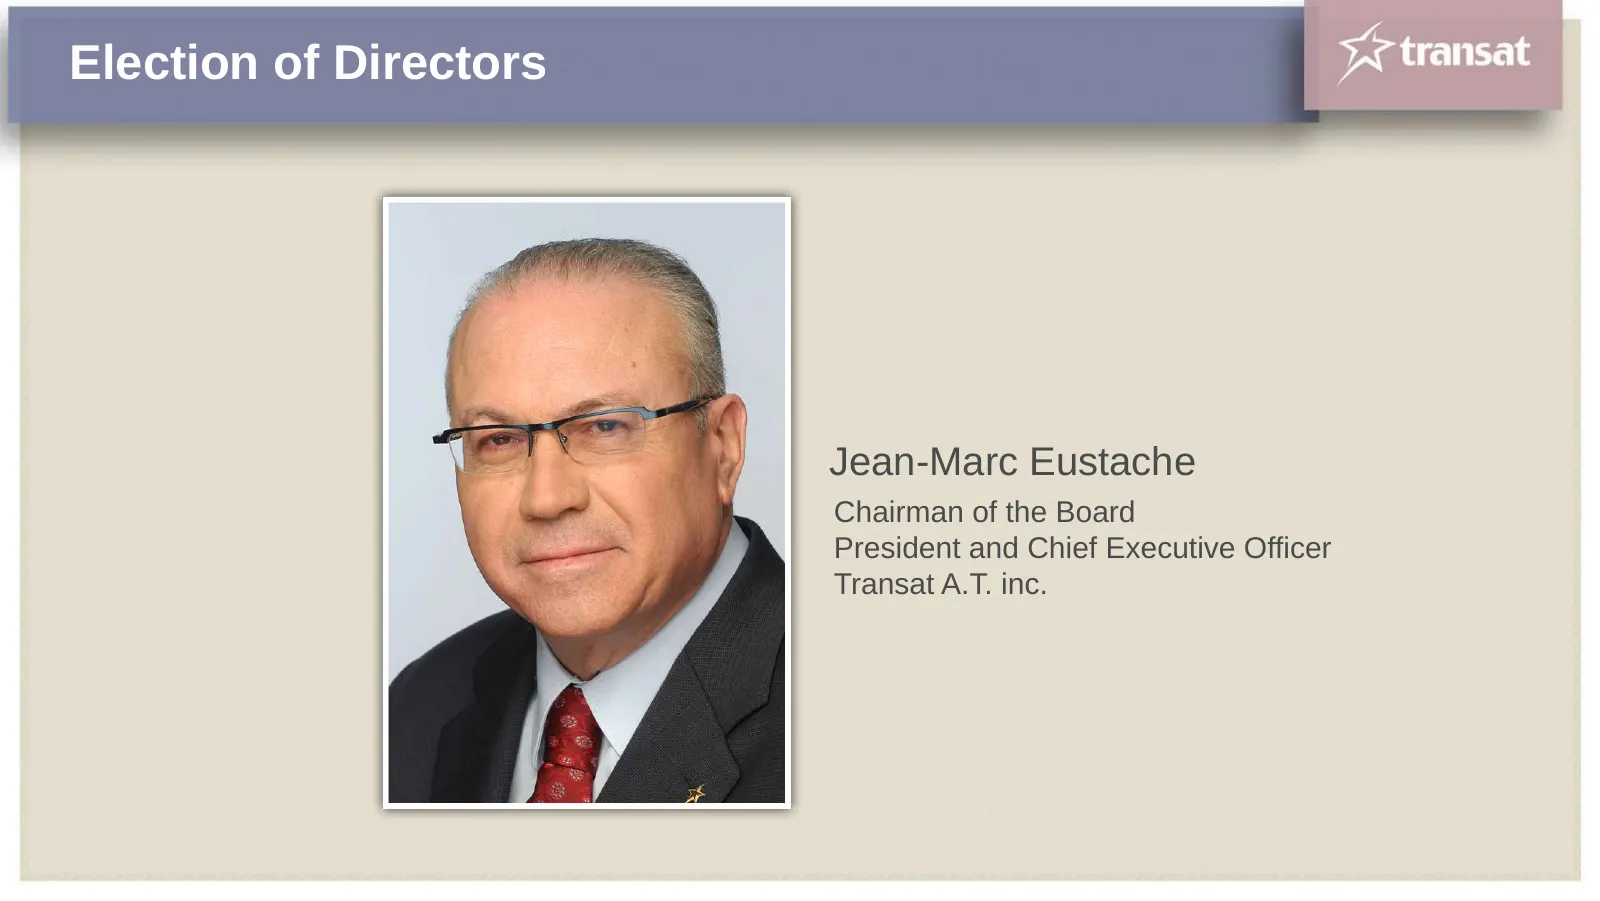
Slide 23: Election of Directors: Jean-Marc Eustache
Election of Directors Jean-Marc Eustache Chairman of the Board President and Chief Executive Officer Transat A.T. inc.

Slide 24: Election of Directors
ve transat Annual and Special Meeting of Shareholders 2014

Slide 25: Appointment of Auditors
ve transat Annual and Special Meeting of Shareholders 2014
Slide 26: Resolution: Shareholder Rights Plan
RESOLUTION: SHAREHOLDER RIGHTS PLAN

Slide 27: Resolution: Executive Compensation
RESOLUTION: EXECUTIVE COMPENSATION

Slide 28: Jean-Marc Eustache, President and CEO
Jean-Marc Eustache President and Chief Executive Officer
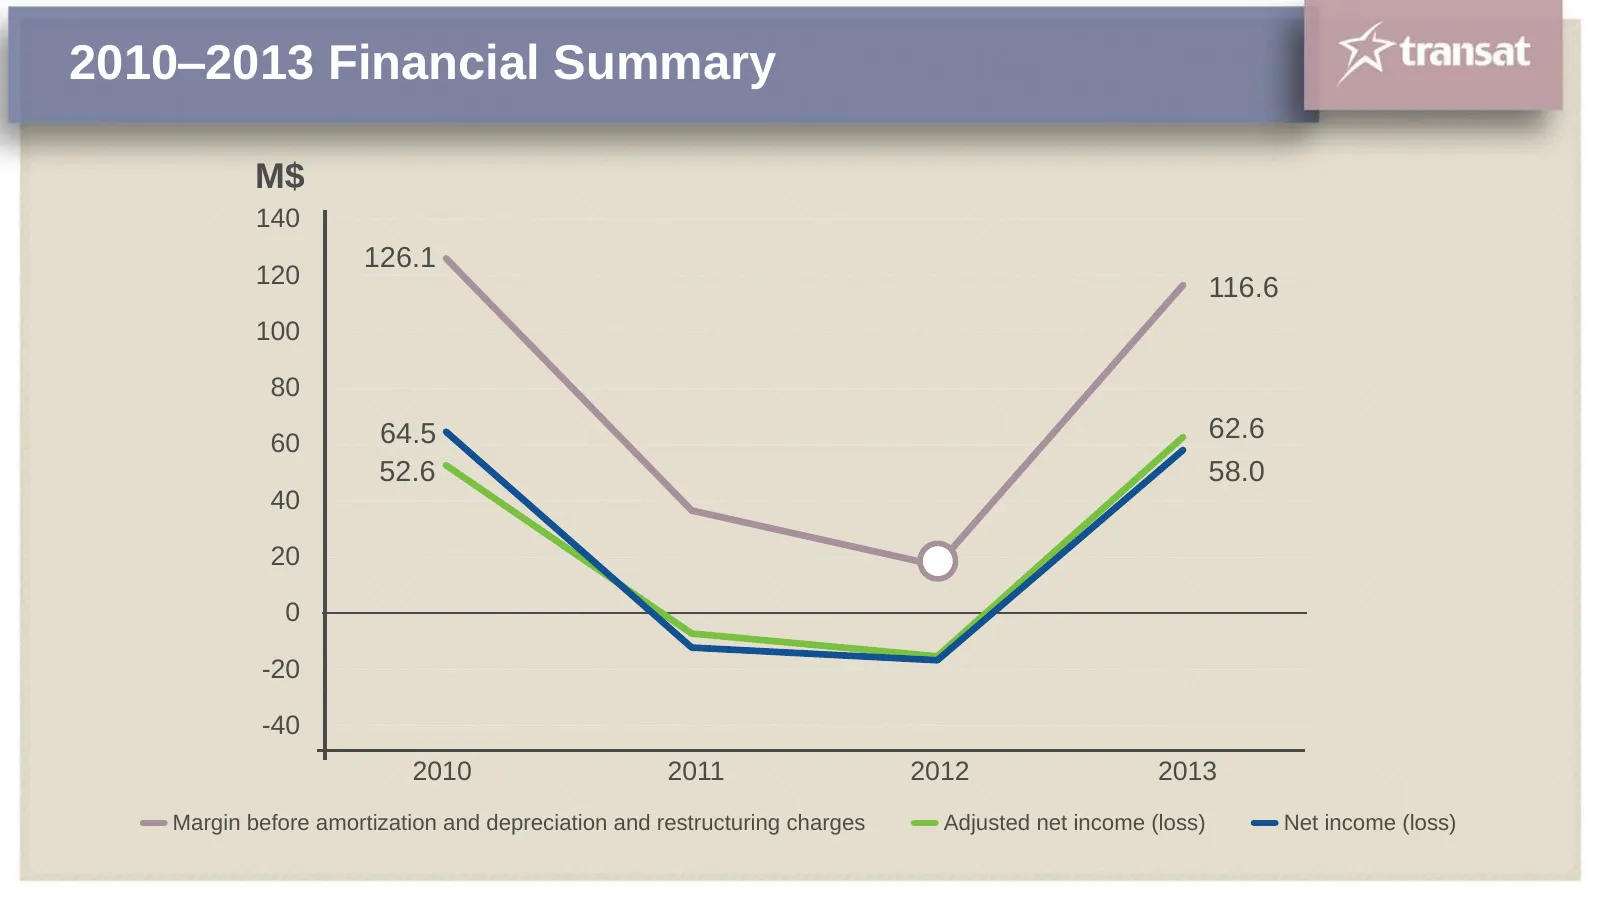
Slide 29: 2010–2013 Financial Summary
2010–2013 Financial Summary M$ 140 126.1 120 116.6 100 80 60 64.5 62.6 52.6 58.0 40 20 0 -20 -40 2010 2011 2012 2013 Margin before amortization and depreciation and restructuring charges Adjusted net income (loss) Net income (loss)
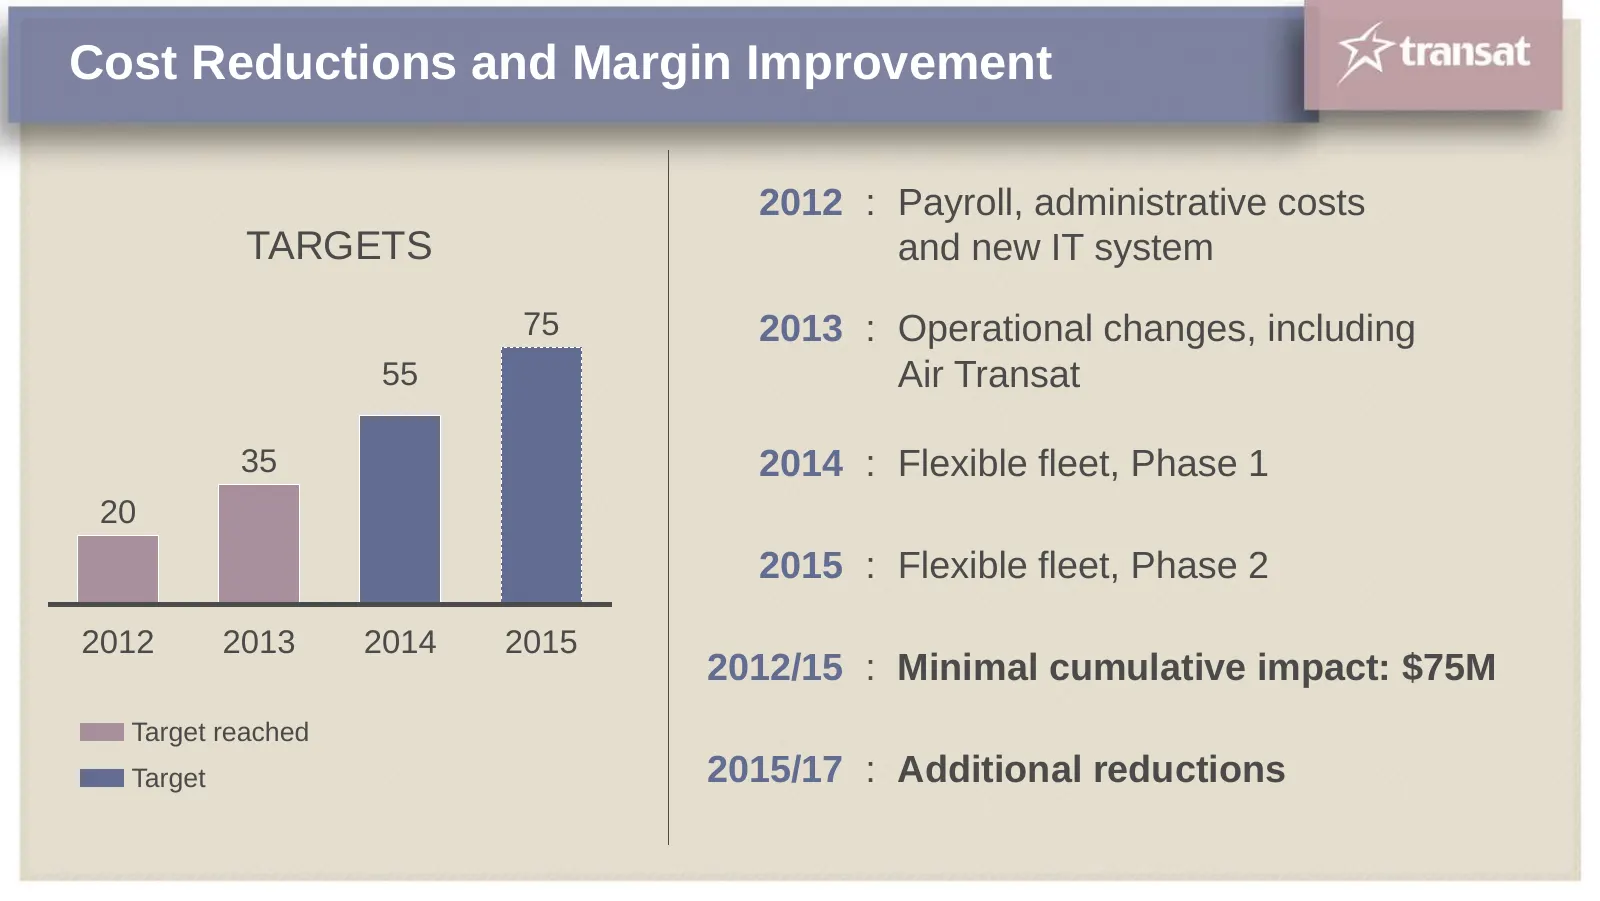
Slide 30: Cost Reductions and Margin Improvement
Cost Reductions and Margin Improvement 2012 : Payroll, administrative costs TARGETS and new IT system 75 2013 : Operational changes, including 55 Air Transat 35 2014 : Flexible fleet, Phase 1 20 2015 : Flexible fleet, Phase 2 2012 2013 2014 2015 2012/15 : Minimal cumulative impact: $75M Target reach
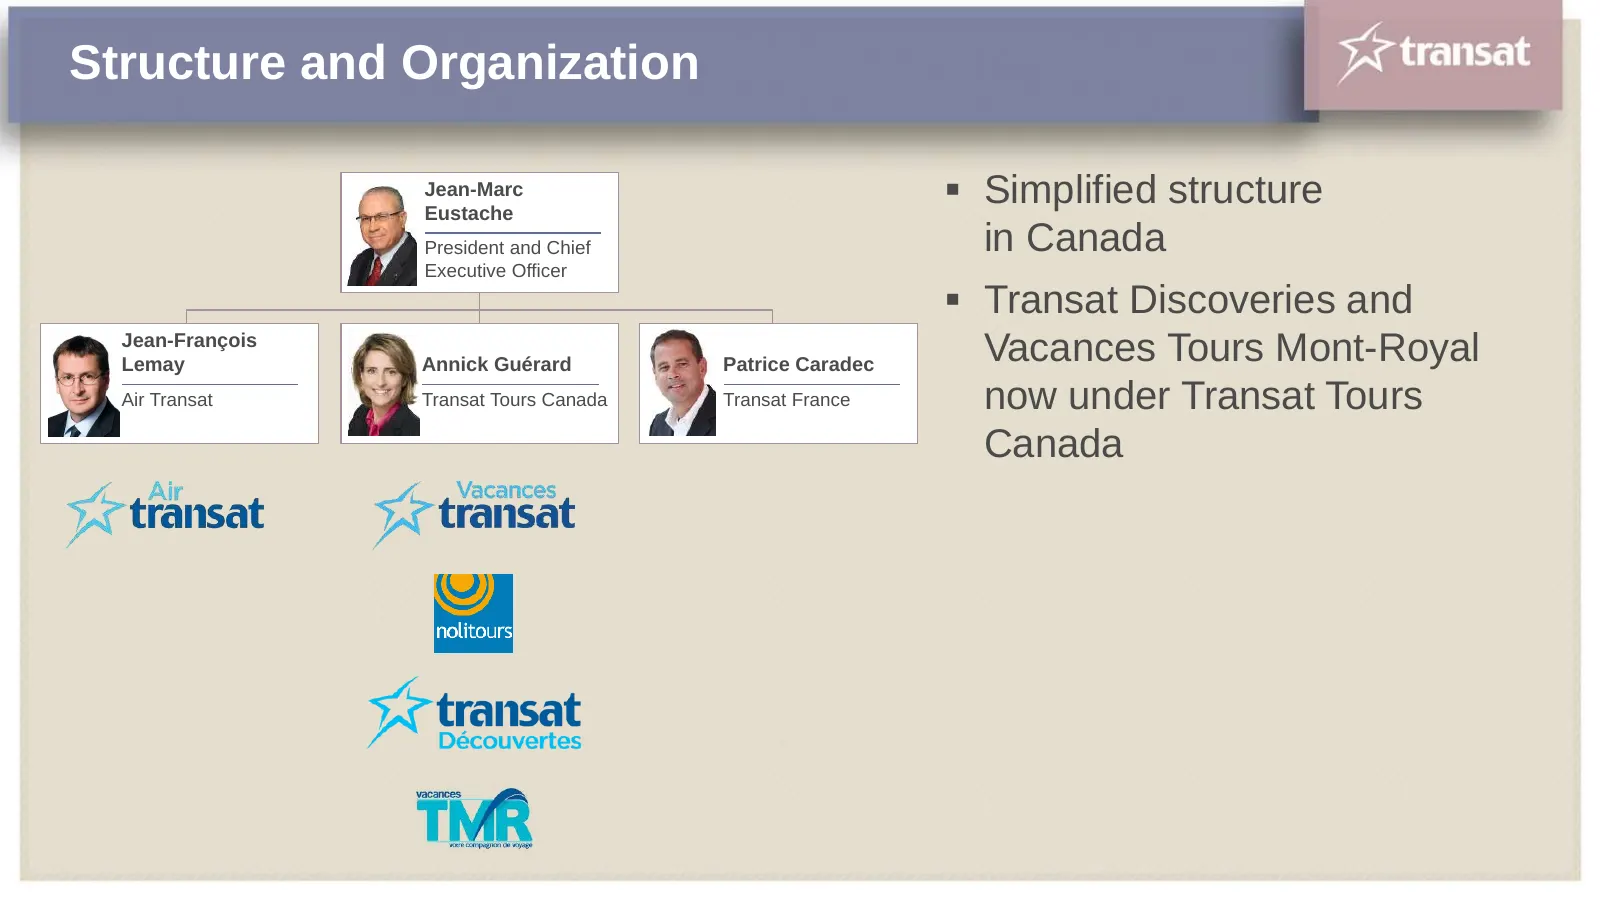
Slide 31: Structure and Organization
Structure and Organization Jean-Marc Eustache Simplified structure President and Chief in Canada Executive Officer Transat Discoveries and Jean-François Lemay Annick Guérard Patrice Caradec Vacances Tours Mont-Royal Air Transat Transat Tours Canada Transat France now under Transat Tours Canada
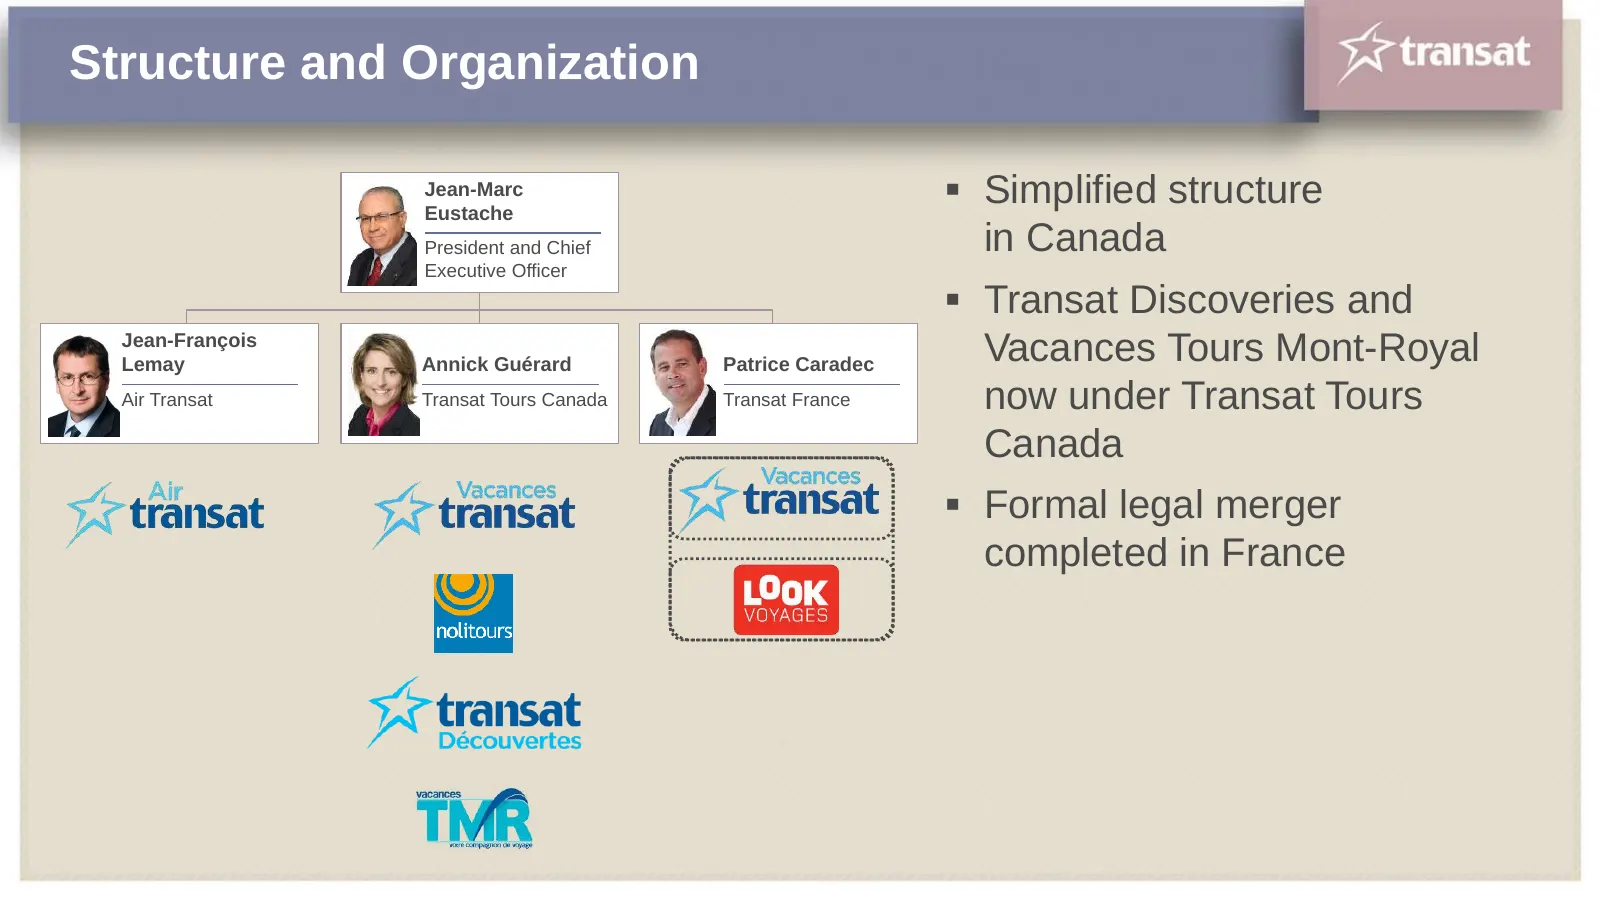
Slide 32: Structure and Organization
Structure and Organization Jean-Marc Eustache Simplified structure President and Chief in Canada Executive Officer Transat Discoveries and Jean-François Lemay Annick Guérard Patrice Caradec Vacances Tours Mont-Royal Air Transat Transat Tours Canada Transat France now under Transat Tours Canada
Slide 33: Structure and Organization
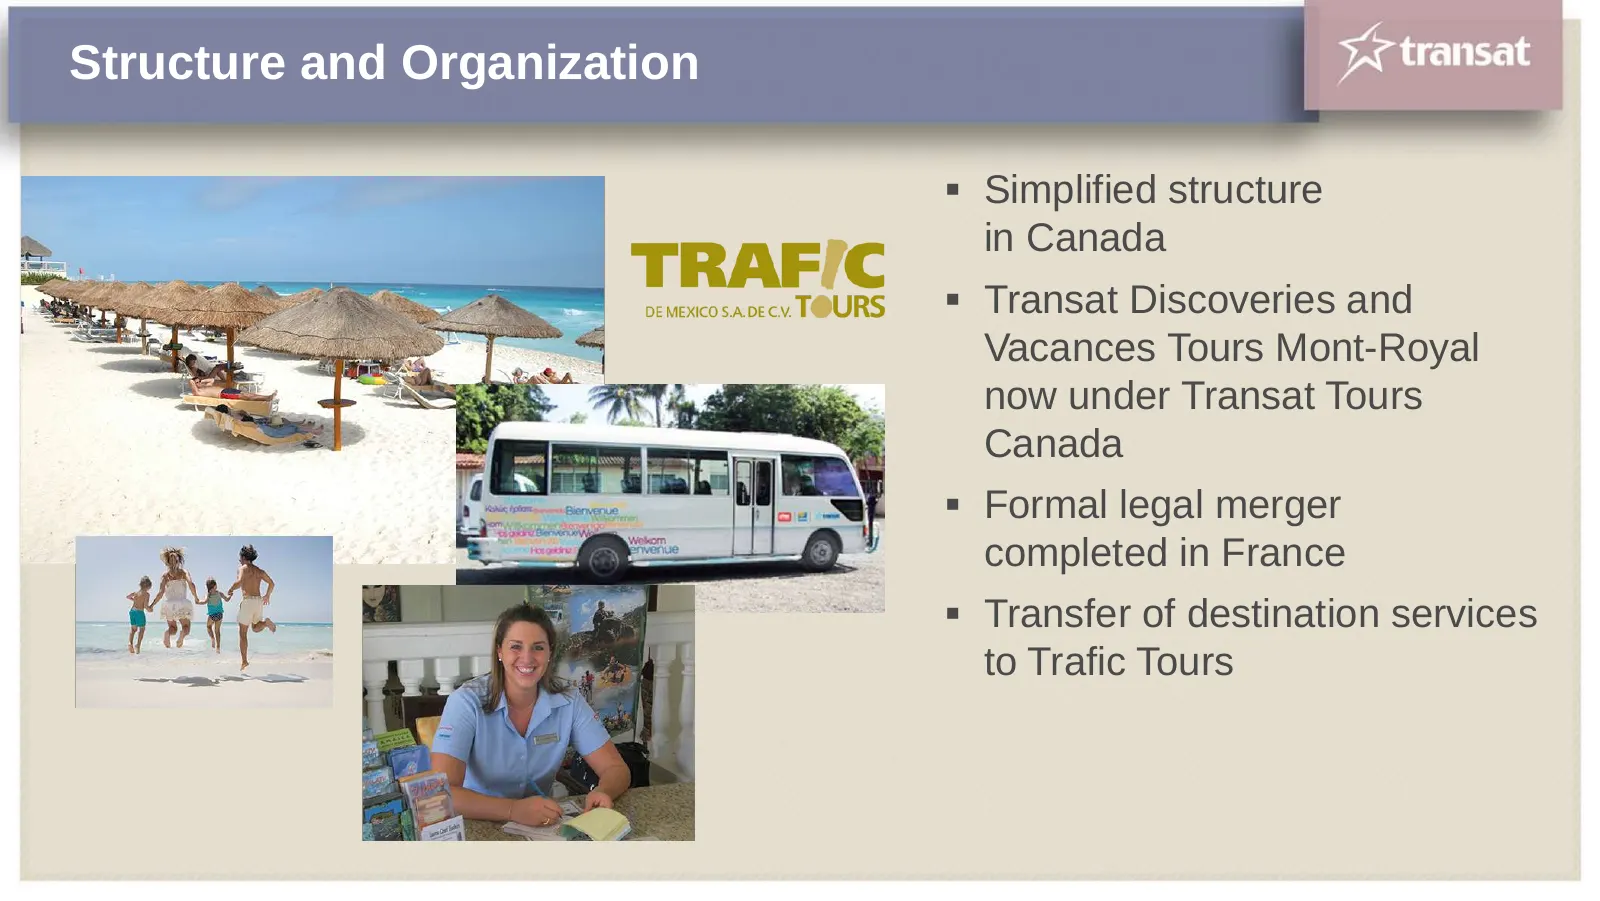
Structure and Organization Simplified structure in Canada Transat Discoveries and Vacances Tours Mont-Royal now under Transat Tours Canada Formal legal merger completed in France Transfer of destination services to Trafic Tours
Slide 34: Structure and Organization
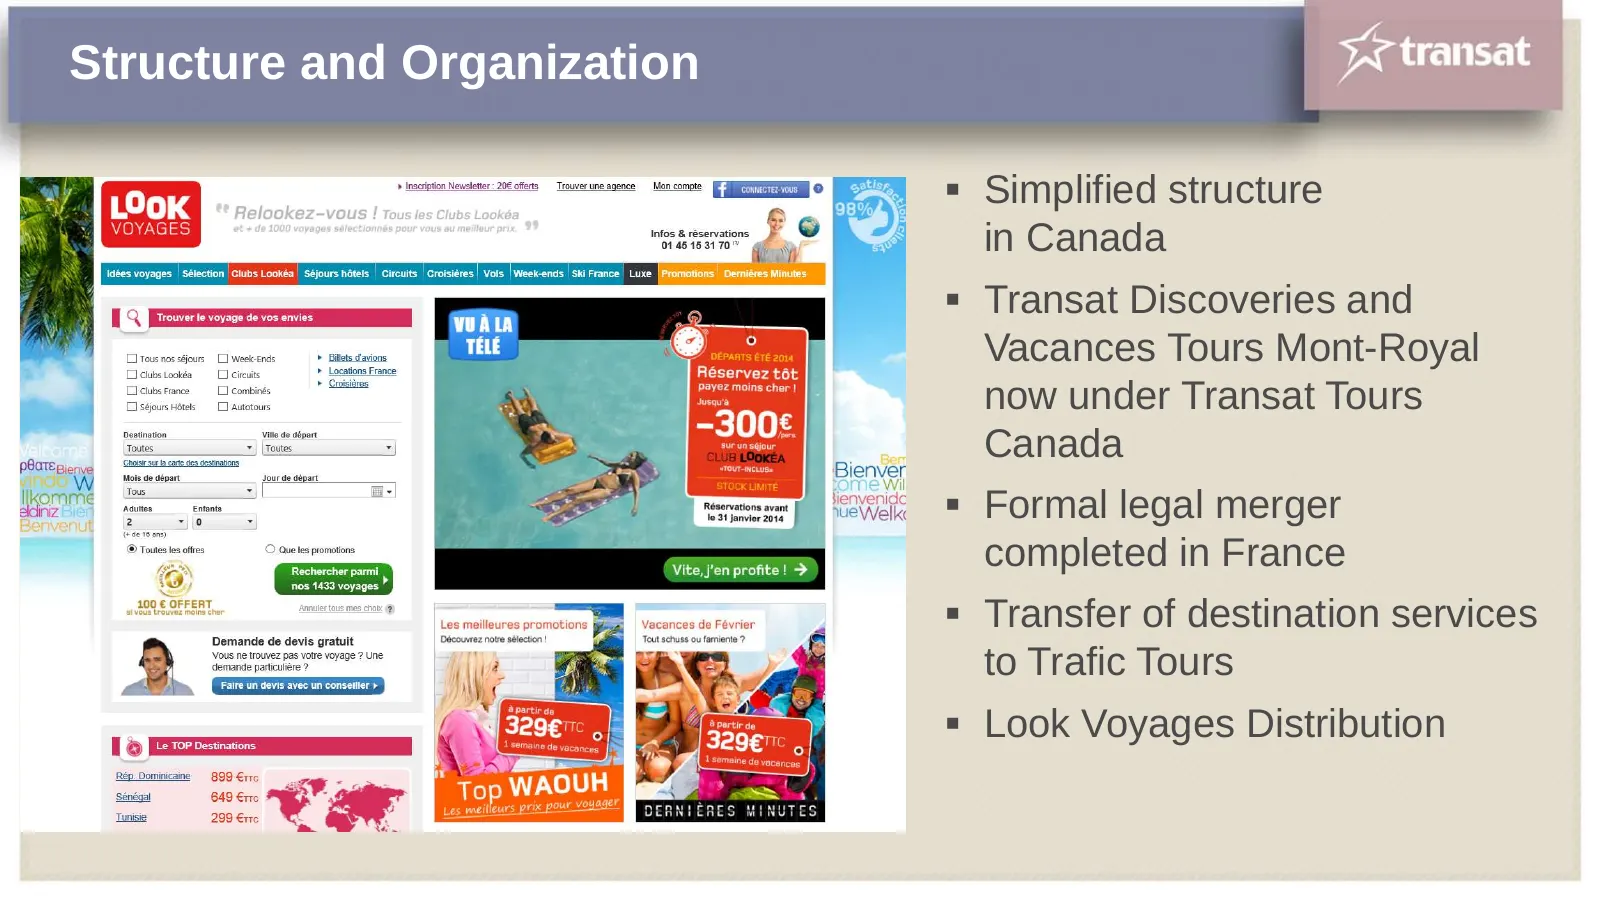
Structure and Organization Simplified structure in Canada Transat Discoveries and Vacances Tours Mont-Royal now under Transat Tours Canada Formal legal merger completed in France Transfer of destination services to Trafic Tours Look Voyages Distribution
Slide 35: Structure and Organization
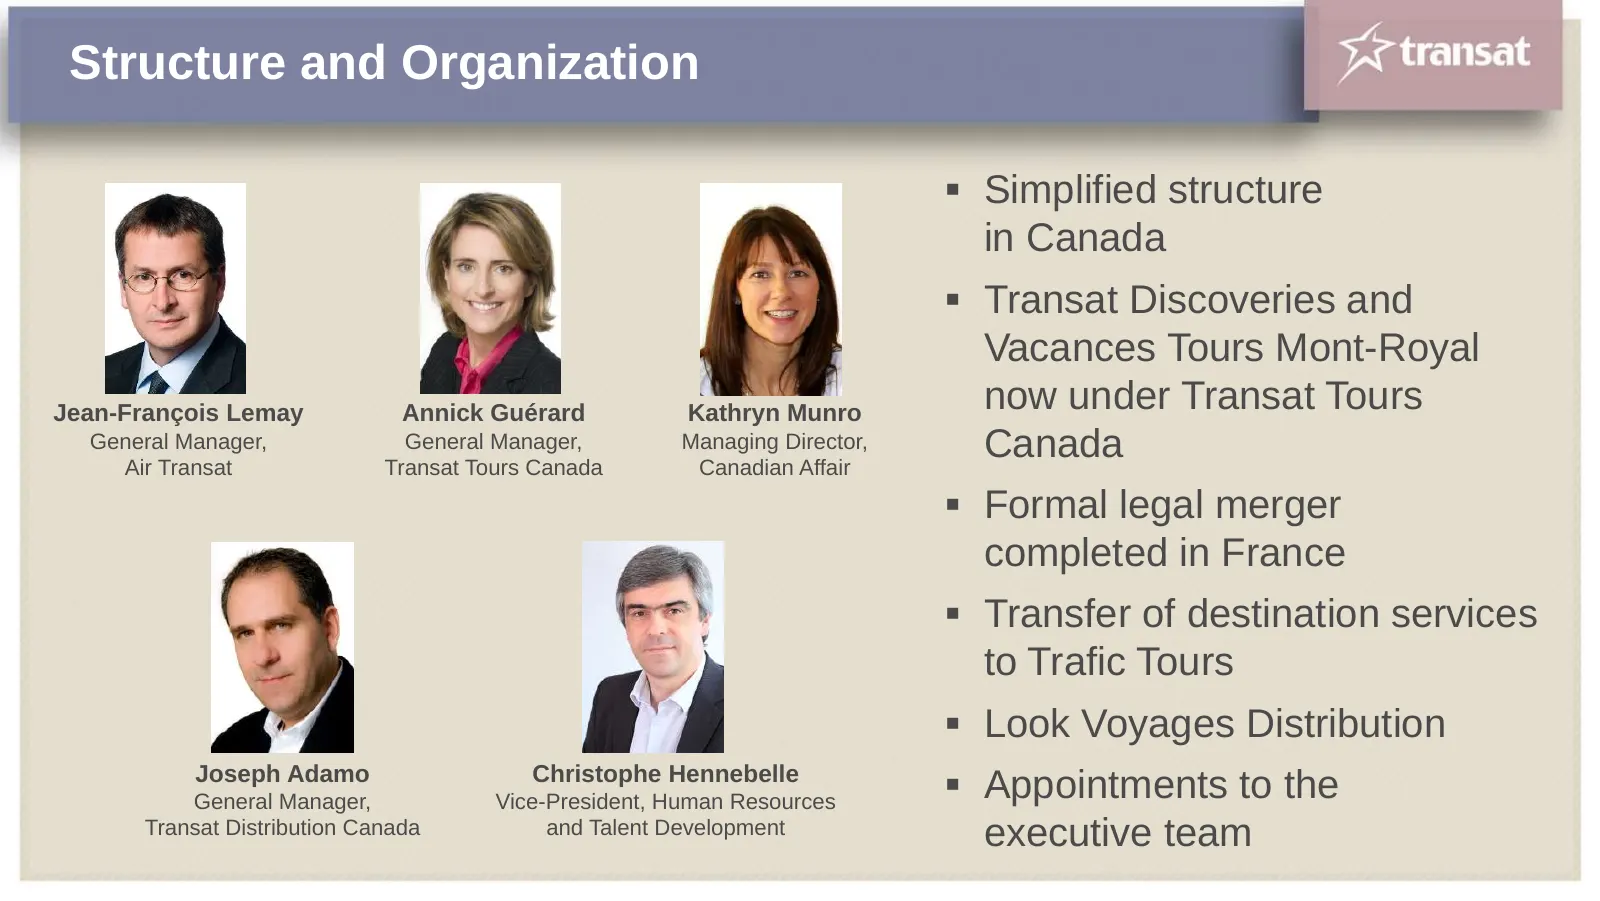
Structure and Organization Simplified structure in Canada Transat Discoveries and Vacances Tours Mont-Royal Jean-François Lemay Annick Guérard Kathryn Munro now under Transat Tours General Manager, Air Transat General Manager, Transat Tours Canada Managing Director, Canadian Affair Canada Form
Slide 36: Air Transat: Flexible Fleet
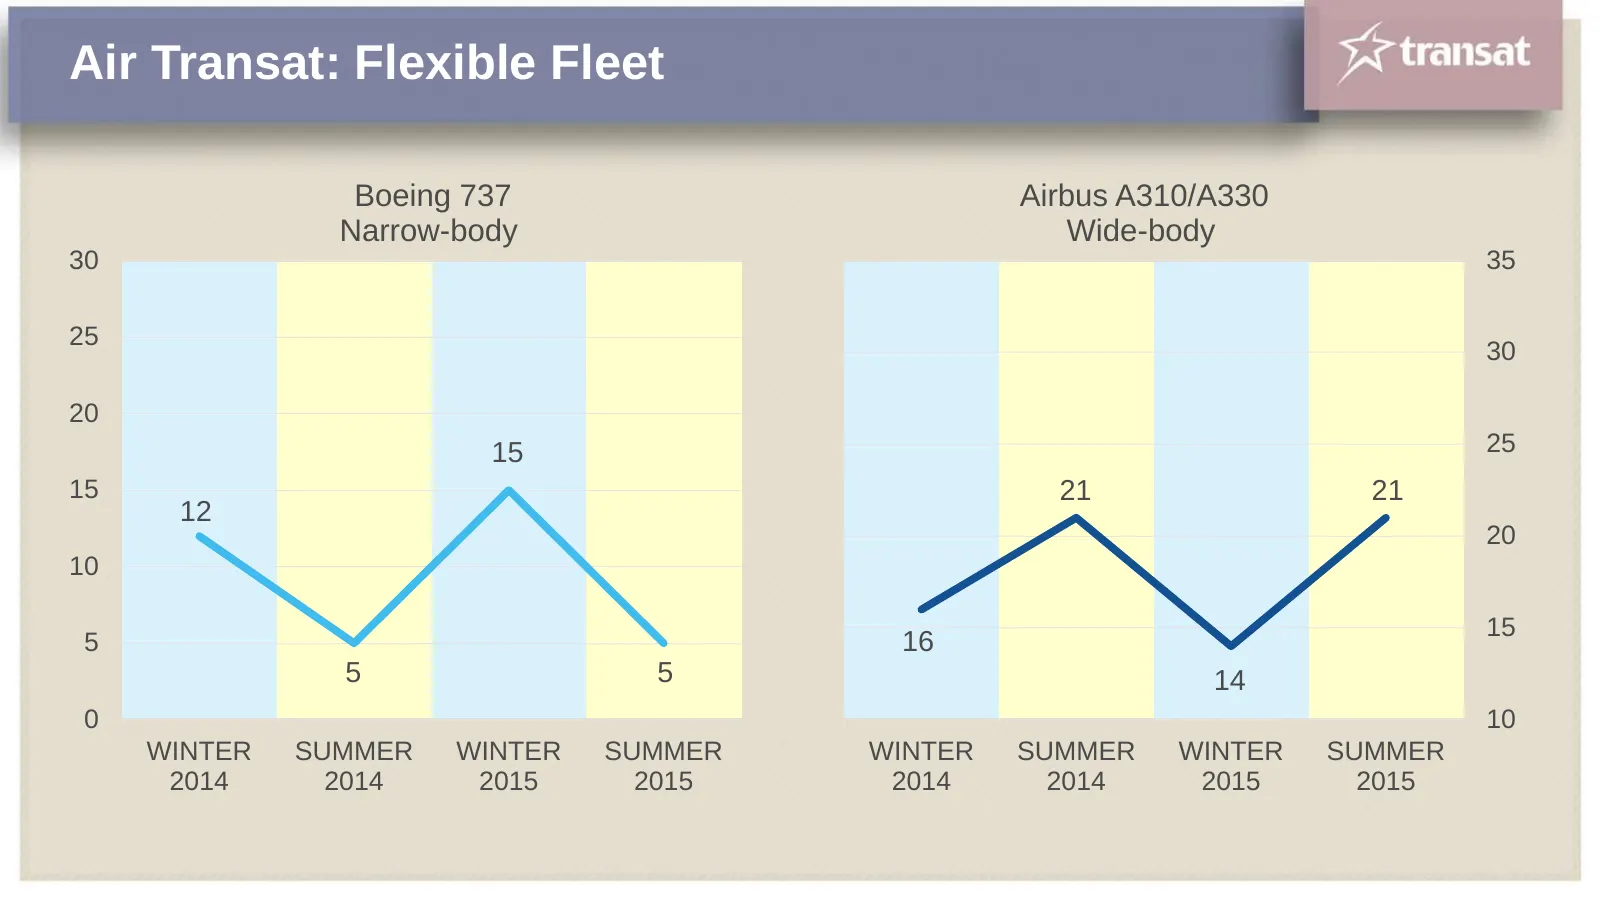
Air Transat: Flexible Fleet Boeing 737 Airbus A310/A330 Narrow-body Wide-body 30 35 25 30 20 15 25 15 21 21 12 20 10 15 5 16 5 5 14 0 10 WINTER SUMMER WINTER SUMMER WINTER SUMMER WINTER SUMMER 2014 2014 2015 2015 2014 2014 2015 2015
Slide 37: Air Transat: Flexible Fleet
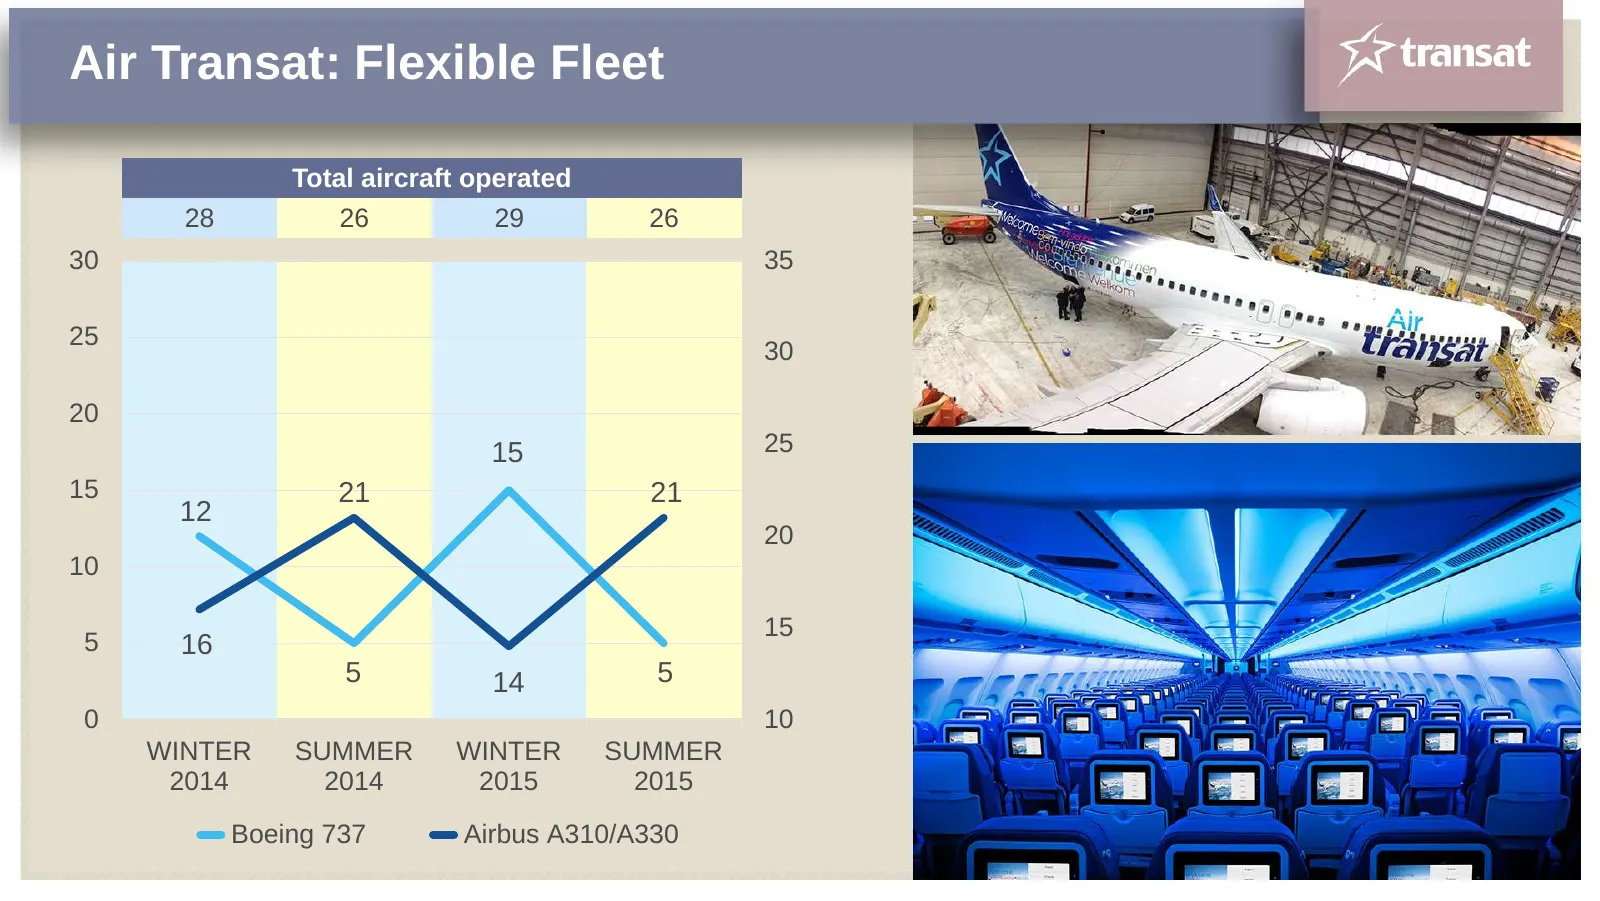
Air Transat: Flexible Fleet Total aircraft operated 28 26 29 26 30 35 25 30 20 15 25 15 21 21 12 20 10 15 5 16 5 14 5 0 10 WINTER SUMMER WINTER SUMMER 2014 2014 2015 2015 Boeing 737 Airbus A310/A330
Slide 38: Two Seasons, Three Markets
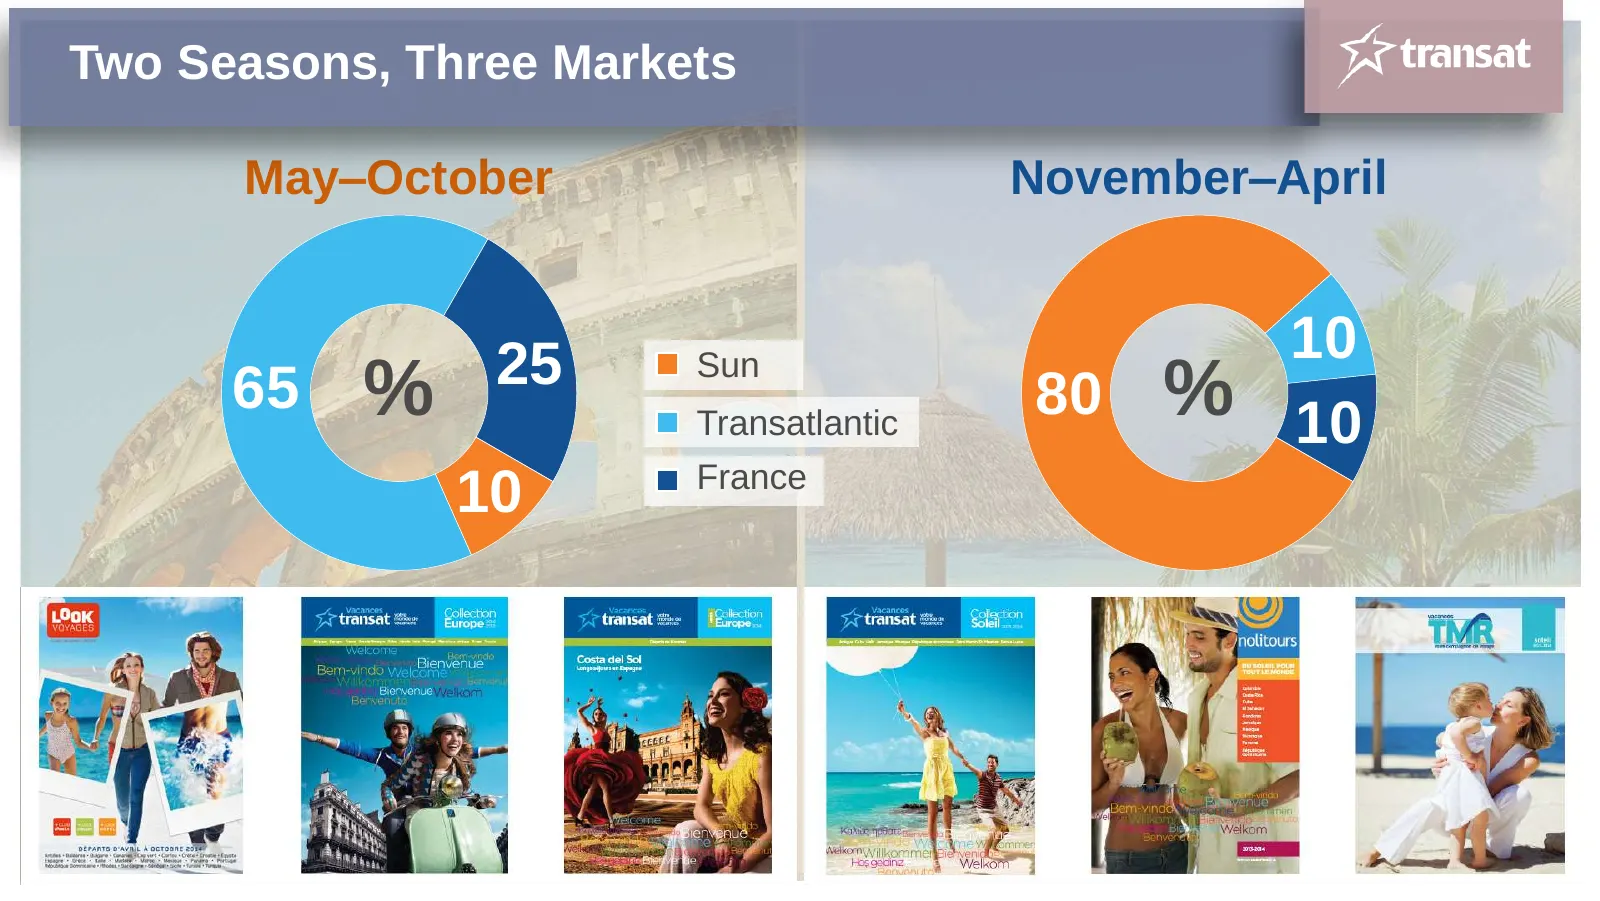
Two Seasons, Three Markets May–October November–April 25 Sun 10 65 % Transatlantic 80 % 10 France 10
Slide 39: Sun Destinations Outbound from Canada
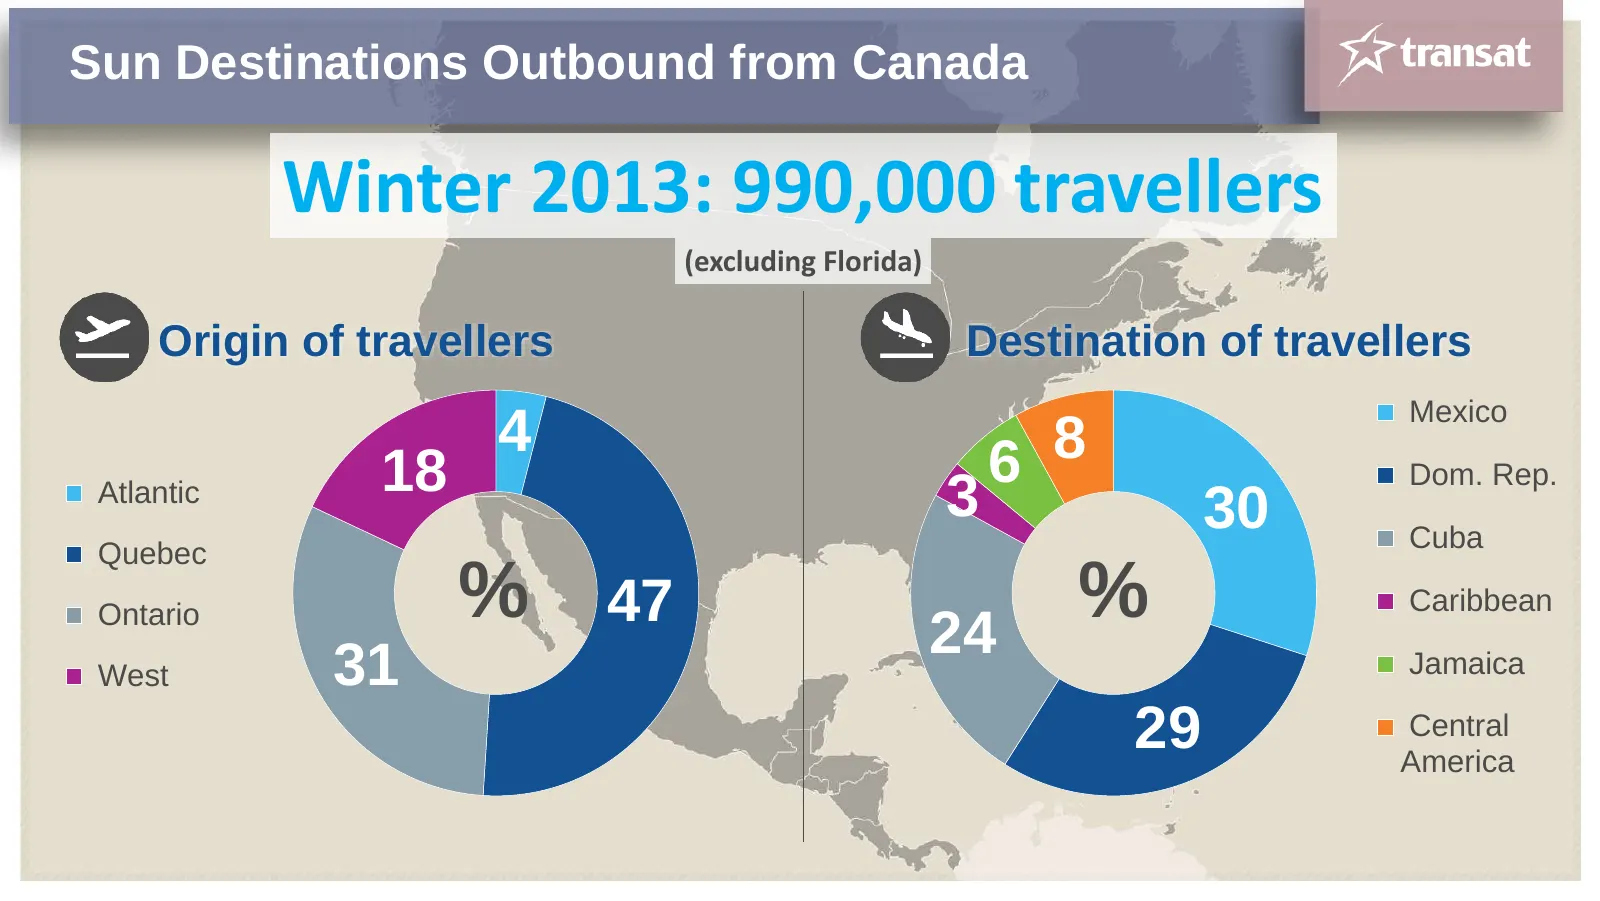
Sun Destinations Outbound from Canada Winter 2013: 990,000 travellers (excluding Florida) Origin of travellers Destination of travellers Mexico 4 8 18 6 Dom. Rep. Atlantic 3 30 Cuba Quebec Ontario % 47 24 % Caribbean West 31 Jamaica 29 Central America
Slide 40: Capacity and Market Share
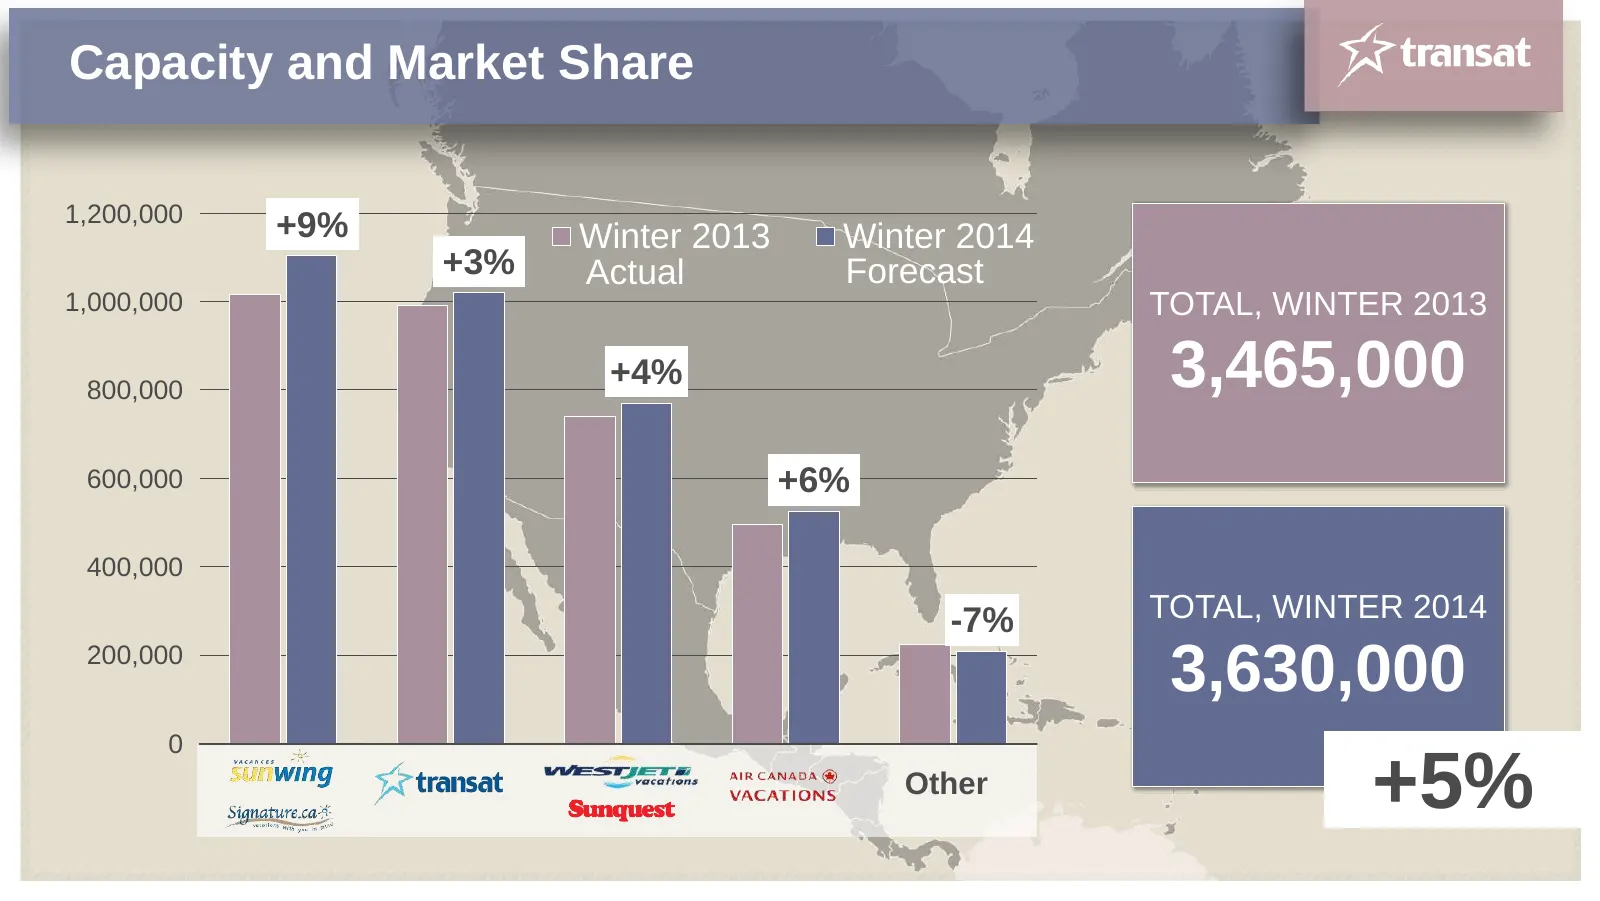
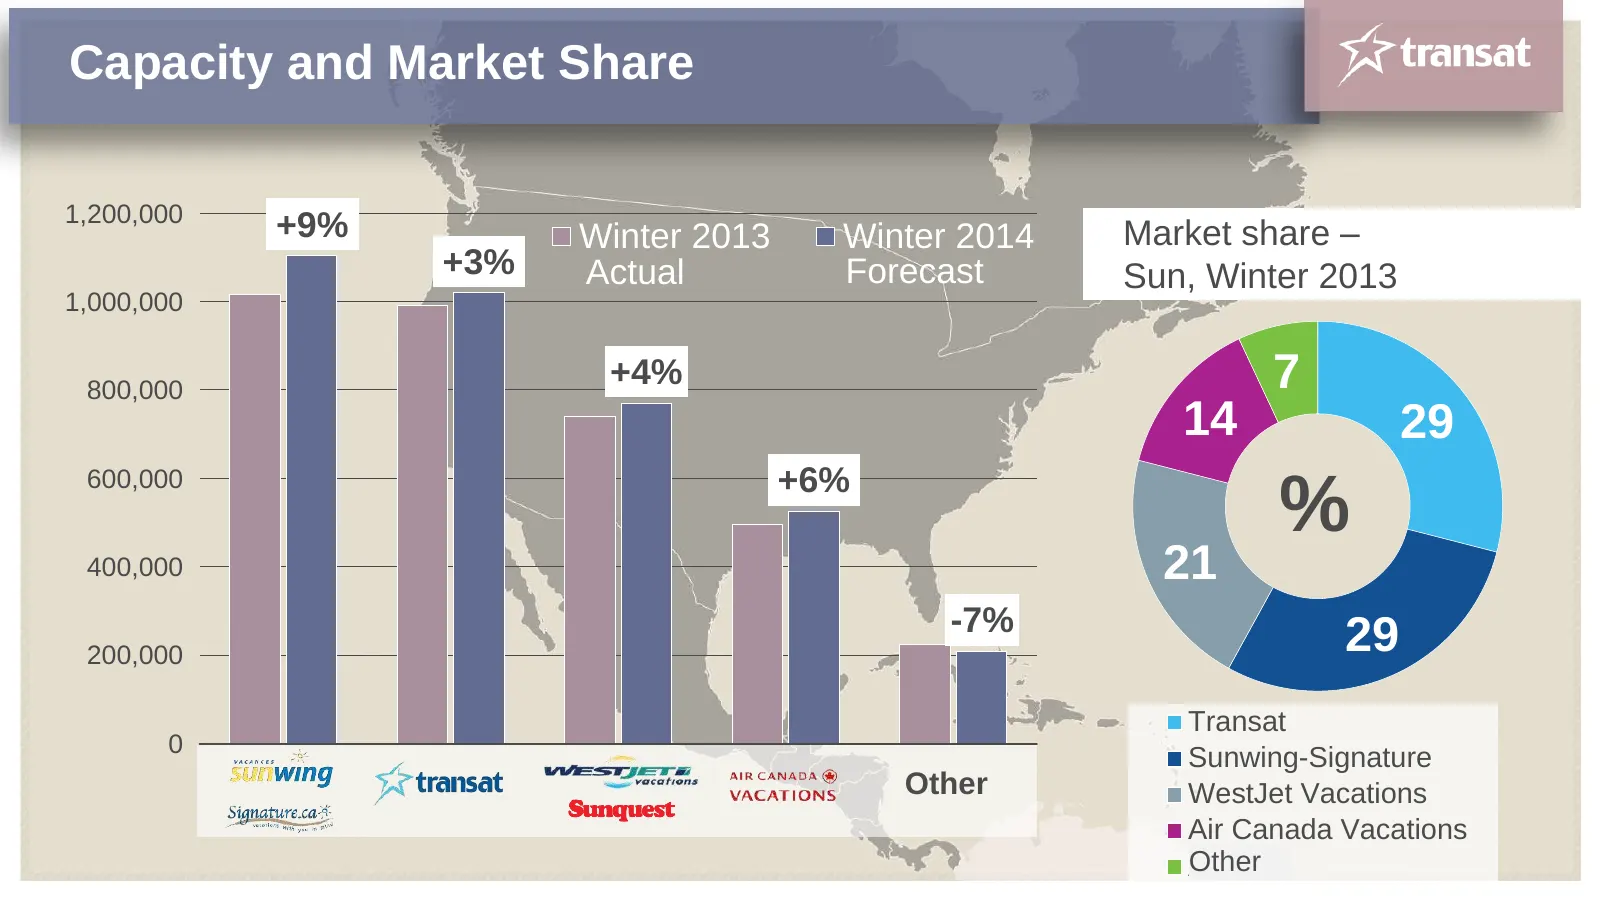
Capacity and Market Share 1,200,000 +9% Winter 2013 Winter 2014 +3% Actual Forecast 1,000,000 TOTAL, WINTER 2013 800,000 +4% 3,465,000 600,000 +6% 400,000 -7% TOTAL, WINTER 2014 200,000 3,630,000 0 Other +5%
Slide 41: Capacity and Market Share
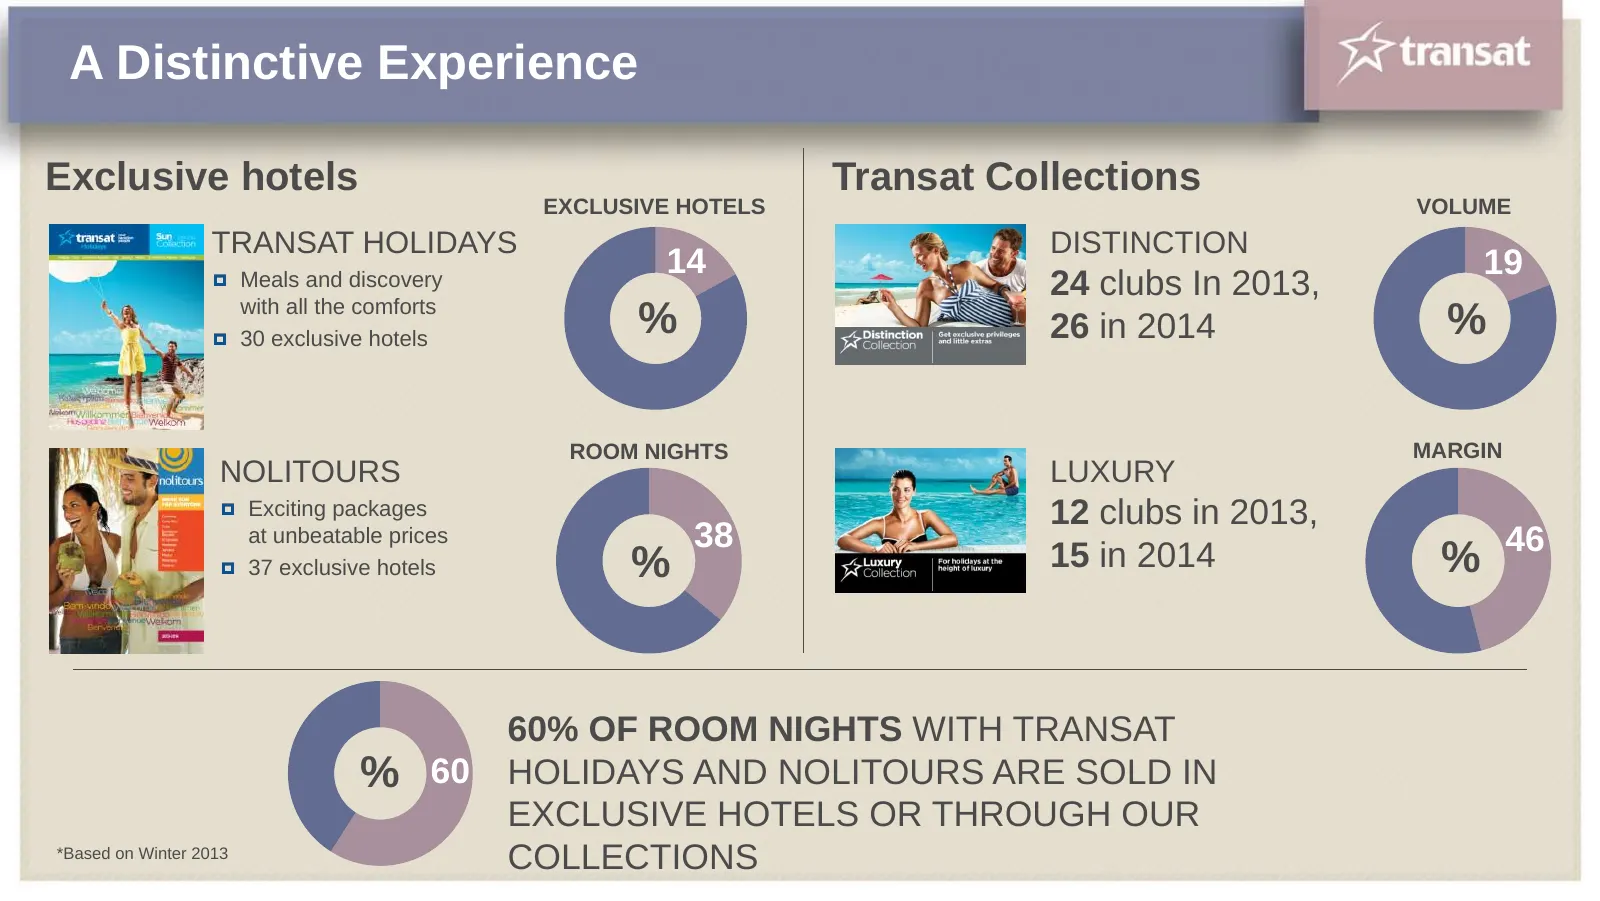
Capacity and Market Share 1,200,000 +9% Winter 2013 Winter 2014 Market share – +3% Actual Forecast Sun, Winter 2013 1,000,000 800,000 +4% 7 14 29 600,000 +6% % 400,000 21 -7% 200,000 29 Transat 0 Sunwing-Signature Other WestJet Vacations Air Canada Vacations Other Autres
Slide 42: A Distinctive Experience
A Distinctive Experience Exclusive hotels Transat Collections EXCLUSIVE HOTELS VOLUME TRANSAT HOLIDAYS DISTINCTION 14 19 Meals and discovery 24 clubs In 2013, with all the comforts 30 exclusive hotels % 26 in 2014 % ROOM NIGHTS MARGIN NOLITOURS LUXURY Exciting packages 12 clubs in 2013, at unbeatabl
Slide 43: Transatlantic Market, Summer 2013
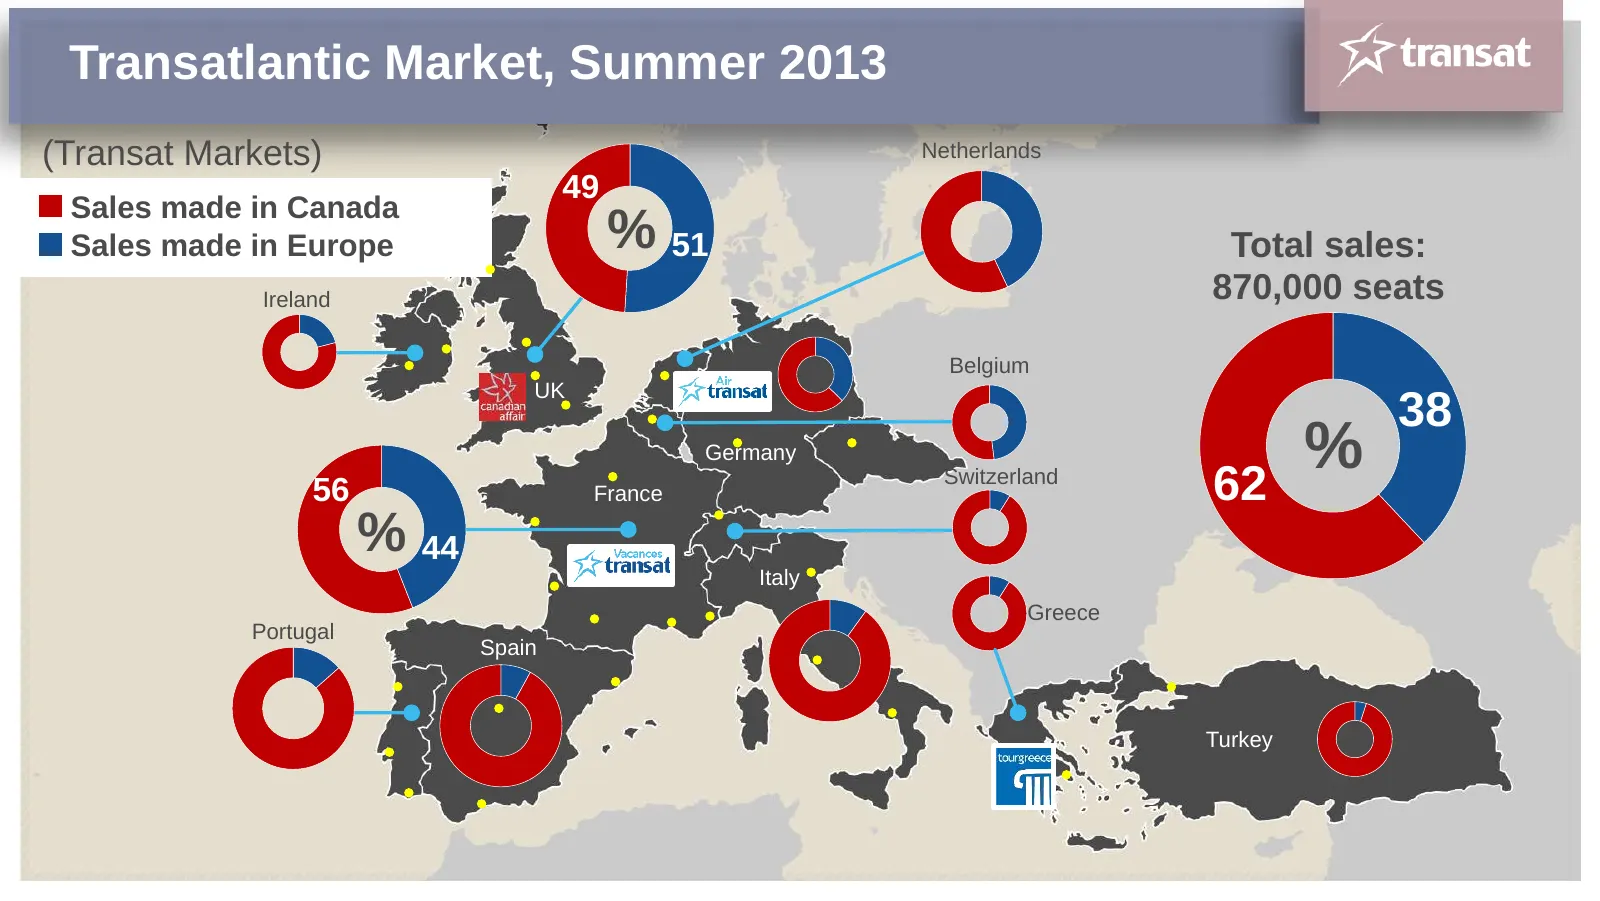
Transatlantic Market, Summer 2013 (Transat Markets) Netherlands 49 Sales made in Canada Sales made in Europe % 51 Total sales: Ireland 870,000 seats Belgium UK 38 56 France Germany Switzerland 62 % % 44 Italy Greece Portugal Spain Turkey
Slide 44: Transatlantic Market, Summer 2013
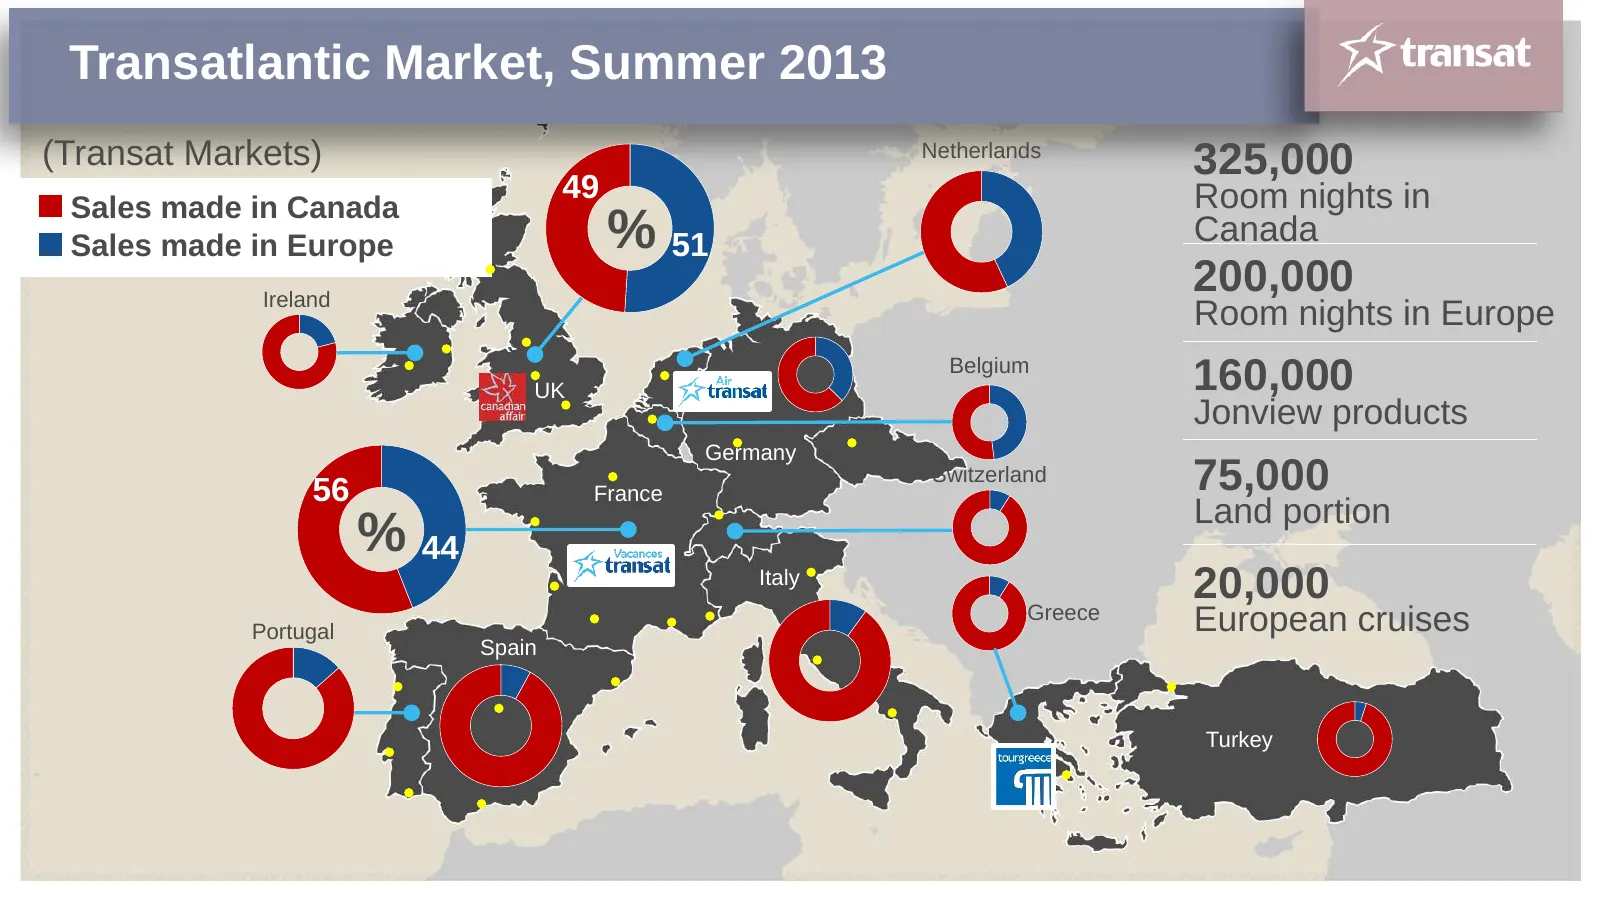
Transatlantic Market, Summer 2013 (Transat Markets) Netherlands 325,000 49 Room nights in Sales made in Canada Sales made in Europe % 51 Canada Ireland 200,000 Room nights in Europe Belgium UK 160,000 Jonview products Germany 56 France Switzerland 75,000 Land portion % 44 Italy 20,000 Greece Europea
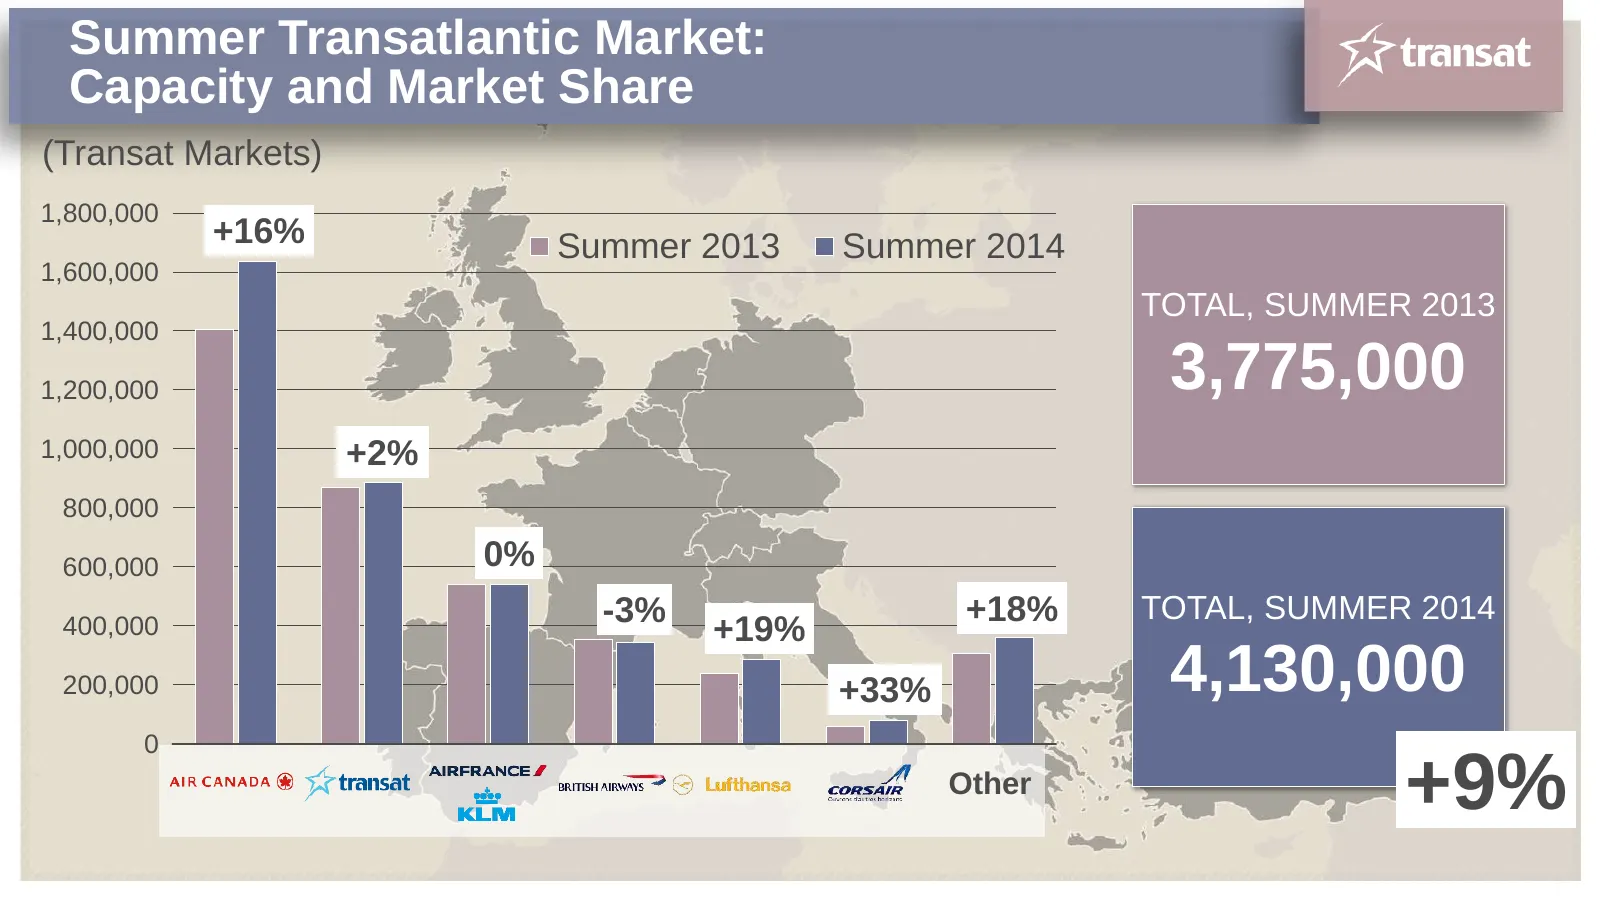
Slide 45: Summer Transatlantic Market: Capacity and Market Share
Summer Transatlantic Market: Capacity and Market Share (Transat Markets) 1,800,000 +16% Summer 2013 Summer 2014 1,600,000 TOTAL, SUMMER 2013 1,400,000 1,200,000 3,775,000 1,000,000 +2% 800,000 600,000 0% -3% +18% TOTAL, SUMMER 2014 400,000 +19% 200,000 +33% 4,130,000 0 Other +9%
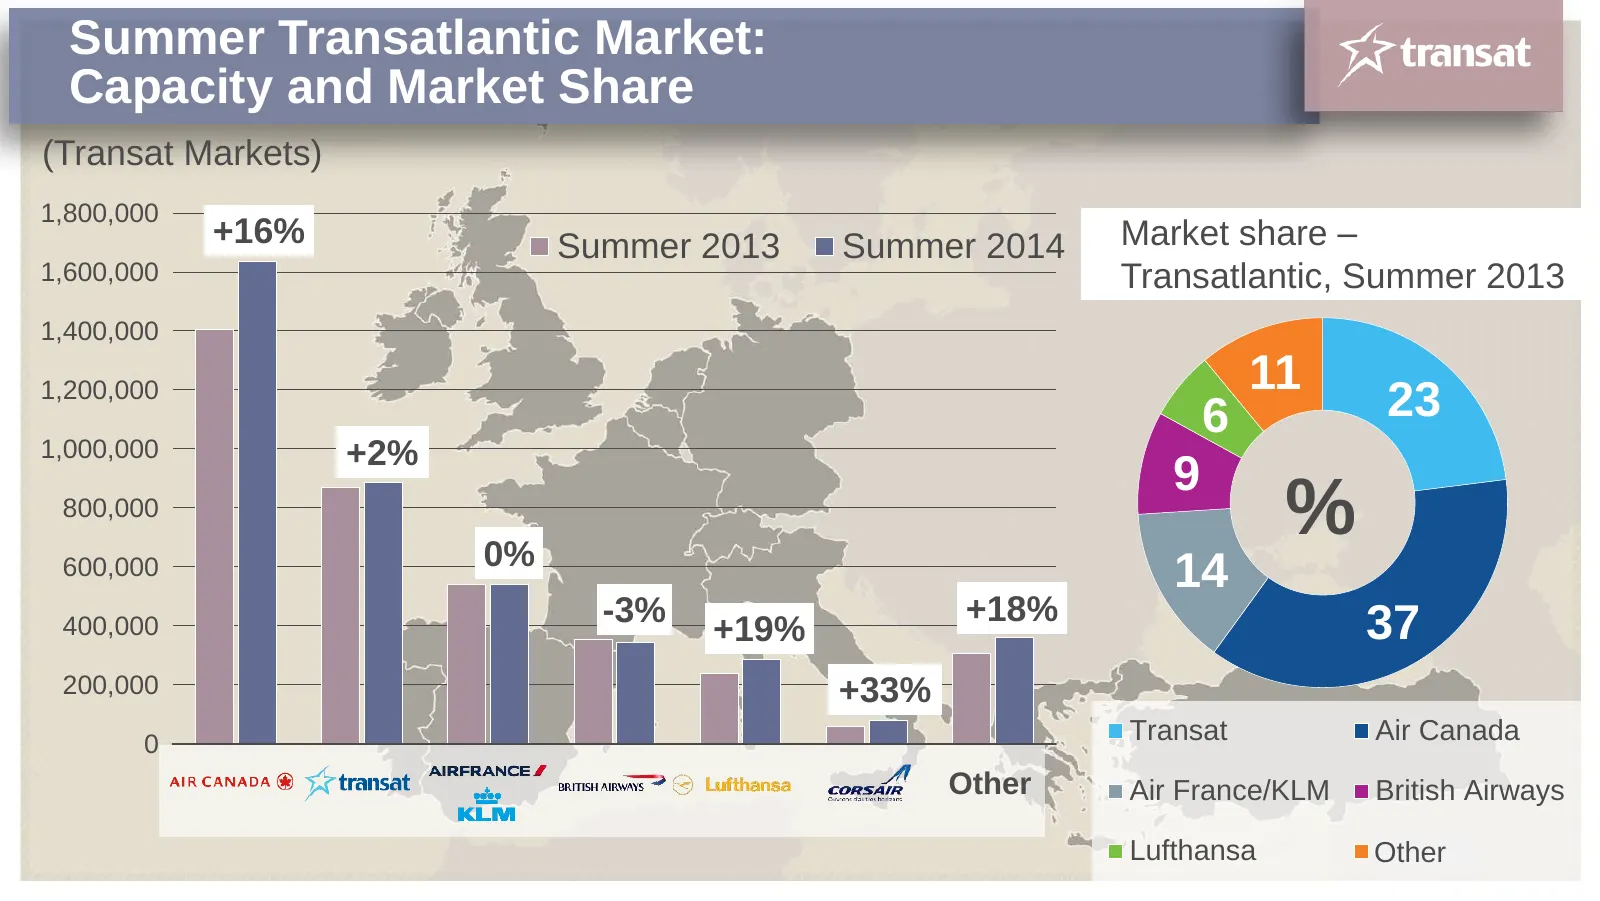
Slide 46: Summer Transatlantic Market: Capacity and Market Share
Summer Transatlantic Market: Capacity and Market Share (Transat Markets) 1,800,000 +16% Summer Summer Été 20132013 Summer 2013 Été 2014 2014 Market share – 1,600,000 Transatlantic, Summer 2013 1,400,000 1,200,000 11 6 23 1,000,000 +2% 9 800,000 0% % 600,000 14 -3% +18% 400,000 +19% 37 200,000 +33% 0
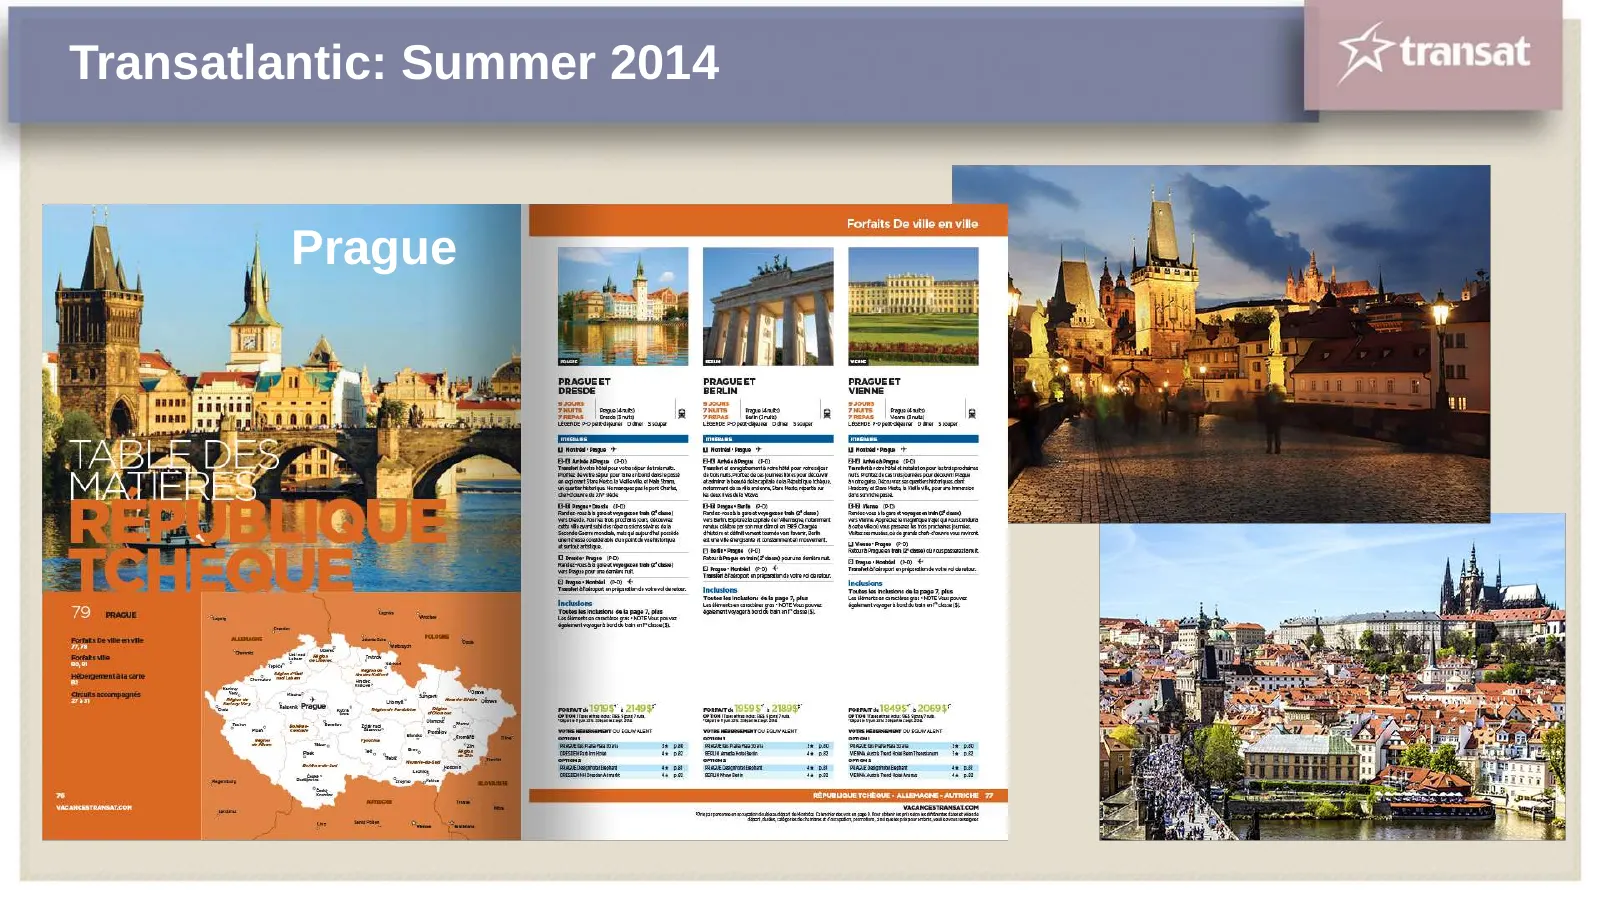
Slide 47: Transatlantic: Summer 2014 Prague
Transatlantic: Summer 2014 Prague
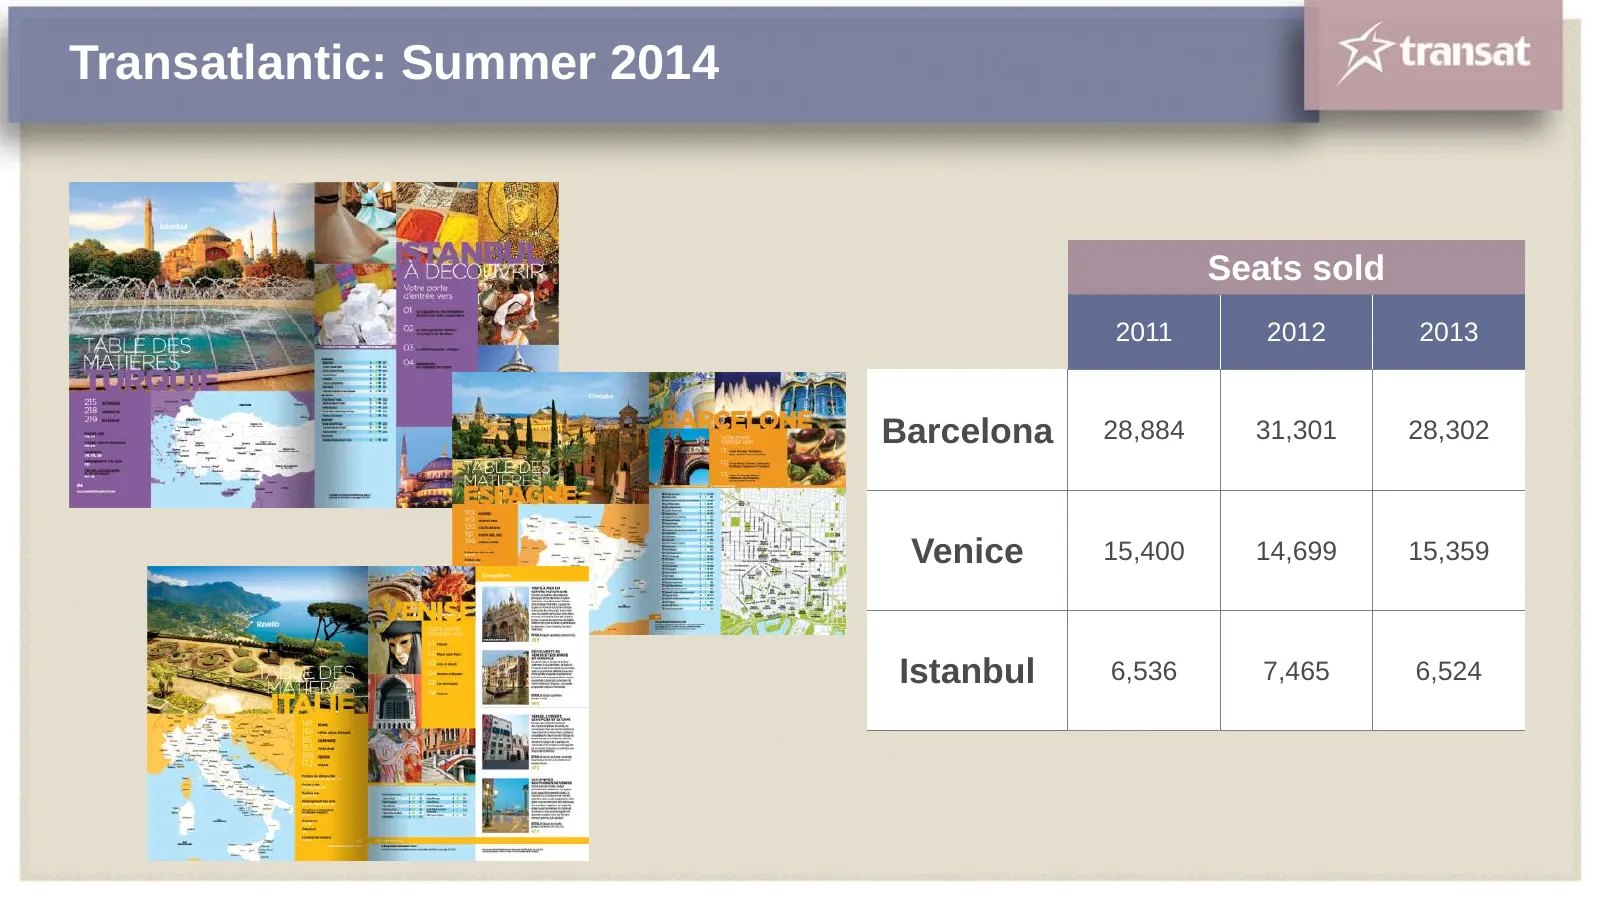
Slide 48: Transatlantic: Summer 2014
Transatlantic: Summer 2014 Seats sold 2011 2012 2013 Barcelona 28,884 31,301 28,302 Venice 15,400 14,699 15,359 Istanbul 6,536 7,465 6,524
Slide 49: France Market
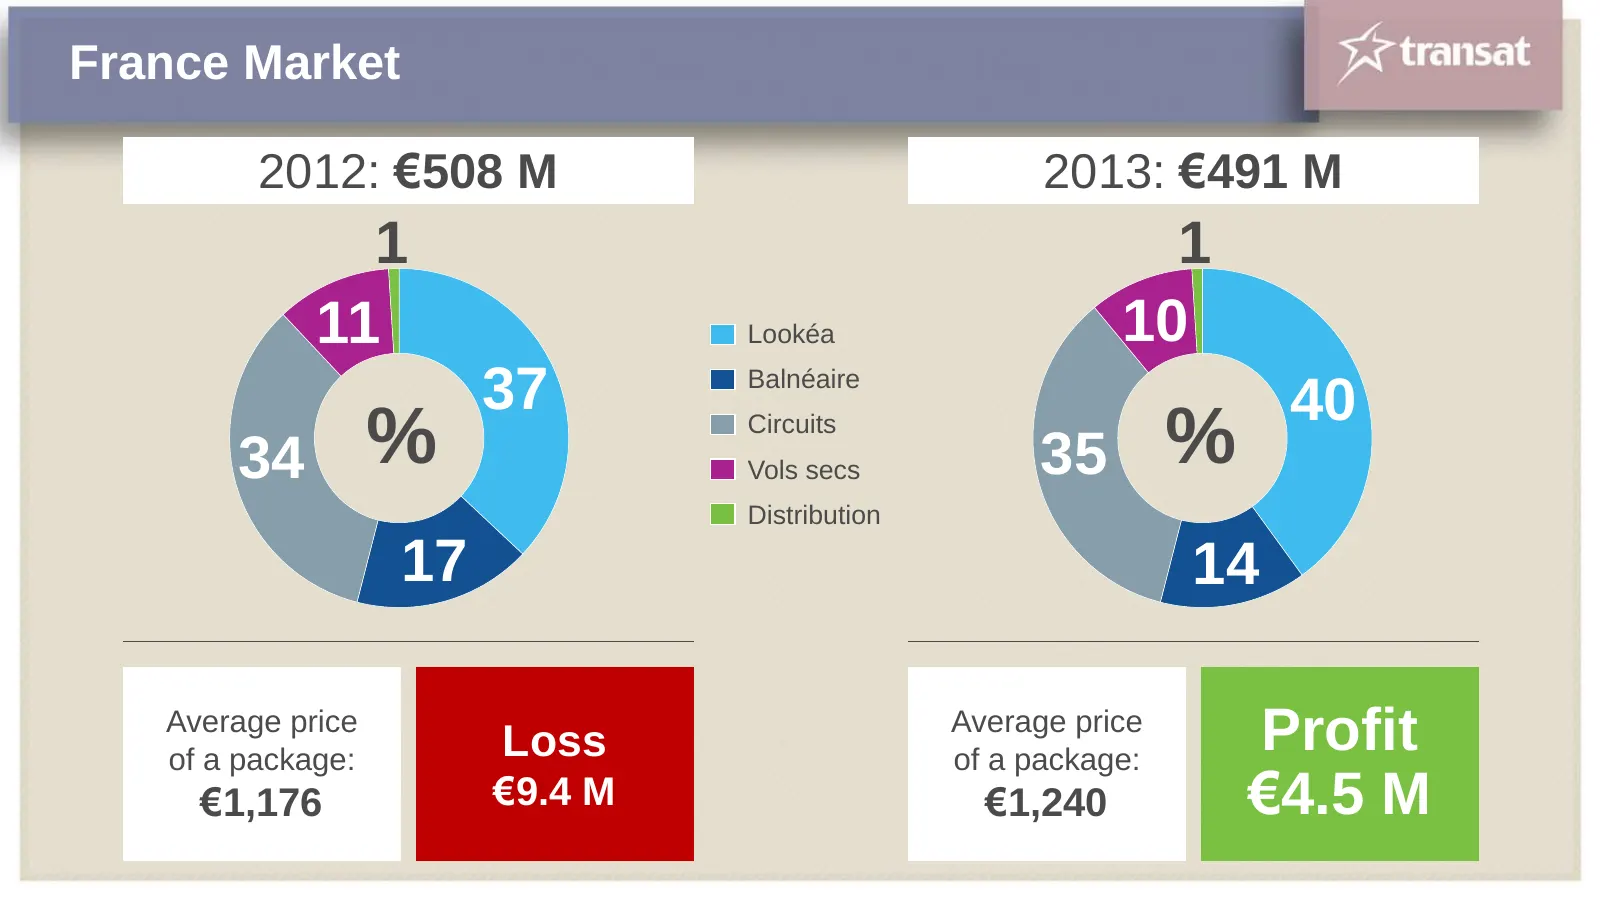
France Market 2012: €508 M 2013: €491 M 1 1 11 Lookéa 10 37 Balnéaire 40 34 % Circuits Vols secs 35 % Distribution 17 14 Average price of a package: Loss Average price of a package: Profit €1,176 €9.4 M €1,240 €4.5 M
Slide 50: France Market
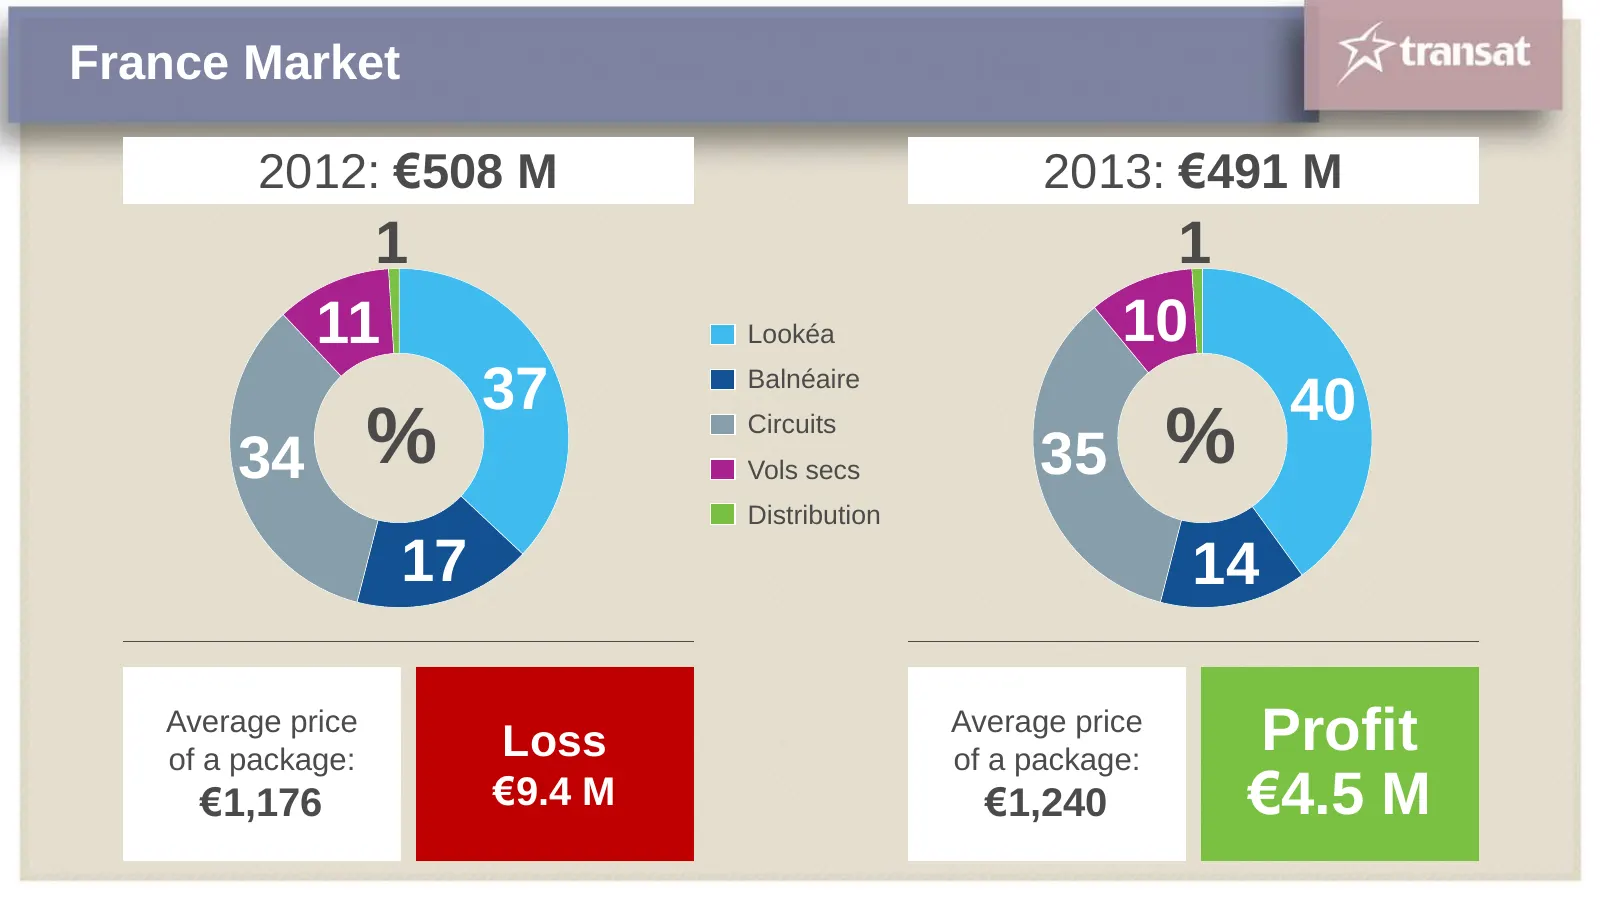
France Market 2012: €508 M 2013: €491 M 1 1 11 Lookéa 10 37 Balnéaire 40 34 % Circuits Vols secs 35 % Distribution 17 14 Average price of a package: Loss Average price of a package: Profit €1,176 €9.4 M €1,240 €4.5 M
Slide 51: France Market
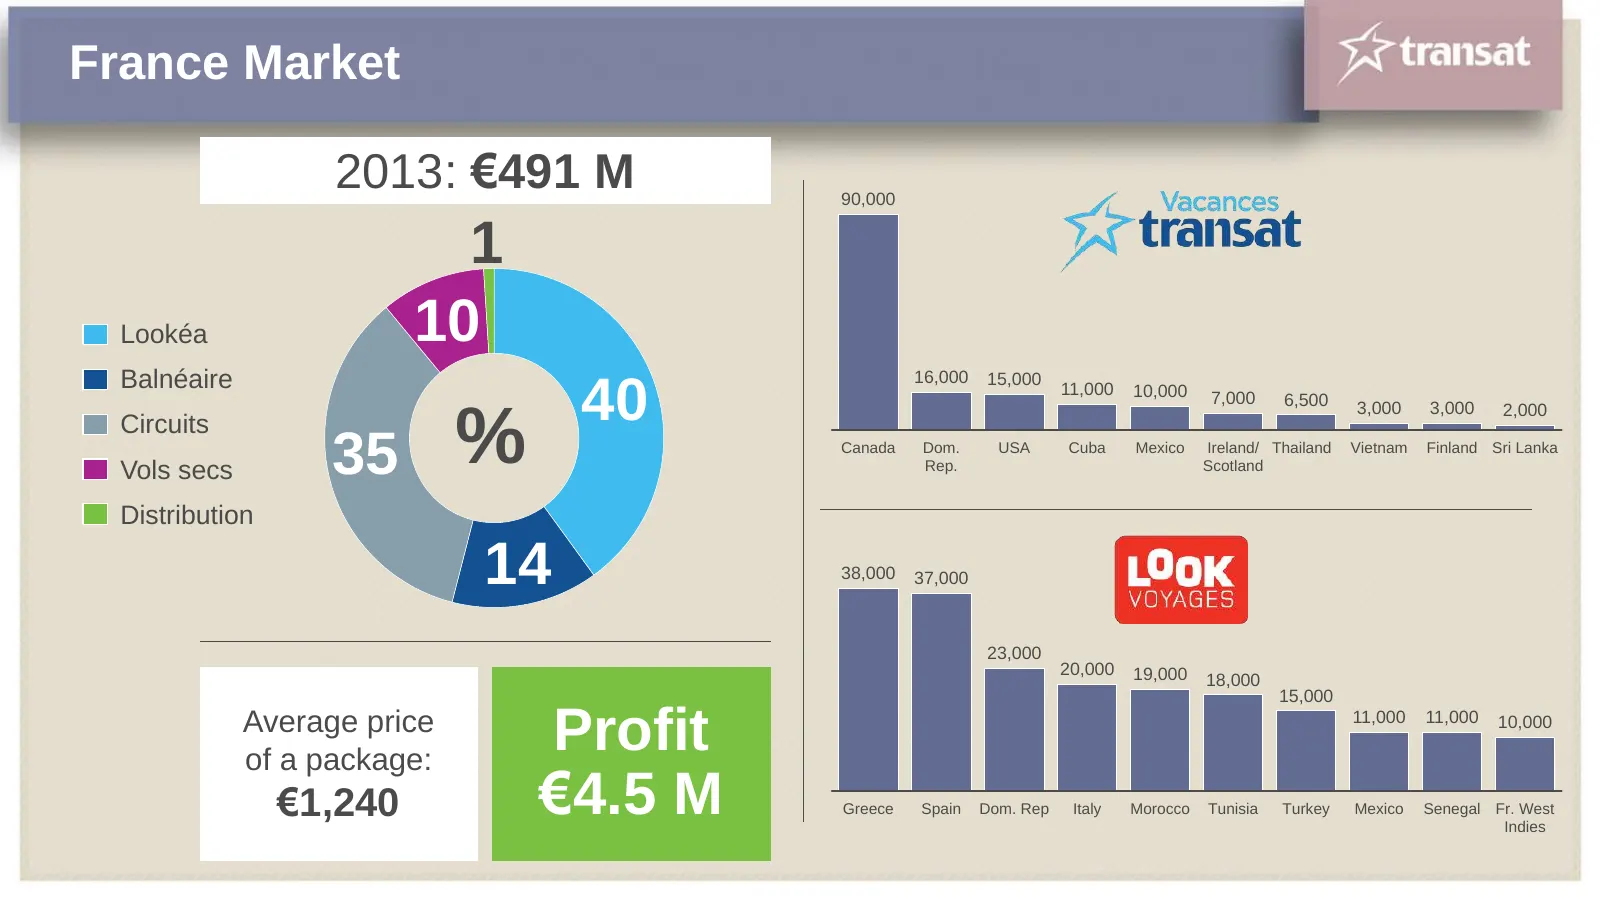
France Market 2013: €491 M 90,000 1 Lookéa 10 Balnéaire 16,000 15,000 40 11,000 10,000 7,000 6,500 3,000 3,000 2,000 Circuits Vols secs 35 % Canada Dom. Rep. USA Cuba Mexico Ireland/ Thailand Scotland Vietnam Finland Sri Lanka Distribution 14 38,000 37,000 23,000 20,000 19,000 18,000 15,000 Average
Slide 52: Hotelier Program: Working Together
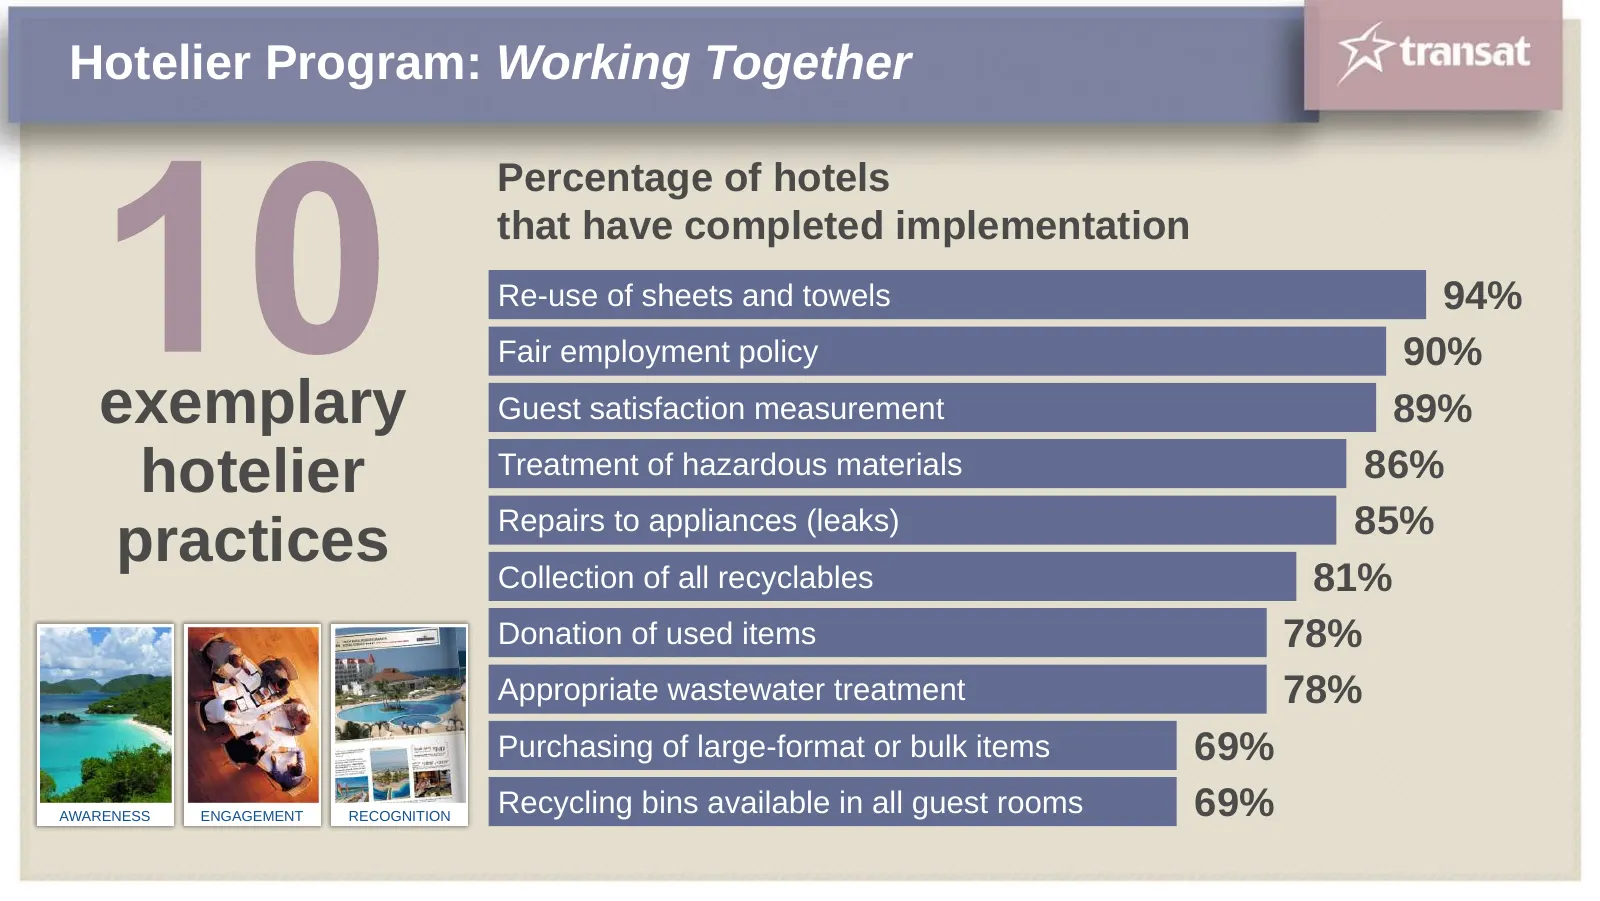
Hotelier Program: Working Together Percentage of hotels that have completed implementation Re-use of sheets and towels 94% Fair employment policy 90% exemplary Guest satisfaction measurement 89% hotelier Treatment of hazardous materials 86% Repairs to appliances (leaks) 85% practices Collection of a
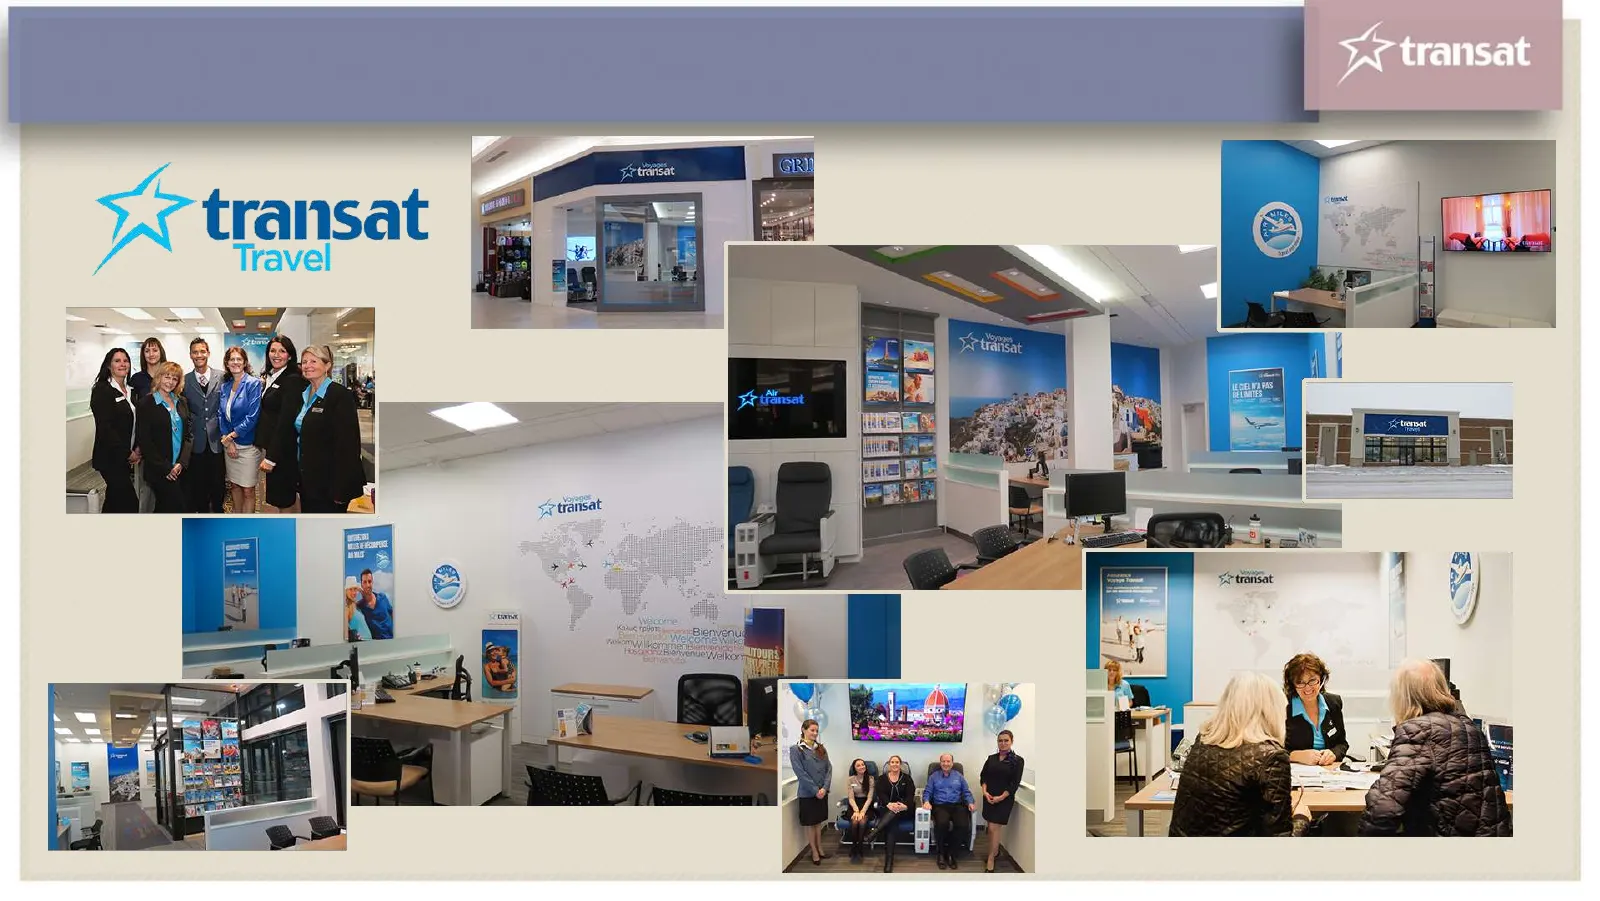
Slide 53: Transat Travel agency network
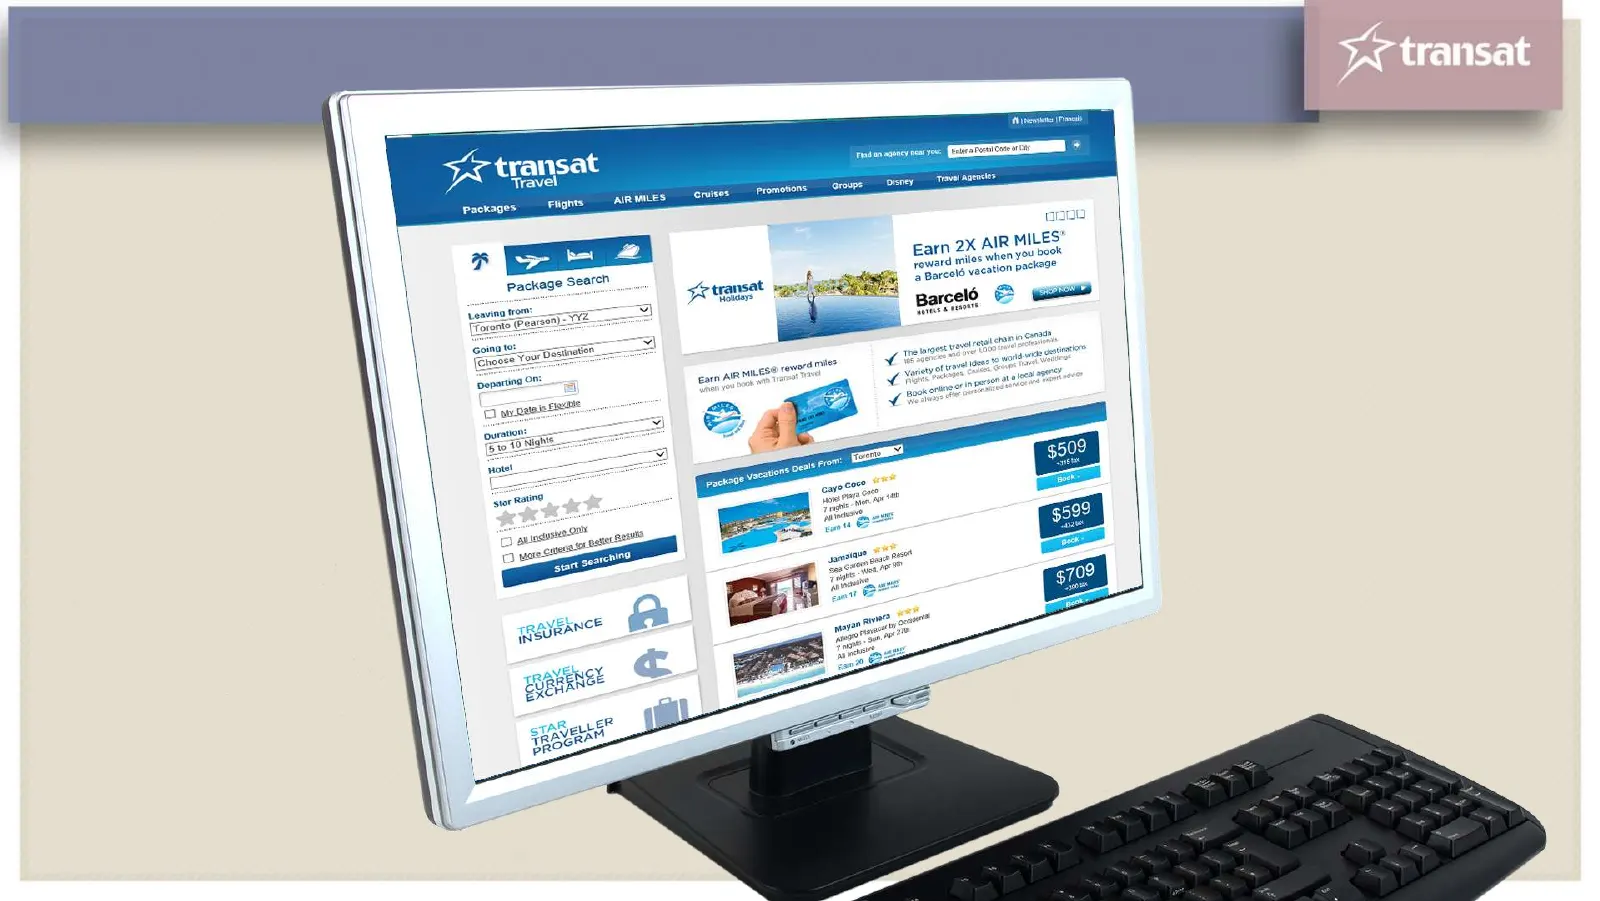
Slide 54: Transat Travel website
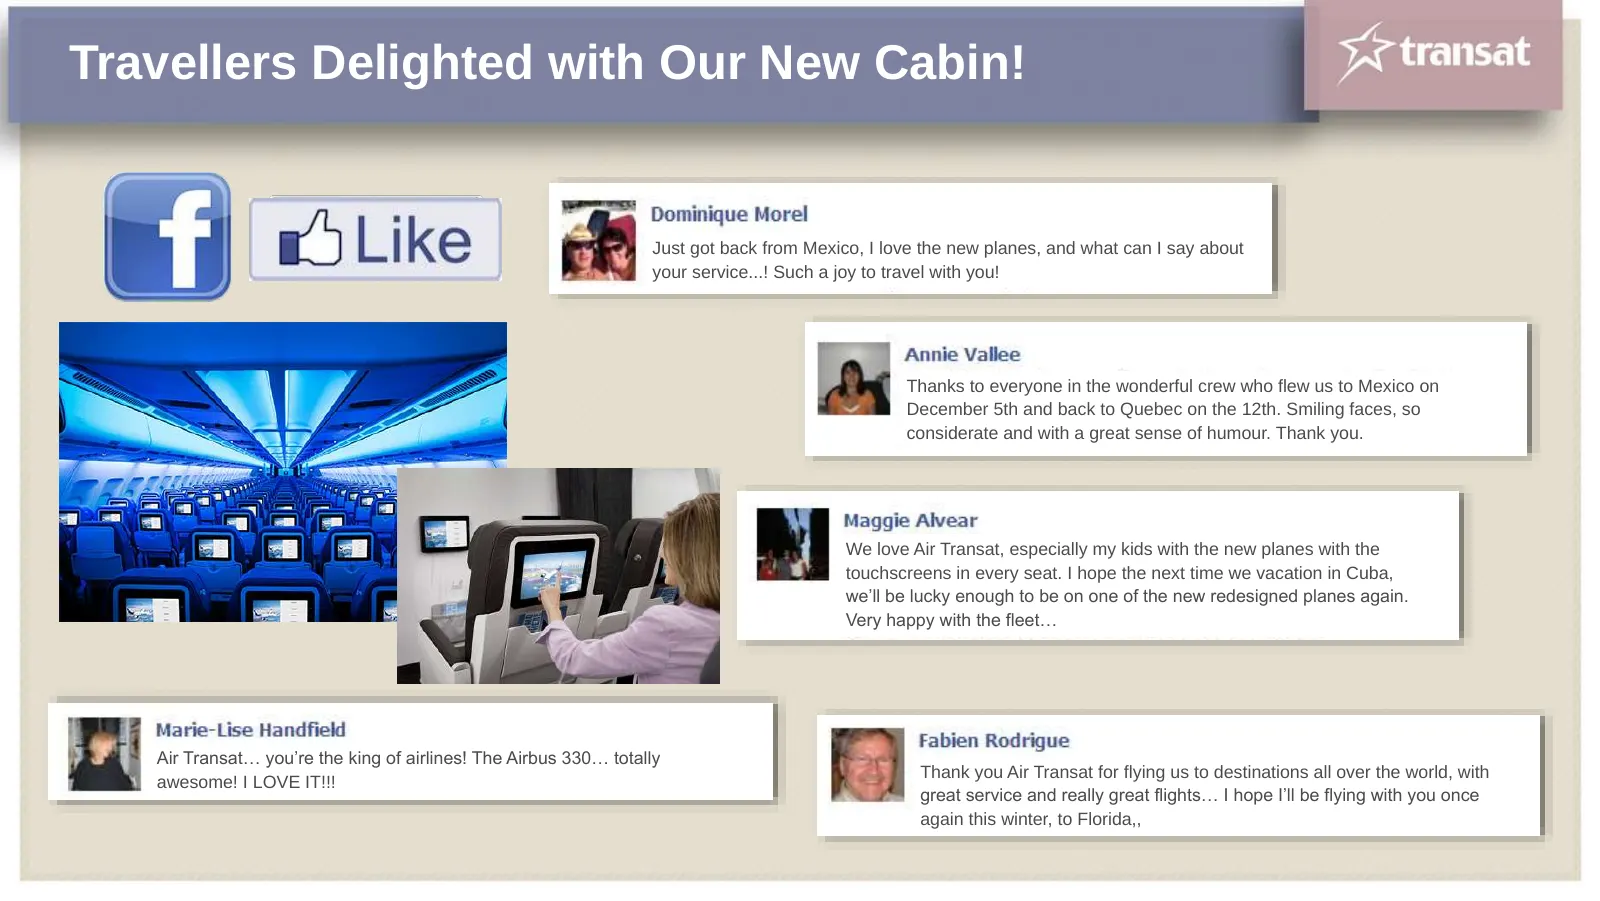
Slide 55: Travellers Delighted with Our New Cabin!
Travellers Delighted with Our New Cabin! Just got back from Mexico, I love the new planes, and what can I say about your service...! Such a joy to travel with you! Thanks to everyone in the wonderful crew who flew us to Mexico on December 5th and back to Quebec on the 12th. Smiling faces, so conside
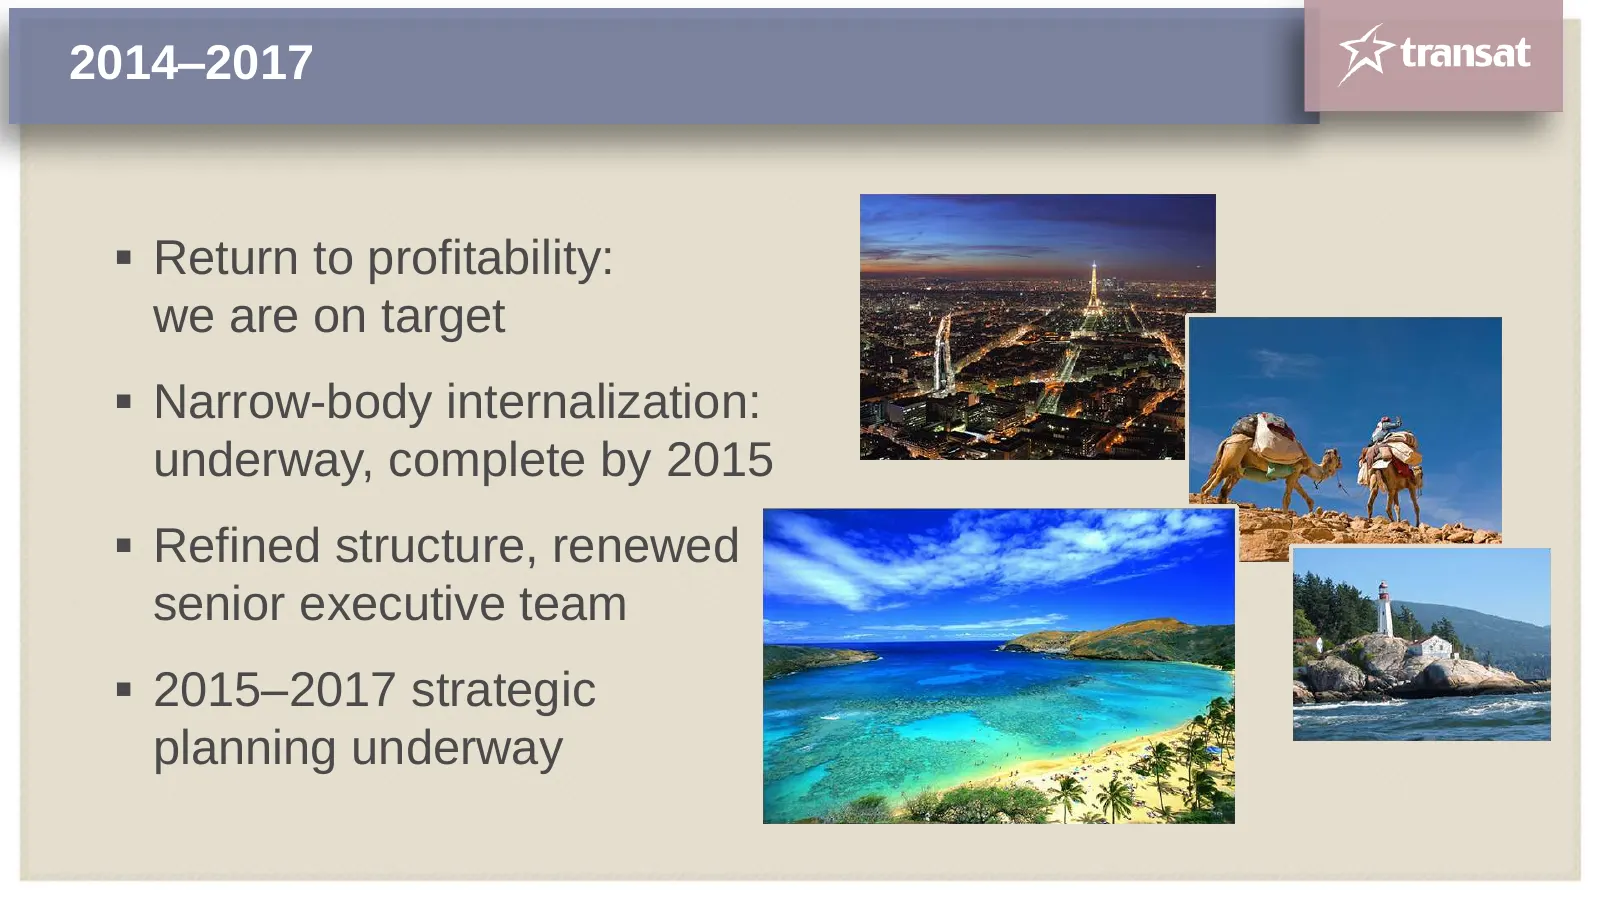
Slide 56: 2014–2017
2014–2017 Return to profitability: we are on target Narrow-body internalization: underway, complete by 2015 Refined structure, renewed senior executive team 2015–2017 strategic planning underway
Slide 57: Denis Pétrin
Denis Pétrin Vice-President, Finance & Administration and Chief Financial Officer
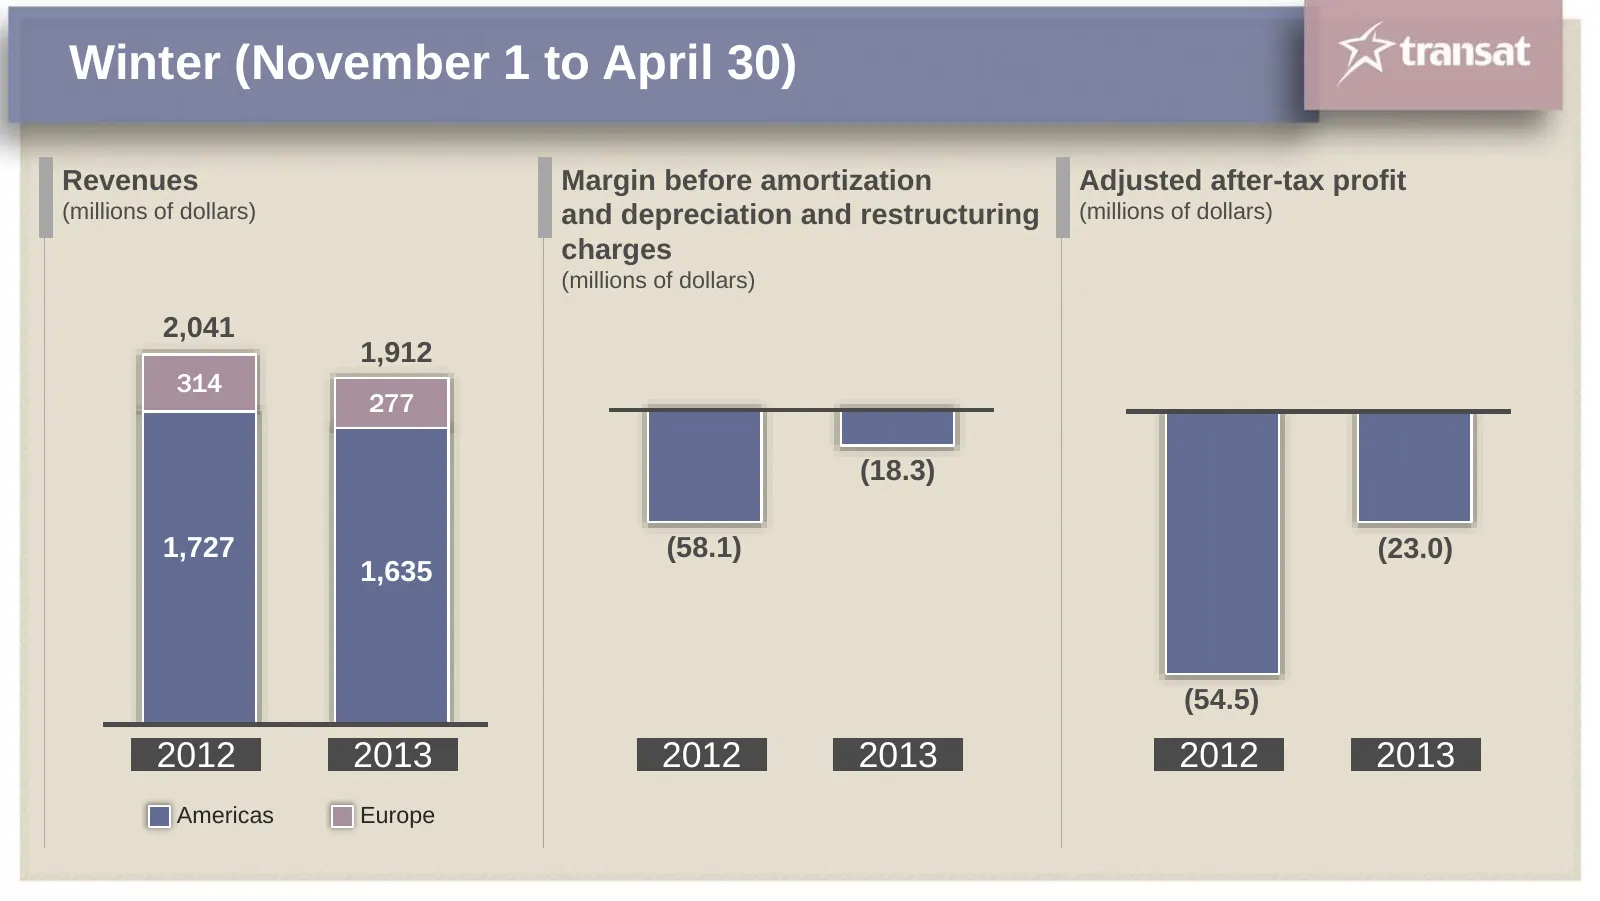
Slide 58: Winter (November 1 to April 30)
Winter (November 1 to April 30) Revenues Margin before amortization Adjusted after-tax profit (millions of dollars) and depreciation and restructuring (millions of dollars) charges (millions of dollars) 2,041 1,912 314 277 (18.3) 1,727 (58.1) (23.0) 1,635 (54.5) 2012 2013 2012 2013 2012 2013 America
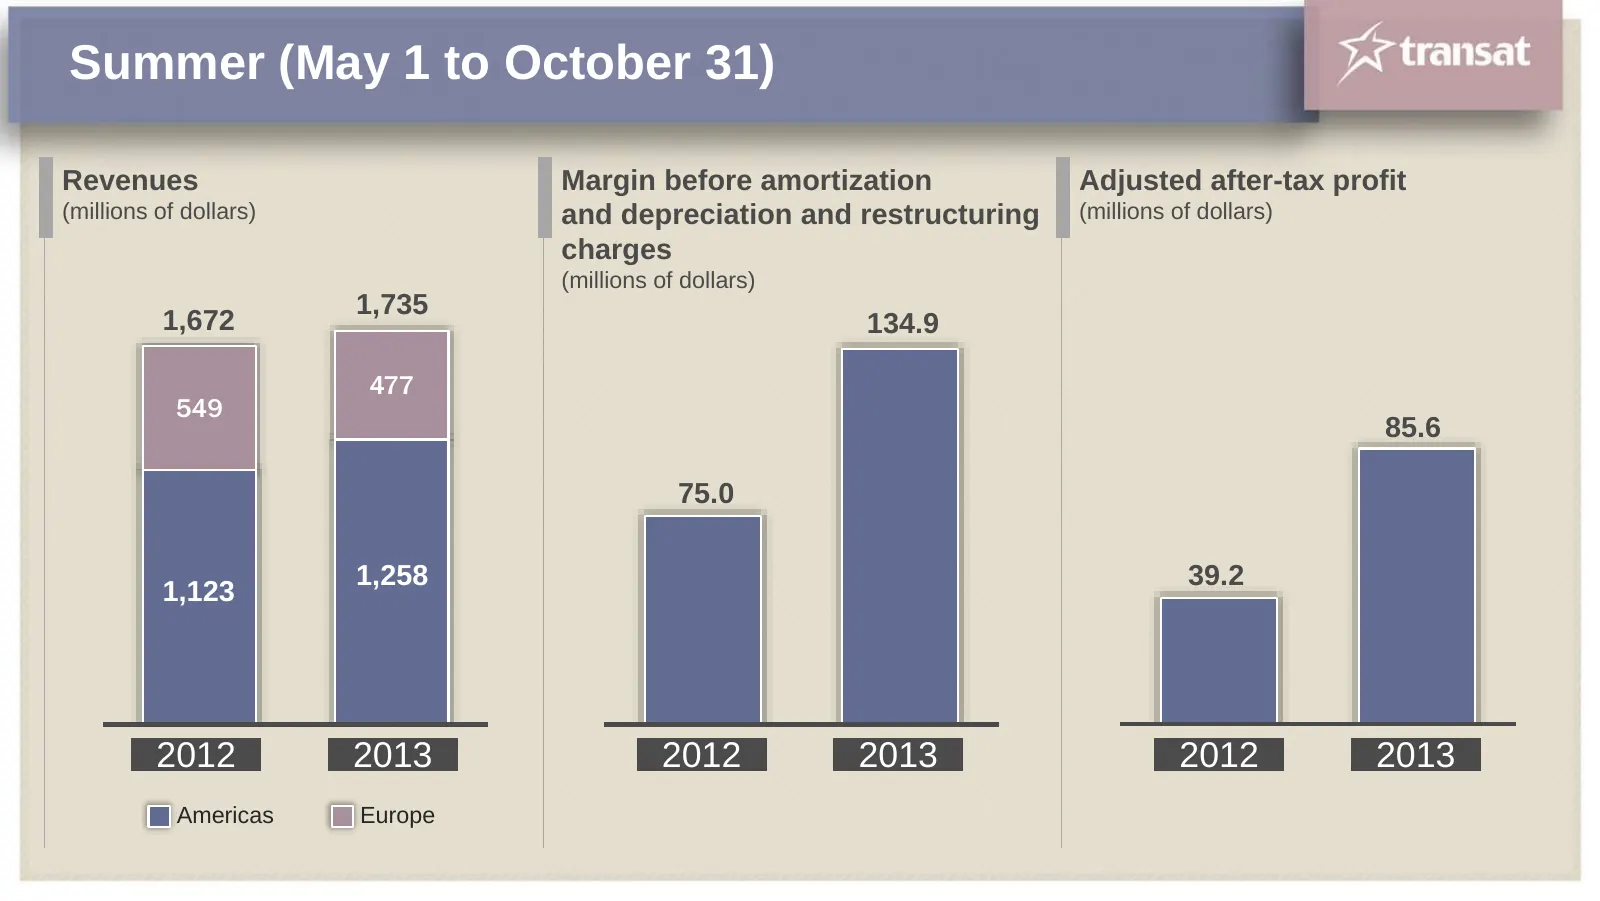
Slide 59: Summer (May 1 to October 31)
Summer (May 1 to October 31) Revenues Margin before amortization Adjusted after-tax profit (millions of dollars) and depreciation and restructuring (millions of dollars) charges (millions of dollars) 1,735 1,672 134.9 477 549 85.6 75.0 1,258 39.2 1,123 2012 2013 2012 2013 2012 2013 Americas Europe
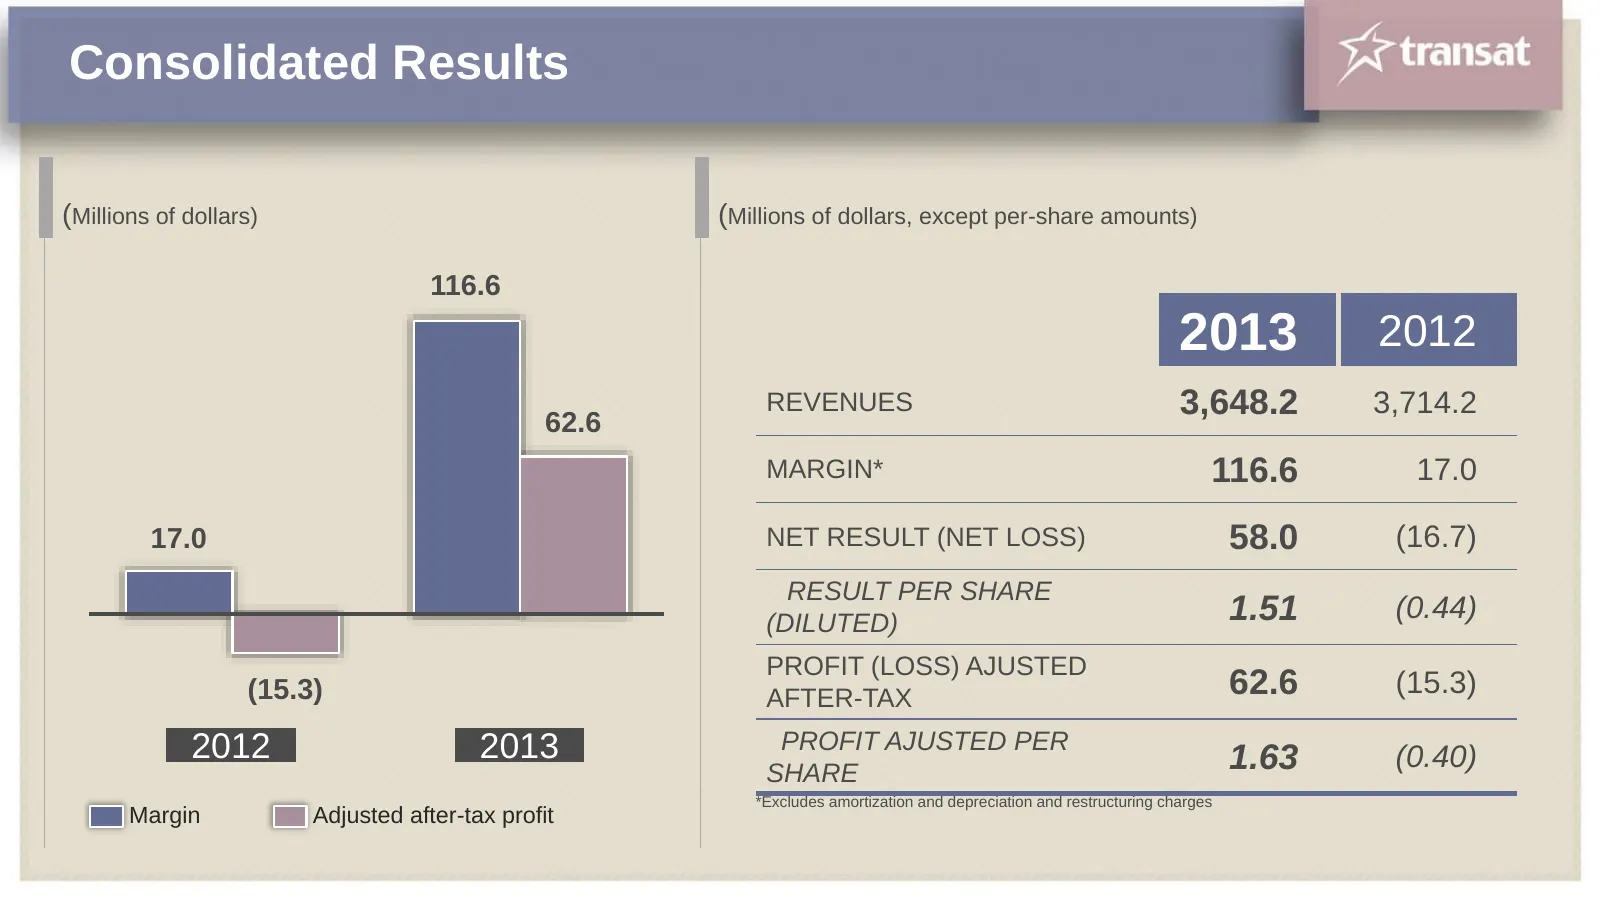
Slide 60: Consolidated Results
Consolidated Results (Millions of dollars) (Millions of dollars, except per-share amounts) 116.6 2013 2012 62.6 REVENUES 3,648.2 3,714.2 MARGIN* 116.6 17.0 17.0 NET RESULT (NET LOSS) 58.0 (16.7) RESULT PER SHARE (DILUTED) 1.51 (0.44) PROFIT (LOSS) AJUSTED (15.3) AFTER-TAX 62.6 (15.3) 2012 2013 PROFI
Slide 61: First-quarter Results
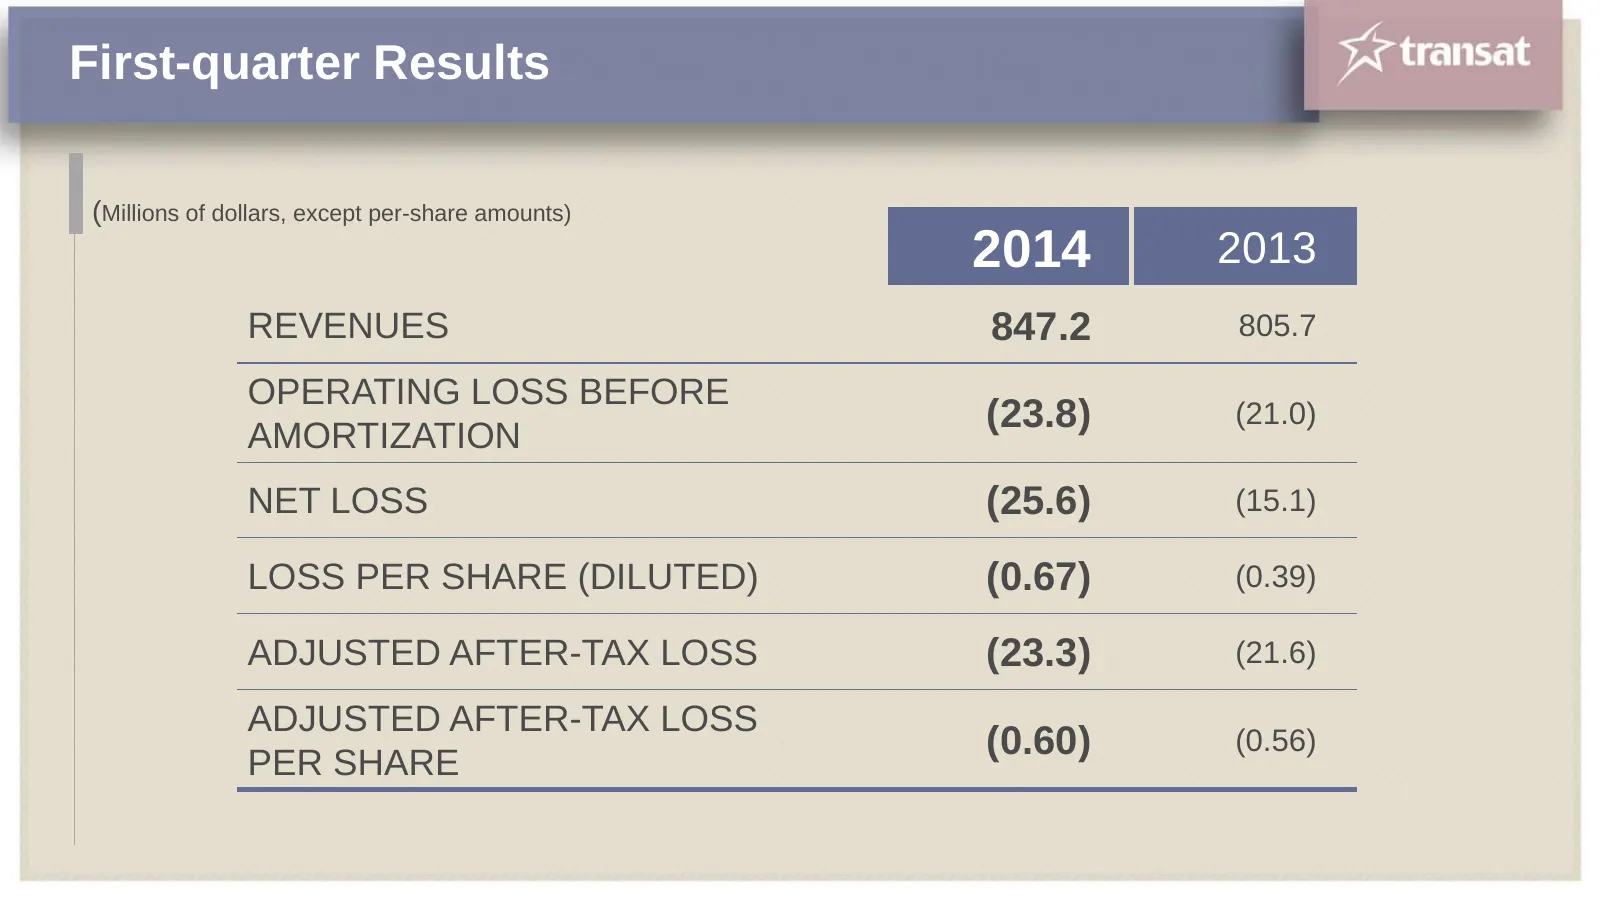
First-quarter Results (Millions of dollars, except per-share amounts) 2014 2013 REVENUES 847.2 805.7 OPERATING LOSS BEFORE (23.8) (21.0) AMORTIZATION NET LOSS (25.6) (15.1) LOSS PER SHARE (DILUTED) (0.67) (0.39) ADJUSTED AFTER-TAX LOSS (23.3) (21.6) ADJUSTED AFTER-TAX LOSS (0.60) (0.56) PER SHARE
Slide 62: Consolidated Balance Sheet, as at January 31
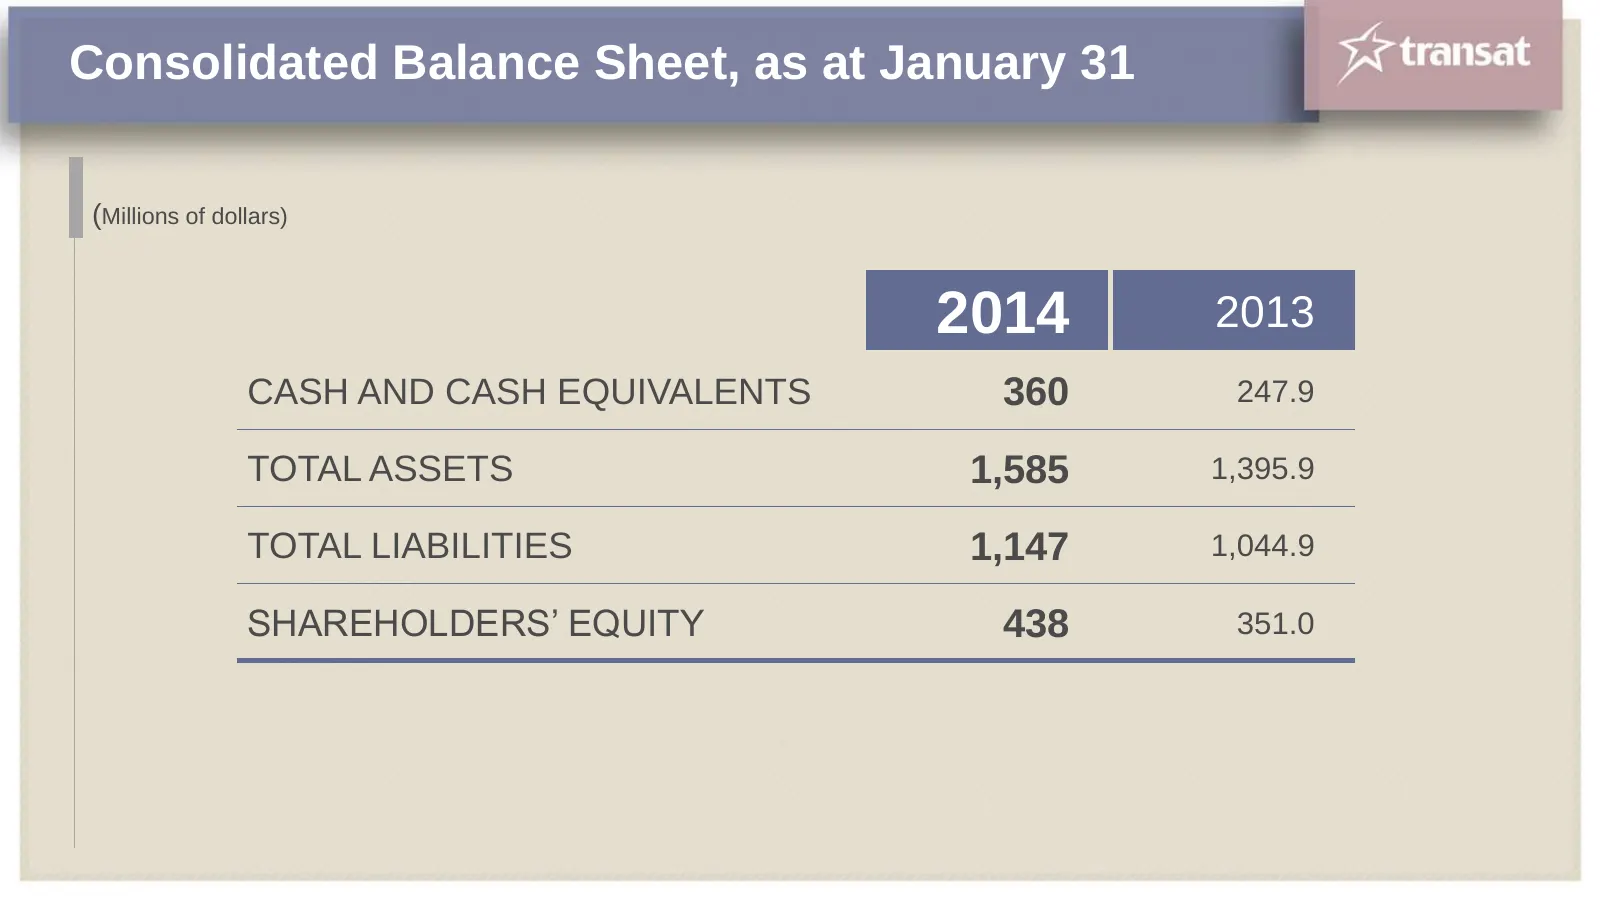
Consolidated Balance Sheet, as at January 31 (Millions of dollars) 2014 2013 CASH AND CASH EQUIVALENTS 360 247.9 TOTAL ASSETS 1,585 1,395.9 TOTAL LIABILITIES 1,147 1,044.9 SHAREHOLDERS’ EQUITY 438 351.0
Slide 63: Outlook
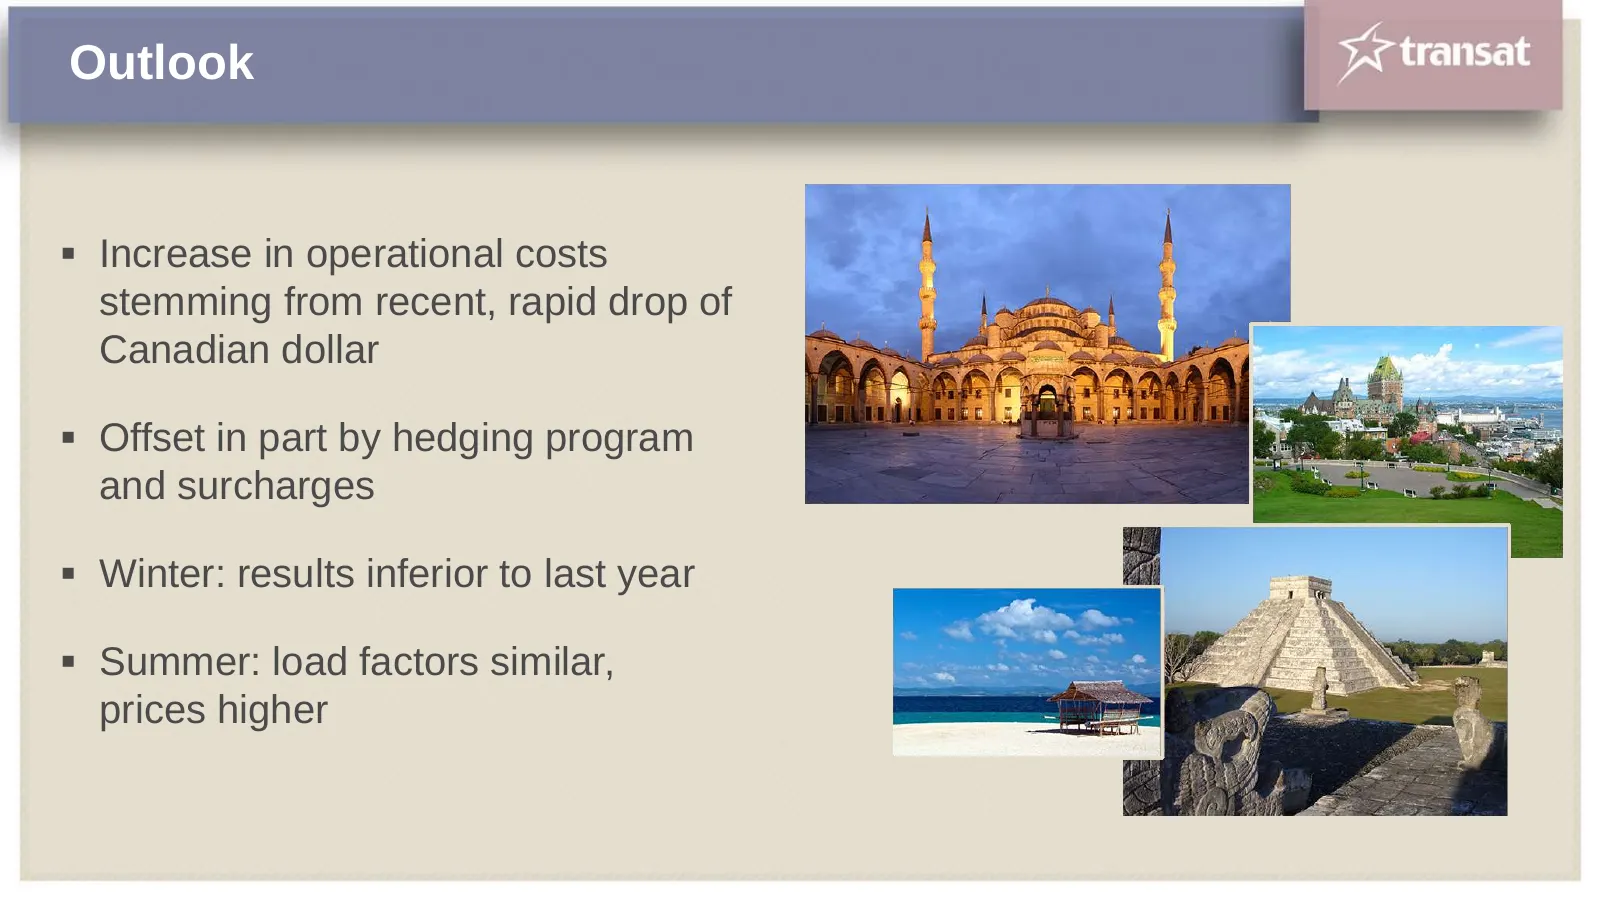
Outlook Increase in operational costs stemming from recent, rapid drop of Canadian dollar Offset in part by hedging program and surcharges Winter: results inferior to last year Summer: load factors similar, prices higher

Slide 64: Results of the Vote
ve transat Annual and Special Meeting of Shareholders 2014

Slide 65: Question Period
ve transat Annual and Special Meeting of Shareholders 2014

Slide 66: Adjournment of Meeting
ve transat Annual and Special Meeting of Shareholders 2014

Slide 67: Annual and Special Meeting of Shareholders 2014
yc transat Annual and Special Meeting of Shareholders 2014 1s Geldiniz BIER Benvenuto
Source: Internet Archive copy of transat.com
More decks from Transat A.T. Inc.
 Q3 2026 Earnings Presentation14 slides · Sep 10, 2026
 Q1 2026 Earnings Presentation15 slides · Mar 10, 2026
 Q4 2025 Earnings Presentation16 slides · Dec 18, 2025
 Q3 2025 Earnings Presentation16 slides · Sep 11, 2025
 Q1 2024 Earnings Presentation19 slides · March 2024
 Q4 2023 Earnings Presentation20 slides · December 2023