Transat A.T. Inc. · TSX:TRZ
Transat A.T — Q1 2024 Earnings Presentation
19 slides from Transat A.T's earnings presentation, March 2024
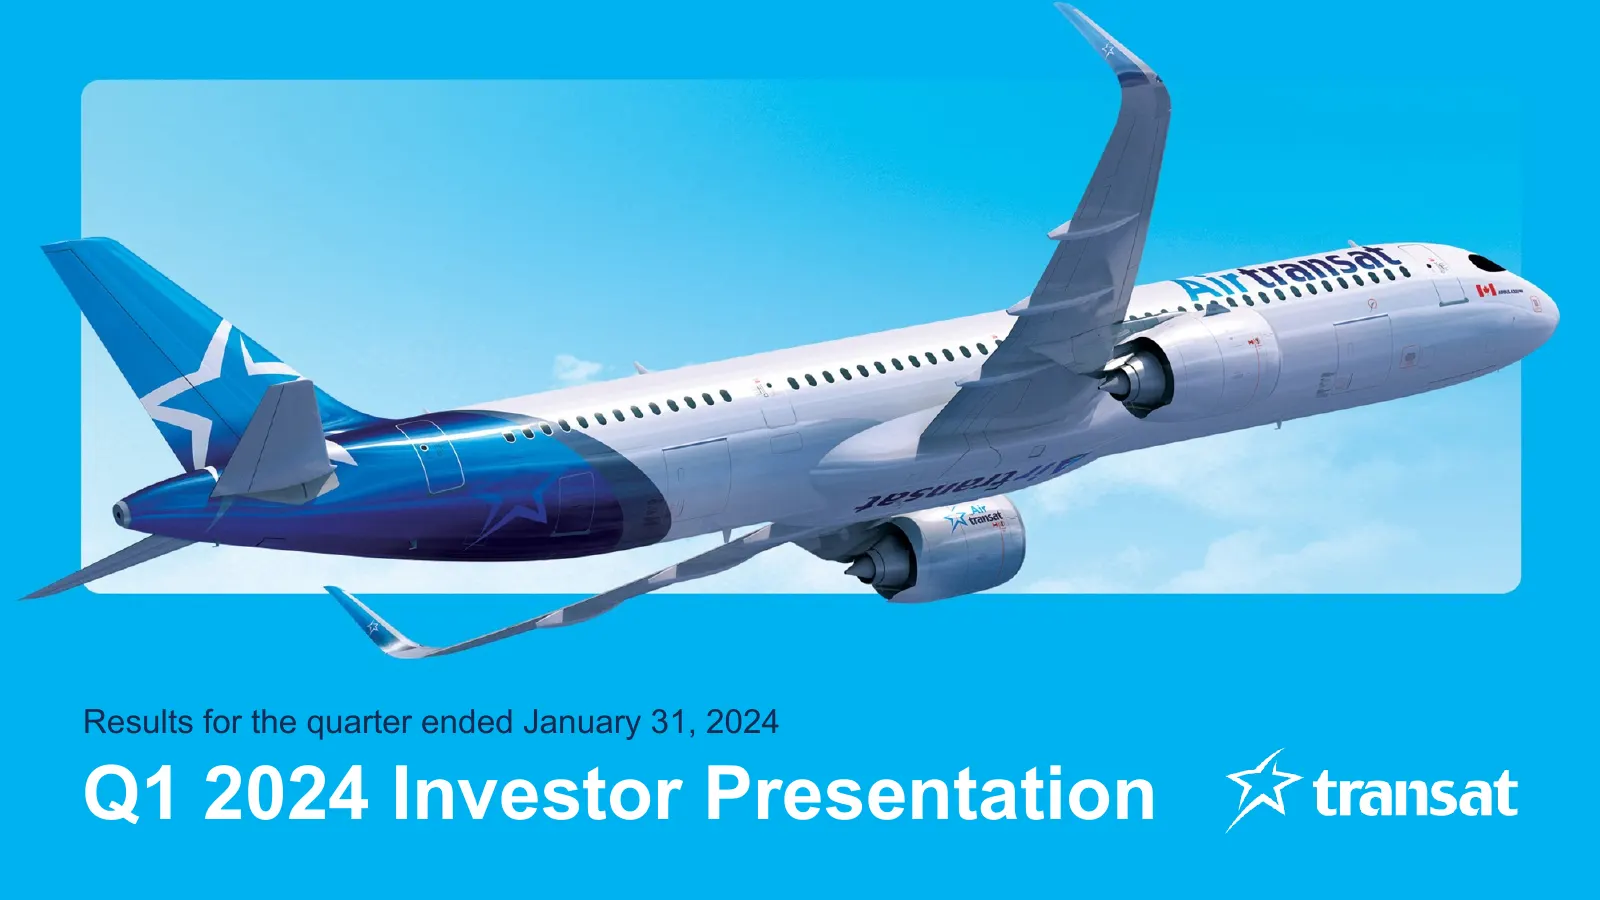
Slide 1: Q1 2024 Investor Presentation
Results for the quarter ended January 31, 2024 Q1 2024 Investor Presentation
Slide 2: Forward-Looking Statements
Forward-Looking Statements This presentation contains certain forward-looking statements with respect to the Corporation, The forward-looking statements in this news release are based on a number of assumptions including those regarding its results, its financial position and its outlook for the fut
Slide 3: Non-IFRS Financial Measures
Non-IFRS Financial Measures We report our financial results in accordance with IFRS. This presentation was By excluding from our results items that arise mainly from long-term strategic prepared using results and financial information determined under IFRS. In addition decisions and/or do not, in ou
Slide 4: General Overview Q1 2024
General Overview Q1 2024 4
Slide 5: Q1 2024 Highlights
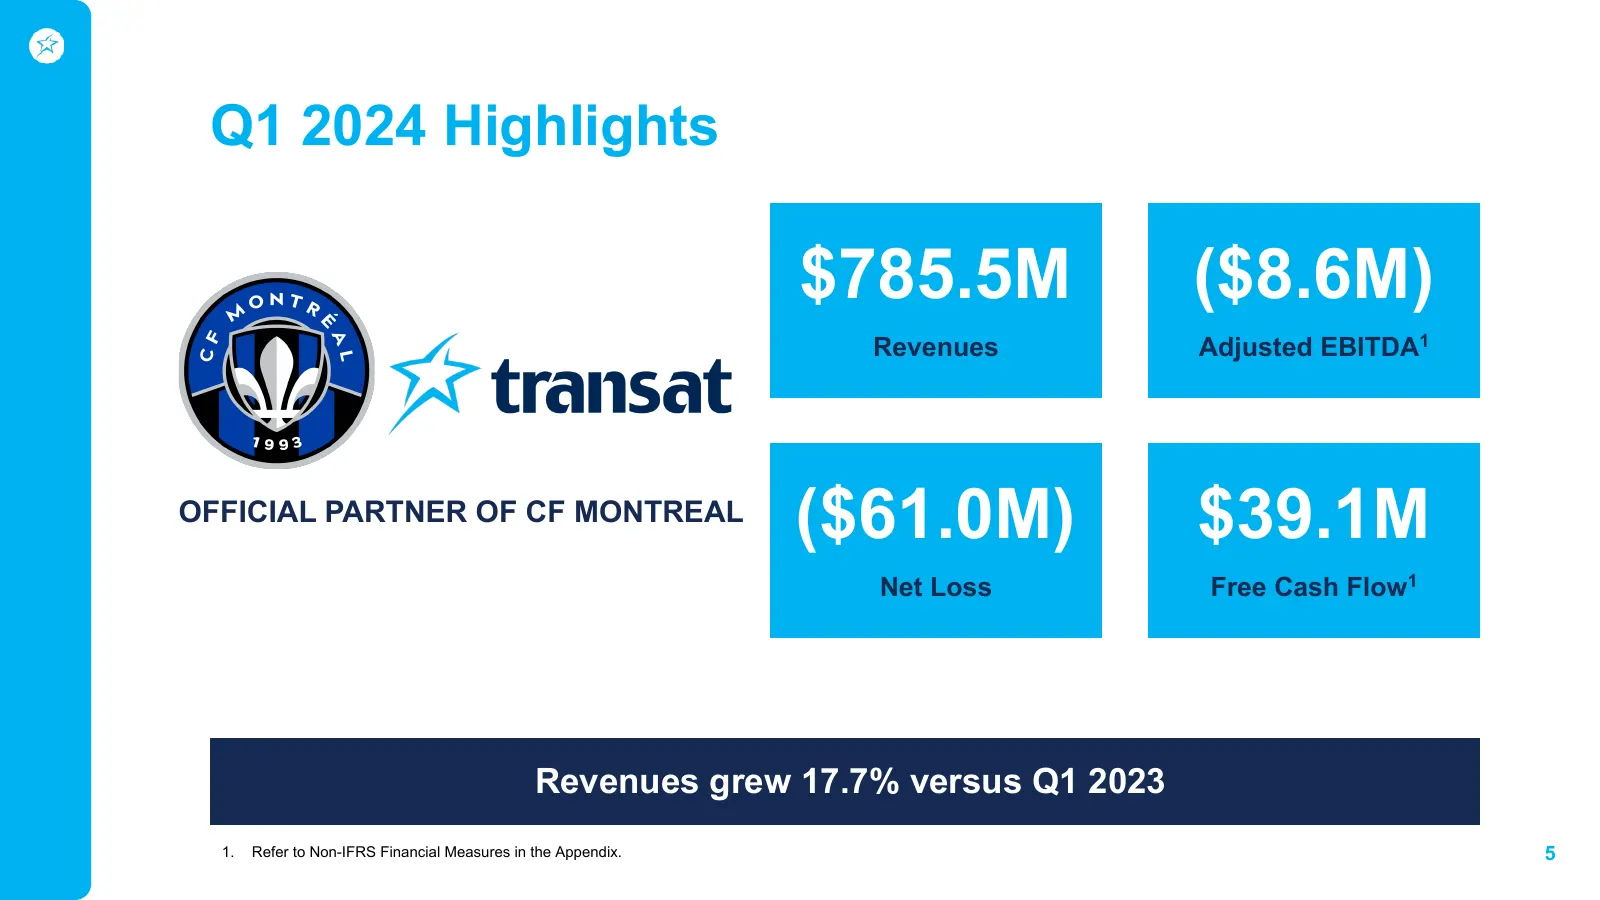
Q1 2024 Highlights $785.5M ($8.6M) Revenues Adjusted EBITDA1 OFFICIAL PARTNER OF CF MONTREAL ($61.0M) $39.1M Net Loss Free Cash Flow1 Revenues grew 17.7% versus Q1 2023 1. Refer to Non-IFRS Financial Measures in the Appendix. 5
Slide 6: Operating Metrics
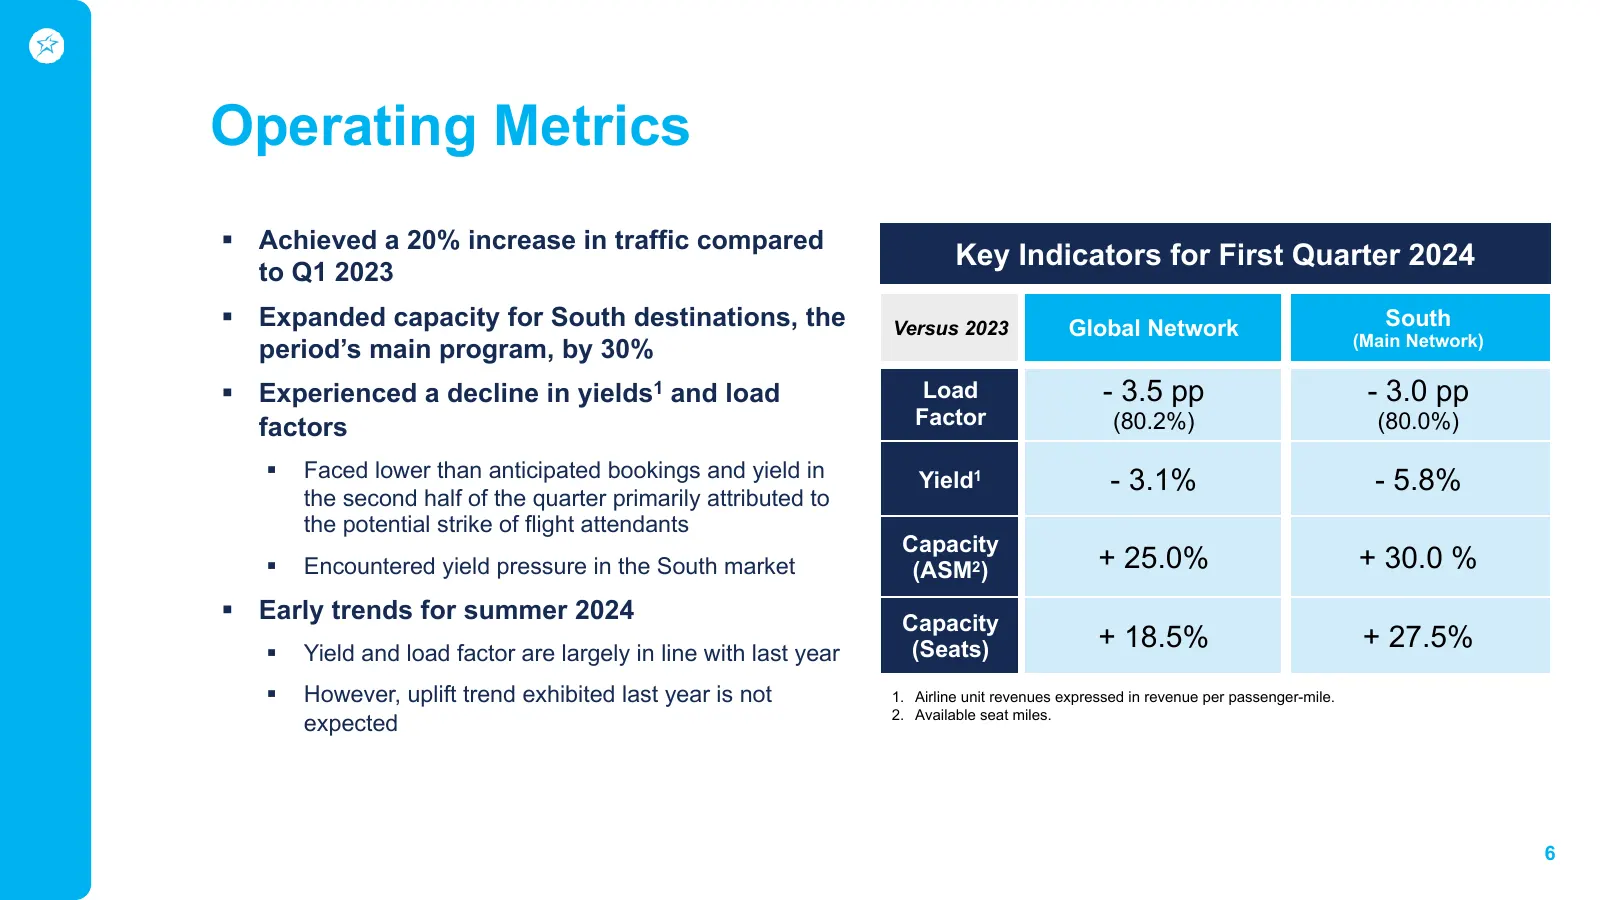
Operating Metrics § Achieved a 20% increase in traffic compared Key Indicators for First Quarter 2024 to Q1 2023 § Expanded capacity for South destinations, the Versus 2023 Global Network South (Main Network) period’s main program, by 30% § Experienced a decline in yields1 and load Load - 3.5 pp - 3
Slide 7: Capacity Increase and Fleet Overview
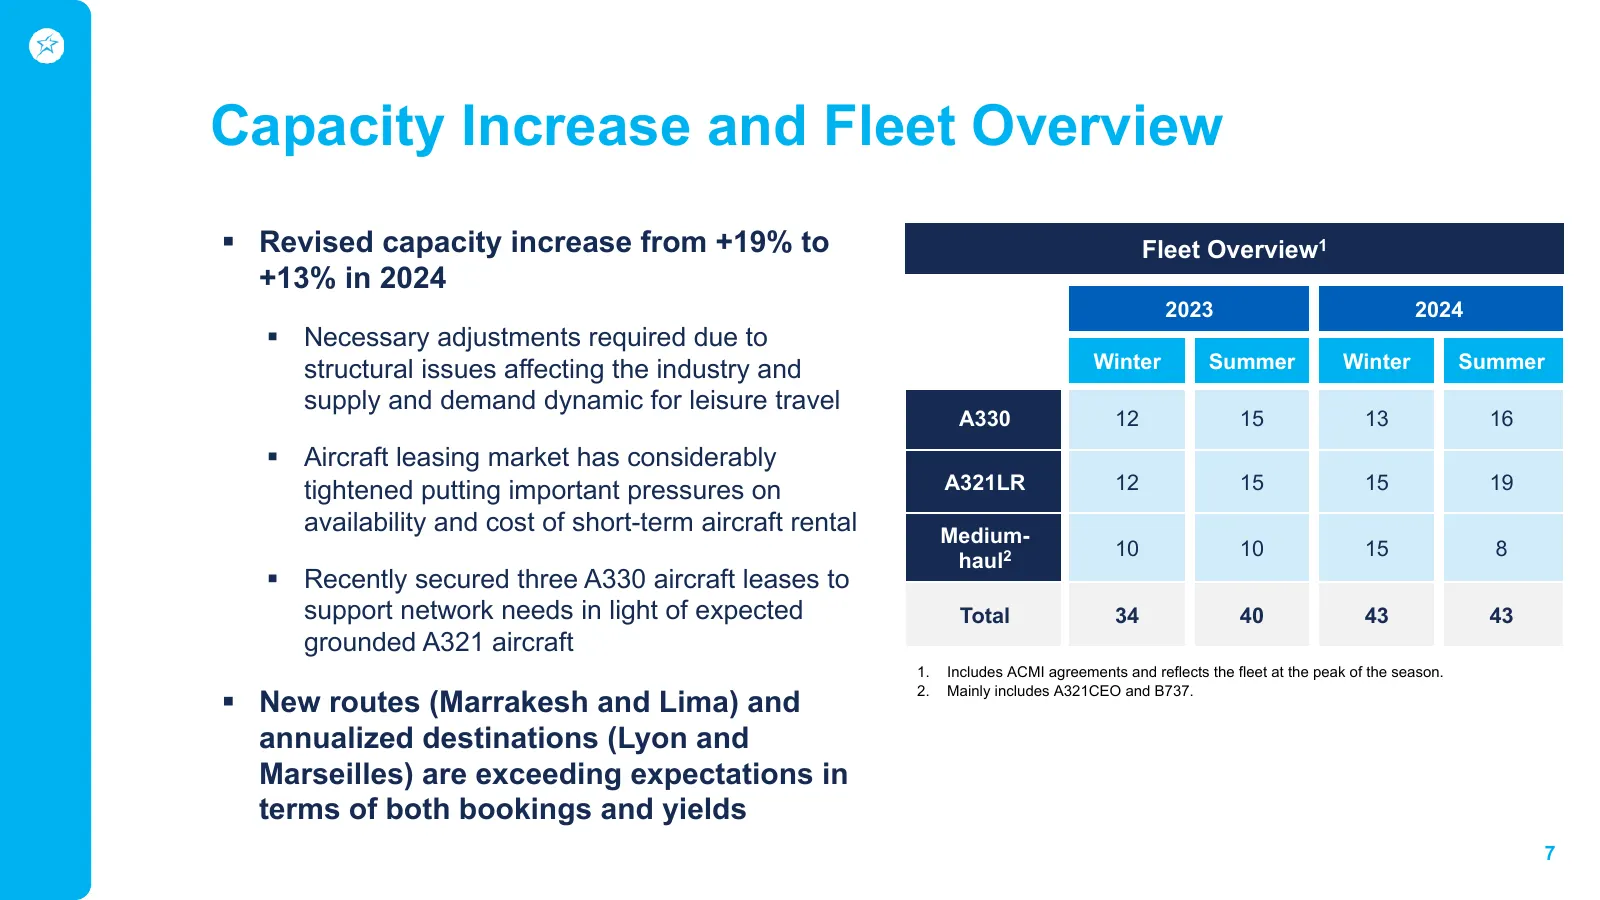
Capacity Increase and Fleet Overview § Revised capacity increase from +19% to Fleet Overview1 +13% in 2024 2023 2024 § Necessary adjustments required due to structural issues affecting the industry and Winter Summer Winter Summer supply and demand dynamic for leisure travel A330 12 15 13 16 § Aircra
Slide 8: Headwinds in 2024
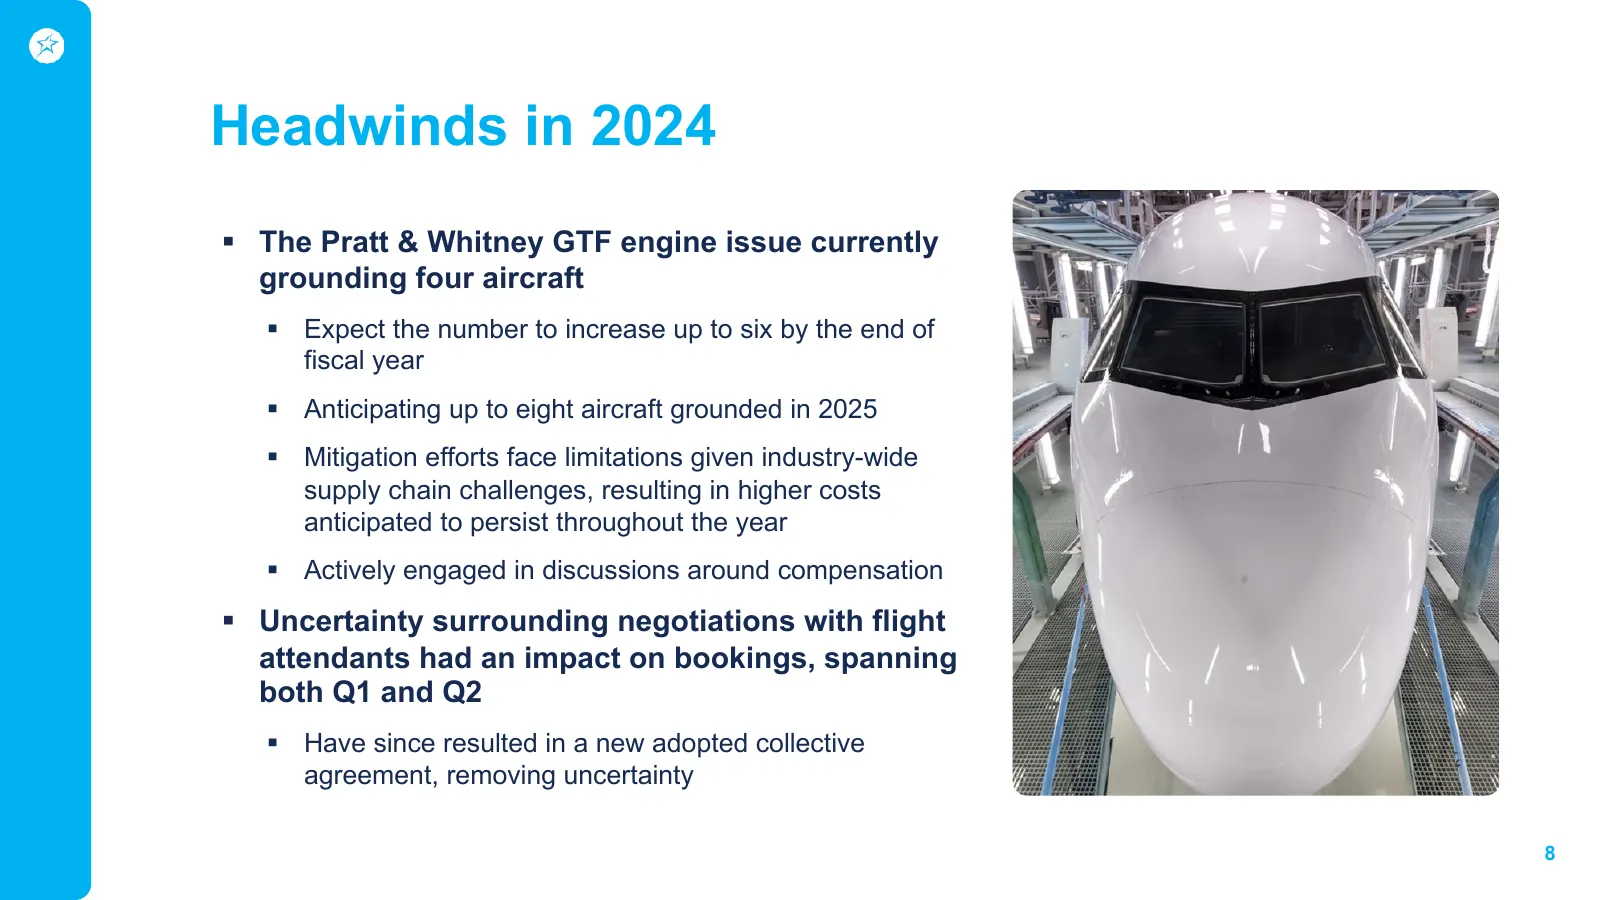
Headwinds in 2024 § The Pratt & Whitney GTF engine issue currently grounding four aircraft § Expect the number to increase up to six by the end of fiscal year § Anticipating up to eight aircraft grounded in 2025 § Mitigation efforts face limitations given industry-wide supply chain challenges, resul
Slide 9: Summary
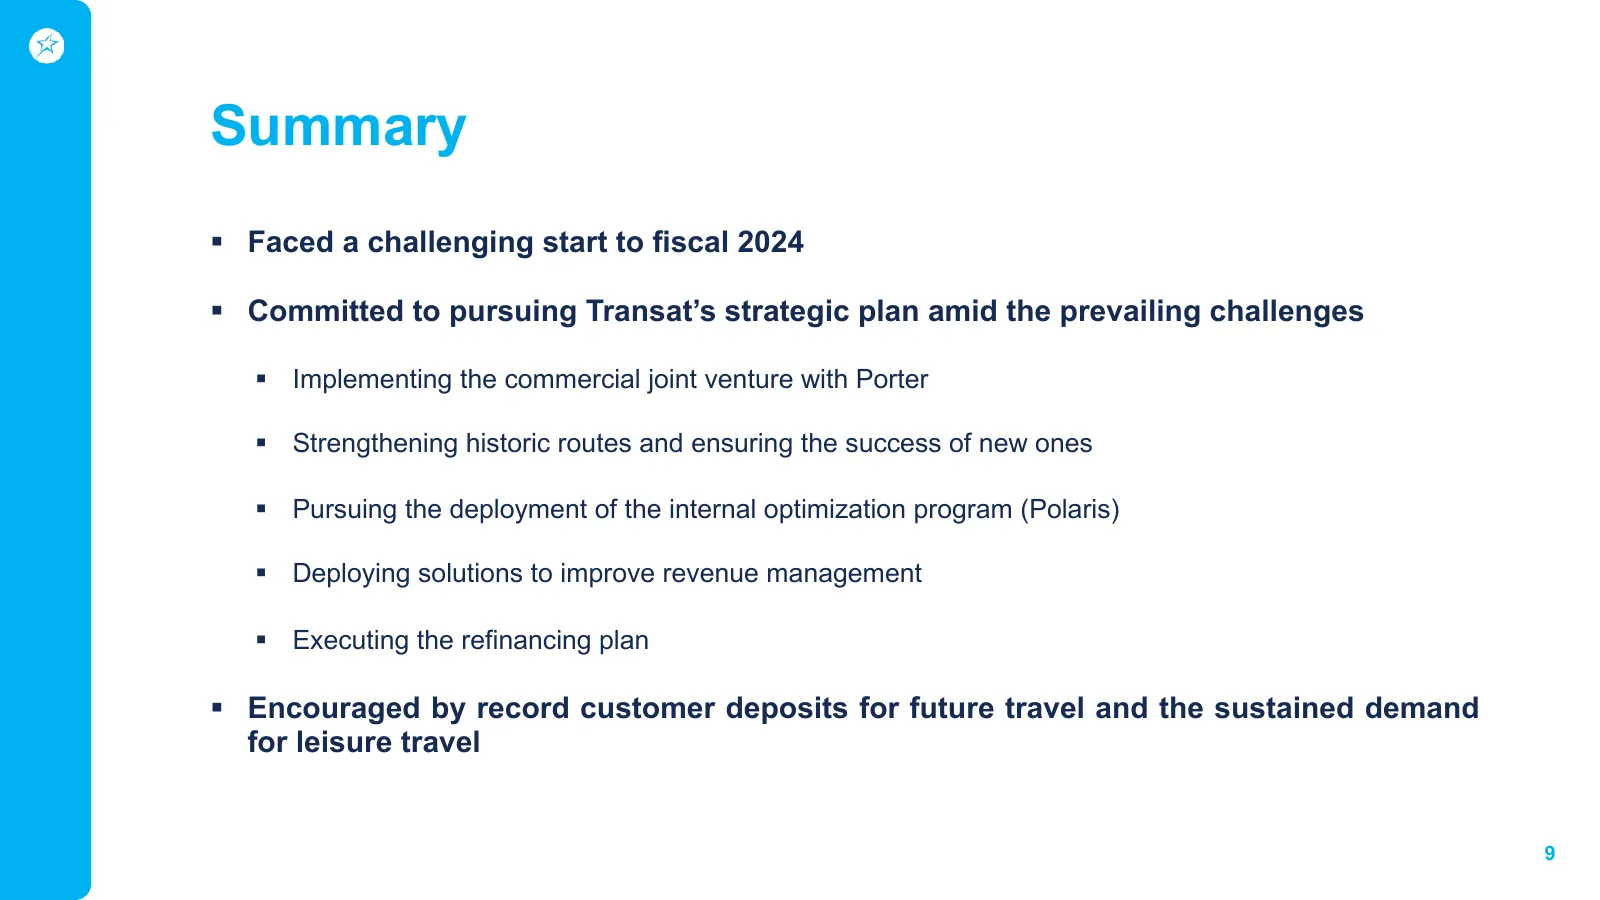
Summary § Faced a challenging start to fiscal 2024 § Committed to pursuing Transat’s strategic plan amid the prevailing challenges § Implementing the commercial joint venture with Porter § Strengthening historic routes and ensuring the success of new ones § Pursuing the deployment of the internal op
Slide 10: Financial Review Q1 2024
Financial Review Q1 2024 10
Slide 11: Financial Highlights
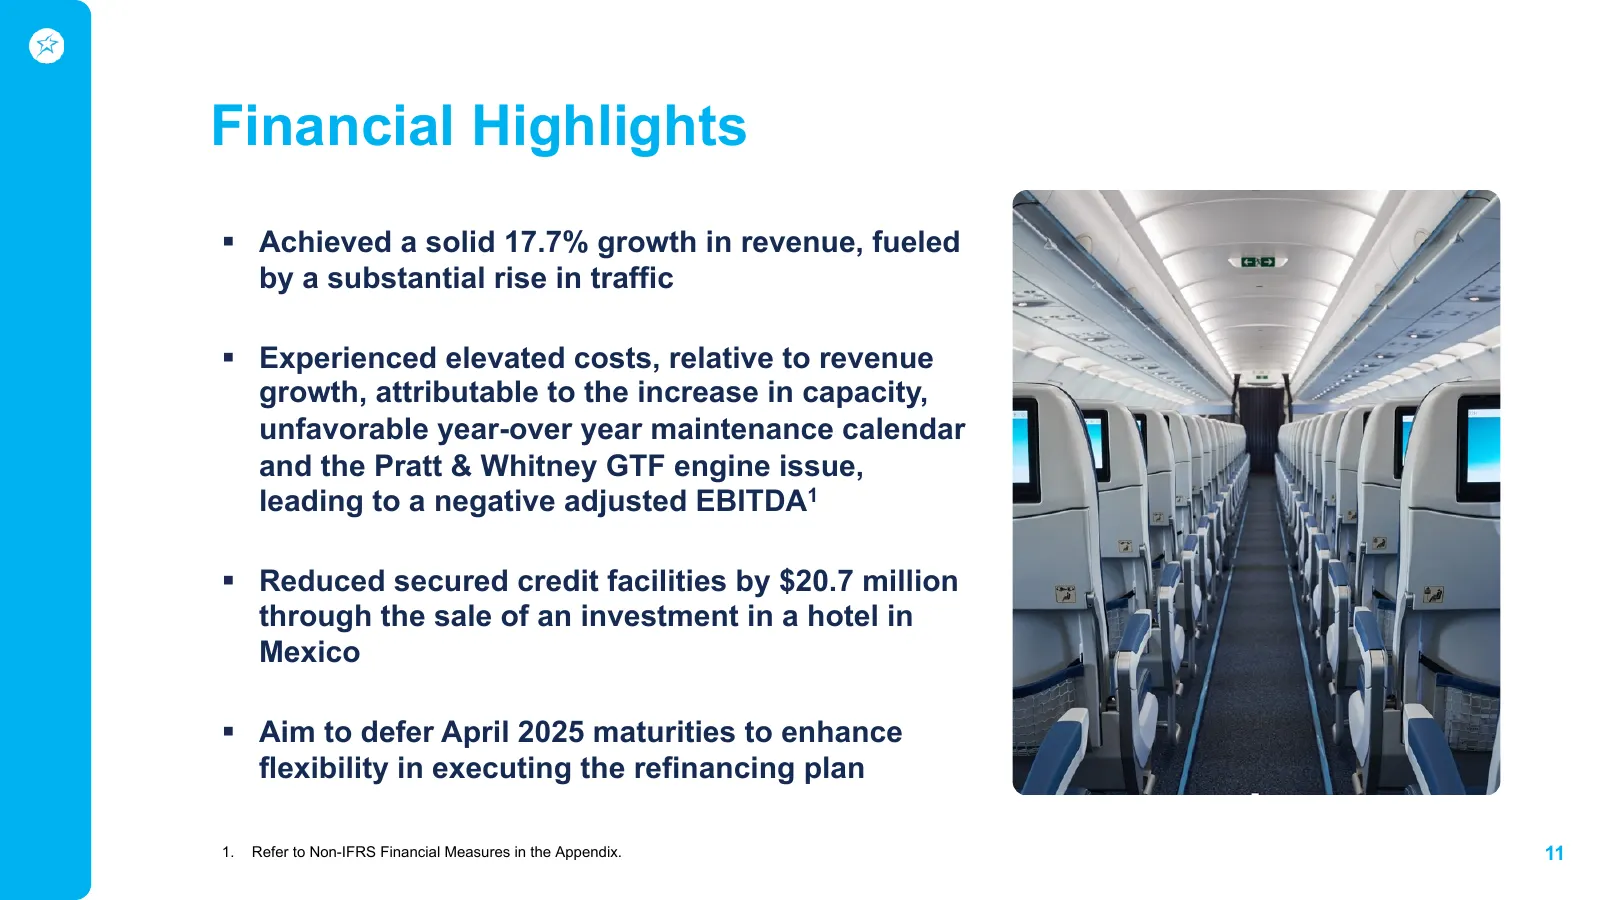
Financial Highlights § Achieved a solid 17.7% growth in revenue, fueled by a substantial rise in traffic § Experienced elevated costs, relative to revenue growth, attributable to the increase in capacity, unfavorable year-over year maintenance calendar and the Pratt & Whitney GTF engine issue, leadi
Slide 12: Q1 2024 Results
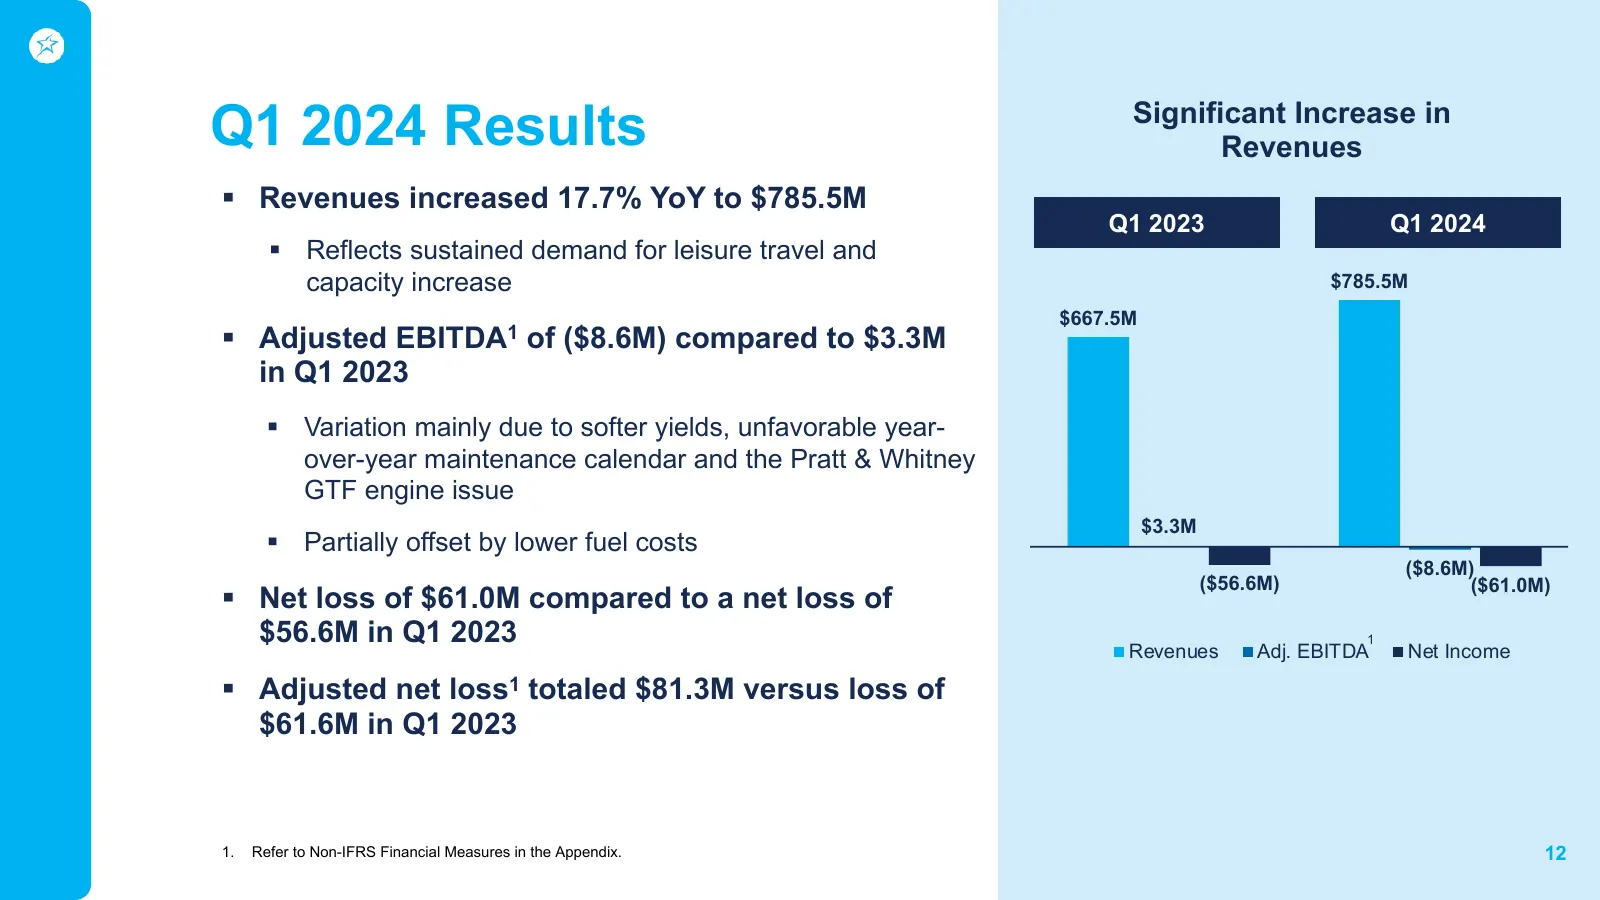
Q1 2024 Results Significant Increase in Revenues § Revenues increased 17.7% YoY to $785.5M Q1 2023 Q1 2024 § Reflects sustained demand for leisure travel and capacity increase $785.5M $667.5M § Adjusted EBITDA1 of ($8.6M) compared to $3.3M in Q1 2023 § Variation mainly due to softer yields, unfavora
Slide 13: Improved Financial Profile
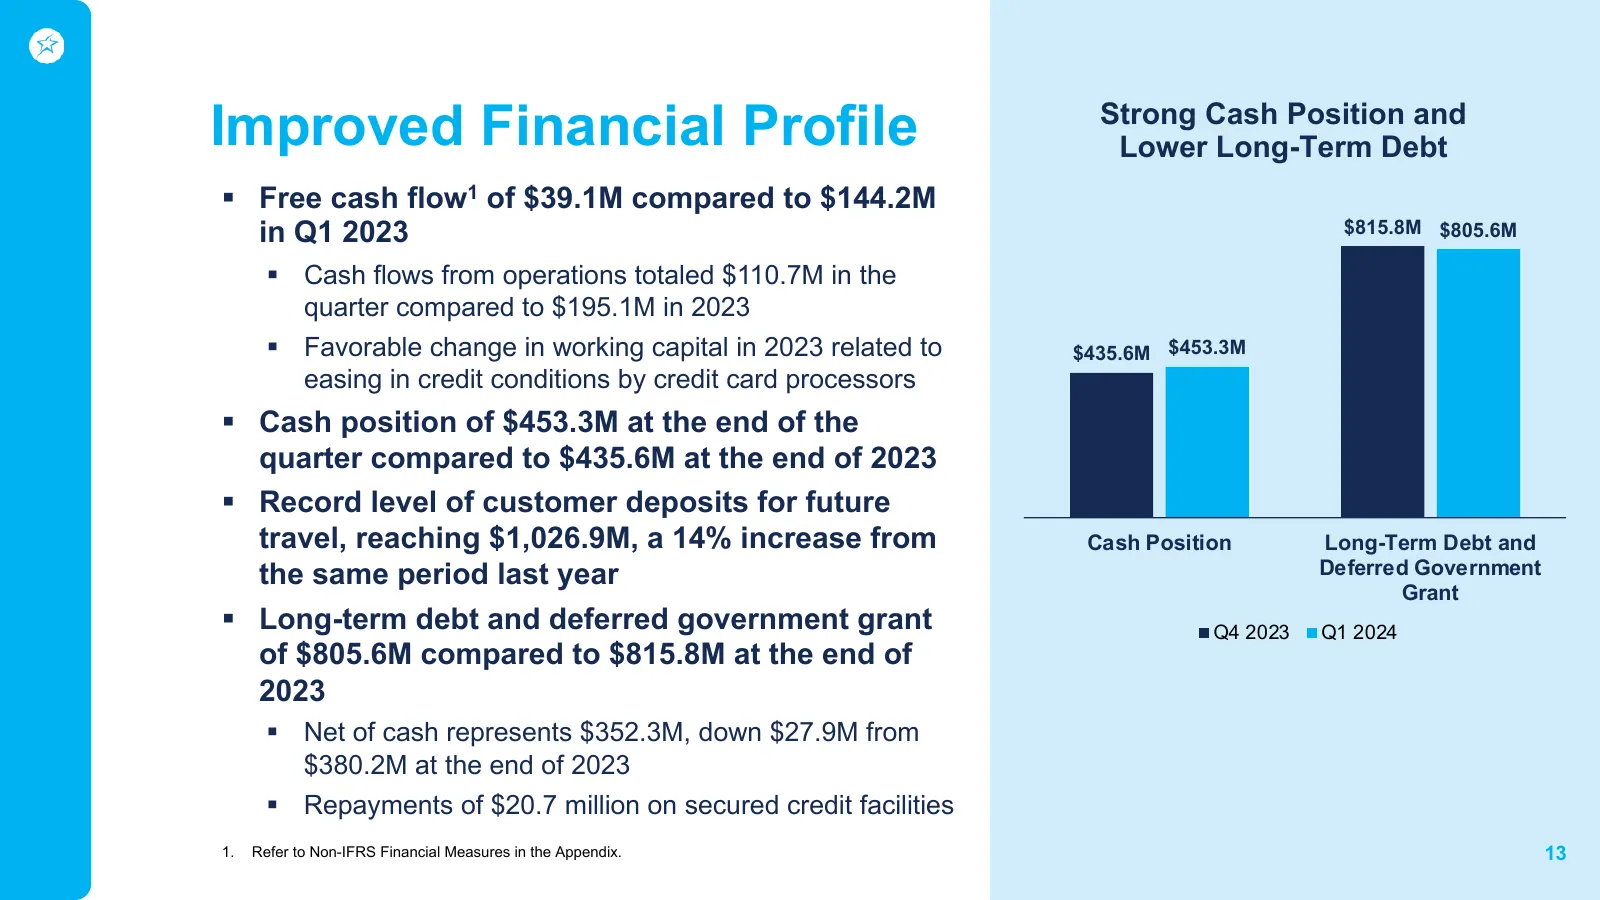
Improved Financial Profile Strong Cash Position and Lower Long-Term Debt § Free cash flow1 of $39.1M compared to $144.2M in Q1 2023 $815.8M $805.6M § Cash flows from operations totaled $110.7M in the quarter compared to $195.1M in 2023 § Favorable change in working capital in 2023 related to $435.6M
Slide 14: Refinancing Plan Update
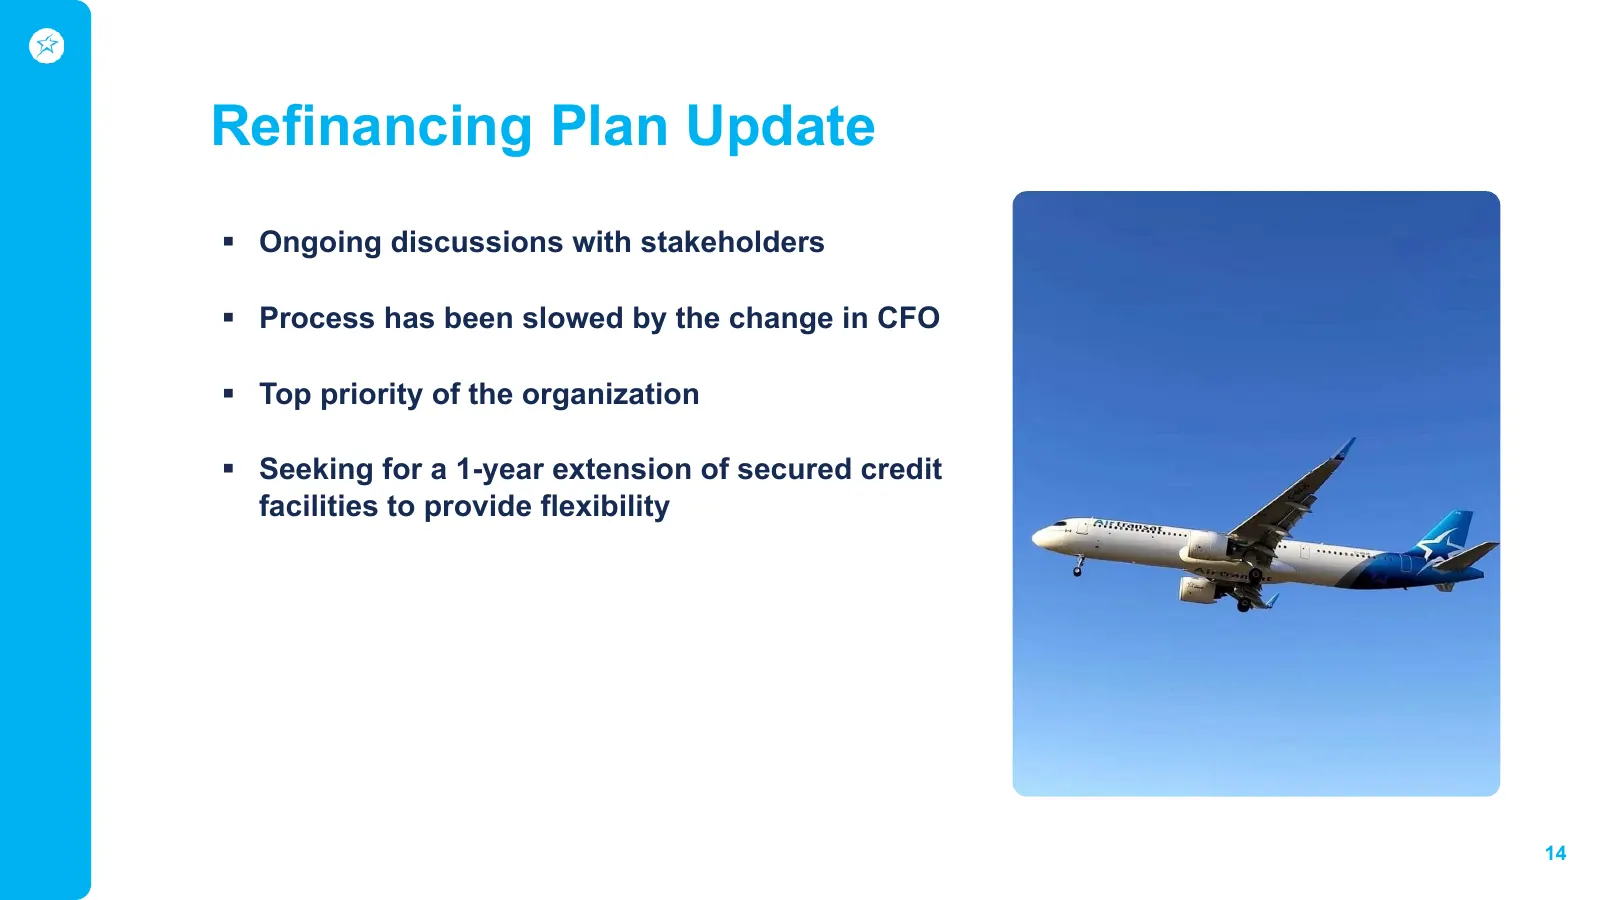
Refinancing Plan Update § Ongoing discussions with stakeholders § Process has been slowed by the change in CFO § Top priority of the organization § Seeking for a 1-year extension of secured credit facilities to provide flexibility 14
Slide 15: Outlook
Outlook § Adjusted EBITDA1 margin for the full year 2024 expected at the lower end of the range of 7.5% to 9.0% announced last December § Anticipating 13% increase in available capacity for the year § Main assumptions for forecast • Weak growth in Canada’s GDP • Exchange rate of C$1.34 to US$1.00 •
Slide 16: Appendix
Appendix 16
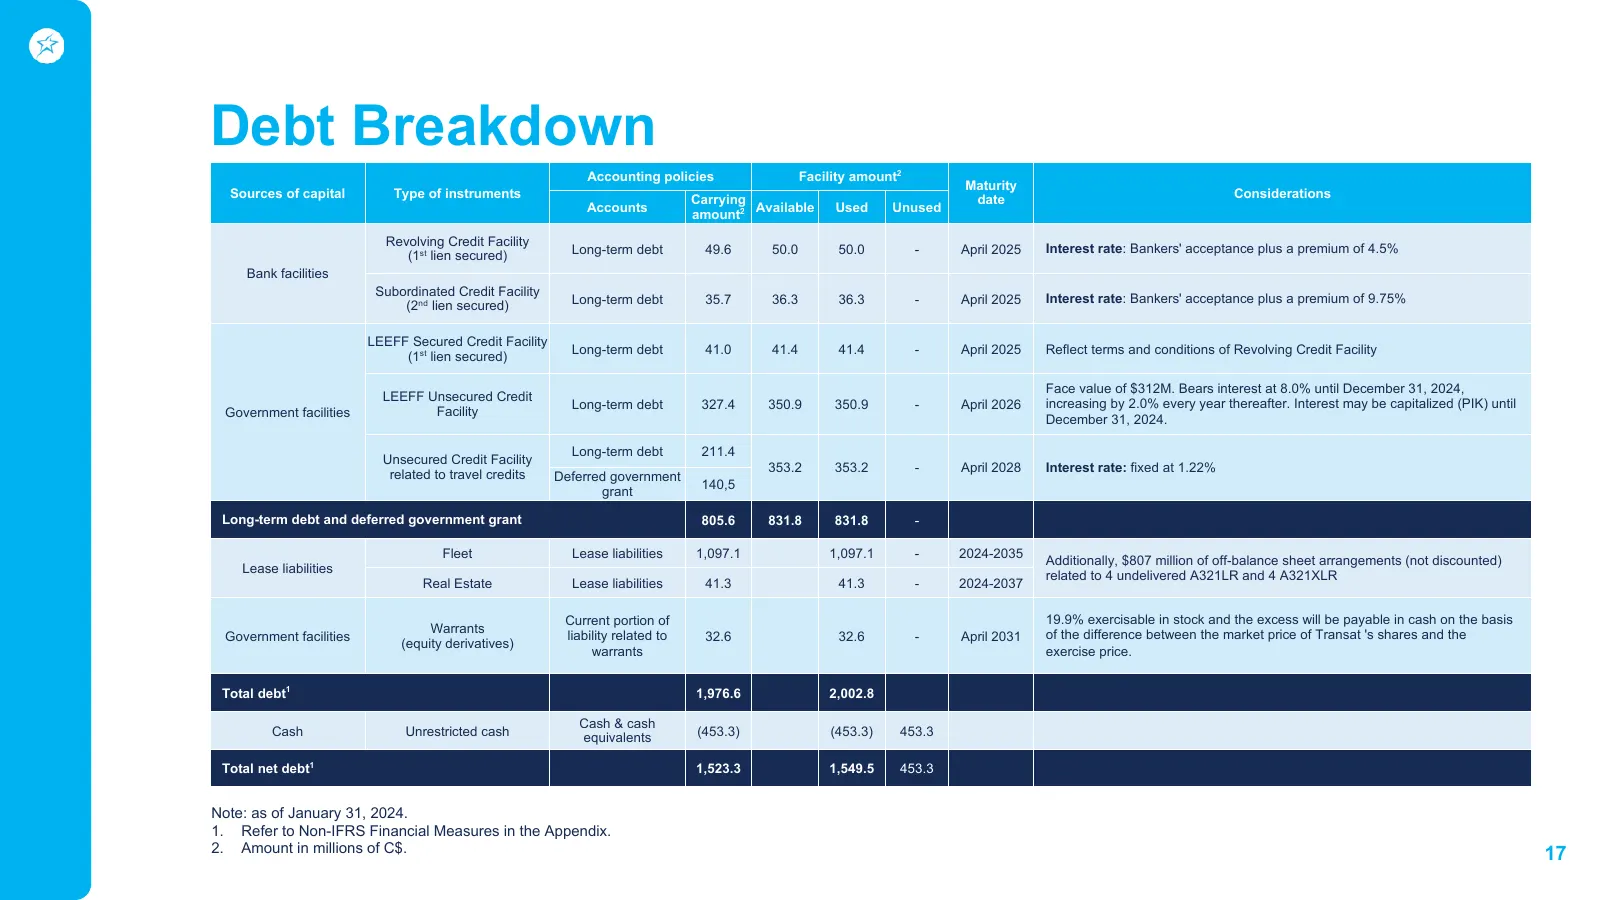
Slide 17: Debt Breakdown
Debt Breakdown Accounting policies Facility amount2 Maturity Sources of capital Type of instruments Carrying Considerations date Accounts Available Used Unused amount2 Revolving Credit Facility Long-term debt 49.6 50.0 50.0 - April 2025 Interest rate: Bankers' acceptance plus a premium of 4.5% (1st
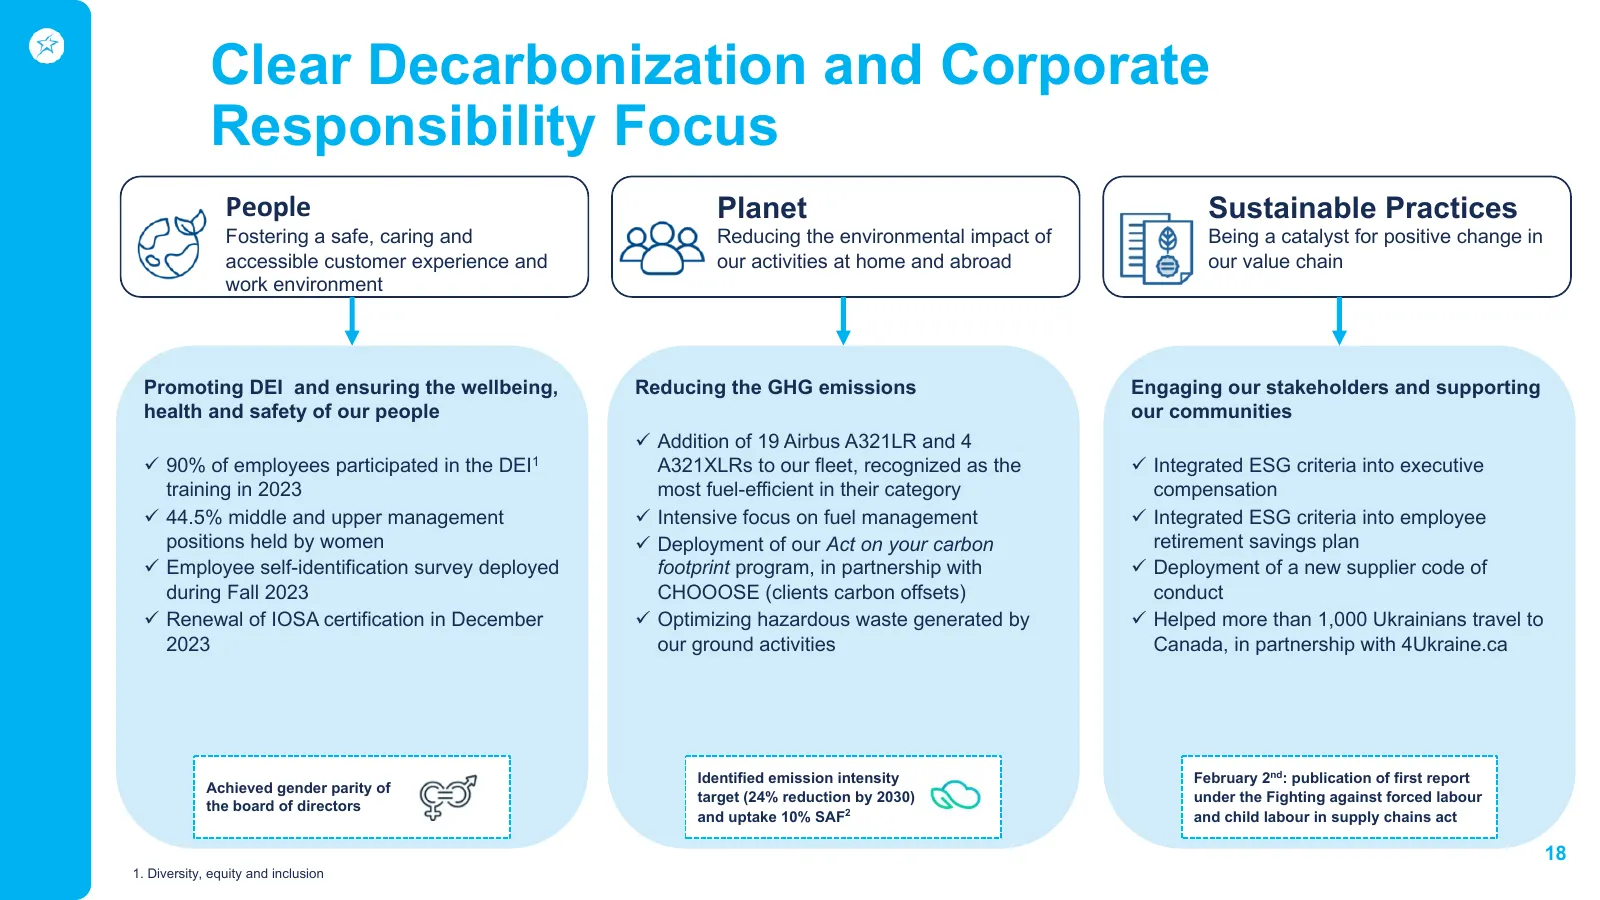
Slide 18: Clear Decarbonization and Corporate Responsibility Focus
Clear Decarbonization and Corporate Responsibility Focus People Planet Sustainable Practices Fostering a safe, caring and Reducing the environmental impact of Being a catalyst for positive change in accessible customer experience and our activities at home and abroad our value chain work environment
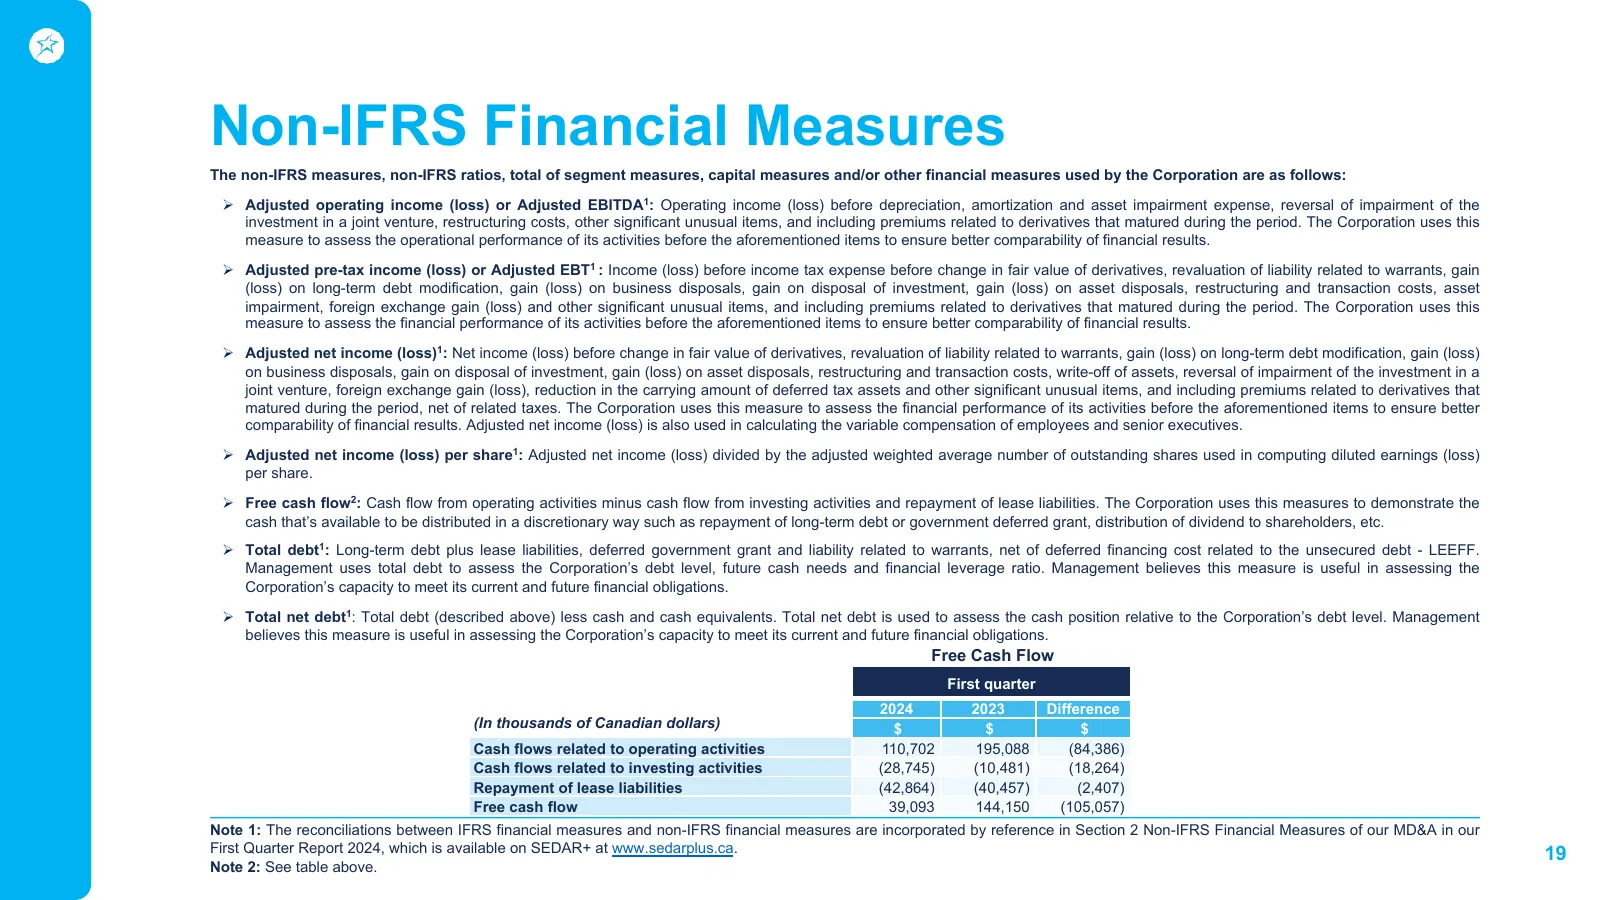
Slide 19: Non-IFRS Financial Measures
Non-IFRS Financial Measures The non-IFRS measures, non-IFRS ratios, total of segment measures, capital measures and/or other financial measures used by the Corporation are as follows: Ø Adjusted operating income (loss) or Adjusted EBITDA1: Operating income (loss) before depreciation, amortization an
Source: Internet Archive copy of transat.com
More decks from Transat A.T. Inc.
 Q3 2026 Earnings Presentation14 slides · Sep 10, 2026
 Q1 2026 Earnings Presentation15 slides · Mar 10, 2026
 Q4 2025 Earnings Presentation16 slides · Dec 18, 2025
 Q3 2025 Earnings Presentation16 slides · Sep 11, 2025
 Q4 2023 Earnings Presentation20 slides · December 2023
 Merger or Acquisition (November 2023)8 slides · Nov 28, 2023