Rockwool A/S Class A · OMXCOP:ROCK_A
Rockwool A/S Class A — Rockwool International — Non-Deal Roadshow (November 2010)
53 slides from Rockwool A/S Class A's roadshow presentation, Nov 25, 2010
Slide 1: Roadshow London 25 November 2010
Roadshow London 25 November 2010 Jens1 Krogsgaard, VP, Group Finance Thorkild Diness Jensen, VP, Group Communications 1
Slide 2: Forward-looking statement
Forward-looking statement The statements on the future in this presentation, including expected sales and earnings, are associated with risks and uncertainties and may be affected by factors influencing the activities of the group, e.g. the global economic environment, including interest and exchang
Slide 3: The Rockwool Group
The Rockwool Group 3 3
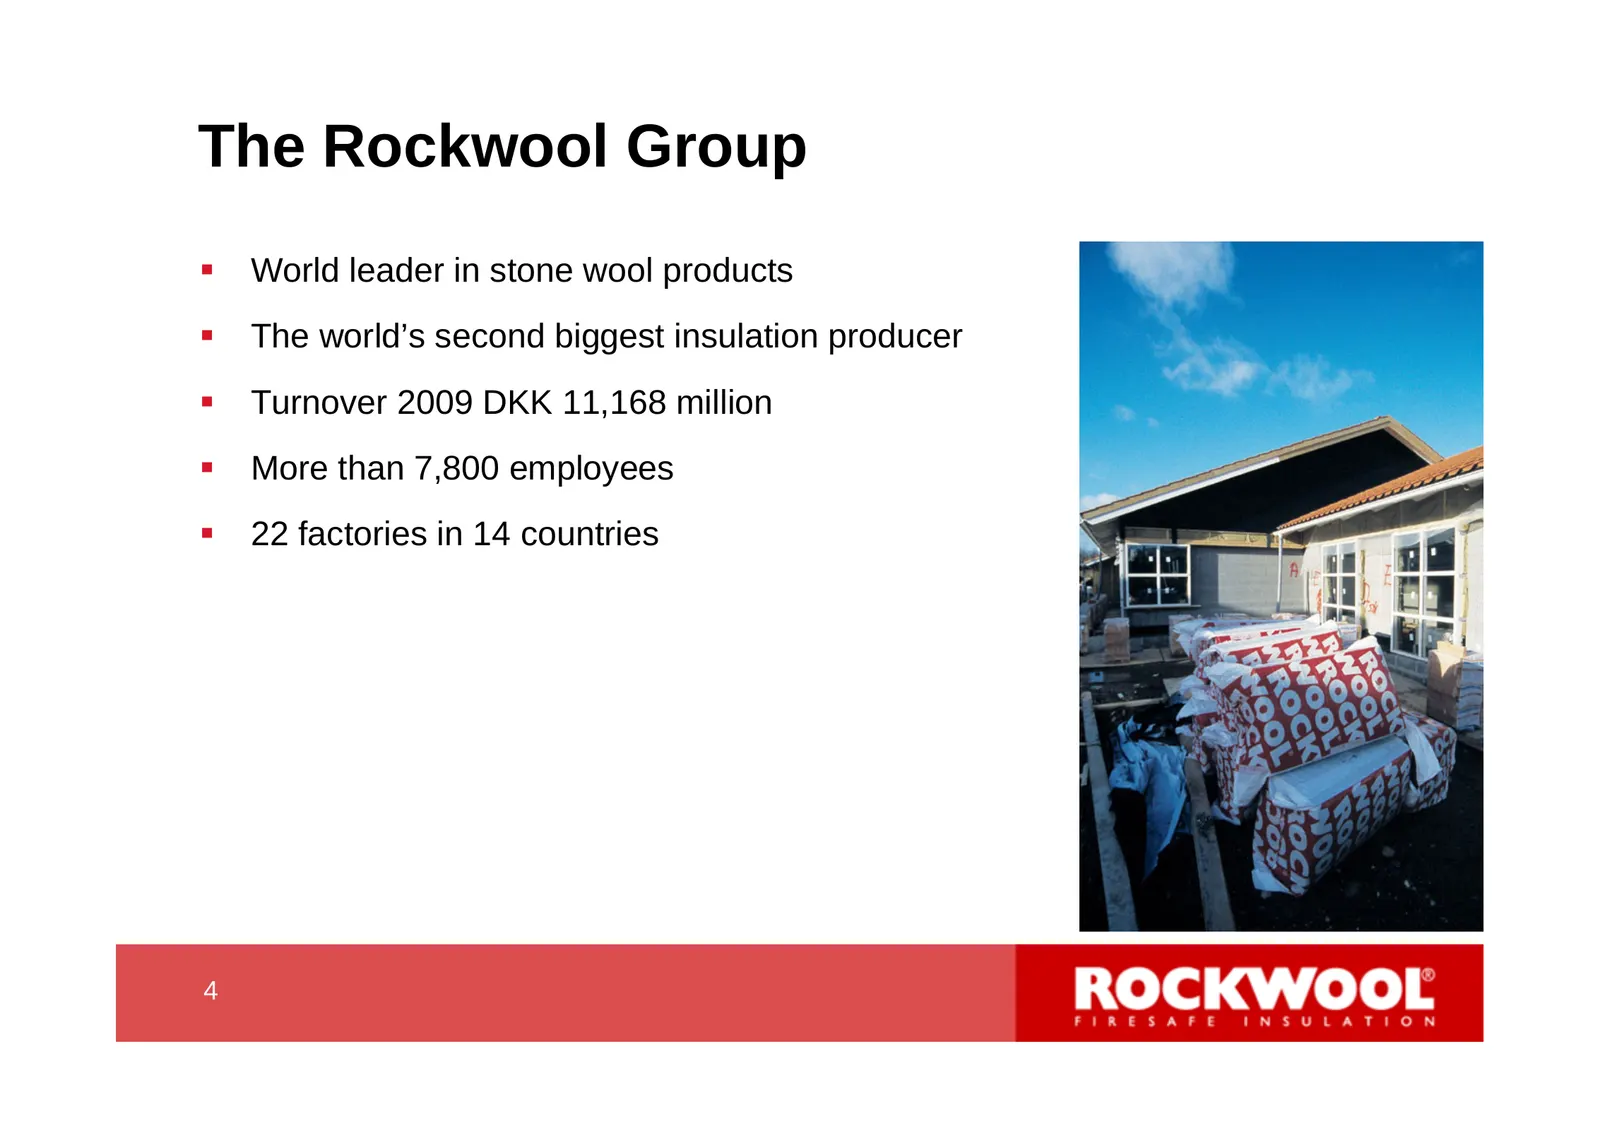
Slide 4: The Rockwool Group
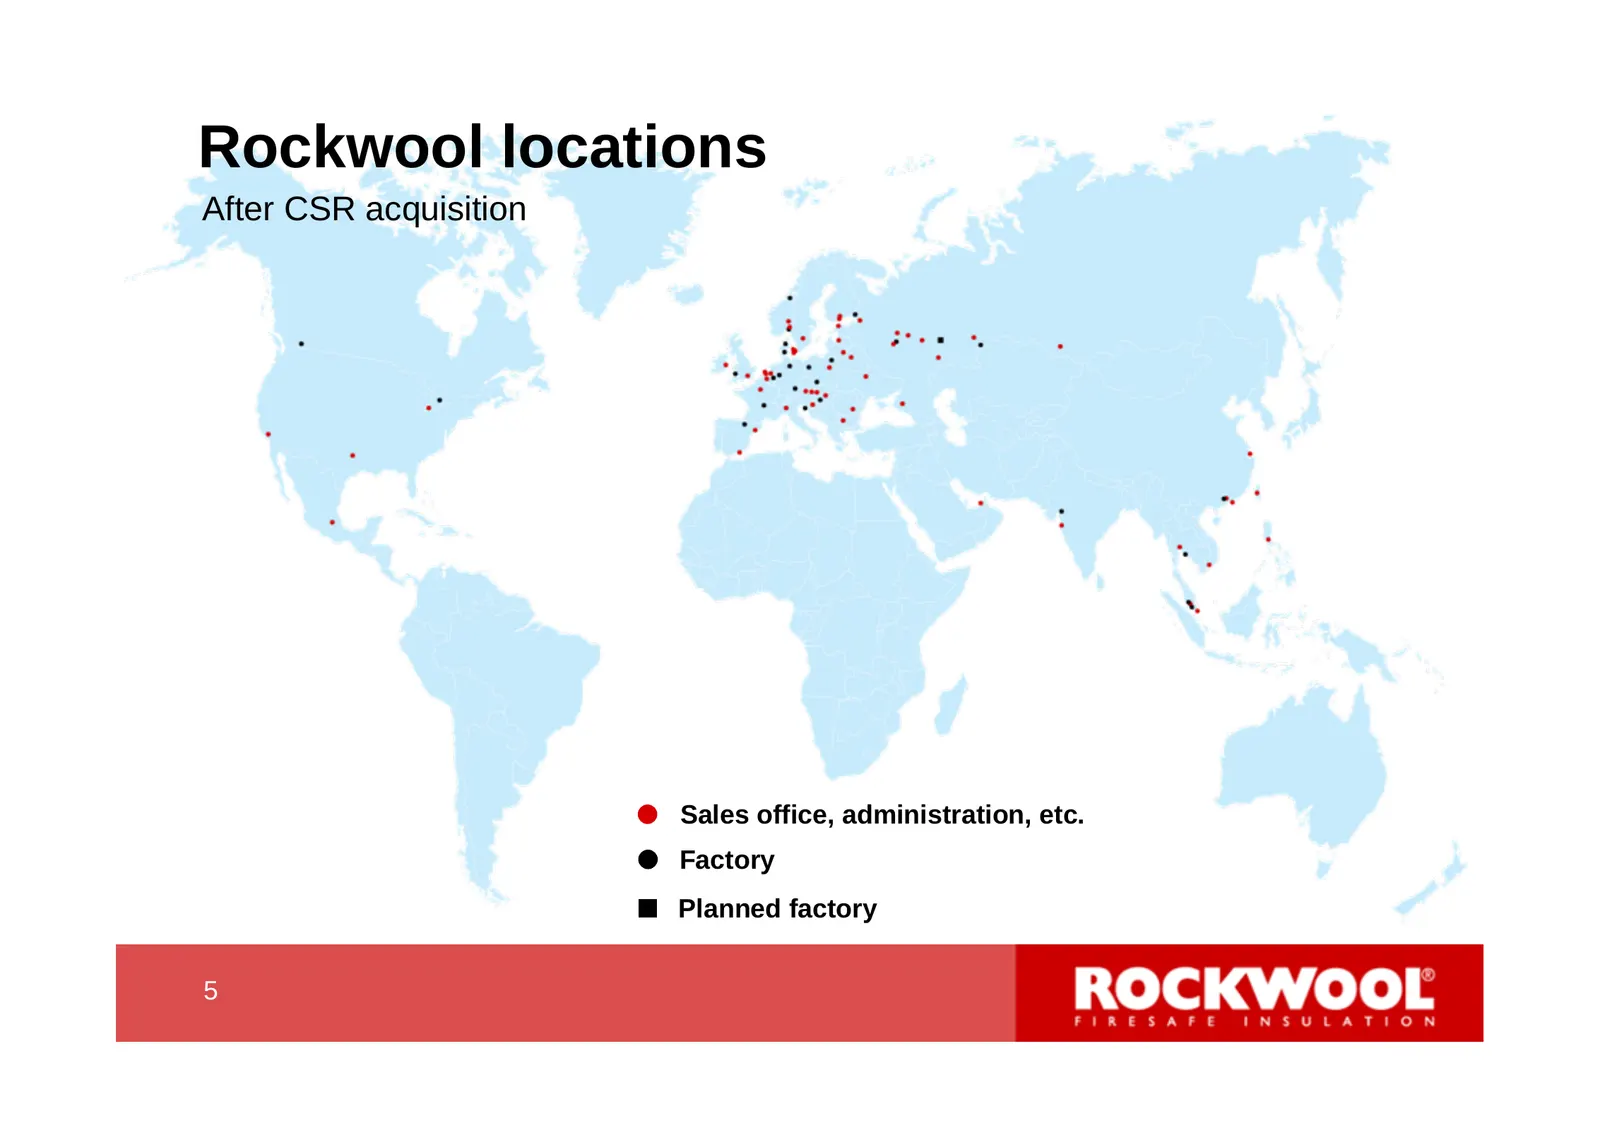
The Rockwool Group World leader in stone wool products The world’s second biggest insulation producer Turnover 2009 DKK 11,168 million More than 7,800 employees 22 factories in 14 countries 4 4
Slide 5: Rockwool locations
Rockwool locations After CSR acquisition Sales office, administration, etc. Factory Planned factory 5 5
Slide 6: Sales distributed on countries
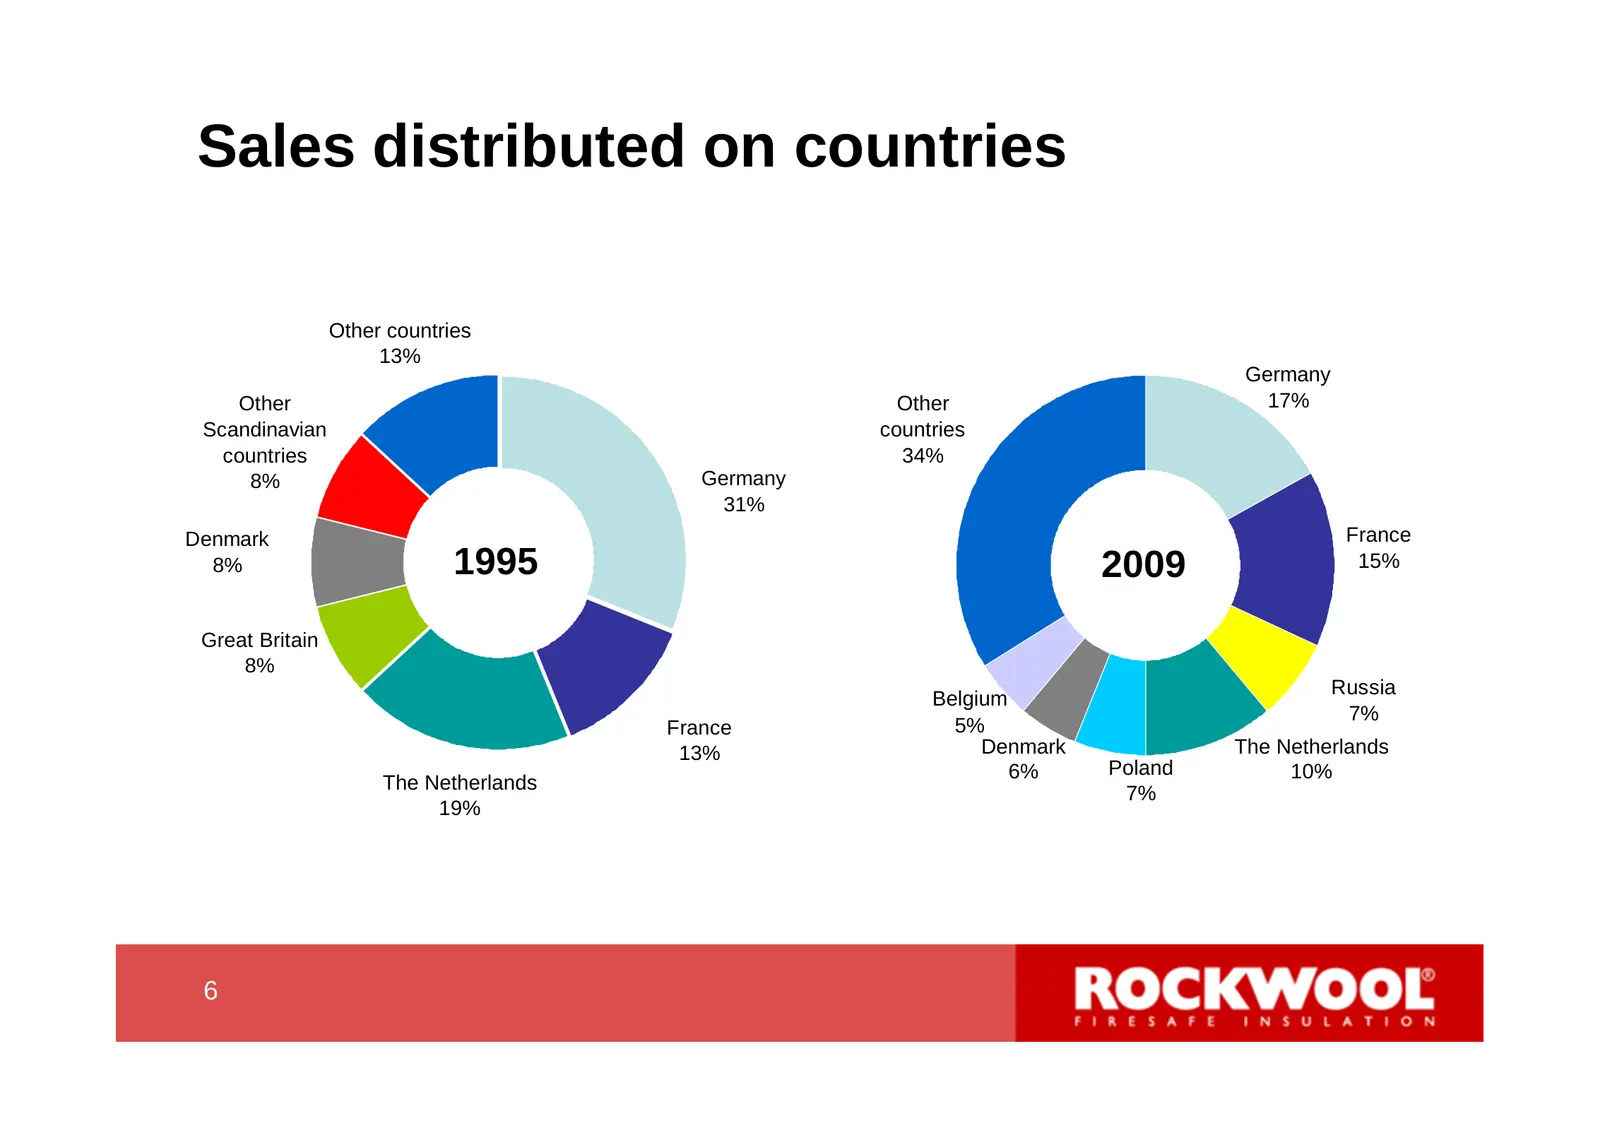
Sales distributed on countries Other countries 13% Germany Other Other 17% Scandinavian countries countries 34% 8% Germany 31% Denmark France 8% 1995 2009 15% Great Britain 8% Russia Belgium 7% France 5% 13% Denmark The Netherlands 6% Poland 10% The Netherlands 7% 19% 6 6
Slide 7: The Rockwool production is capital intensive
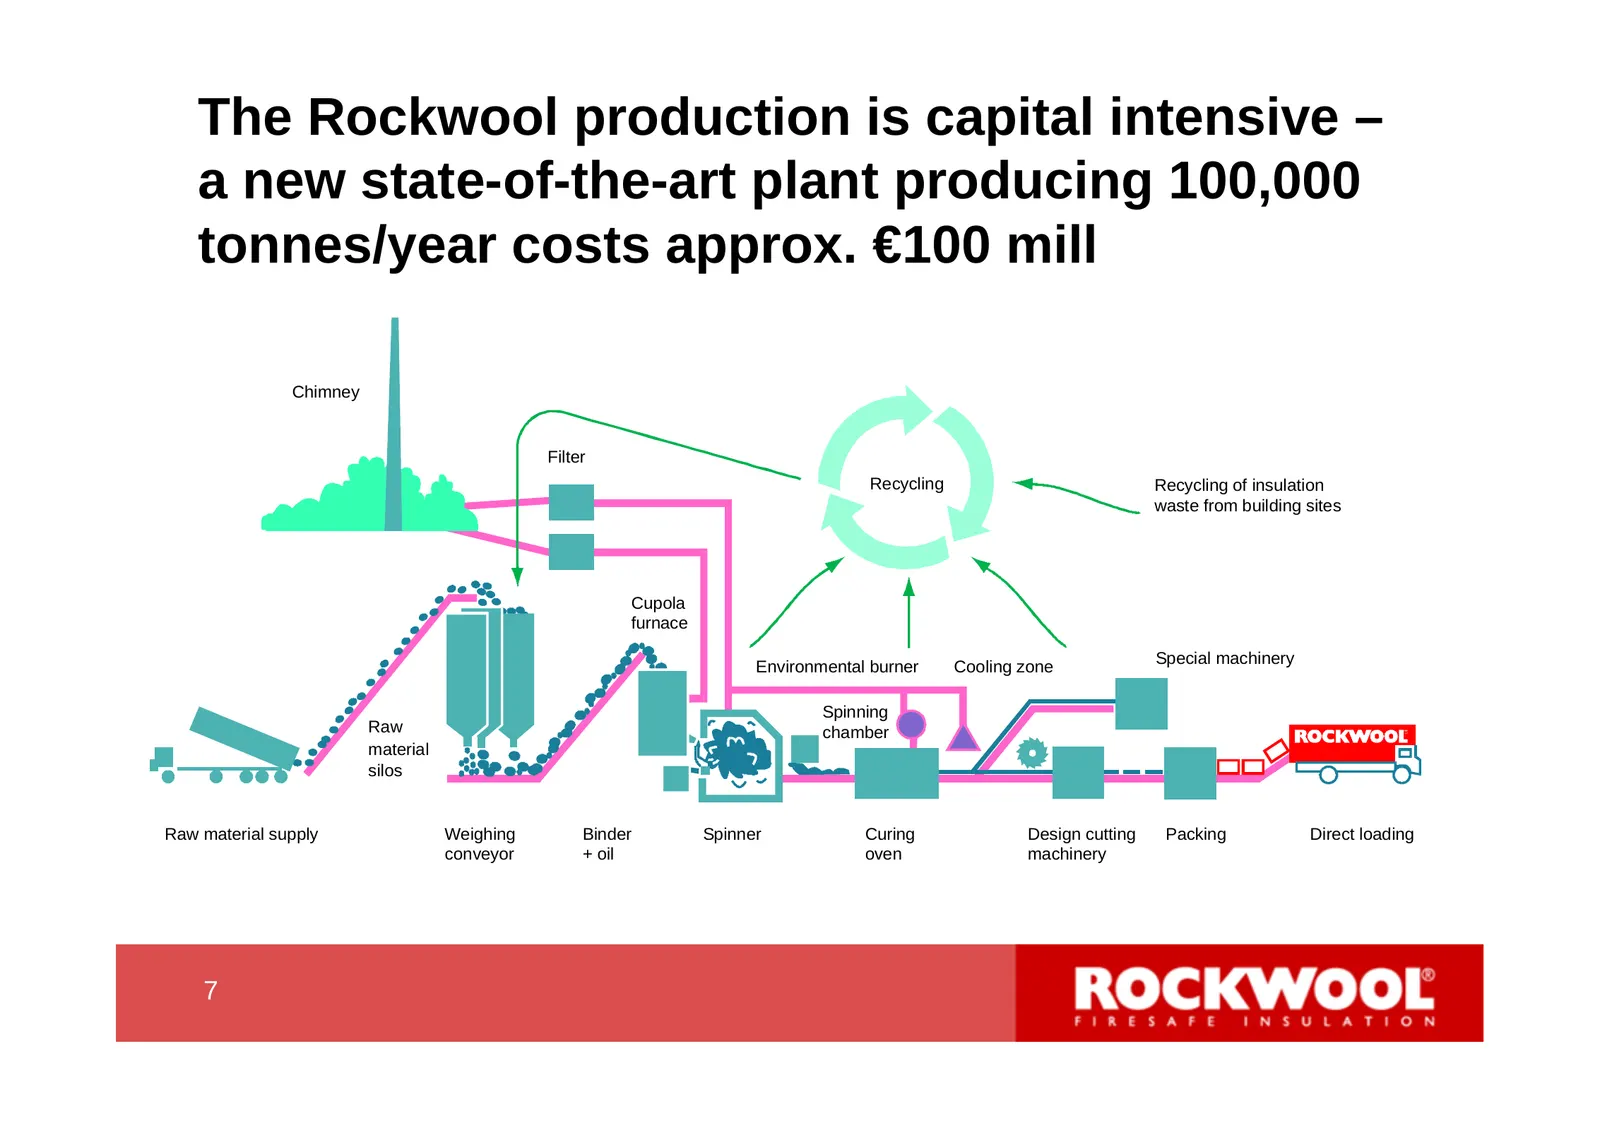
The Rockwool production is capital intensive – a new state-of-the-art plant producing 100,000 tonnes/year costs approx. €100 mill Chimney Filter Recycling Recycling of insulation waste from building sites Cupola furnace Environmental burner Cooling zone Special machinery Spinning Raw chamber materia
Slide 8: Sales distributed on business area
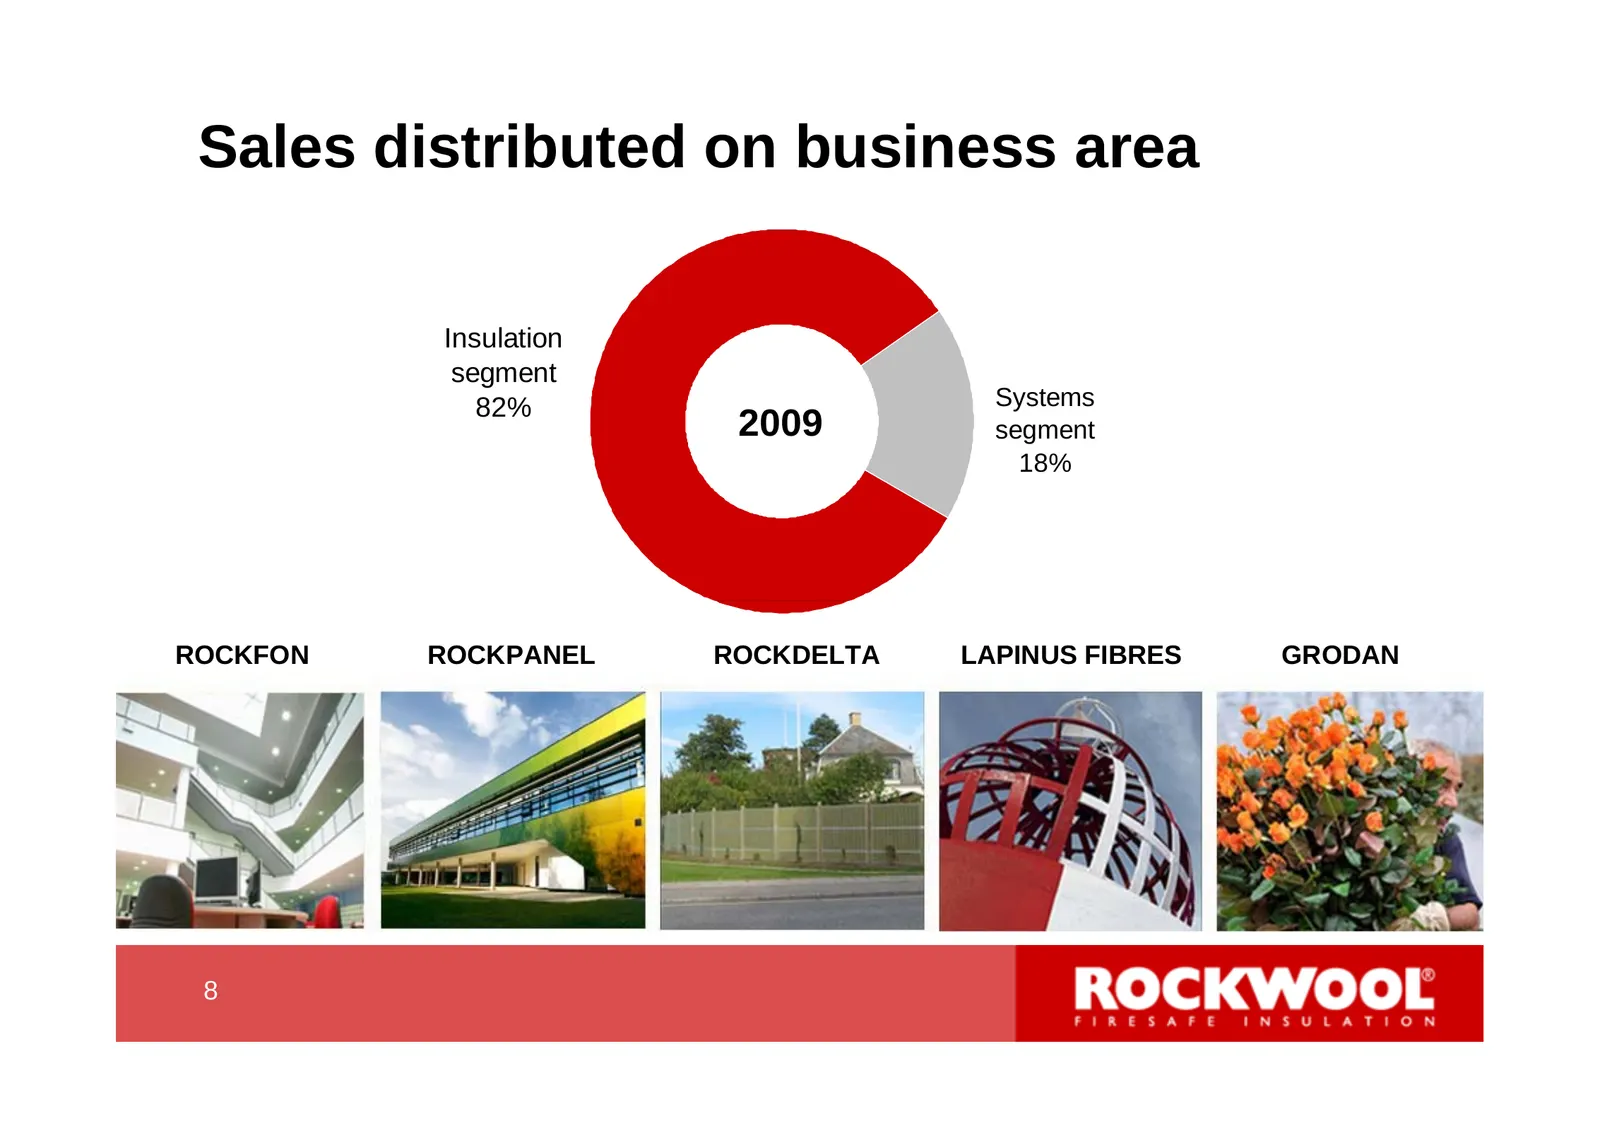
Sales distributed on business area Insulation segment 82% Systems 2009 segment 18% ROCKFON ROCKPANEL ROCKDELTA LAPINUS FIBRES GRODAN 8 8
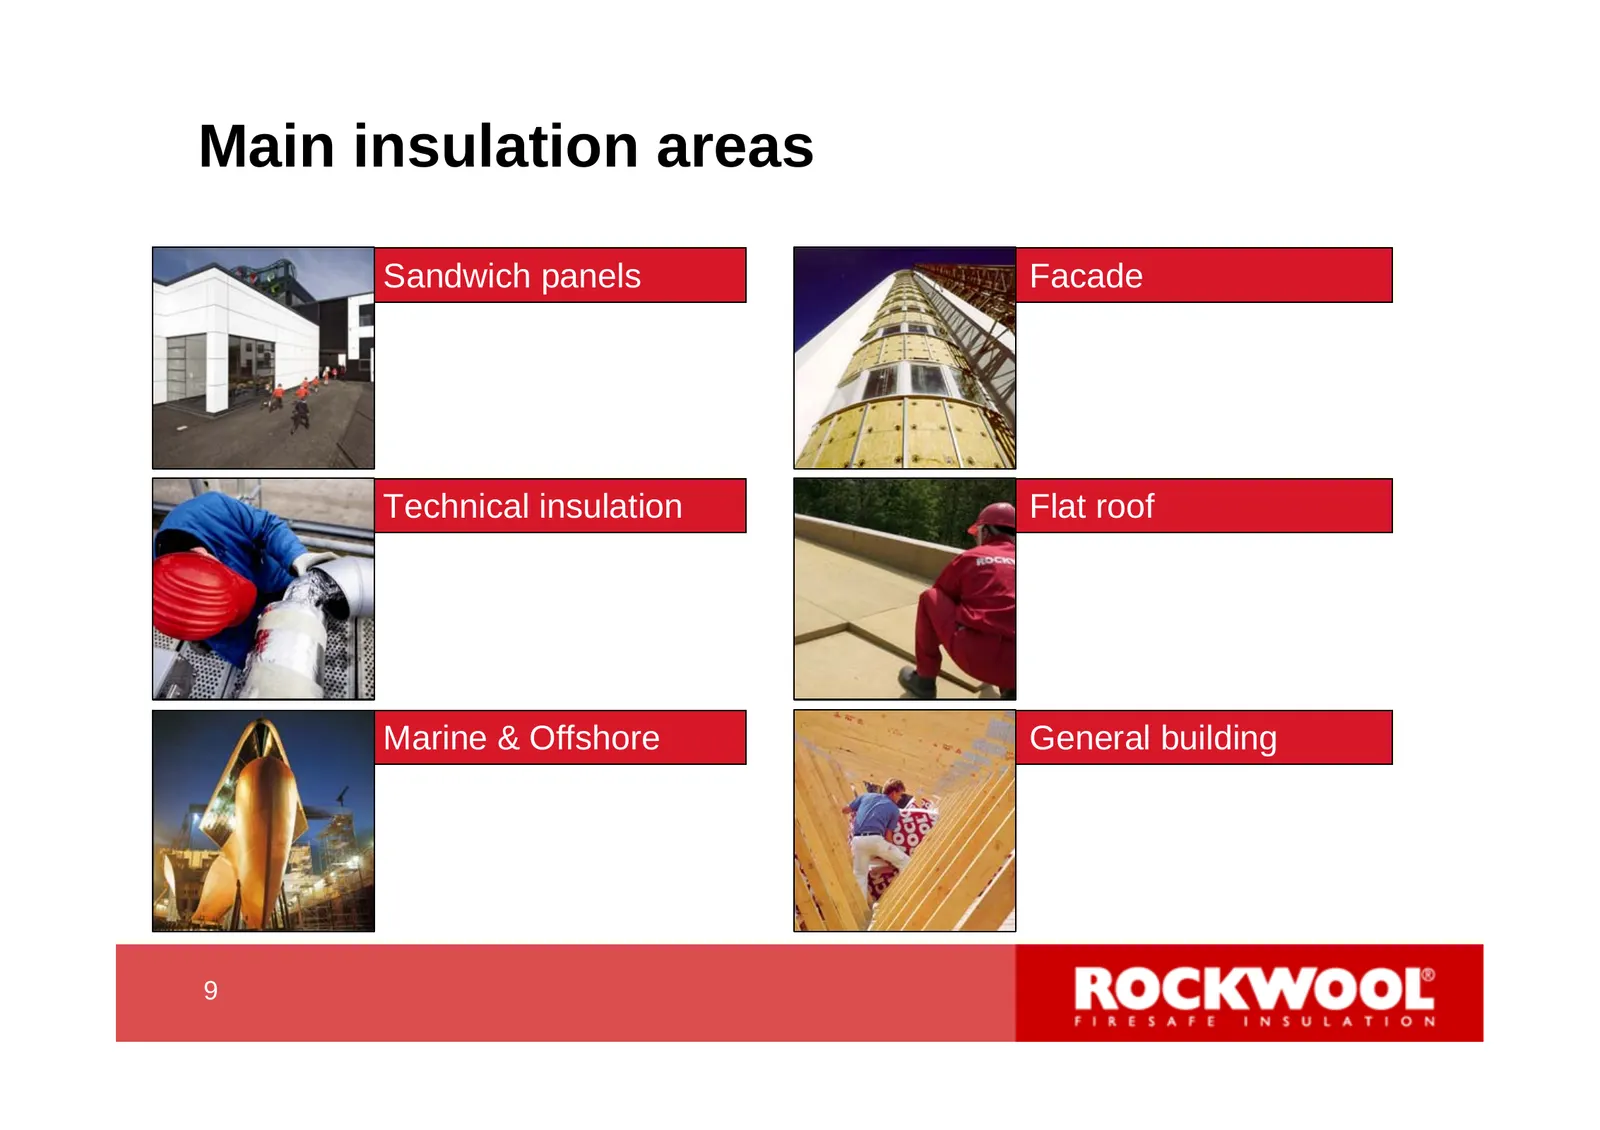
Slide 9: Main insulation areas
Main insulation areas Sandwich panels Facade Technical insulation Flat roof Marine & Offshore General building 9 9
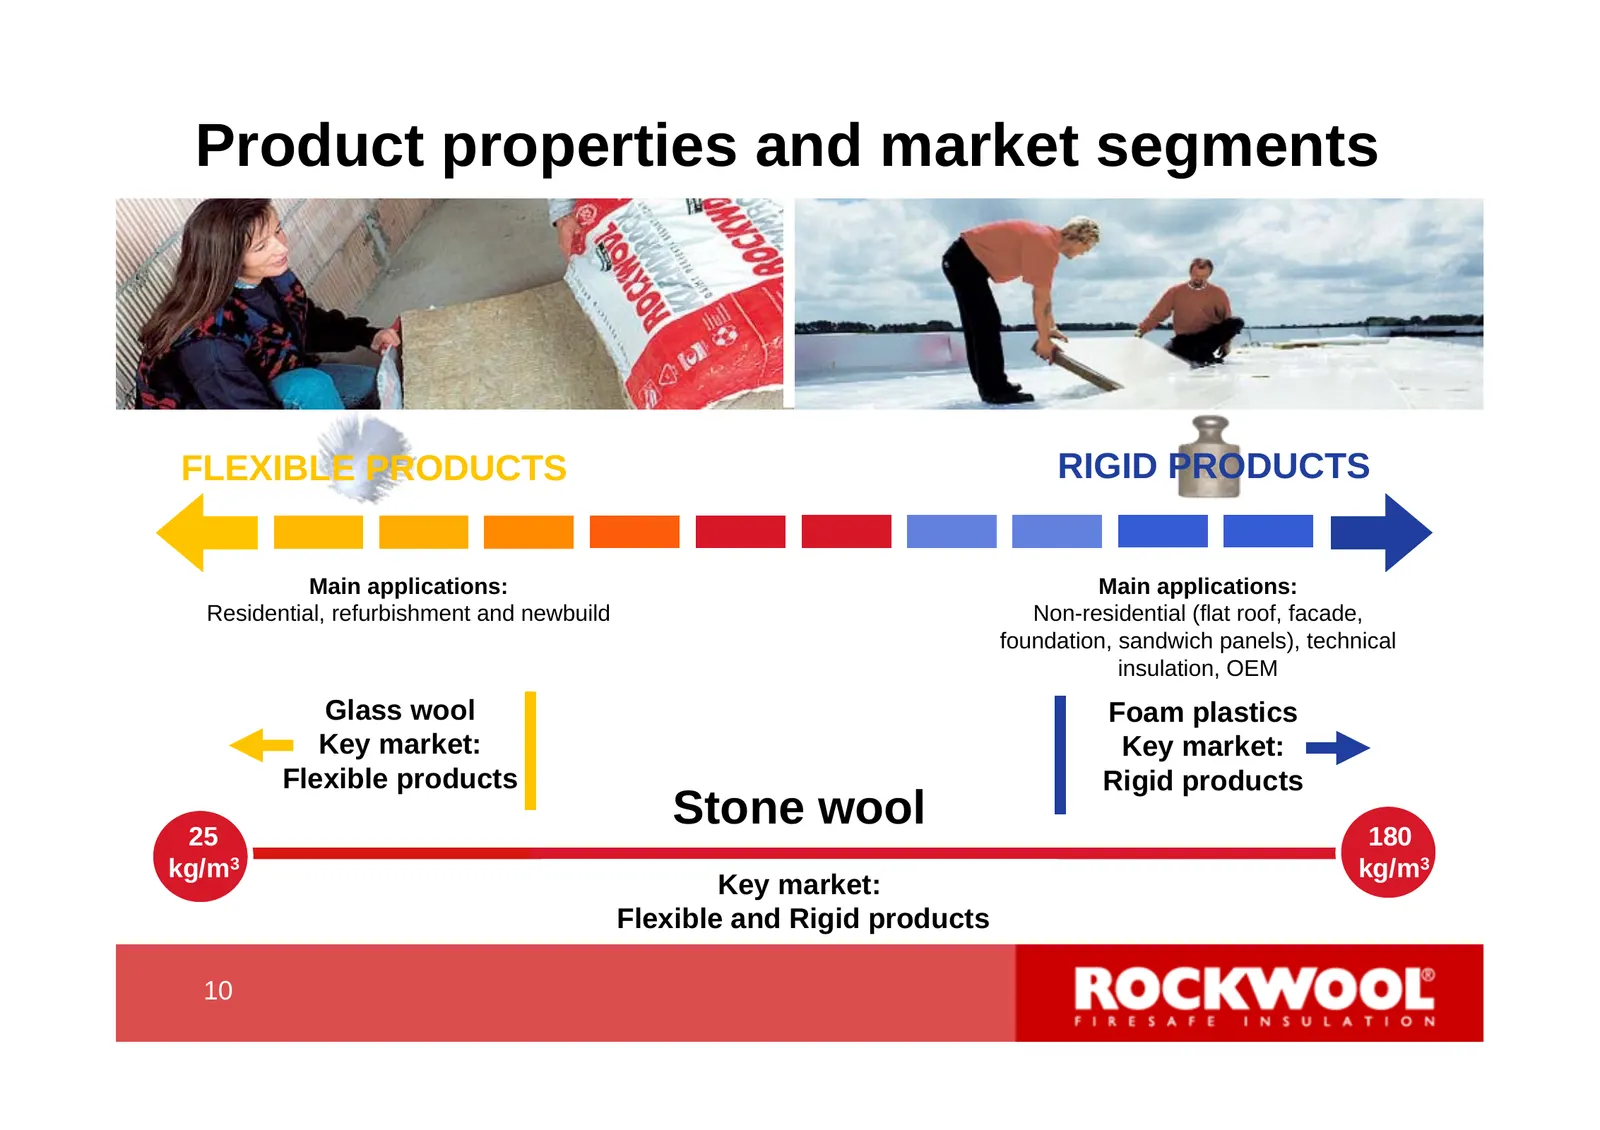
Slide 10: Product properties and market segments
Product properties and market segments FLEXIBLE PRODUCTS RIGID PRODUCTS Main applications: Main applications: Residential, refurbishment and newbuild Non-residential (flat roof, facade, foundation, sandwich panels), technical insulation, OEM Glass wool Foam plastics Key market: Key market: Flexible
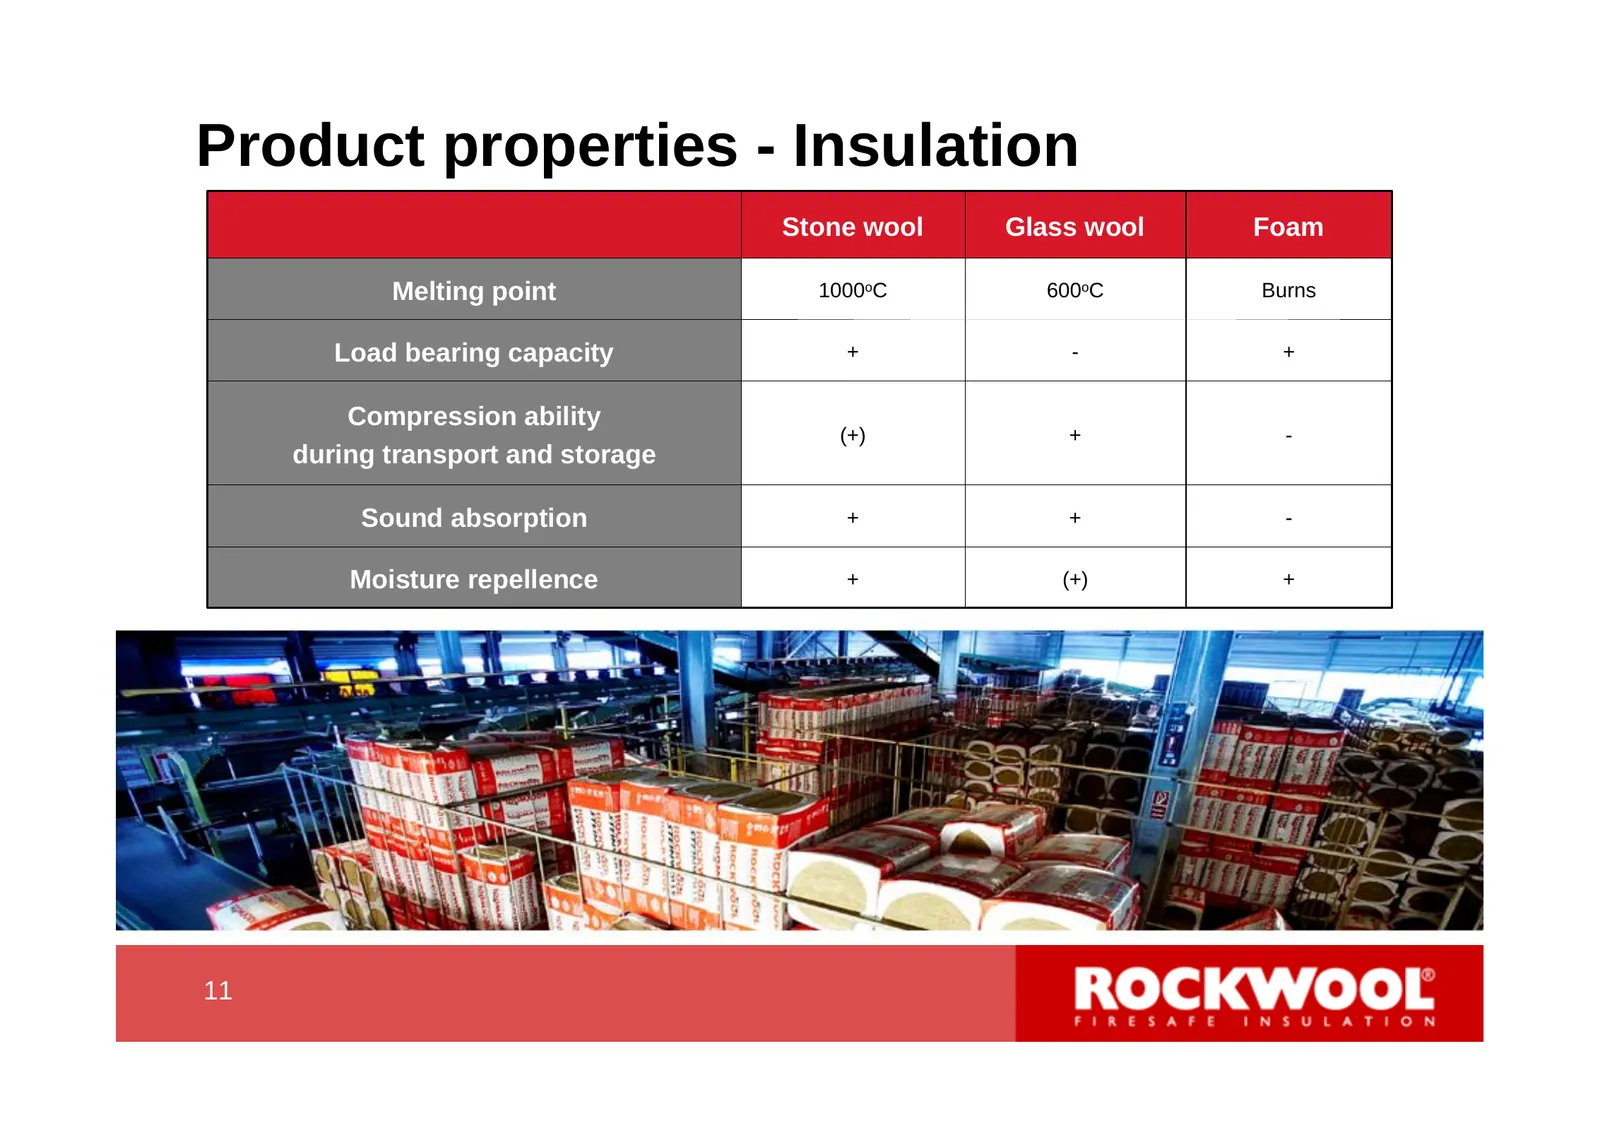
Slide 11: Product properties - Insulation
Product properties - Insulation Stone wool Glass wool Foam Melting point 1000oC 600oC Burns Load bearing capacity + - + Compression ability (+) + - during transport and storage Sound absorption + + - Moisture repellence + (+) + 11 11
Slide 12: Energy and climate as growth drivers
Energy and climate as growth drivers 12 12
Slide 13: Why save energy?
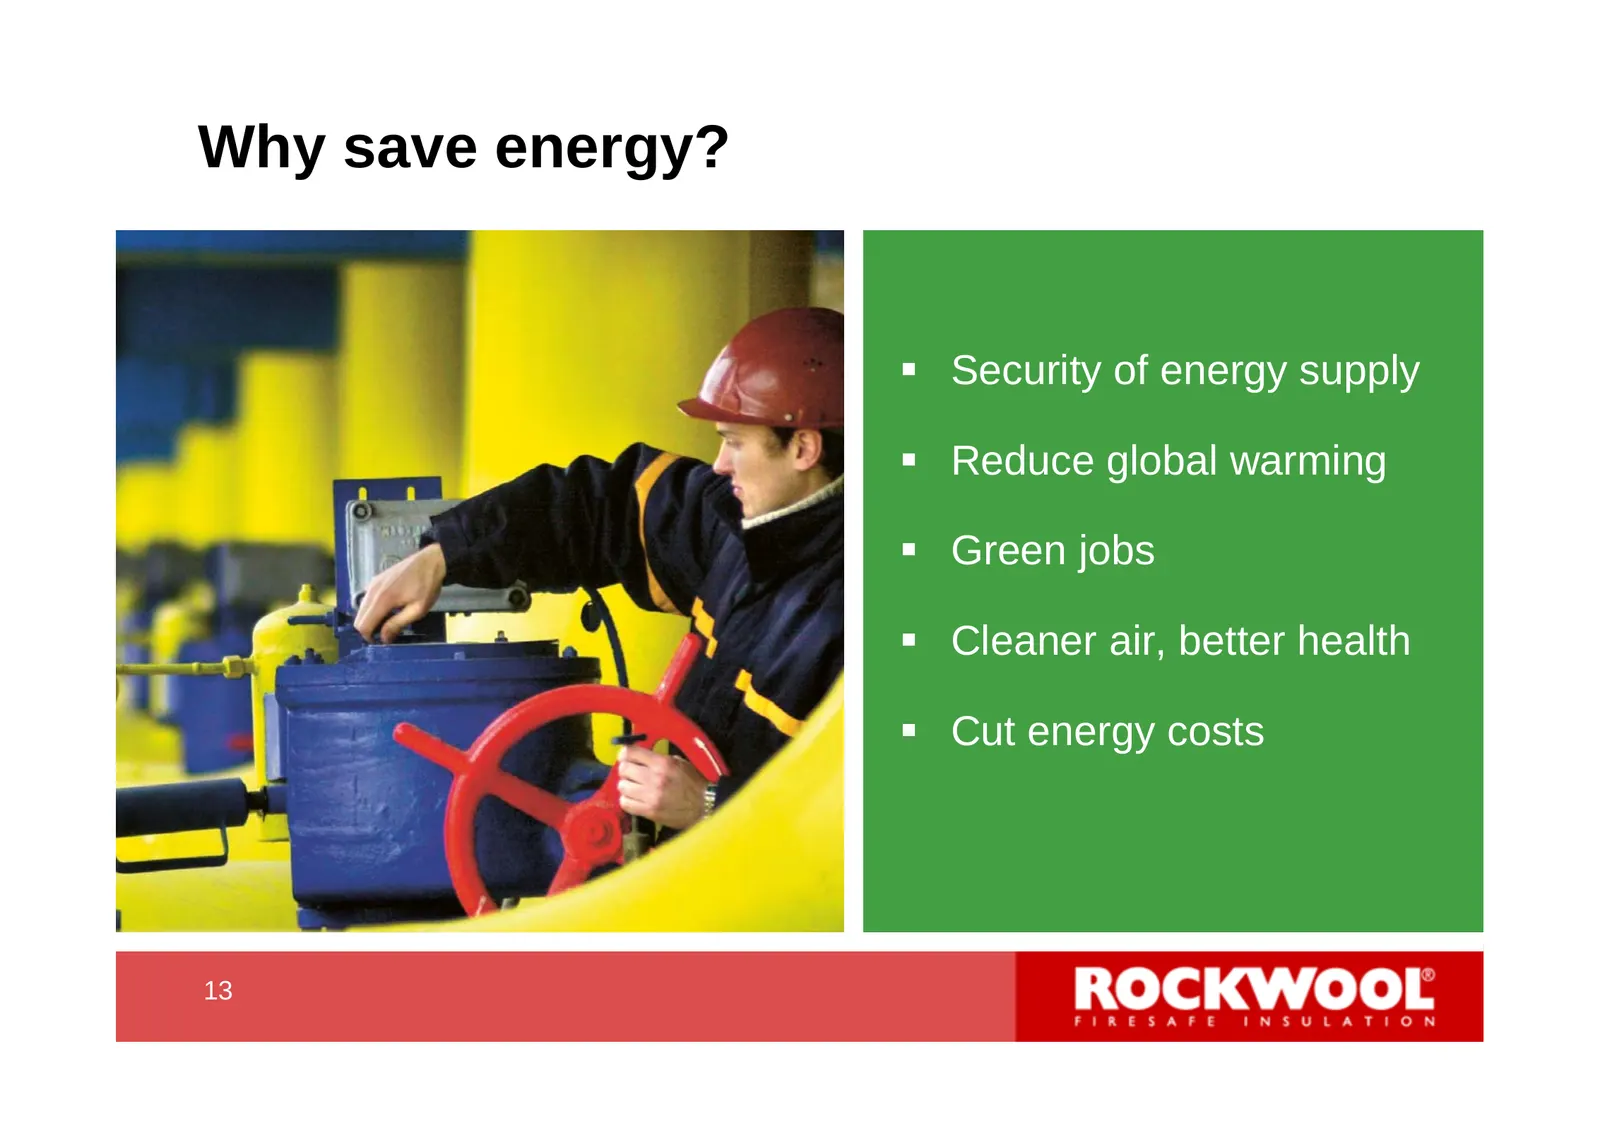
Why save energy? Security of energy supply Reduce global warming Green jobs Cleaner air, better health Cut energy costs 13 13
Slide 14: Buildings are the biggest energy consumer and CO2 polluter
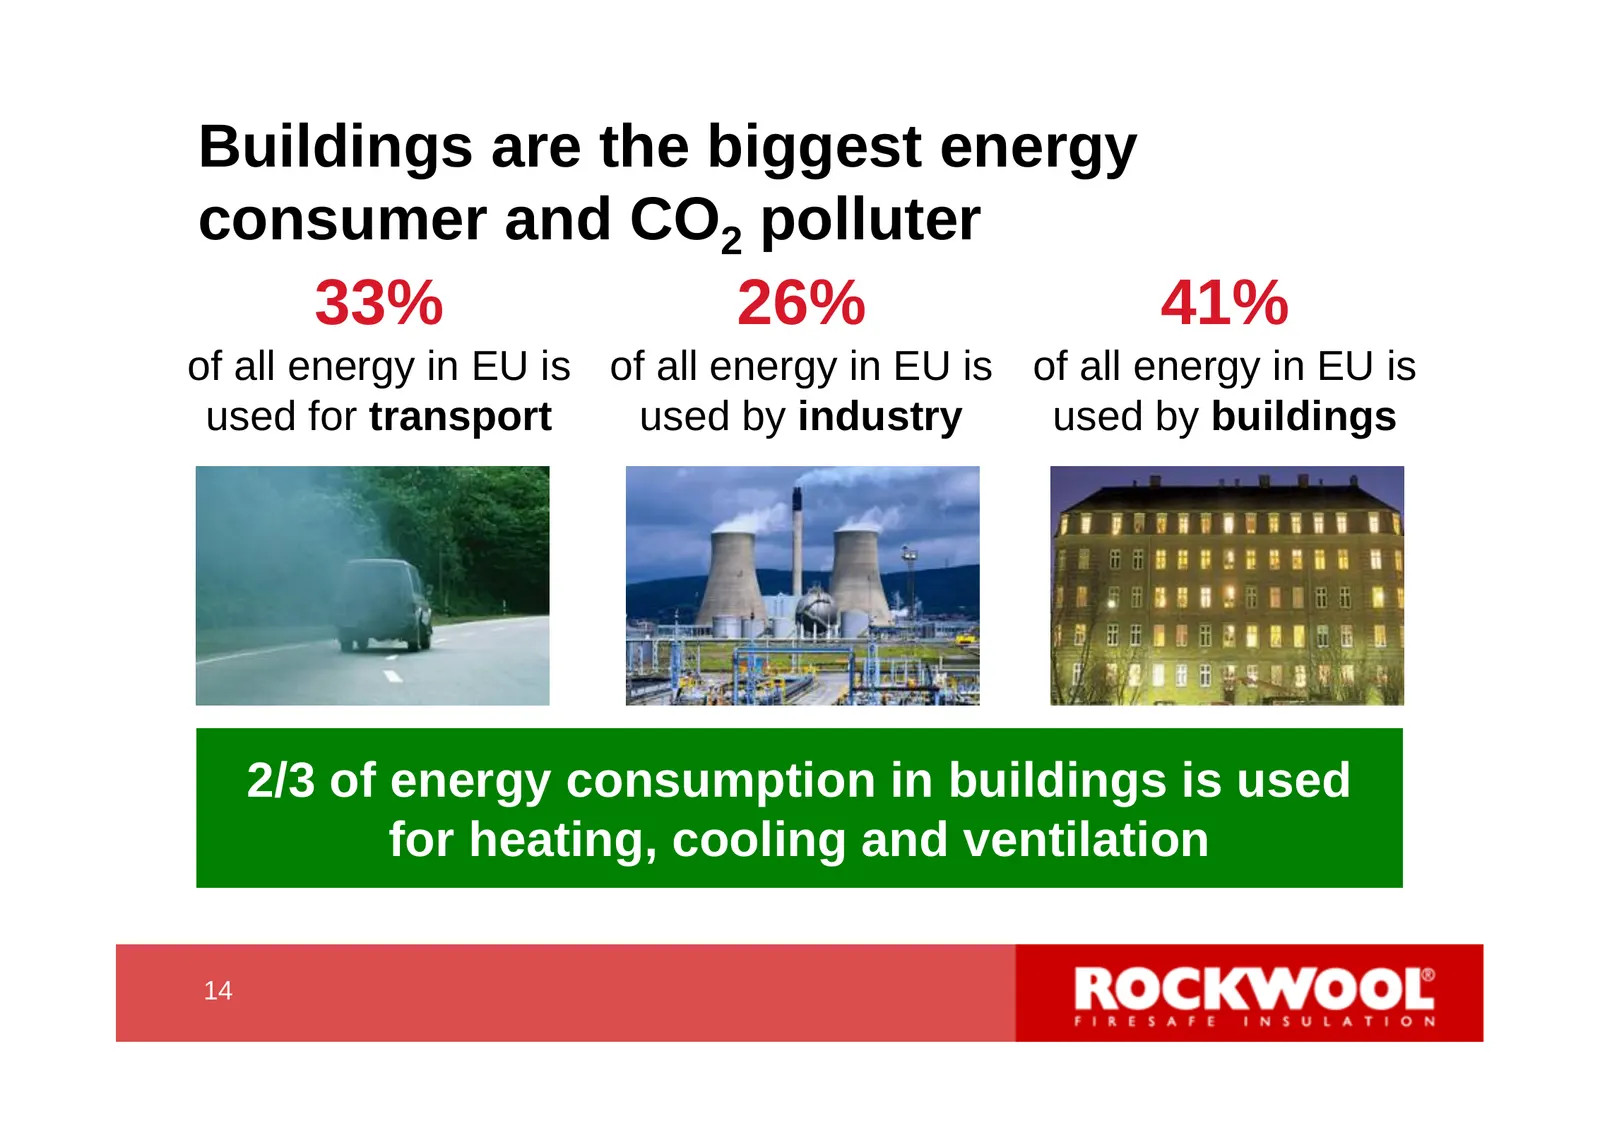
Buildings are the biggest energy consumer and CO2 polluter 33% 26% 41% of all energy in EU is of all energy in EU is of all energy in EU is used for transport used by industry used by buildings 2/3 of energy consumption in buildings is used for heating, cooling and ventilation 14 14
Slide 15: The lowest hanging fruit
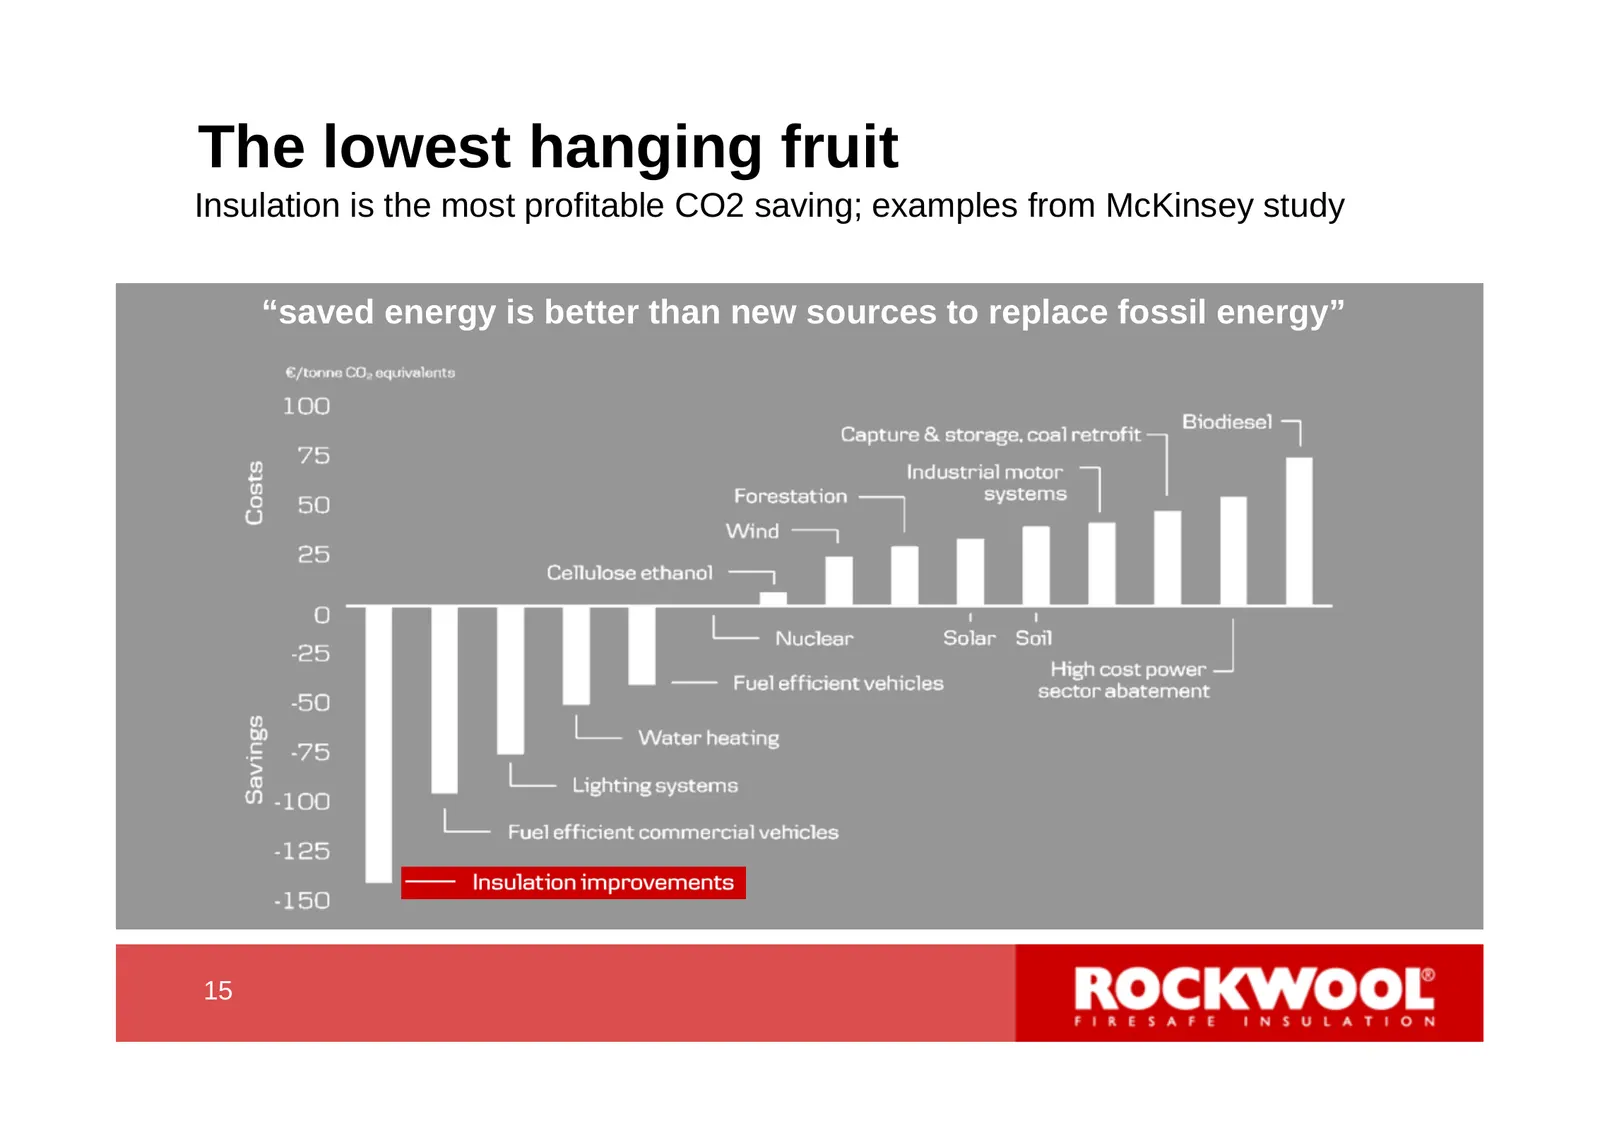
The lowest hanging fruit Insulation is the most profitable CO2 saving; examples from McKinsey study “saved energy is better than new sources to replace fossil energy” 15 15
Slide 16: Energy efficiency is key to a low-carbon future
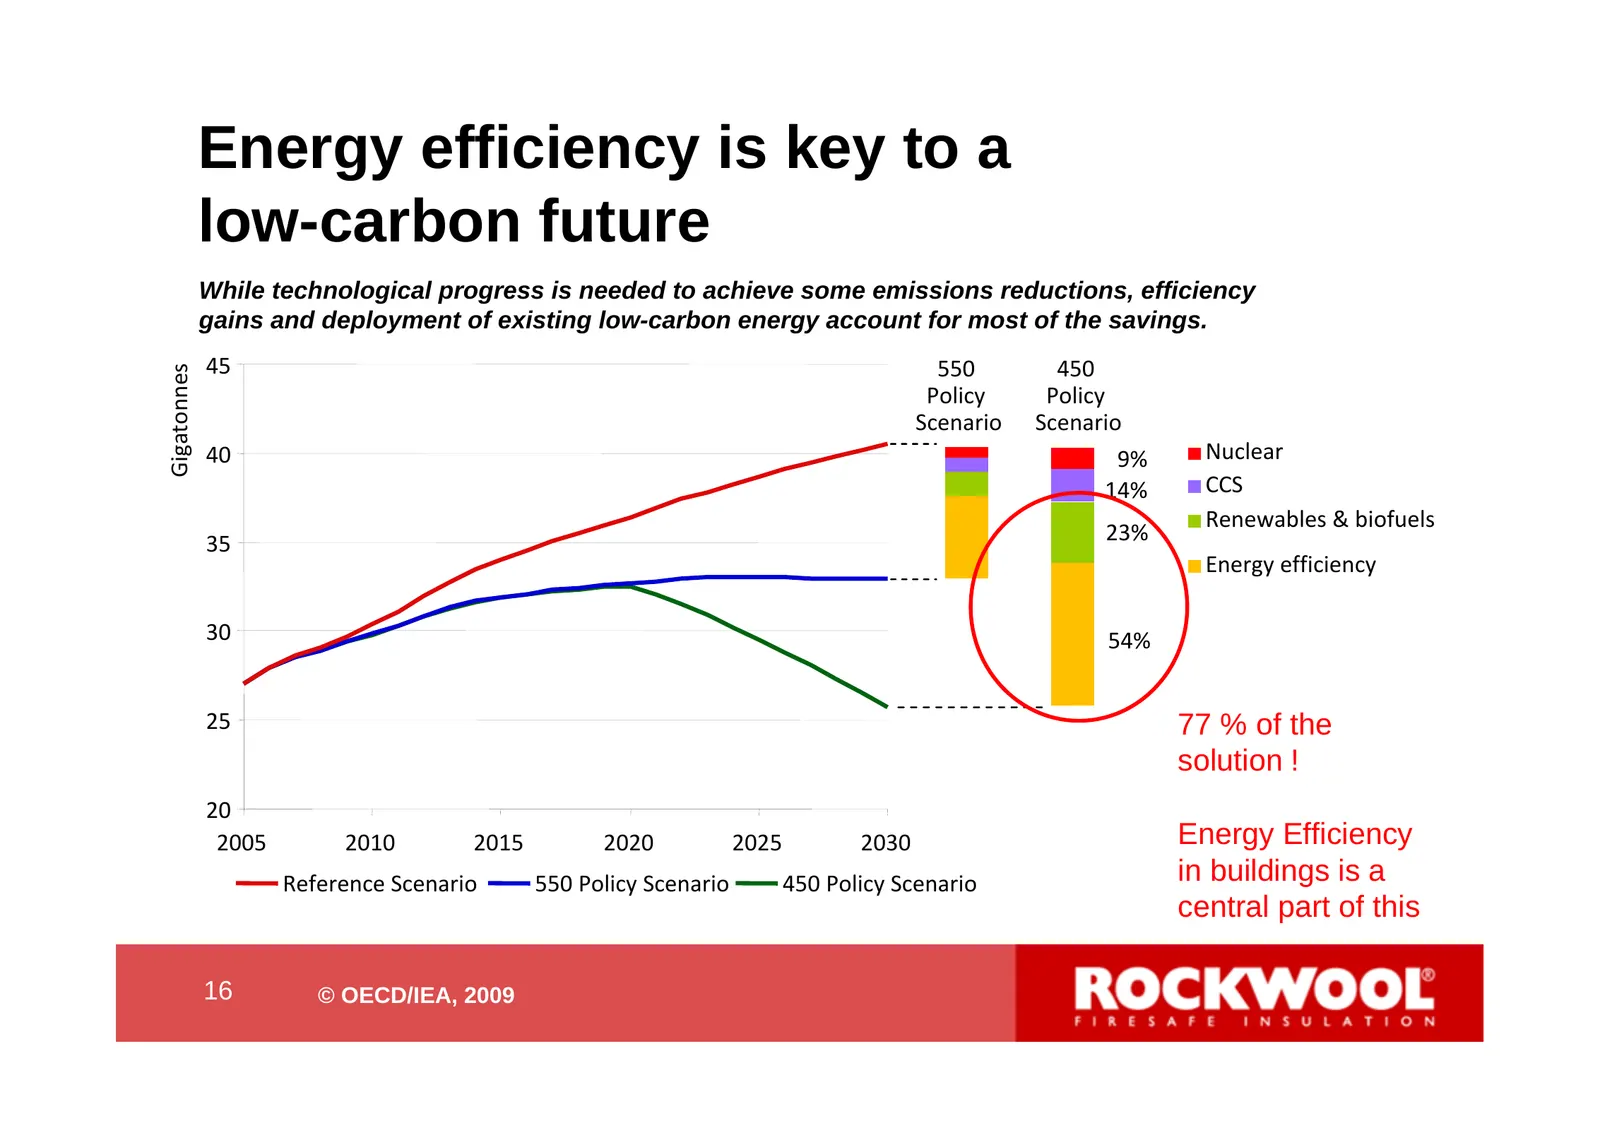
Energy efficiency is key to a low-carbon future While technological progress is needed to achieve some emissions reductions, efficiency gains and deployment of existing low-carbon energy account for most of the savings. 45 550 450 Gigatonnes Policy Policy Scenario Scenario 40 9% Nuclear 14% CCS Rene
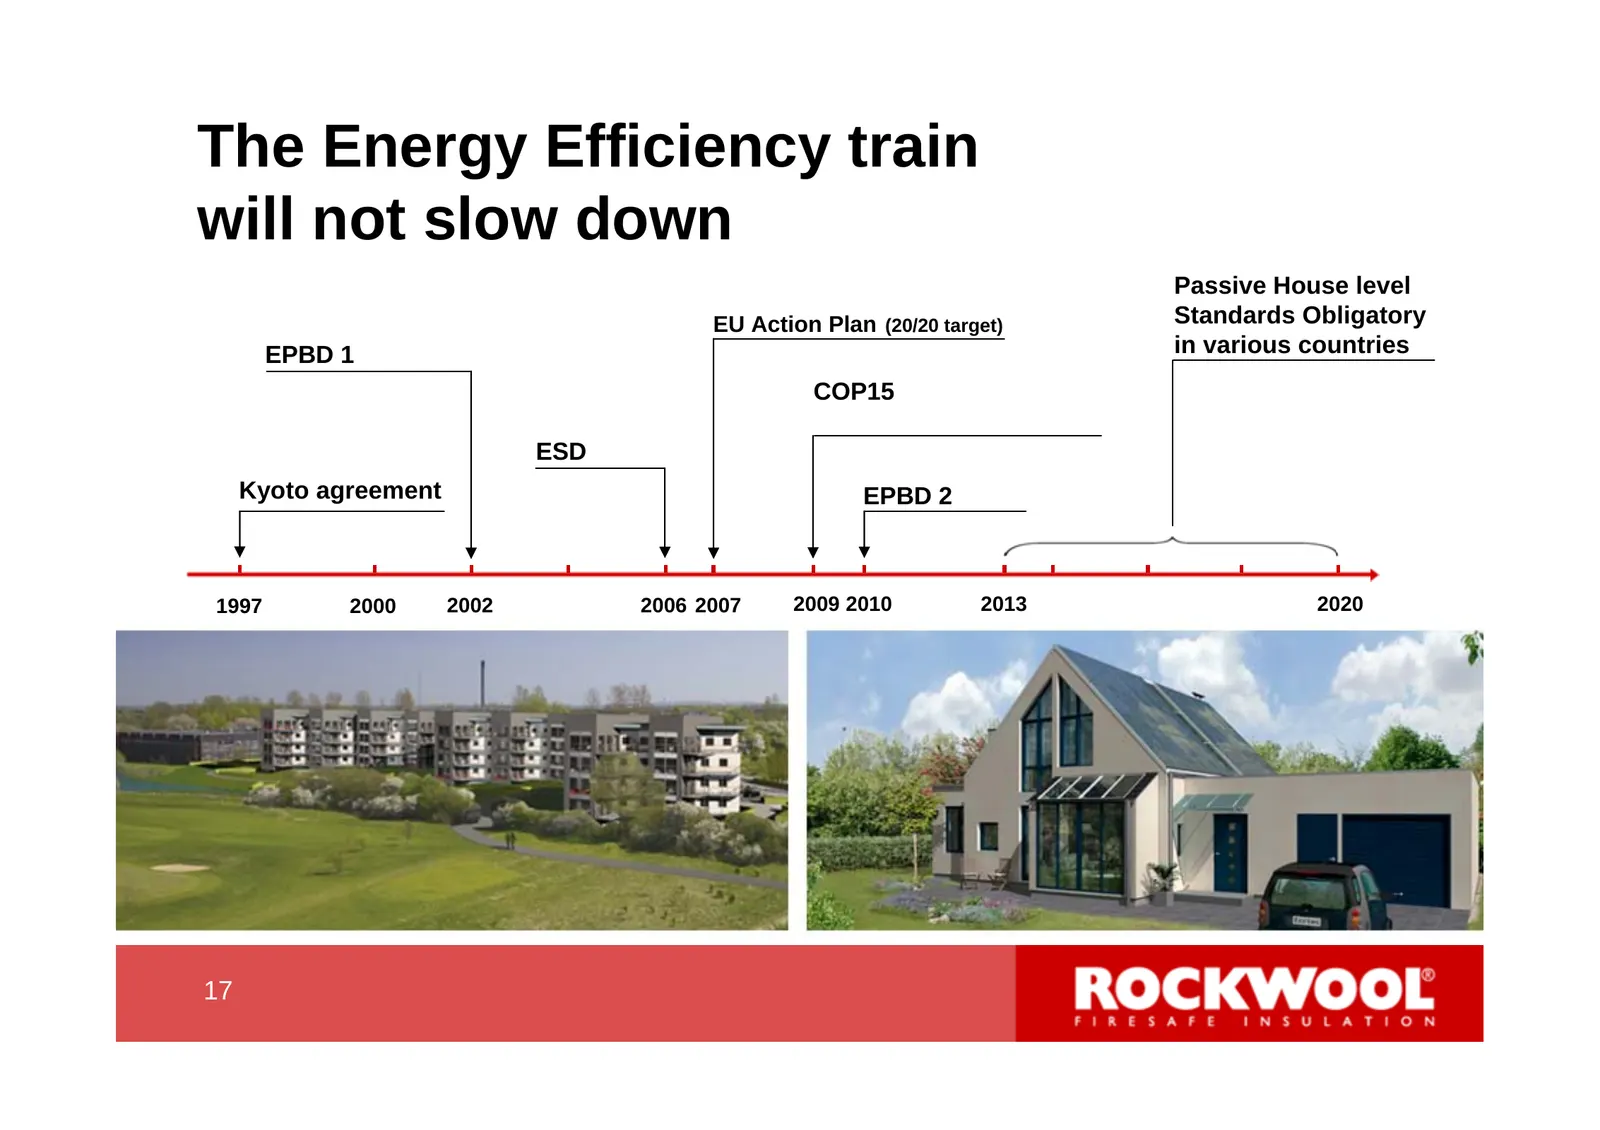
Slide 17: The Energy Efficiency train will not slow down
The Energy Efficiency train will not slow down Passive House level EU Action Plan (20/20 target) Standards Obligatory EPBD 1 in various countries COP15 ESD Kyoto agreement EPBD 2 1997 2000 2002 2006 2007 2009 2010 2013 2020 17 17
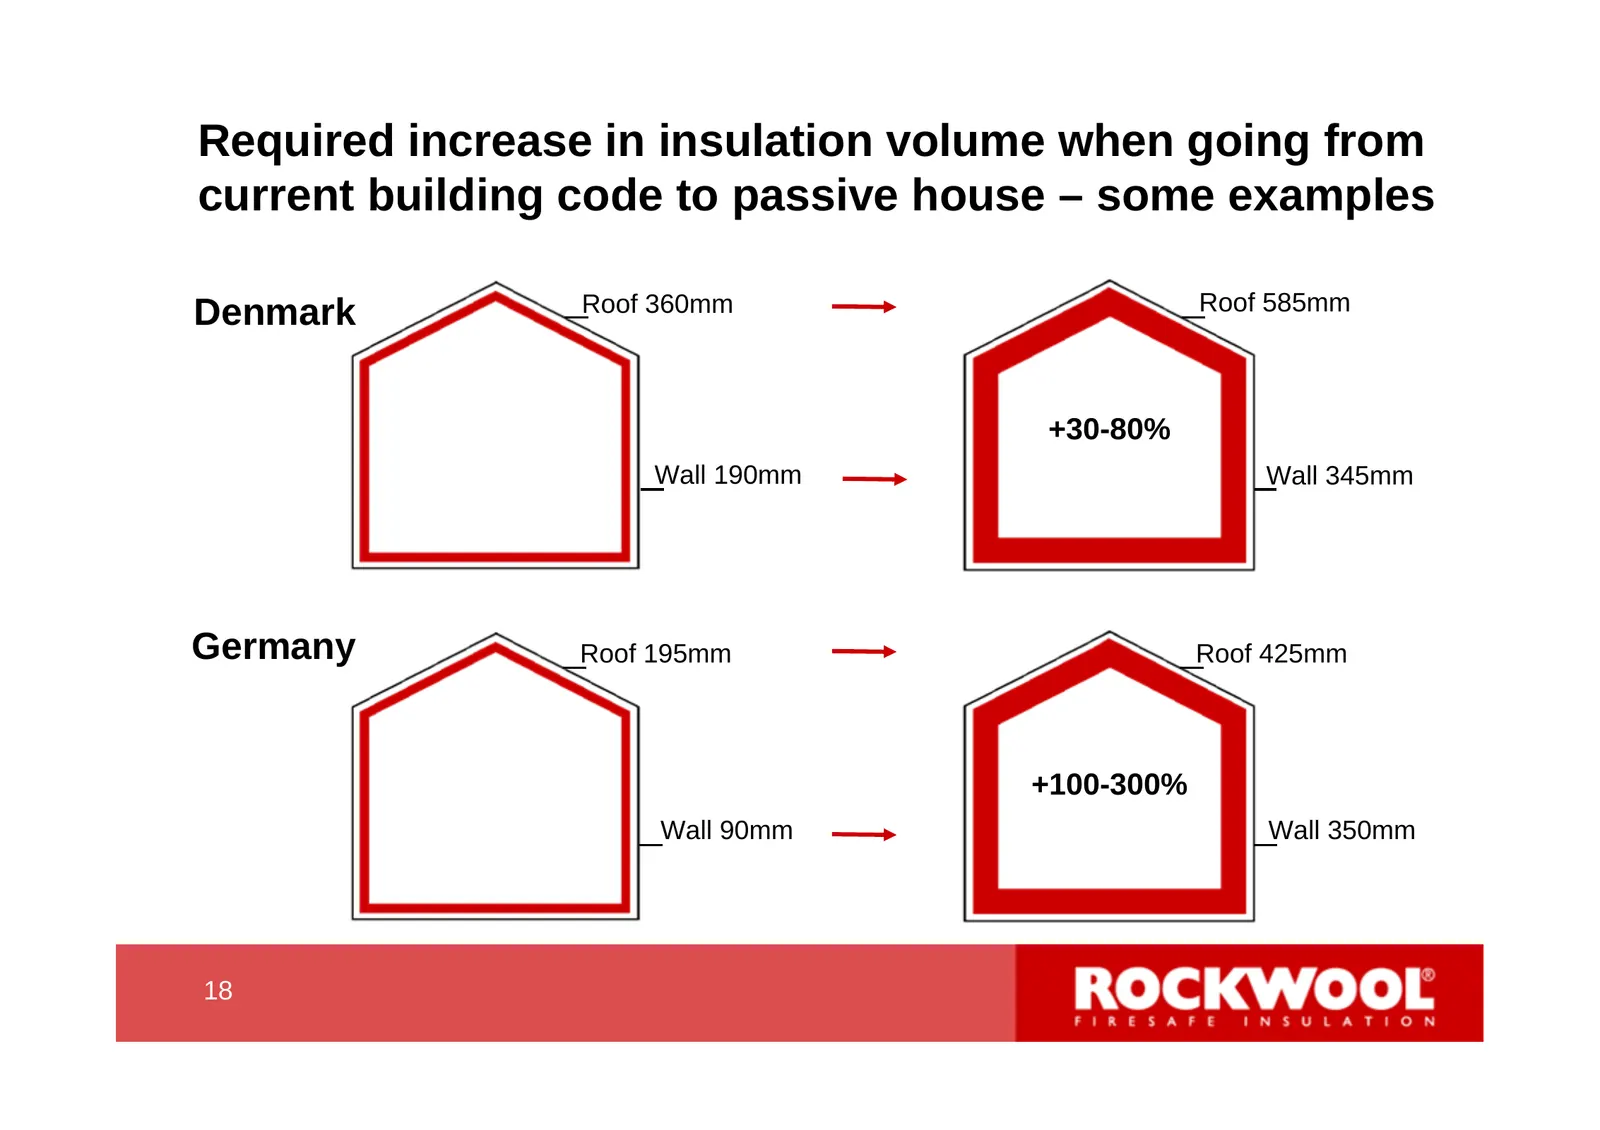
Slide 18: Required increase in insulation volume to passive house
Required increase in insulation volume when going from current building code to passive house – some examples Roof 360mm Roof 585mm Denmark +30-80% Wall 190mm Wall 345mm Germany Roof 195mm Roof 425mm +100-300% Wall 90mm Wall 350mm 18 18
Slide 19: Financials
Financials 19 19
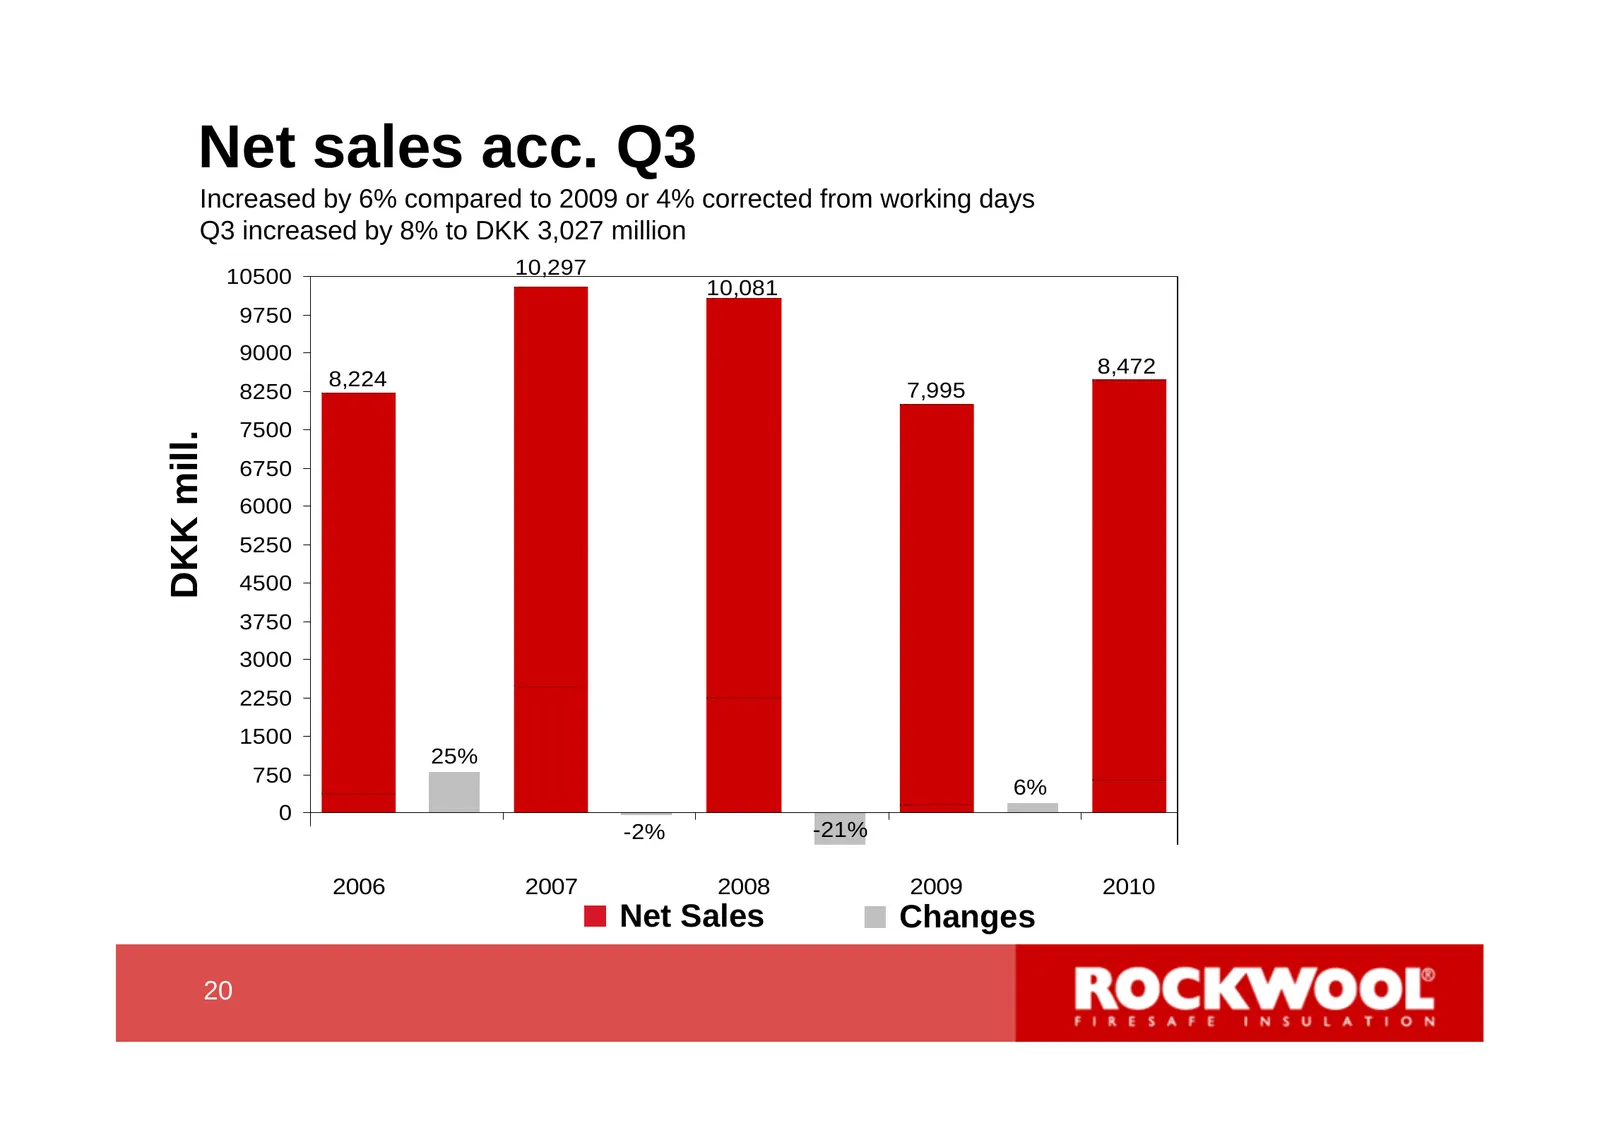
Slide 20: Net sales acc. Q3
Net sales acc. Q3 Increased by 6% compared to 2009 or 4% corrected from working days Q3 increased by 8% to DKK 3,027 million 10500 10,297 10,081 326% 9750 9000 8,472 276% 8,224 8250 7,995 7500 DKK mill. 226% 6750 6000 176% 5250 4500 126% 3750 3000 76% 2250 1500 25% 26% 750 6% 0 -2% -21% -750 -24% 20
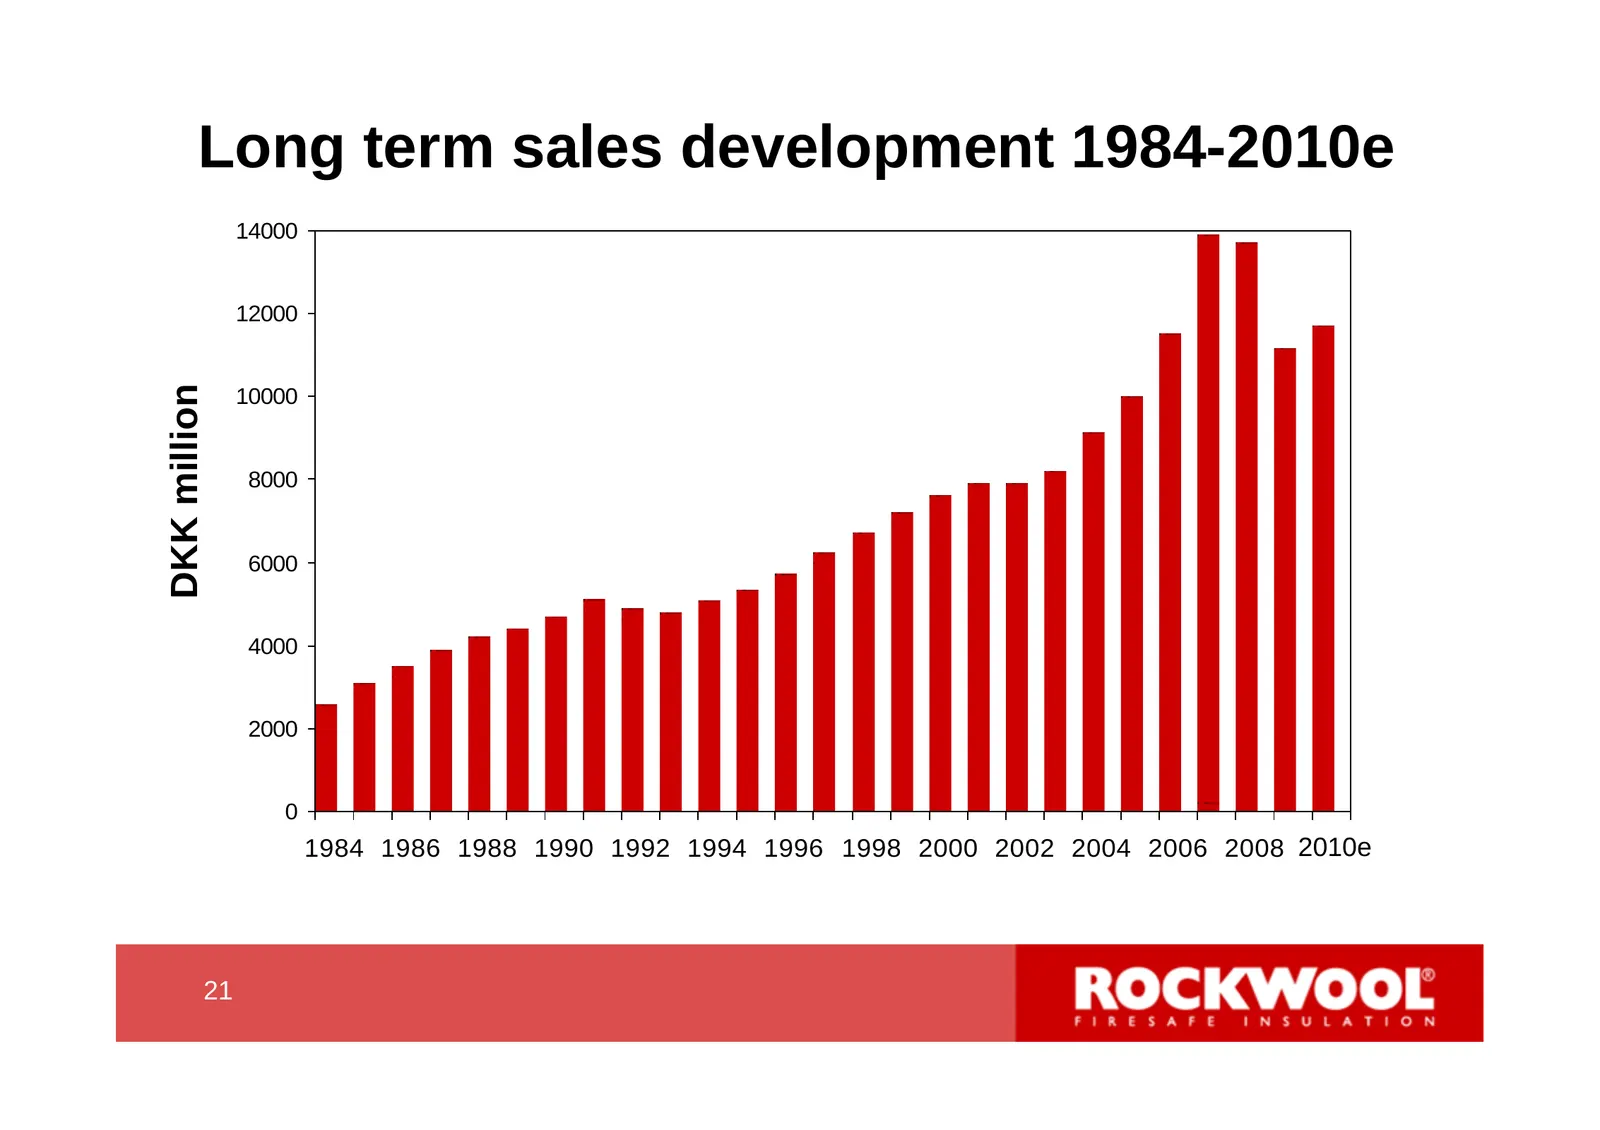
Slide 21: Long term sales development 1984-2010e
Long term sales development 1984-2010e 14000 12000 DKK million 10000 8000 6000 4000 2000 0 2010e 1984 1986 1988 1990 1992 1994 1996 1998 2000 2002 2004 2006 2008 2010e 21 21
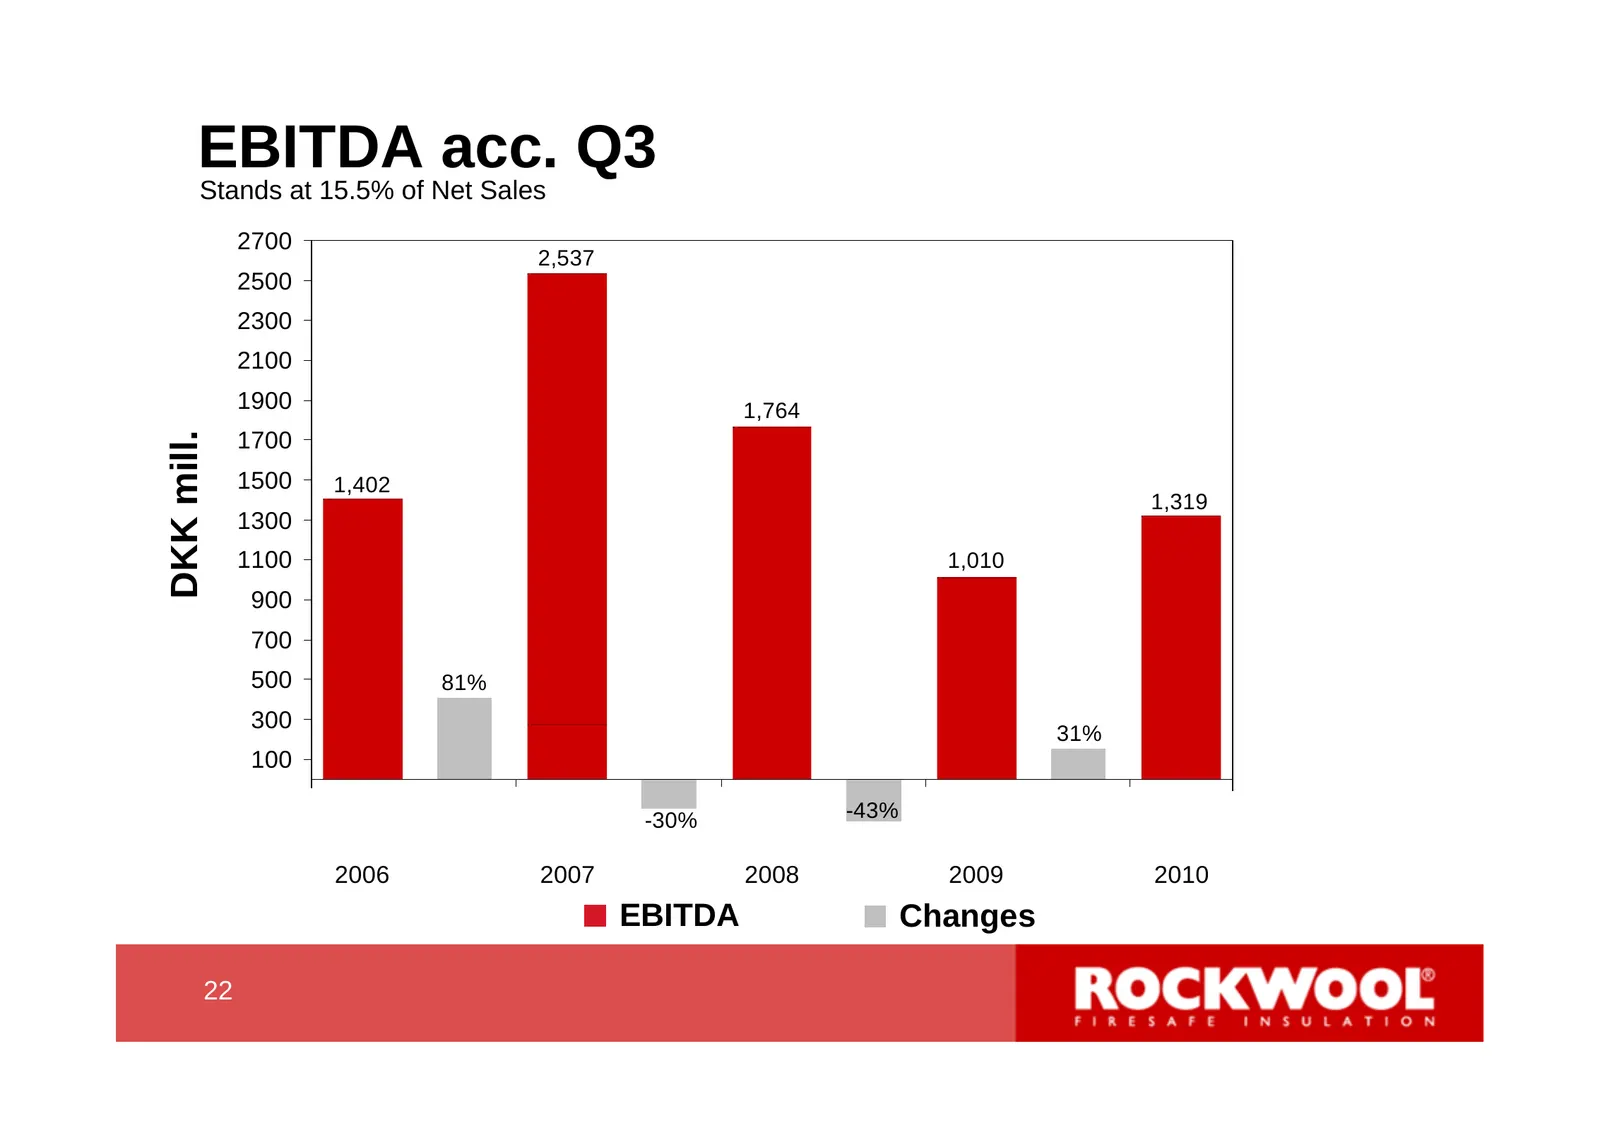
Slide 22: EBITDA acc. Q3
EBITDA acc. Q3 Stands at 15.5% of Net Sales 2700 540% 2,537 2500 2300 440% 2100 1900 1,764 DKK mill. 1700 340% 1500 1,402 1,319 1300 240% 1100 1,010 900 700 140% 500 81% 300 31% 40% 100 -100 -43% -30% -300 -60% 2006 2007 2008 2009 2010 EBITDA Changes 22 22
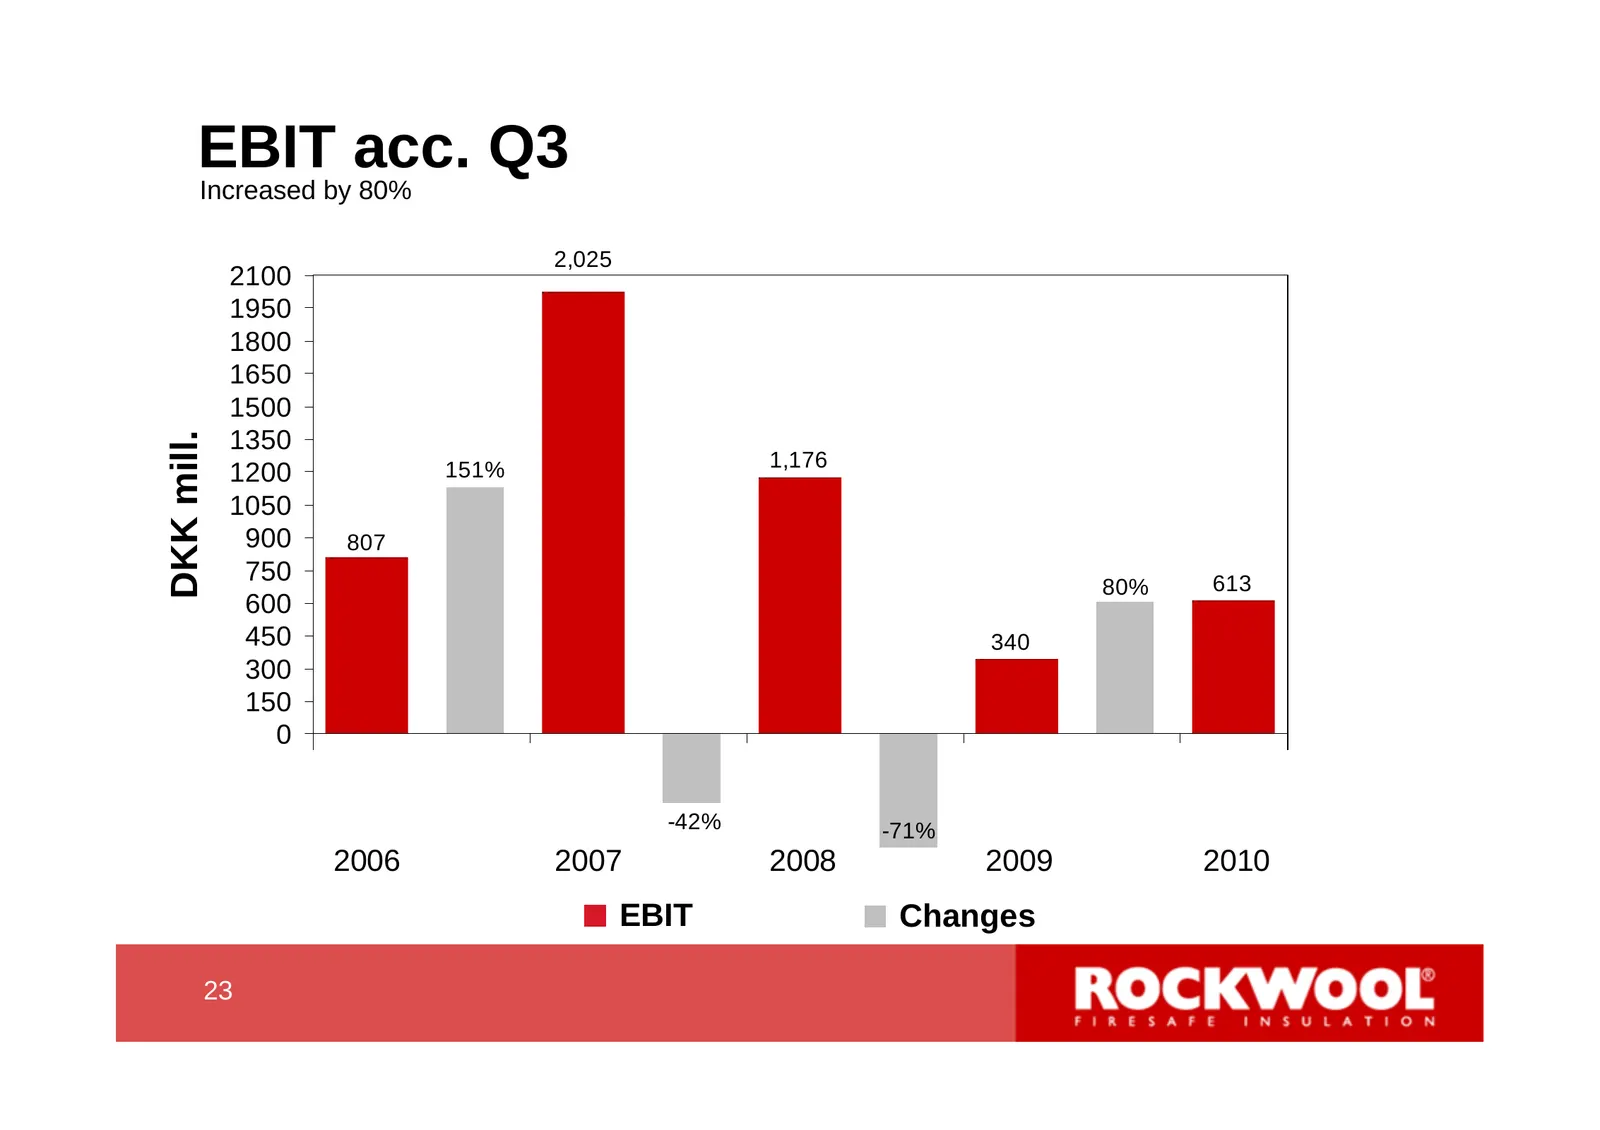
Slide 23: EBIT acc. Q3
EBIT acc. Q3 Increased by 80% 2,025 2100 270% 1950 1800 1650 220% 1500 1350 DKK mill. 1,176 170% 1200 151% 1050 900 807 120% 750 80% 613 600 70% 450 340 300 150 20% 0 -150 -30% -300 -42% -71% -450 -600 2006 2007 2008 2009 2010 -80% 2006 2007 EBIT 2008 2009 Changes 2010 23 23
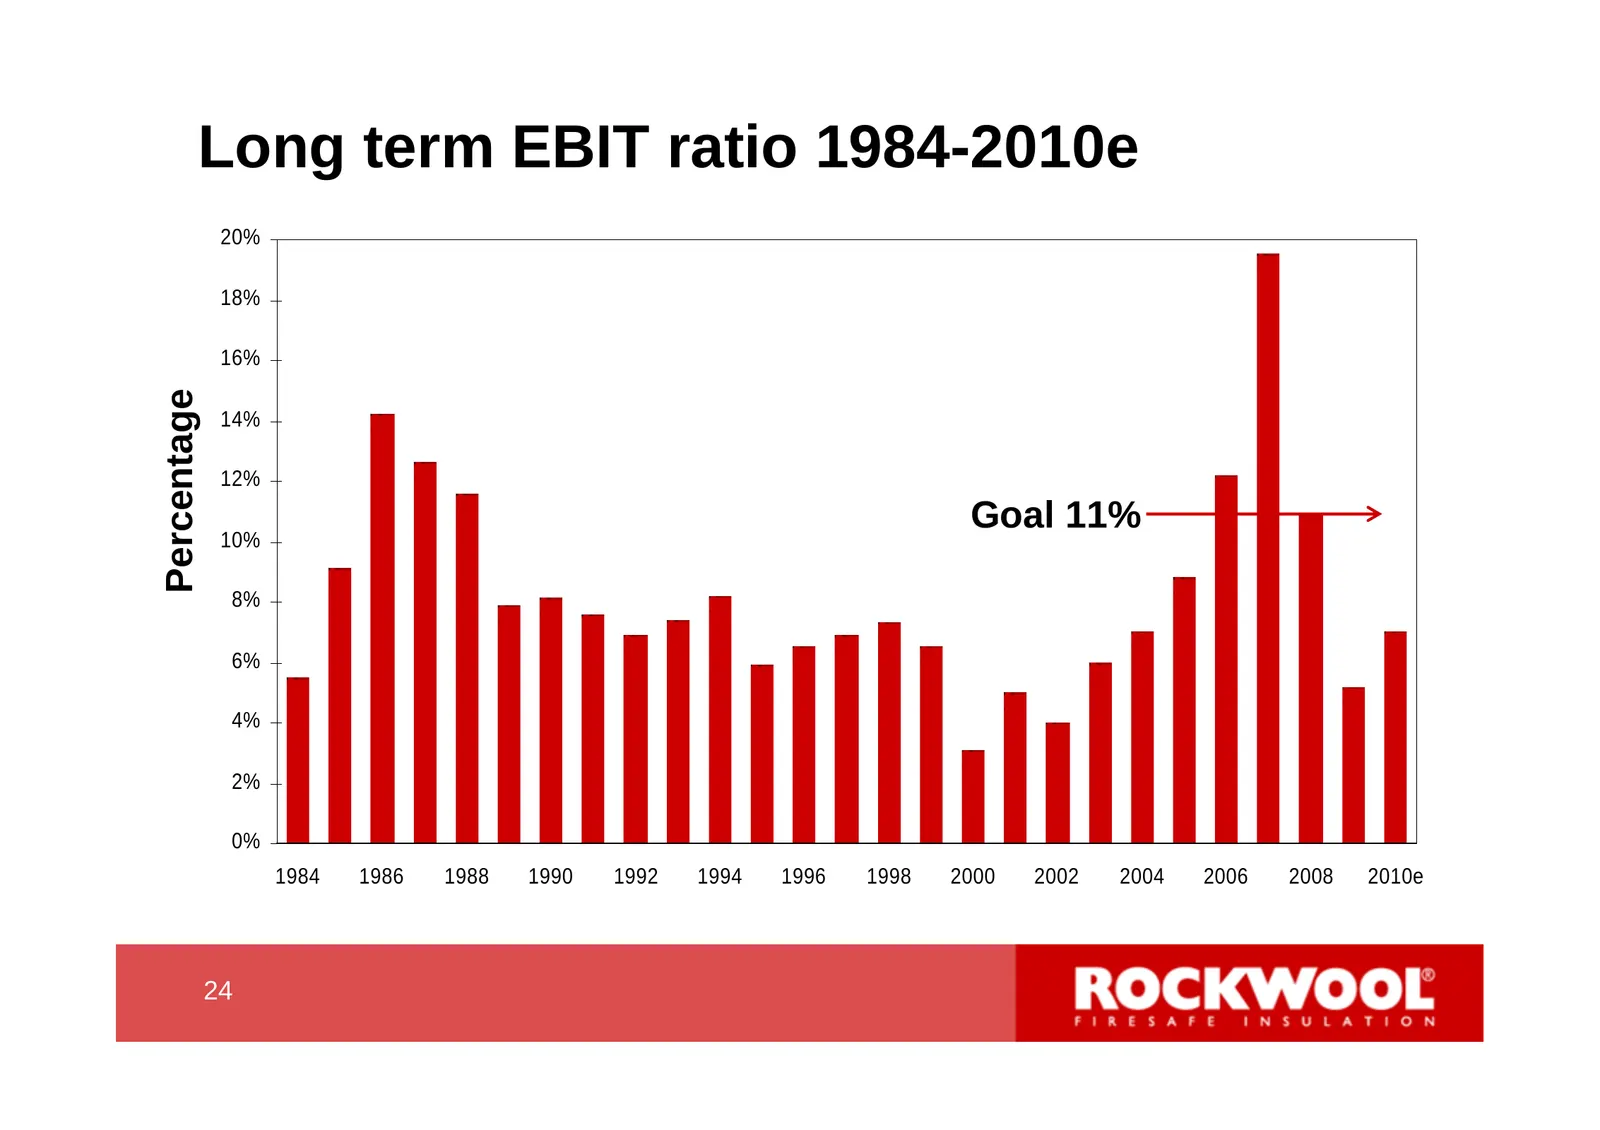
Slide 24: Long term EBIT ratio 1984-2010e
Long term EBIT ratio 1984-2010e 20% 18% 16% Percentage 14% 12% Goal 11% 10% 8% 6% 4% 2% 0% 1984 1986 1988 1990 1992 1994 1996 1998 2000 2002 2004 2006 2008 2010e 24 24
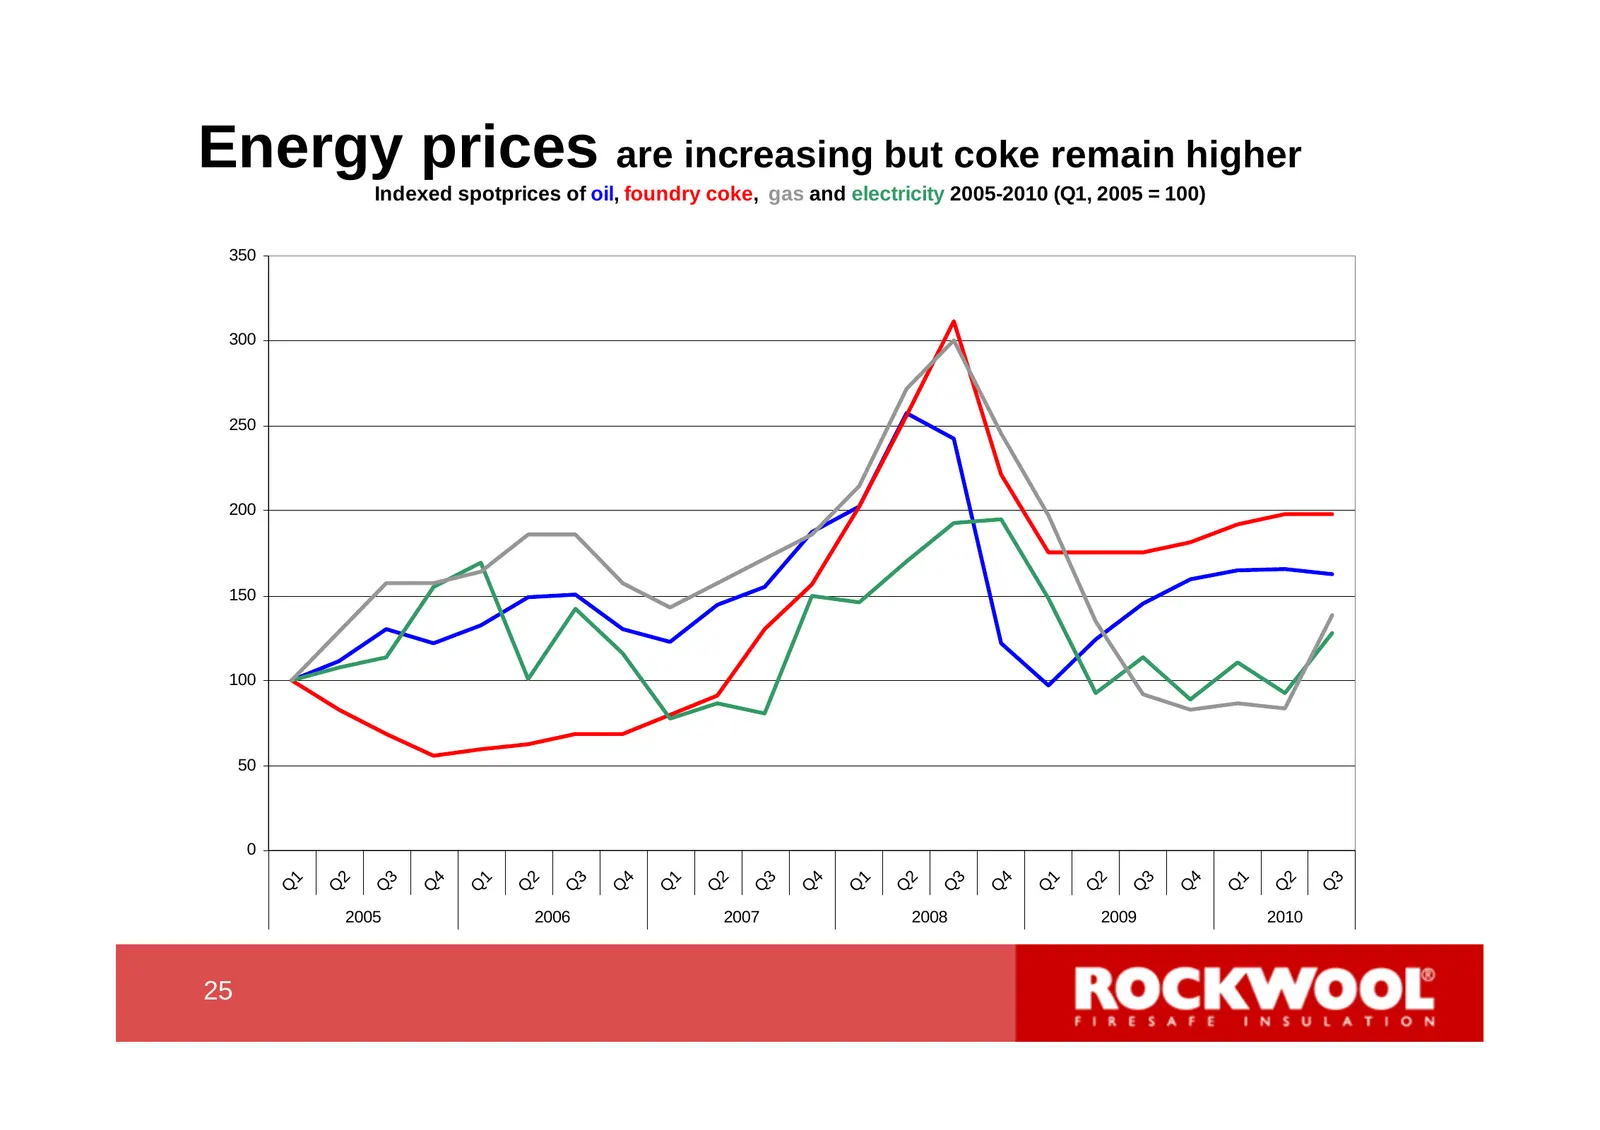
Slide 25: Energy prices are increasing but coke remain higher
Energy prices are increasing but coke remain higher Indexed spotprices of oil, foundry coke, gas and electricity 2005-2010 (Q1, 2005 = 100) 350 300 250 200 150 100 50 0 1 2 3 4 1 2 3 4 1 2 3 4 1 2 3 4 1 2 3 4 1 2 3 Q Q Q Q Q Q Q Q Q Q Q Q Q Q Q Q Q Q Q Q Q Q Q 2005 2006 2007 2008 2009 2010 25 25
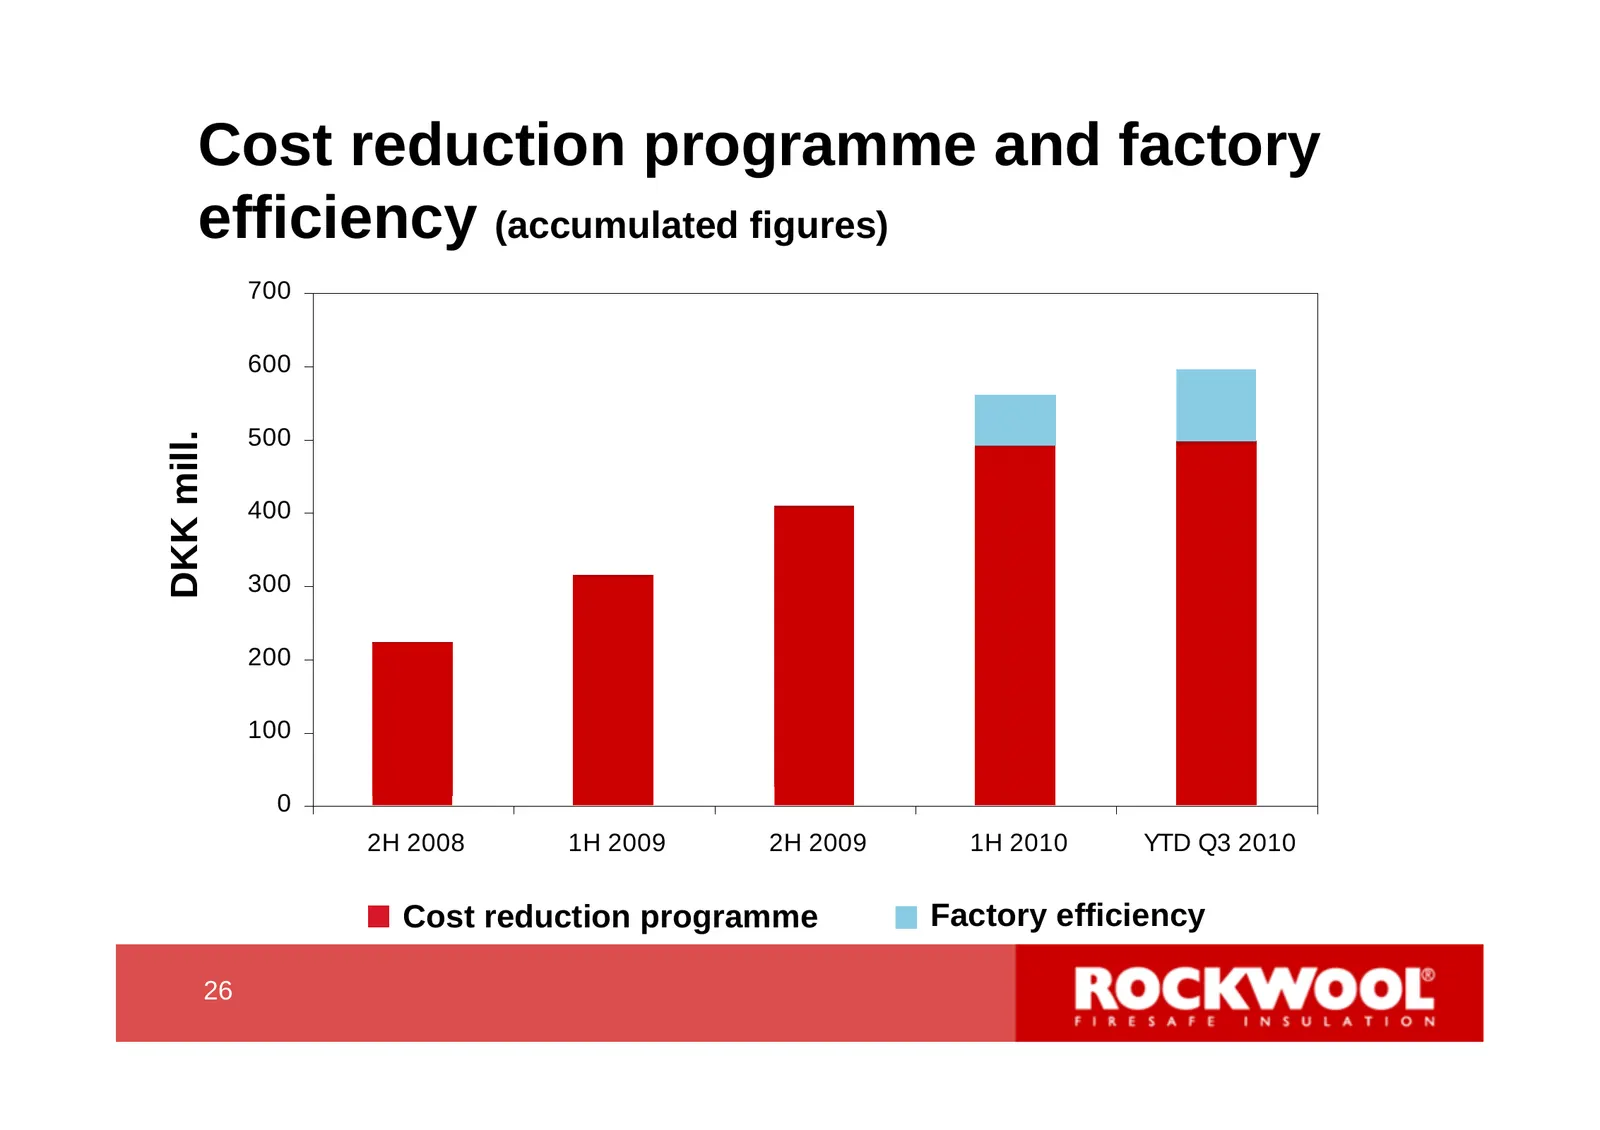
Slide 26: Cost reduction programme and factory efficiency
Cost reduction programme and factory efficiency (accumulated figures) 700 600 500 DKK mill. 400 300 200 100 0 2H 2008 1H 2009 2H 2009 1H 2010 YTD Q3 2010 Cost reduction programme Factory efficiency 26 26
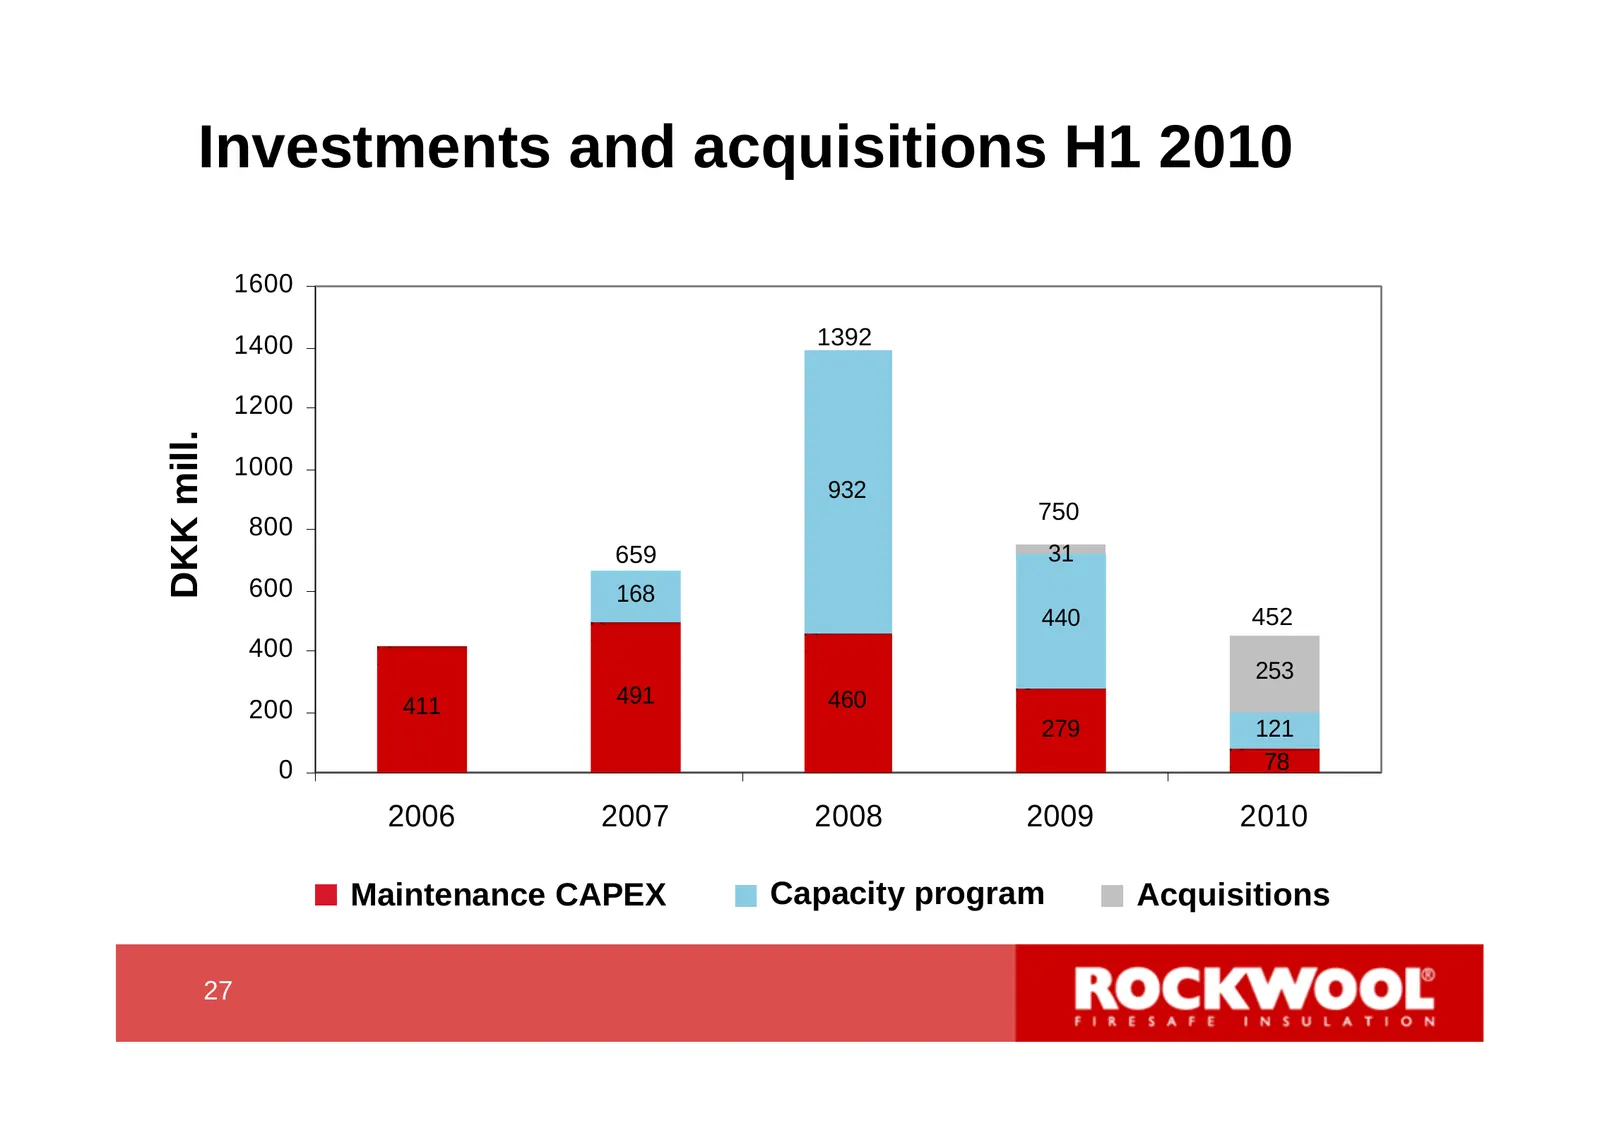
Slide 27: Investments and acquisitions H1 2010
Investments and acquisitions H1 2010 1600 1400 1392 1200 DKK mill. 1000 932 750 800 659 31 600 168 440 452 400 253 411 491 460 200 279 121 0 78 2006 2007 2008 2009 2010 Maintenance CAPEX Capacity program Acquisitions 27 27
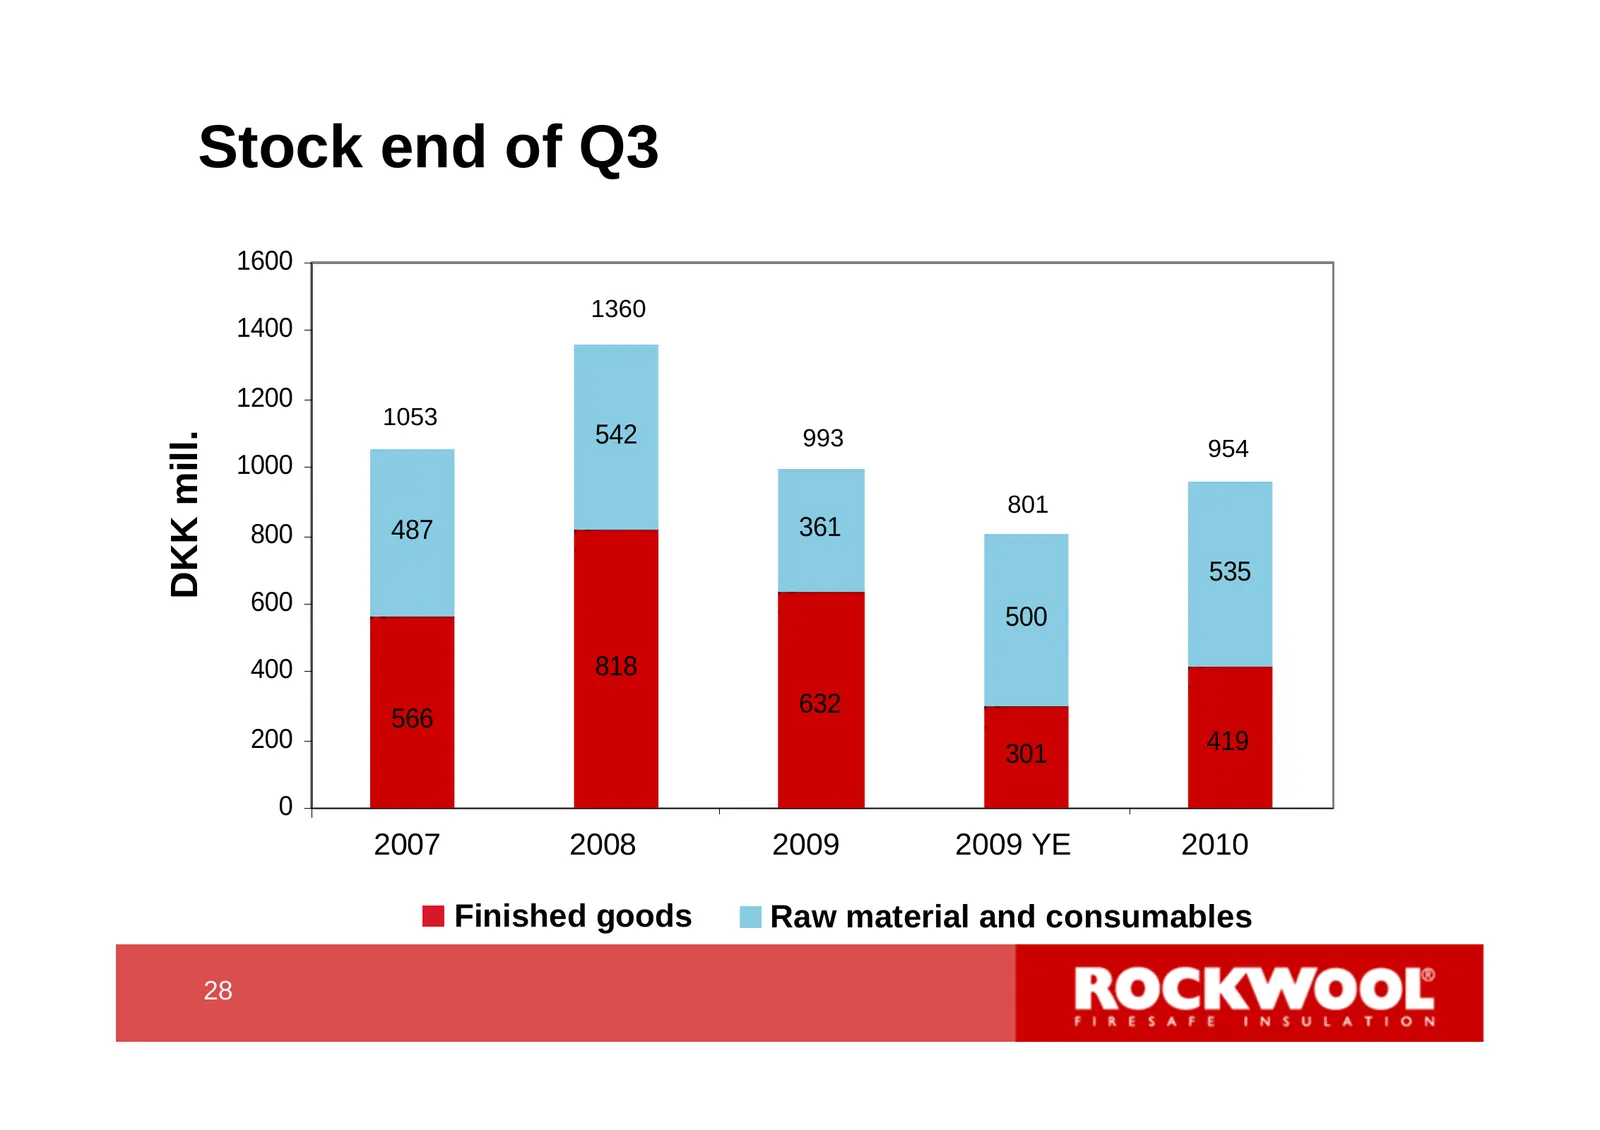
Slide 28: Stock end of Q3
Stock end of Q3 1600 1360 1400 1200 1053 542 993 DKK mill. 954 1000 801 800 487 361 535 600 500 400 818 632 566 200 419 301 0 2007 1 2008 2 2009 3 20094YE 2010 5 Finished goods Raw material and consumables 28 28
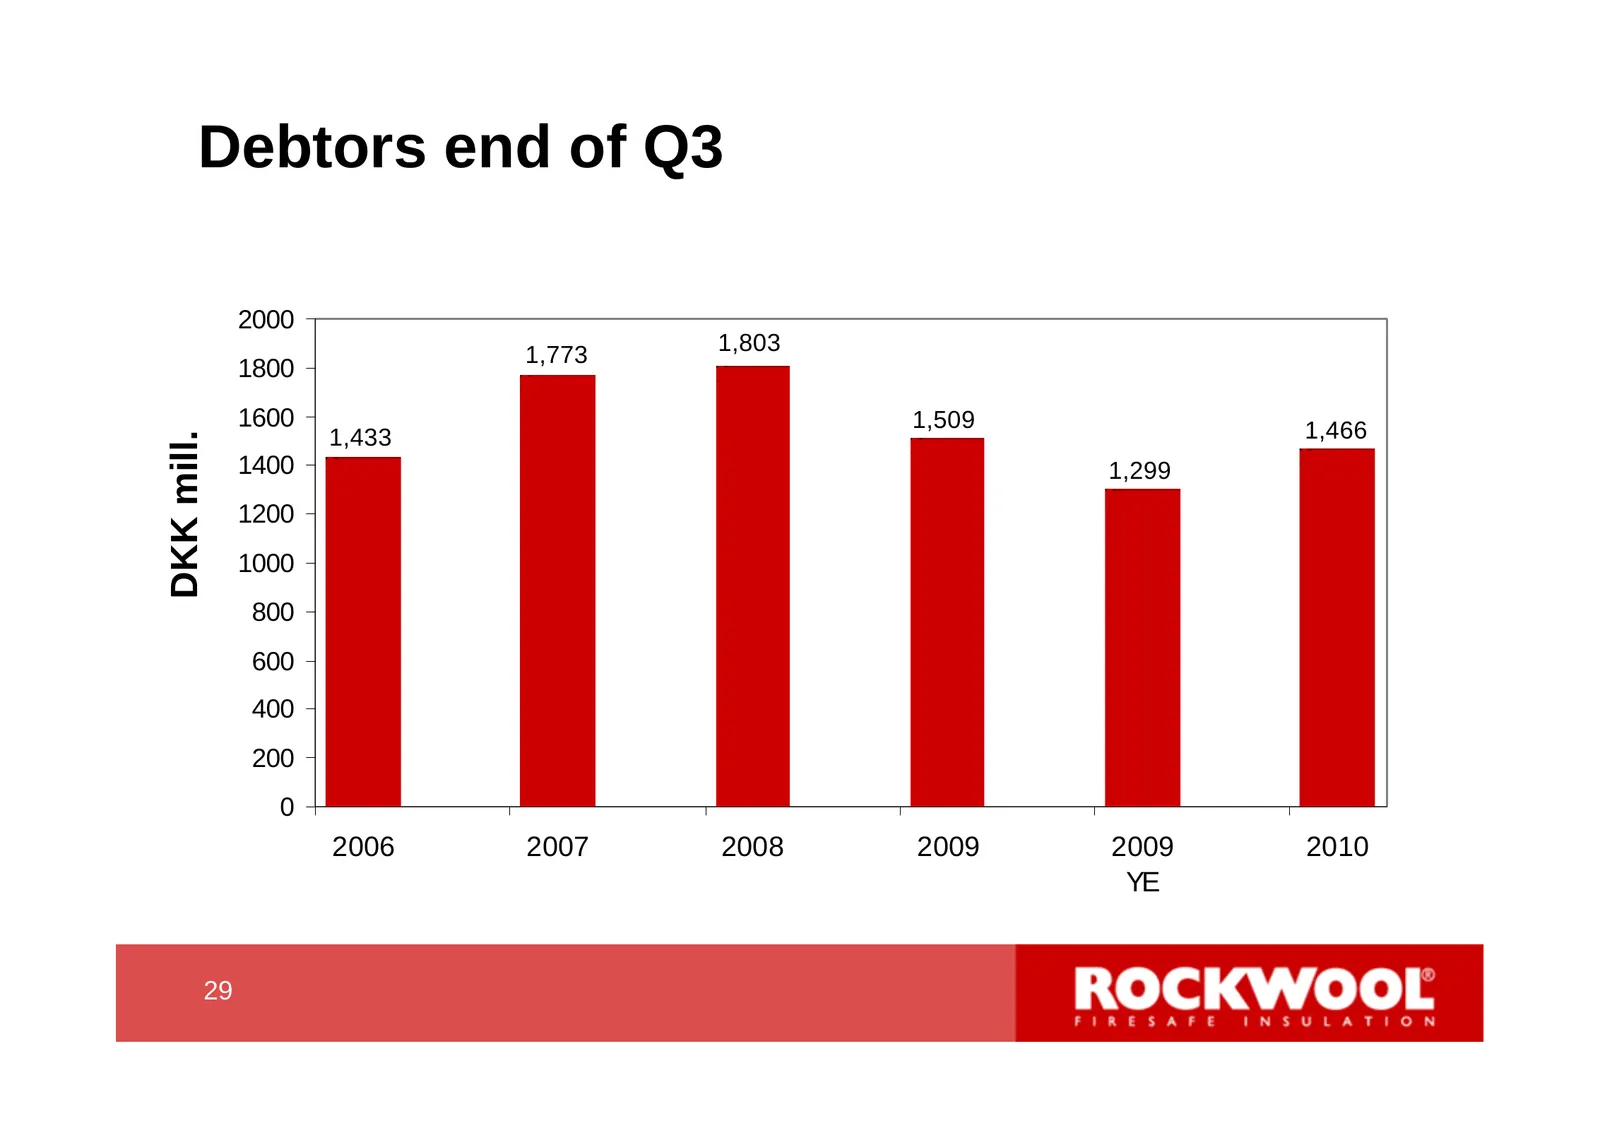
Slide 29: Debtors end of Q3
Debtors end of Q3 2000 1,803 1,773 1800 1600 1,509 1,466 1,433 DKK mill. 1400 1,299 1200 1000 800 600 400 200 0 2006 2007 2008 2009 2009 2010 YE 29 29
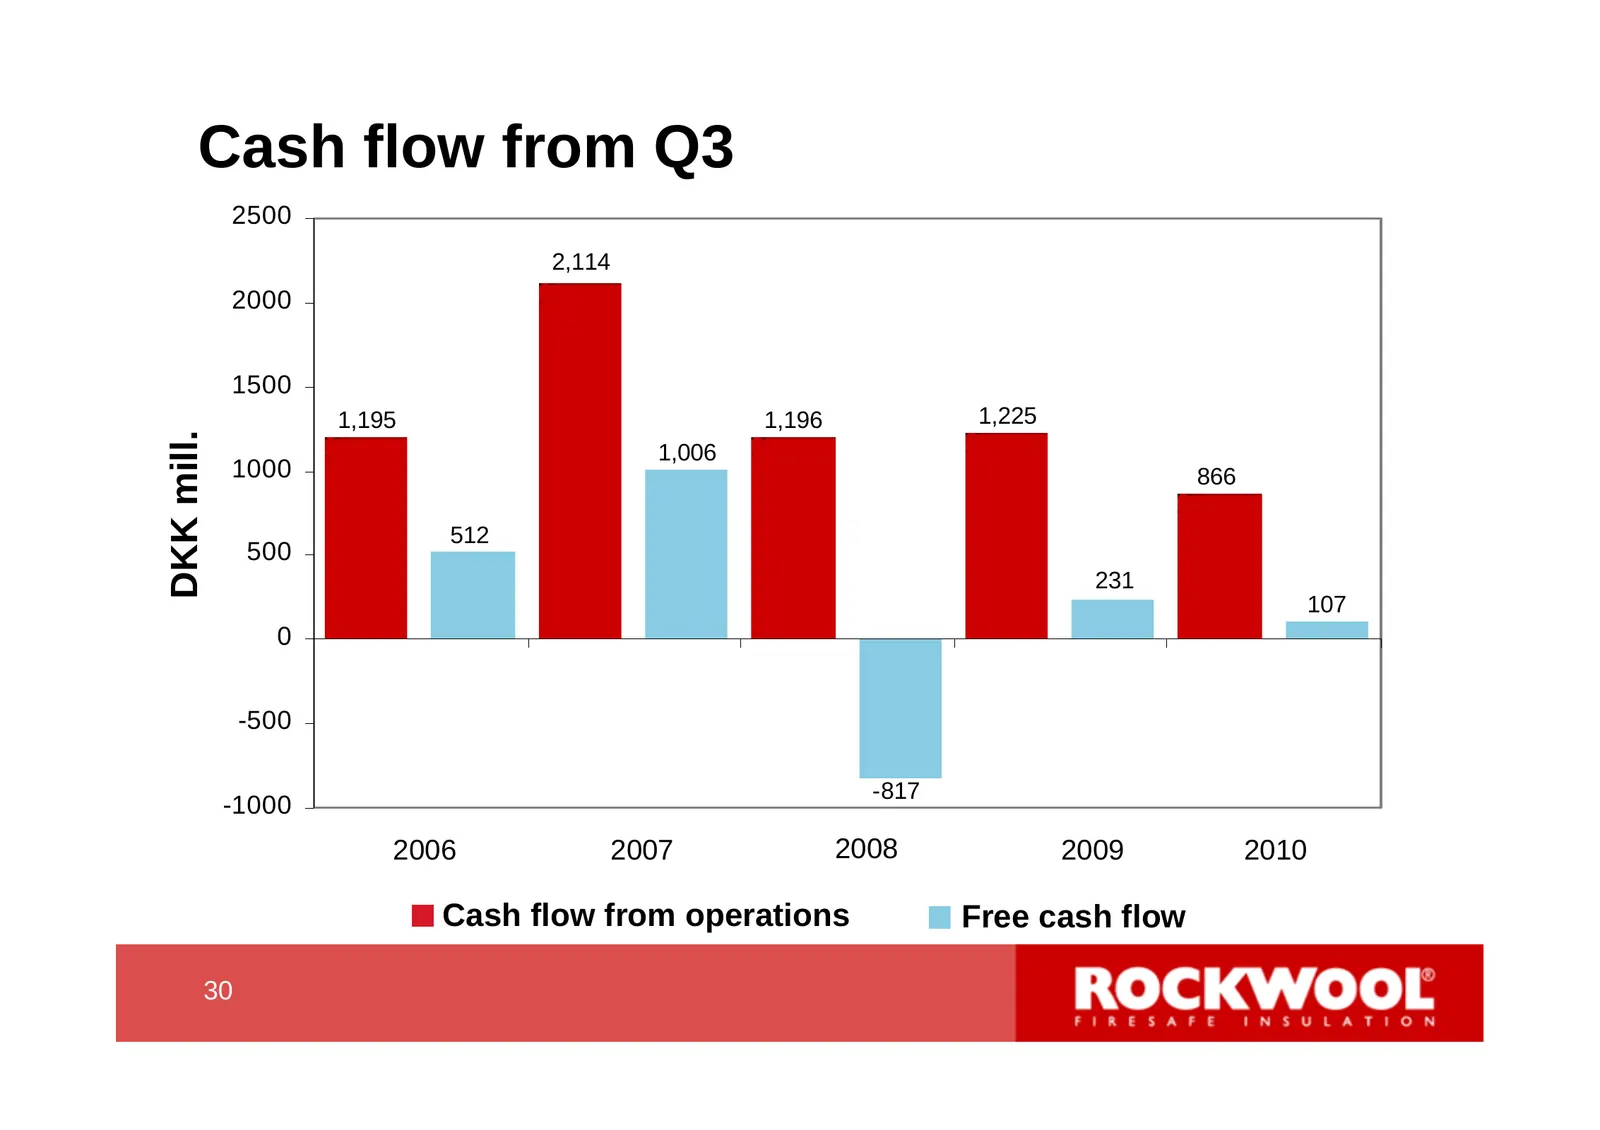
Slide 30: Cash flow from Q3
Cash flow from Q3 2500 2,114 2000 1500 1,195 1,196 1,225 DKK mill. 1,006 1000 866 512 500 231 107 0 -500 -817 -1000 2006 2007 2008 2009 2010 Cash flow from operations Free cash flow 30 30
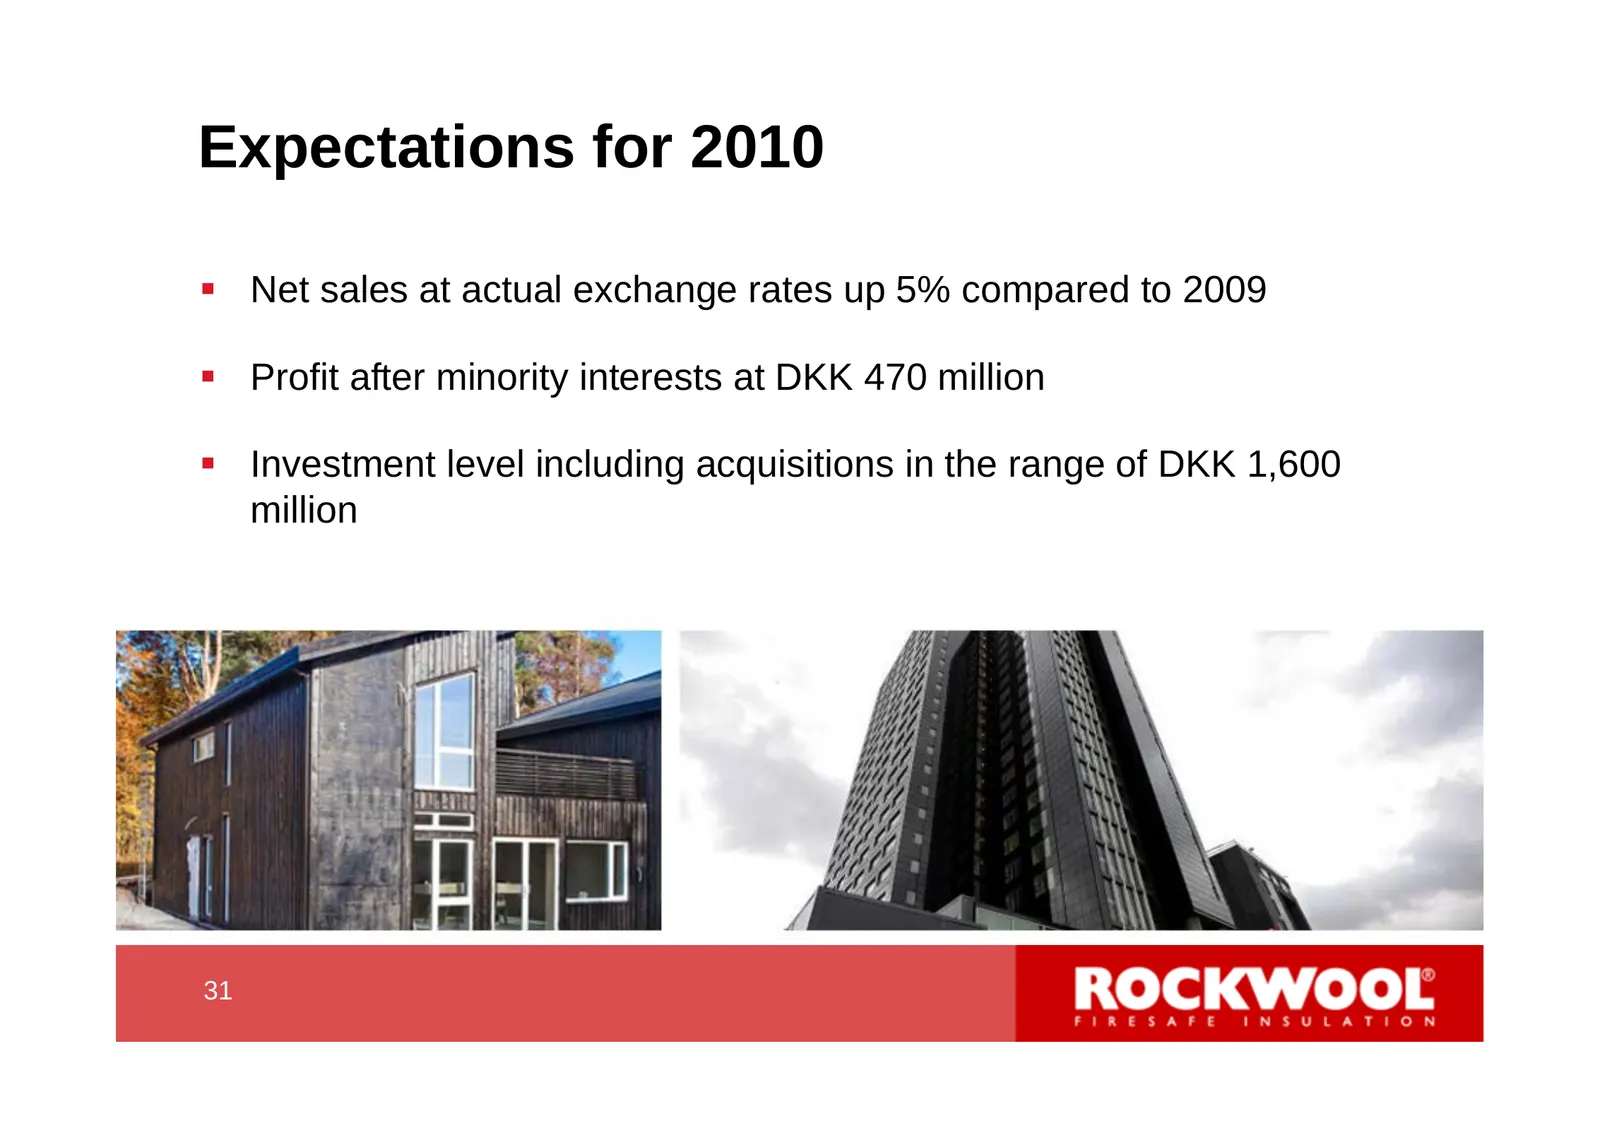
Slide 31: Expectations for 2010
Expectations for 2010 Net sales at actual exchange rates up 5% compared to 2009 Profit after minority interests at DKK 470 million Investment level including acquisitions in the range of DKK 1,600 million 31 31
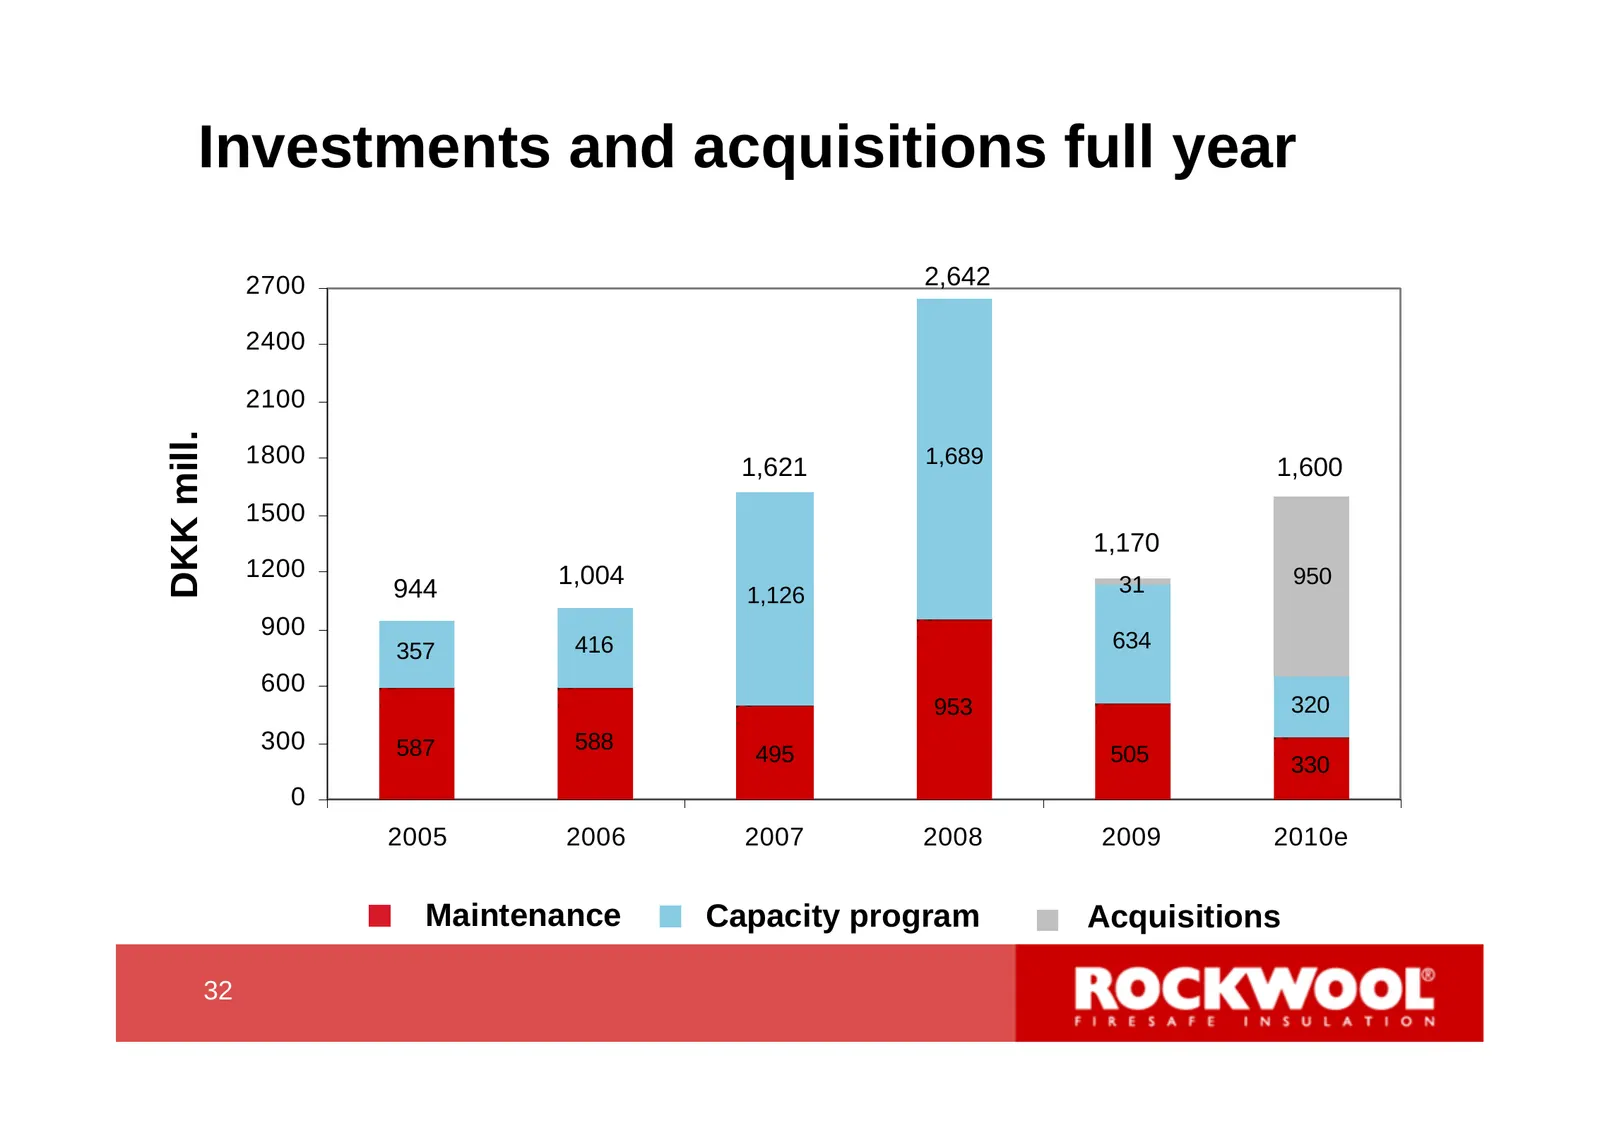
Slide 32: Investments and acquisitions full year
Investments and acquisitions full year 2700 2,642 2400 2100 DKK mill. 1800 1,621 1,689 1,600 1500 1,170 1200 1,004 950 944 1,126 31 900 357 416 634 600 953 320 300 587 588 495 505 330 0 2005 2006 2007 2008 2009 2010e Maintenance Capacity program Acquisitions 32 32
Slide 33: Market region Europe
Market region Europe 33 33
Slide 34: European insulation market 2010
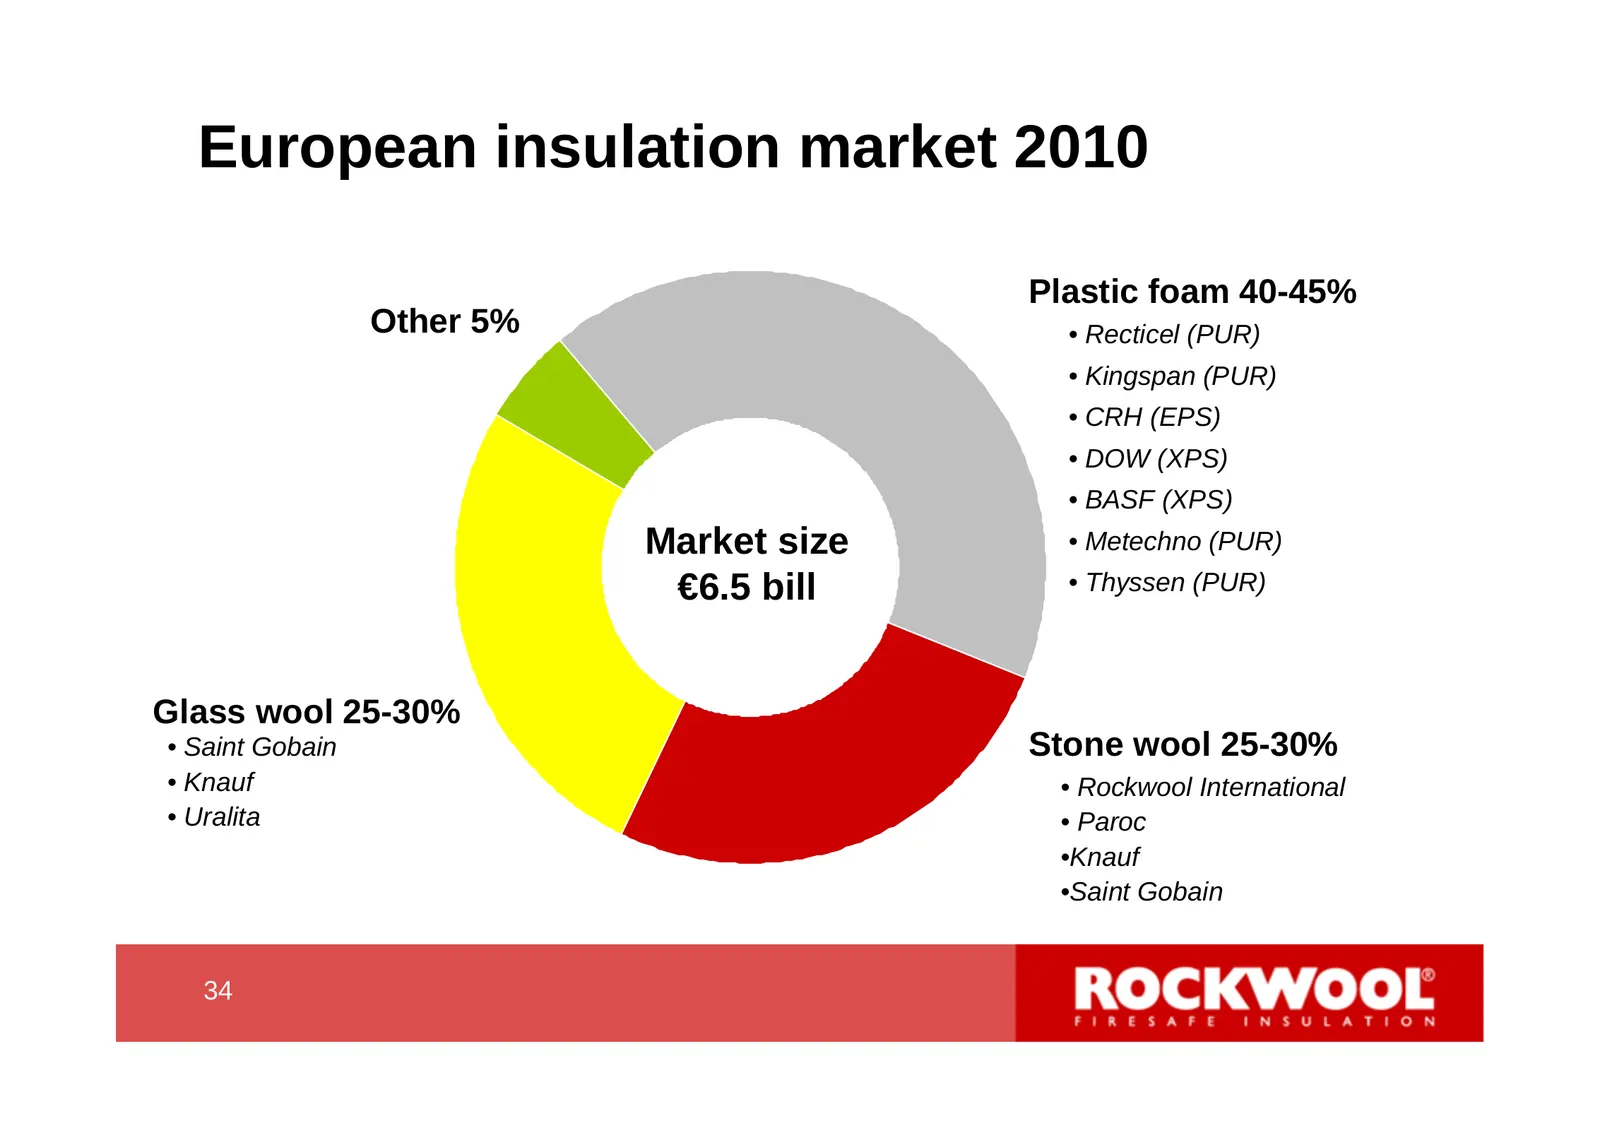
European insulation market 2010 Plastic foam 40-45% Other 5% • Recticel (PUR) • Kingspan (PUR) • CRH (EPS) • DOW (XPS) • BASF (XPS) Market size • Metechno (PUR) €6.5 bill • Thyssen (PUR) Glass wool 25-30% • Saint Gobain Stone wool 25-30% • Knauf • Rockwool International • Uralita • Paroc •Knauf •Sai
Slide 35: Regional outlook
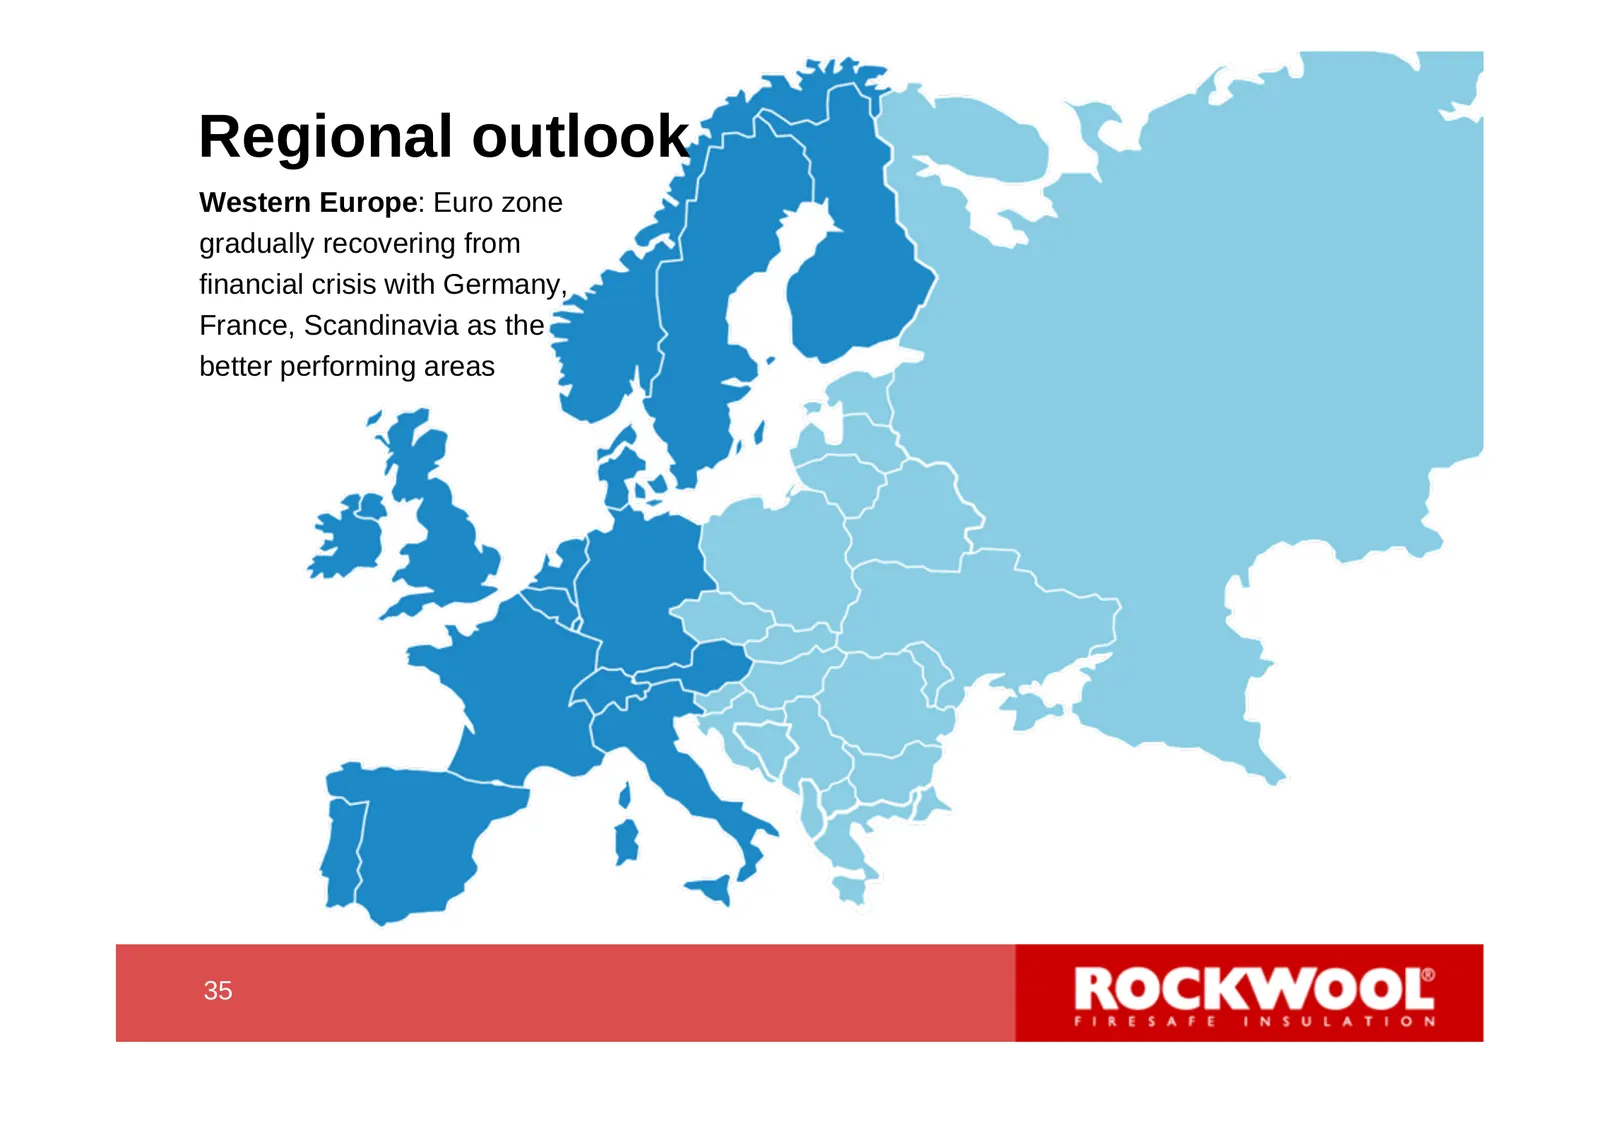
Regional outlook Western Europe: Euro zone gradually recovering from financial crisis with Germany, France, Scandinavia as the better performing areas 35 35
Slide 36: Regional outlook
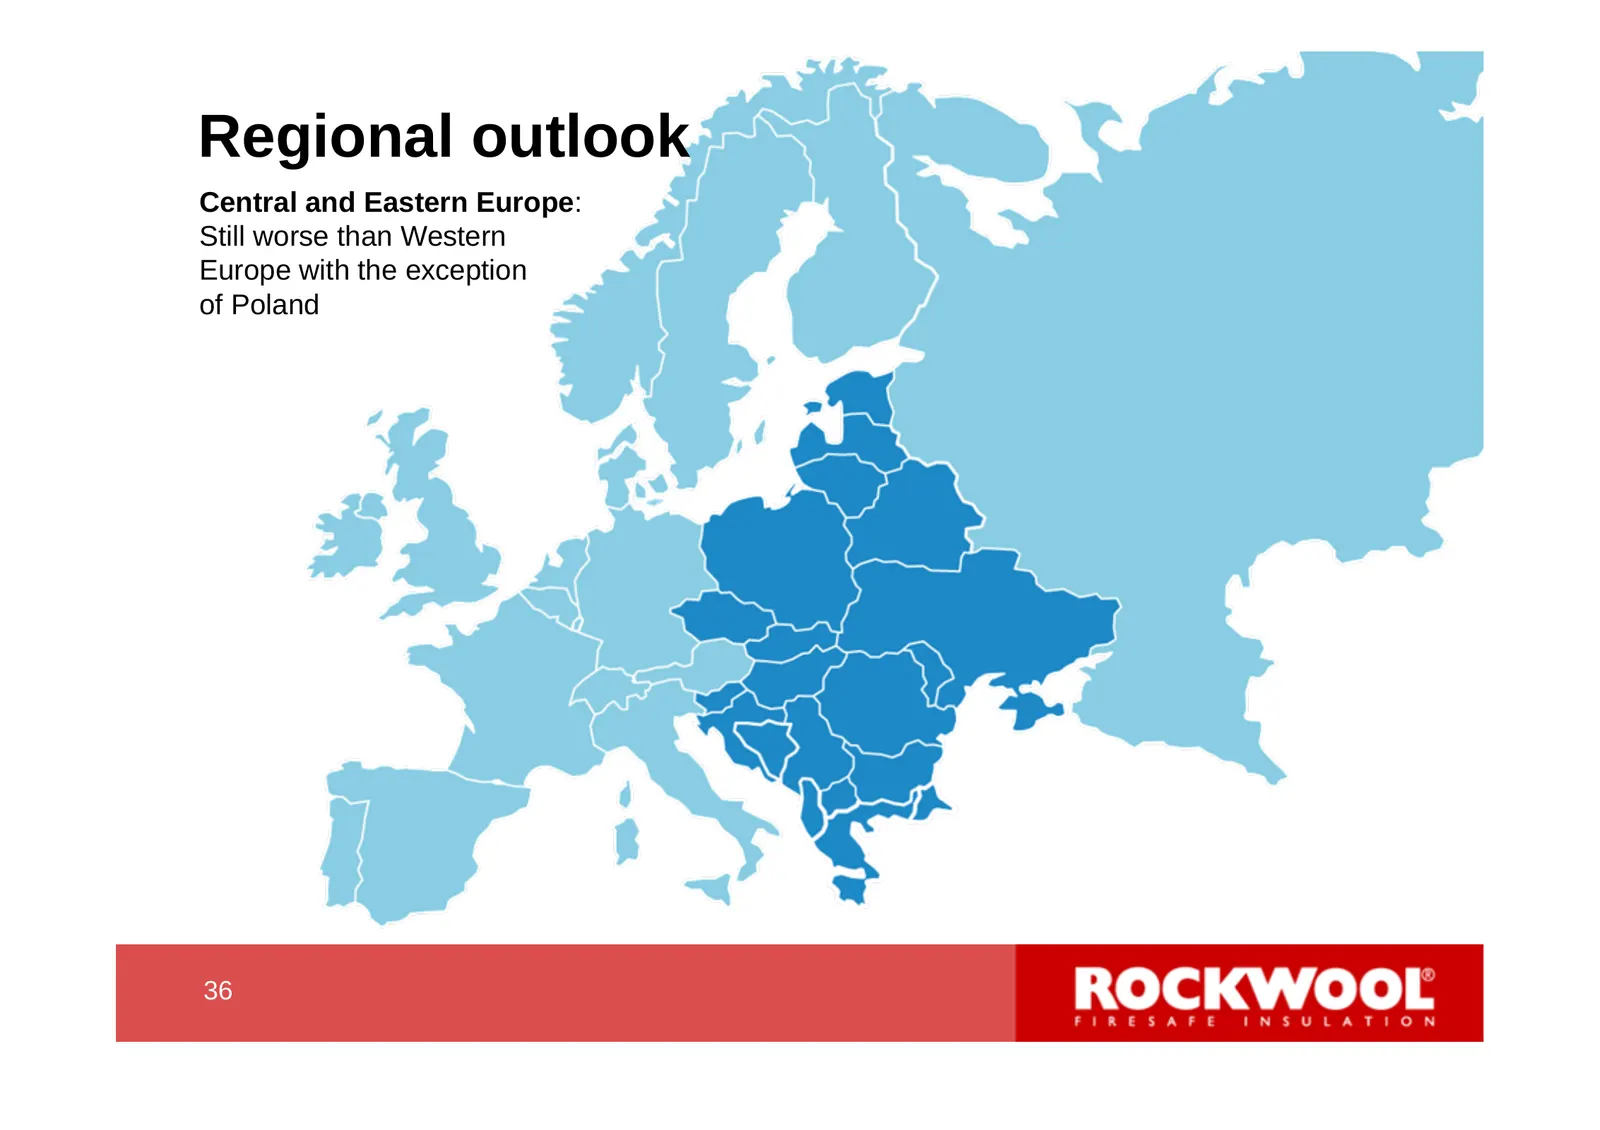
Regional outlook Central and Eastern Europe: Still worse than Western Europe with the exception of Poland 36 36
Slide 37: European legislation creates long-term growth perspectives
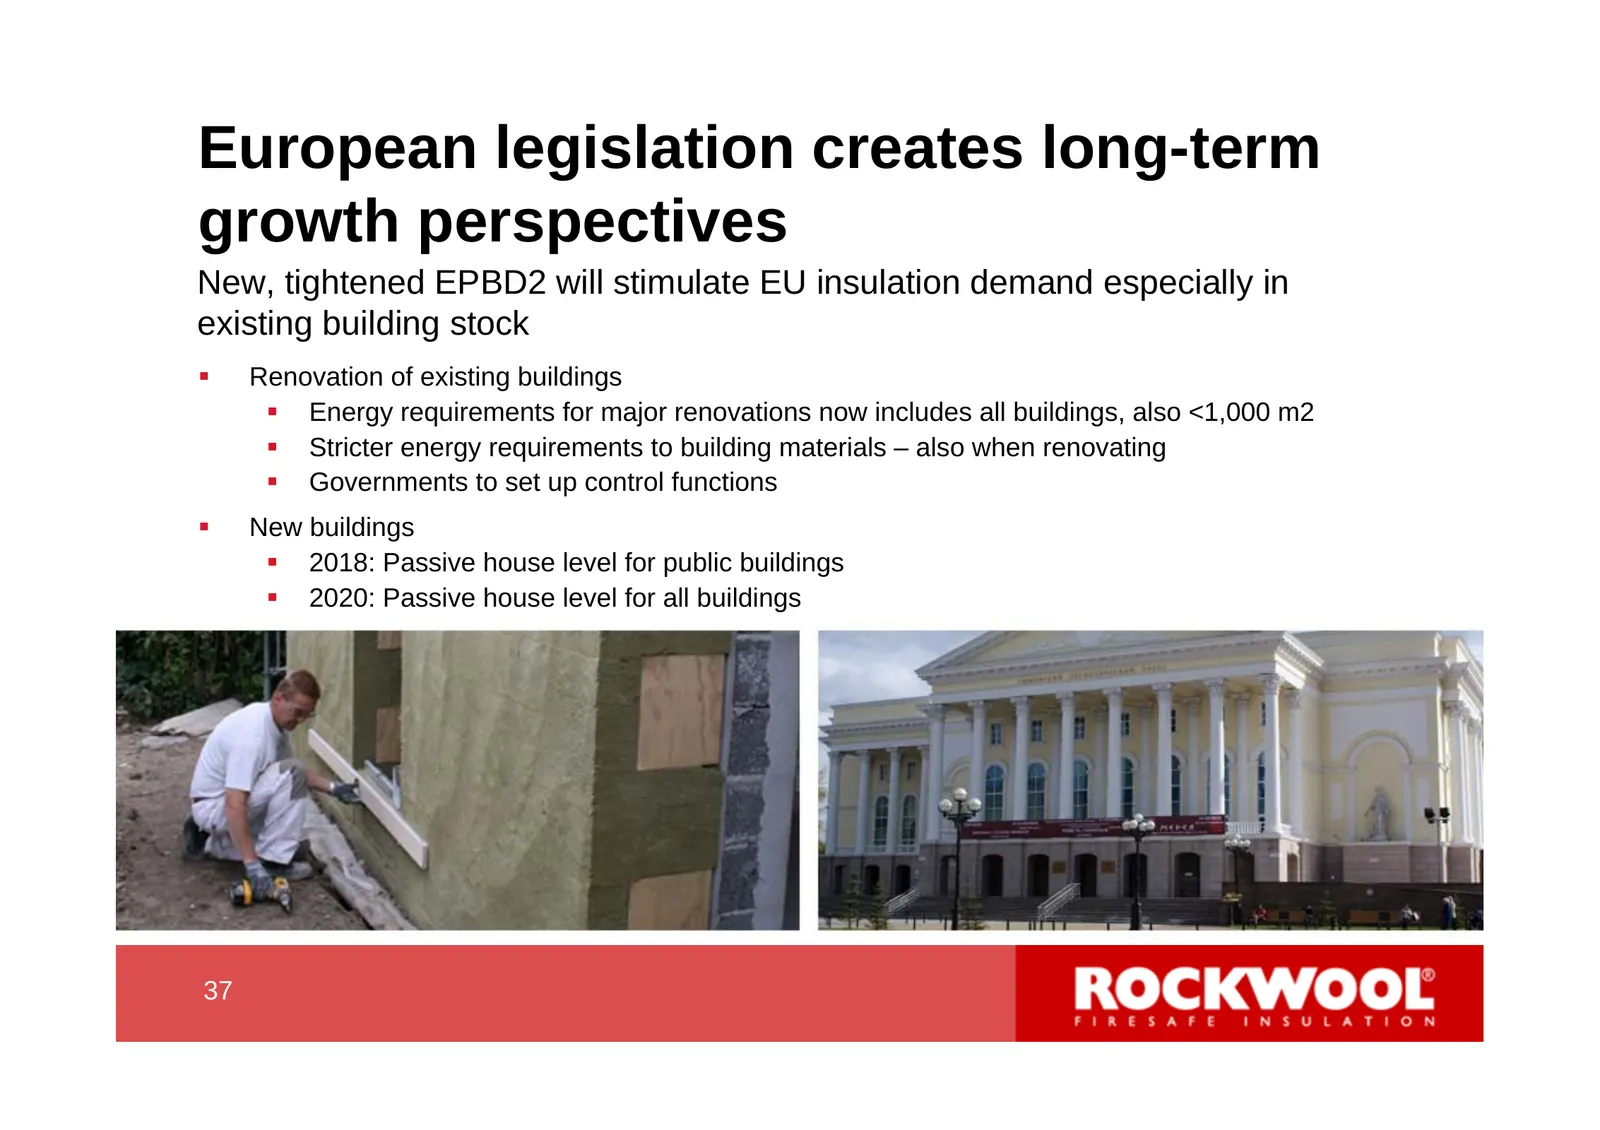
European legislation creates long-term growth perspectives New, tightened EPBD2 will stimulate EU insulation demand especially in existing building stock Renovation of existing buildings Energy requirements for major renovations now includes all buildings, also <1,000 m2 Stricter energy requir
Slide 38: Energy Services Directive
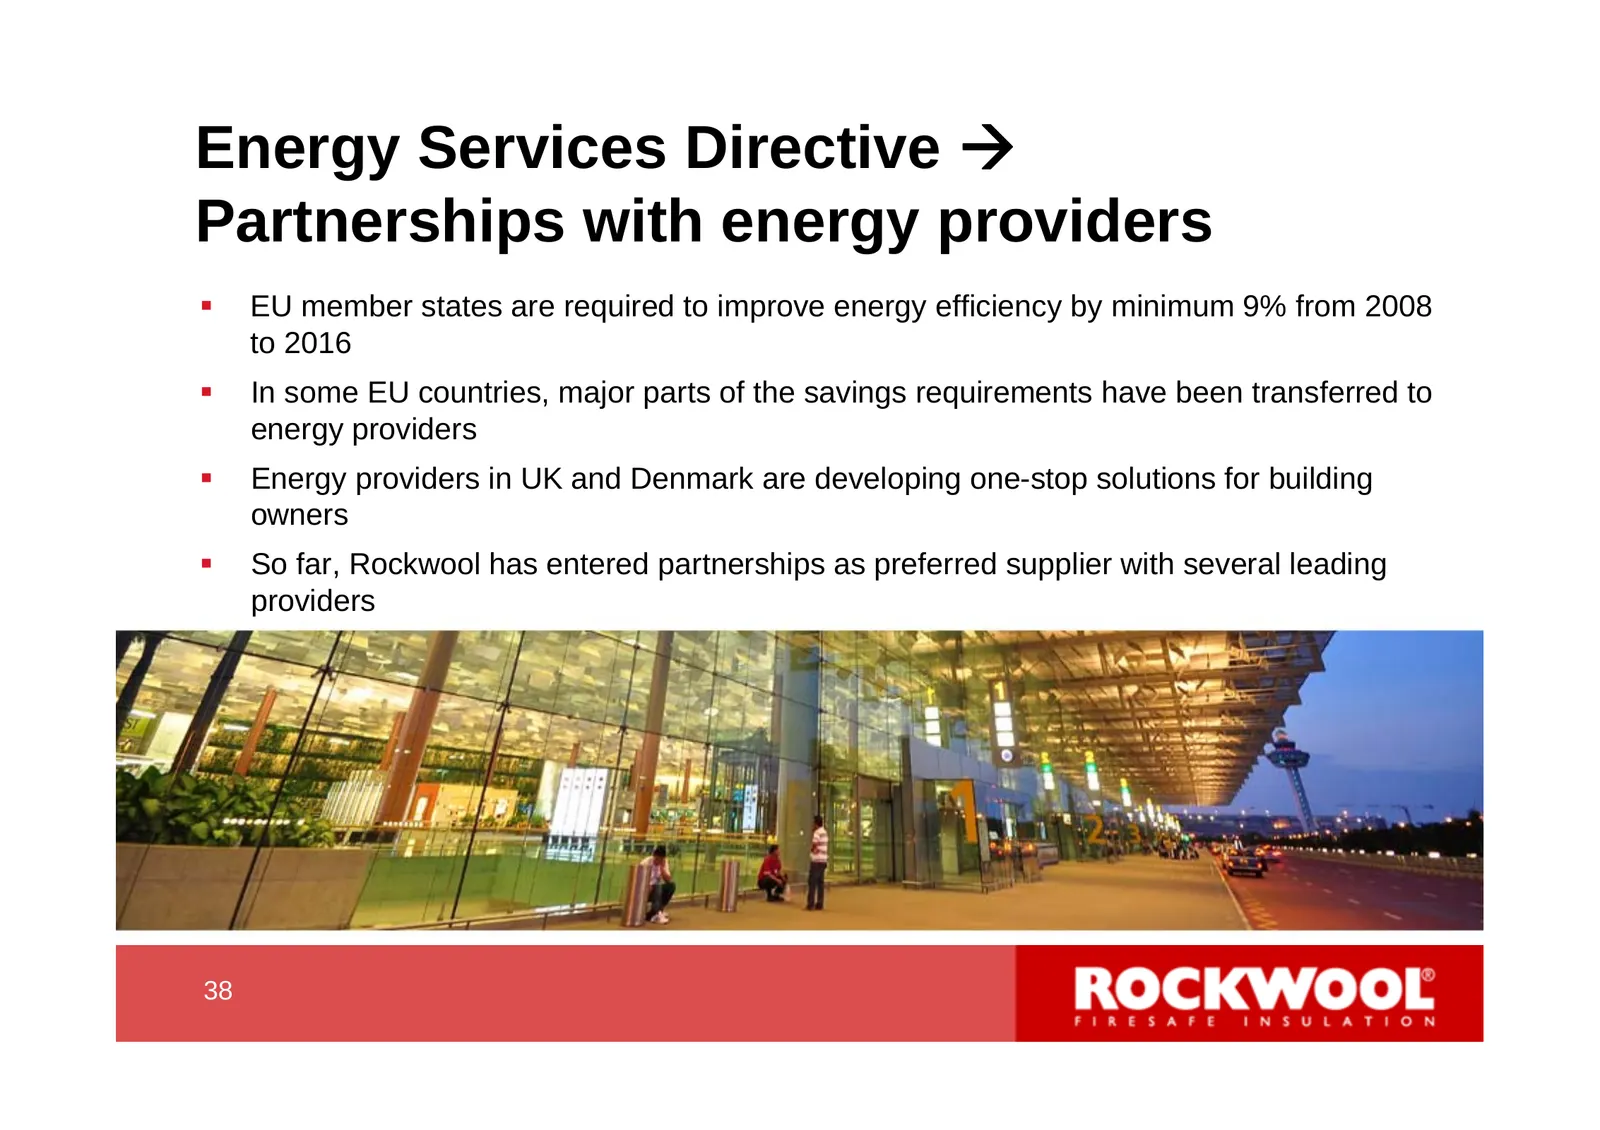
Energy Services Directive Partnerships with energy providers EU member states are required to improve energy efficiency by minimum 9% from 2008 to 2016 In some EU countries, major parts of the savings requirements have been transferred to energy providers Energy providers in UK and Denmark a
Slide 39: Market region Russia
Market region Russia 39 39
Slide 40: Russian insulation market 2010
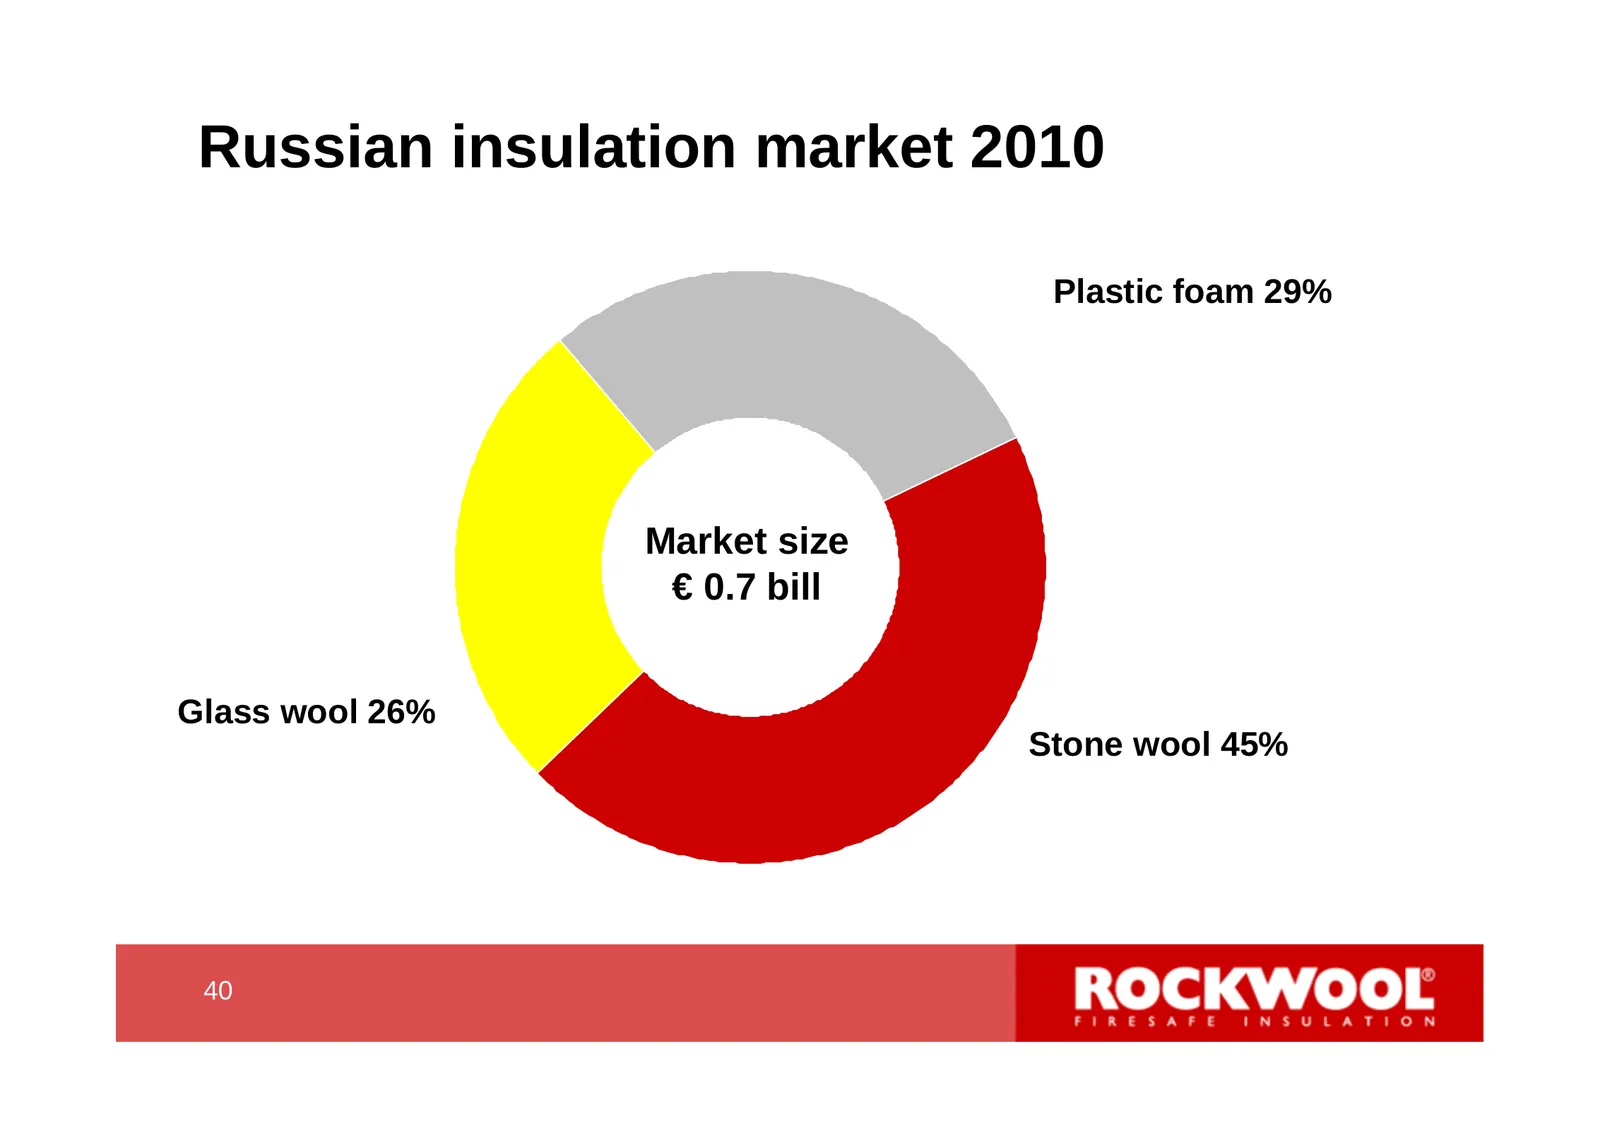
Russian insulation market 2010 Plastic foam 29% Market size € 0.7 bill Glass wool 26% Stone wool 45% 40 40
Slide 41: Regional outlook
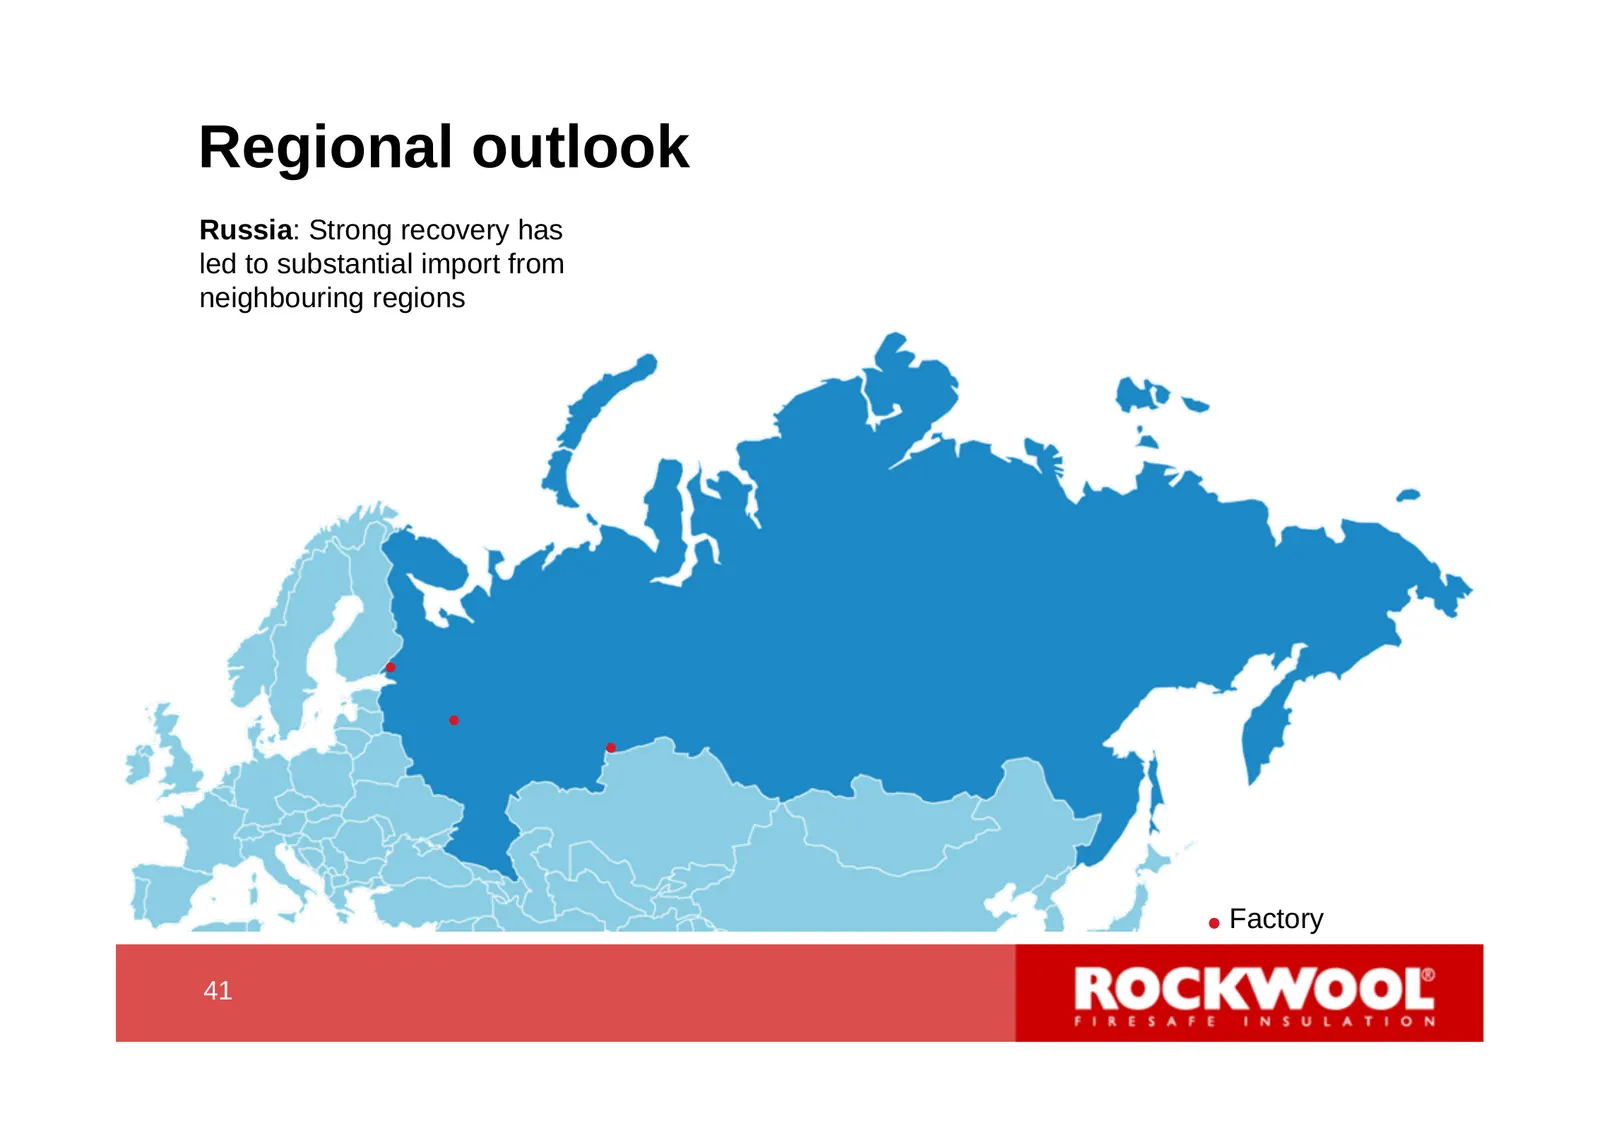
Regional outlook Russia: Strong recovery has led to substantial import from neighbouring regions Factory 41 41
Slide 42: New capacity to support the Group's long-term growth in Russia
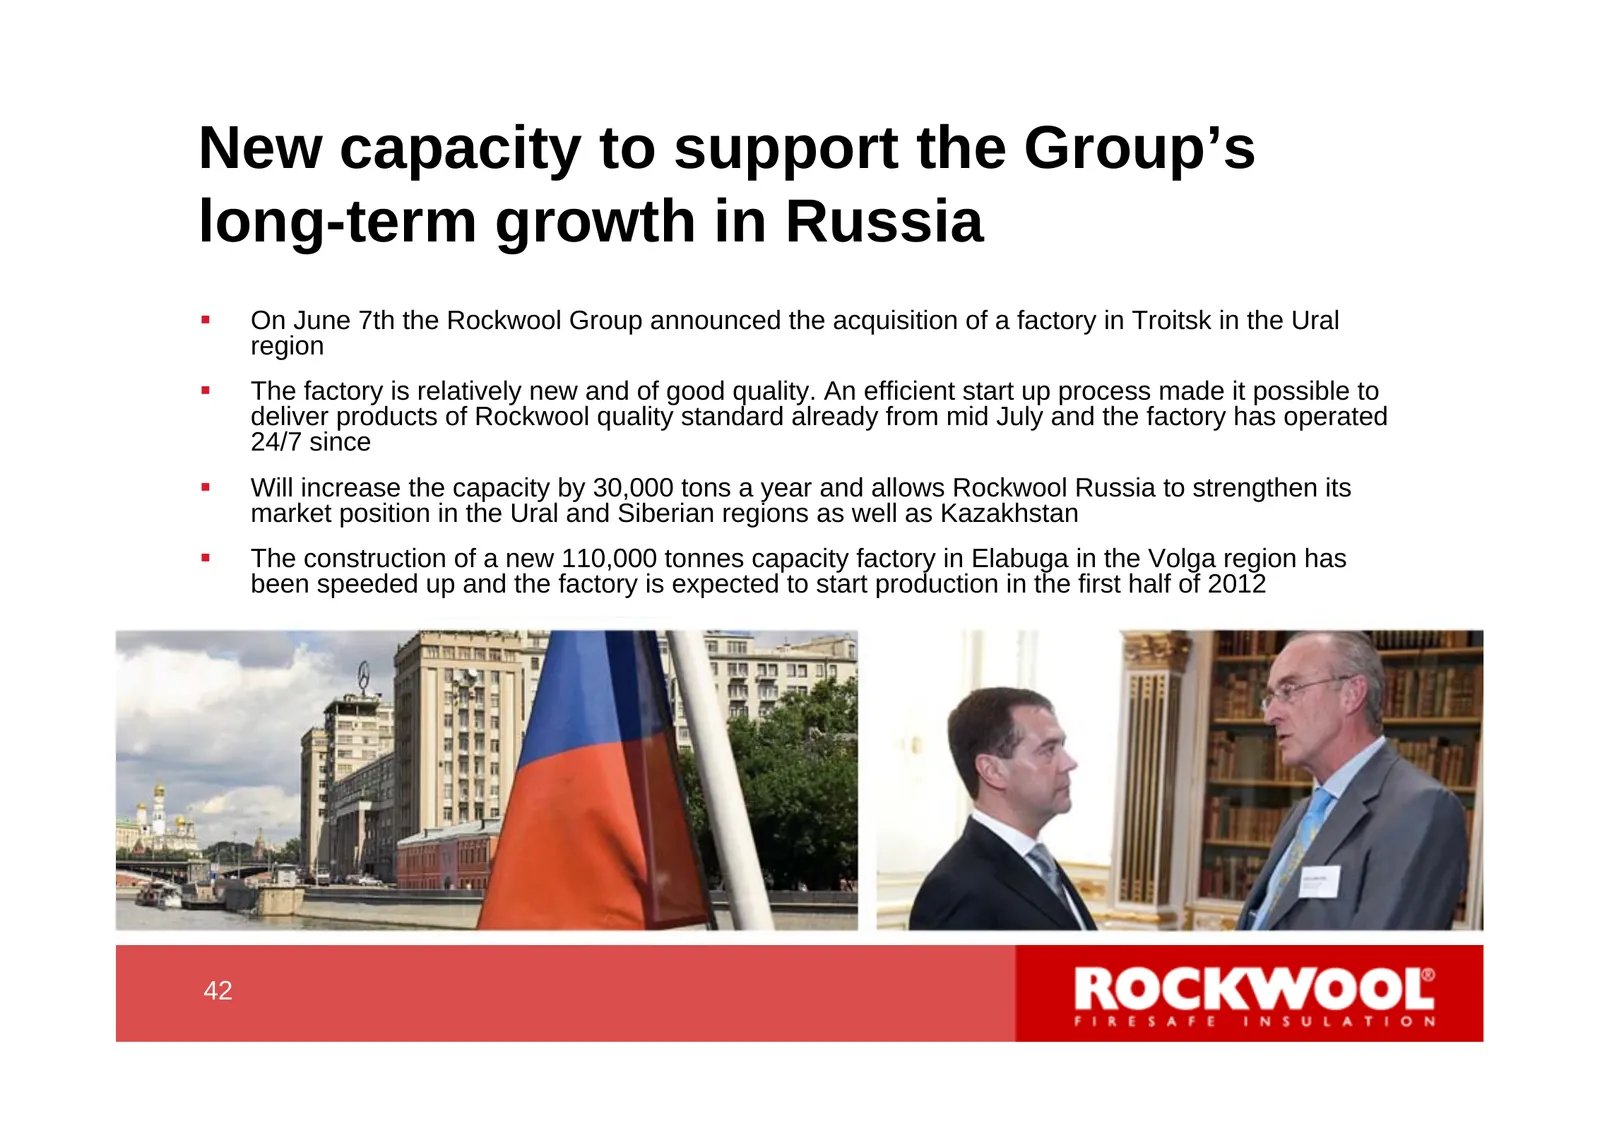
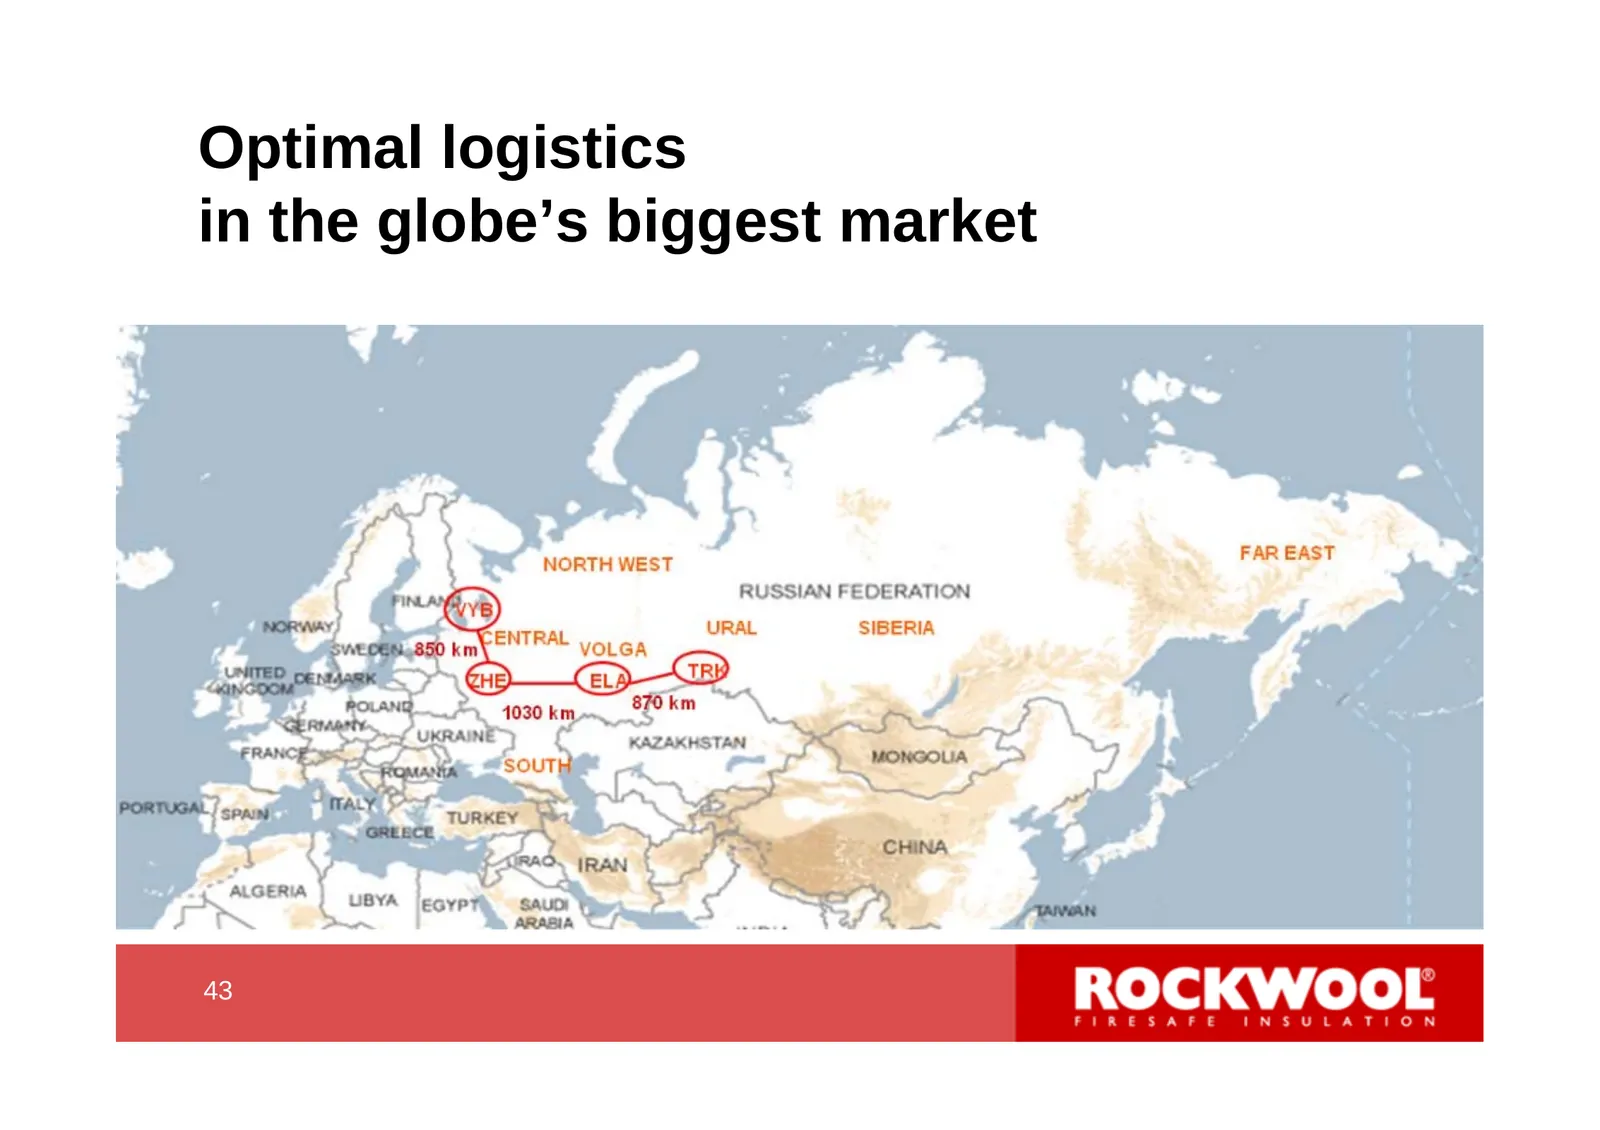
New capacity to support the Group’s long-term growth in Russia On June 7th the Rockwool Group announced the acquisition of a factory in Troitsk in the Ural region The factory is relatively new and of good quality. An efficient start up process made it possible to deliver products of Rockwool qua
Slide 43: Optimal logistics in the globe's biggest market
Optimal logistics in the globe’s biggest market 43 43
Slide 44: Market region North America
Market region North America 44 44
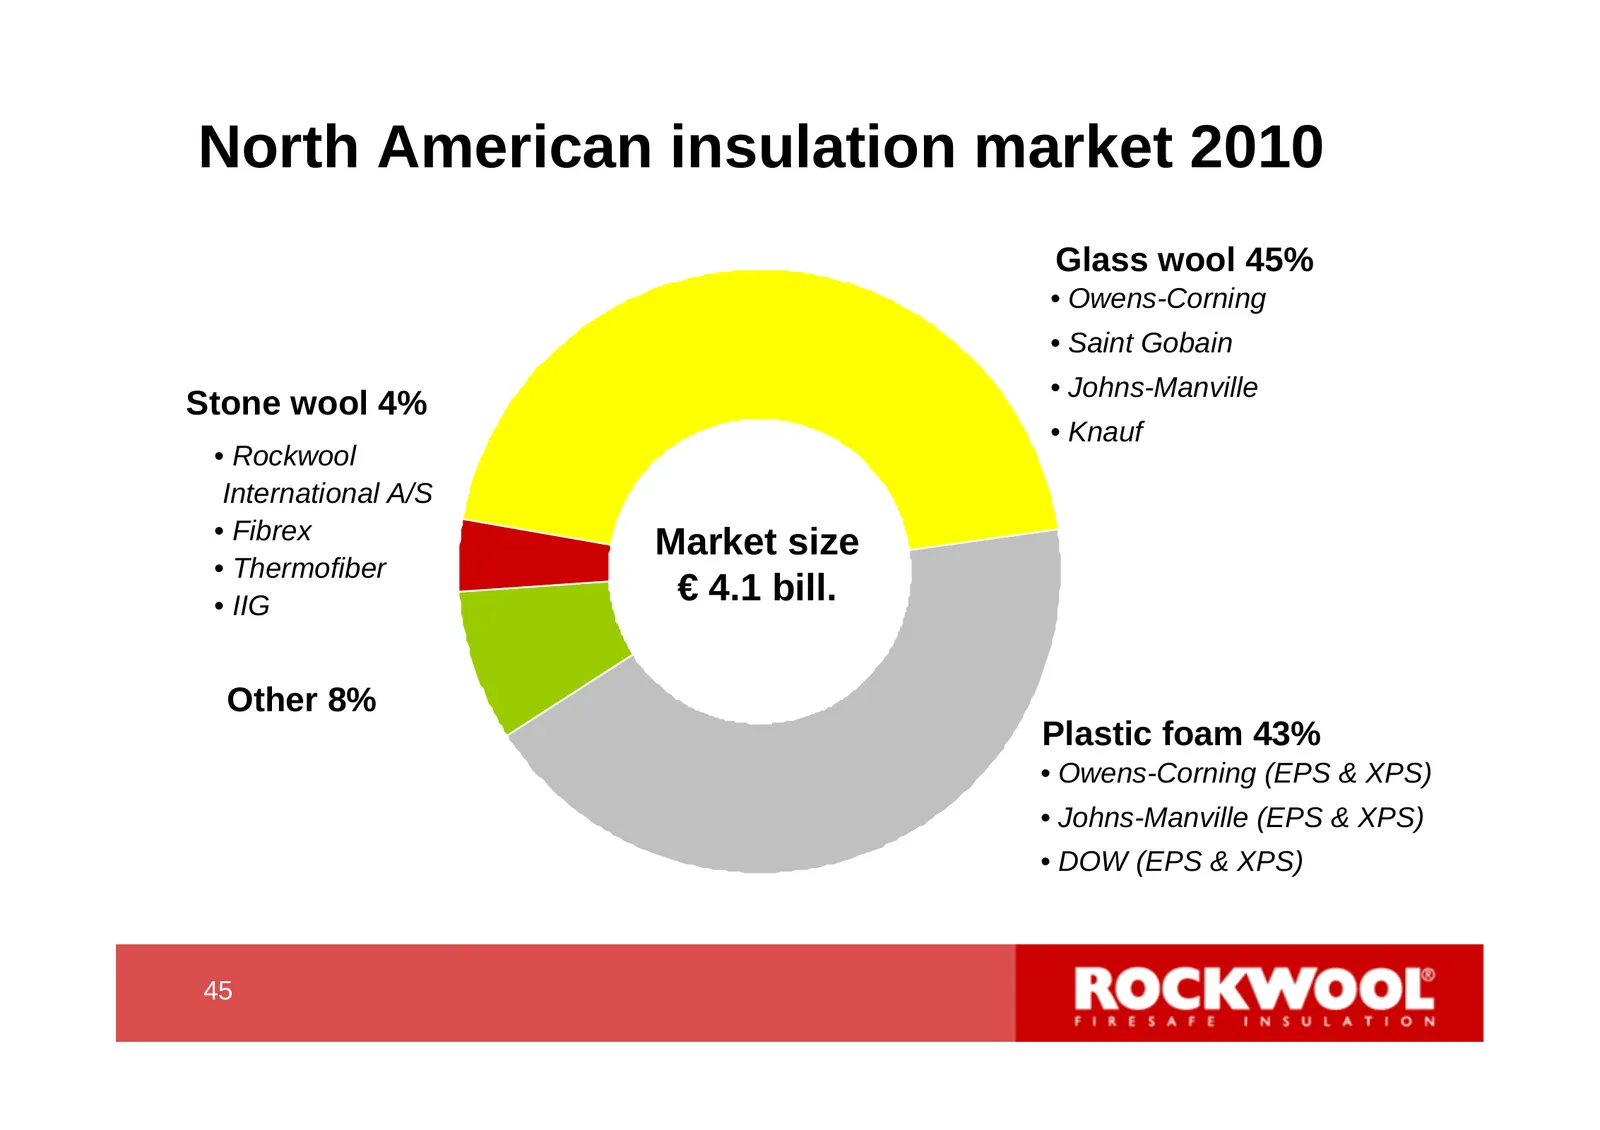
Slide 45: North American insulation market 2010
North American insulation market 2010 Glass wool 45% • Owens-Corning • Saint Gobain • Johns-Manville Stone wool 4% • Knauf • Rockwool International A/S • Fibrex Market size • Thermofiber • IIG € 4.1 bill. Other 8% Plastic foam 43% • Owens-Corning (EPS & XPS) • Johns-Manville (EPS & XPS) • DOW (EPS &
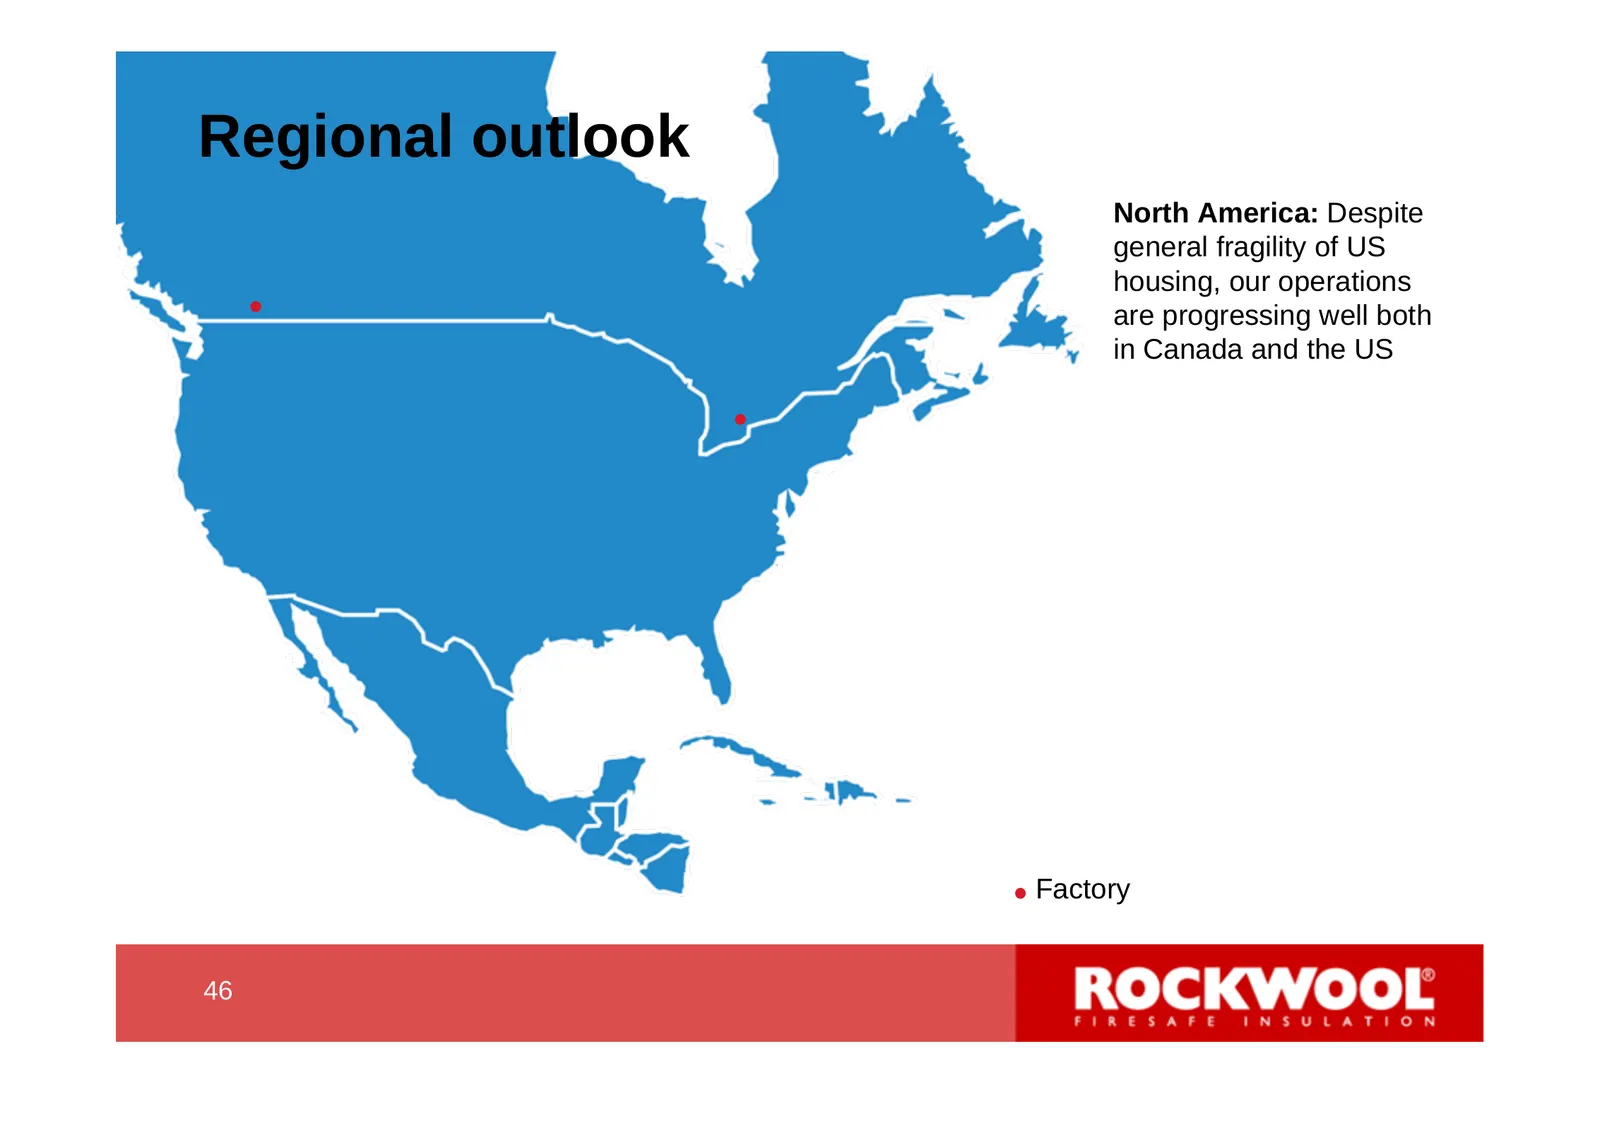
Slide 46: Regional outlook
Regional outlook North America: Despite general fragility of US housing, our operations are progressing well both in Canada and the US Factory 46 46
Slide 47: Market region Asia
Market region Asia 47 47
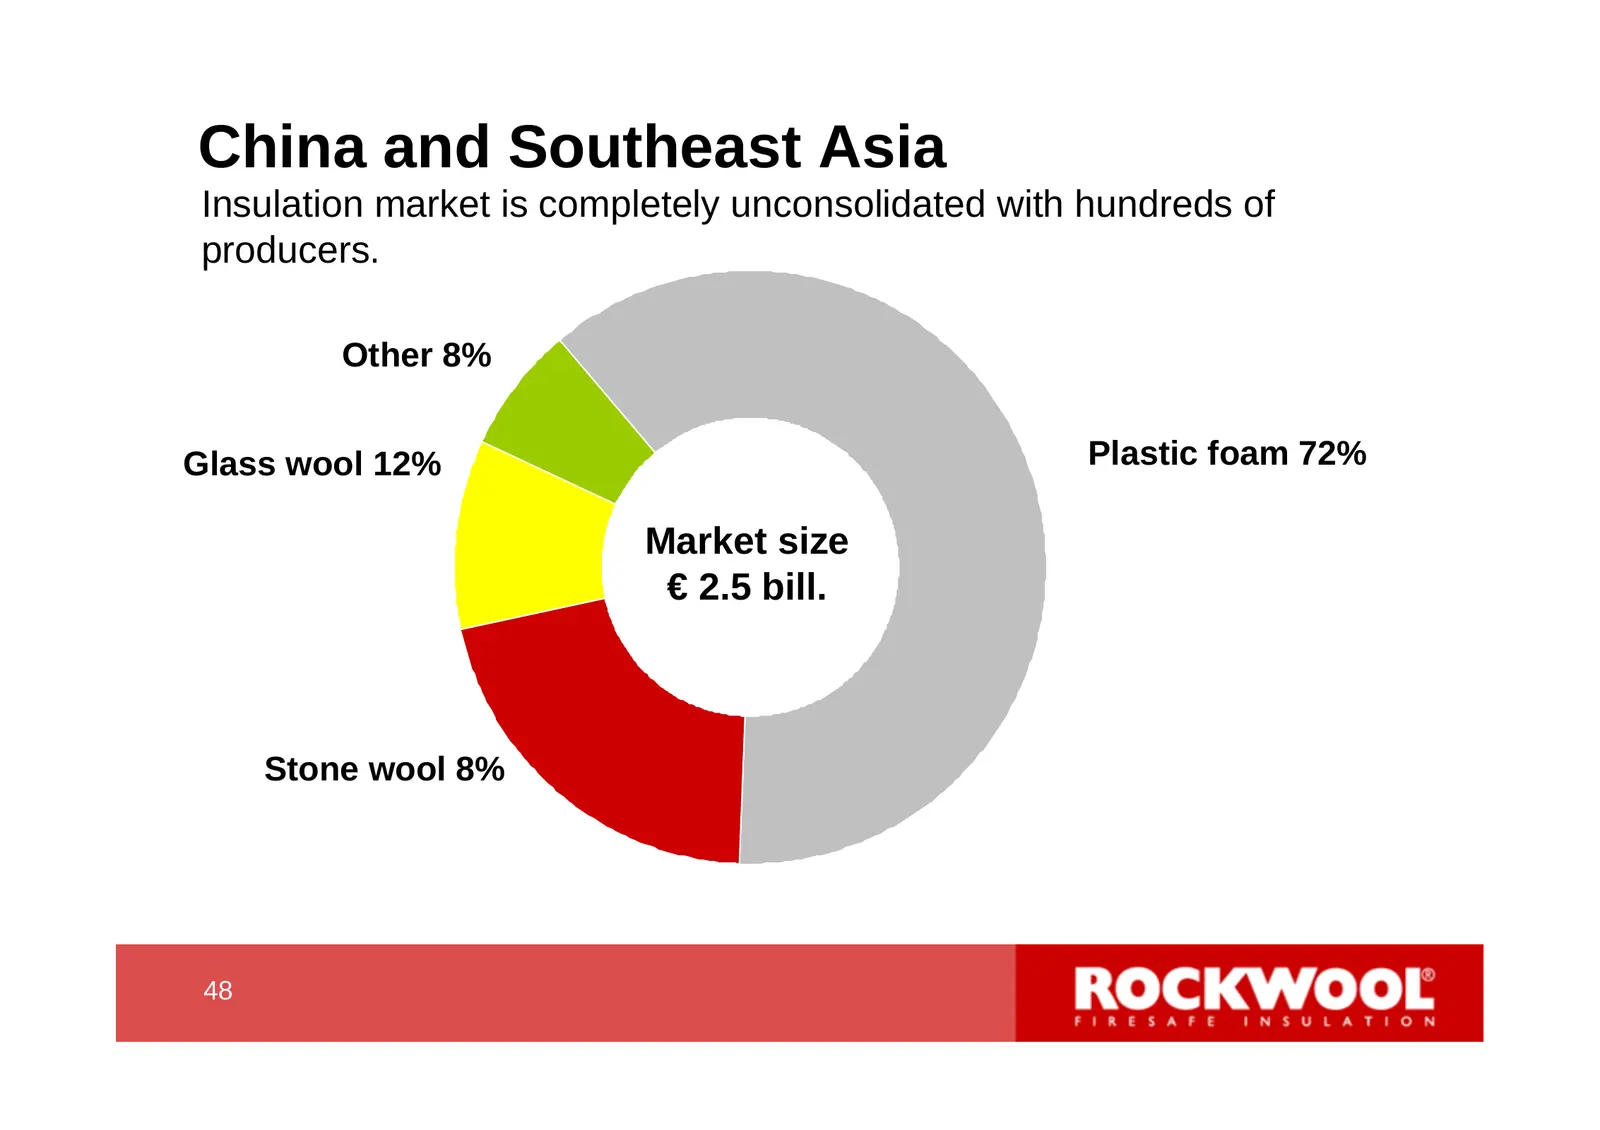
Slide 48: China and Southeast Asia
China and Southeast Asia Insulation market is completely unconsolidated with hundreds of producers. Other 8% Glass wool 12% Plastic foam 72% Market size € 2.5 bill. Stone wool 8% 48 48
Slide 49: Regional outlook
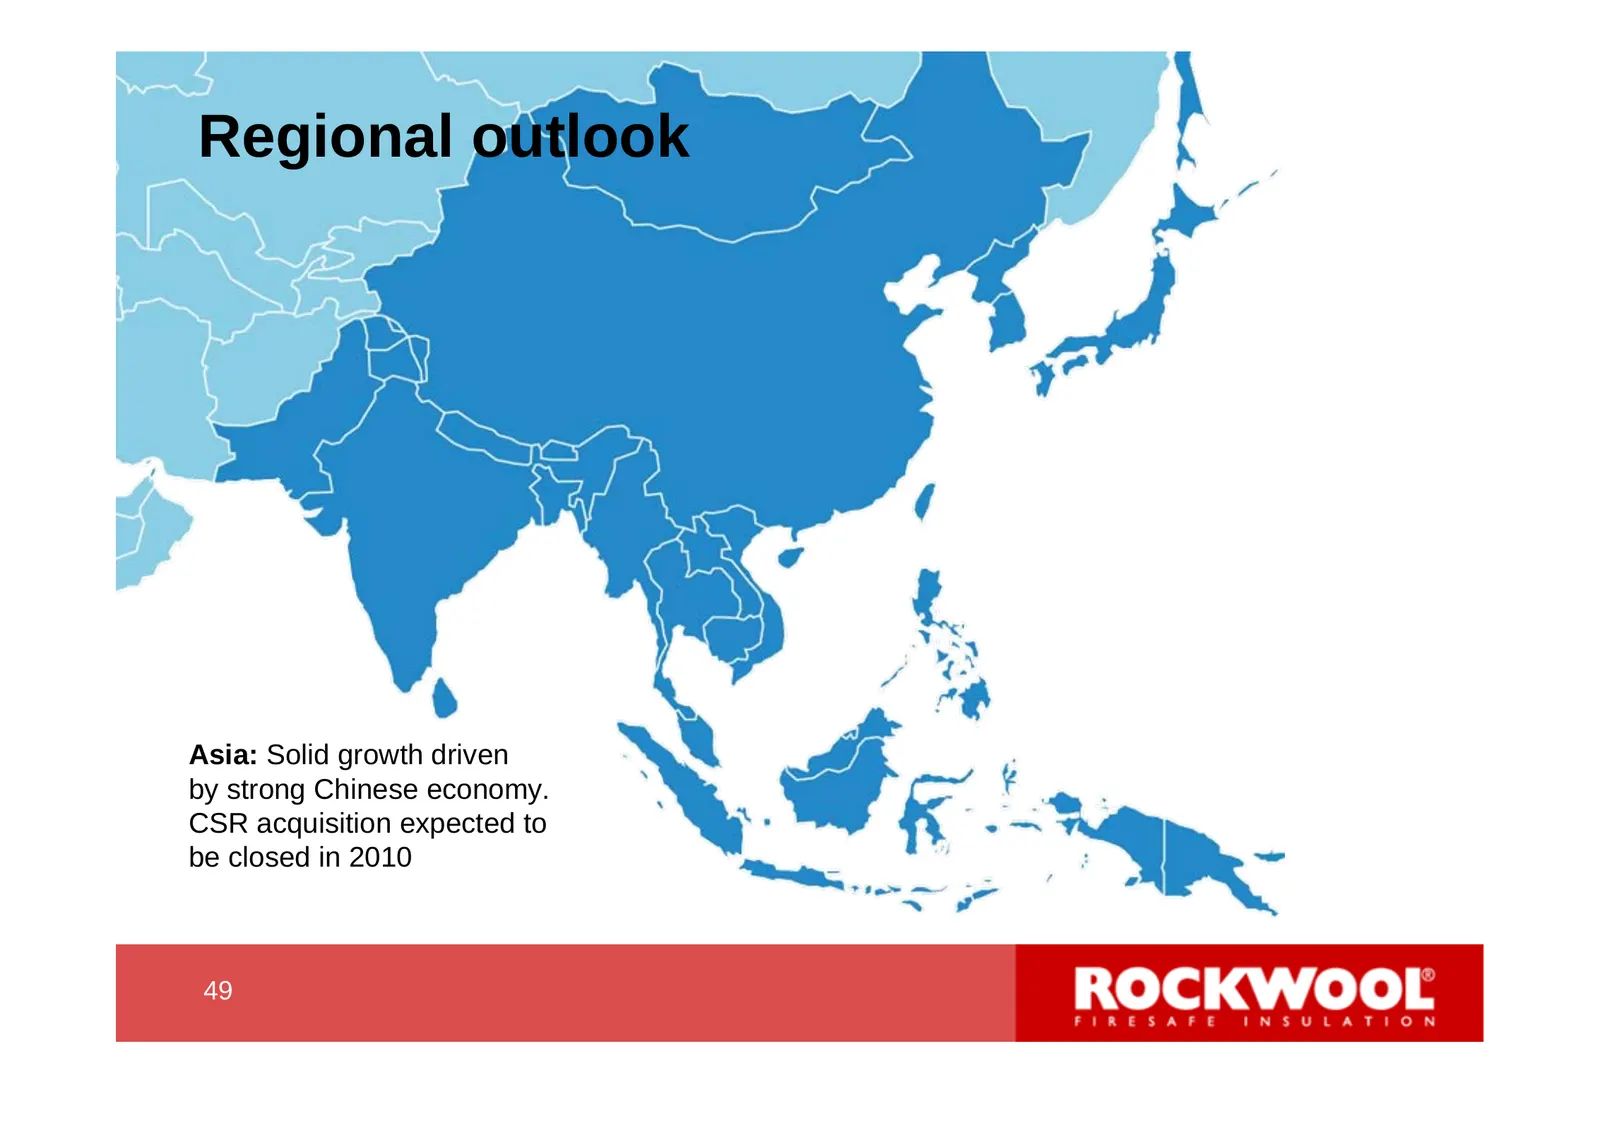
Regional outlook Asia: Solid growth driven by strong Chinese economy. CSR acquisition expected to be closed in 2010 49 49
Slide 50: Acquisition of CSR's Asian stone wool insulation business
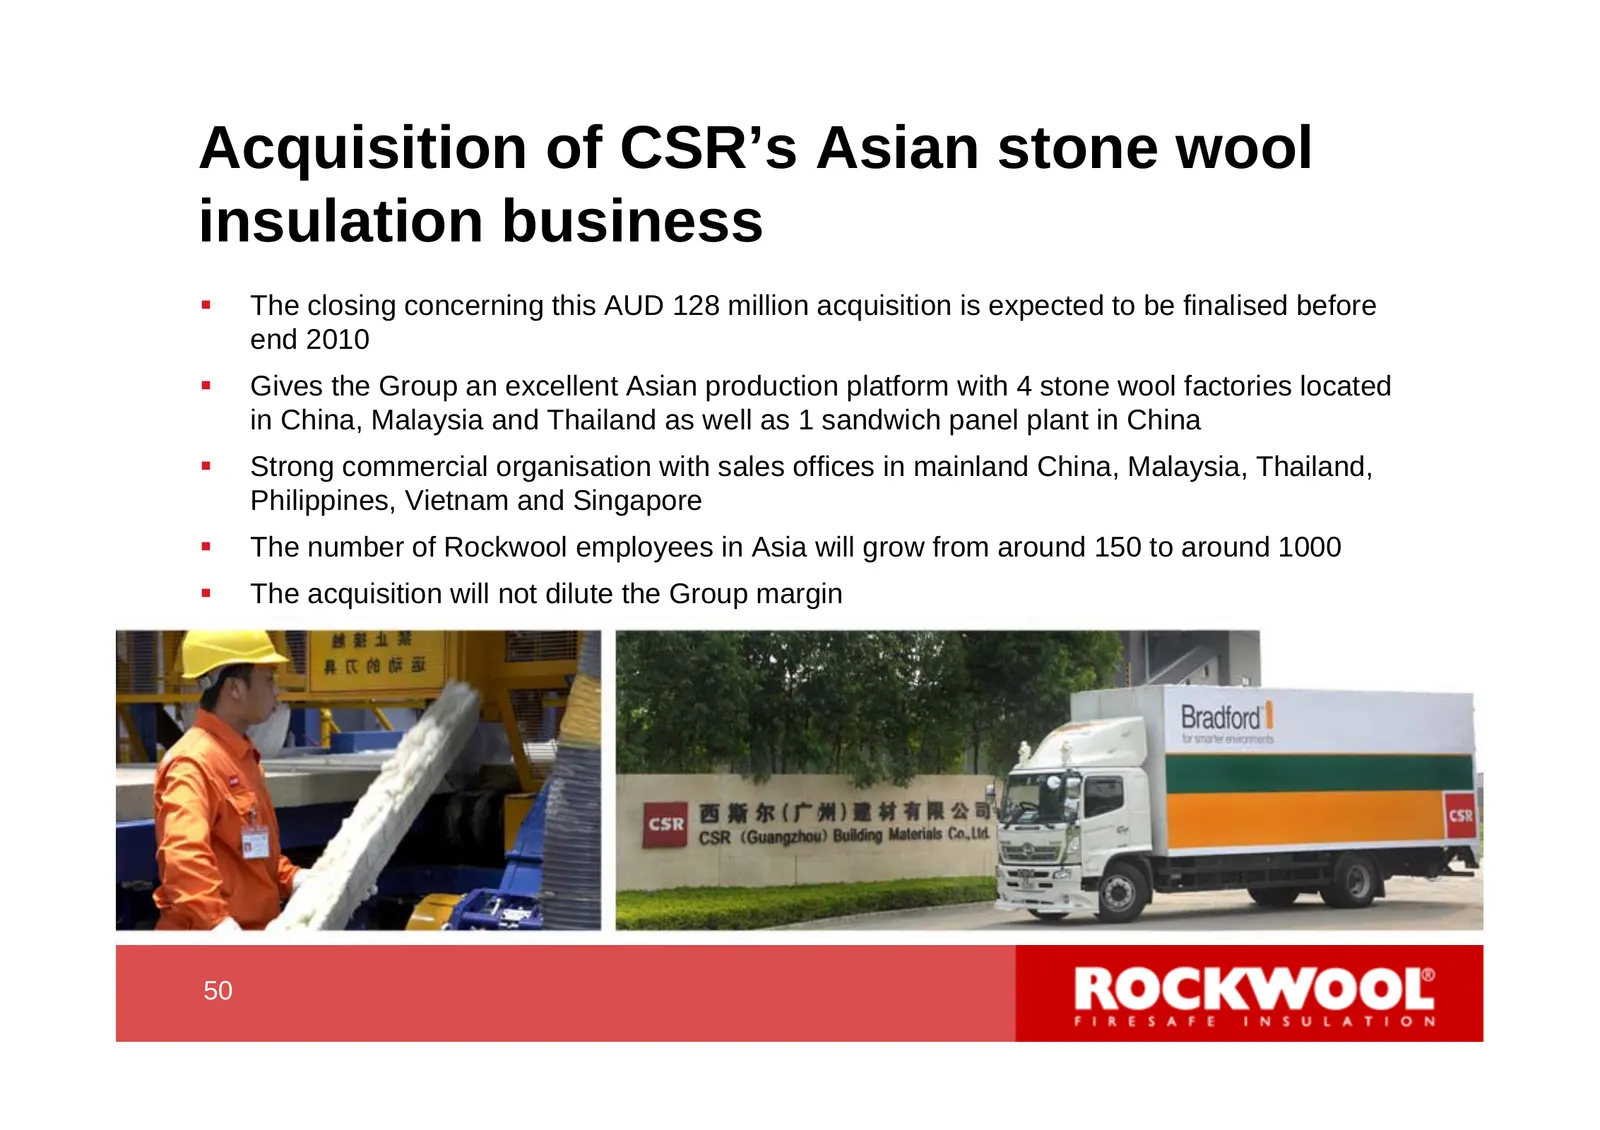
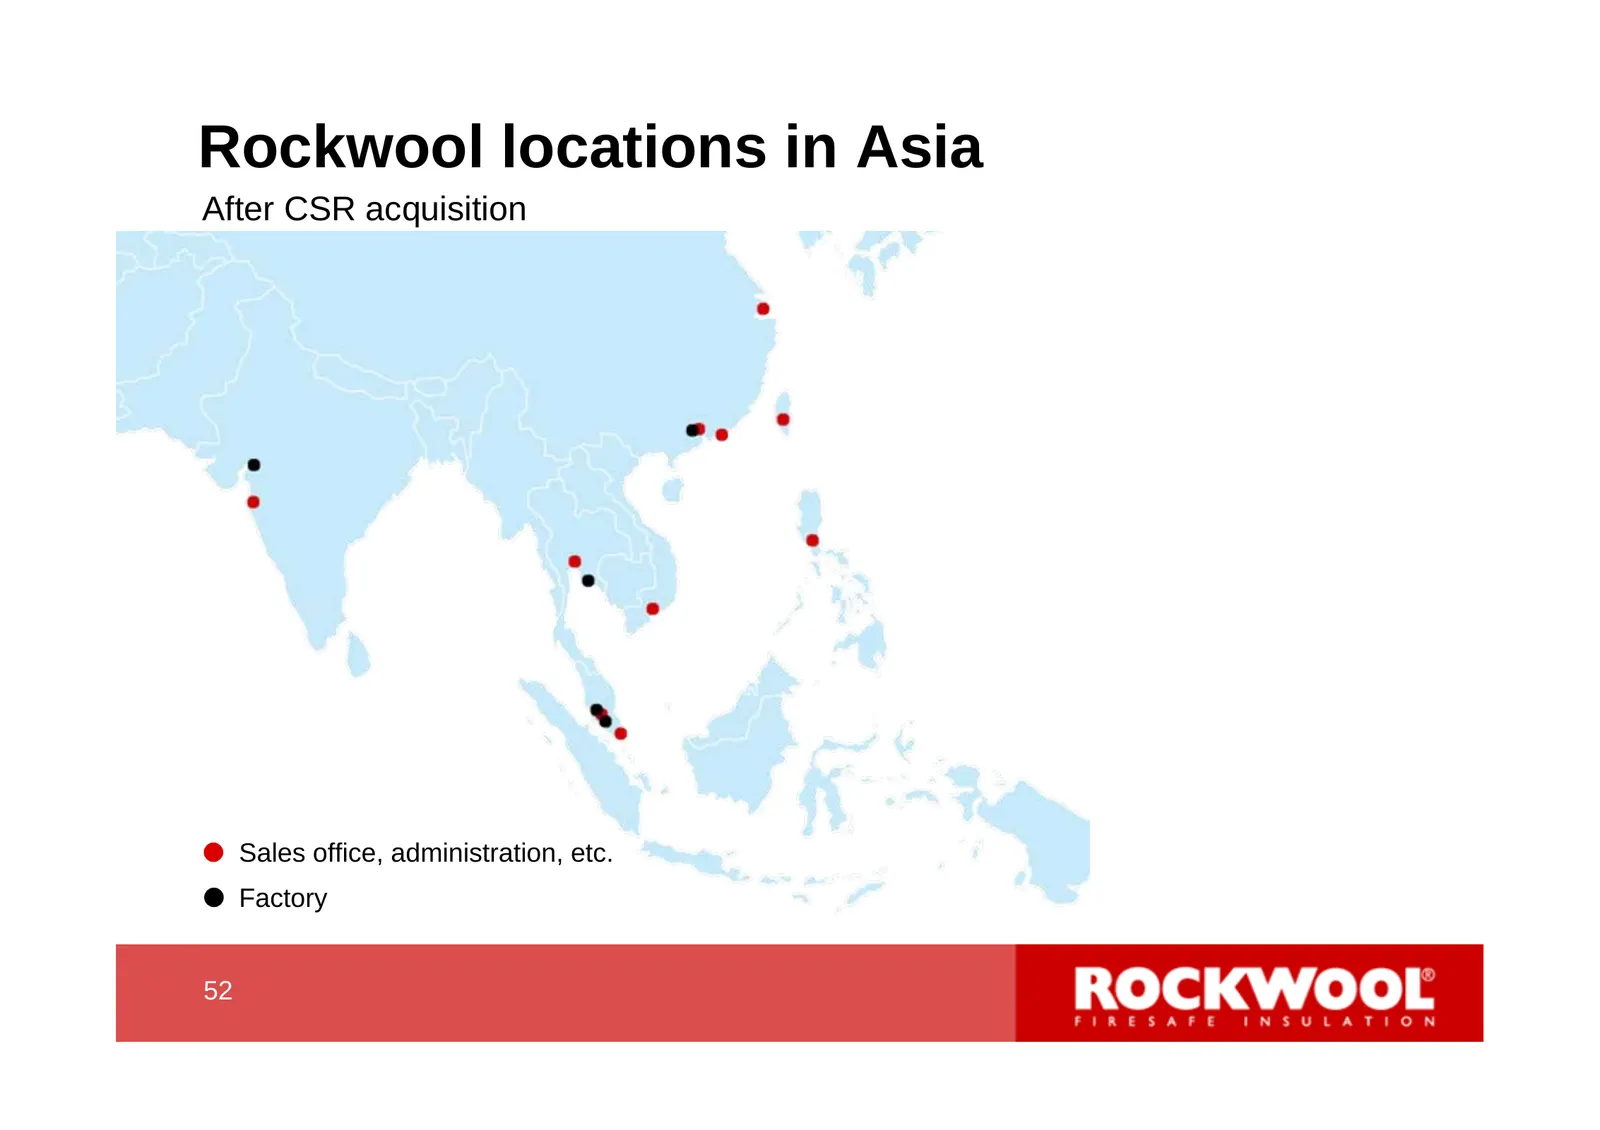
Acquisition of CSR’s Asian stone wool insulation business The closing concerning this AUD 128 million acquisition is expected to be finalised before end 2010 Gives the Group an excellent Asian production platform with 4 stone wool factories located in China, Malaysia and Thailand as well as 1 sa
Slide 51: Rockwool locations in Asia
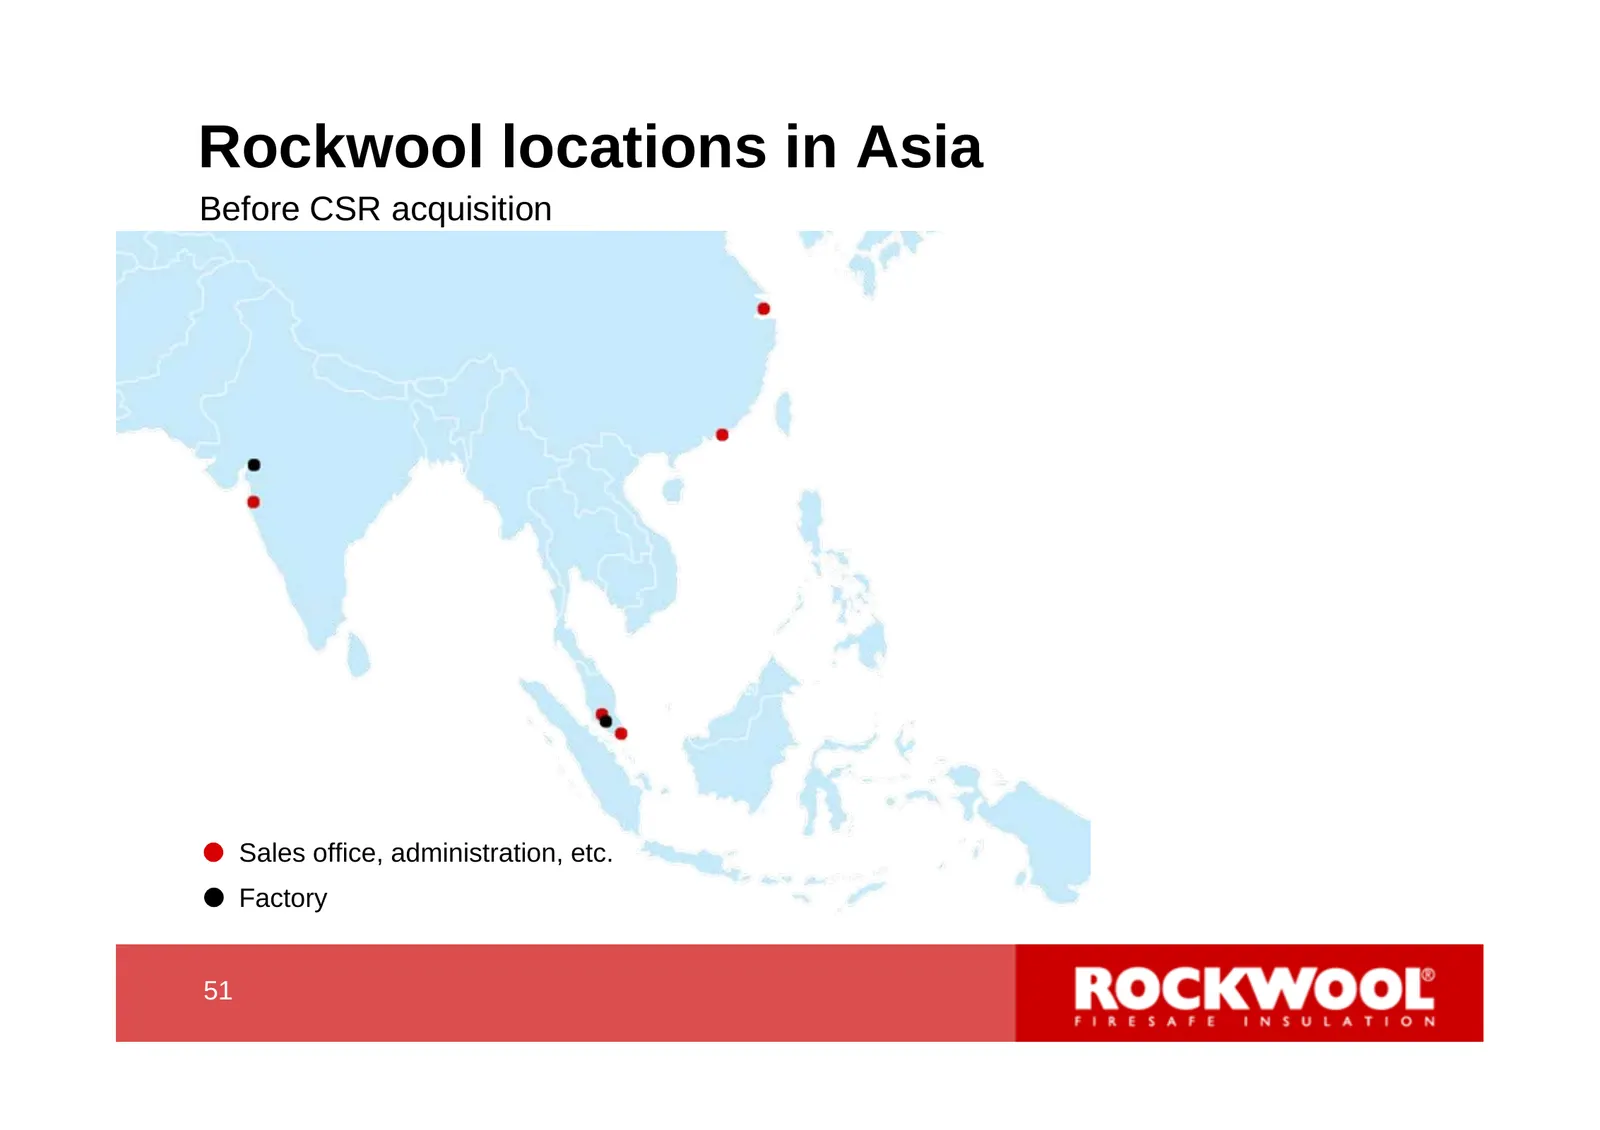
Rockwool locations in Asia Before CSR acquisition Sales office, administration, etc. Factory 51 51
Slide 52: Rockwool locations in Asia
Rockwool locations in Asia After CSR acquisition Sales office, administration, etc. Factory 52 52
Slide 53: Indian market driven by infrastructure
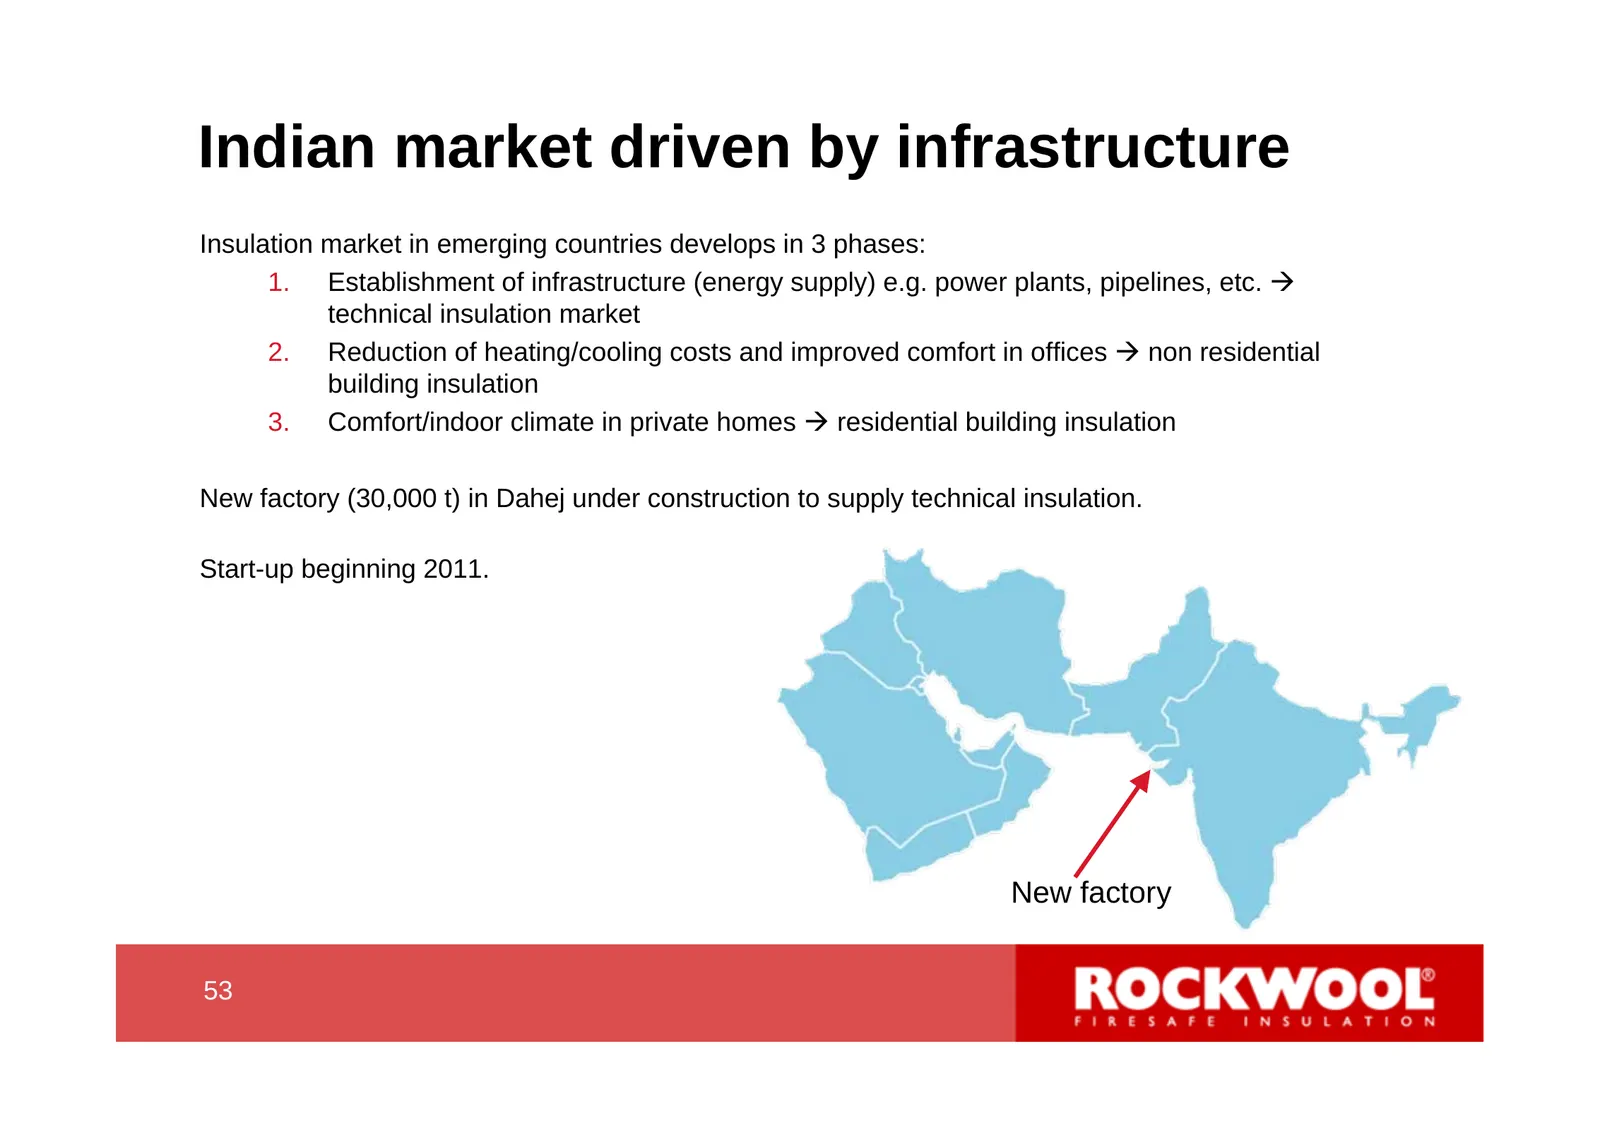
Indian market driven by infrastructure Insulation market in emerging countries develops in 3 phases: 1. Establishment of infrastructure (energy supply) e.g. power plants, pipelines, etc. technical insulation market 2. Reduction of heating/cooling costs and improved comfort in offices non residen
Source: Internet Archive copy of rockwool.com
More decks from Rockwool A/S Class A
 Q2 2026 Earnings Presentation19 slides · Aug 20, 2026
 Q1 2026 Earnings Presentation15 slides · May 20, 2026
 Shareholder Meeting (2026)10 slides · Apr 15, 2026
 Shareholder Meeting (April 2026)46 slides · Apr 15, 2026
 Q4 2025 Earnings Presentation19 slides · Feb 5, 2026
 Q2 2025 Earnings Presentation17 slides · Aug 21, 2025