McBride plc · LSE:MCB
McBride — FY2006-07 Earnings Presentation
31 slides from McBride's earnings presentation, September 2007
Slide 1: McBride plc 2006-07 full year results presentation
McBride plc 2006-07 full year results presentation September 2007
Slide 2: Summary
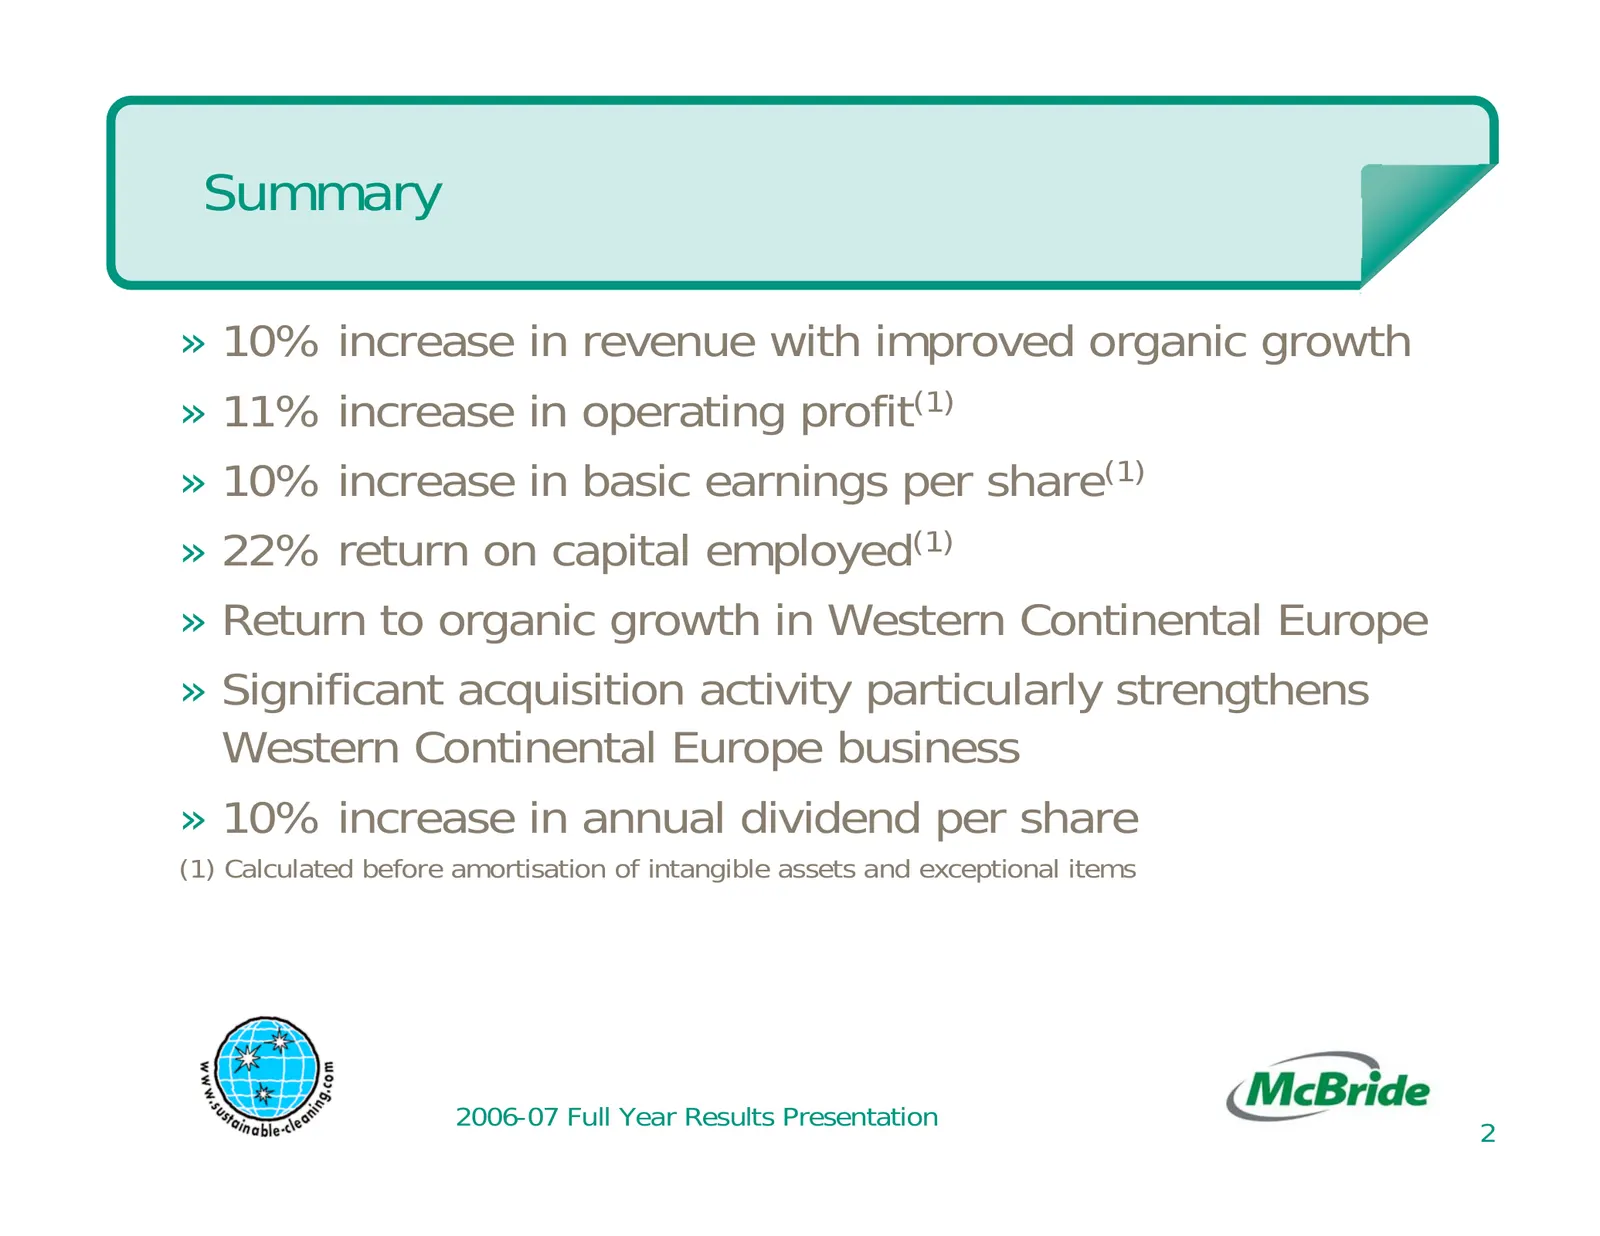
Summary » 10% increase in revenue with improved organic growth » 11% increase in operating profit(1) » 10% increase in basic earnings per share(1) » 22% return on capital employed(1) » Return to organic growth in Western Continental Europe » Significant acquisition activity particularly strengthens

Slide 3: Financial review
Financial review
Slide 4: Financial headlines
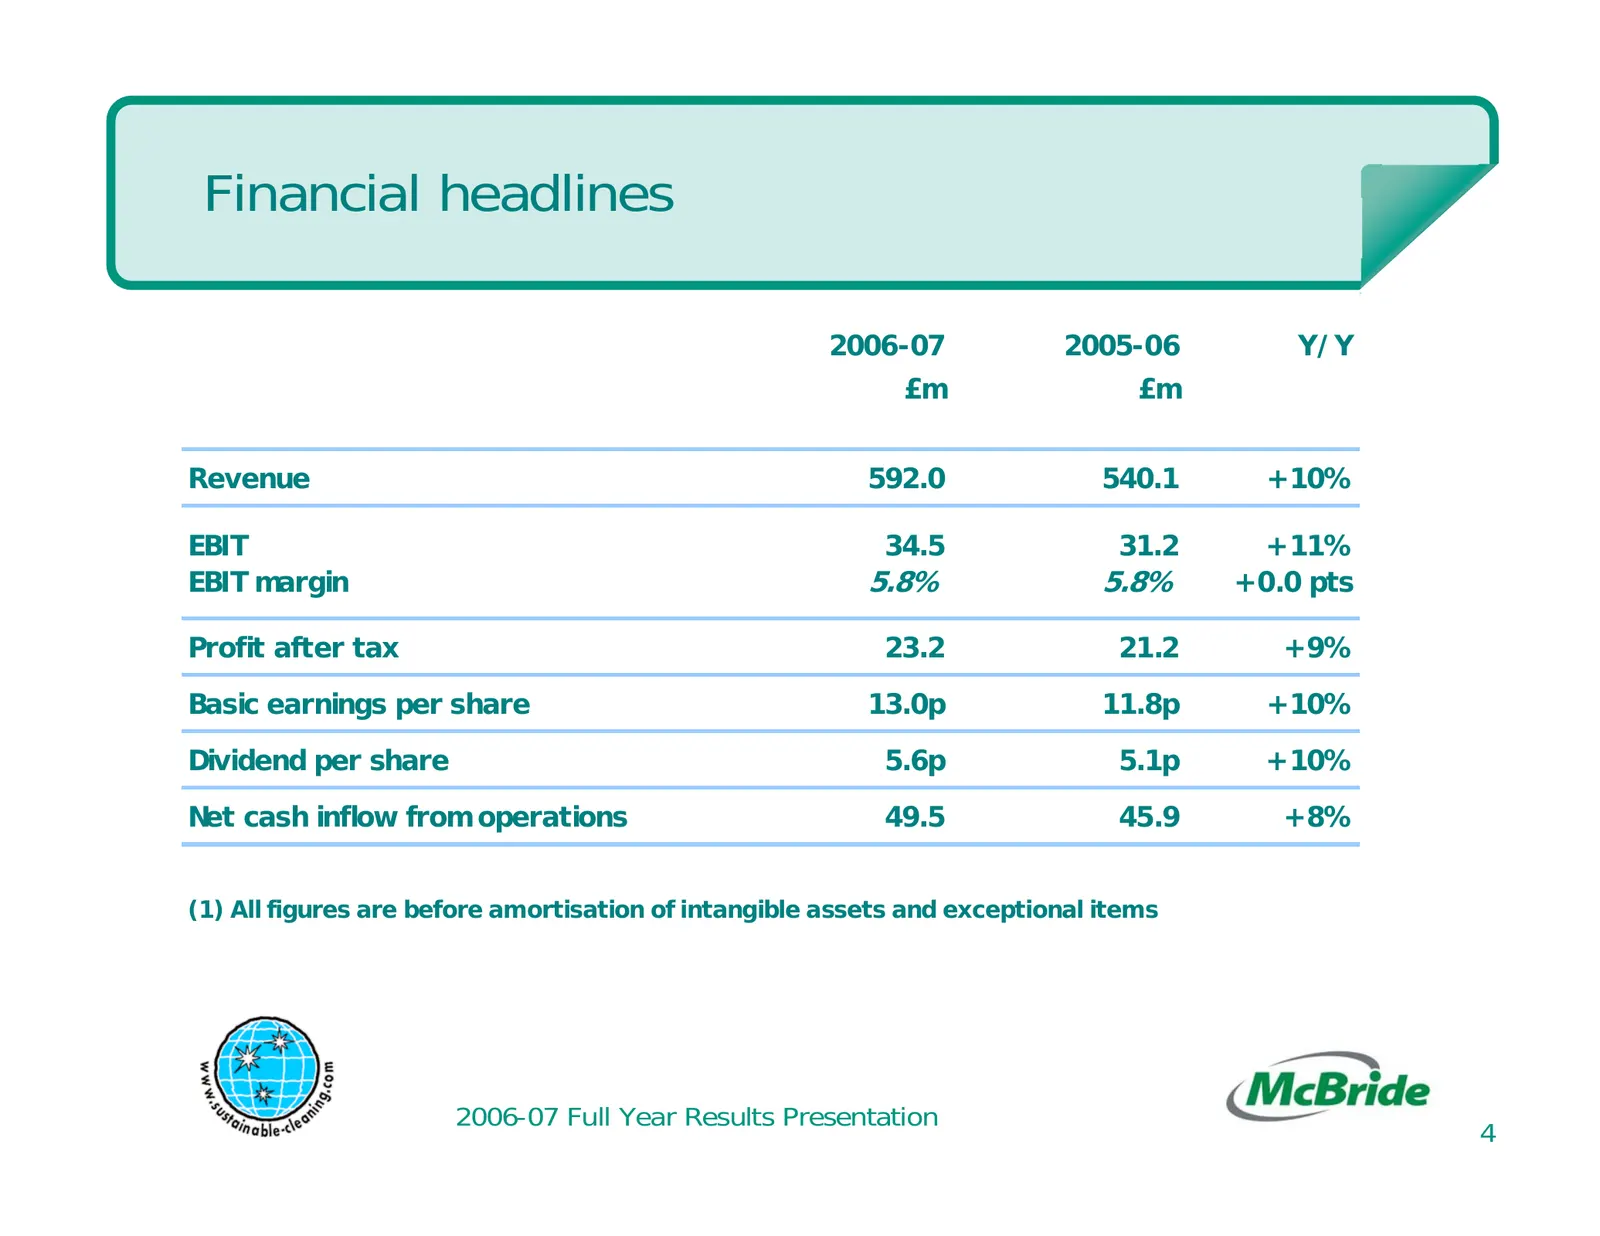
Financial headlines 2006-07 2005-06 Y/Y £m £m Revenue 592.0 540.1 +10% EBIT 34.5 31.2 +11% EBIT margin 5.8% 5.8% +0.0 pts Profit after tax 23.2 21.2 +9% Basic earnings per share 13.0p 11.8p +10% Dividend per share 5.6p 5.1p +10% Net cash inflow from operations 49.5 45.9 +8% (1) All figures are befor
Slide 5: Revenue bridge 2005-06 to 2006-07
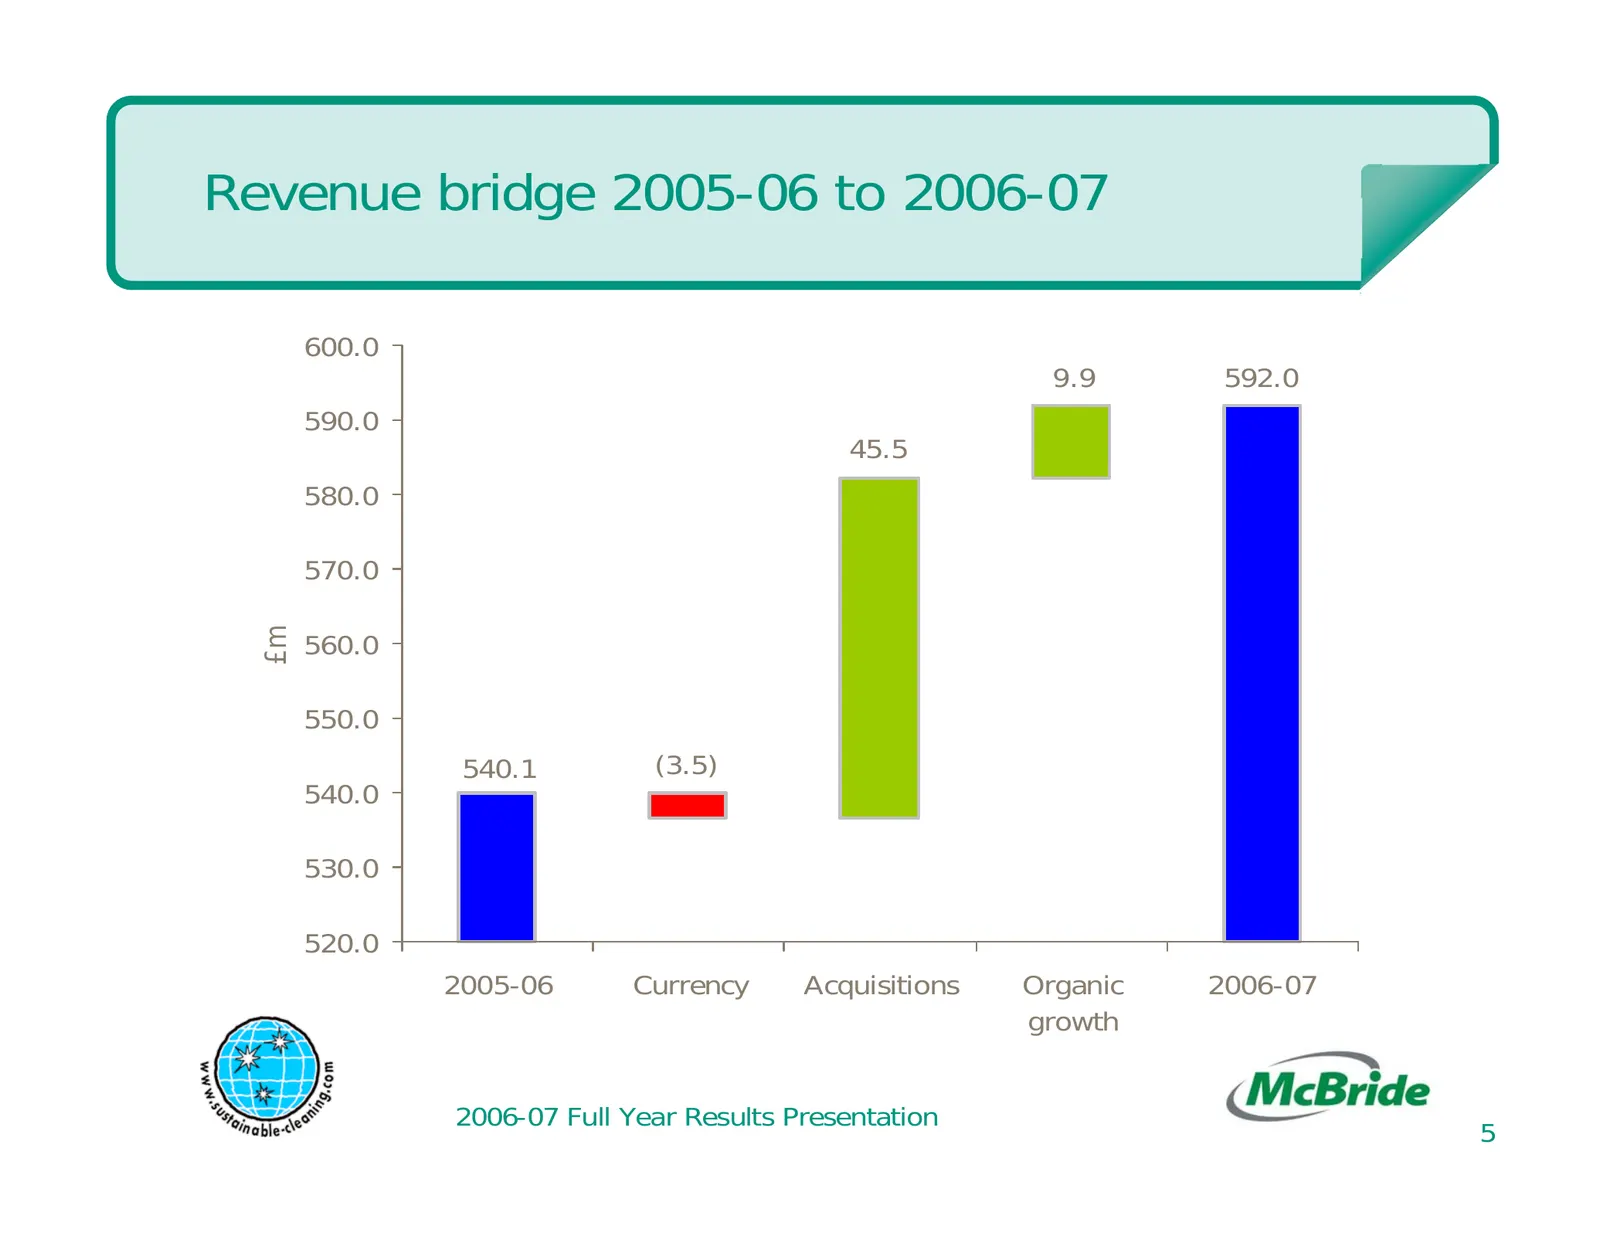
Revenue bridge 2005-06 to 2006-07 600.0 9.9 592.0 590.0 45.5 580.0 570.0 £m 560.0 550.0 540.1 (3.5) 540.0 530.0 520.0 2005-06 Currency Acquisitions Organic 2006-07 growth 2006-07 Full Year Results Presentation 5
Slide 6: Gross profit and EBIT
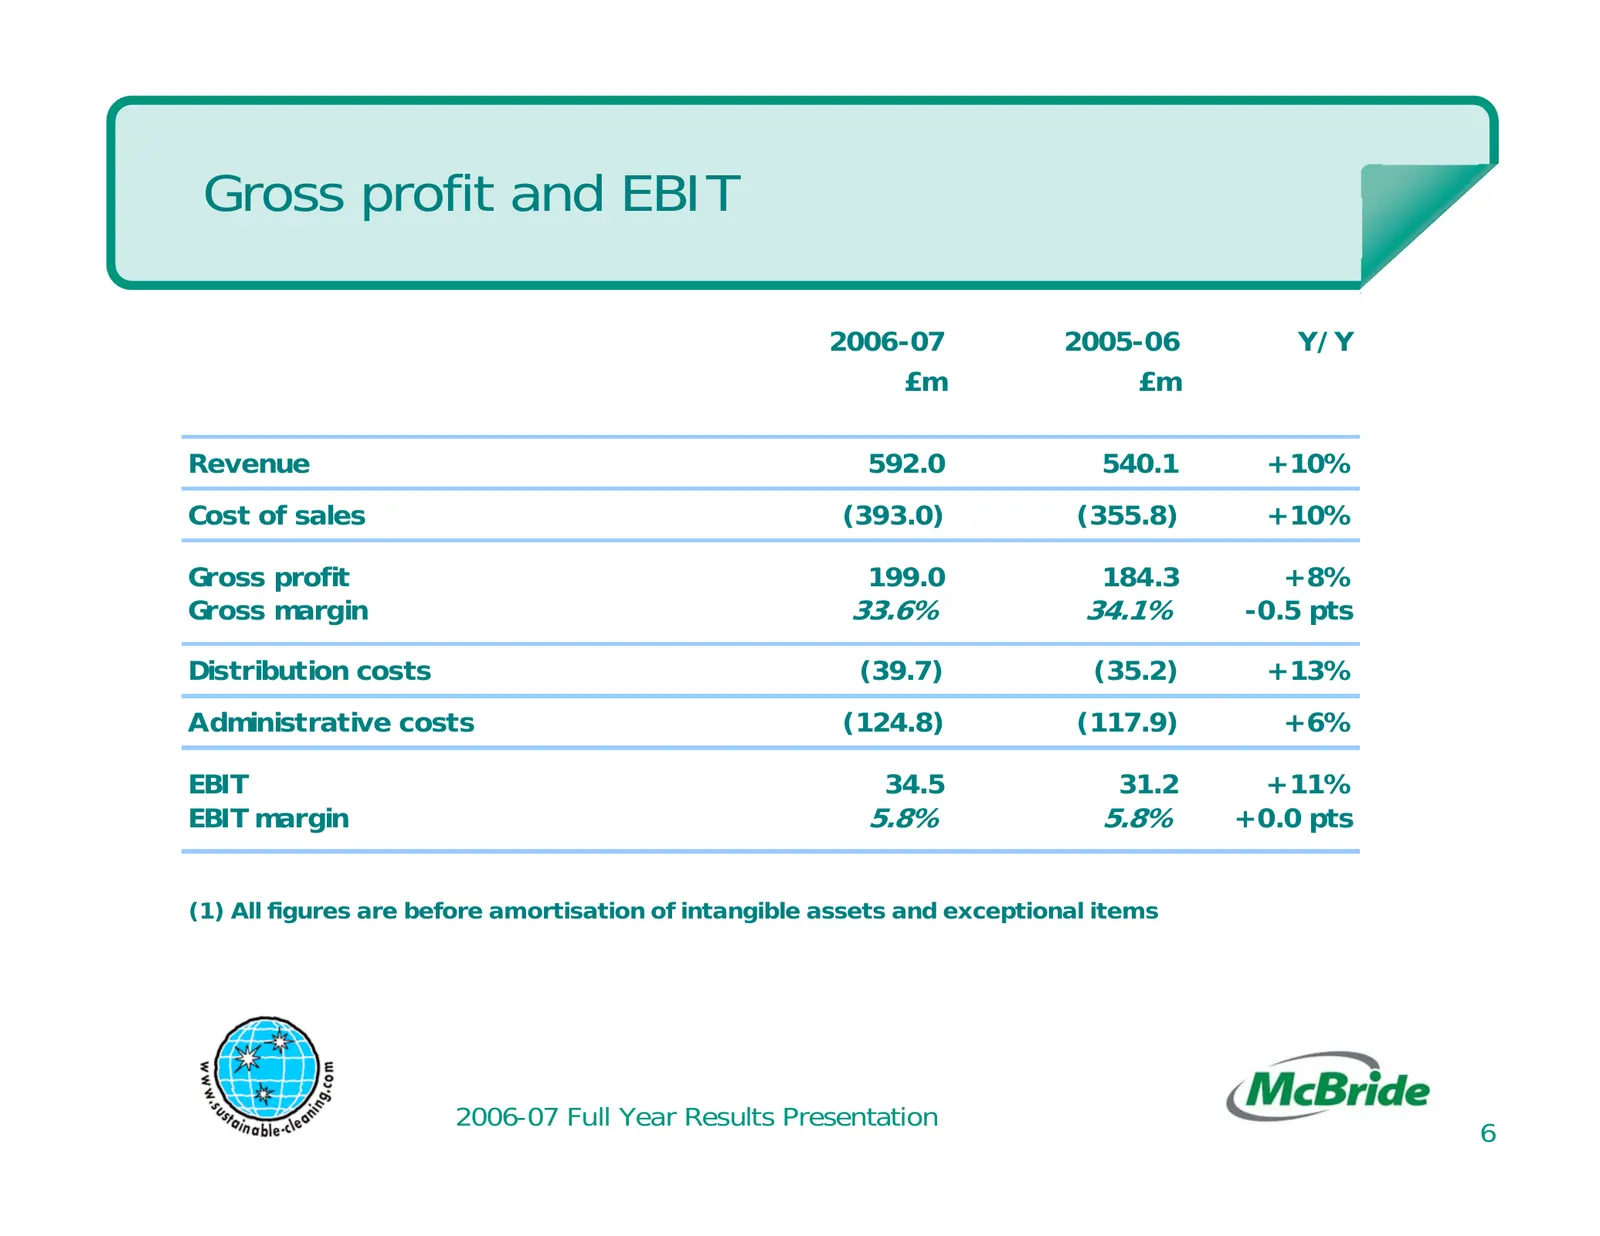
Gross profit and EBIT 2006-07 2005-06 Y/Y £m £m Revenue 592.0 540.1 +10% Cost of sales (393.0) (355.8) +10% Gross profit 199.0 184.3 +8% Gross margin 33.6% 34.1% -0.5 pts Distribution costs (39.7) (35.2) +13% Administrative costs (124.8) (117.9) +6% EBIT 34.5 31.2 +11% EBIT margin 5.8% 5.8% +0.0 pts
Slide 7: EBIT to earnings
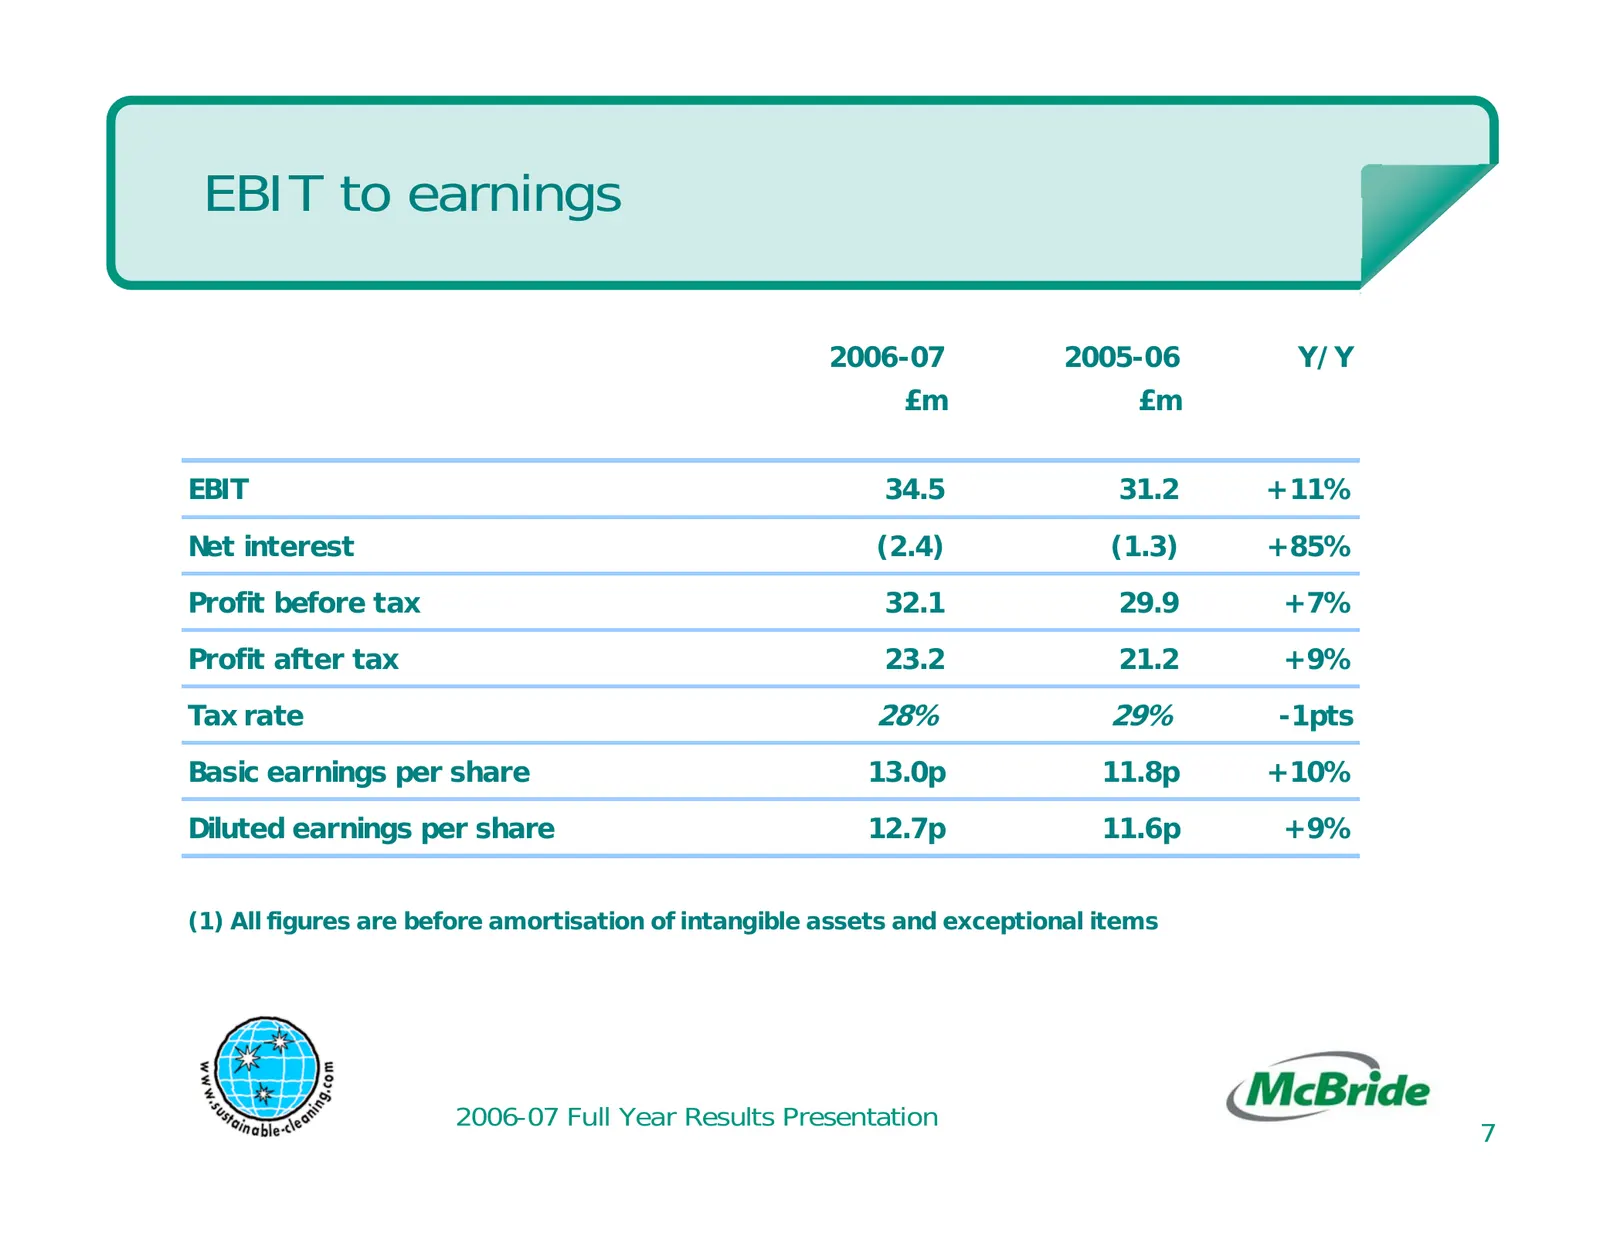
EBIT to earnings 2006-07 2005-06 Y/Y £m £m EBIT 34.5 31.2 +11% Net interest (2.4) (1.3) +85% Profit before tax 32.1 29.9 +7% Profit after tax 23.2 21.2 +9% Tax rate 28% 29% -1pts Basic earnings per share 13.0p 11.8p +10% Diluted earnings per share 12.7p 11.6p +9% (1) All figures are before amortisat
Slide 8: Regional performance
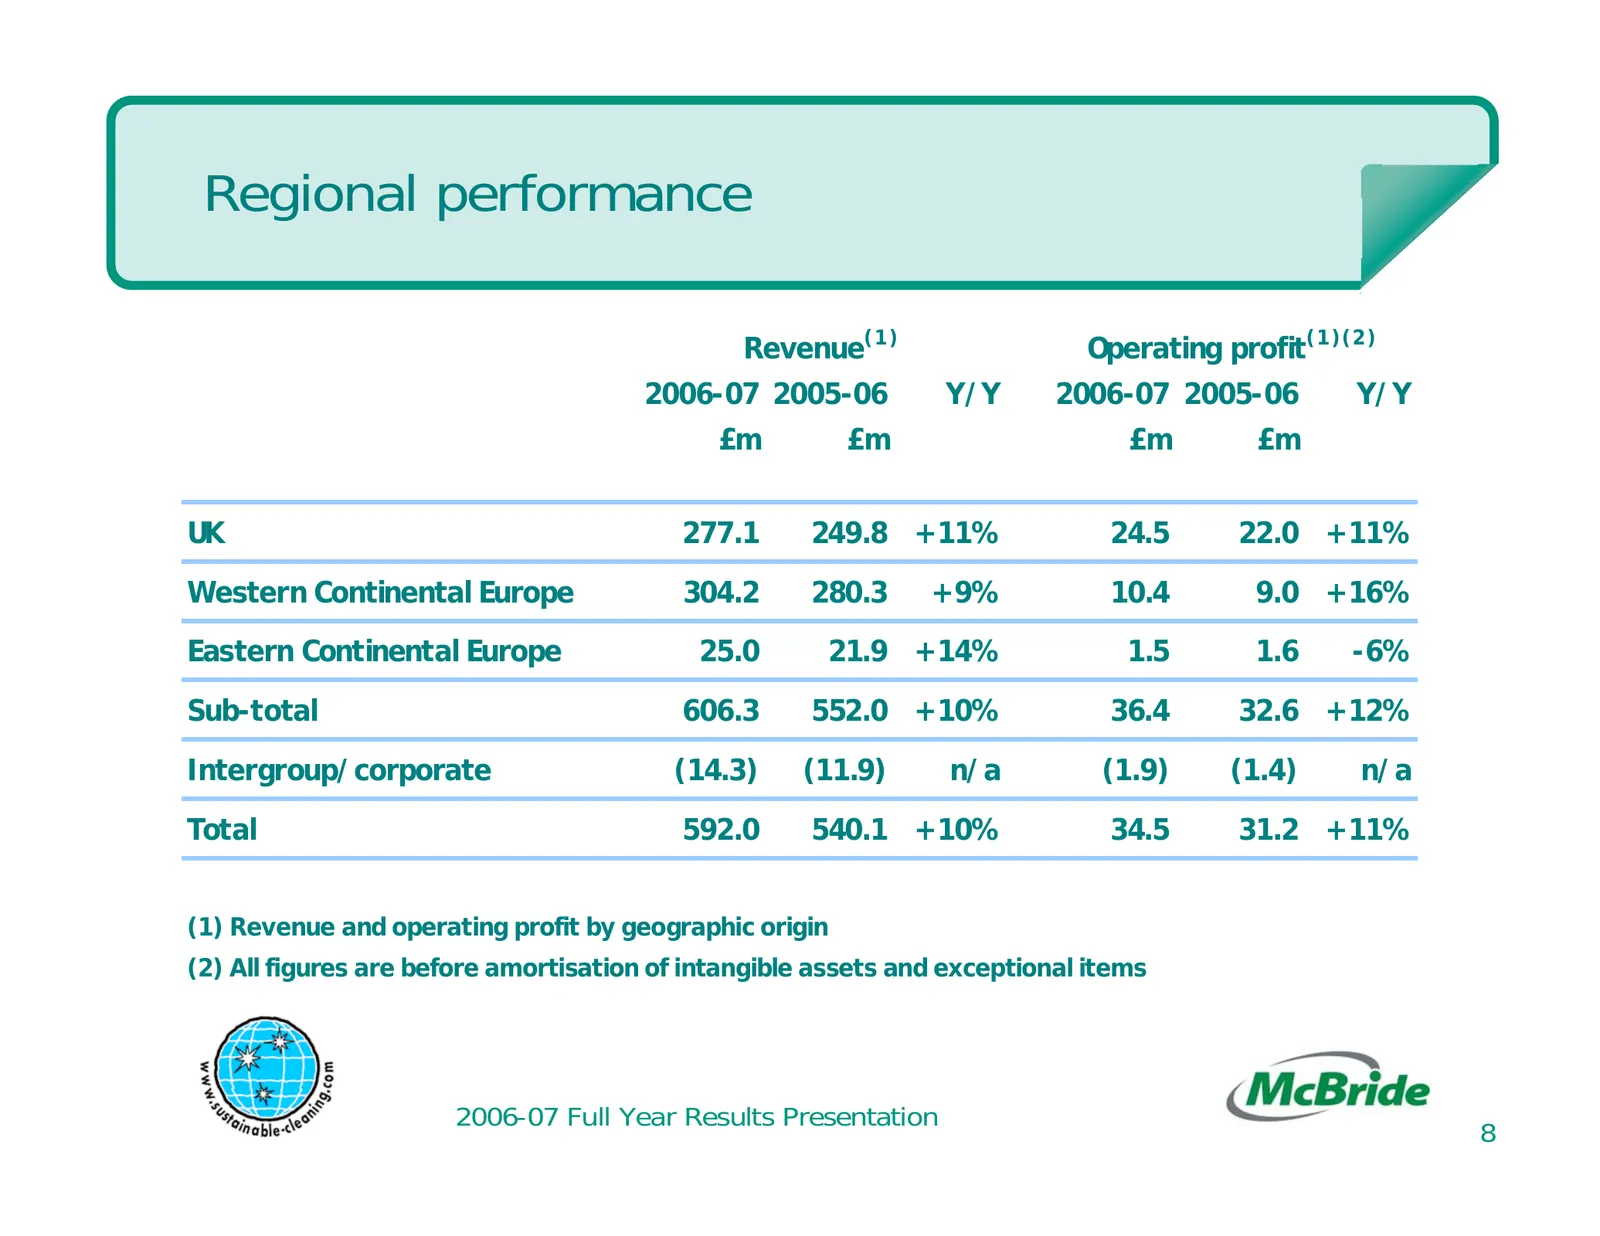
Regional performance Revenue(1 ) Operating profit (1 )(2 ) 2006-07 2005-06 Y/Y 2006-07 2005-06 Y/Y £m £m £m £m UK 277.1 249.8 +11% 24.5 22.0 +11% Western Continental Europe 304.2 280.3 +9% 10.4 9.0 +16% Eastern Continental Europe 25.0 21.9 +14% 1.5 1.6 -6% Sub-total 606.3 552.0 +10% 36.4 32.6 +12% I
Slide 9: Movement in net debt June 2006-2007
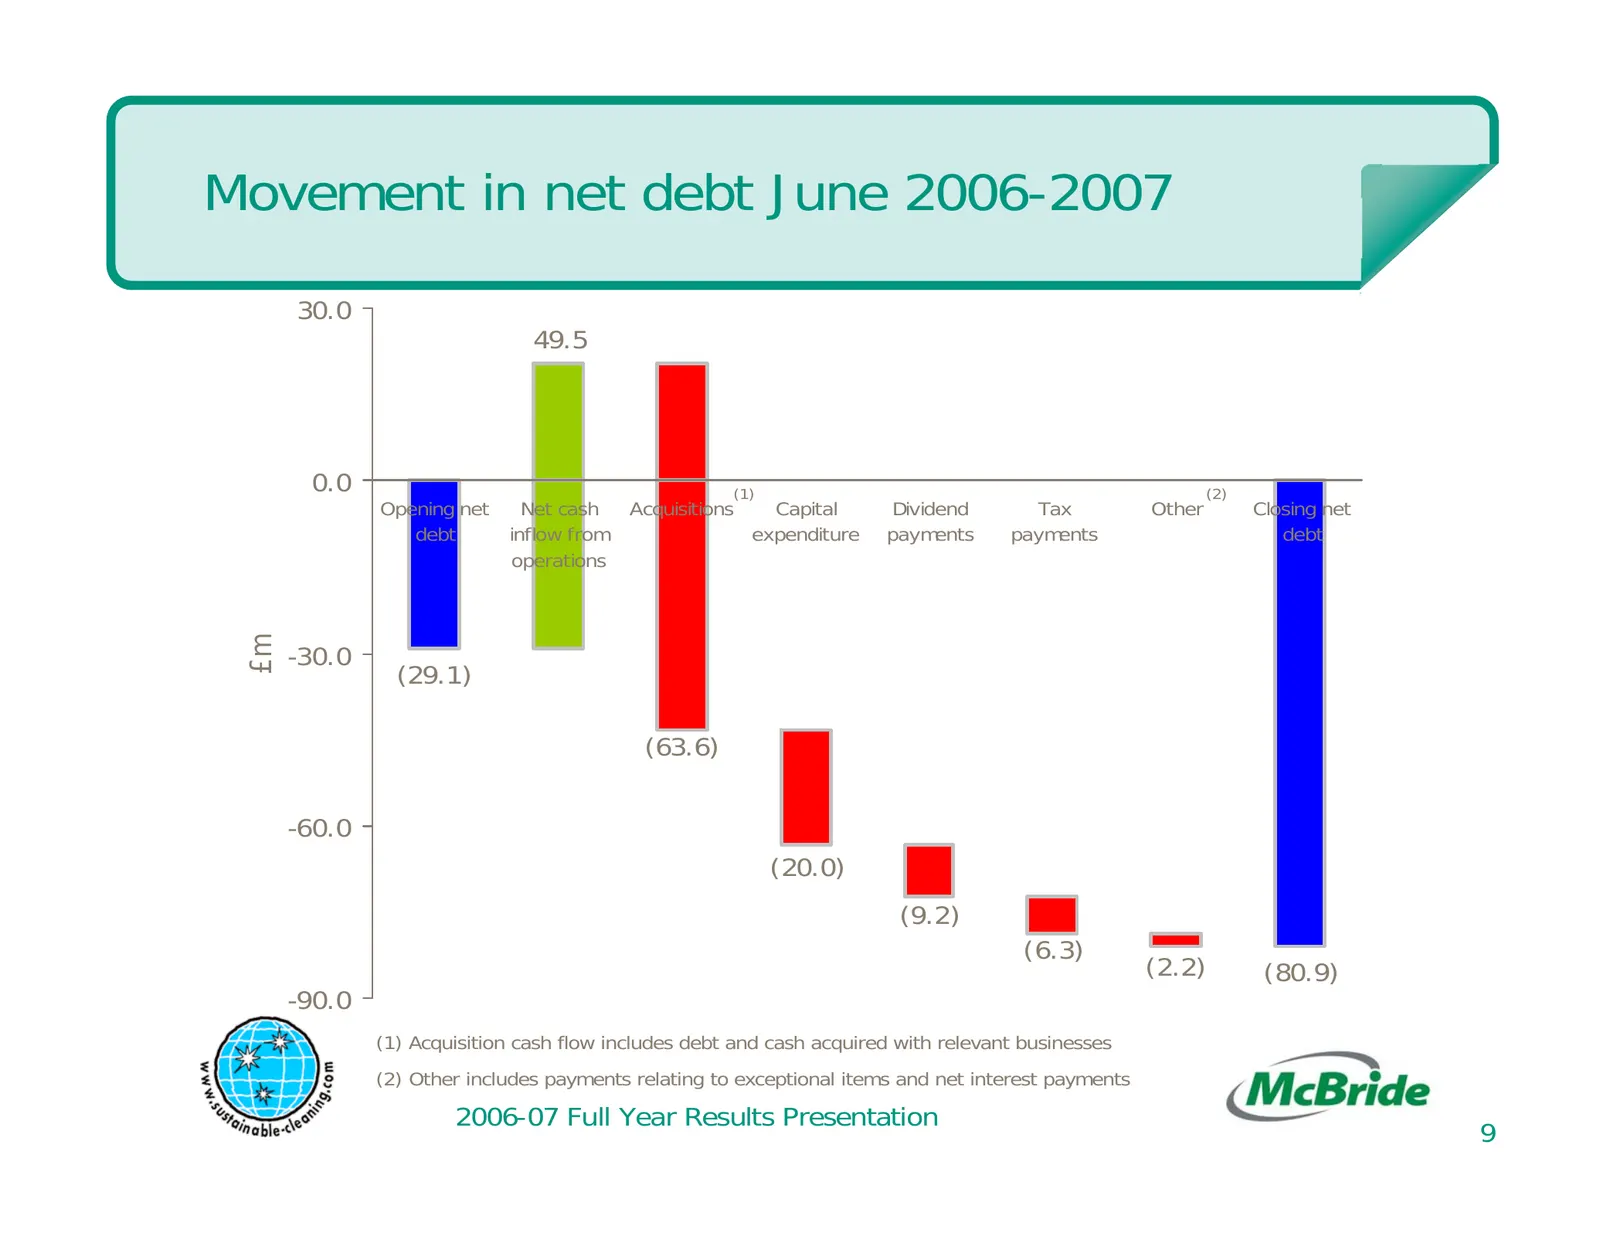
Movement in net debt June 2006-2007 30.0 49.5 0.0 (1) (2) Opening net Net cash Acquisitions Capital Dividend Tax Other Closing net debt inflow from expenditure payments payments debt operations £m -30.0 (29.1) (63.6) -60.0 (20.0) (9.2) (6.3) (2.2) (80.9) -90.0 (1) Acquisition cash flow includes debt
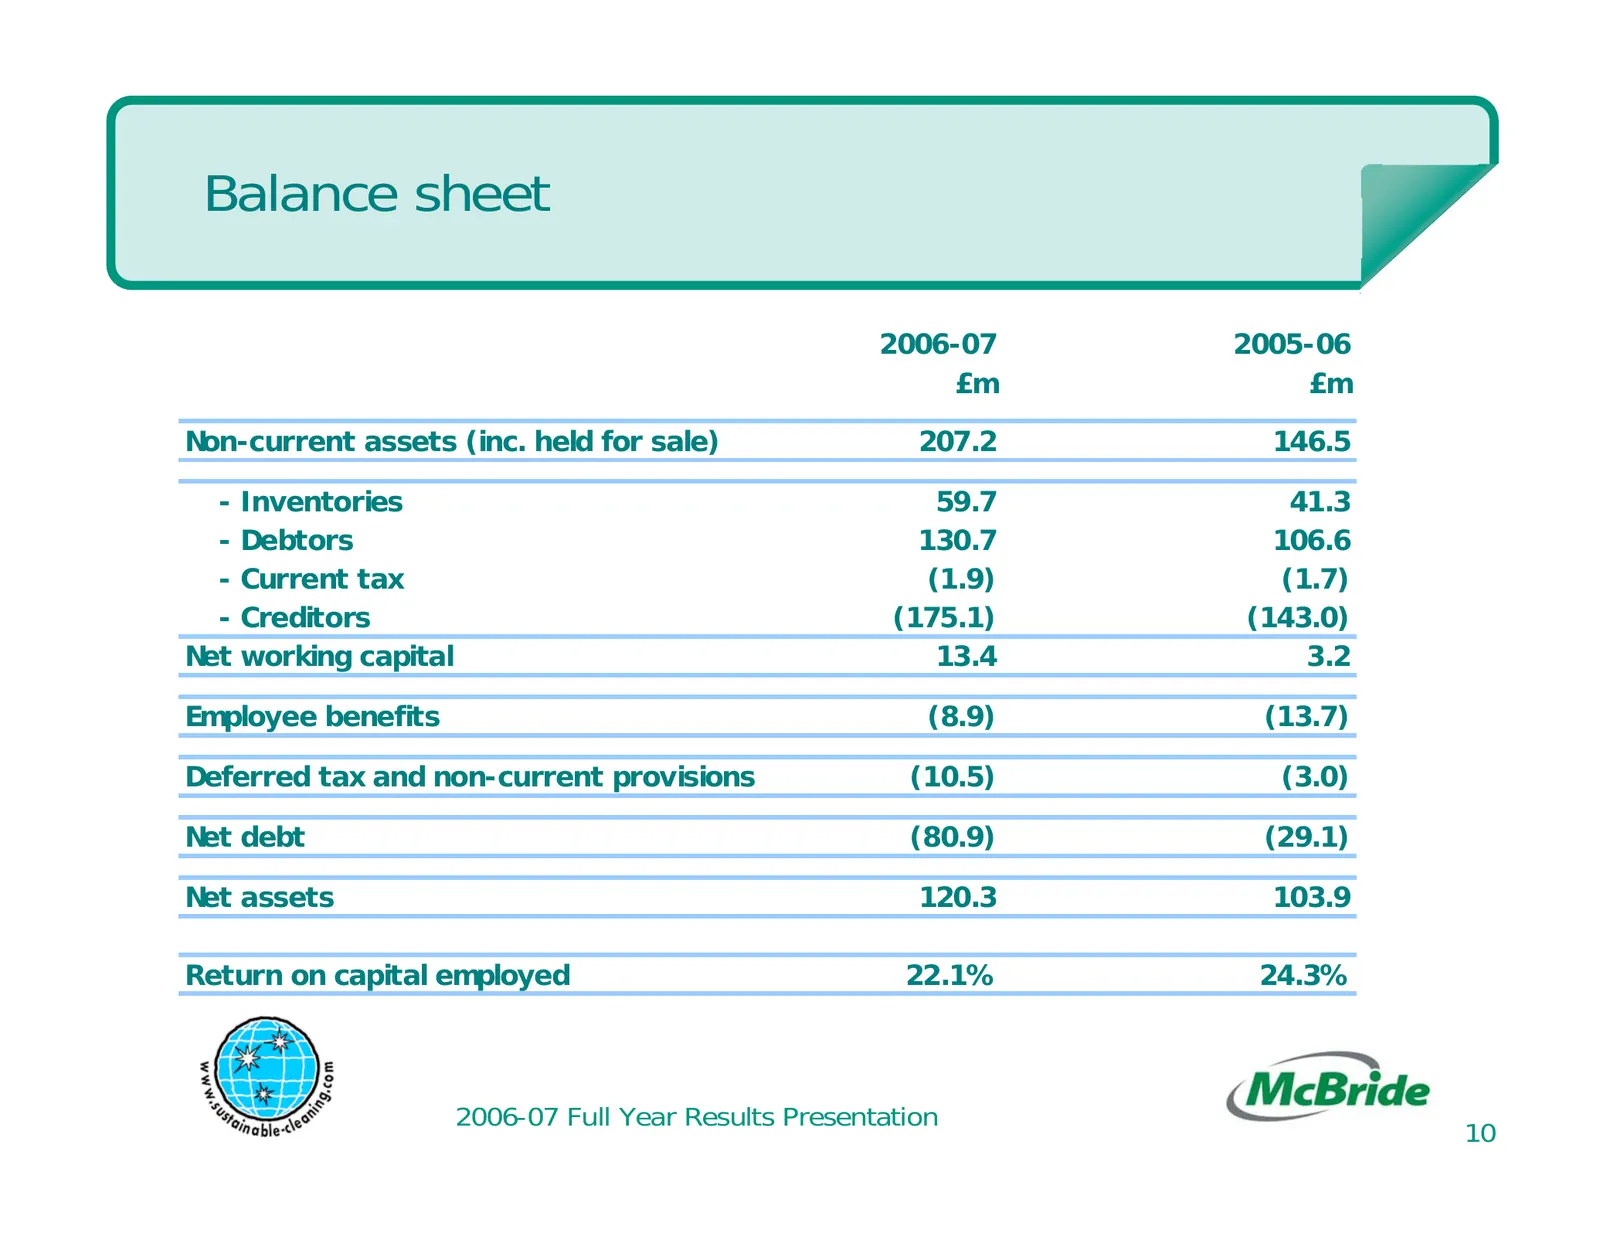
Slide 10: Balance sheet
Balance sheet 2006-07 2005-06 £m £m Non-current assets (inc. held for sale) 207.2 146.5 - Inventories 59.7 41.3 - Debtors 130.7 106.6 - Current tax (1.9) (1.7) - Creditors (175.1) (143.0) Net working capital 13.4 3.2 Employee benefits (8.9) (13.7) Deferred tax and non-current provisions (10.5) (3.0)

Slide 11: Business review
Business review
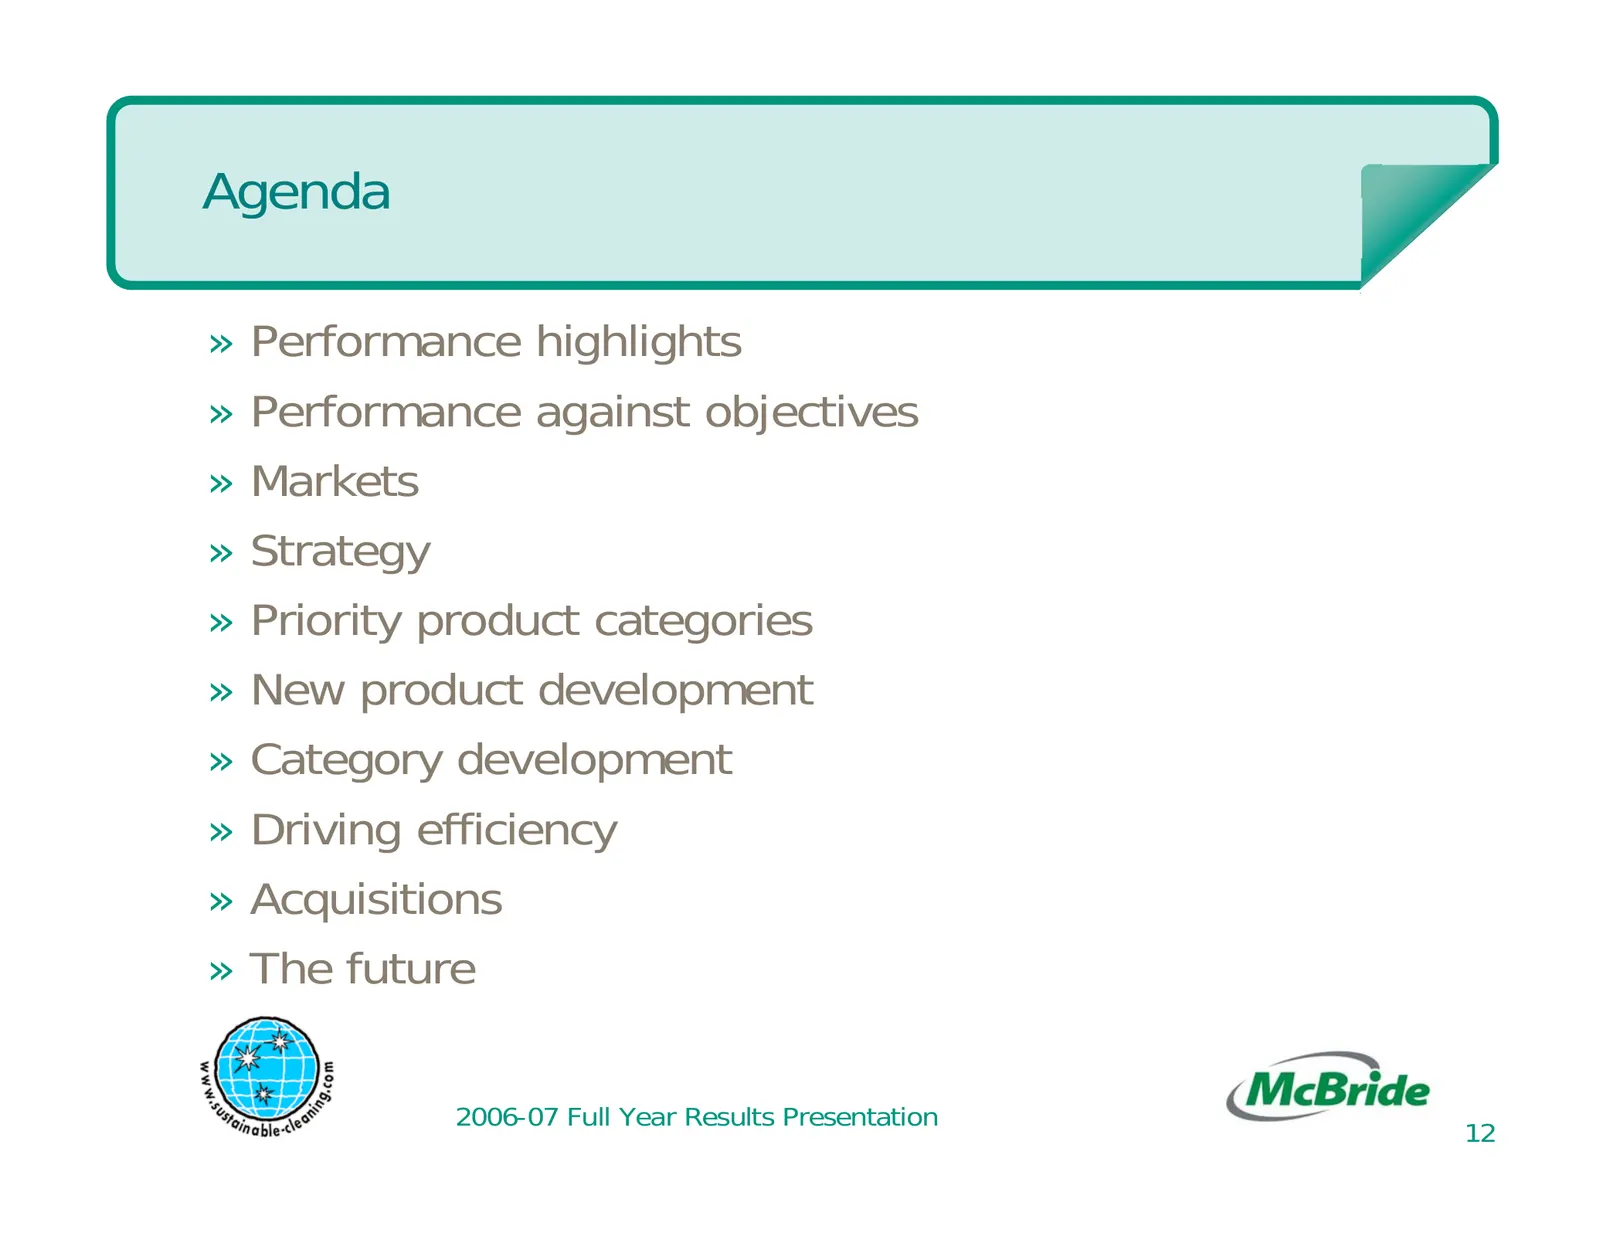
Slide 12: Agenda
Agenda » Performance highlights » Performance against objectives » Markets » Strategy » Priority product categories » New product development » Category development » Driving efficiency » Acquisitions » The future 2006-07 Full Year Results Presentation 12
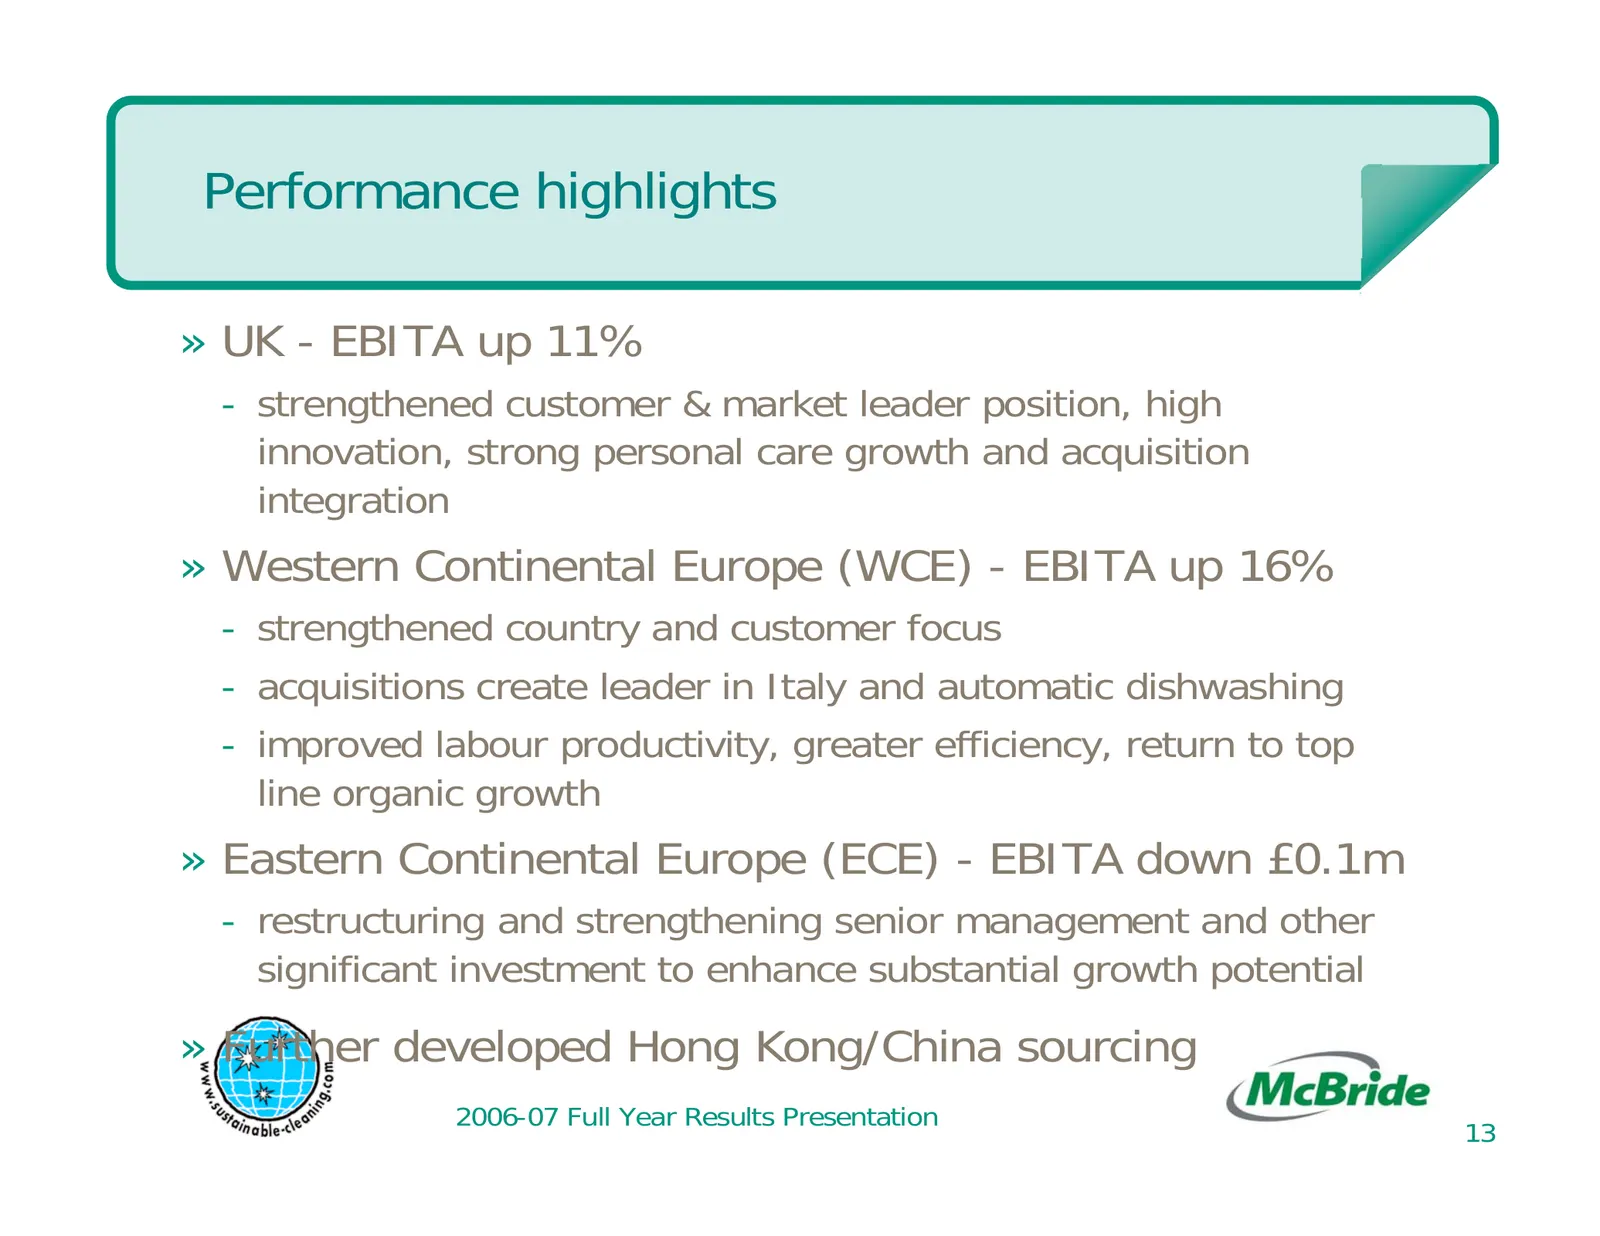
Slide 13: Performance highlights
Performance highlights » UK - EBITA up 11% - strengthened customer & market leader position, high innovation, strong personal care growth and acquisition integration » Western Continental Europe (WCE) - EBITA up 16% - strengthened country and customer focus - acquisitions create leader in Italy and
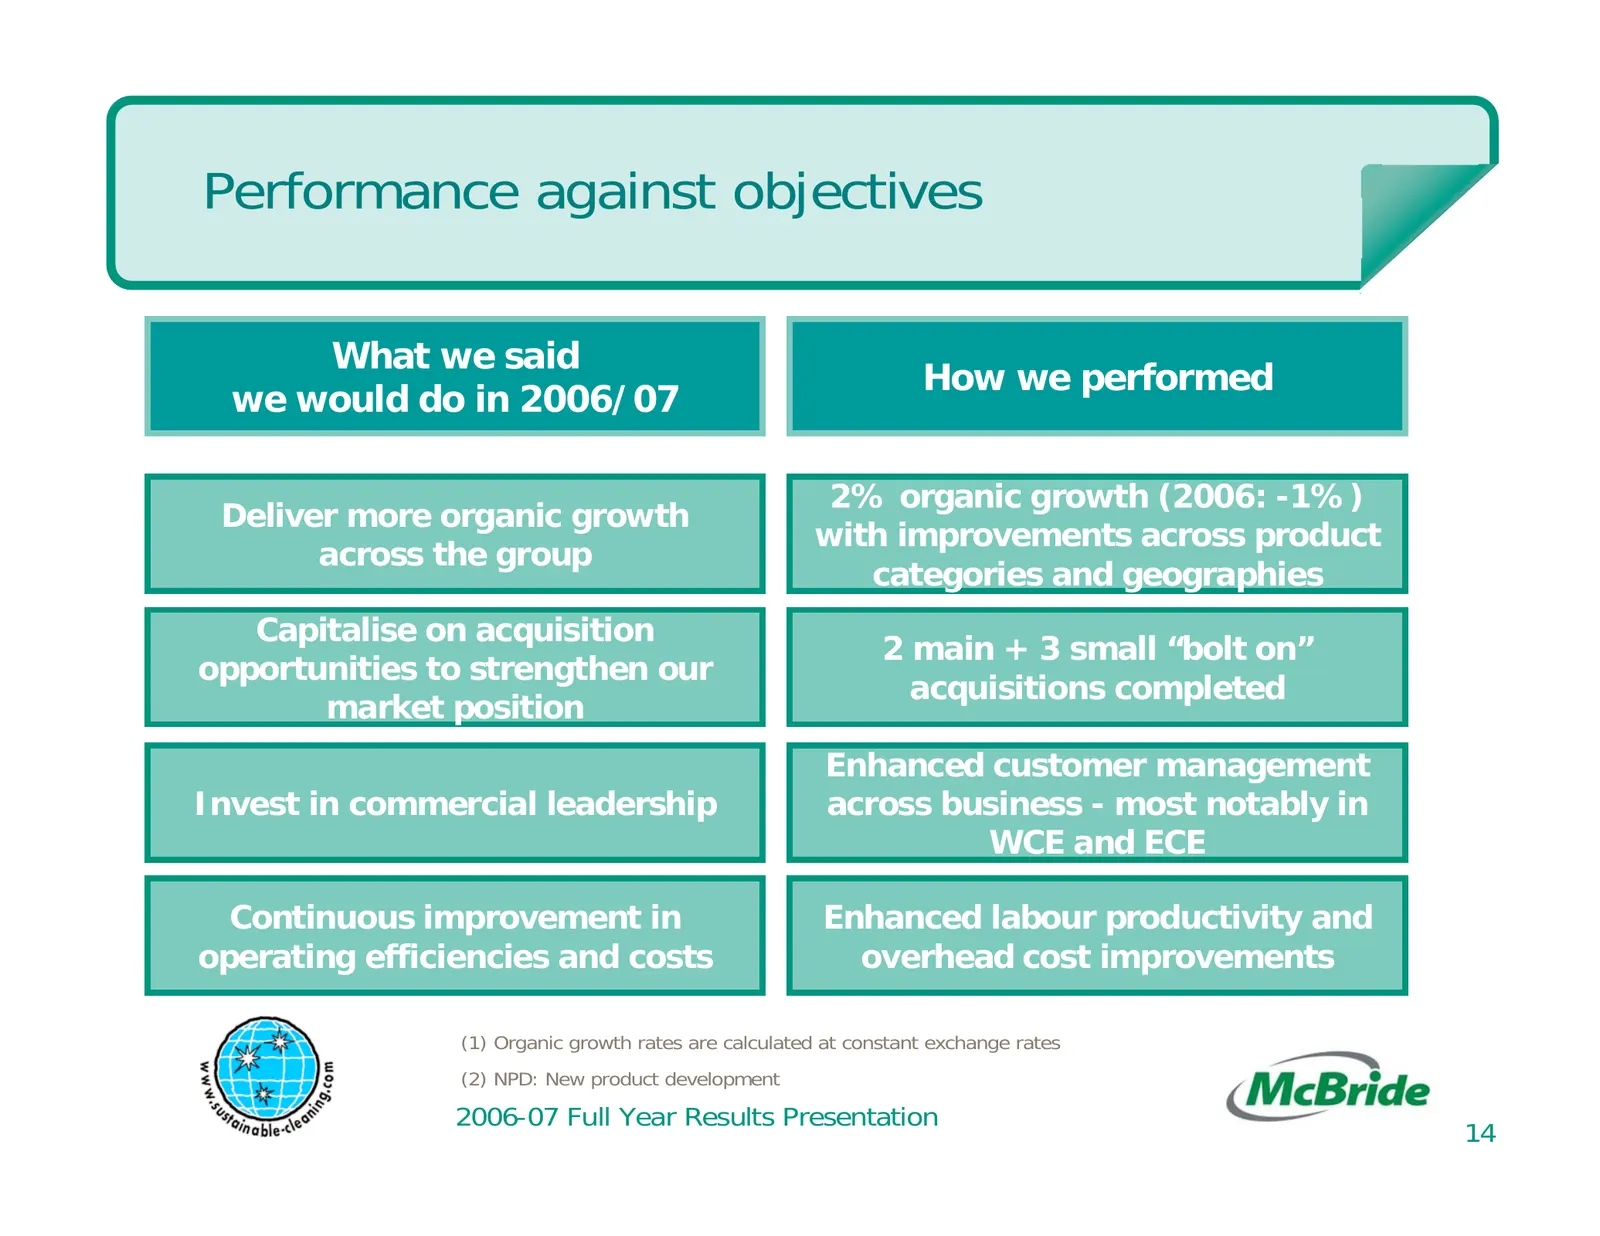
Slide 14: Performance against objectives
Performance against objectives What we said How we performed we would do in 2006/07 2% organic growth (2006: -1%) Deliver more organic growth with improvements across product across the group categories and geographies Capitalise on acquisition 2 main + 3 small “bolt on” opportunities to strengthen
Slide 15: Market overview
Market overview » McBride operates in very large and growing markets » Household and personal care markets in Western Europe worth £48 billion pa and growing 2-4% pa » Private label consistently outperforms overall markets » Higher growth in McBride’s targeted product categories » Household and pers
Slide 16: Private label outperforms Western Europe household and personal care
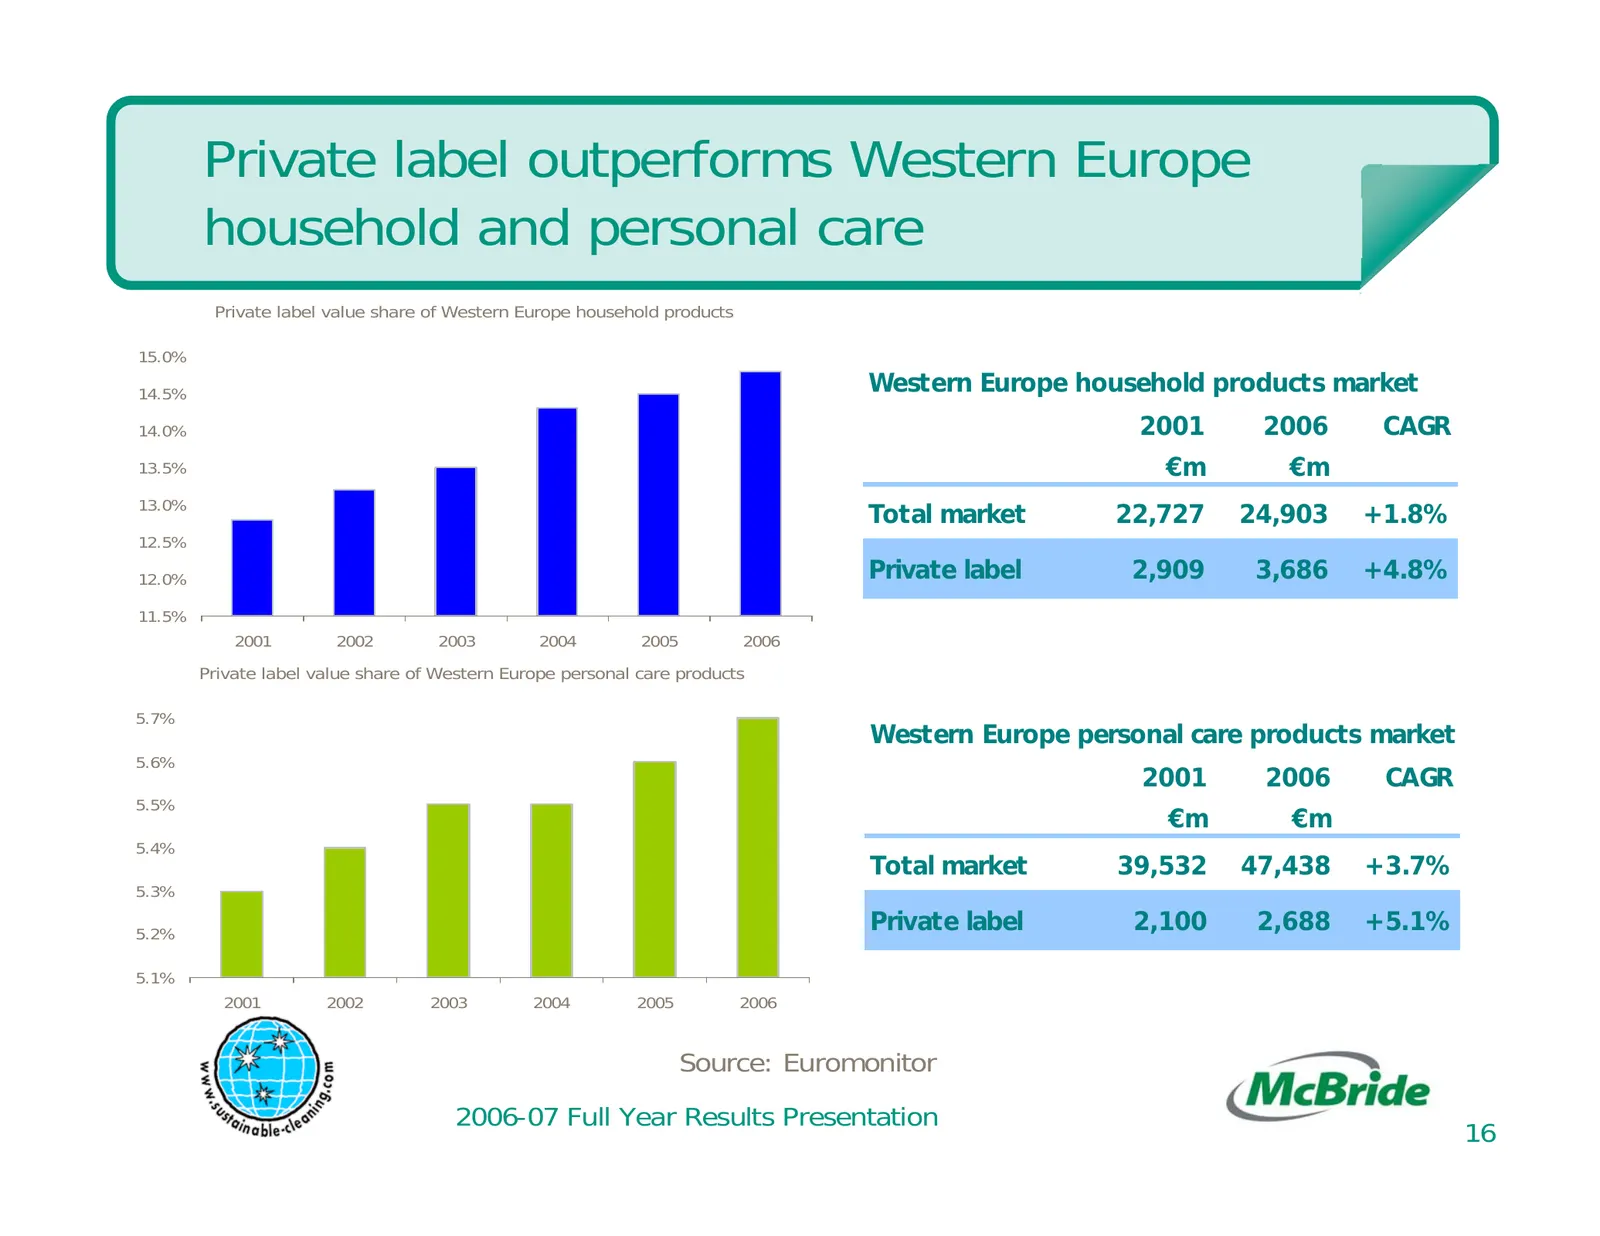
Private label outperforms Western Europe household and personal care Private label value share of Western Europe household products 15.0% 14.5% Western Europe household products market 14.0% 2001 2006 CAGR 13.5% €m €m 13.0% Total market 22,727 24,903 +1.8% 12.5% 12.0% Private label 2,909 3,686 +4.8%
Slide 17: Why is private label growing?
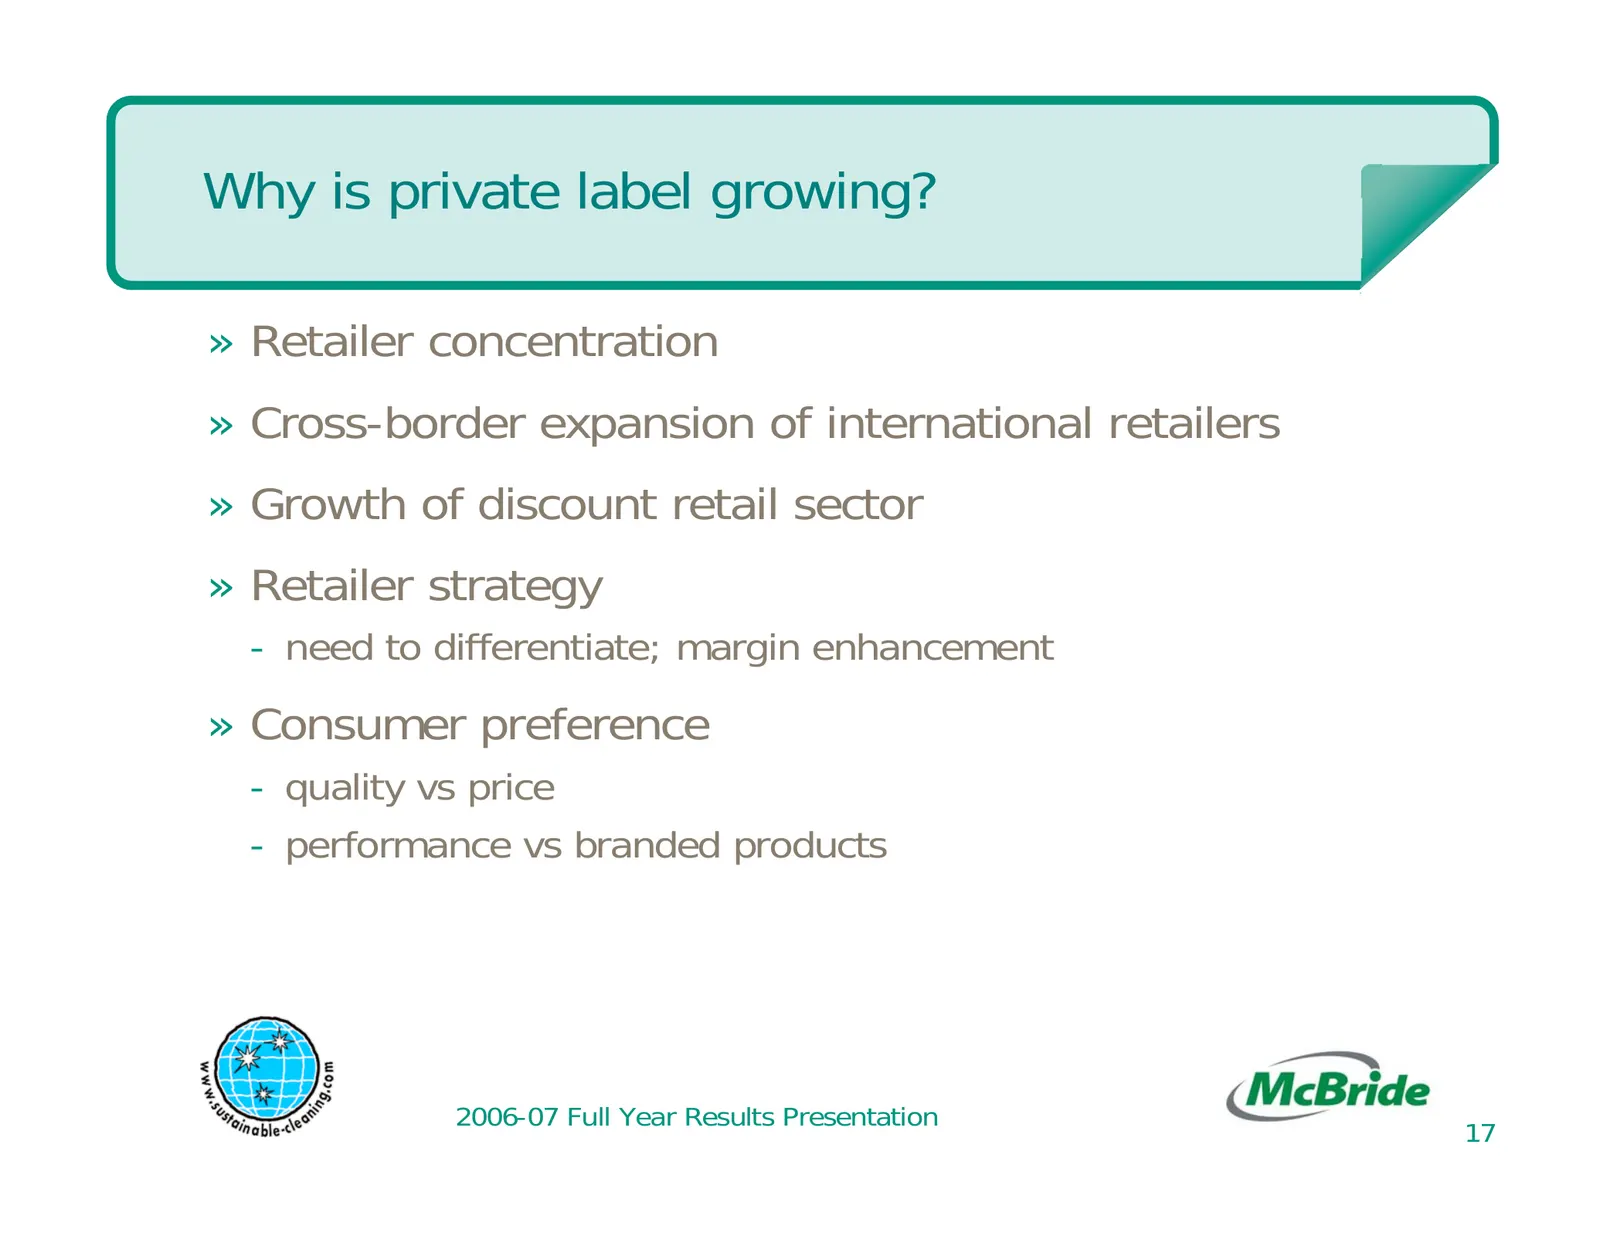
Why is private label growing? » Retailer concentration » Cross-border expansion of international retailers » Growth of discount retail sector » Retailer strategy - need to differentiate; margin enhancement » Consumer preference - quality vs price - performance vs branded products 2006-07 Full Year R
Slide 18: Strategy focused on delivering shareholder value
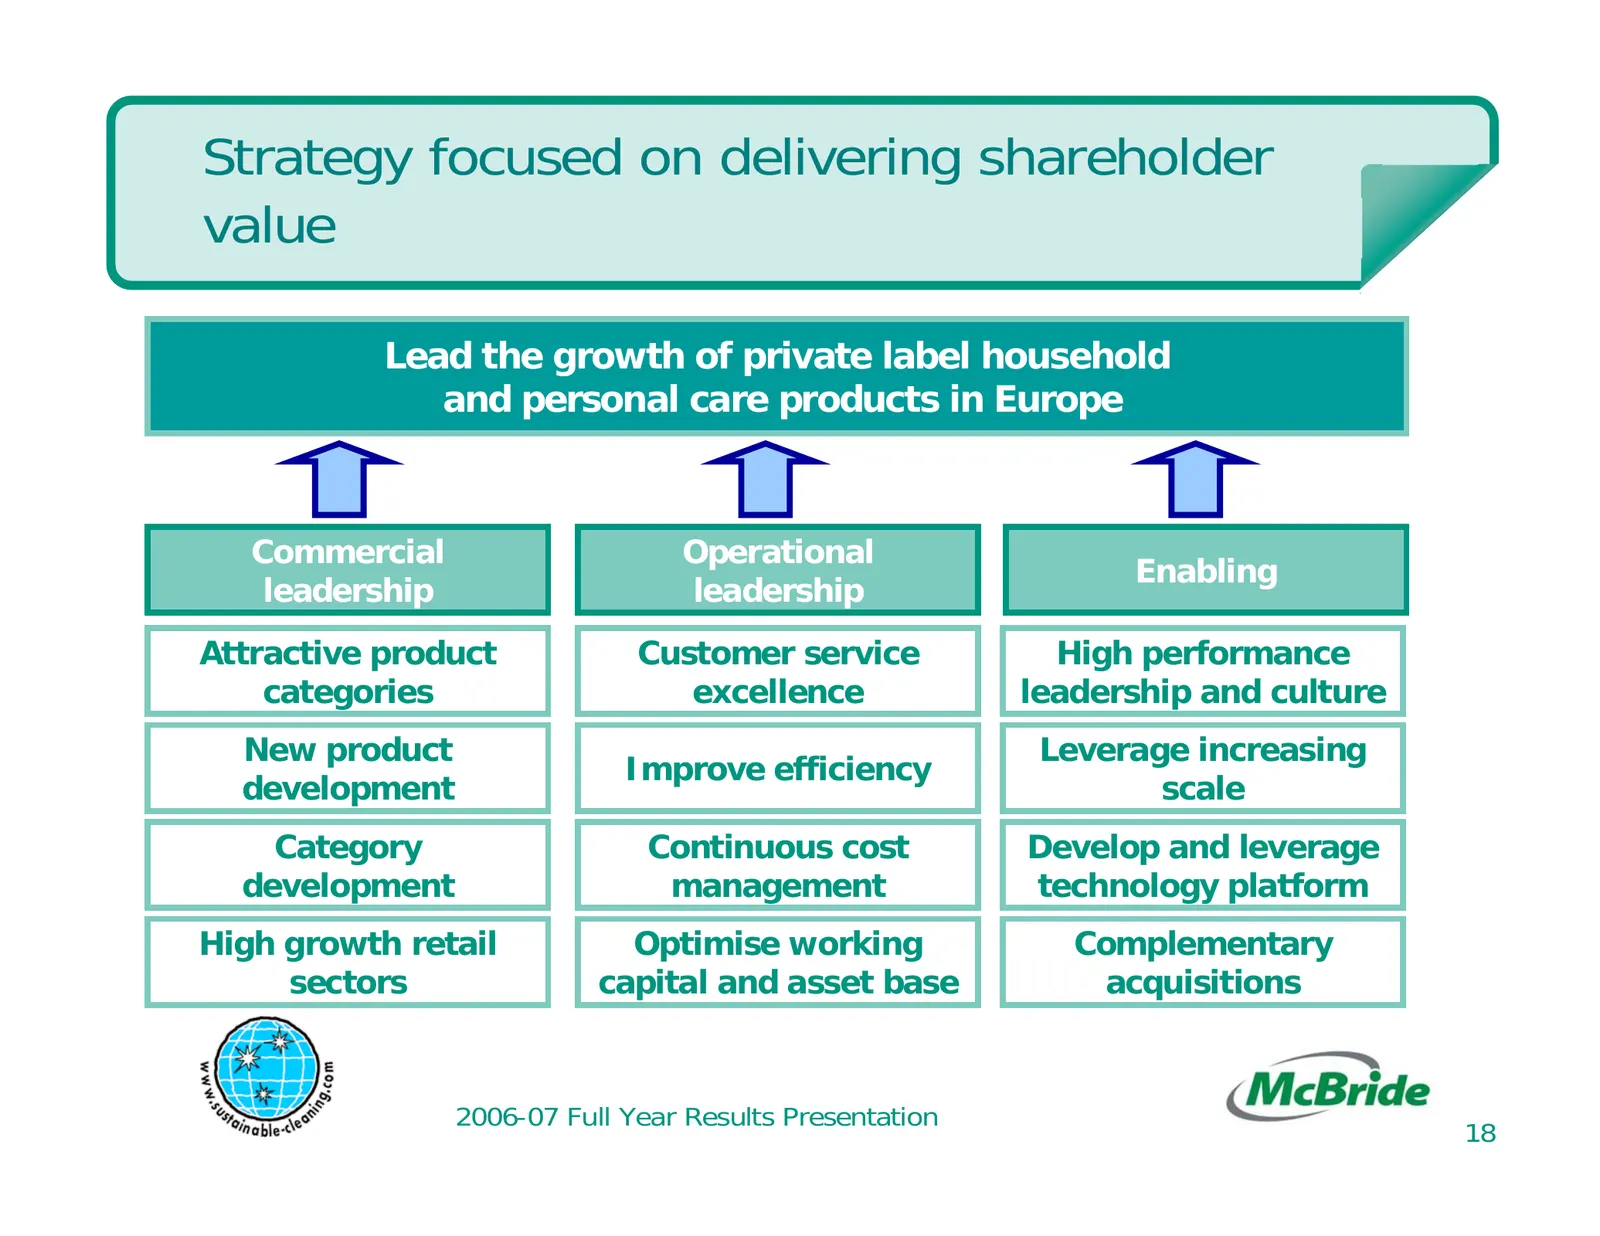
Strategy focused on delivering shareholder value Lead the growth of private label household and personal care products in Europe Commercial Operational Enabling leadership leadership Attractive product Customer service High performance categories excellence leadership and culture New product Leverag
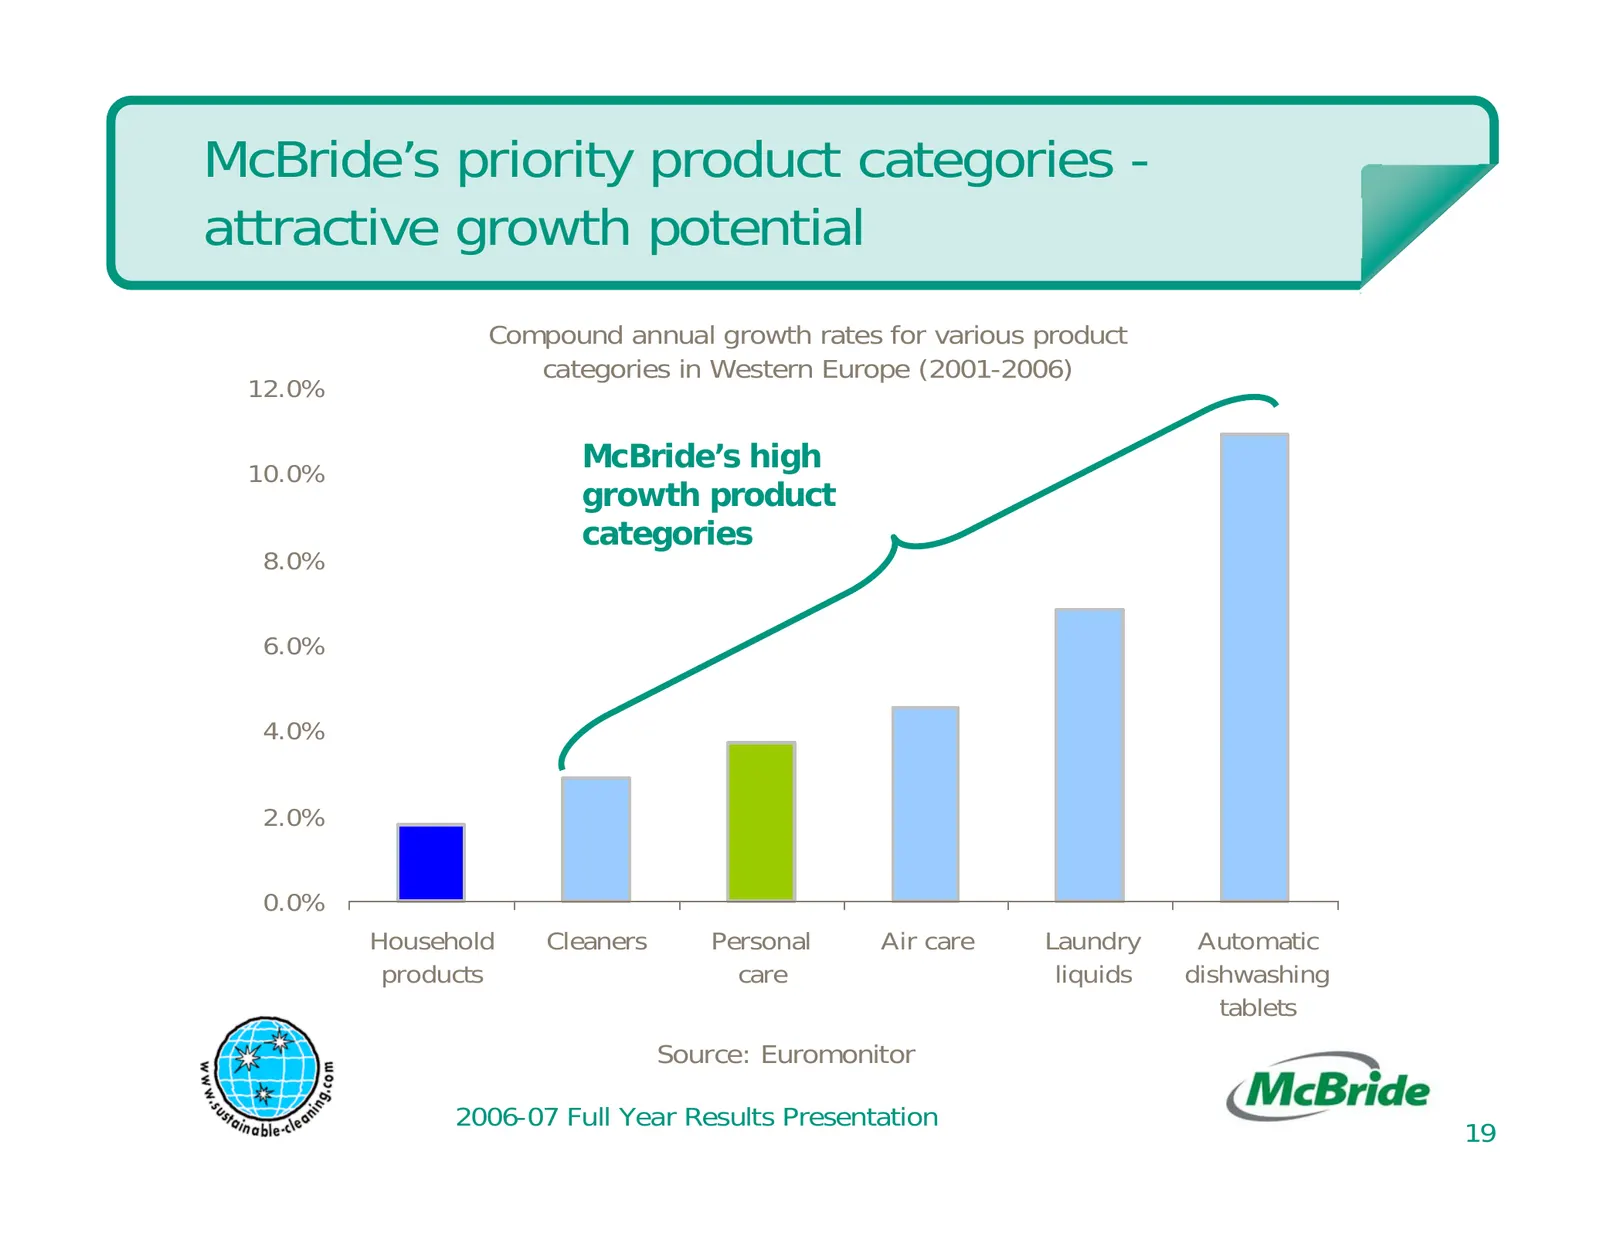
Slide 19: McBride's priority product categories - attractive growth potential
McBride’s priority product categories - attractive growth potential Compound annual growth rates for various product categories in Western Europe (2001-2006) 12.0% 10.0% McBride’s high growth product categories 8.0% 6.0% 4.0% 2.0% 0.0% Household Cleaners Personal Air care Laundry Automatic products
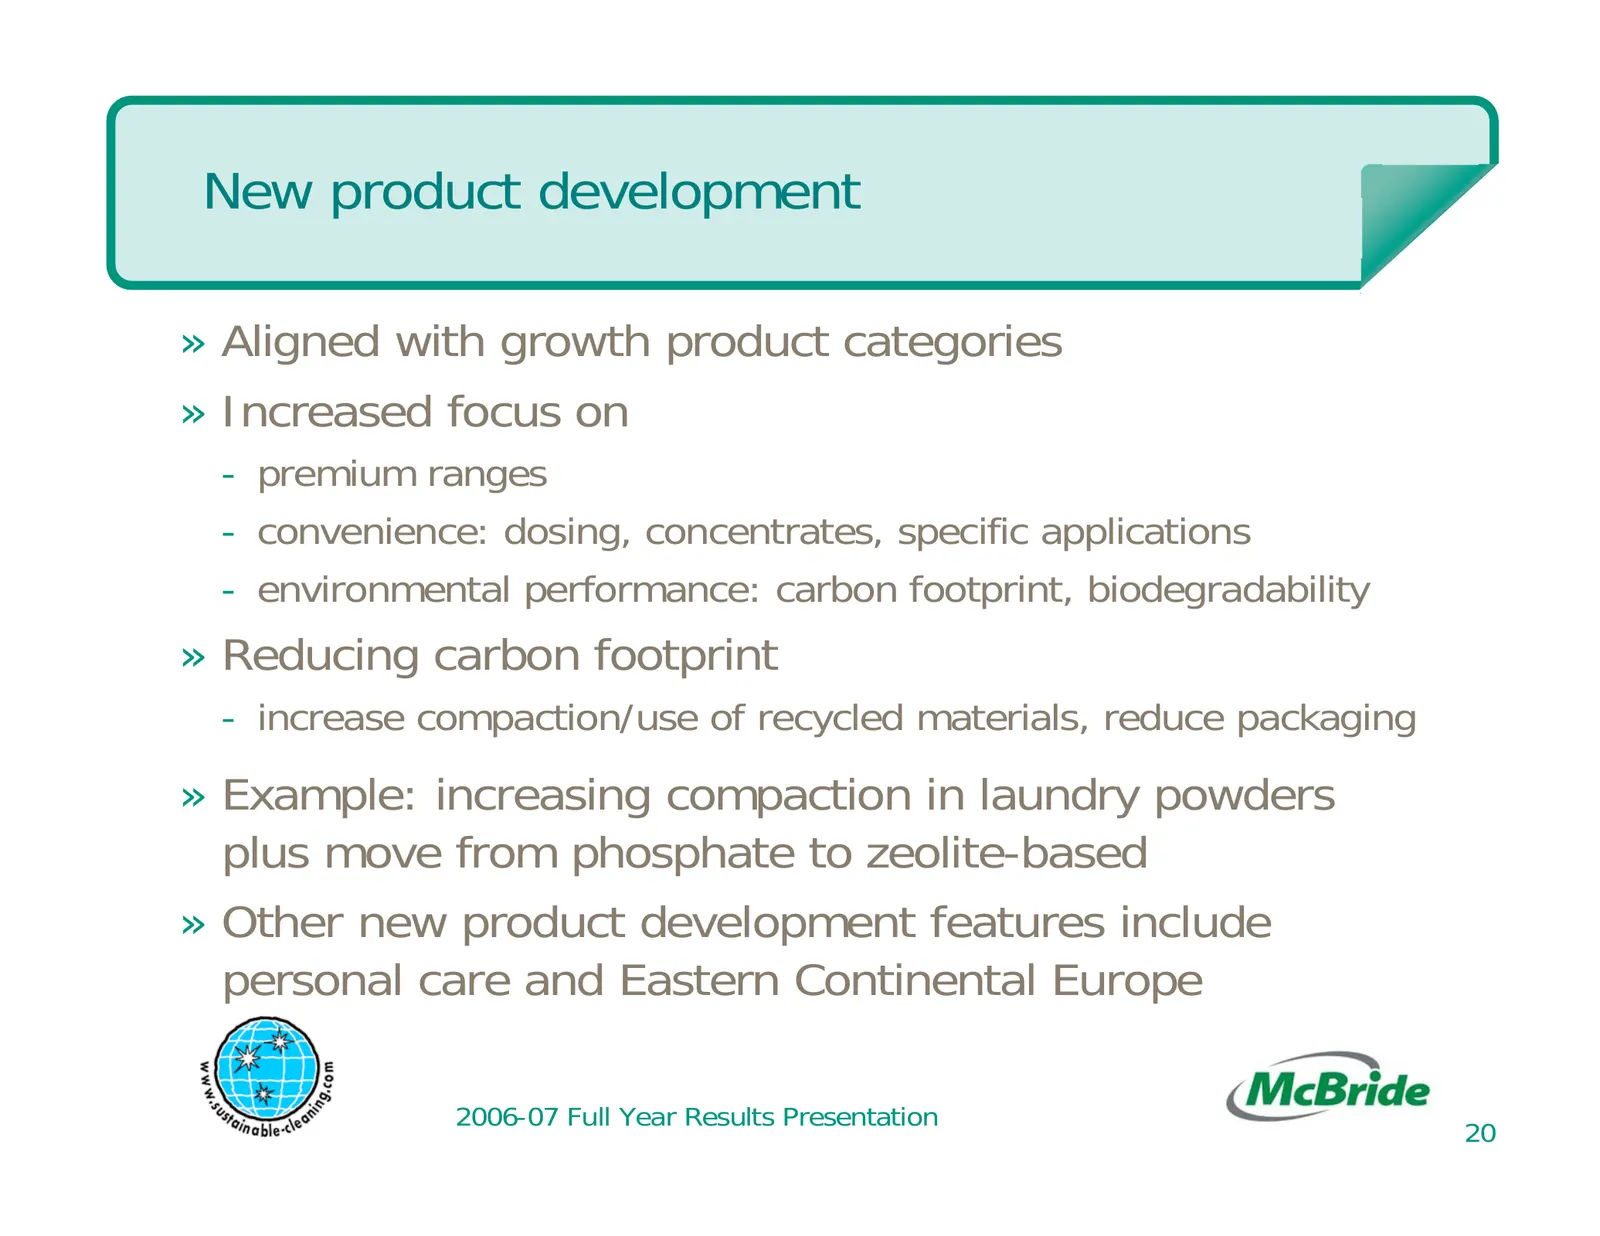
Slide 20: New product development
New product development » Aligned with growth product categories » Increased focus on - premium ranges - convenience: dosing, concentrates, specific applications - environmental performance: carbon footprint, biodegradability » Reducing carbon footprint - increase compaction/use of recycled material
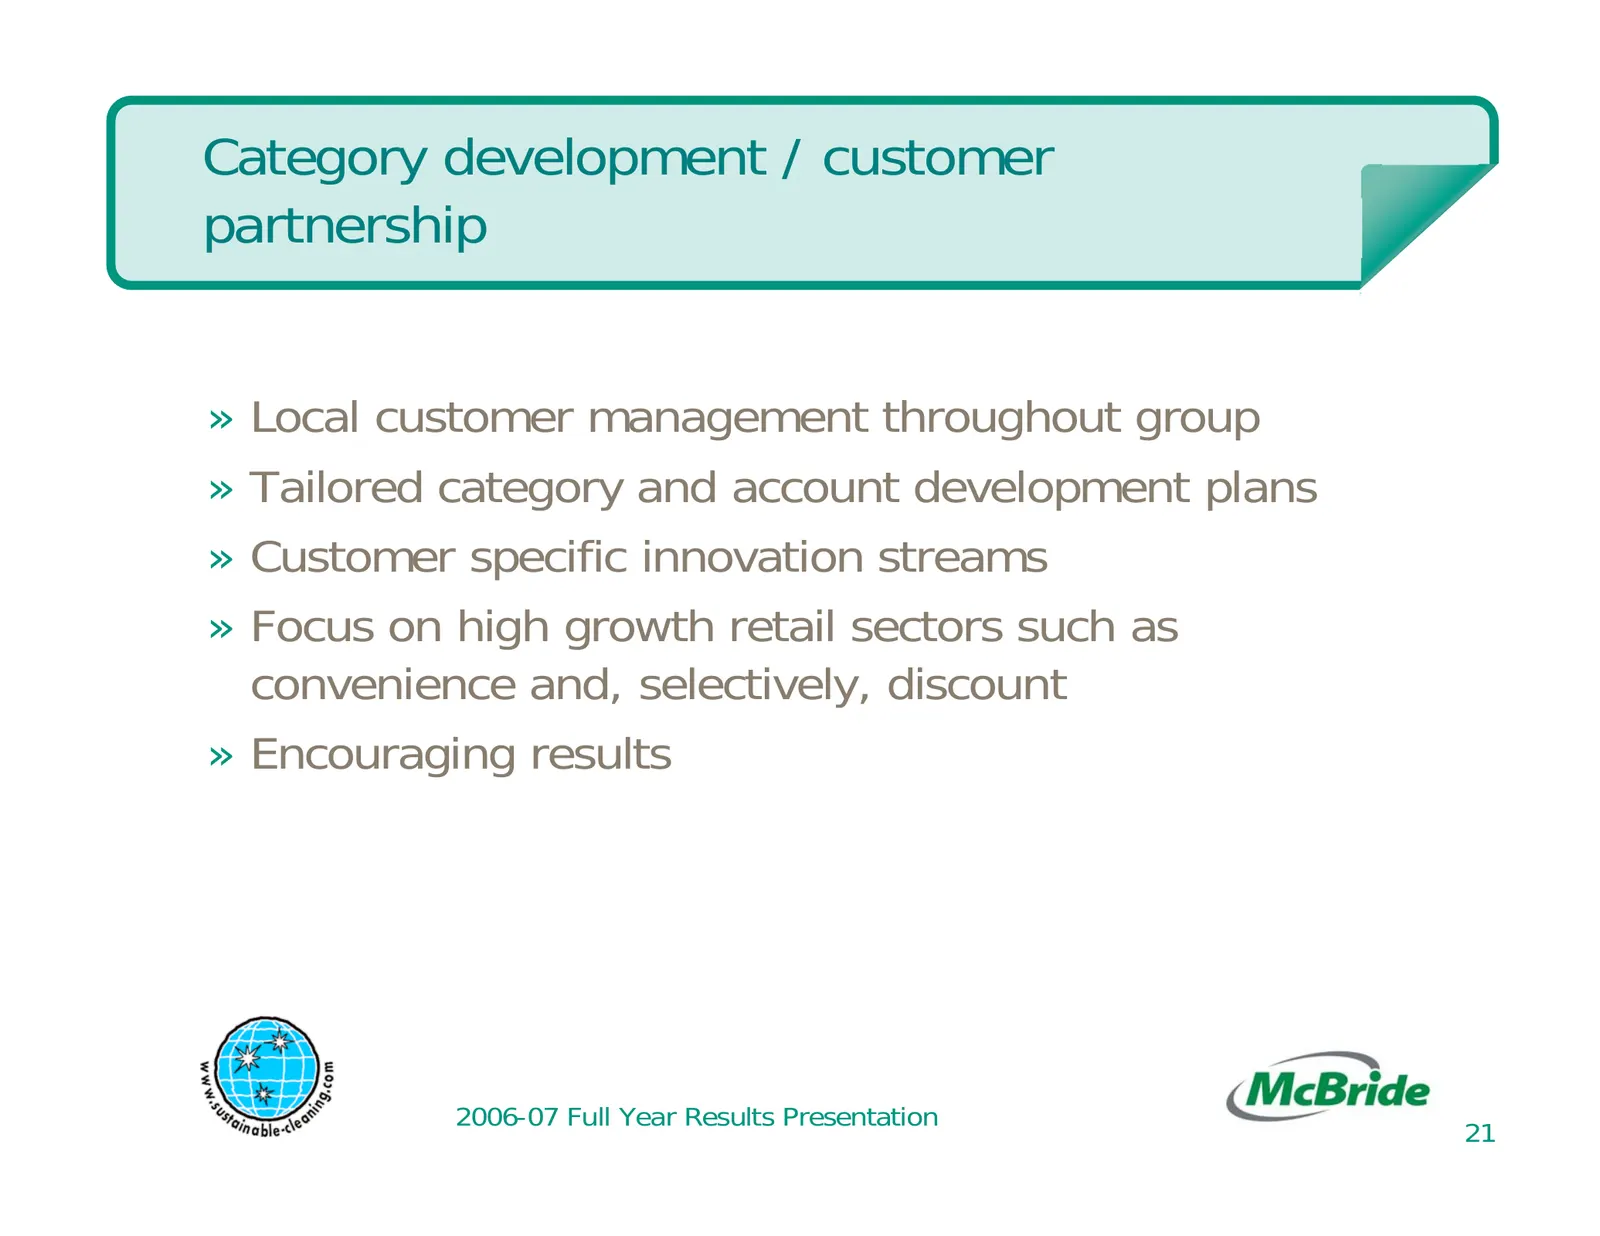
Slide 21: Category development / customer partnership
Category development / customer partnership » Local customer management throughout group » Tailored category and account development plans » Customer specific innovation streams » Focus on high growth retail sectors such as convenience and, selectively, discount » Encouraging results 2006-07 Full Ye
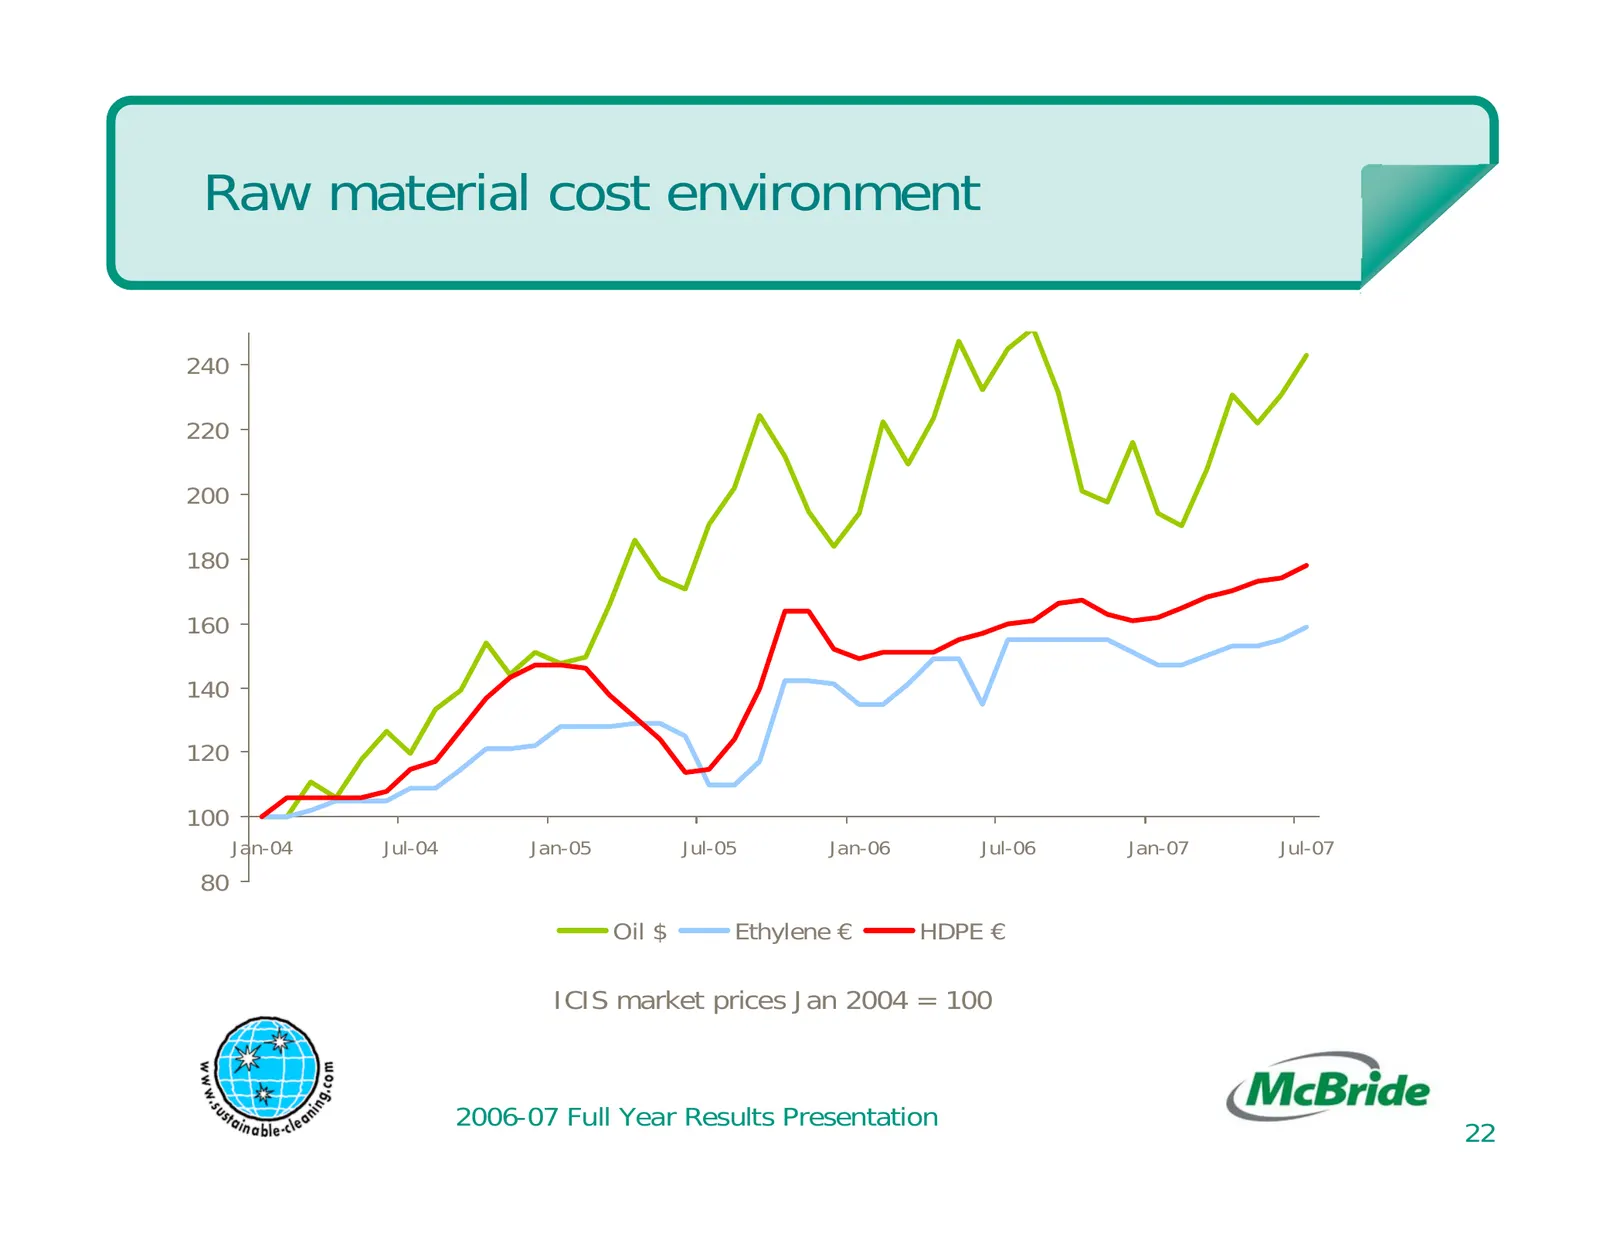
Slide 22: Raw material cost environment
Raw material cost environment 240 220 200 180 160 140 120 100 Jan-04 Jul-04 Jan-05 Jul-05 Jan-06 Jul-06 Jan-07 Jul-07 80 Oil $ Ethylene € HDPE € ICIS market prices Jan 2004 = 100 2006-07 Full Year Results Presentation 22
Slide 23: Driving efficiency and costs
Driving efficiency and costs » Continuous improvement enabled through staff engagement - Operations - waste reduction - labour productivity - efficiencies in overheads, distribution, energy etc - Products - value engineering - packaging reduction, reformulation, alternative materials - Purchasing st
Slide 24: Acquisitions
Acquisitions » 5 acquisitions in year at cost of £63.6m(1) » New Business Streams - Henkel’s European private label household products business - Dasty Italia » Small Bolt on - Coventry Chemicals; Darcy Industries (UK) - Schneider (Poland) » Strengthen position in priority product categories and tar
Slide 25: The future
The future » Key objectives for current year - drive further improvements in commercial positioning - deliver further enhancements to efficiency and costs - grow our priority product categories - further improve performance in Western Continental Europe - accelerate growth in Eastern Continental Eur
Slide 26: Conclusion
Conclusion » Double digit revenue, profit, and earnings growth » Organic growth » Good improvement in WCE » Significant acquisition activity in carefully targeted products, geographies and distribution channels » Clear business strategy » Good progress expected in current year 2006-07 Full Year Resu

Slide 27: Appendices
Appendices
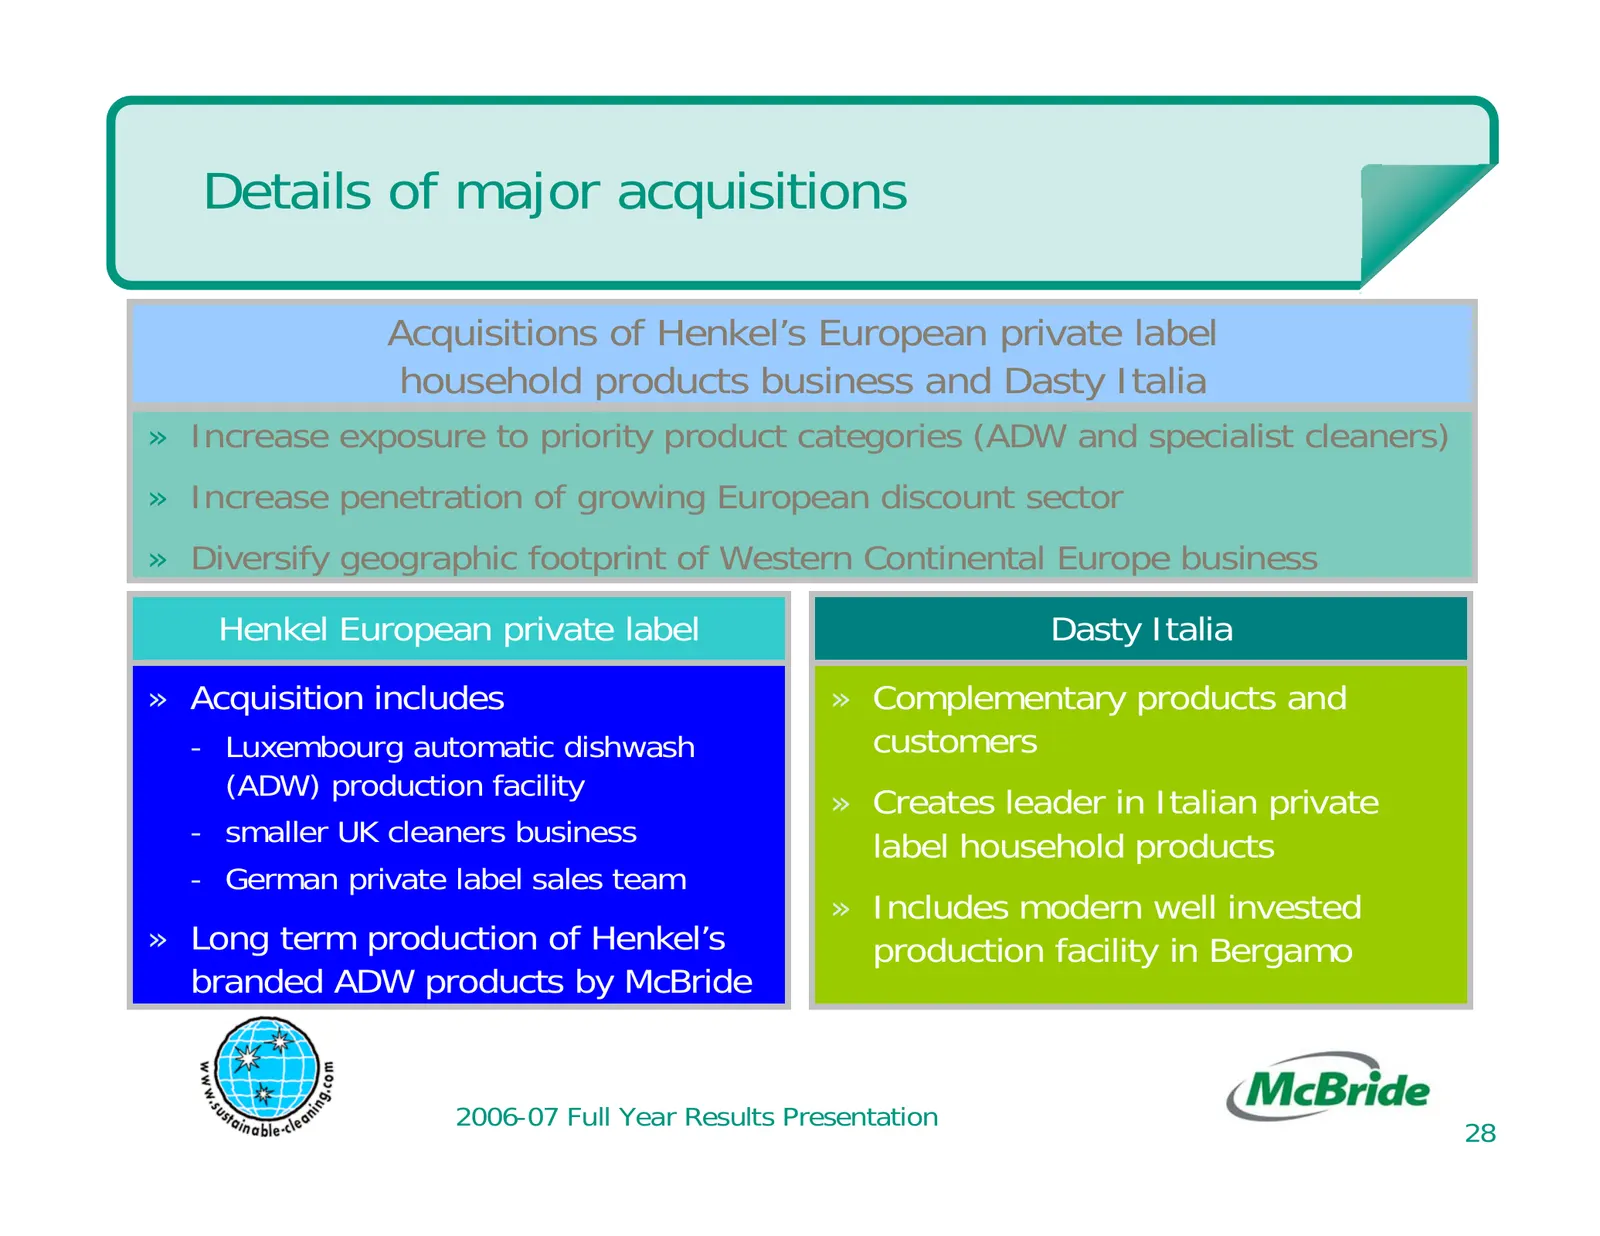
Slide 28: Details of major acquisitions
Details of major acquisitions Acquisitions of Henkel’s European private label household products business and Dasty Italia » Increase exposure to priority product categories (ADW and specialist cleaners) » Increase penetration of growing European discount sector » Diversify geographic footprint of W
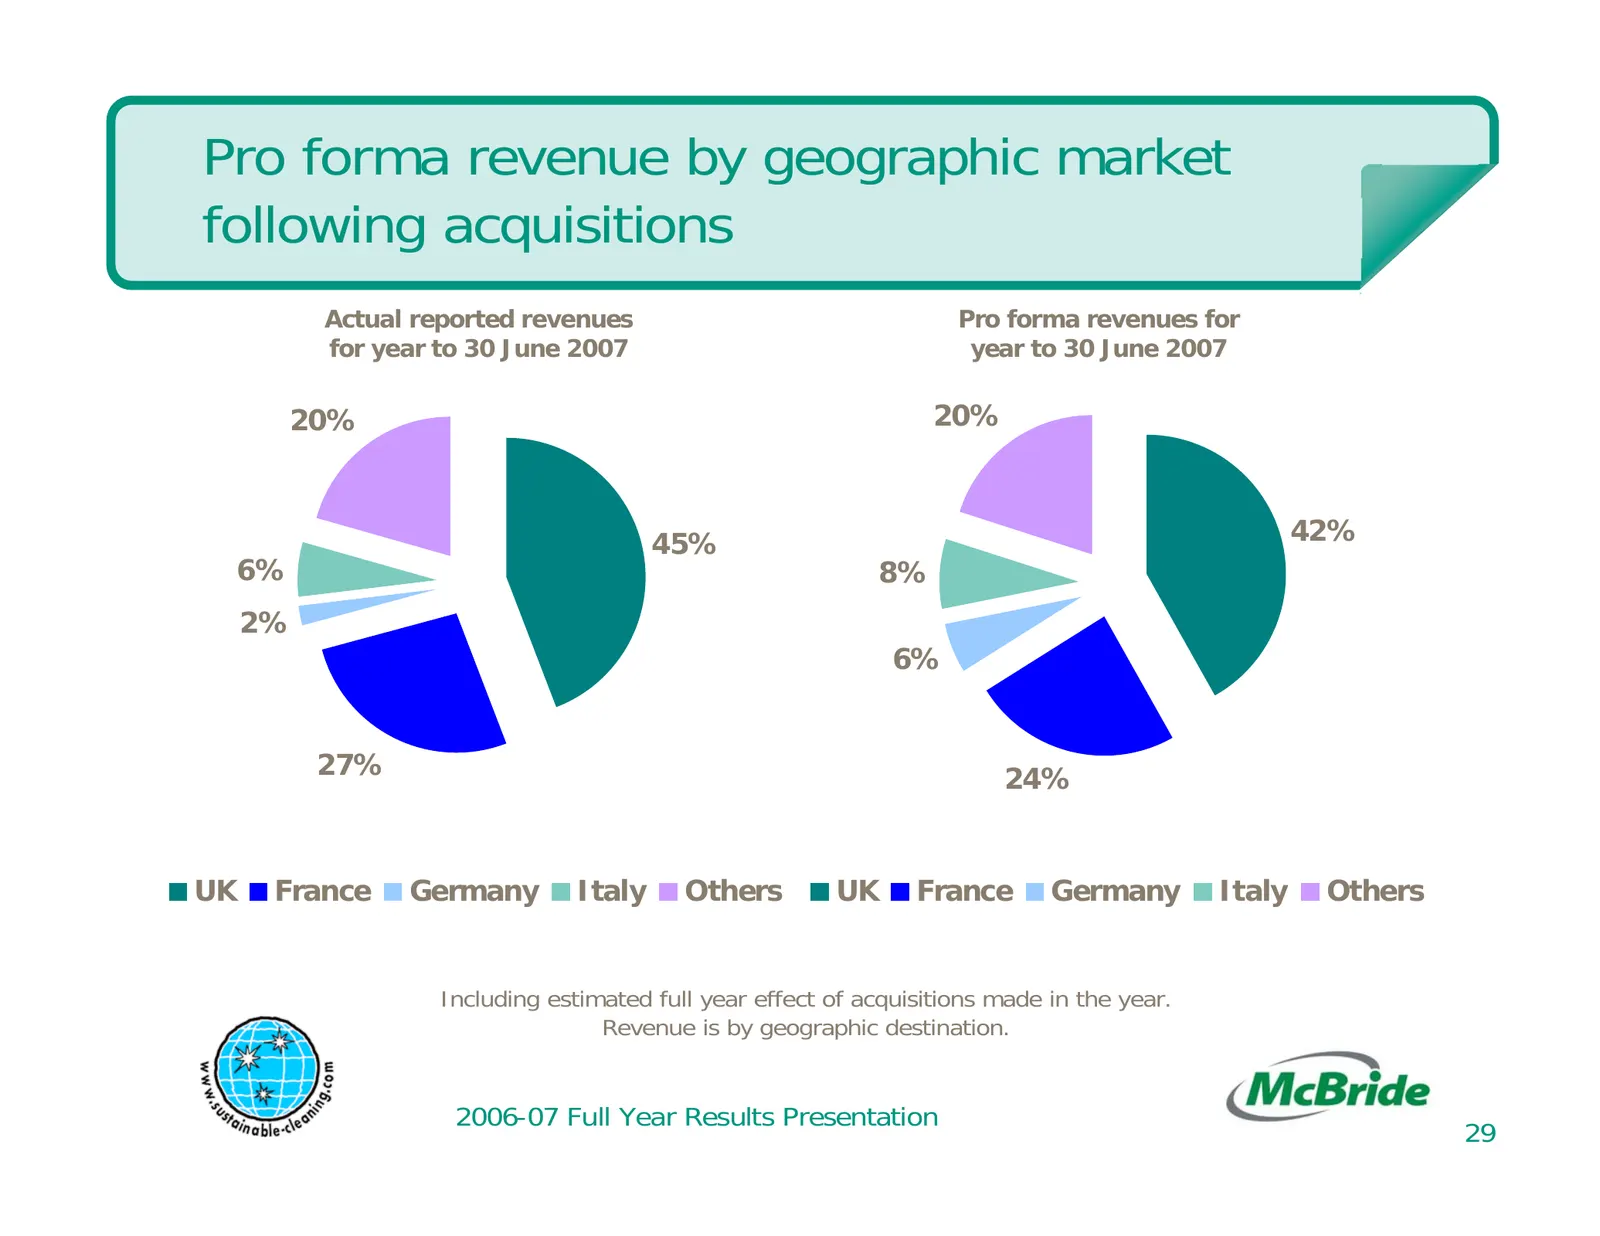
Slide 29: Pro forma revenue by geographic market following acquisitions
Pro forma revenue by geographic market following acquisitions Actual reported revenues Pro forma revenues for for year to 30 June 2007 year to 30 June 2007 20% 20% 45% 42% 6% 8% 2% 6% 27% 24% UK France Germany Italy Others UK France Germany Italy Others Including estimated full year effect of acquis
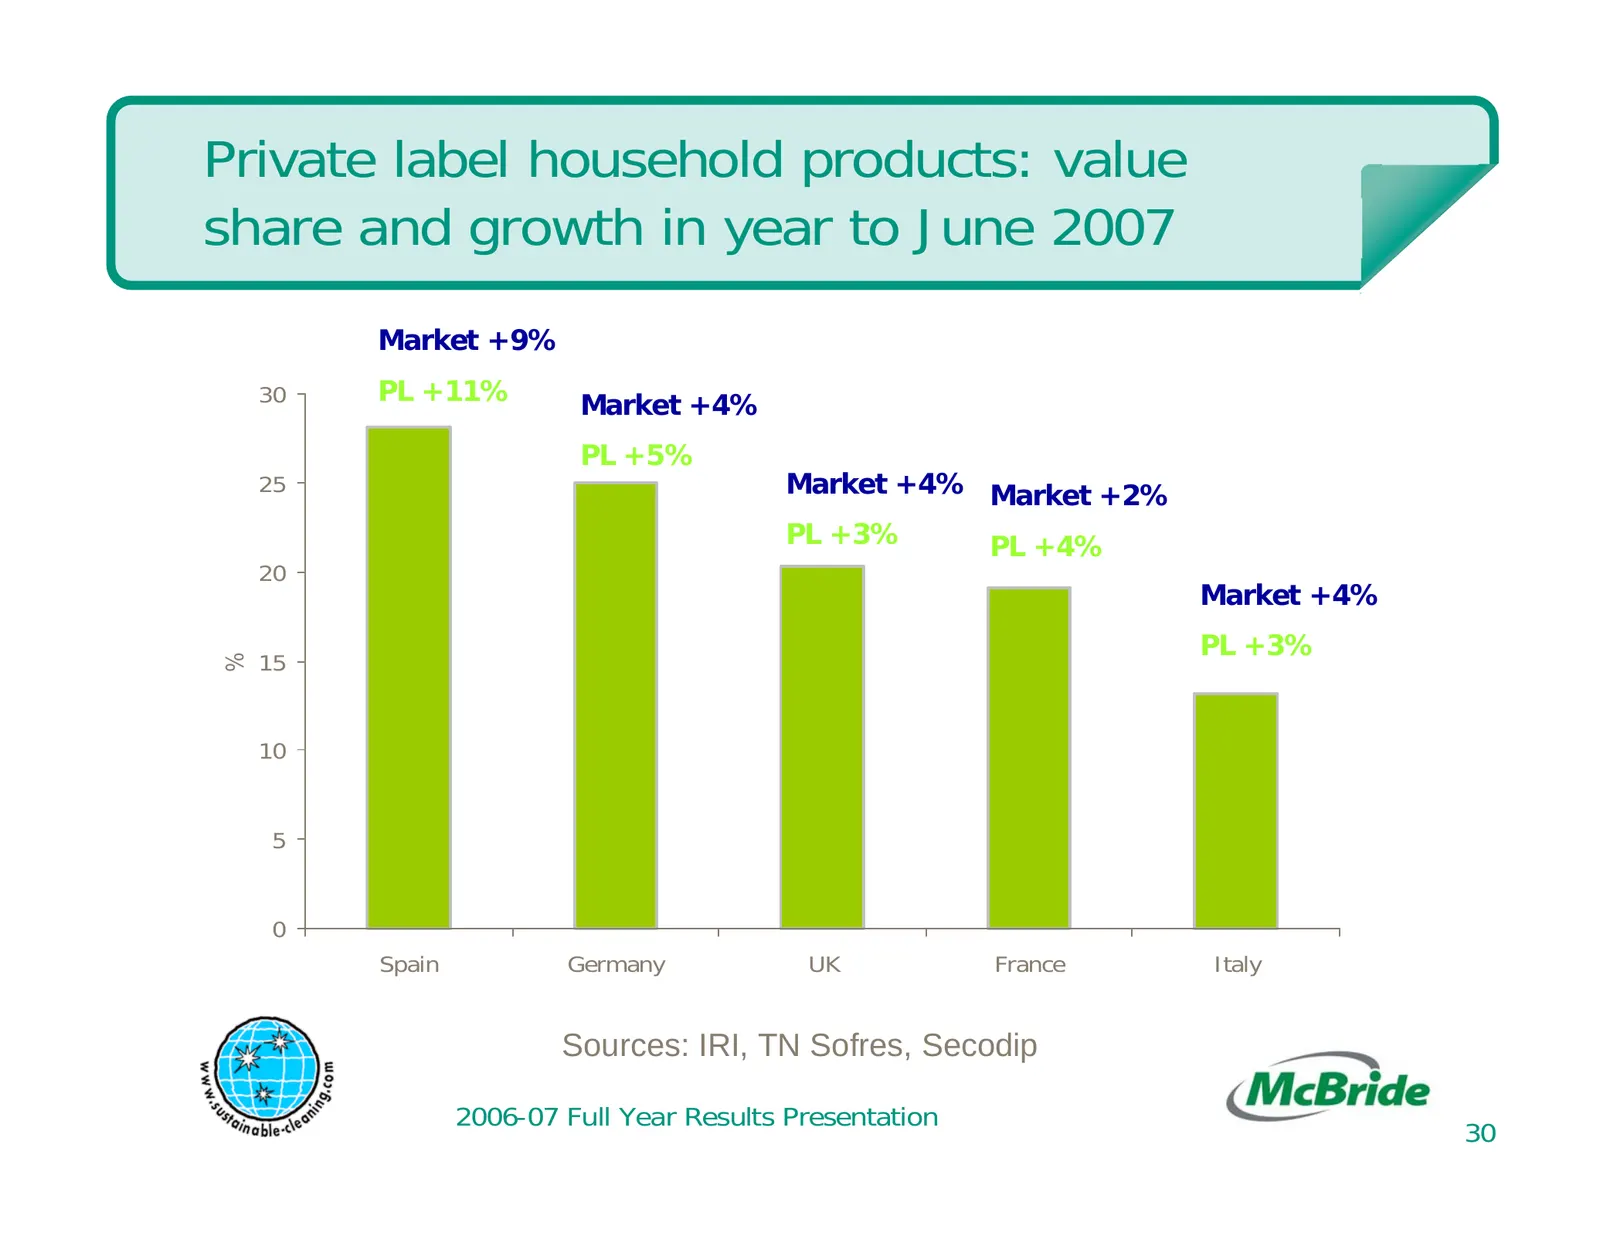
Slide 30: Private label household products: value share and growth in year to June 2007
Private label household products: value share and growth in year to June 2007 Market +9% 30 PL +11% Market +4% PL +5% 25 Market +4% Market +2% PL +3% PL +4% 20 Market +4% PL +3% 15 % 10 5 0 Spain Germany UK France Italy Sources: IRI, TN Sofres, Secodip 2006-07 Full Year Results Presentation 30
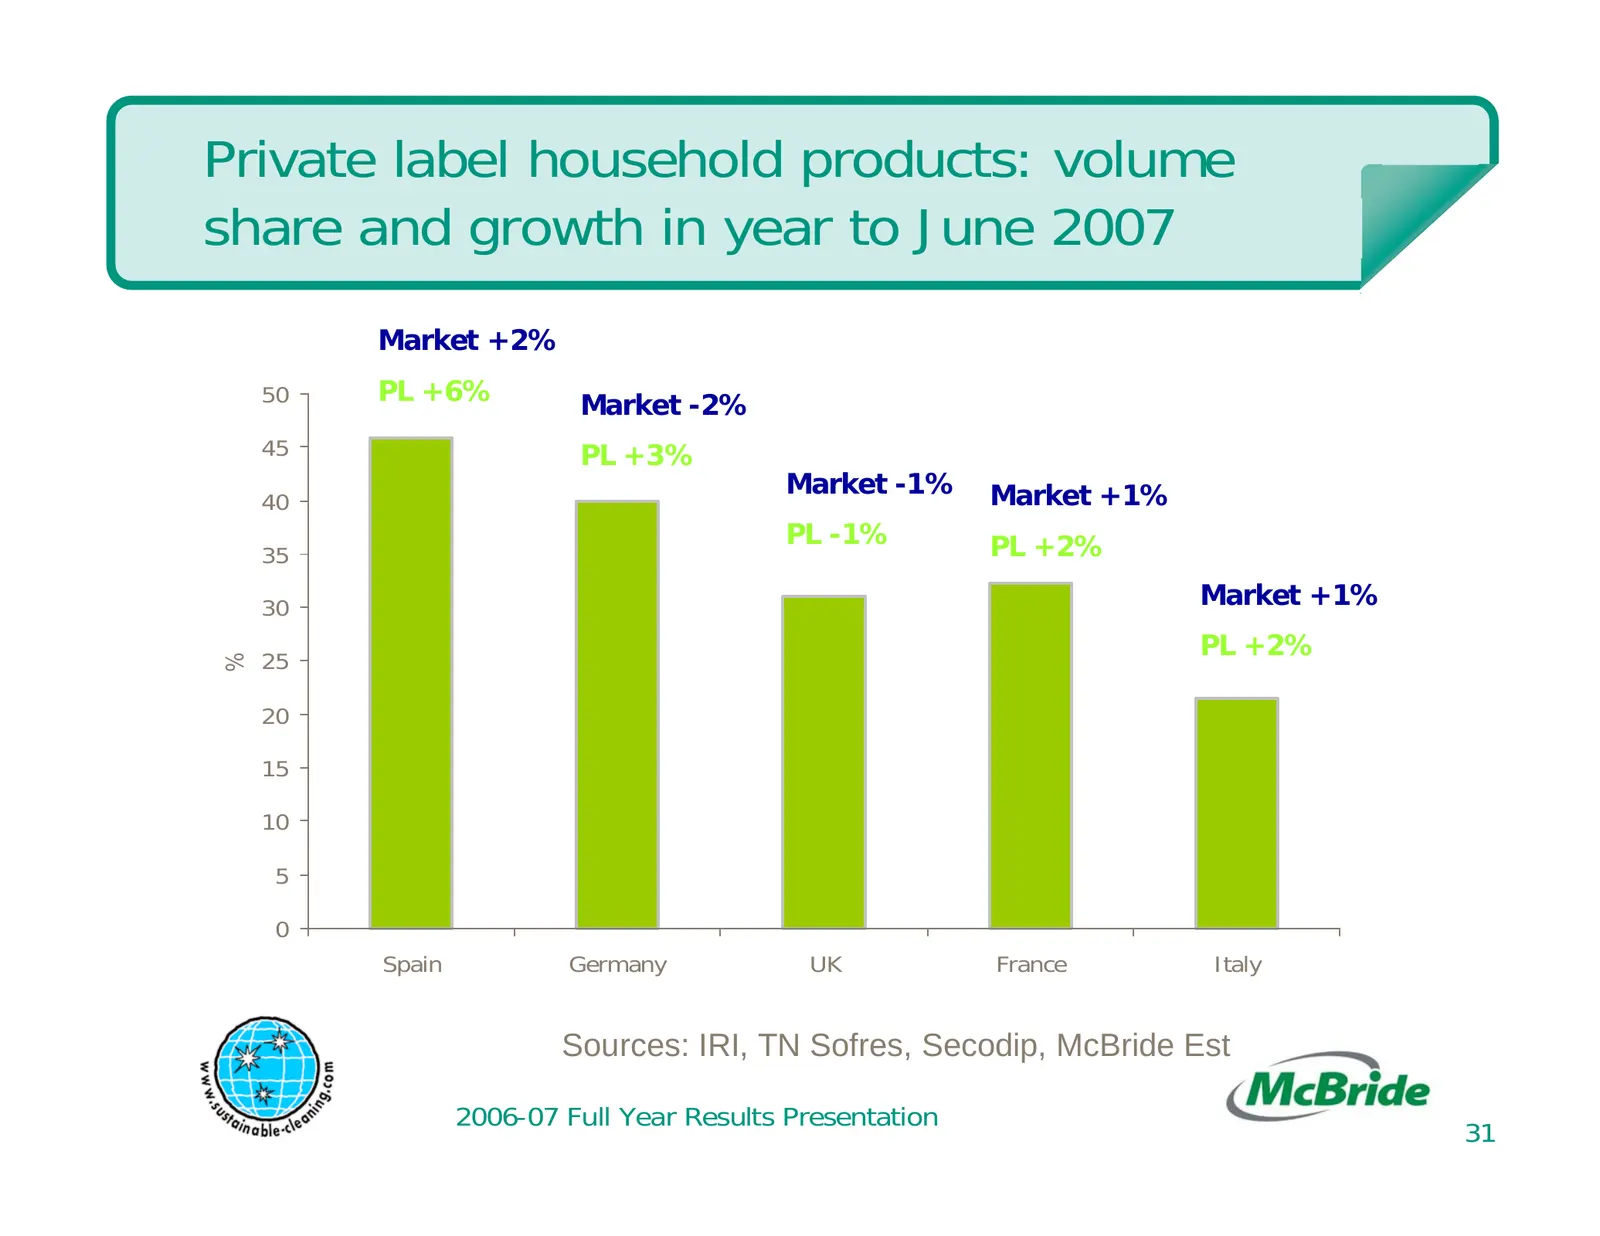
Slide 31: Private label household products: volume share and growth in year to June 2007
Private label household products: volume share and growth in year to June 2007 Market +2% 50 PL +6% Market -2% 45 PL +3% Market -1% Market +1% 40 PL -1% PL +2% 35 30 Market +1% 25 PL +2% % 20 15 10 5 0 Spain Germany UK France Italy Sources: IRI, TN Sofres, Secodip, McBride Est 2006-07 Full Year Resu
Source: Internet Archive copy of mcbride.co.uk
More decks from McBride plc
 FY2026 Earnings Presentation28 slides · Sep 15, 2026
 H1 FY26 Earnings Presentation22 slides · Feb 26, 2026
 FY2025 Earnings Presentation23 slides · Sep 18, 2025
 H1 FY2025 Earnings Presentation30 slides · Feb 25, 2025
 FY2024 Earnings Presentation30 slides · Sep 17, 2024
 Investor Day (March 2024)65 slides · Mar 13, 2024