FGC Rosseti · RUS:FEES
FGC Rosseti — Federal Grid Company — FY2015 Earnings Presentation
15 slides from FGC Rosseti's earnings presentation, March 2016
Slide 1: IFRS FY2015 Operational and Financial Results
Federal Grid Company IFRS FY2015 Operational and Financial Results LISTED March 2016 STANDARD DEPOSITARY RECEIPTS
Slide 2: Key corporate developments
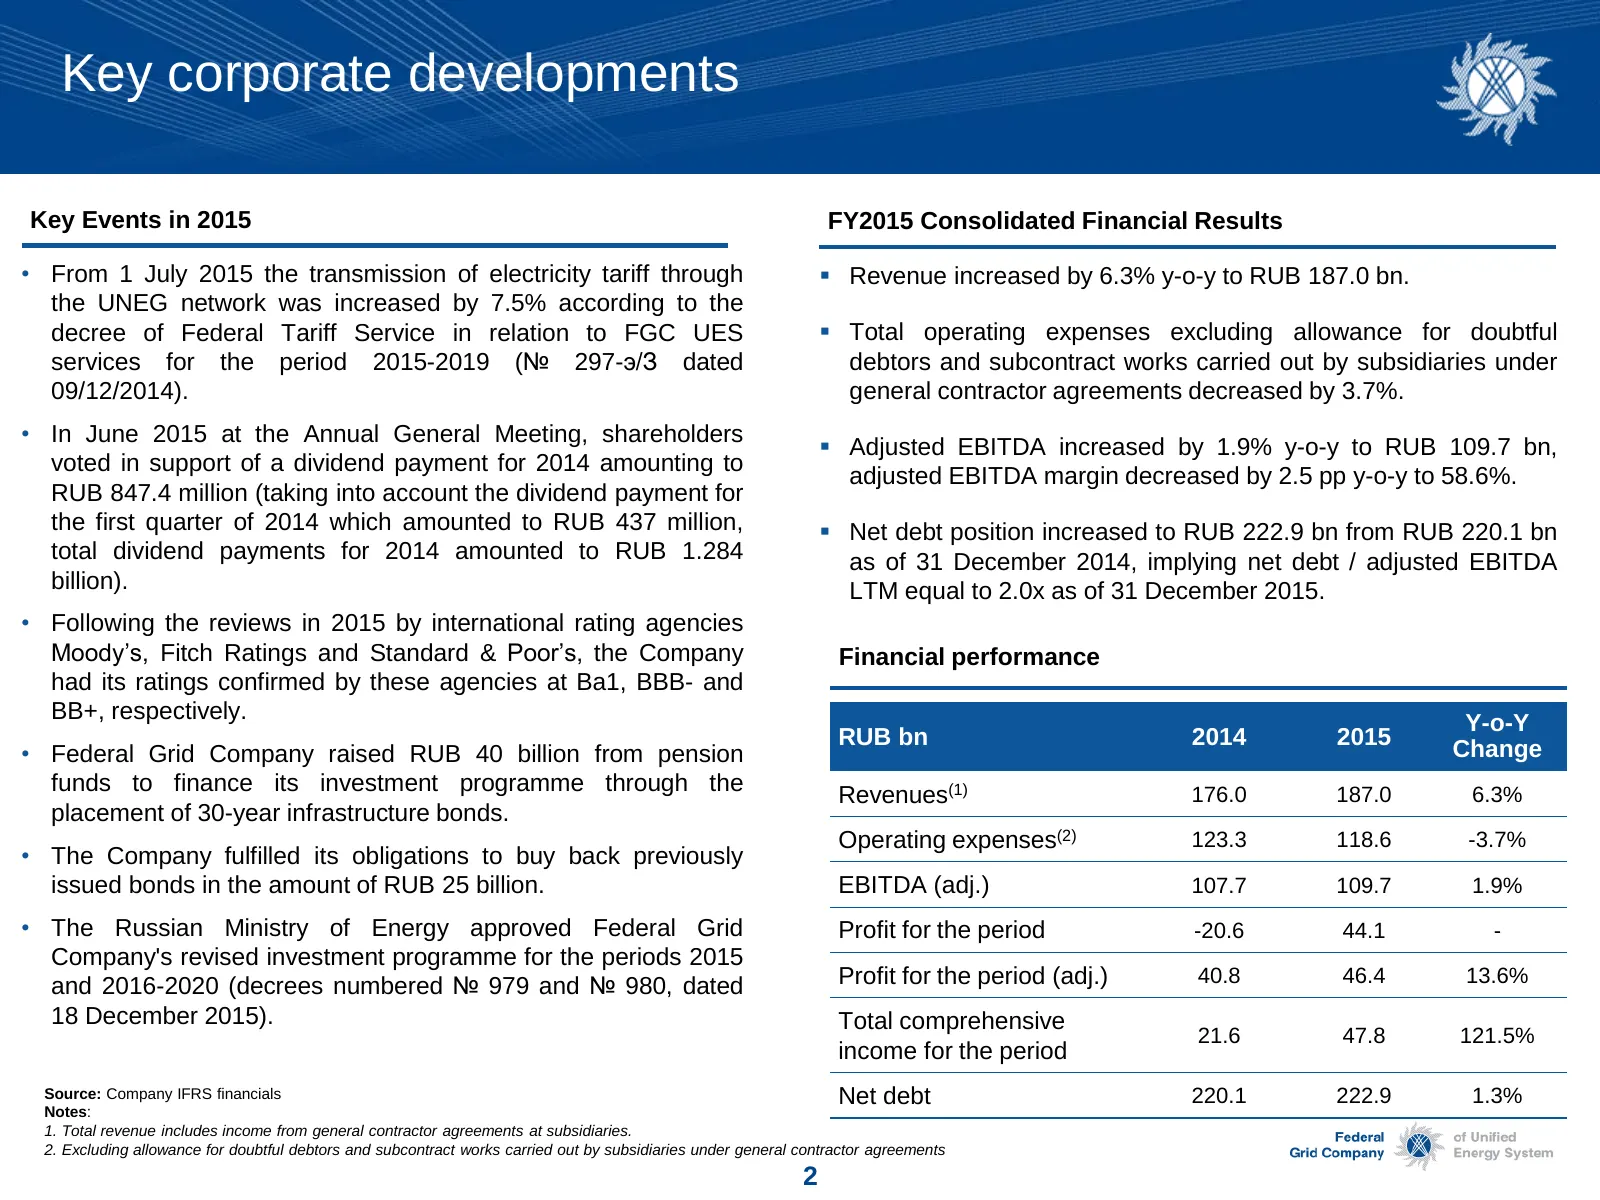
Key corporate developments Key Events in 2015 FY2015 Consolidated Financial Results • From 1 July 2015 the transmission of electricity tariff through Revenue increased by 6.3% y-o-y to RUB 187.0 bn. the UNEG network was increased by 7.5% according to the decree of Federal Tariff Service in relatio
Slide 3: Operational Overview
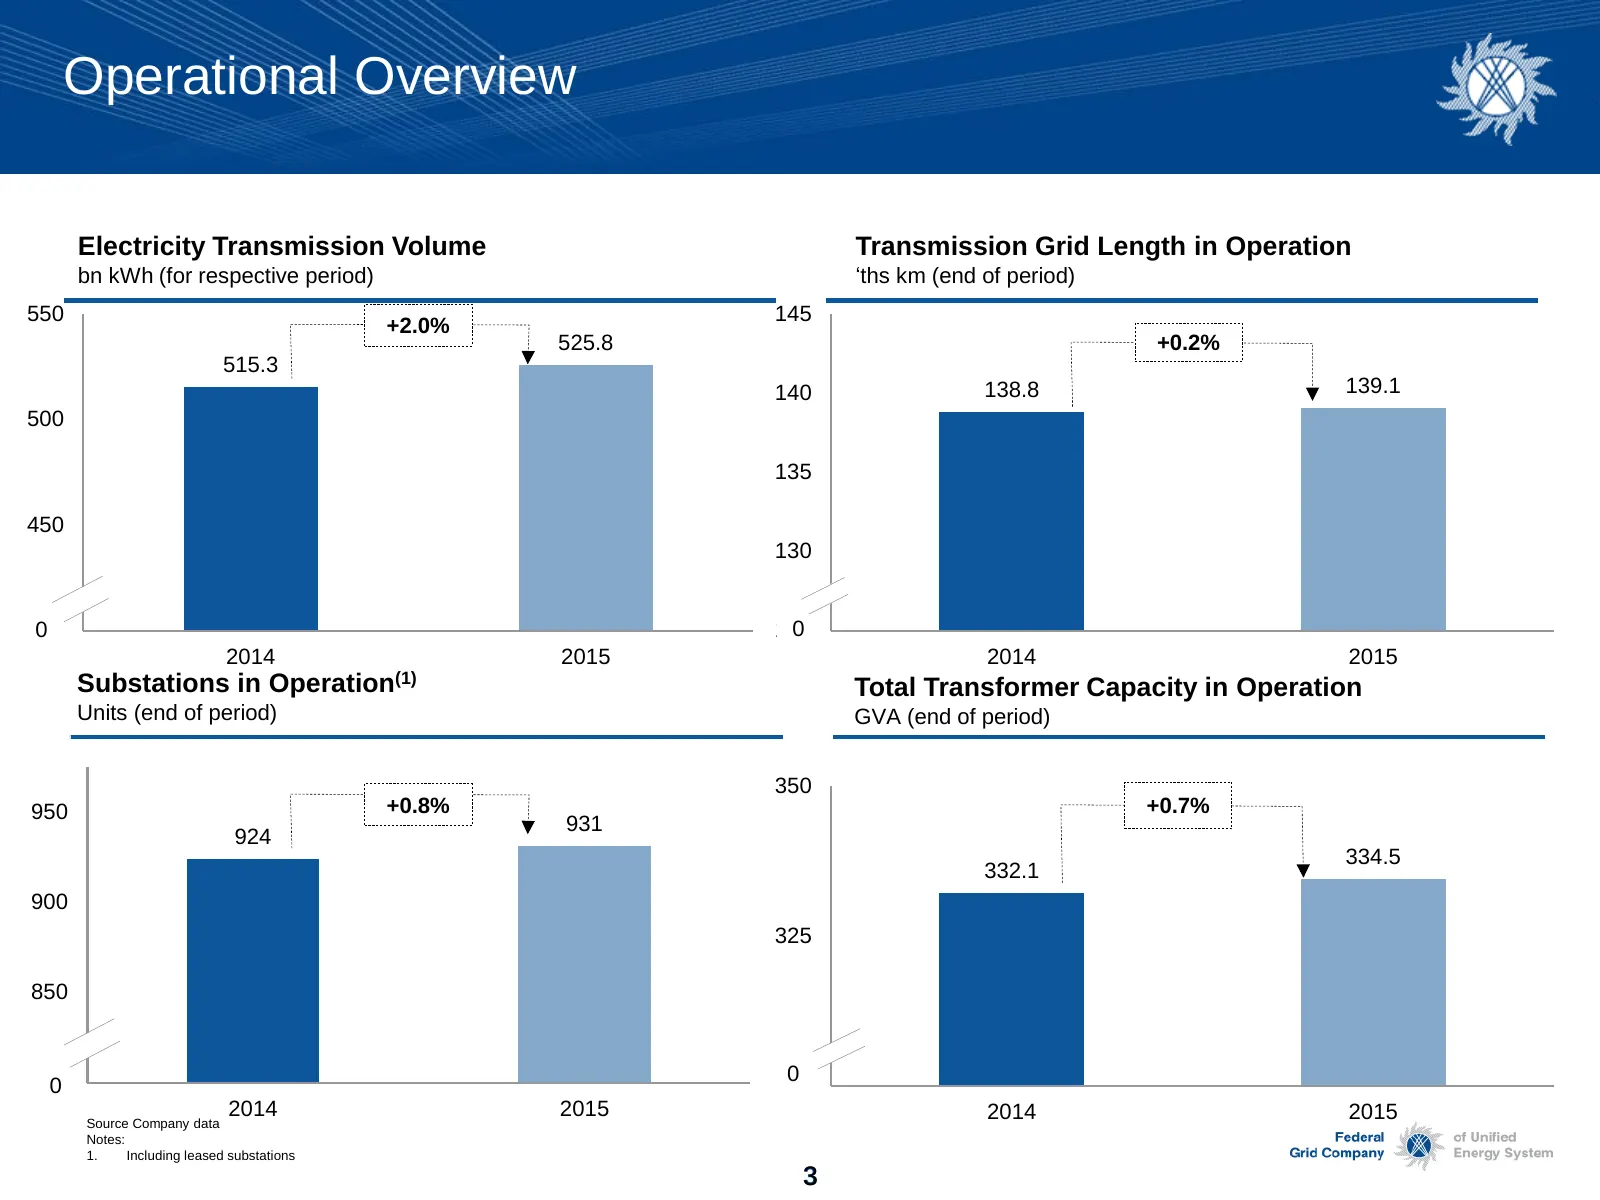
Operational Overview Electricity Transmission Volume Transmission Grid Length in Operation bn kWh (for respective period) ‘ths km (end of period) 550 145 +2.0% 525.8 +0.2% 515.3 140 138.8 139.1 500 135 450 130 400 0 0 125 2014 2015 2014 2015 Substations in Operation(1) Total Transformer Capacity in
Slide 4: Key Financial Results
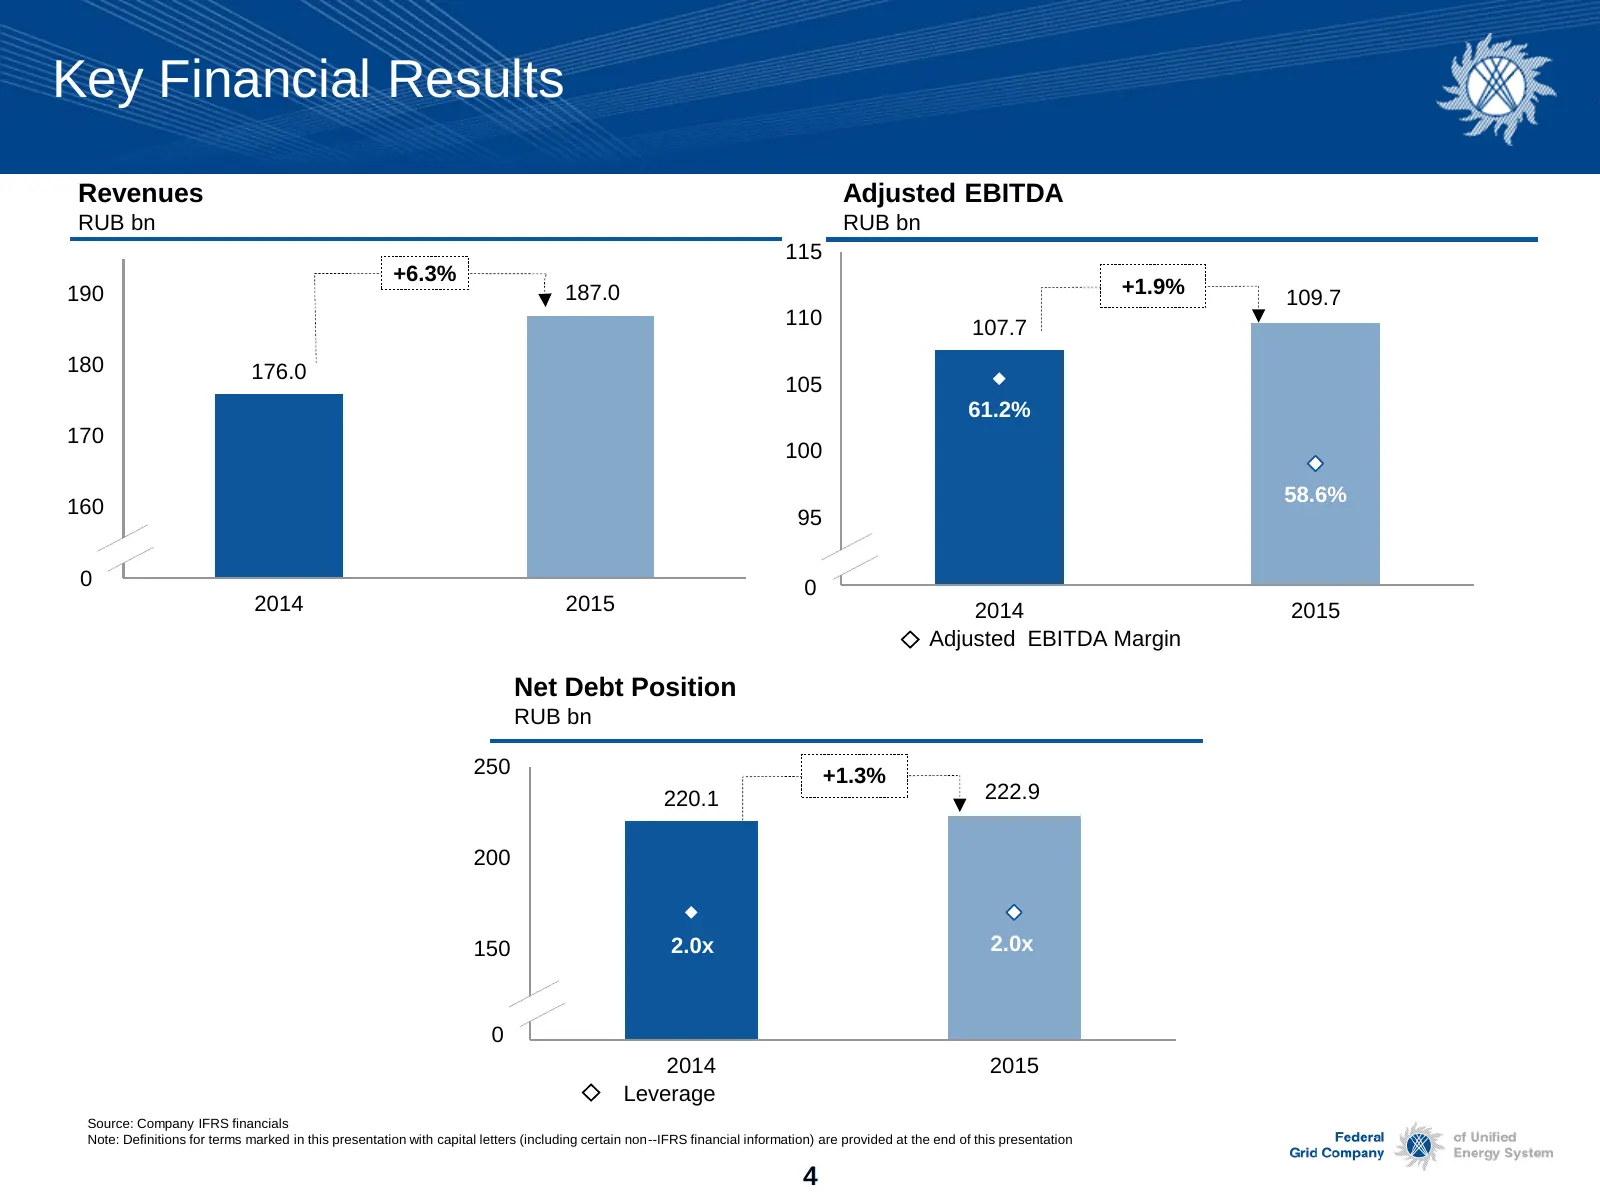
Key Financial Results Revenues Adjusted EBITDA RUB bn RUB bn 115 +6.3% 190 187.0 +1.9% 109.7 110 107.7 180 176.0 105 61.2% 170 100 58.6% 160 95 150 0 90 0 2014 2015 2014 2015 Adjusted EBITDA Margin Net Debt Position RUB bn 250 +1.3% 220.1 222.9 200 150 2.0x 2.0x 0 100 2014 2015 Leverage Source: Comp
Slide 5: Revenue Structure
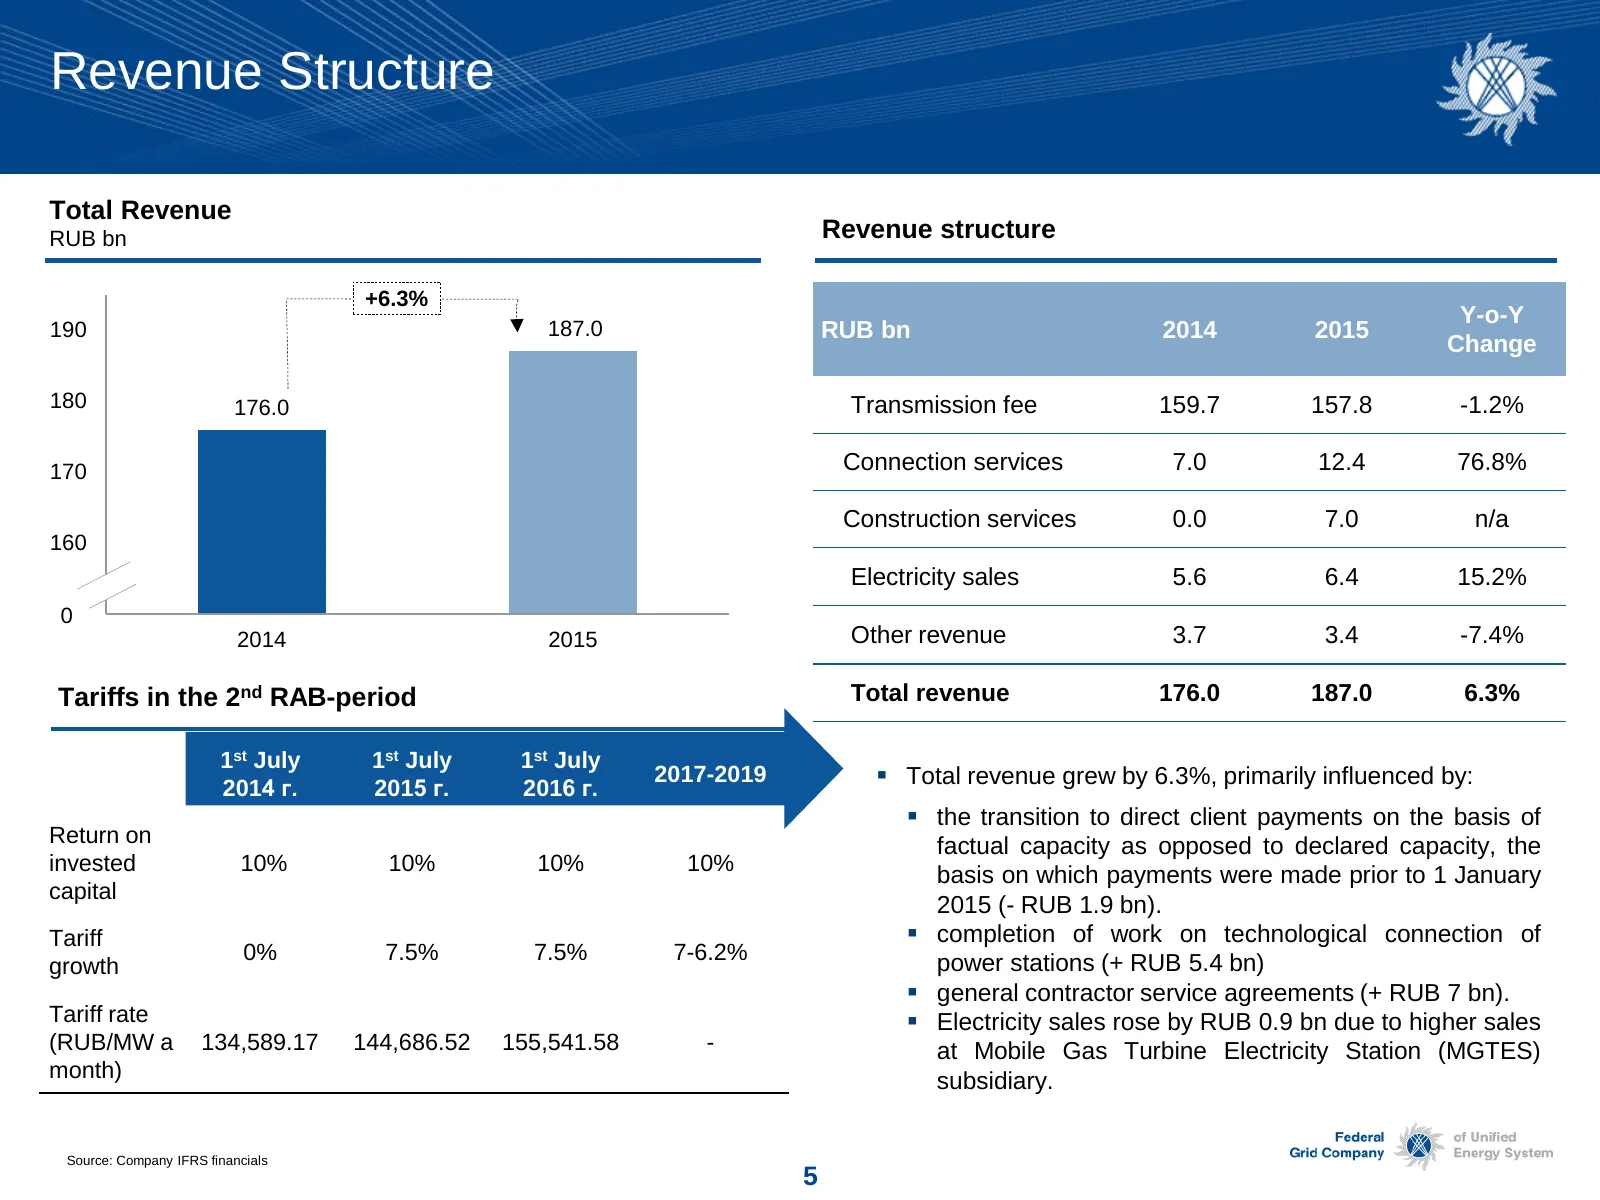
Revenue Structure Total Revenue RUB bn Revenue structure +6.3% Y-o-Y 190 187.0 RUB bn 2014 2015 Change 180 176.0 Transmission fee 159.7 157.8 -1.2% 170 Connection services 7.0 12.4 76.8% Construction services 0.0 7.0 n/a 160 Electricity sales 5.6 6.4 15.2% 150 0 2014 2015 Other revenue 3.7 3.4 -7.4%
Slide 6: Operating Cost Structure
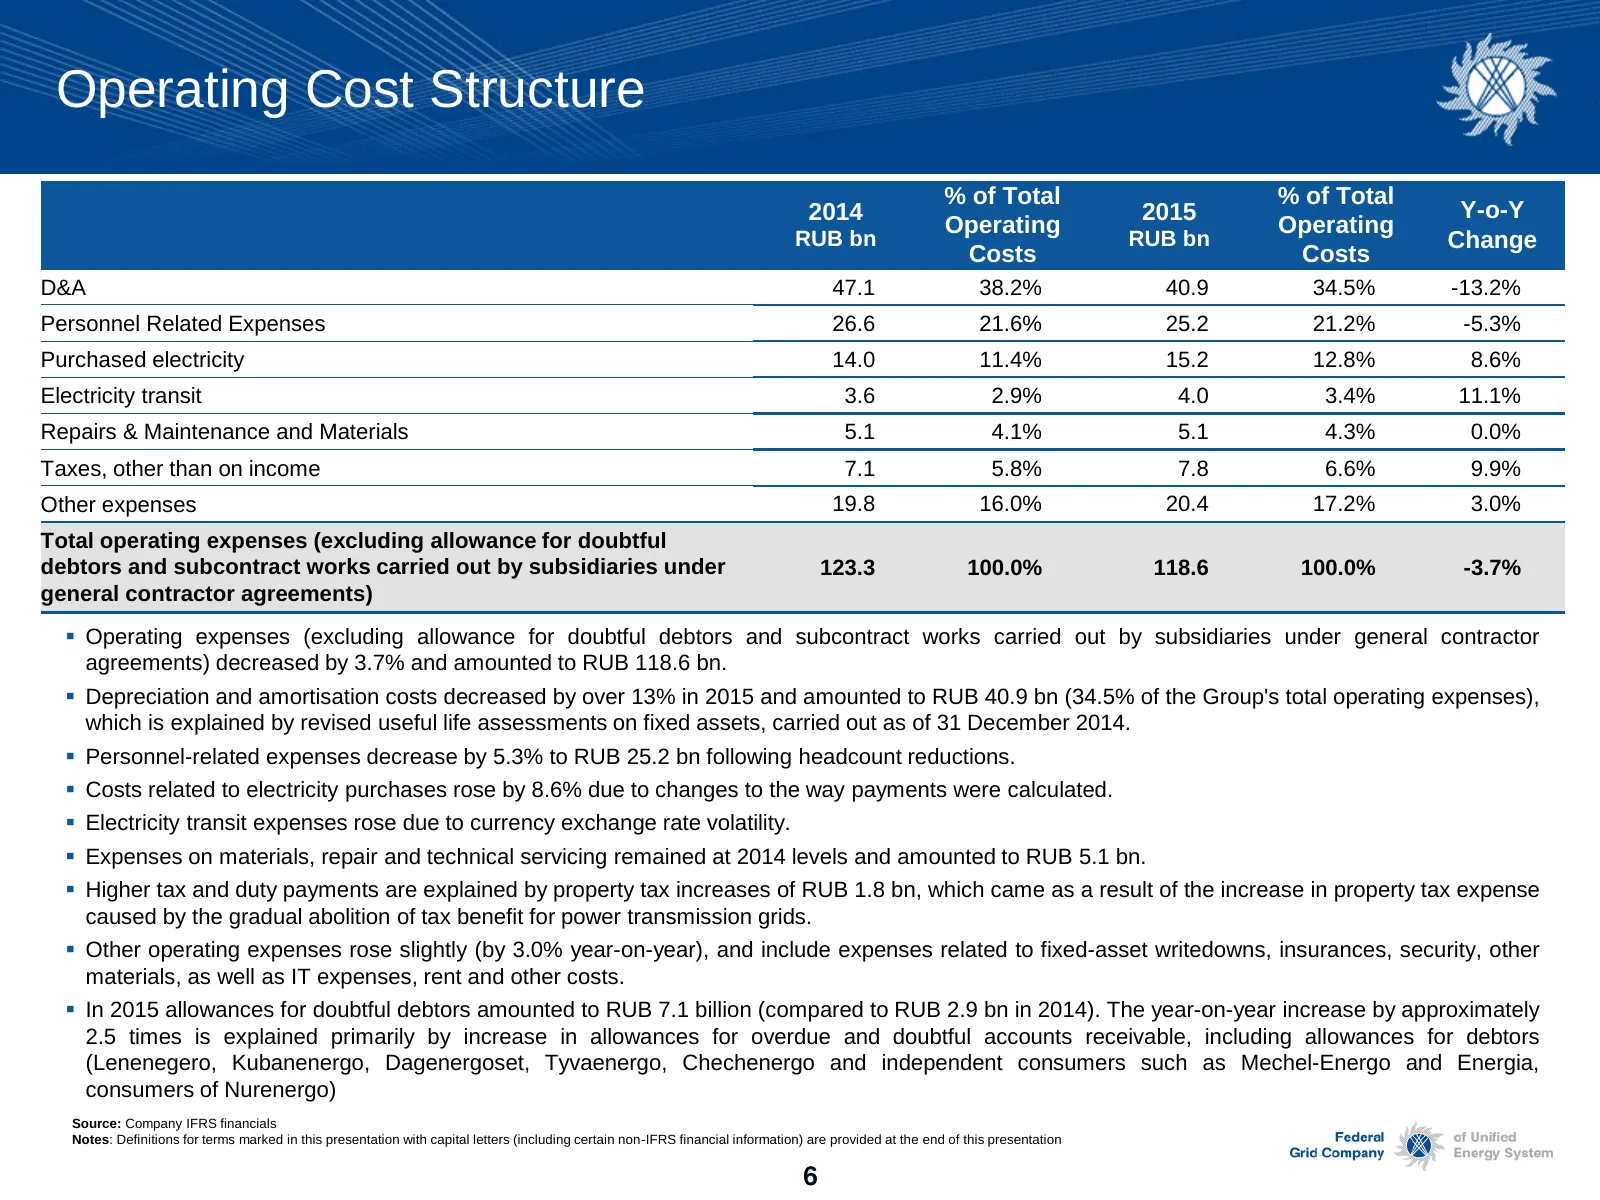
Operating Cost Structure % of Total % of Total 2014 2015 Y-o-Y Operating Operating RUB bn RUB bn Change Costs Costs D&A 47.1 38.2% 40.9 34.5% -13.2% Personnel Related Expenses 26.6 21.6% 25.2 21.2% -5.3% Purchased electricity 14.0 11.4% 15.2 12.8% 8.6% Electricity transit 3.6 2.9% 4.0 3.4% 11.1% Rep
Slide 7: EBITDA Analysis
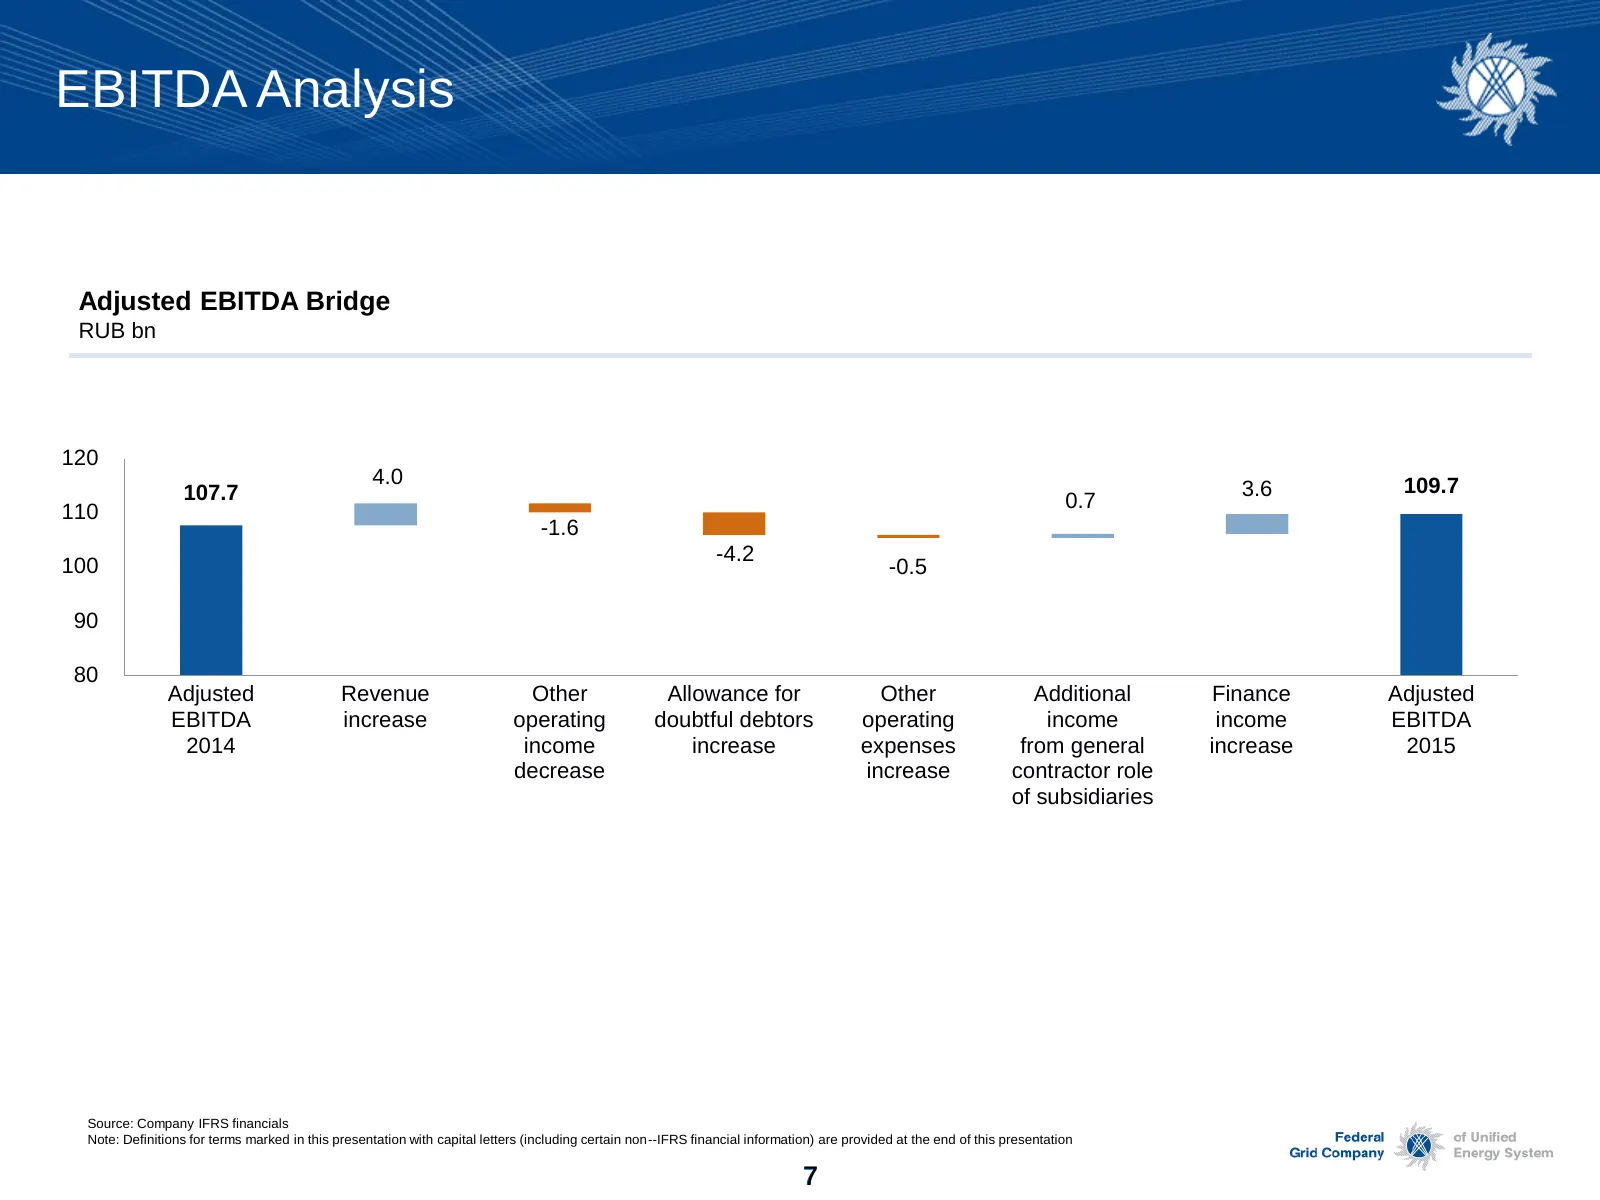
EBITDA Analysis Adjusted EBITDA Bridge RUB bn 120 4.0 109.7 107.7 3.6 0.7 110 -1.6 -4.2 100 -0.5 90 80 Adjusted Revenue Other Allowance for Other Additional Finance Adjusted EBITDA increase operating doubtful debtors operating income income EBITDA 2014 income increase expenses from general increase
Slide 8: Free Cash Flow
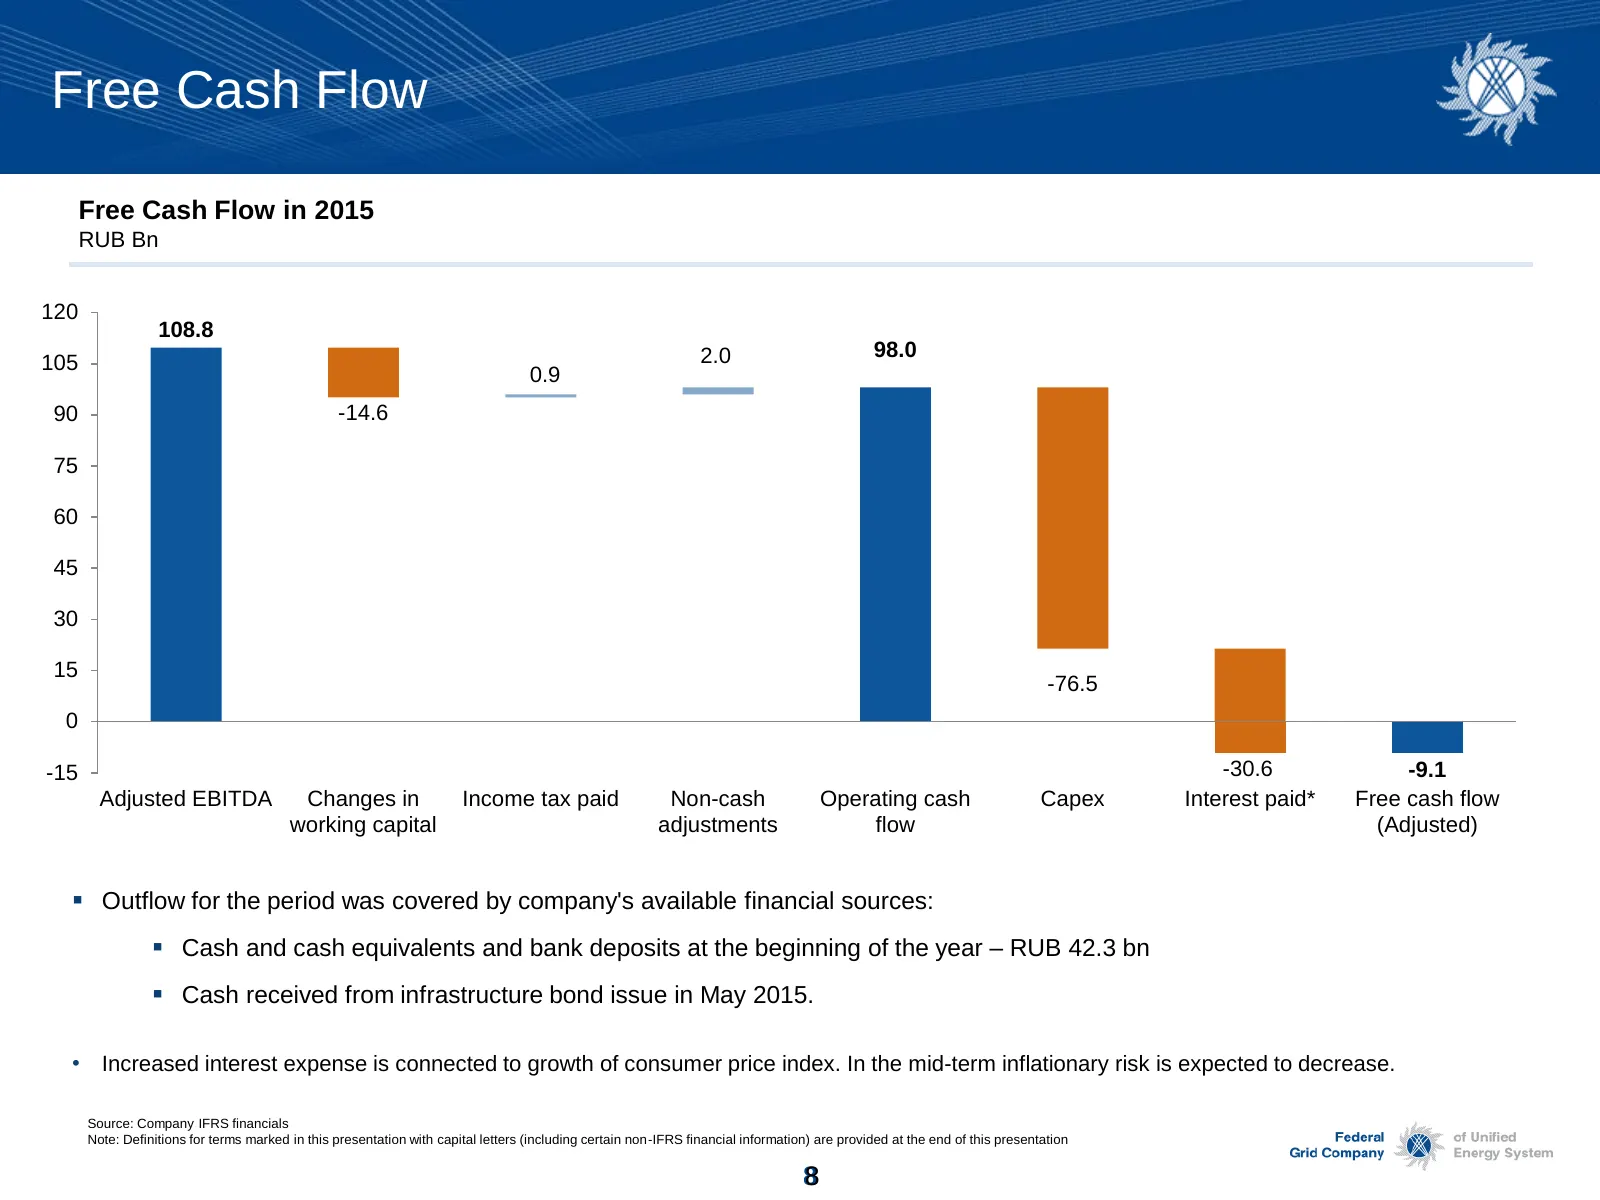
Free Cash Flow Free Cash Flow in 2015 RUB Bn 120 108.8 2.0 98.0 105 0.9 90 -14.6 75 60 45 30 15 -76.5 0 -15 -30.6 -9.1 Adjusted EBITDA Changes in Income tax paid Non-cash Operating cash Capex Interest paid* Free cash flow working capital adjustments flow (Adjusted) Outflow for the period was cover
Slide 9: Debt Capital Structure
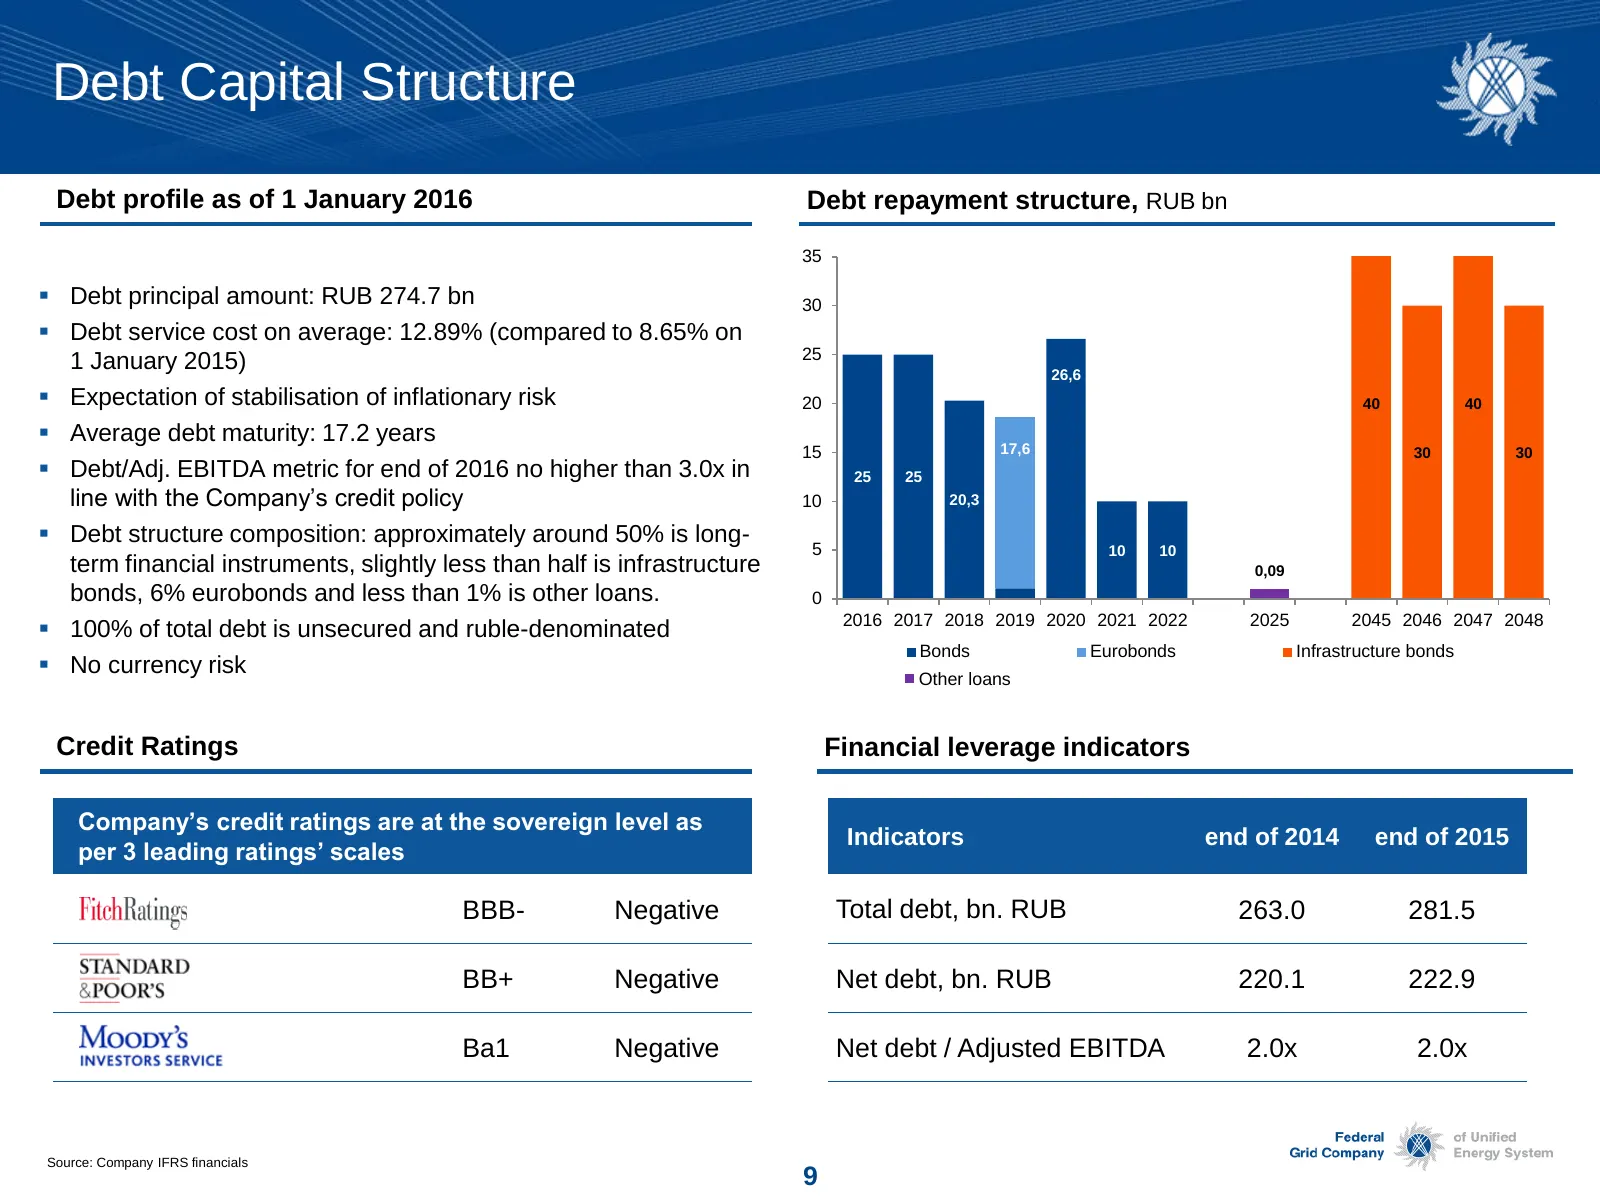
Debt Capital Structure Debt profile as of 1 January 2016 Debt repayment structure, RUB bn 35 Debt principal amount: RUB 274.7 bn 30 Debt service cost on average: 12.89% (compared to 8.65% on 25 1 January 2015) 26,6 Expectation of stabilisation of inflationary risk 20 40 40 Average debt matur
Slide 10: Key initiatives to raise operating efficiency in 2016
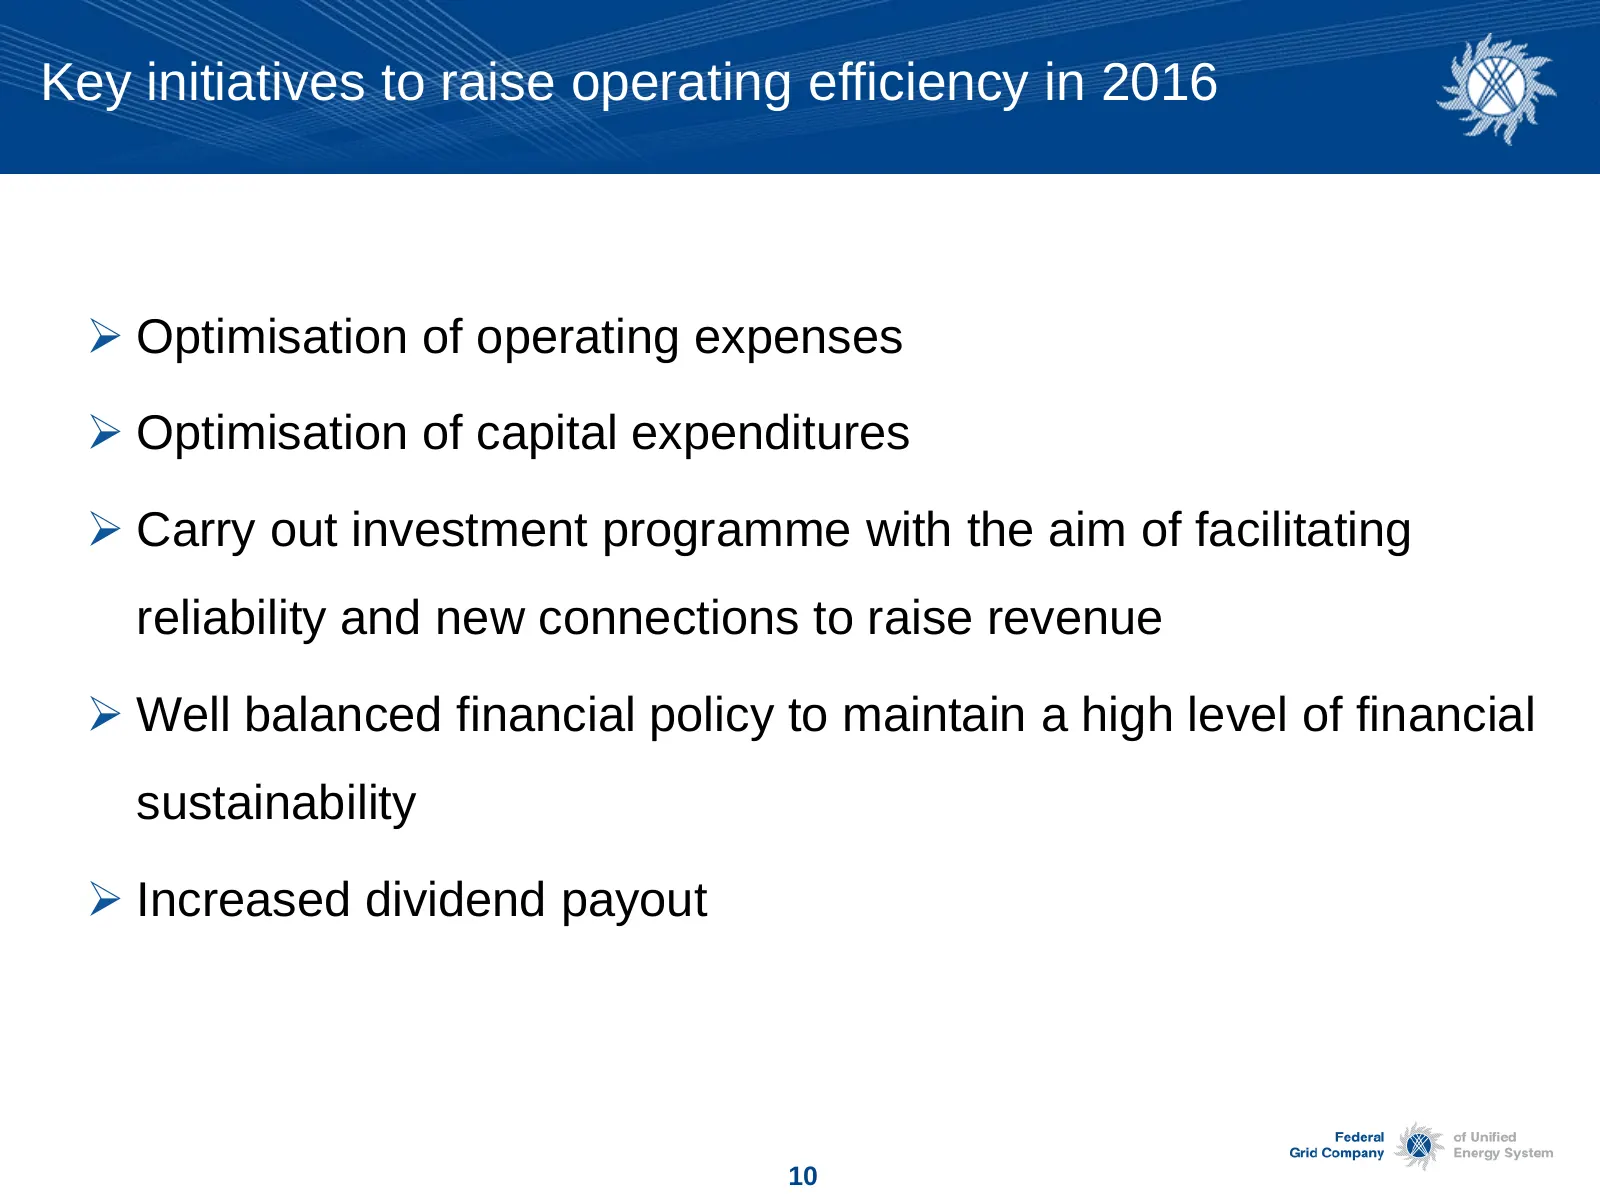
Key initiatives to raise operating efficiency in 2016 Optimisation of operating expenses Optimisation of capital expenditures Carry out investment programme with the aim of facilitating reliability and new connections to raise revenue Well balanced financial policy to maintain a high level o
Slide 11: Appendices
Appendices
Slide 12: Preliminary results of investment programme in 2015
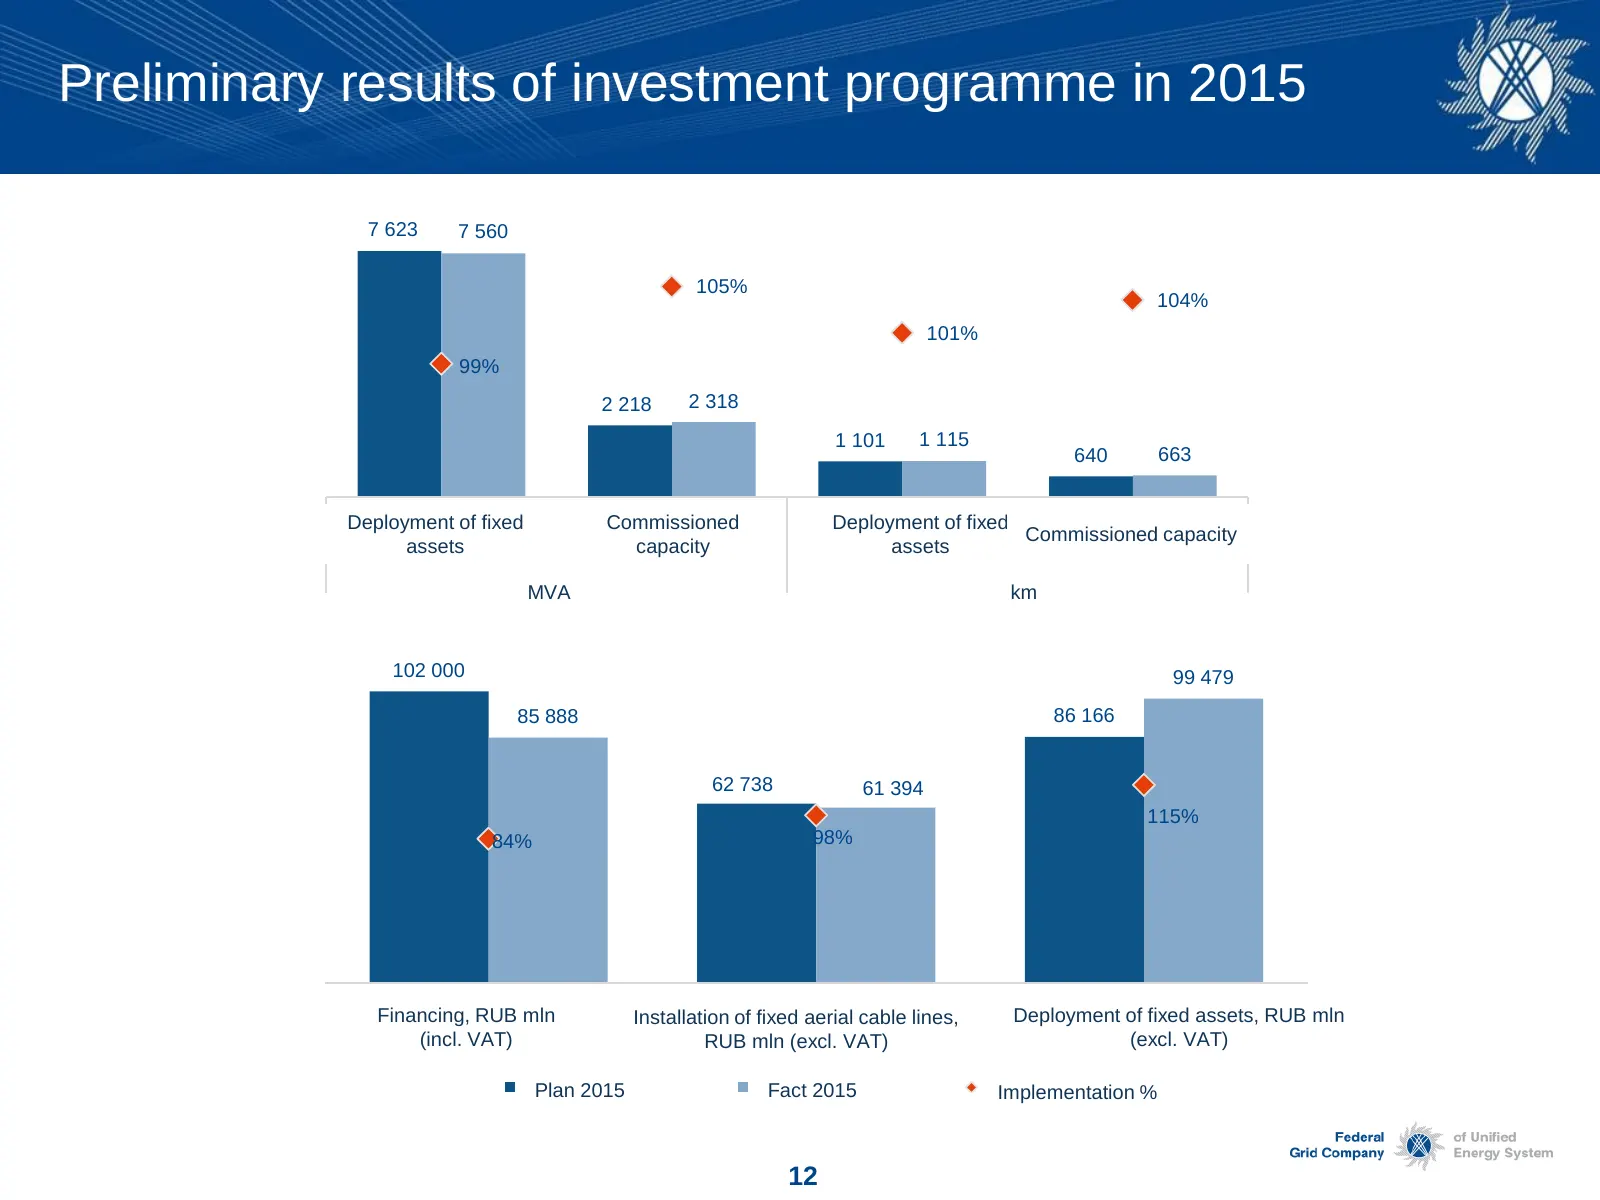
Preliminary results of investment programme in 2015 9 000 110% 8 000 7 623 7 560 7 000 105% 105% 6 000 104% 5 000 101% 100% 4 000 99% 3 000 2 218 2 318 2 000 95% 1 101 1 115 1 000 640 663 0 90% Ввод в состав Deployment ОС of fixed Постановка Commissionedпод Ввод в составofОС Deployment fixed Постано
Slide 13: Glossary
Glossary General The Unified National Electric Grid – the UNEG PJSC “Federal Grid Company of Unified Energy System” – Federal Grid Company PJSC “FGC UES” and its subsidiaries – the Group PJSC “Russian Grids” – Russian Grids The Russian Federal Tariff Service – the FTS Financial Metrics A
Slide 14: Investor Relations Contacts
Investor Relations Contacts Egor Toropov Tel.: +7 495 710 9333 ext. 2275 E-mail: toropov-ev@fsk-ees.ru Alexey Novikov Tel.: +7 495 710 9333 ext. 2143 E-mail: novikov-as@fsk-ees.ru 14
Slide 15: Disclaimer
Disclaimer The materials comprising this Presentation have been prepared by the Company solely for use by the Company’s management at investor meetings with a limited number of institutional investors who have agreed to attend such meetings and to be subject to obligations to maintain Company to con
Source: Internet Archive copy of fsk-ees.ru
More decks from FGC Rosseti
 пао «фск еэс» — 9M 2021 Earnings Presentation9 slides · November 2021
 Rosseti FGC UES — 9M 2021 Earnings Presentation9 slides · November 2021
 PJSC FGC UES (Rosseti FGC UES) — FY2020 Earnings Presentation9 slides · Jun 1, 2021
 пао «фск еэс» — FY2020 Earnings Presentation10 slides · 2021
 Россети (Rosseti) / ПАО «ФСК ЕЭС» — FY2020 Earnings Presentation20 slides · 2021
 пао «фск еэс» — FY2019 Earnings Presentation11 slides · Mar 5, 2020