Heidrick & Struggles International
Heidrick & Struggles International — Baird Small Cap Conference 2004
29 slides from Heidrick & Struggles International's conference presentation, Aug 5, 2004

Slide 1: Heidrick & Struggles – Baird Small Cap Conference
HEIDRICK & STRUGGLES Baird Small Cap Conference August 4, 2004

Slide 2: Safe Harbor Statement
Safe Harbor Statement This presentation contains forward-looking statements. The forward-looking statements are based on current expectations, estimates, forecasts and projections about the industry in which we operate and management’s beliefs and assumptions. Forward-looking statements may be ident
Slide 3: Heidrick & Struggles
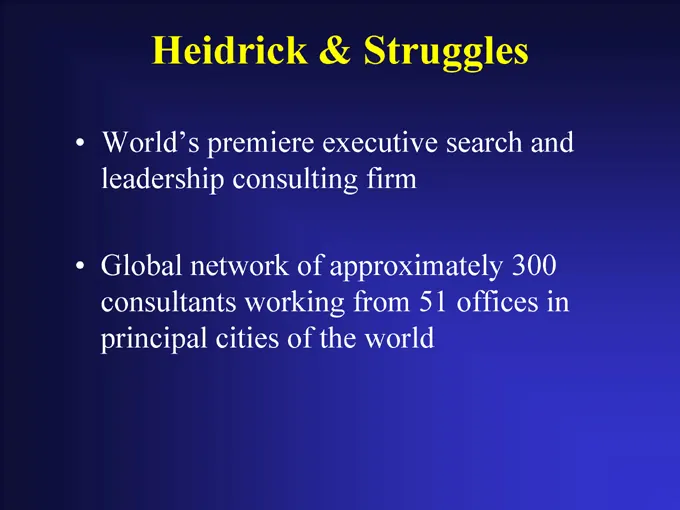
Heidrick & Struggles World’s premiere executive search and leadership consulting firm Global network of approximately 300 consultants working from 51 offices in principal cities of the world
Slide 4: Global Presence
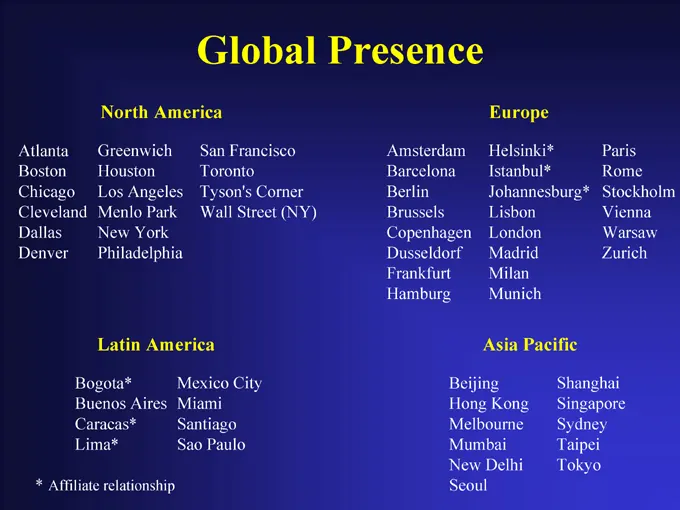
Global Presence North America Europe Latin America Asia Pacific Atlanta Boston Chicago Cleveland Dallas Denver Greenwich Houston Los Angeles Menlo Park New York Philadelphia San Francisco Toronto Tyson’s Corner Wall Street (NY) Amsterdam Barcelona Berlin Brussels Copenhagen Dusseldorf Frankfurt Hamb
Slide 5: Diverse Geographic Mix
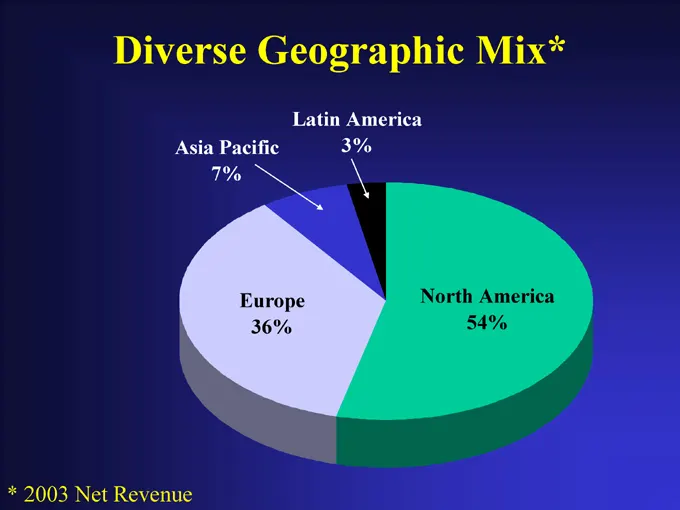
Diverse Geographic Mix* Latin America 3% Asia Pacific 7% Europe 36% North America 54% * 2003 Net Revenue
Slide 6: 2003 Industry Practice Mix
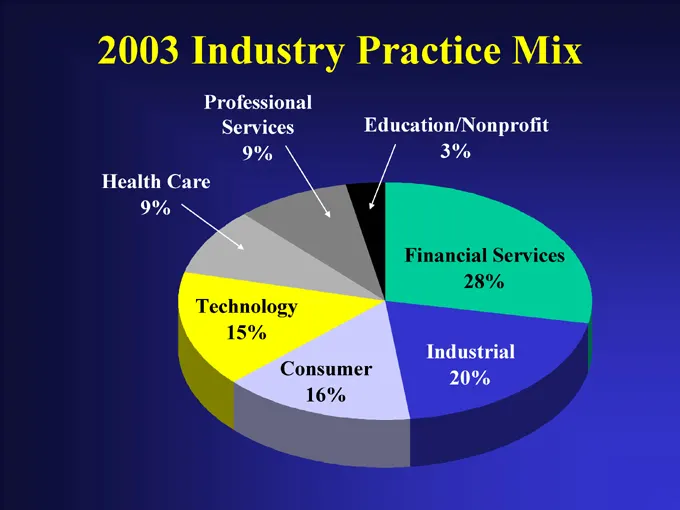
2003 Industry Practice Mix Professional Services 9% Education/Nonprofit 3% Health Care 9% Technology 15% Consumer 16% Industrial 20% Financial Services 28%
Slide 7: World's Largest Search Firms
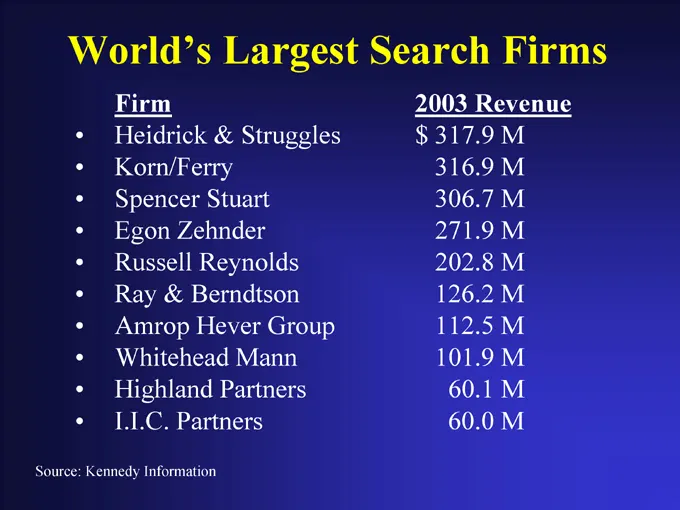
World’s Largest Search Firms Firm 2003 Revenue Heidrick & Struggles $317.9 M Korn/Ferry 316.9 M Spencer Stuart 306.7 M Egon Zehnder 271.9 M Russell Reynolds 202.8 M Ray & Berndtson 126.2 M Amrop Hever Group 112.5 M Whitehead Mann 101.9 M Highland Partners 60.1 M I.I.C. Partners 60.0 M Source: Kenned
Slide 8: Focus on Top-Level Services
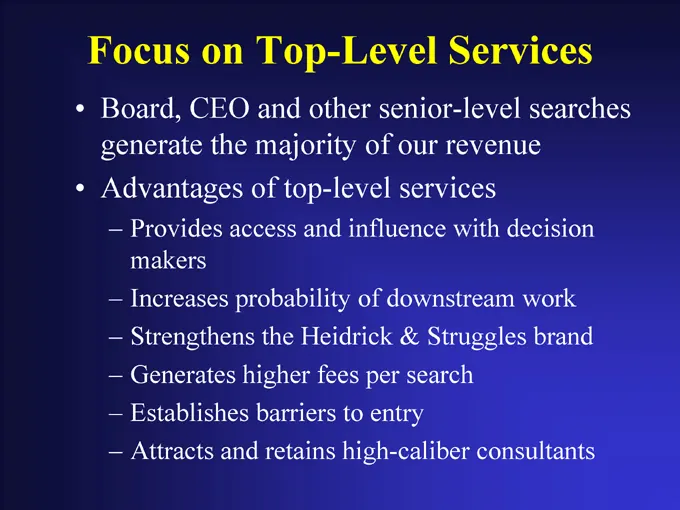
Focus on Top-Level Services Board, CEO and other senior-level searches generate the majority of our revenue Advantages of top-level services Provides access and influence with decision makers Increases probability of downstream work Strengthens the Heidrick & Struggles brand Generates higher fees pe
Slide 9: Recent Representative CEO/Board Searches
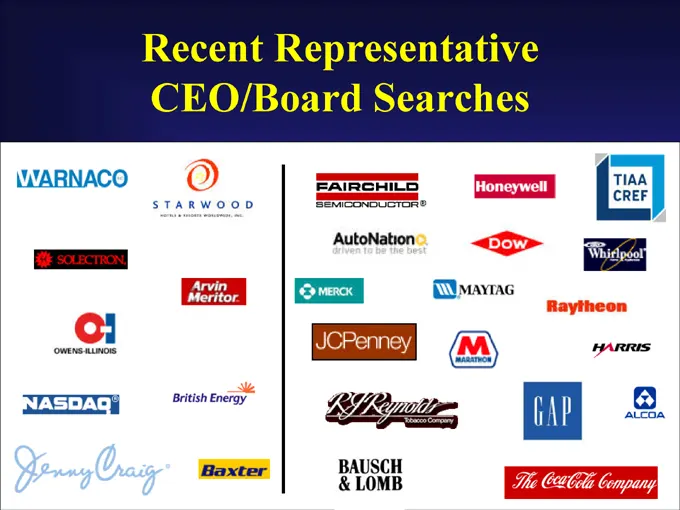
Recent Representative CEO/Board Searches
Slide 10: Economics of the Firm
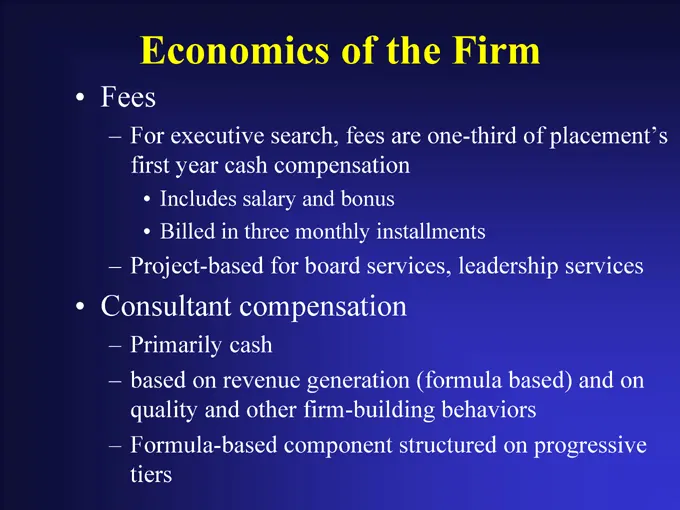
Economics of the Firm Fees For executive search, fees are one-third of placement’s first year cash compensation Includes salary and bonus Billed in three monthly installments Project-based for board services, leadership services Consultant compensation Primarily cash based on revenue generation (for

Slide 11: Heidrick & Struggles
HEIDRICK & STRUGGLES
Slide 12: Client Needs
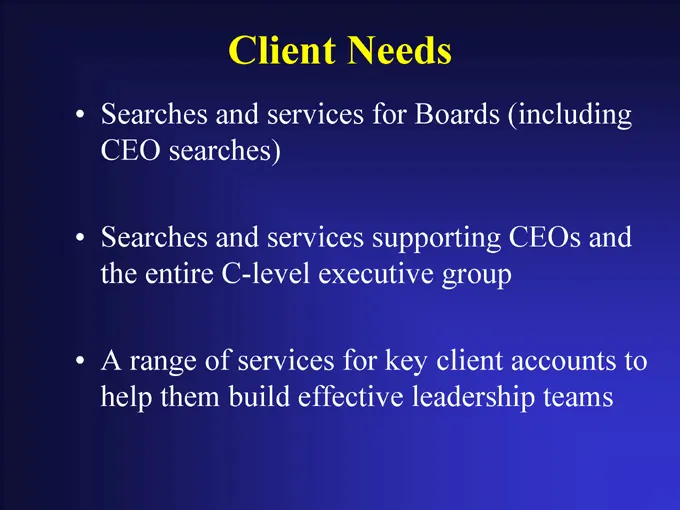
Client Needs Searches and services for Boards (including CEO searches) Searches and services supporting CEOs and the entire C-level executive group A range of services for key client accounts to help them build effective leadership teams
Slide 13: 2004 Investments
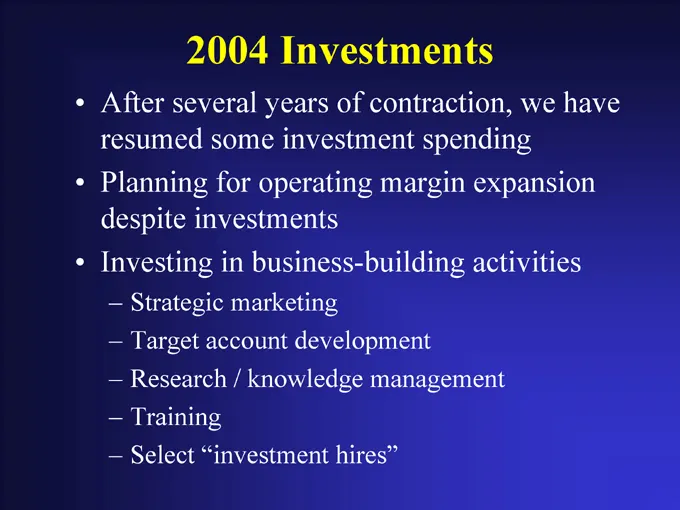
2004 Investments After several years of contraction, we have resumed some investment spending Planning for operating margin expansion despite investments Investing in business-building activities Strategic marketing Target account development Research / knowledge management Training Select “investme
Slide 14: This Is Fundamentally A Growth Business
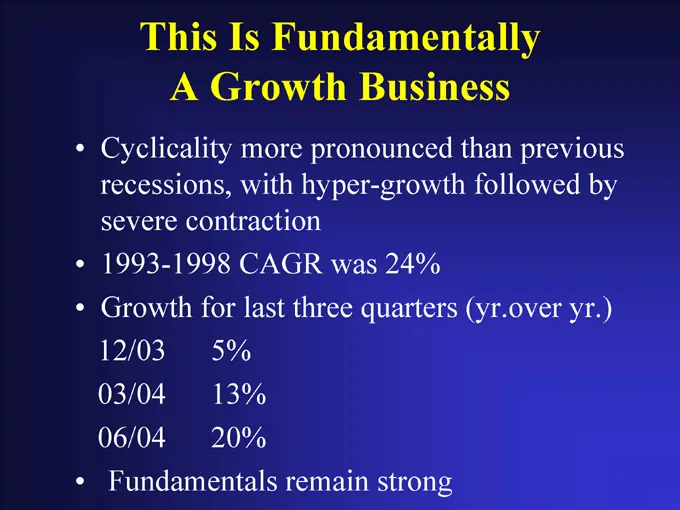
This Is Fundamentally A Growth Business Cyclicality more pronounced than previous recessions, with hyper-growth followed by severe contraction 1993-1998 CAGR was 24% Growth for last three quarters (yr.over yr.) 12/03 5% 03/04 13% 06/04 20% Fundamentals remain strong
Slide 15: Fundamentals Strong
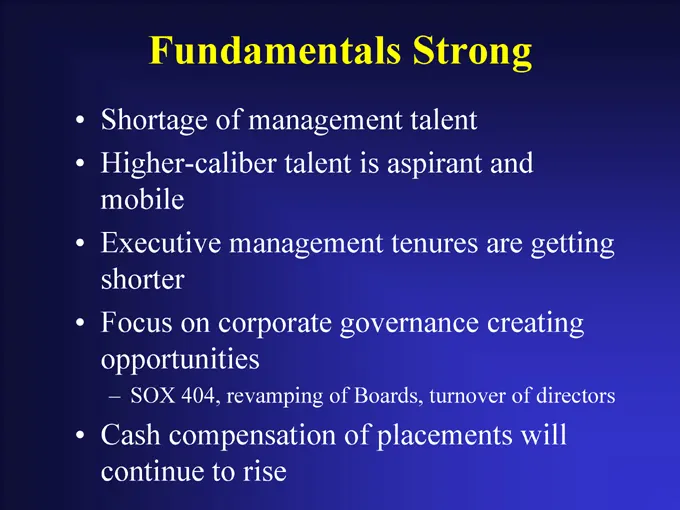
Fundamentals Strong Shortage of management talent Higher-caliber talent is aspirant and mobile Executive management tenures are getting shorter Focus on corporate governance creating opportunities SOX 404, revamping of Boards, turnover of directors Cash compensation of placements will continue to ri

Slide 16: Heidrick & Struggles
HEIDRICK & STRUGGLES

Slide 17: Financial Performance
Financial Performance
Slide 18: Revenue Performance & Consultant Headcount
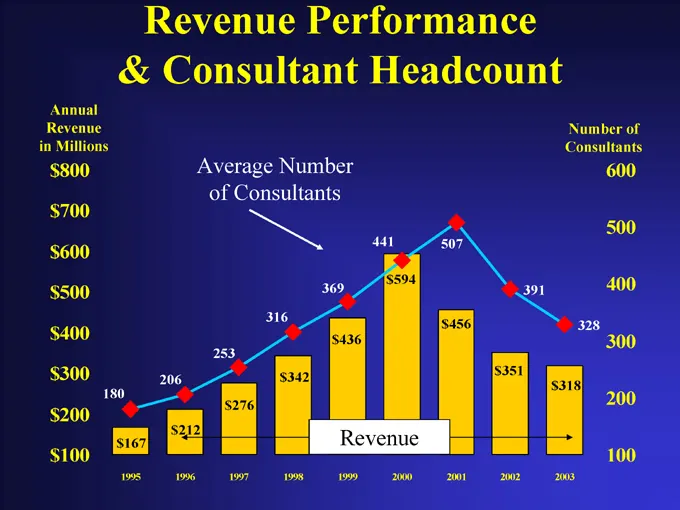
Revenue Performance & Consultant Headcount Average Number of Consultants Annual Revenue in Millions $800 $700 $600 $500 $400 $300 $200 $100 1995 1996 1997 1998 1999 2000 2001 2002 2003 Number of Consultants 600 500 400 300 200 100 328 $167 $212 $276 $342 $436 $594 $456 $351 $318 Revenue
Slide 19: Quarterly Revenue Trends
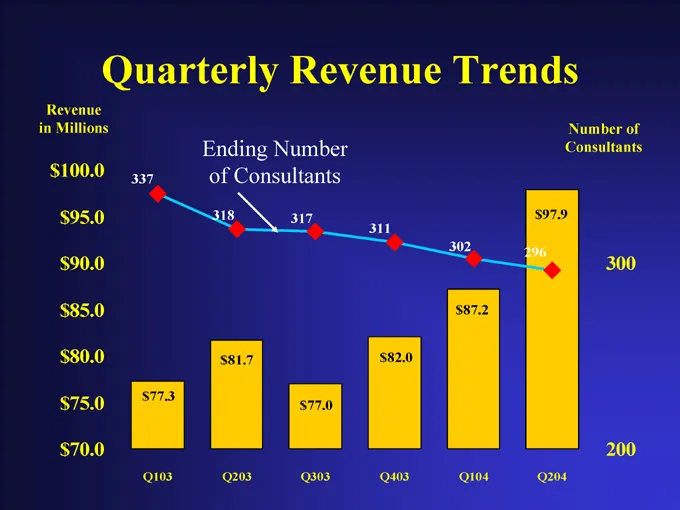
Quarterly Revenue Trends Revenue in Millions $100.0 $95.0 $90.0 $85.0 $80.0 $75.0 $70.0 Q103 Q203 Q303 Q403 Q104 Q204 Number of Consultants Ending Number of Consultants 296 $77.3 $81.7 $77.0 $82.0 $87.2 $97.9
Slide 20: Quarterly Operating Income
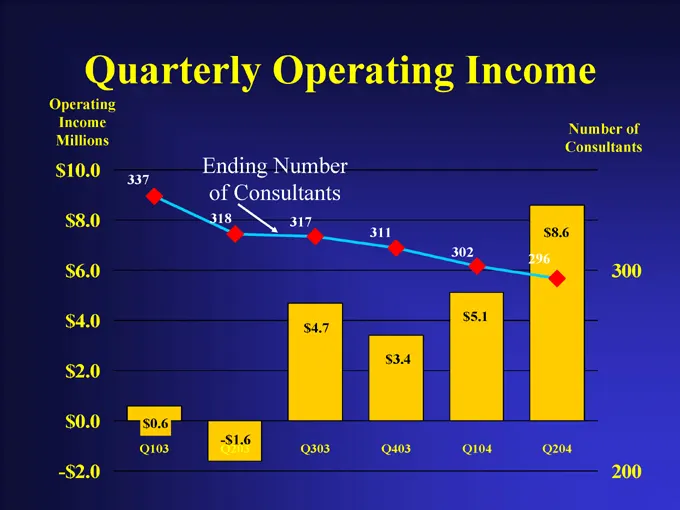
Quarterly Operating Income Operating Income Millions $ 10.0 $ 8.0 $ 6.0 $ 4.0 $ 2.0 $ 0.0 - $ 2.0 Number of Consultants Ending Number of Consultants 296 $0.6 Q103 -$ 1.6 Q203 Q303 Q403 Q104 Q204 $4.7 $3.4 $5.1 300 $8.6
Slide 21: Financial Results
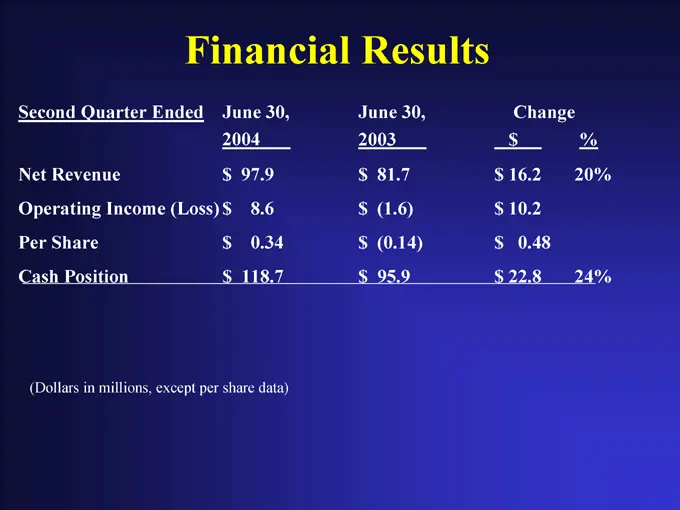
Financial Results Second Quarter Ended June 30, 2004 June 30, 2003 Change $ % Net Revenue $97.9 $81.7 $16.2 20% Operating Income (Loss) $8.6 $(1.6) $10.2 Per Share $0.34 $(0.14) $0.48 Cash Position $118.7 $95.9 $22.8 24% (Dollars in millions, except per share data)
Slide 22: Results By Geography
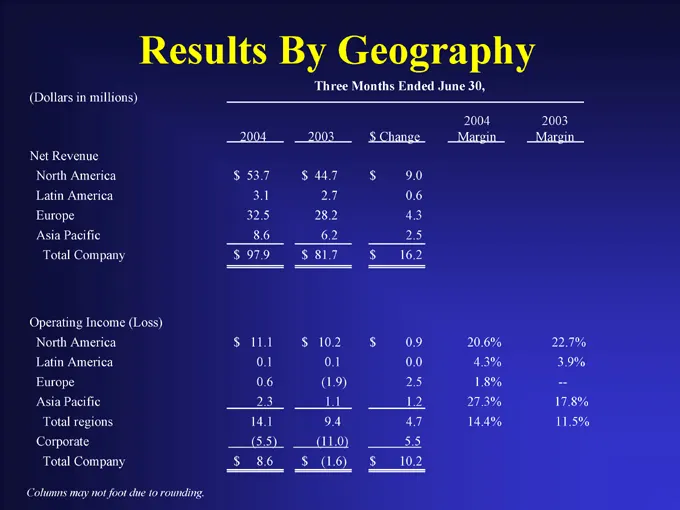
Results By Geography Three Months Ended June 30, (Dollars in millions) 2004 2003 $Change 2004 Margin 2003 Margin Net Revenue North America $53.7 $44.7 $9.0 Latin America 3.1 2.7 0.6 Europe 32.5 28.2 4.3 Asia Pacific 8.6 6.2 2.5 Total Company $97.9 $81.7 $16.2 Operating Income (Loss) North America $1
Slide 23: Strong Balance Sheet
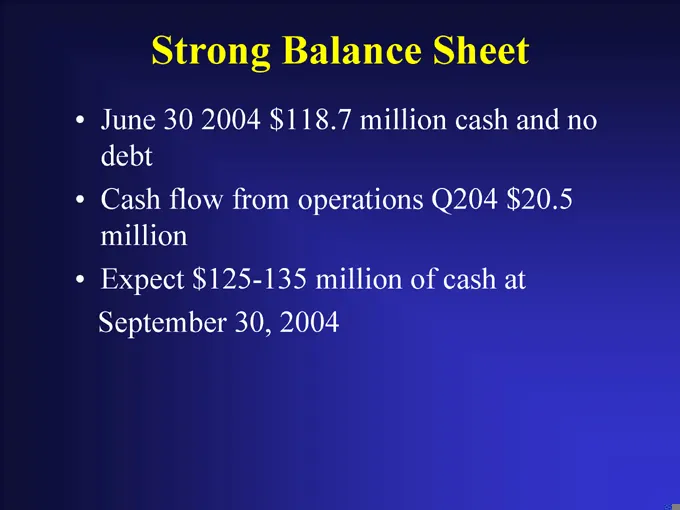
Strong Balance Sheet June 30 2004 $118.7 million cash and no debt Cash flow from operations Q204 $20.5 million Expect $125-135 million of cash at September 30, 2004
Slide 24: Outlook
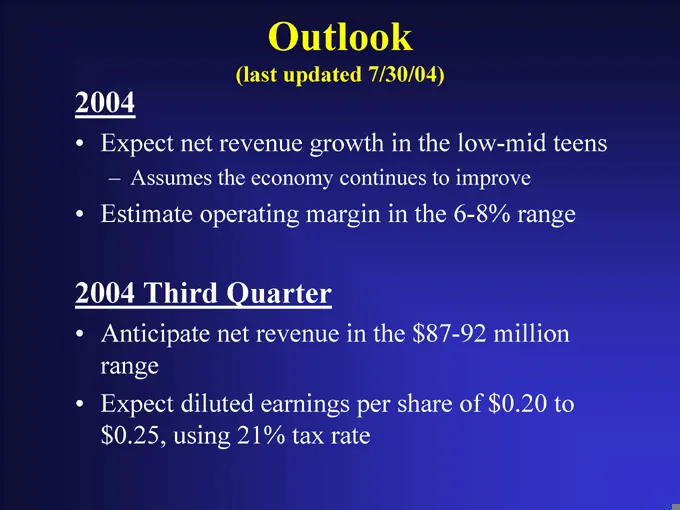
Outlook (last updated 7/30/04) 2004 Expect net revenue growth in the low-mid teens Assumes the economy continues to improve Estimate operating margin in the 6-8% range 2004 Third Quarter Anticipate net revenue in the $87-92 million range Expect diluted earnings per share of $0.20 to $0.25, using 21%
Slide 25: Summary
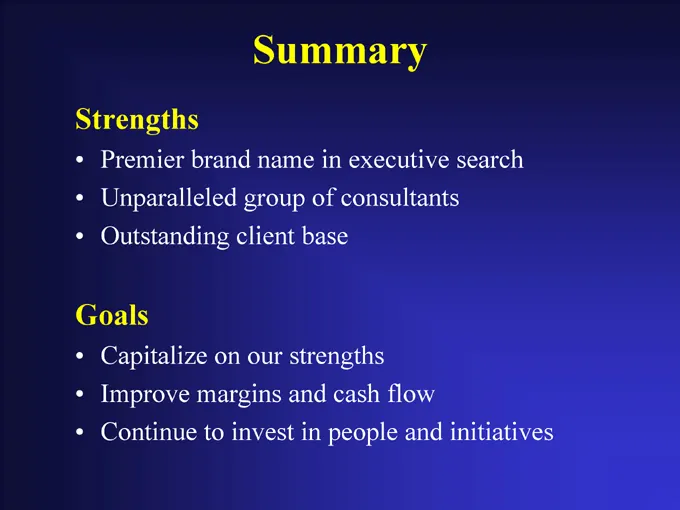
Summary Strengths Premier brand name in executive search Unparalleled group of consultants Outstanding client base Goals Capitalize on our strengths Improve margins and cash flow Continue to invest in people and initiatives

Slide 26: Heidrick & Struggles
HEIDRICK & STRUGGLES
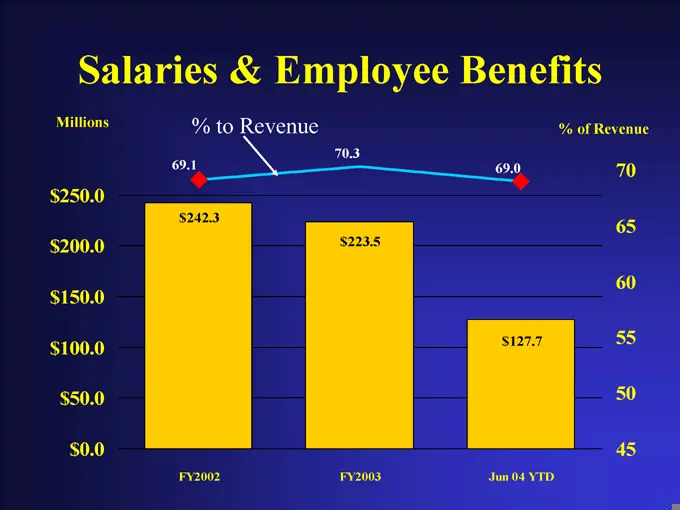
Slide 27: Salaries & Employee Benefits
Salaries & Employee Benefits Millions % to Revenue % of Revenue $250.0 $200.0 $150.0 $100.0 $50.0 $0.0 69.1 70.3 69.0 $242.3 $223.5 $127.7 FY2002 FY2003 Jun 04 YTD 70 65 60 55 50 45
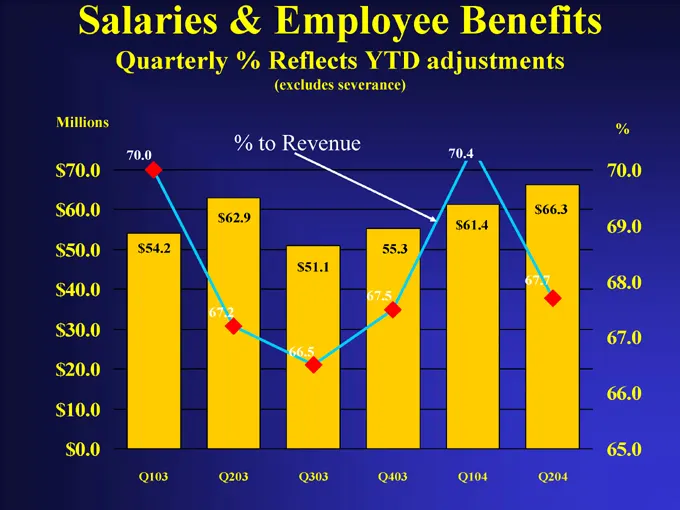
Slide 28: Salaries & Employee Benefits
Salaries & Employee Benefits Quarterly % Reflects YTD adjustments (excludes severance) Millions $70.0 $60.0 $50.0 $40.0 $30.0 $20.0 $10.0 $0.0 % to Revenue 70.4 70.0 67.2 66.5 67.5 67.7 $54.2 Q103 $62.9 Q203 $51.1 Q303 55.3 Q403 $61.4 Q104 $66.3 Q204 % 70.0 69.0 68.0 67.0 66.0 65.0
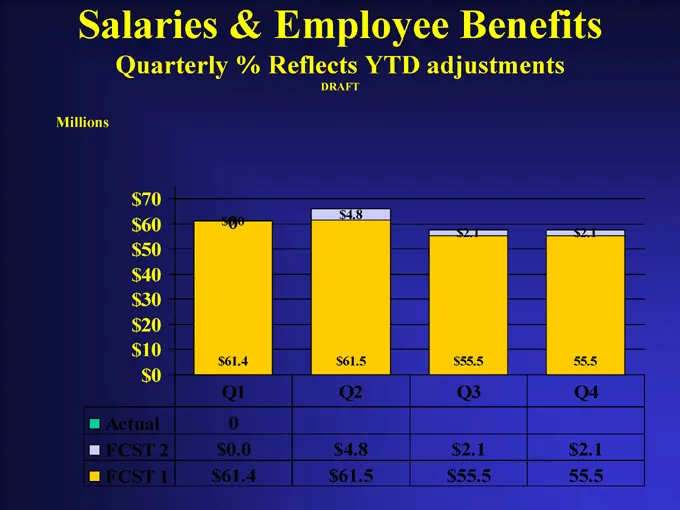
Slide 29: Salaries & Employee Benefits
Salaries & Employee Benefits Quarterly % Reflects YTD adjustments DRAFT Millions $70 $60 $50 $40 $30 $20 $10 $0 $0.0 $4.8 $2.1 $2.1 $61.4 $61.5 $55.5 55.5 Q1 Q2 Q3 Q4 Actual 0 FCST 2 $0.0 $4.8 $2.1 $2.1 FCST 1 $61.4 $61.5 $55.5 55.5
Source: SEC EDGAR · 8-K filed Aug 5, 2004
More decks from Heidrick & Struggles International
 Q1 2025 Earnings Presentation20 slides · May 5, 2025
 Q4 2024 Earnings Presentation26 slides · Mar 3, 2025
 Investor Day (December 2024)68 slides · Dec 3, 2024
 Q3 2024 Earnings Presentation24 slides · Nov 4, 2024
 Q2 2024 Earnings Presentation25 slides · Jul 29, 2024
 Q1 2024 Earnings Presentation25 slides · May 6, 2024