Heidrick & Struggles International
Heidrick & Struggles International — Q1 2024 Earnings Presentation
25 slides from Heidrick & Struggles International's earnings presentation, May 6, 2024
Slide 1: First Quarter 2024 Results
First Quarter 2024 Results May 6, 2024
Slide 2: Cautionary Statement Regarding Forward-Looking Information
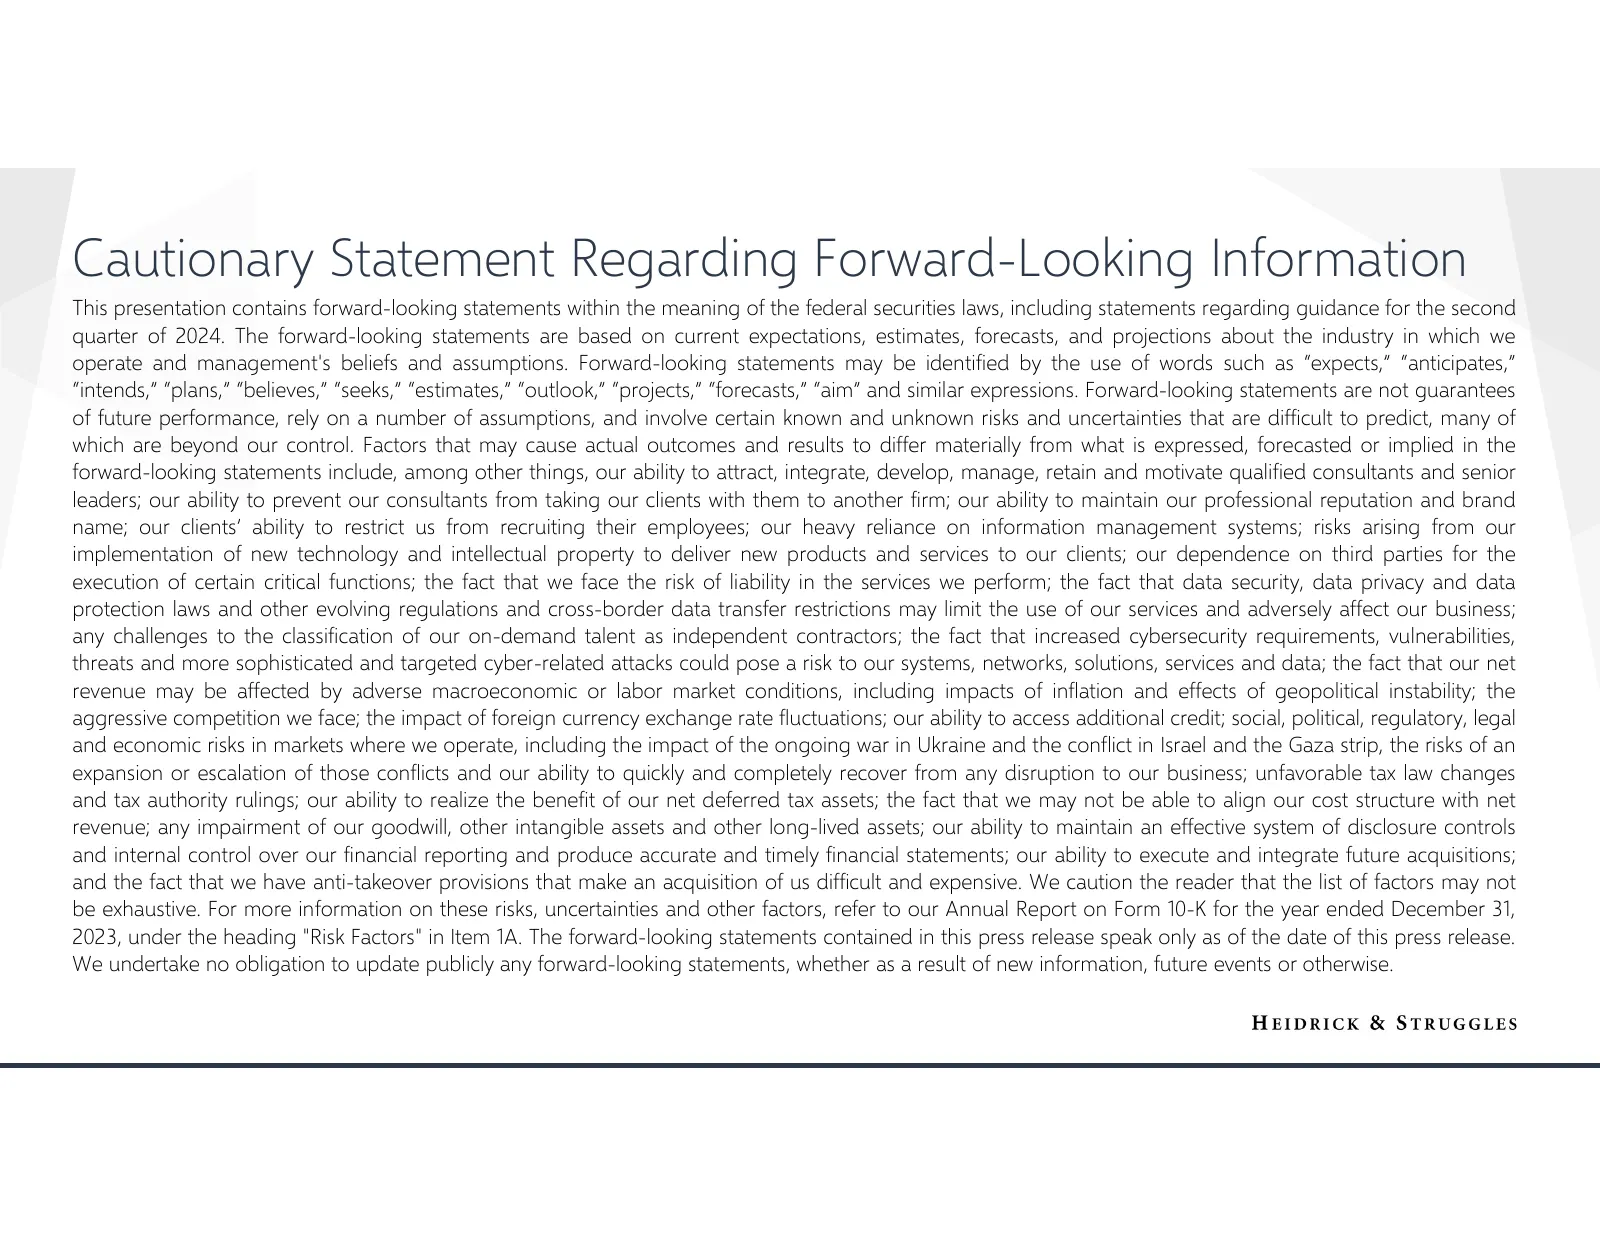
Cautionary Statement Regarding Forward-Looking Information This presentation contains forward-looking statements within the meaning of the federal securities laws, including statements regarding guidance for the second quarter of 2024. The forward-looking statements are based on current expectations
Slide 3: Non-GAAP Financial Measures & Currency Presentation
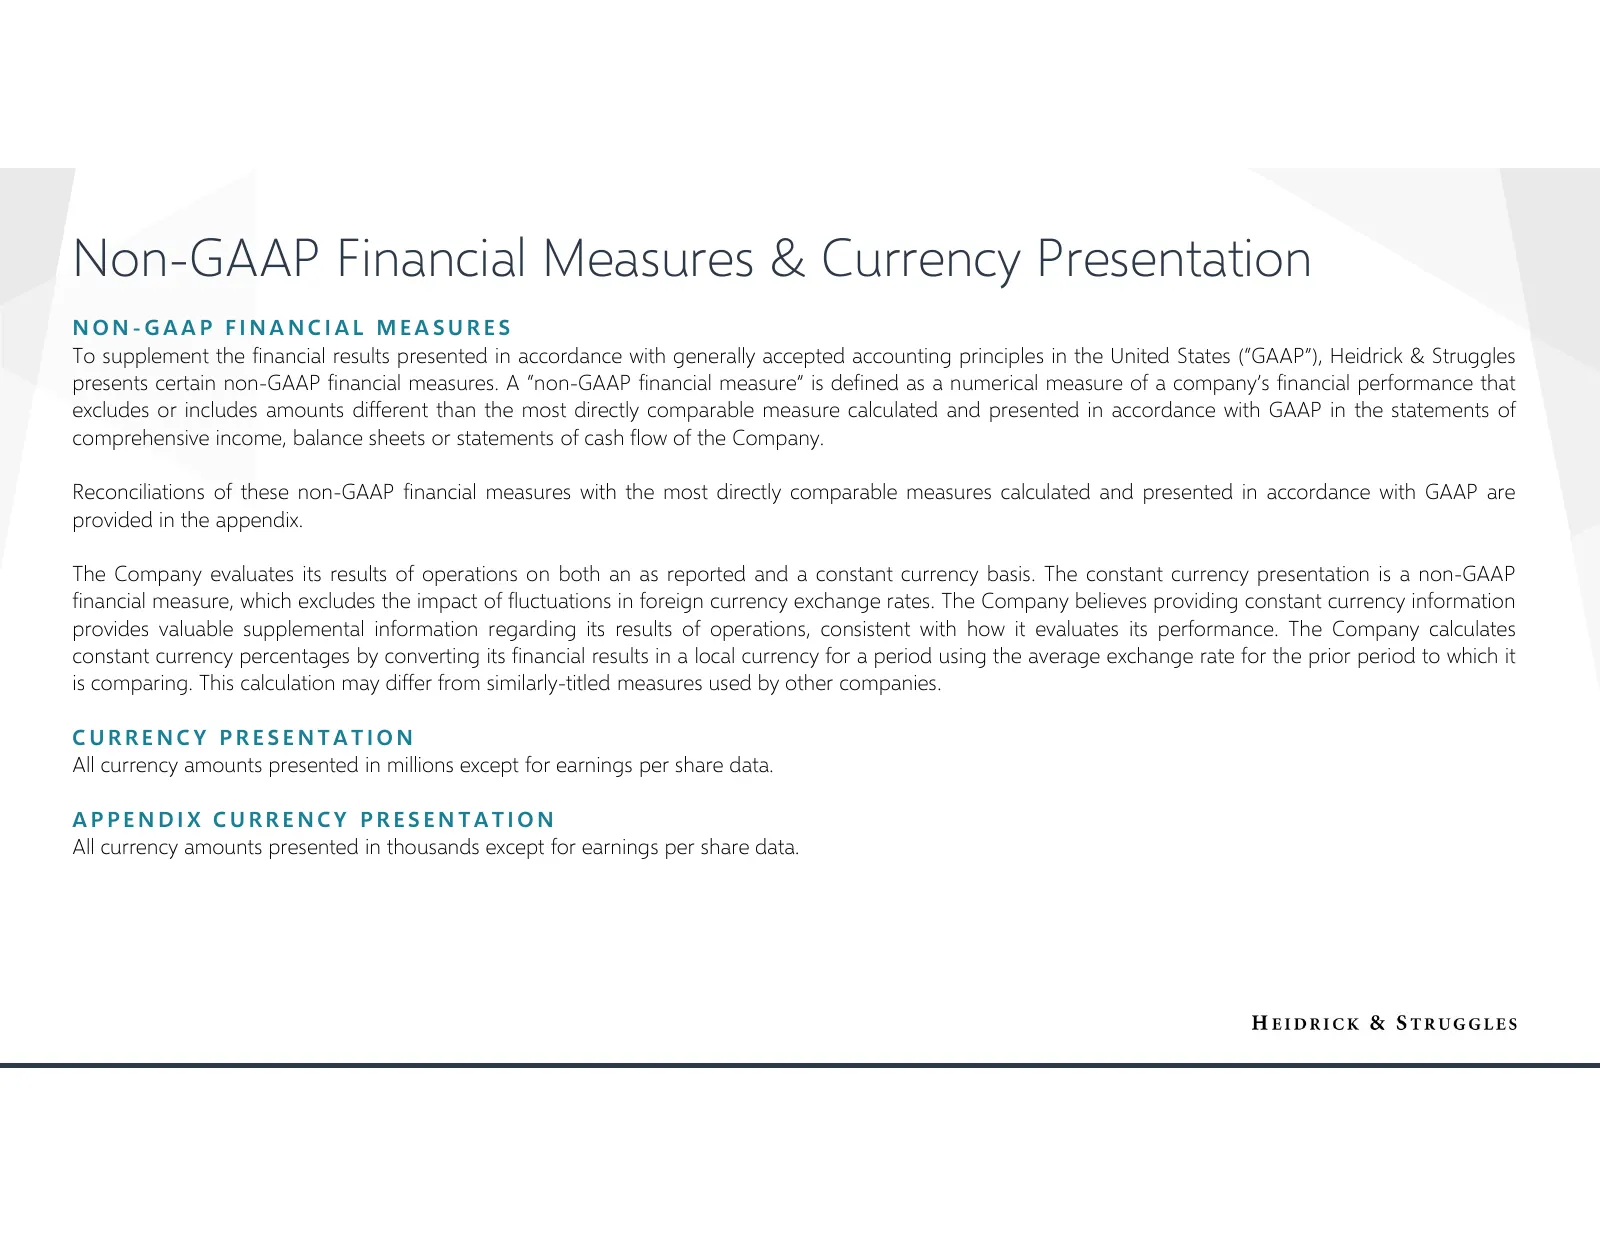
Non-GAAP Financial Measures & Currency Presentation NON-GAAP FINANCIAL MEASURES To supplement the financial results presented in accordance with generally accepted accounting principles in the United States (“GAAP”), Heidrick & Struggles presents certain non-GAAP financial measures. A “non-GAAP fina

Slide 4: Overview
Overview
Slide 5: Our Purpose & Vision
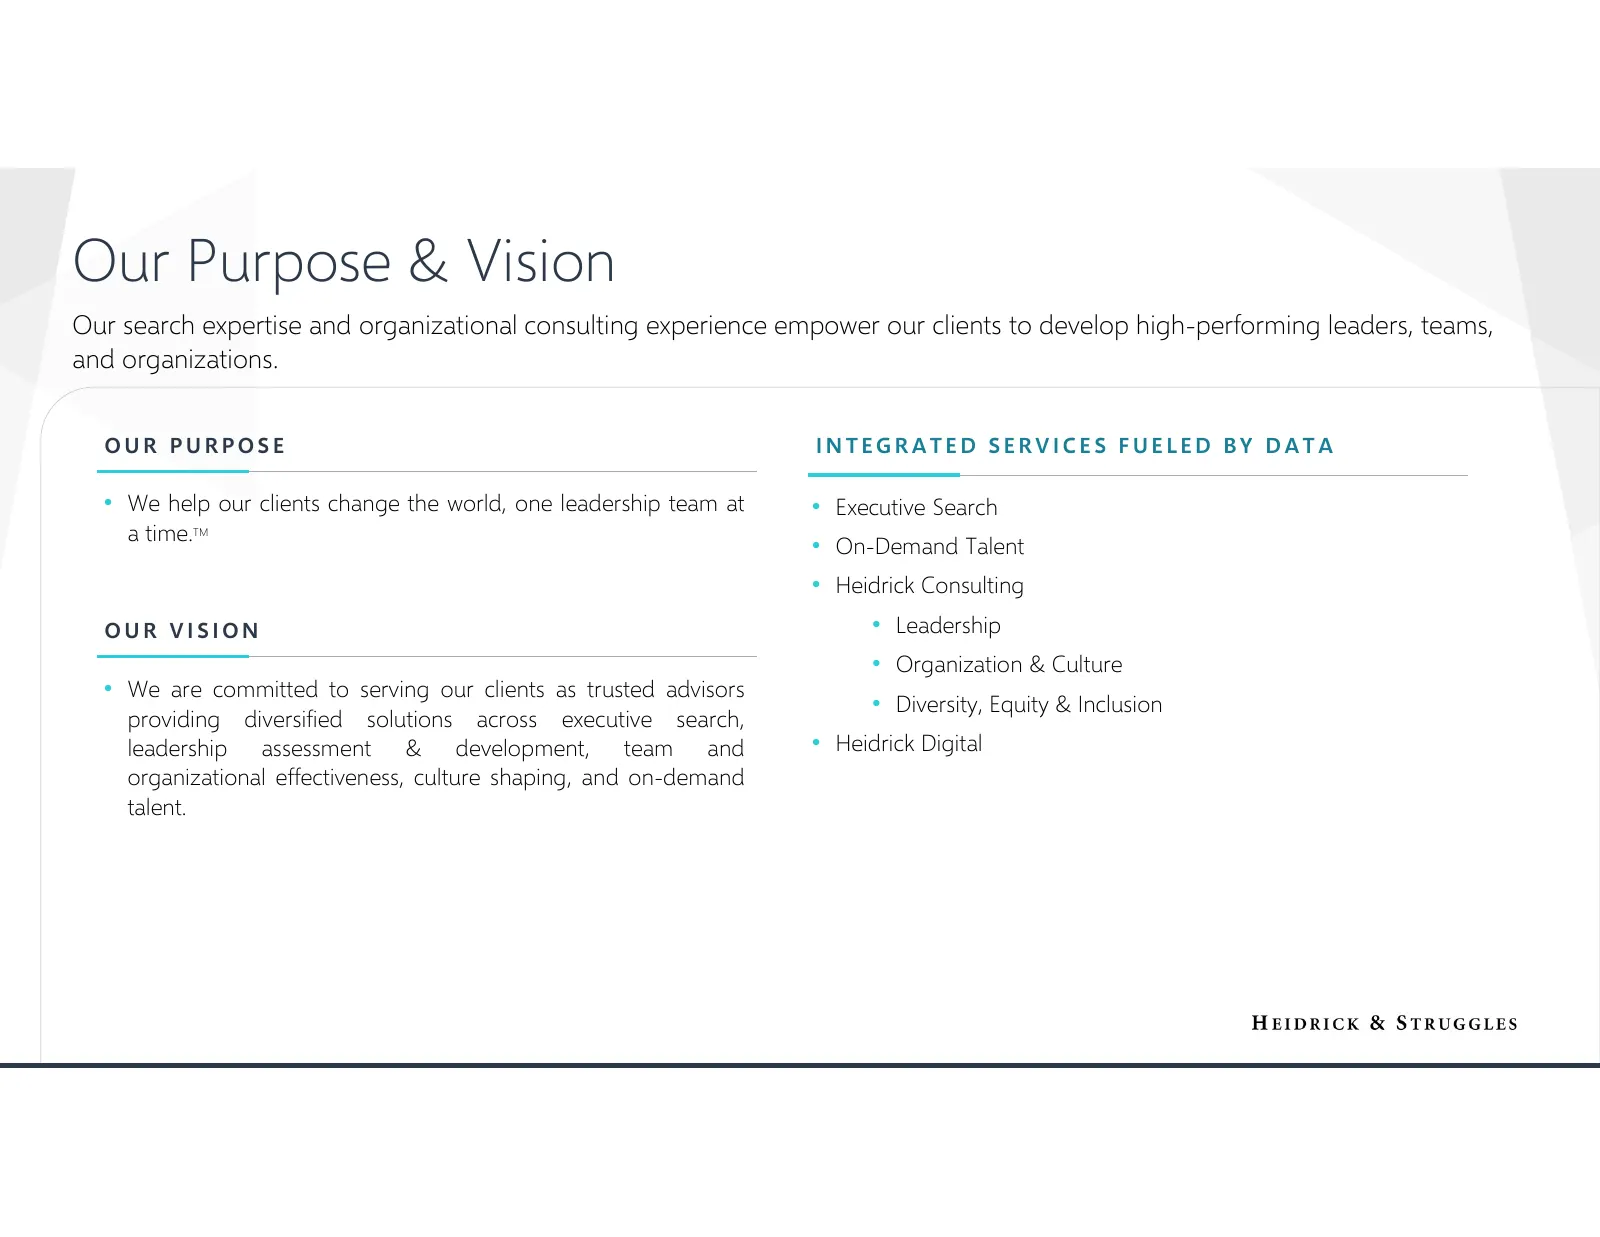
Our Purpose & Vision Our search expertise and organizational consulting experience empower our clients to develop high-performing leaders, teams, and organizations. OUR PURPOSE INTEGRATED SERVICES FUELED BY DATA • We help our clients change the world, one leadership team at • Executive Search a time
Slide 6: Financial Highlights
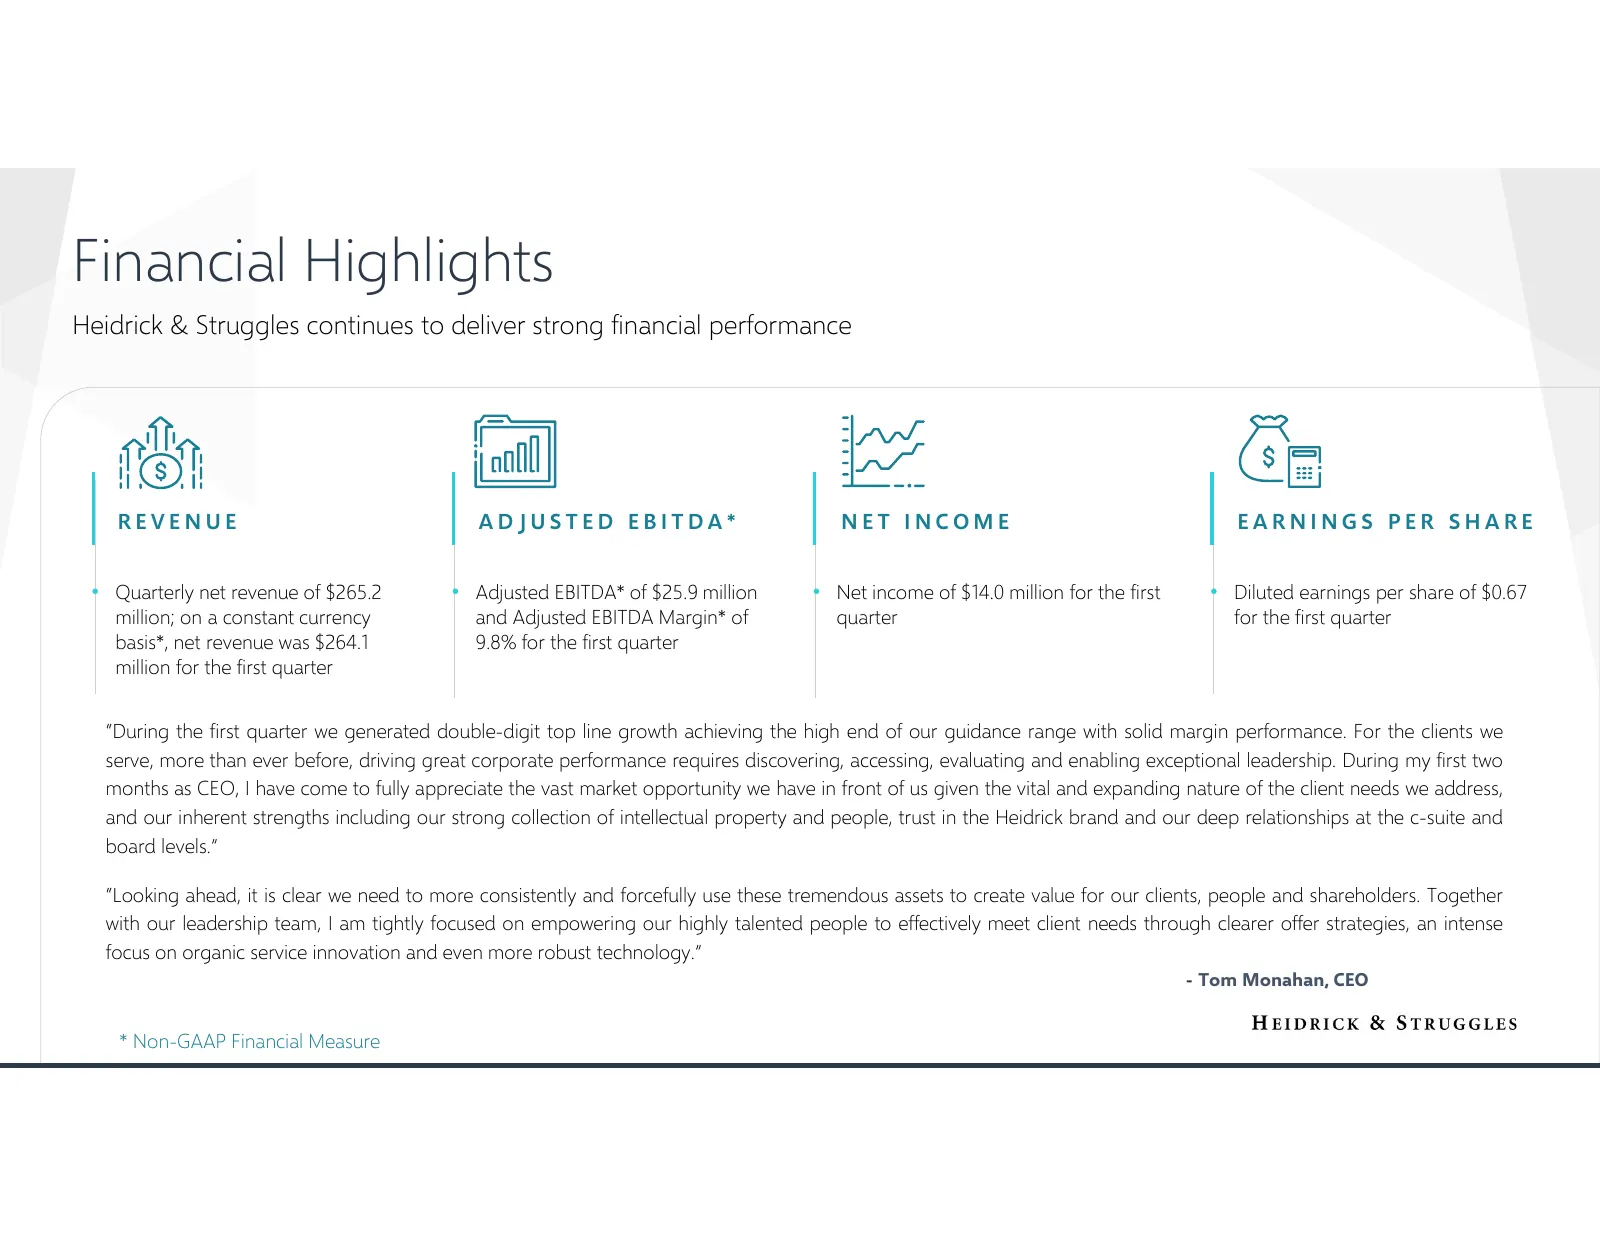
Financial Highlights Heidrick & Struggles continues to deliver strong financial performance REVENUE ADJUSTED EBITDA* NET INCOME EARNINGS PER SHARE • Quarterly net revenue of $265.2 • Adjusted EBITDA* of $25.9 million • Net income of $14.0 million for the first • Diluted earnings per share of $0.67 m
Slide 7: Diversification Drives Growth
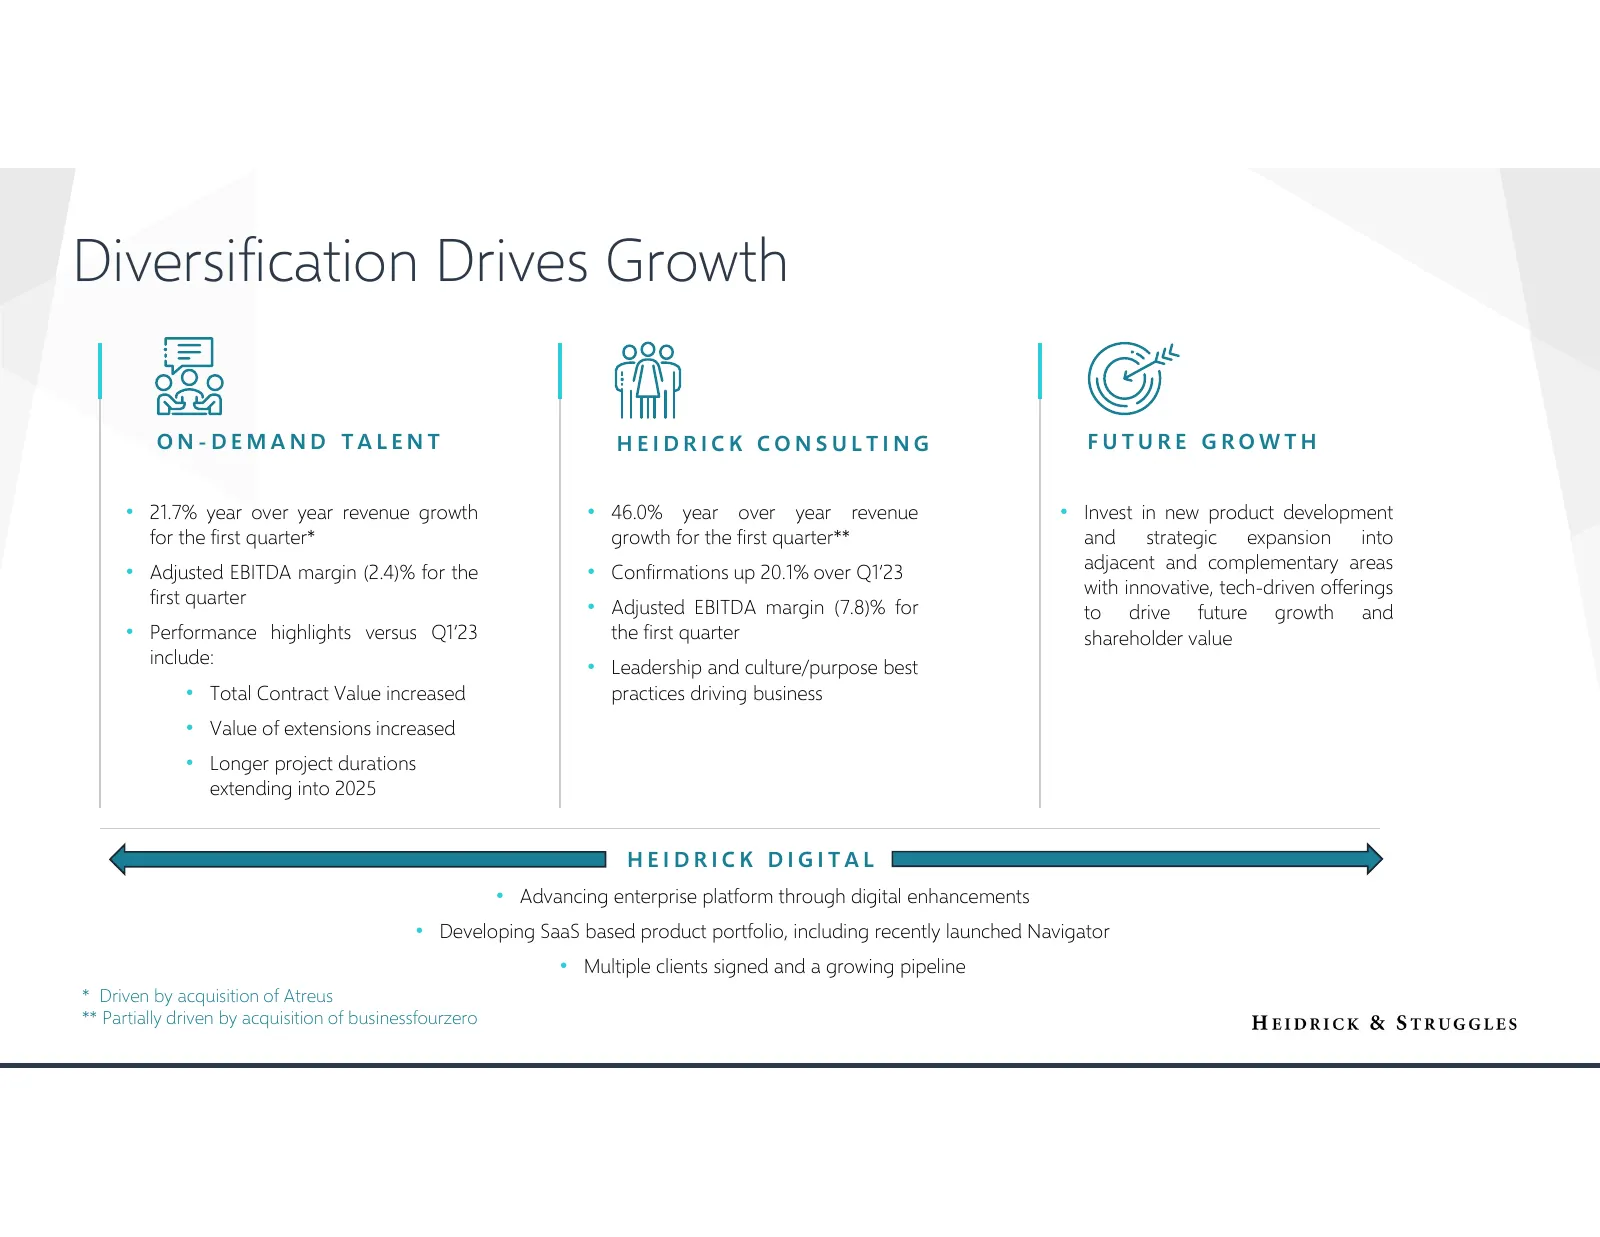
Diversification Drives Growth ON-DEMAND TALENT HEIDRICK CONSULTING FUTURE GROWTH • 21.7% year over year revenue growth • 46.0% year over year revenue • Invest in new product development for the first quarter* growth for the first quarter** and strategic expansion into • Adjusted EBITDA margin (2.4)%
Slide 8: Investing in Diversified Expansion Platform
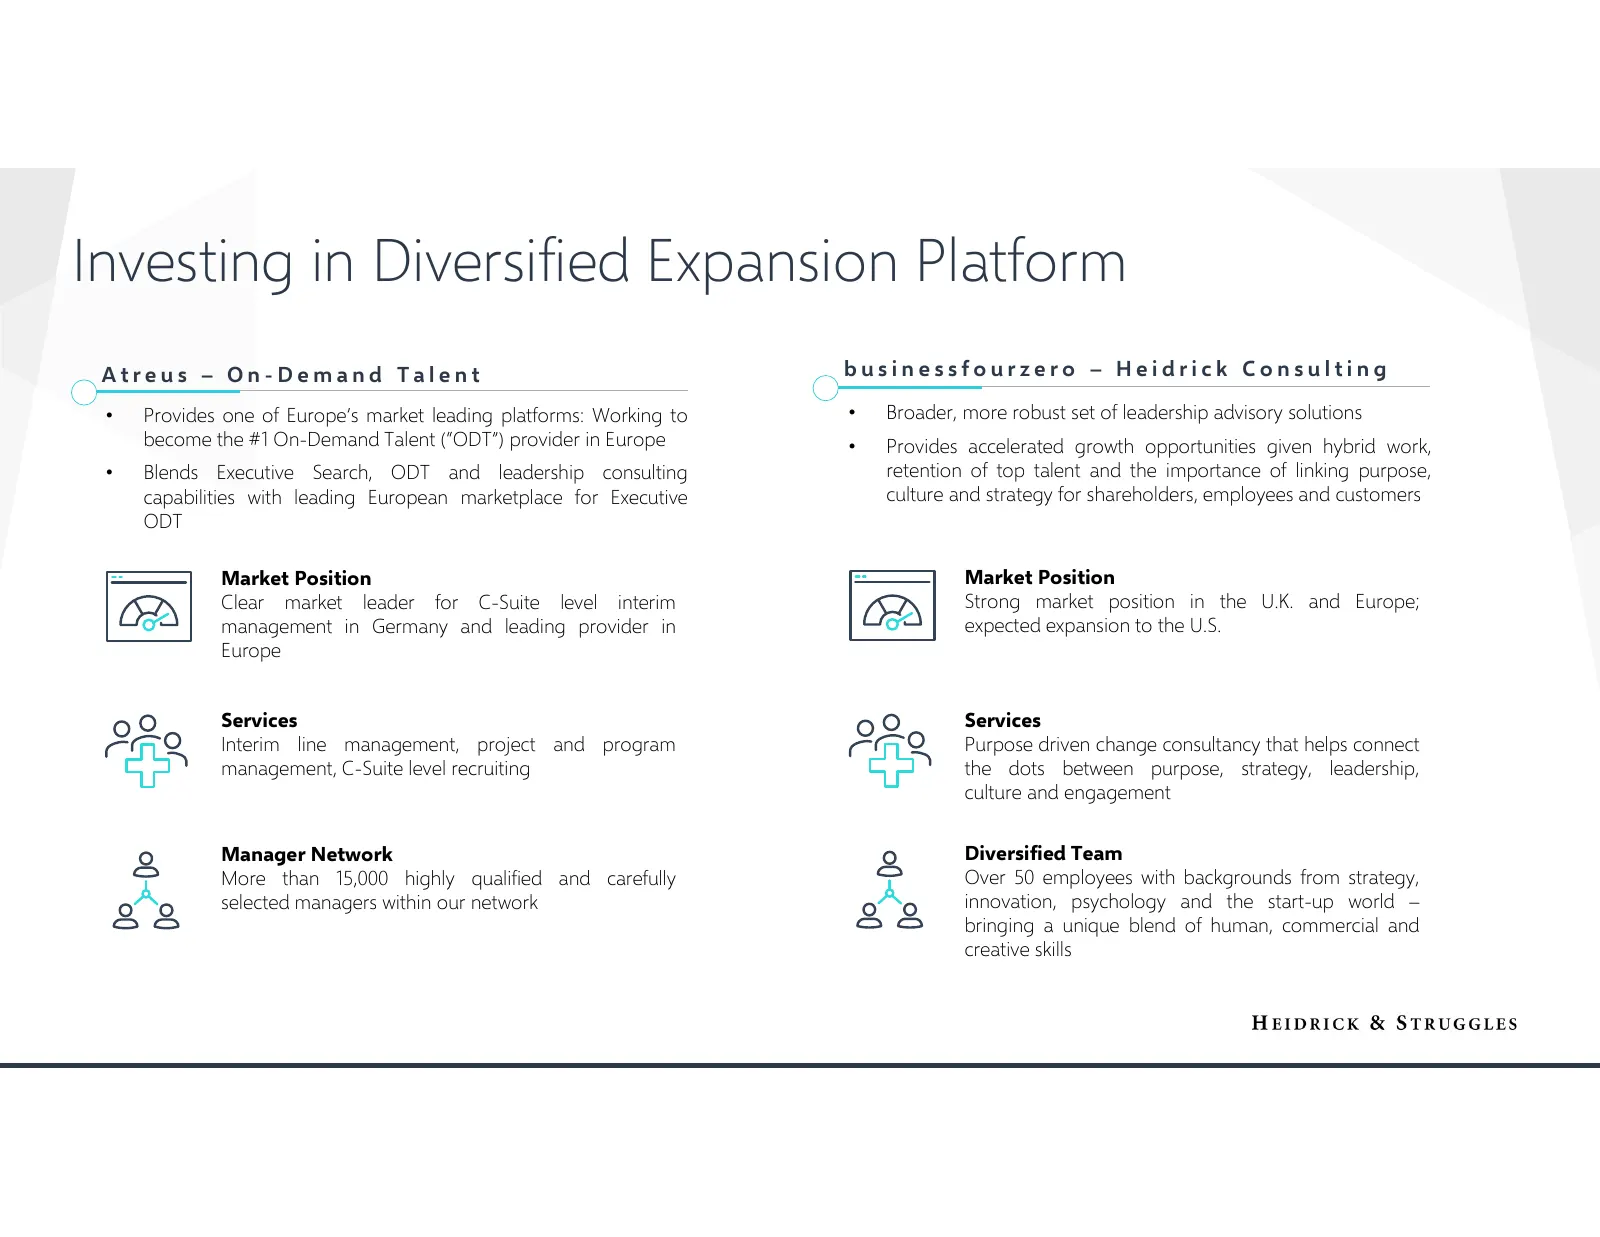
Investing in Diversified Expansion Platform Atreus – On-Demand Talent businessfourzero – Heidrick Consulting • Provides one of Europe’s market leading platforms: Working to • Broader, more robust set of leadership advisory solutions become the #1 On-Demand Talent (“ODT”) provider in Europe • Provide
Slide 9: Long-Term Objectives
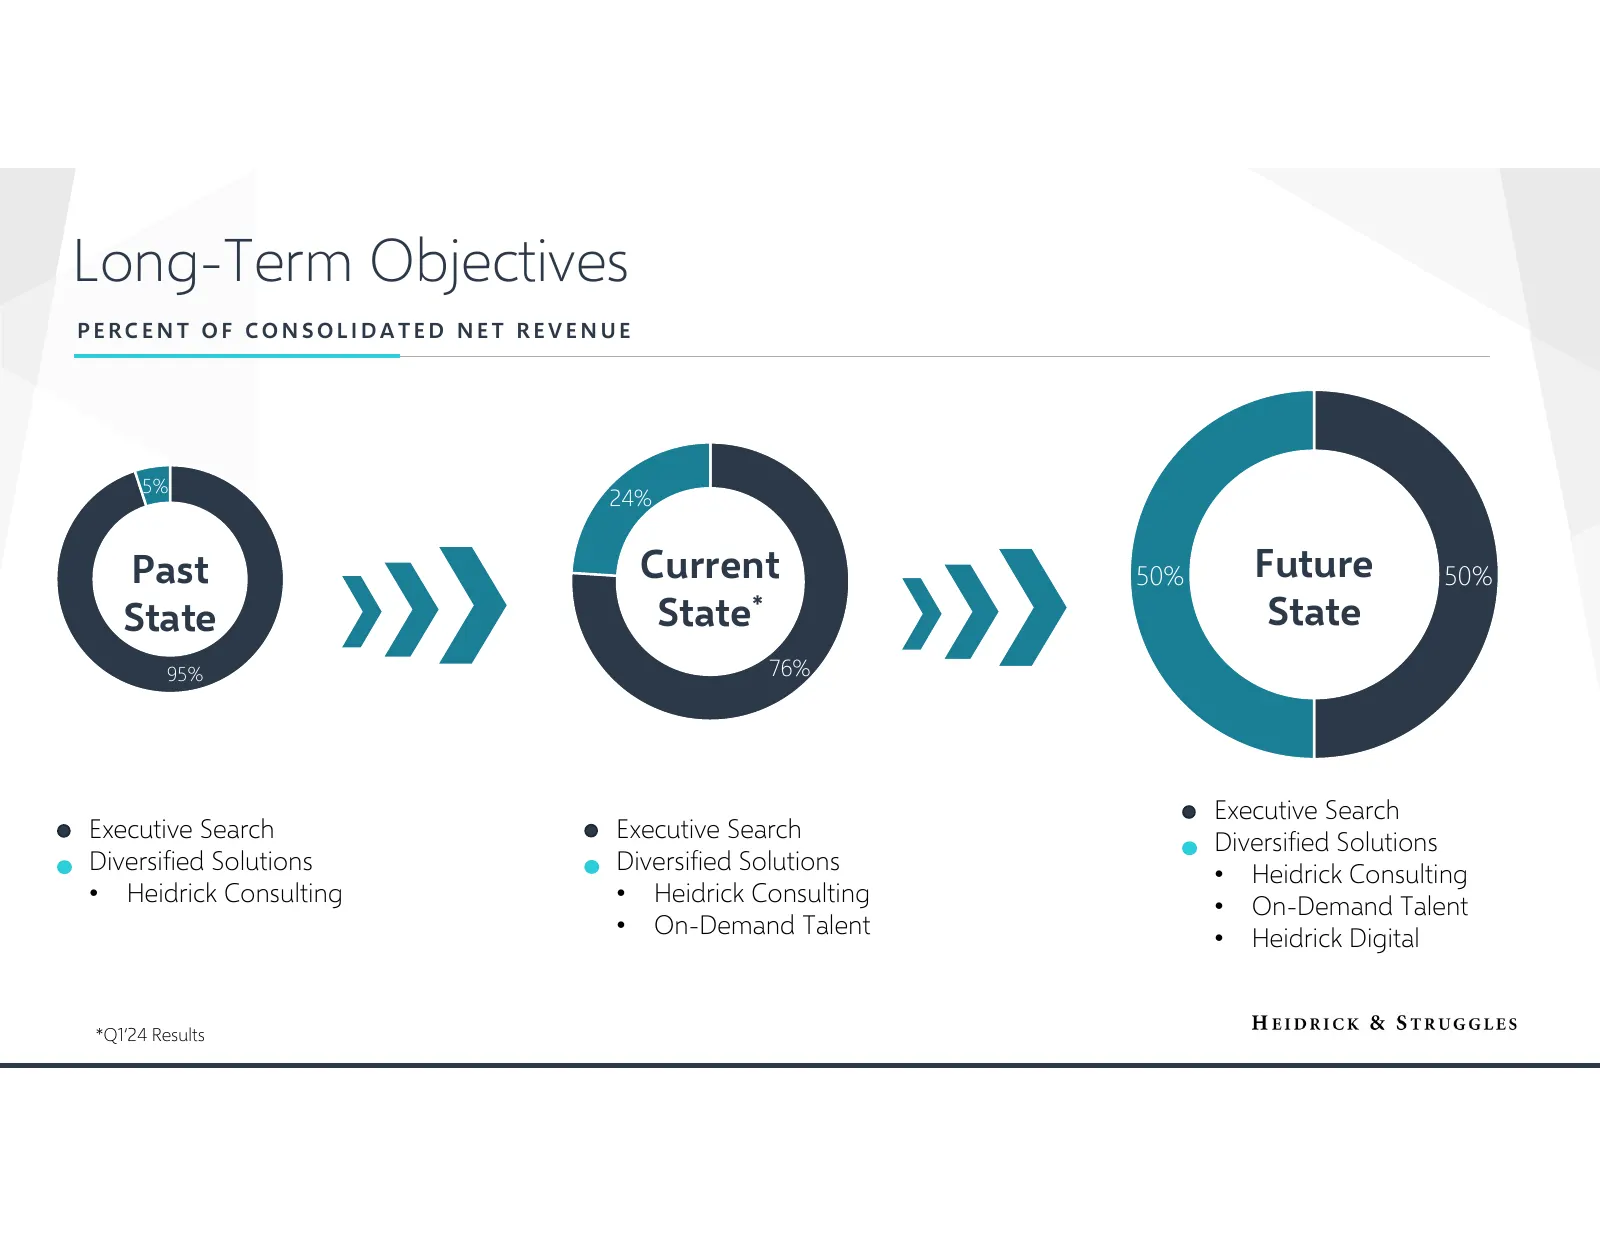
Long-Term Objectives PERCENT OF CONSOLIDATED NET REVENUE 5% 24% Past Current 50% Future 50% State State* State 95% 76% Executive Search Executive Search Executive Search Diversified Solutions Diversified Solutions Diversified Solutions • Heidrick Consulting • Heidrick Consulting • Heidrick Consultin
Slide 10: Consolidated Results
Consolidated Results
Slide 11: Consolidated Financial Highlights
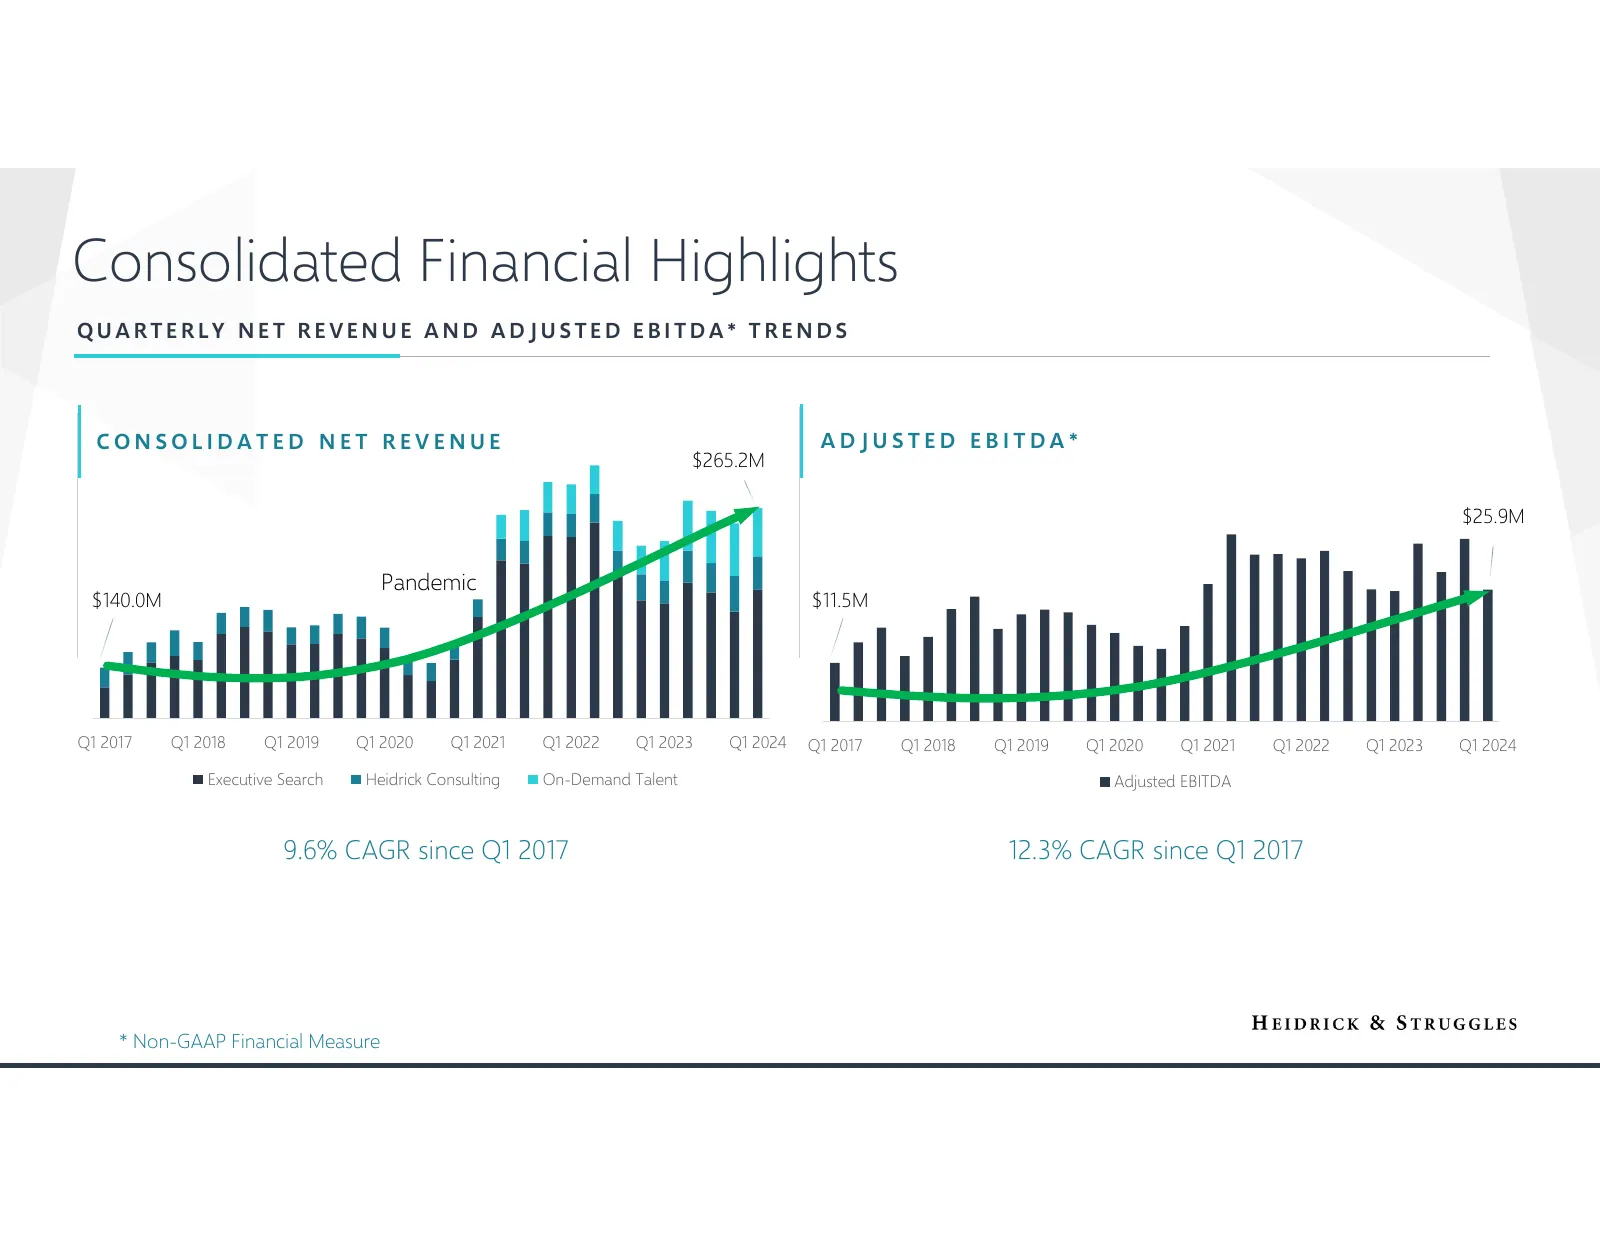
Consolidated Financial Highlights QUARTERLY NET REVENUE AND ADJUSTED EBITDA* TRENDS CONSOLIDATED NET REVENUE ADJUSTED EBITDA* $265.2M $25.9M Pandemic $140.0M $11.5M Q1 2017 Q1 2018 Q1 2019 Q1 2020 Q1 2021 Q1 2022 Q1 2023 Q1 2024 Q1 2017 Q1 2018 Q1 2019 Q1 2020 Q1 2021 Q1 2022 Q1 2023 Q1 2024 Executi
Slide 12: Consolidated Financial Highlights
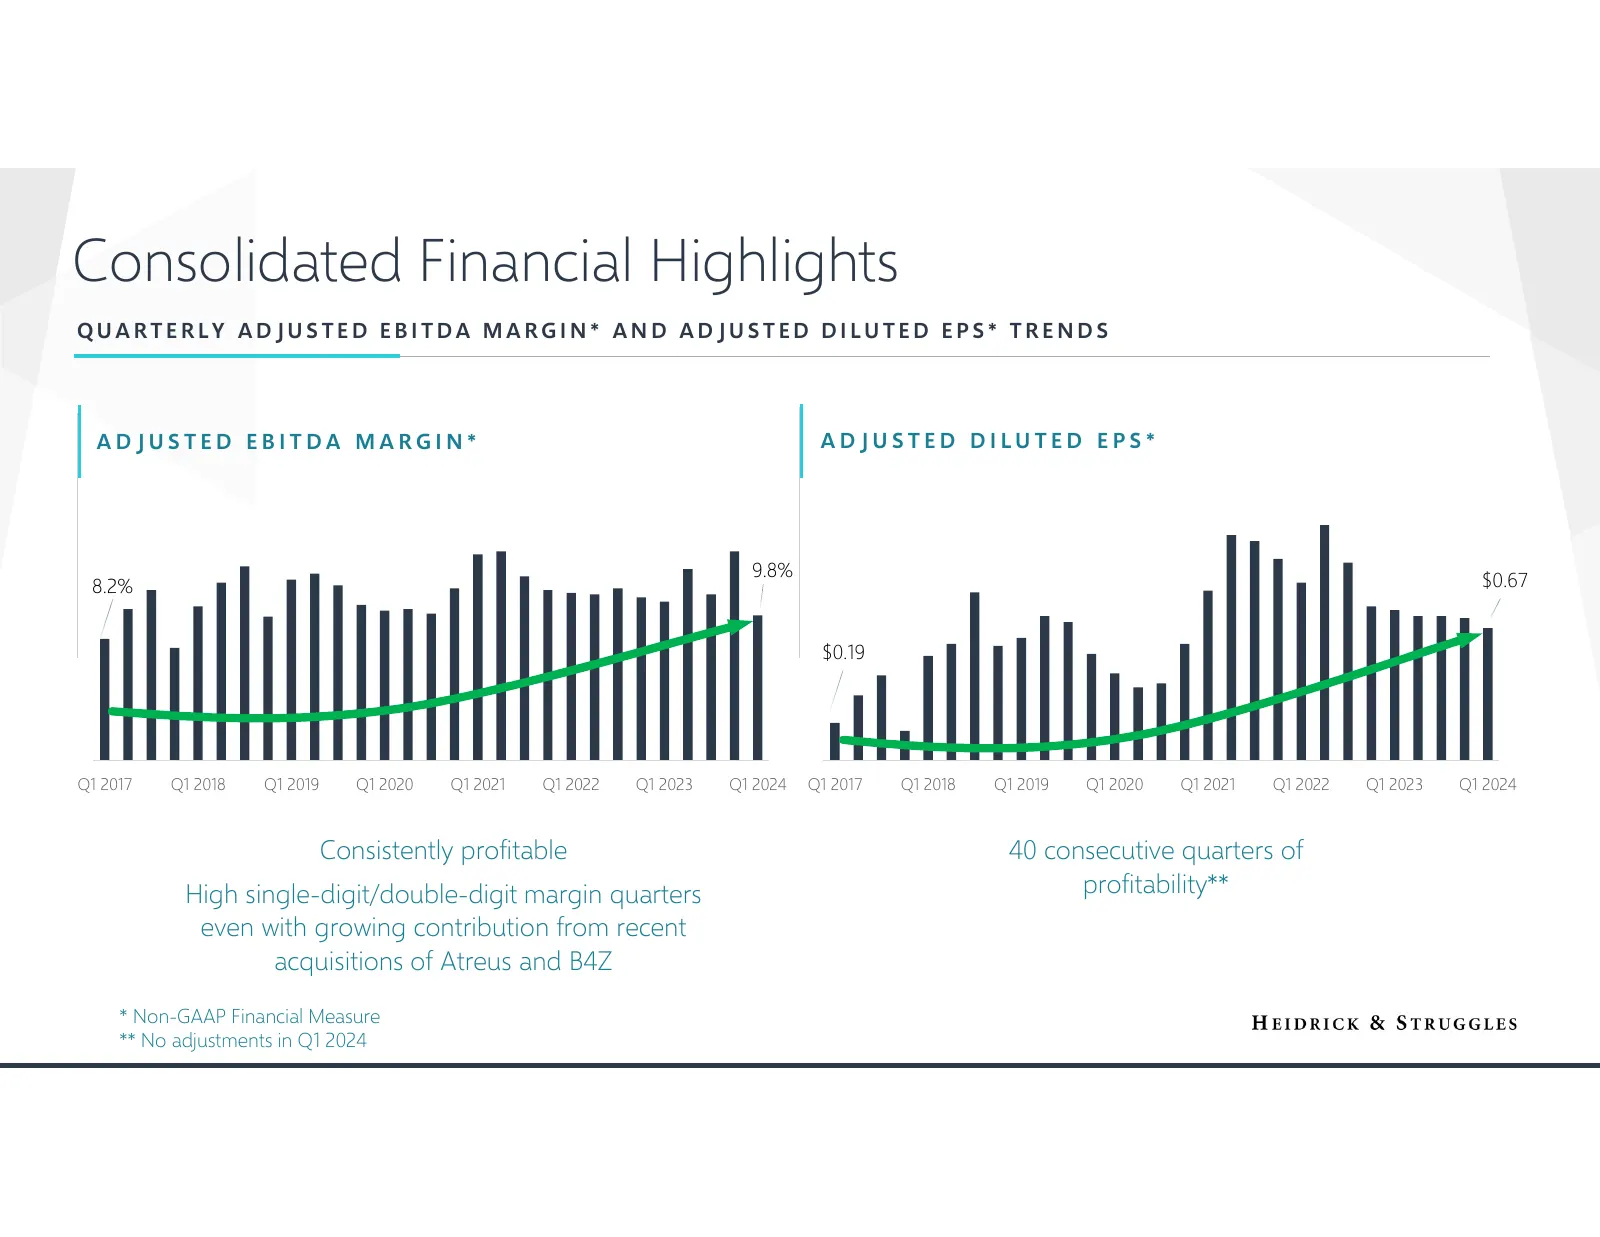
Consolidated Financial Highlights QUARTERLY ADJUSTED EBITDA MARGIN* AND ADJUSTED DILUTED EPS* TRENDS ADJUSTED EBITDA MARGIN* ADJUSTED DILUTED EPS* 9.8% $0.67 8.2% $0.19 Q1 2017 Q1 2018 Q1 2019 Q1 2020 Q1 2021 Q1 2022 Q1 2023 Q1 2024 Q1 2017 Q1 2018 Q1 2019 Q1 2020 Q1 2021 Q1 2022 Q1 2023 Q1 2024 Con
Slide 13: Executive Search Results
Executive Search Results
Slide 14: Executive Search Financial Highlights
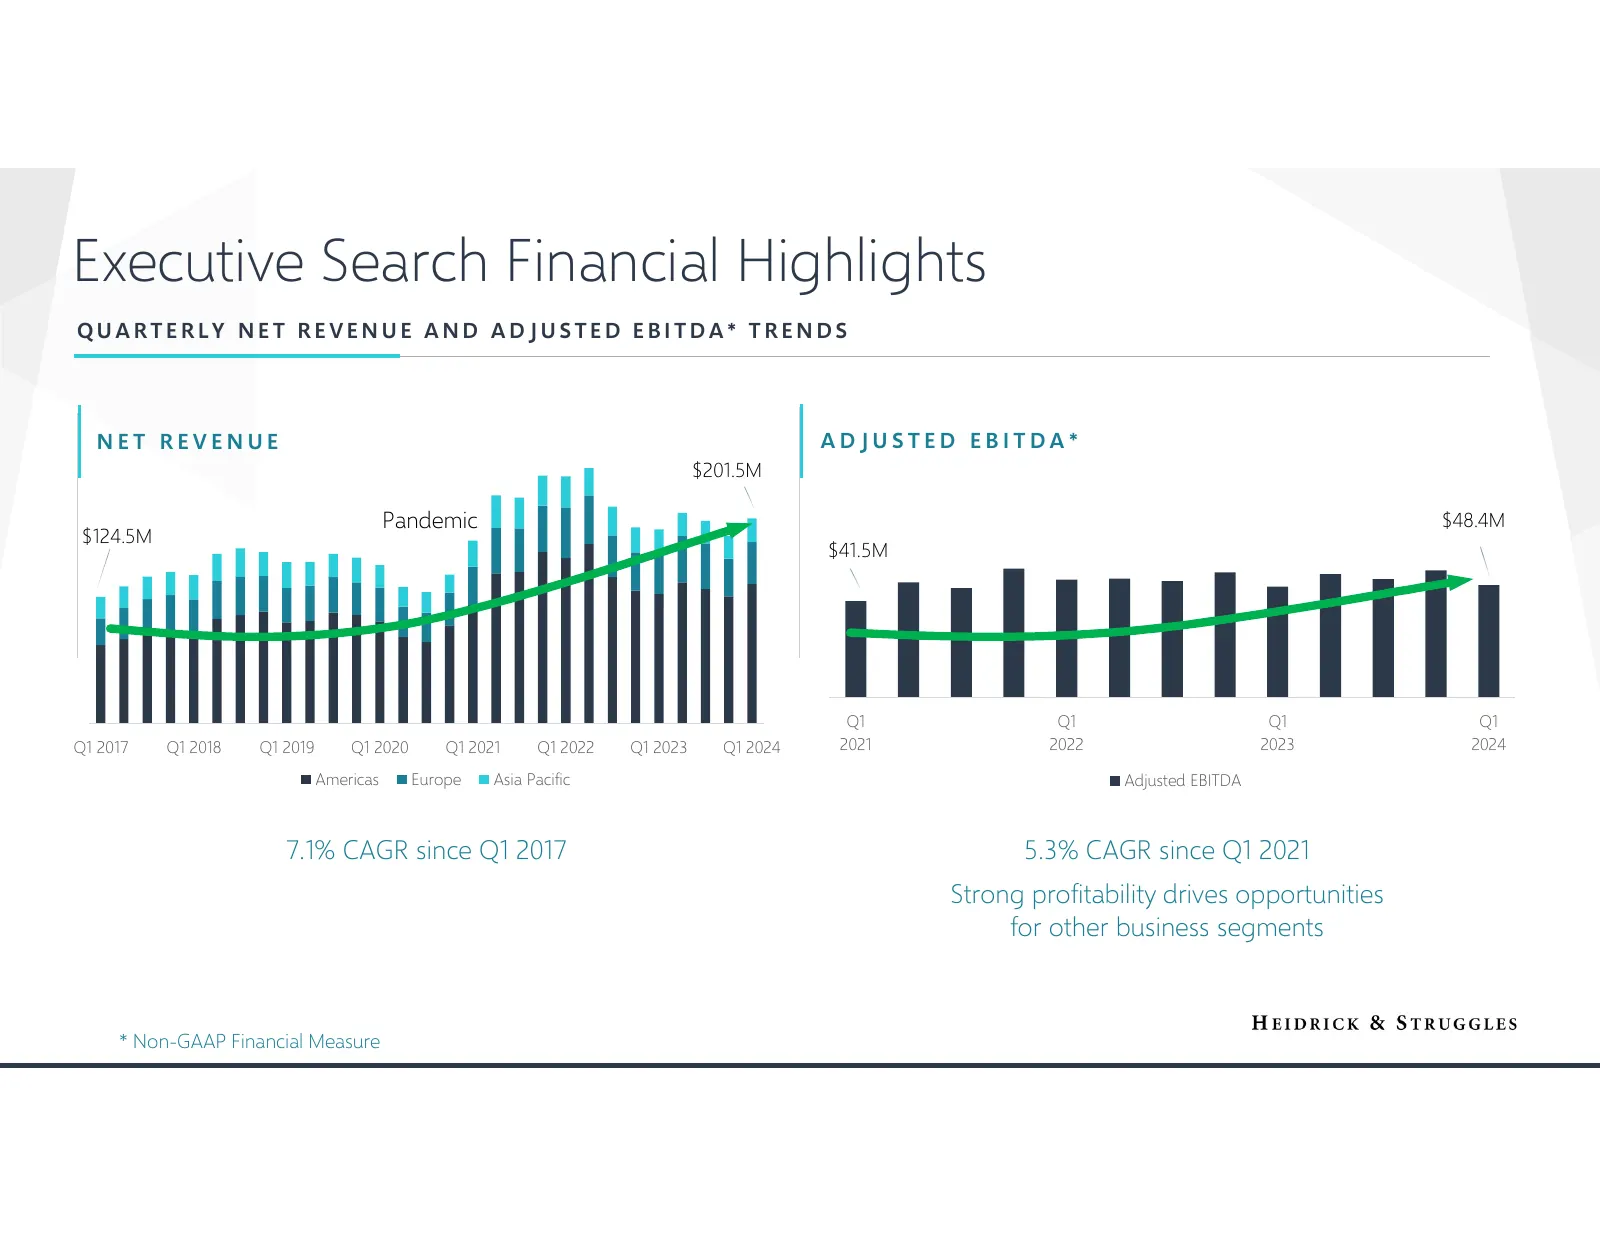
Executive Search Financial Highlights QUARTERLY NET REVENUE AND ADJUSTED EBITDA* TRENDS NET REVENUE ADJUSTED EBITDA* $201.5M Pandemic $48.4M $124.5M $41.5M Q1 Q1 Q1 Q1 Q1 2017 Q1 2018 Q1 2019 Q1 2020 Q1 2021 Q1 2022 Q1 2023 Q1 2024 2021 2022 2023 2024 Americas Europe Asia Pacific Adjusted EBITDA 7.1
Slide 15: Executive Search Operational Highlights
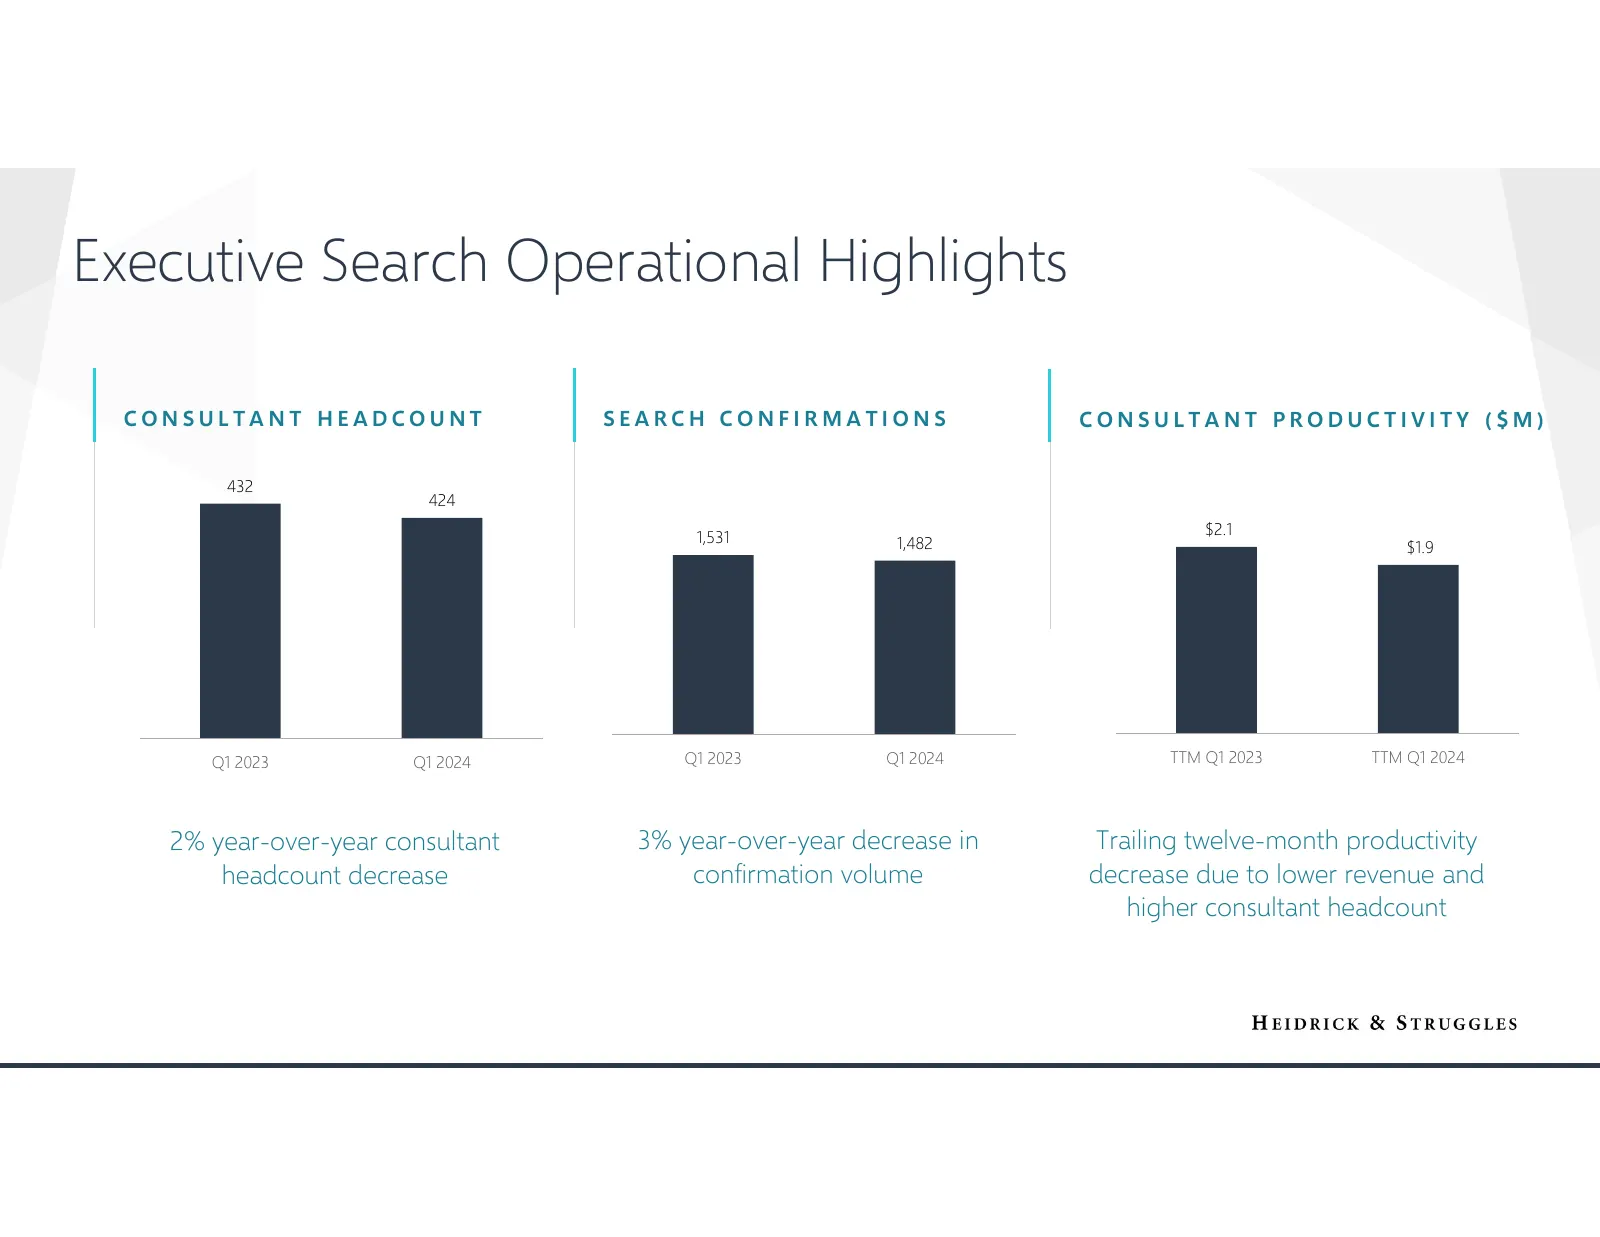
Executive Search Operational Highlights CONSULTANT HEADCOUNT SEARCH CONFIRMATIONS CONSULTANT PRODUCTIVITY ($M) 432 424 1,531 $2.1 1,482 $1.9 Q1 2023 Q1 2024 Q1 2023 Q1 2024 TTM Q1 2023 TTM Q1 2024 2% year-over-year consultant 3% year-over-year decrease in Trailing twelve-month productivity headcount
Slide 16: Diversified Mix Of Business In Executive Search
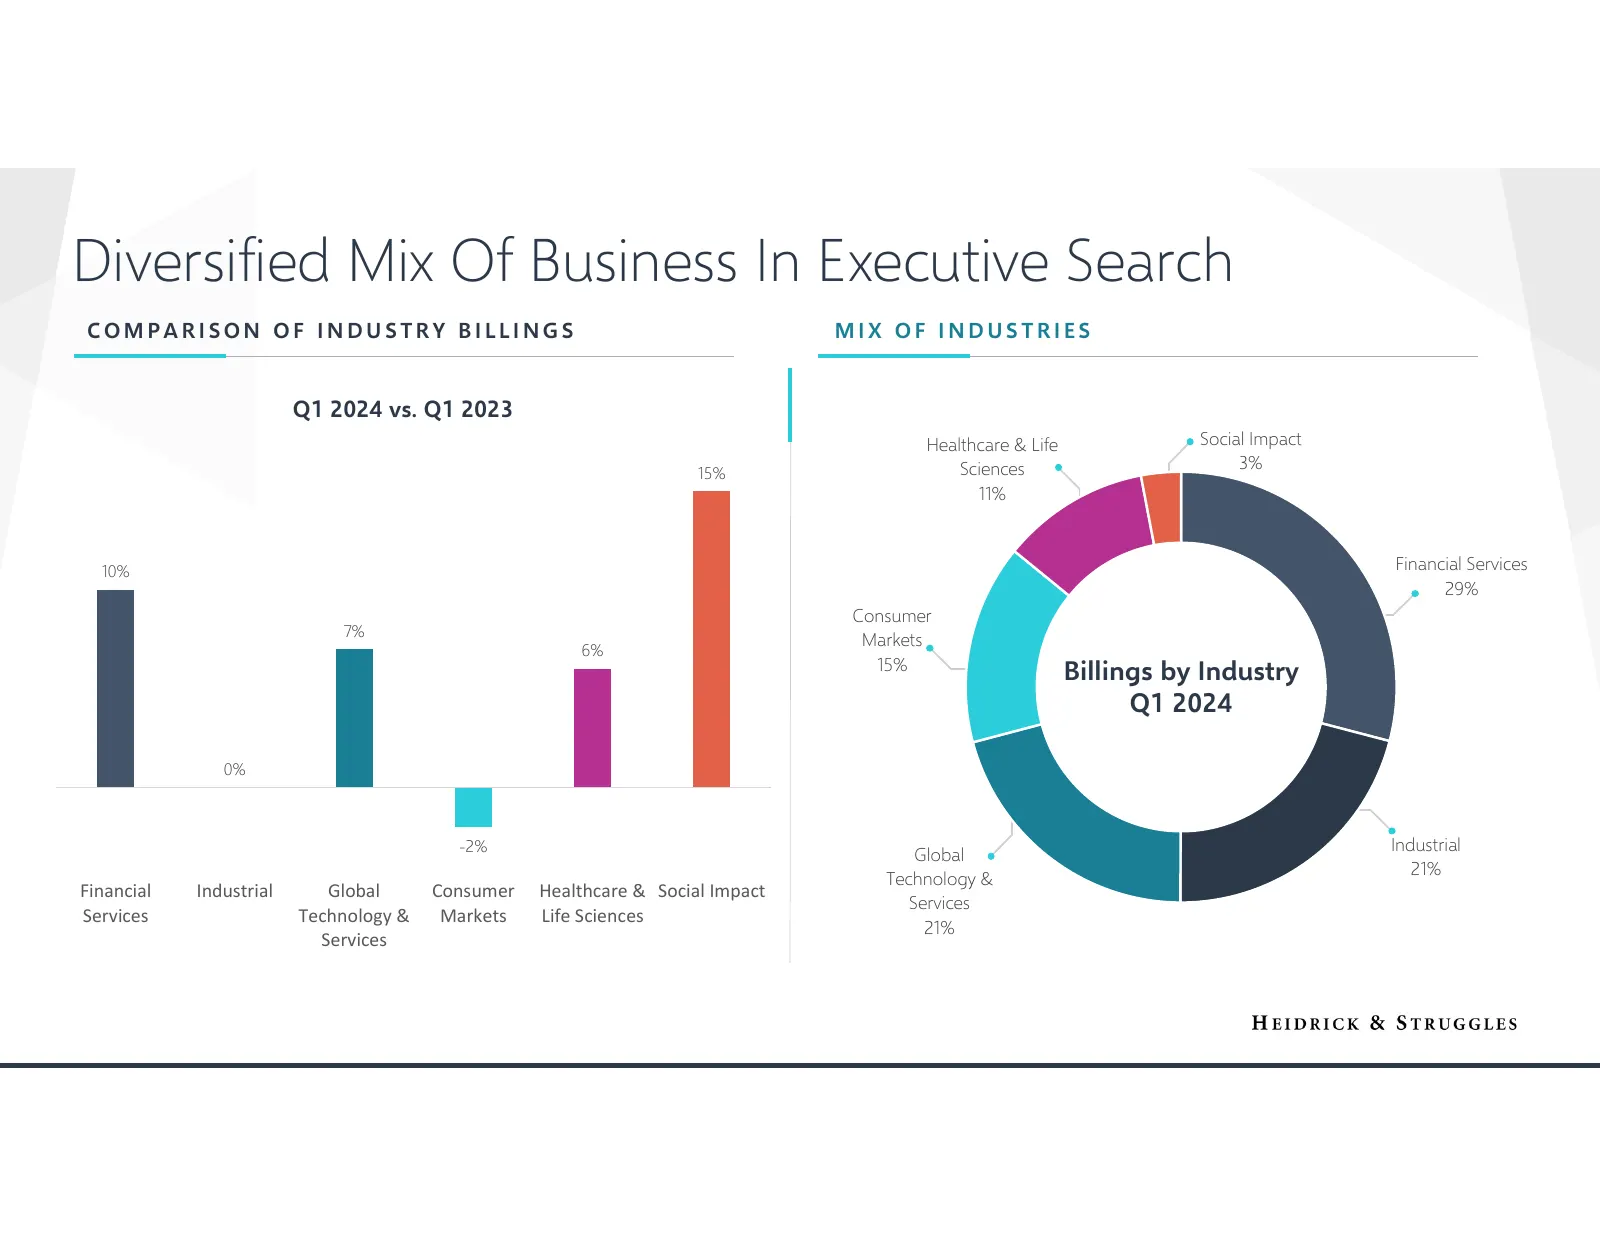
Diversified Mix Of Business In Executive Search COMPARISON OF INDUSTRY BILLINGS MIX OF INDUSTRIES Q1 2024 vs. Q1 2023 Healthcare & Life Social Impact Sciences 3% 15% 11% 10% Financial Services 29% Consumer 7% Markets 6% 15% Billings by Industry Q1 2024 0% -2% Industrial Global 21% Technology & Finan
Slide 17: On-Demand Talent Results
On-Demand Talent Results
Slide 18: On-Demand Talent Financial Highlights
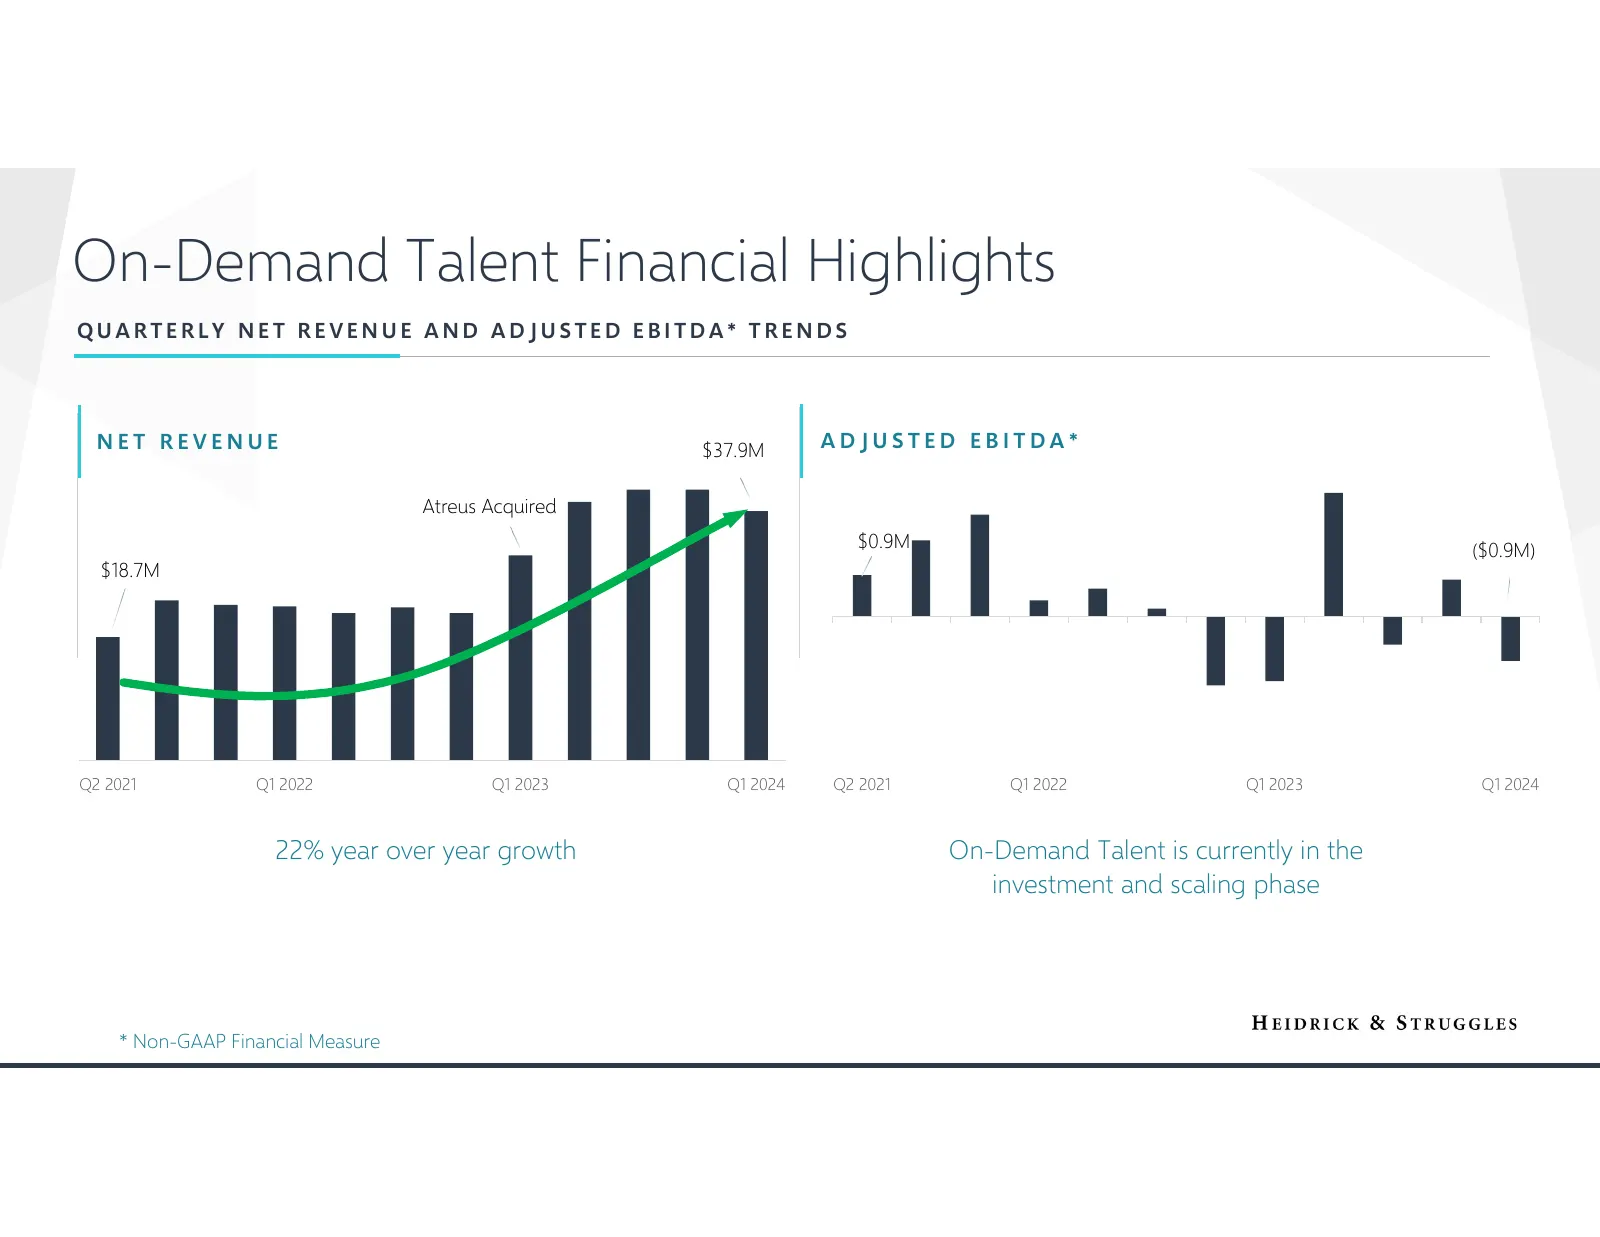
On-Demand Talent Financial Highlights QUARTERLY NET REVENUE AND ADJUSTED EBITDA* TRENDS NET REVENUE $37.9M ADJUSTED EBITDA* Atreus Acquired $0.9M ($0.9M) $18.7M Q2 2021 Q1 2022 Q1 2023 Q1 2024 Q2 2021 Q1 2022 Q1 2023 Q1 2024 22% year over year growth On-Demand Talent is currently in the investment a
Slide 19: Heidrick Consulting Results
Heidrick Consulting Results
Slide 20: Heidrick Consulting Financial Highlights
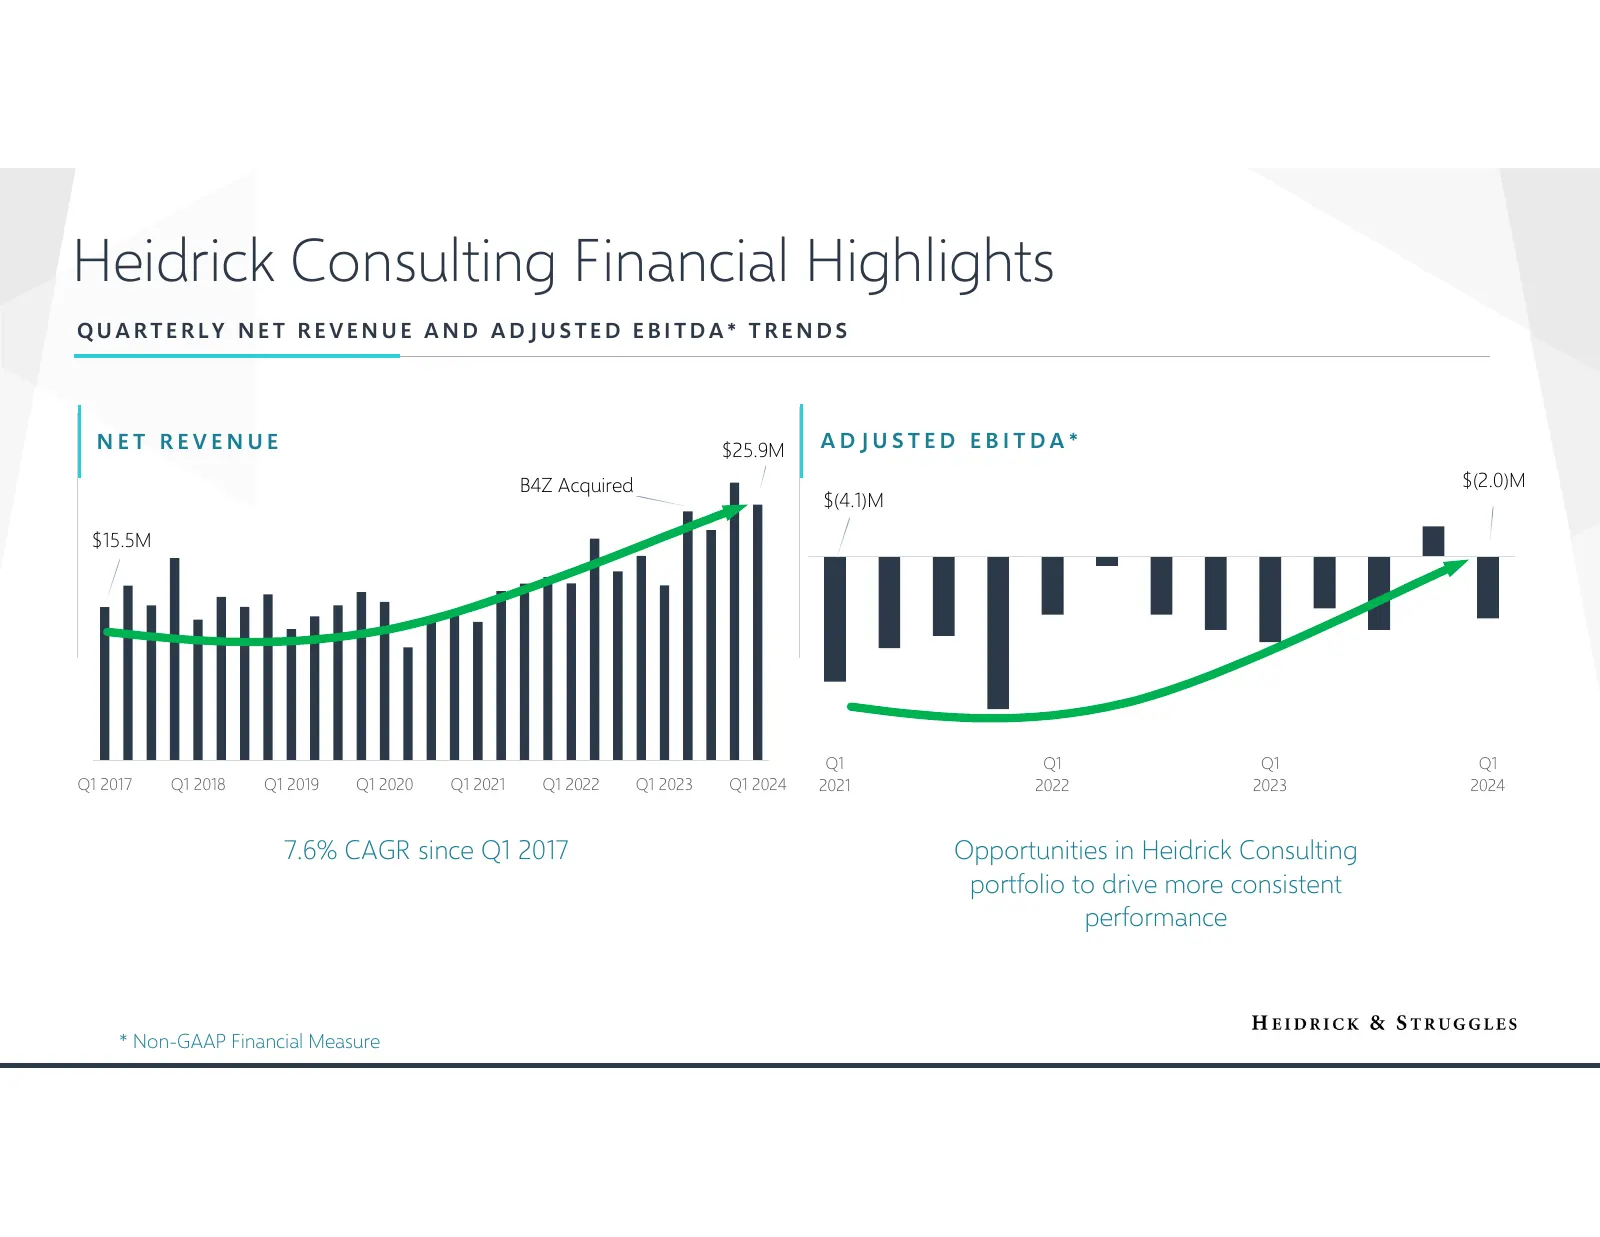
Heidrick Consulting Financial Highlights QUARTERLY NET REVENUE AND ADJUSTED EBITDA* TRENDS NET REVENUE $25.9M ADJUSTED EBITDA* B4Z Acquired $(2.0)M $(4.1)M $15.5M Q1 Q1 Q1 Q1 Q1 2017 Q1 2018 Q1 2019 Q1 2020 Q1 2021 Q1 2022 Q1 2023 Q1 2024 2021 2022 2023 2024 7.6% CAGR since Q1 2017 Opportunities in

Slide 21: Balance Sheet & Liquidity
Balance Sheet & Liquidity
Slide 22: Strong & Flexible Balance Sheet
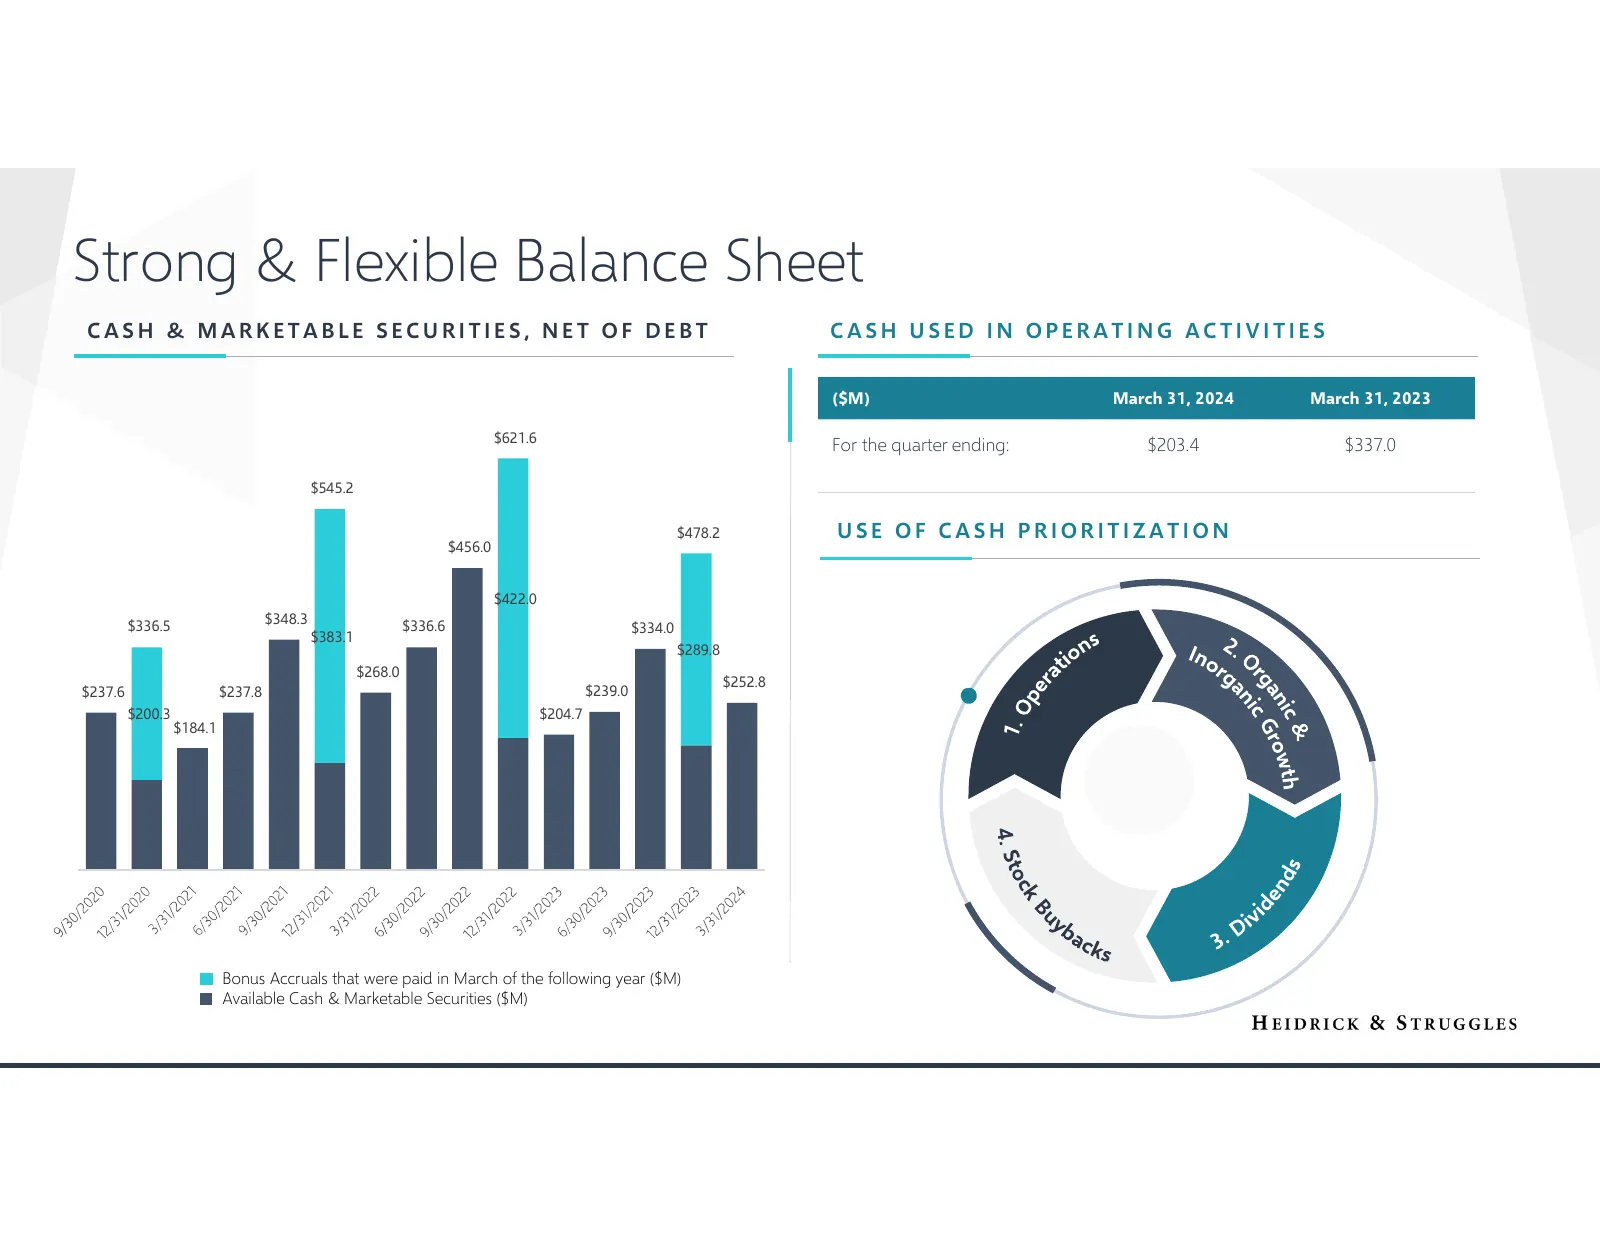
Strong & Flexible Balance Sheet CASH & MARKETABLE SECURITIES, NET OF DEBT CASH USED IN OPERATING ACTIVITIES ($M) March 31, 2024 March 31, 2023 $621.6 For the quarter ending: $203.4 $337.0 $545.2 $478.2 USE OF CASH PRIORITIZATION $456.0 $422.0 $348.3 $336.5 $336.6 $334.0 $383.1 $289.8 $268.0 $252.8 $
Slide 23: Appendix
Appendix Reconciliation of GAAP to Non-GAAP Financial Measures
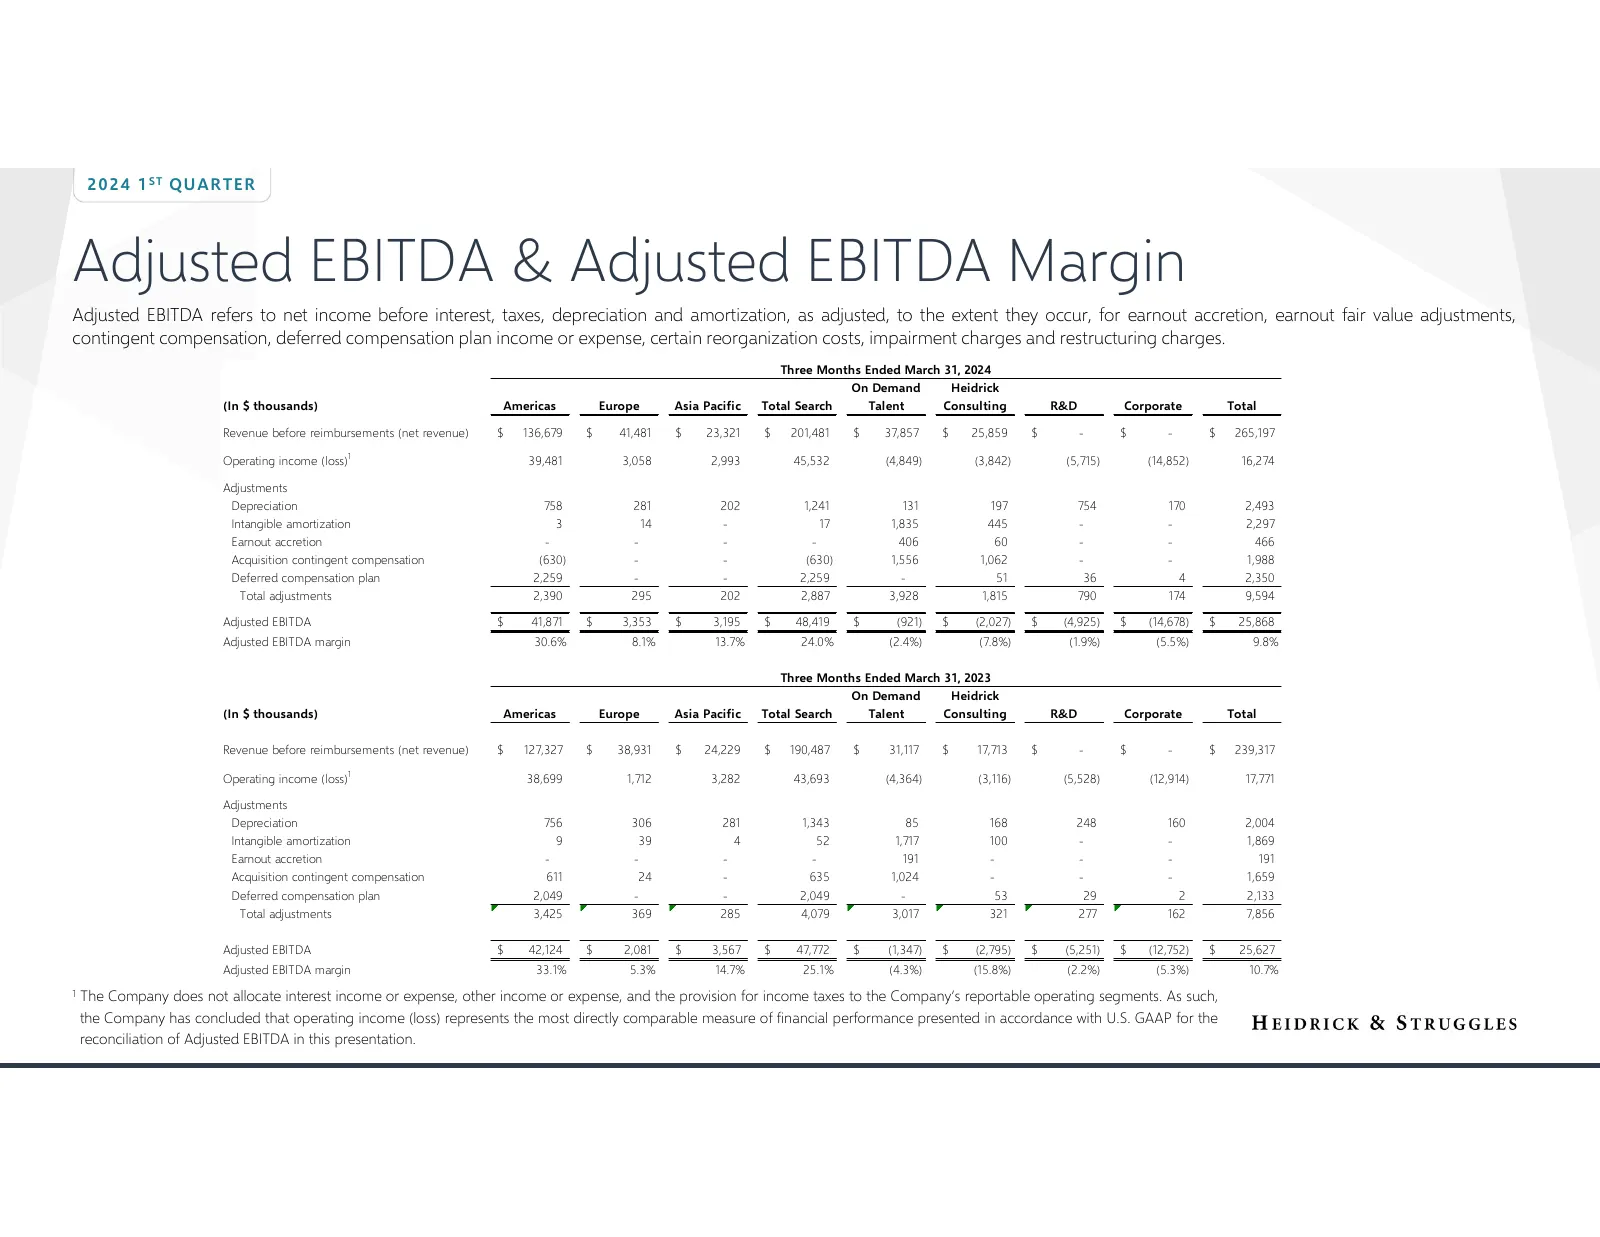
Slide 24: Adjusted EBITDA & Adjusted EBITDA Margin
2 02 4 1 ST QU AR TE R Adjusted EBITDA & Adjusted EBITDA Margin Adjusted EBITDA refers to net income before interest, taxes, depreciation and amortization, as adjusted, to the extent they occur, for earnout accretion, earnout fair value adjustments, contingent compensation, deferred compensation pla

Slide 25: Suzanne Rosenberg, VP, Investor Relations
Suzanne Rosenberg, VP, Investor Relations srosenberg@heidrick.com
Source: EarningsCall slides
More decks from Heidrick & Struggles International
 Q1 2025 Earnings Presentation20 slides · May 5, 2025
 Q4 2024 Earnings Presentation26 slides · Mar 3, 2025
 Investor Day (December 2024)68 slides · Dec 3, 2024
 Q3 2024 Earnings Presentation24 slides · Nov 4, 2024
 Q2 2024 Earnings Presentation25 slides · Jul 29, 2024
 Q4 2023 Earnings Presentation27 slides · Feb 26, 2024