Worldline SA · EURONEXT:WLN
Worldline SA — Q1 2024 Earnings Presentation
21 slides from Worldline SA's earnings presentation, May 2, 2024
Slide 1: Q1 2024 Revenue
Q1 2024 Revenue May 2nd, 2024 Q1 2024 revenue – 02-05-2024
Slide 2: Disclaimer
Disclaimer This document contains forward-looking statements that involve risks and uncertainties, including references, concerning the Group's expected growth and profitability in the future which may significantly impact the expected performance indicated in the forward-looking statements. These r
Slide 3: Q1'24 highlights
Q1’24 highlights Gilles Grapinet Group CEO Q1 2024 revenue – 02-05-2024
Slide 4: Q1'24 highlights
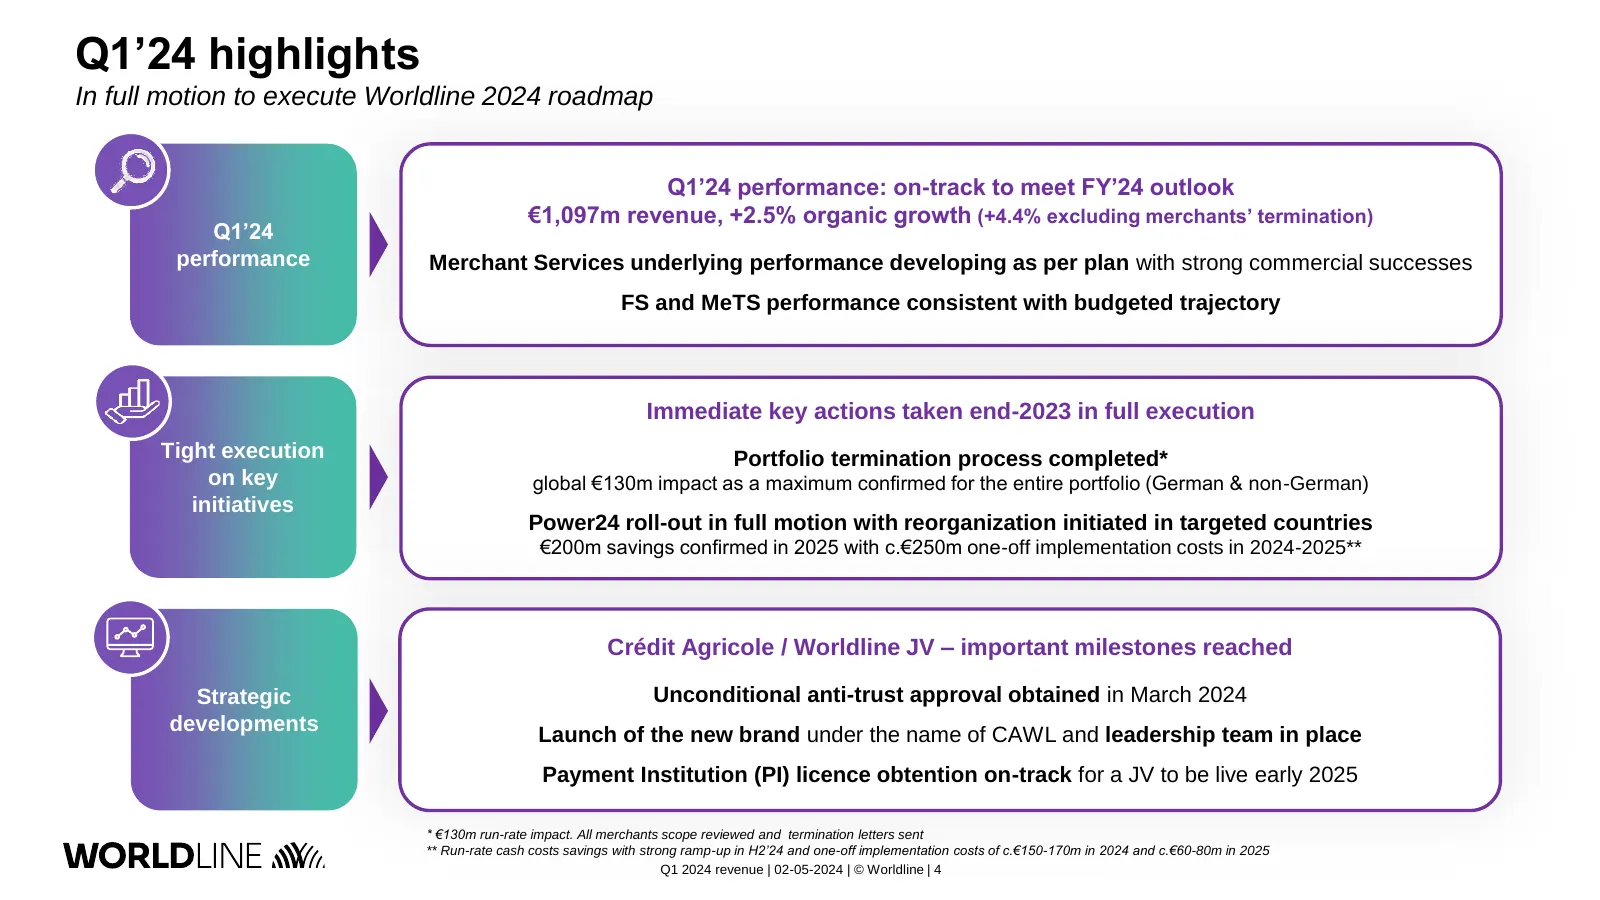
Q1’24 highlights In full motion to execute Worldline 2024 roadmap Q1’24 performance: on-track to meet FY’24 outlook €1,097m revenue, +2.5% organic growth (+4.4% excluding merchants’ termination) Q1’24 performance Merchant Services underlying performance developing as per plan with strong commercial
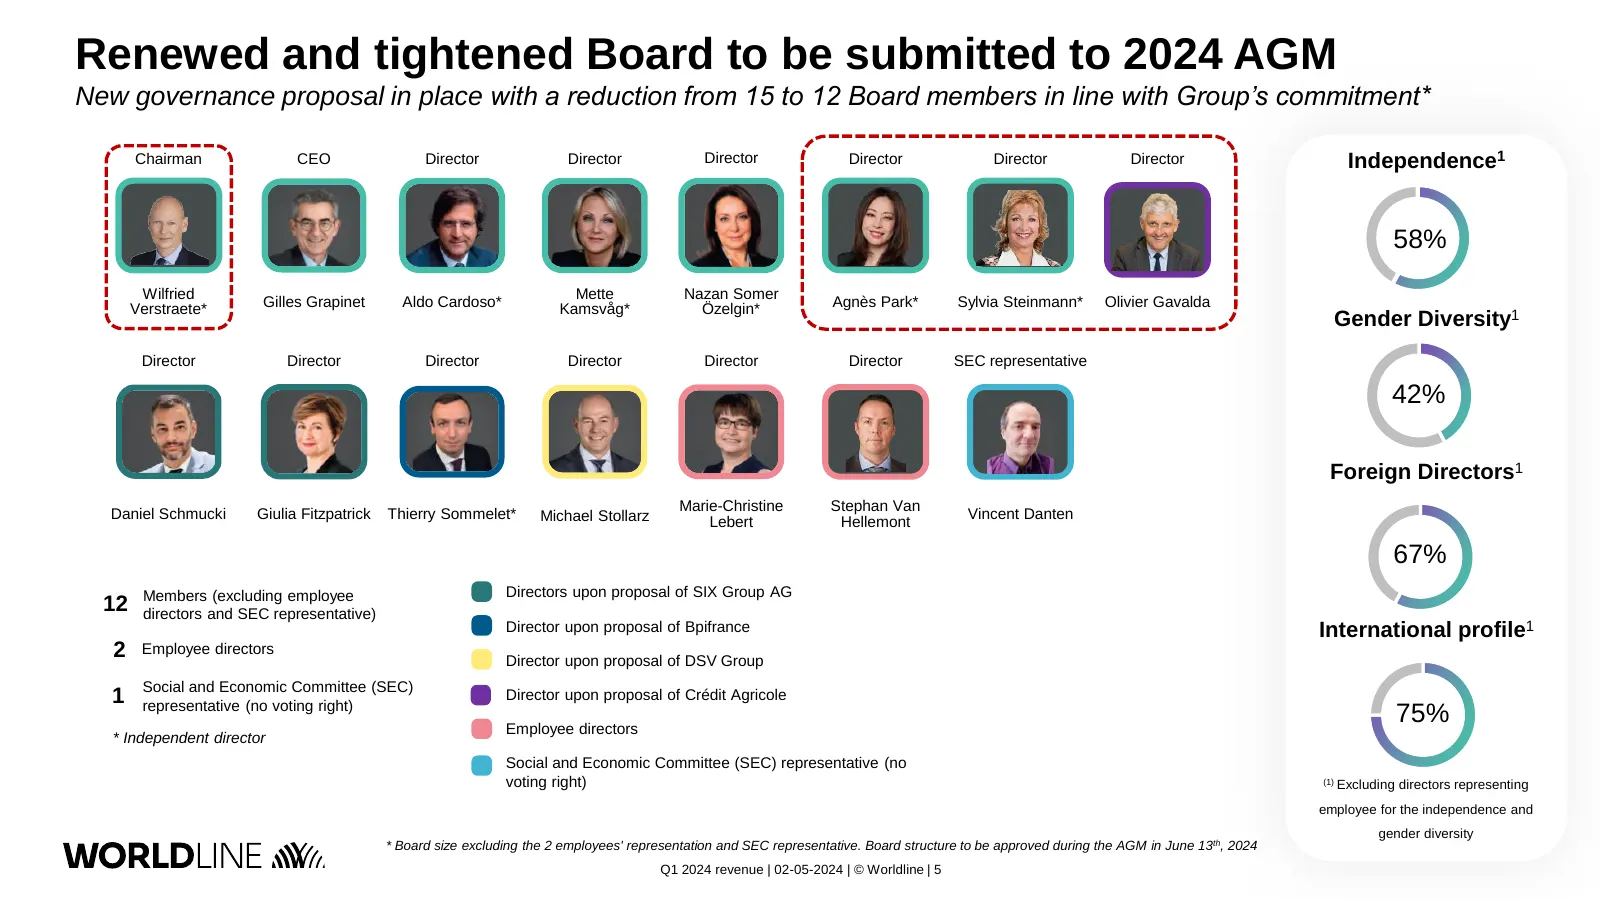
Slide 5: Renewed and tightened Board to be submitted to 2024 AGM
Renewed and tightened Board to be submitted to 2024 AGM New governance proposal in place with a reduction from 15 to 12 Board members in line with Group’s commitment* Chairman CEO Director Director Director Director Director Director Independence1 58% Wilfried Mette Nazan Somer Verstraete* Gilles Gr
Slide 6: Business and Commercial Dynamics
Business and Commercial Dynamics Gilles Grapinet Group CEO Q1 2024 revenue – 02-05-2024
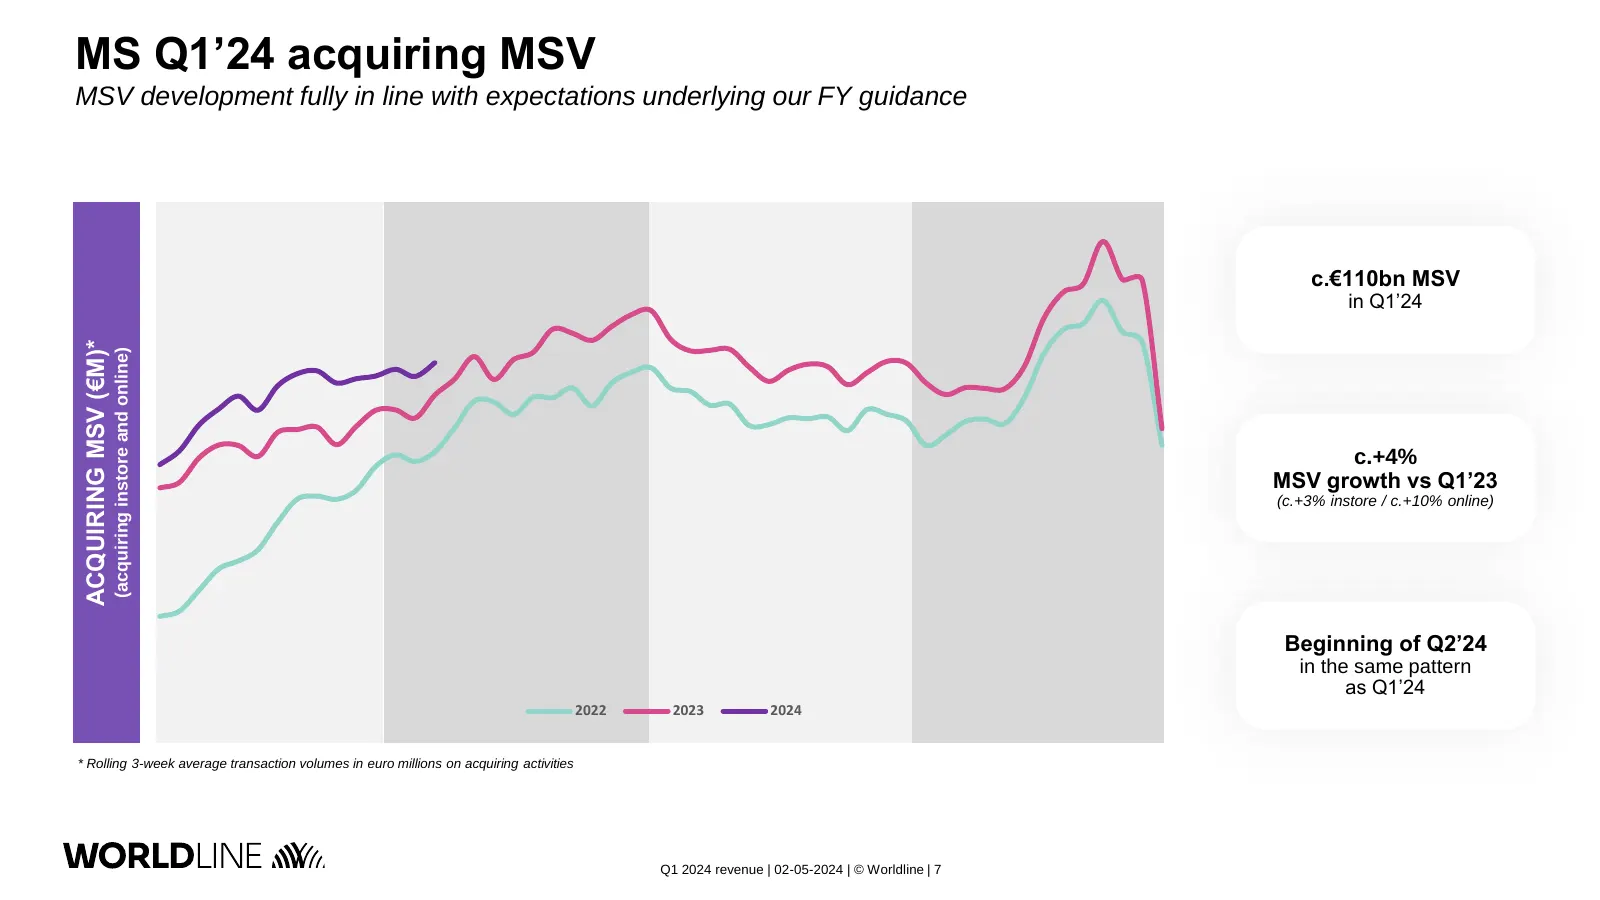
Slide 7: MS Q1'24 acquiring MSV
MS Q1’24 acquiring MSV MSV development fully in line with expectations underlying our FY guidance c.€110bn MSV in Q1’24 ACQUIRING MSV (€M)* (acquiring instore and online) c.+4% MSV growth vs Q1’23 (c.+3% instore / c.+10% online) Beginning of Q2’24 in the same pattern as Q1’24 2022 2023 2024 * Rollin
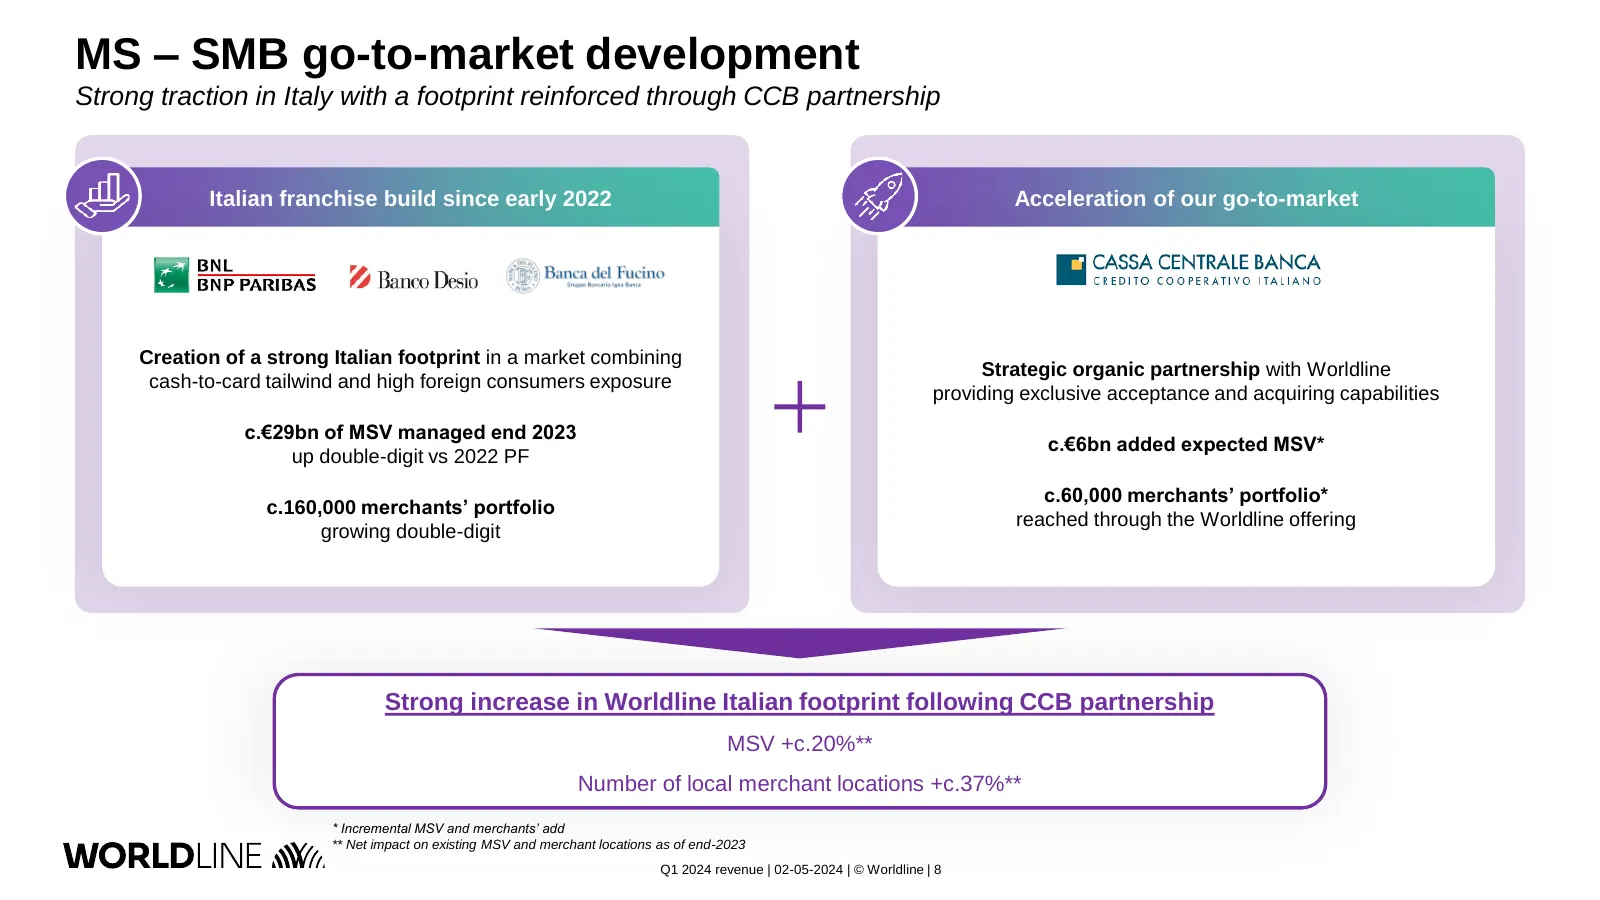
Slide 8: MS – SMB go-to-market development
MS – SMB go-to-market development Strong traction in Italy with a footprint reinforced through CCB partnership Italian franchise build since early 2022 Acceleration of our go-to-market Creation of a strong Italian footprint in a market combining Strategic organic partnership with Worldline cash-to-c
Slide 9: MS – Enterprise go-to-market development
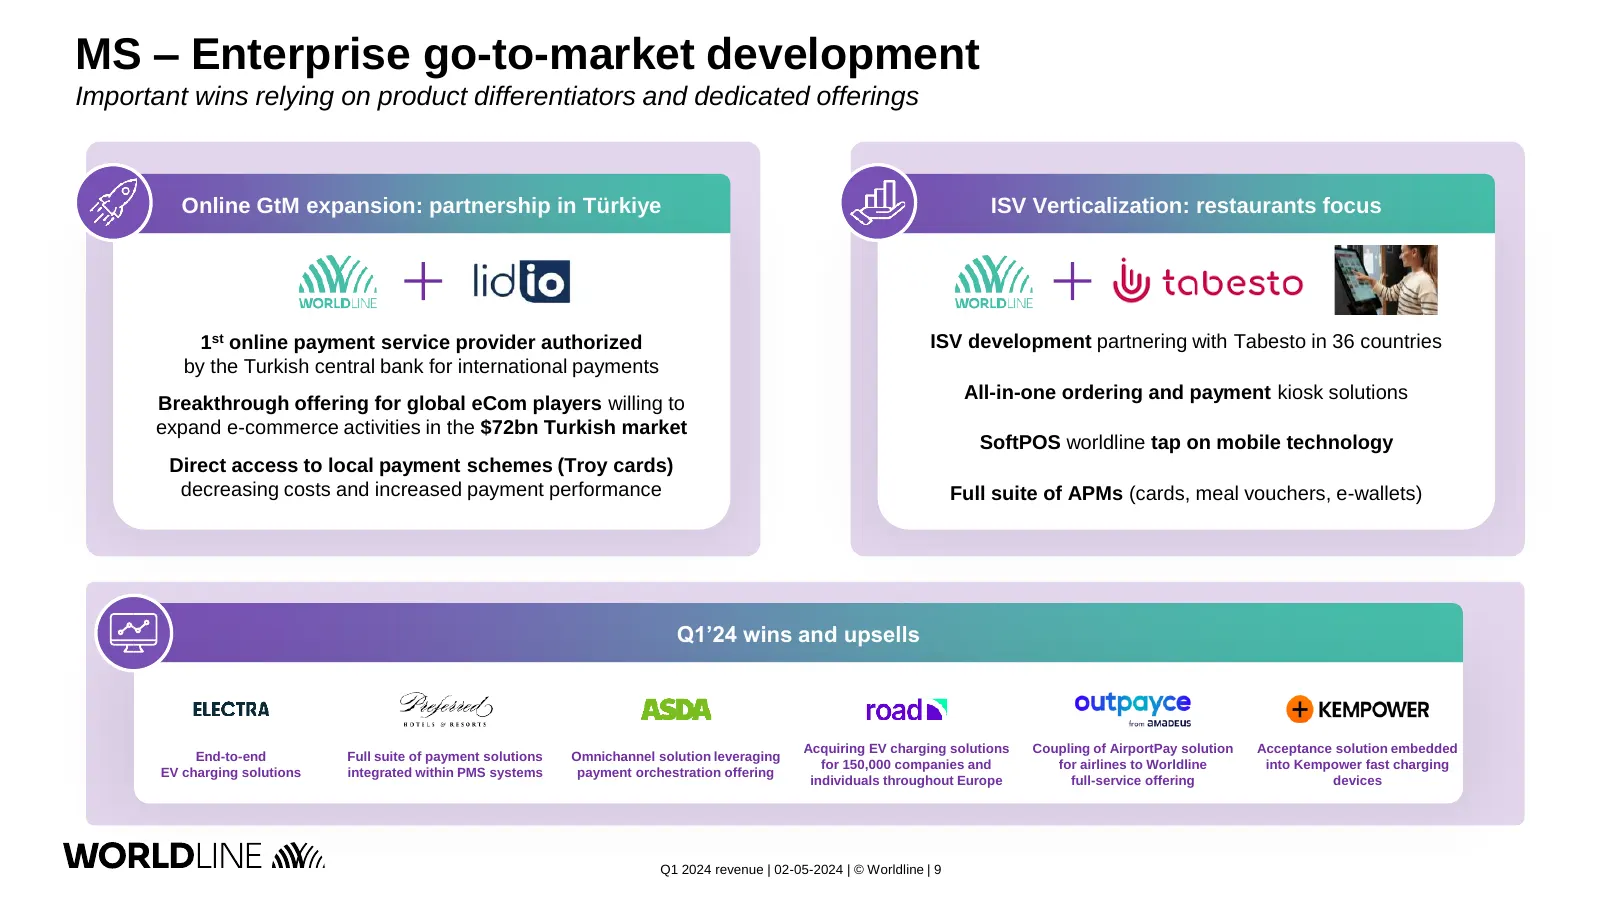
MS – Enterprise go-to-market development Important wins relying on product differentiators and dedicated offerings Online GtM expansion: partnership in Türkiye ISV Verticalization: restaurants focus 1st online payment service provider authorized ISV development partnering with Tabesto in 36 countrie
Slide 10: FS and MeTS – Solid commercial activity
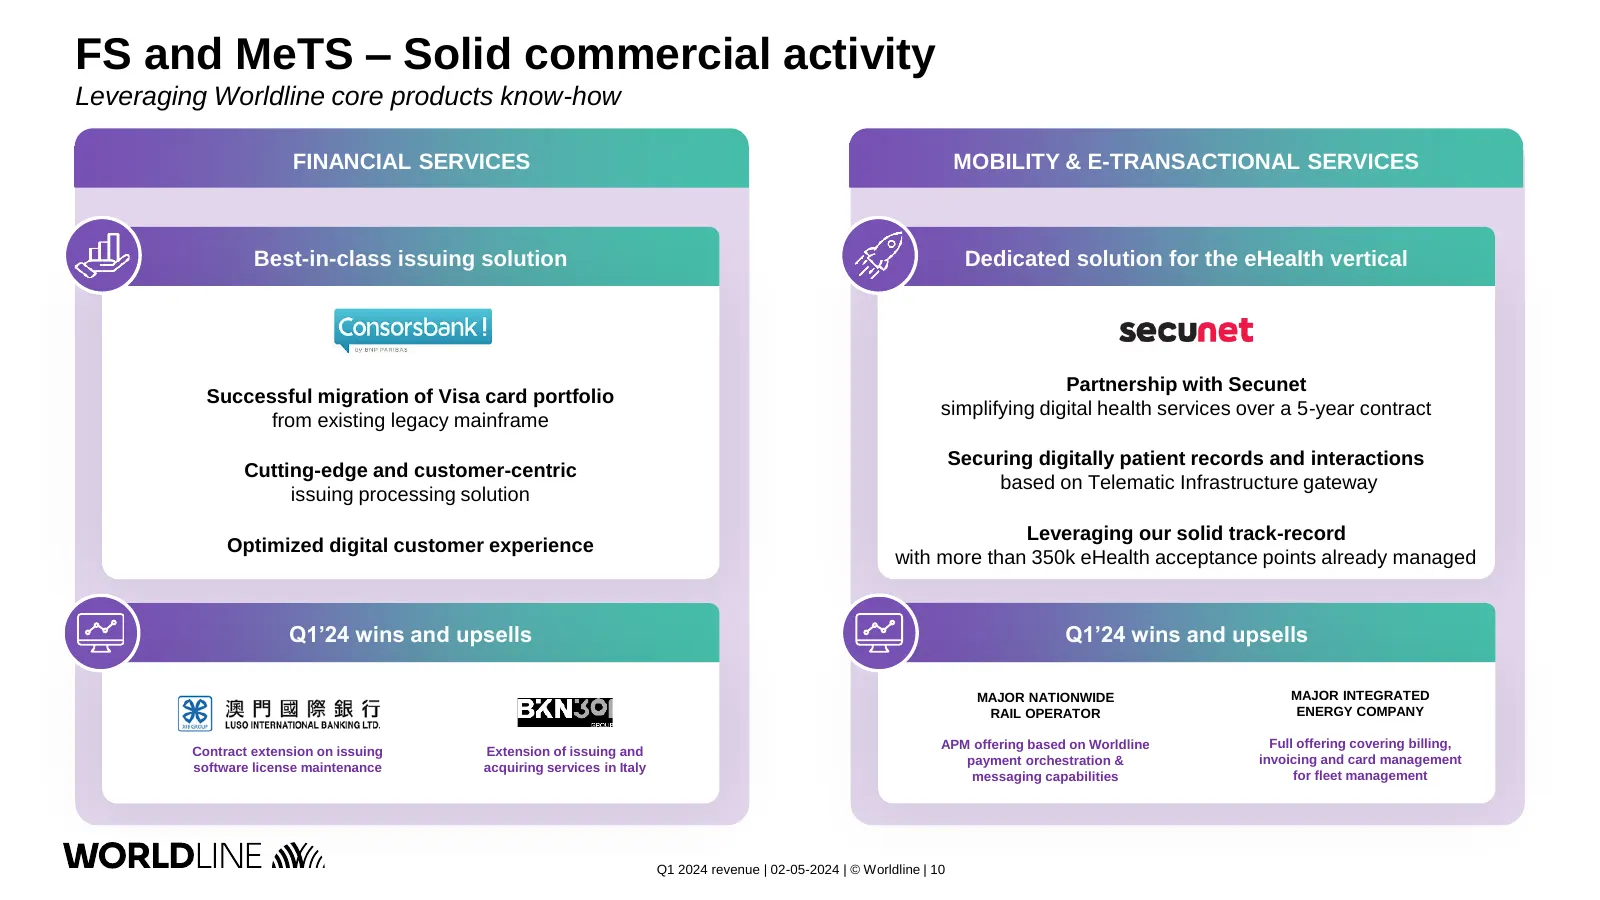
FS and MeTS – Solid commercial activity Leveraging Worldline core products know-how FINANCIAL SERVICES MOBILITY & E-TRANSACTIONAL SERVICES Best-in-class issuing solution Dedicated solution for the eHealth vertical Partnership with Secunet Successful migration of Visa card portfolio simplifying digit
Slide 11: Q1'24 Financial performance
Q1’24 Financial performance Grégory Lambertie Group CFO Q1 2024 revenue – 02-05-2024
Slide 12: Q1 2024 financial performance
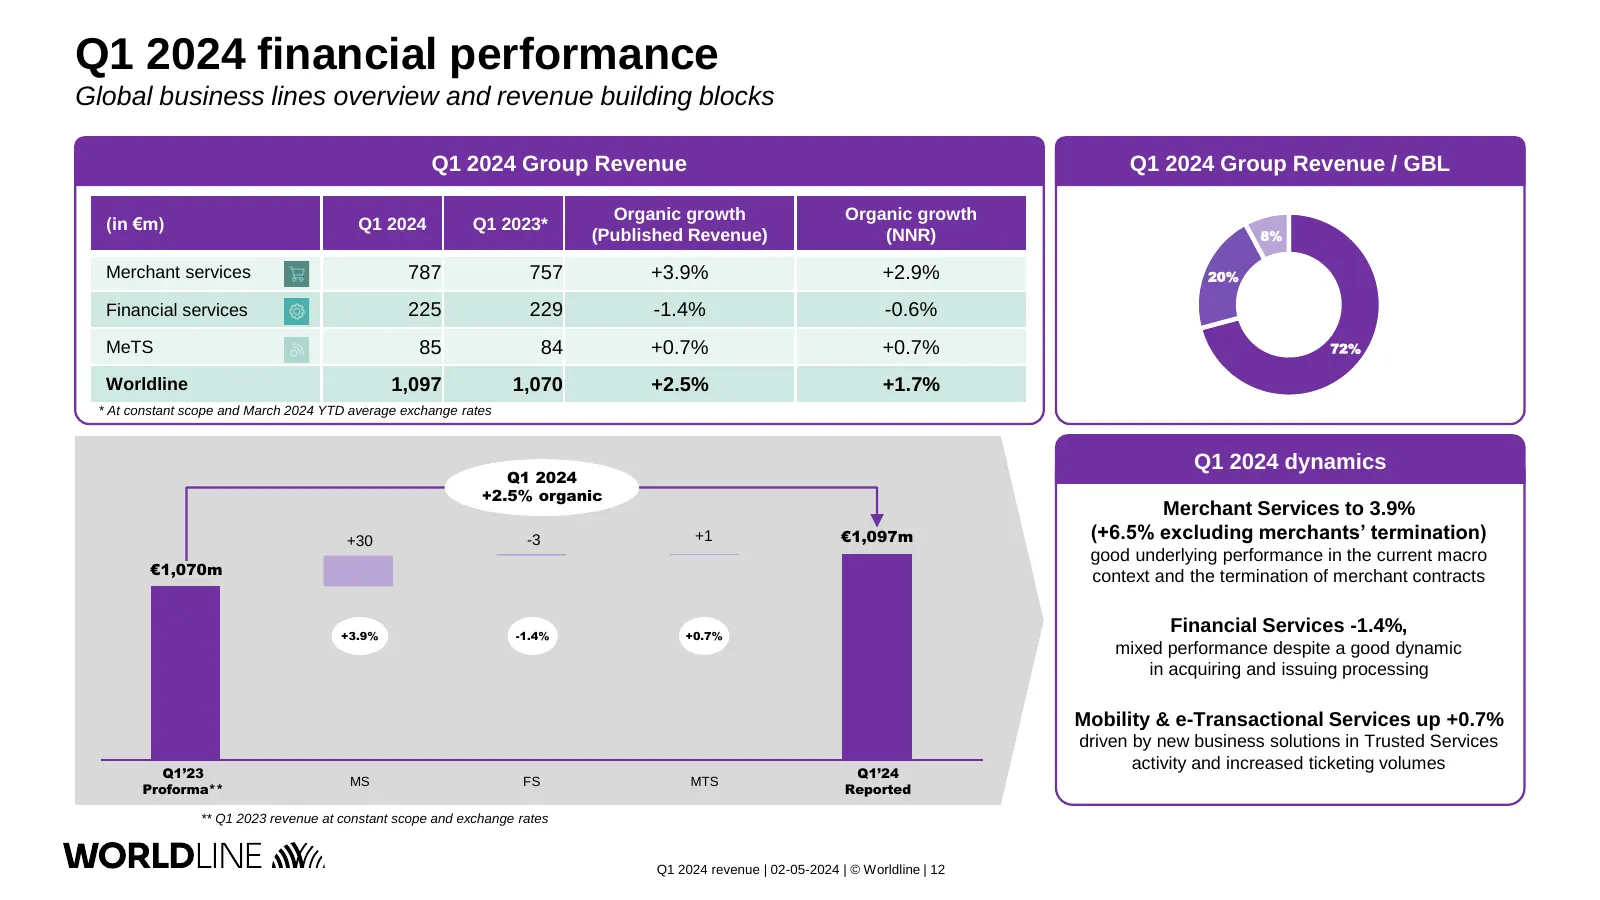
Q1 2024 financial performance Global business lines overview and revenue building blocks Q1 2024 Group Revenue Q1 2024 Group Revenue / GBL Organic growth Organic growth (in €m) Q1 2024 Q1 2023* (Published Revenue) (NNR) 8% Merchant services 787 757 +3.9% +2.9% 20% Financial services 225 229 -1.4% -0
Slide 13: Merchant Services Q1 2024 highlights
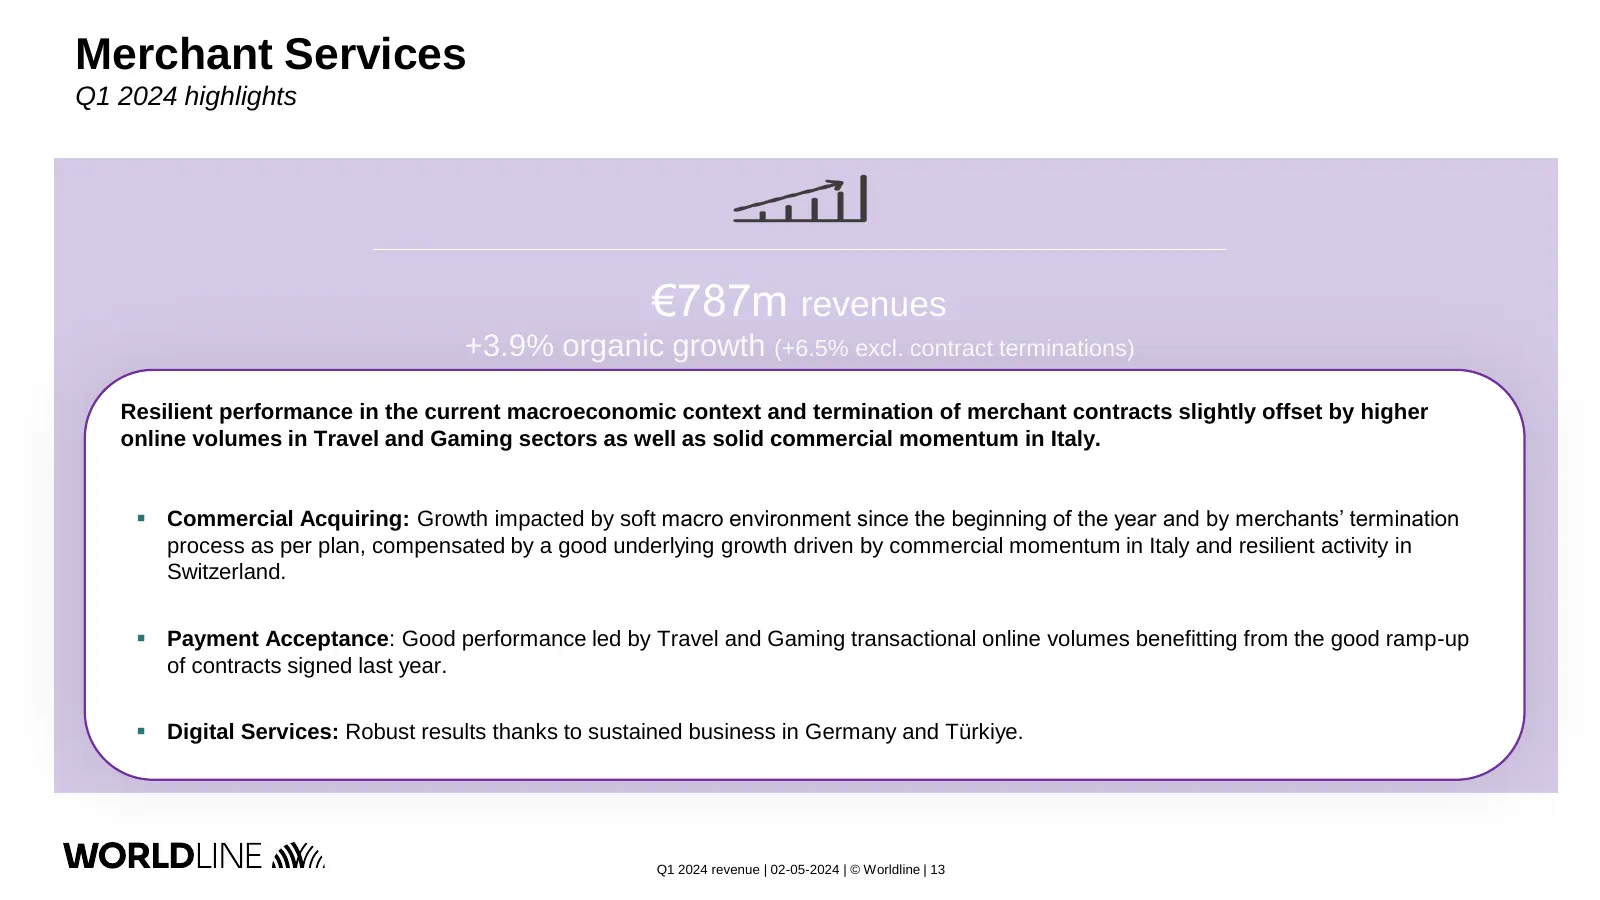
Merchant Services Q1 2024 highlights €787m revenues +3.9% organic growth (+6.5% excl. contract terminations) Resilient performance in the current macroeconomic context and termination of merchant contracts slightly offset by higher online volumes in Travel and Gaming sectors as well as solid commerc
Slide 14: Financial Services and Mobility & e-Transactional Services
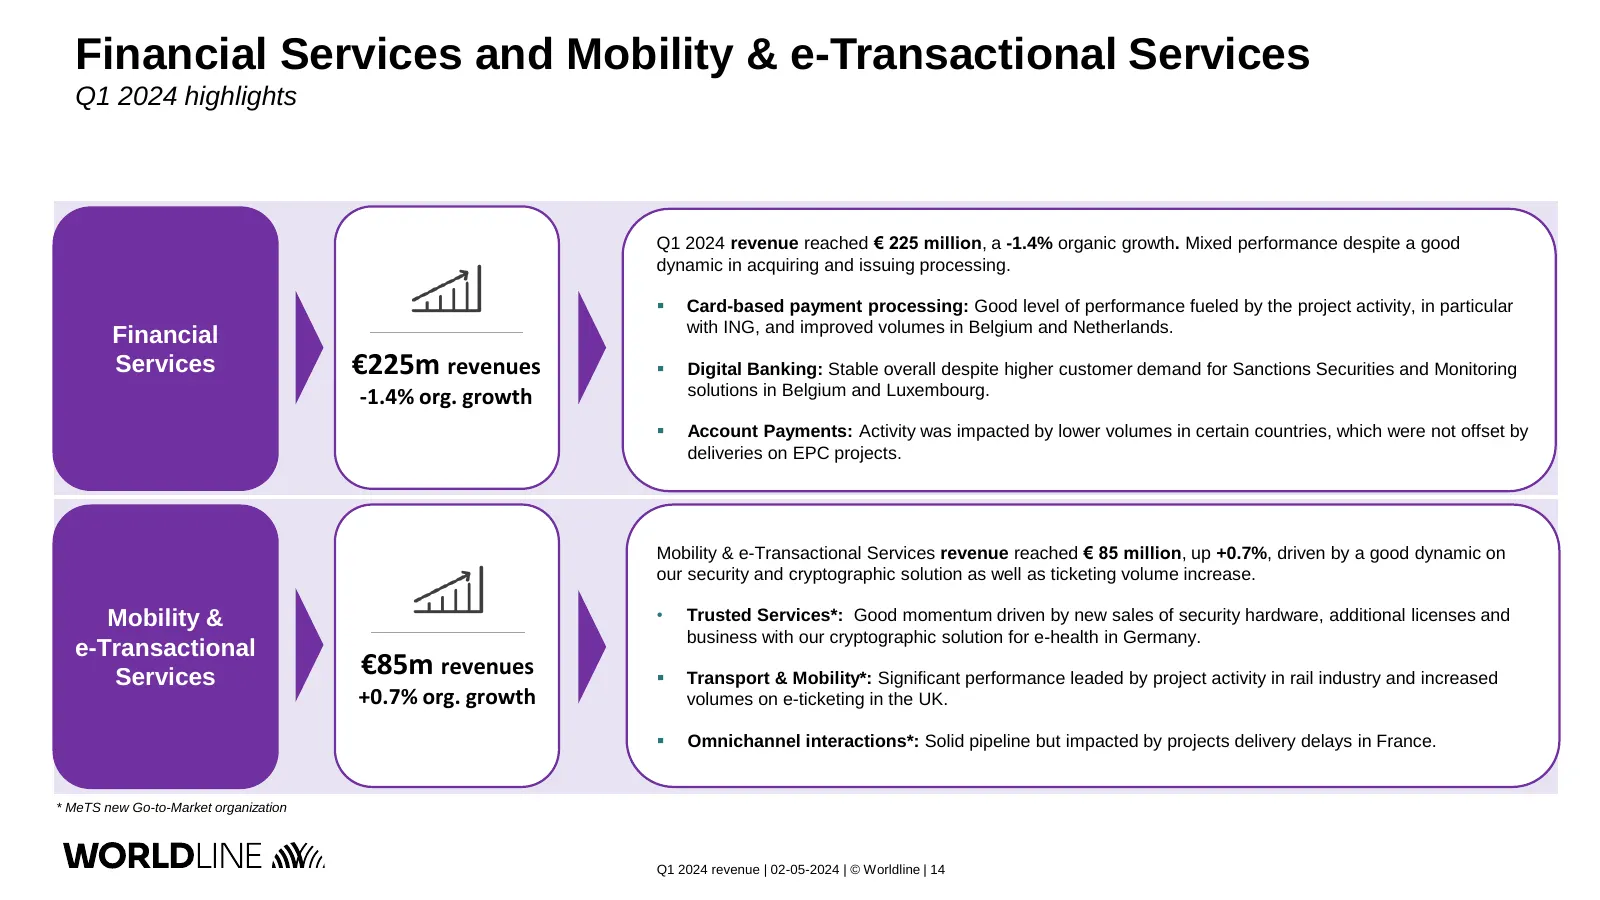
Financial Services and Mobility & e-Transactional Services Q1 2024 highlights Q1 2024 revenue reached € 225 million, a -1.4% organic growth. Mixed performance despite a good dynamic in acquiring and issuing processing. ▪ Card-based payment processing: Good level of performance fueled by the project
Slide 15: Key take-aways
Key take-aways Gilles Grapinet Group CEO Q1 2024 revenue – 02-05-2024
Slide 16: Board and management team fully focused on execution
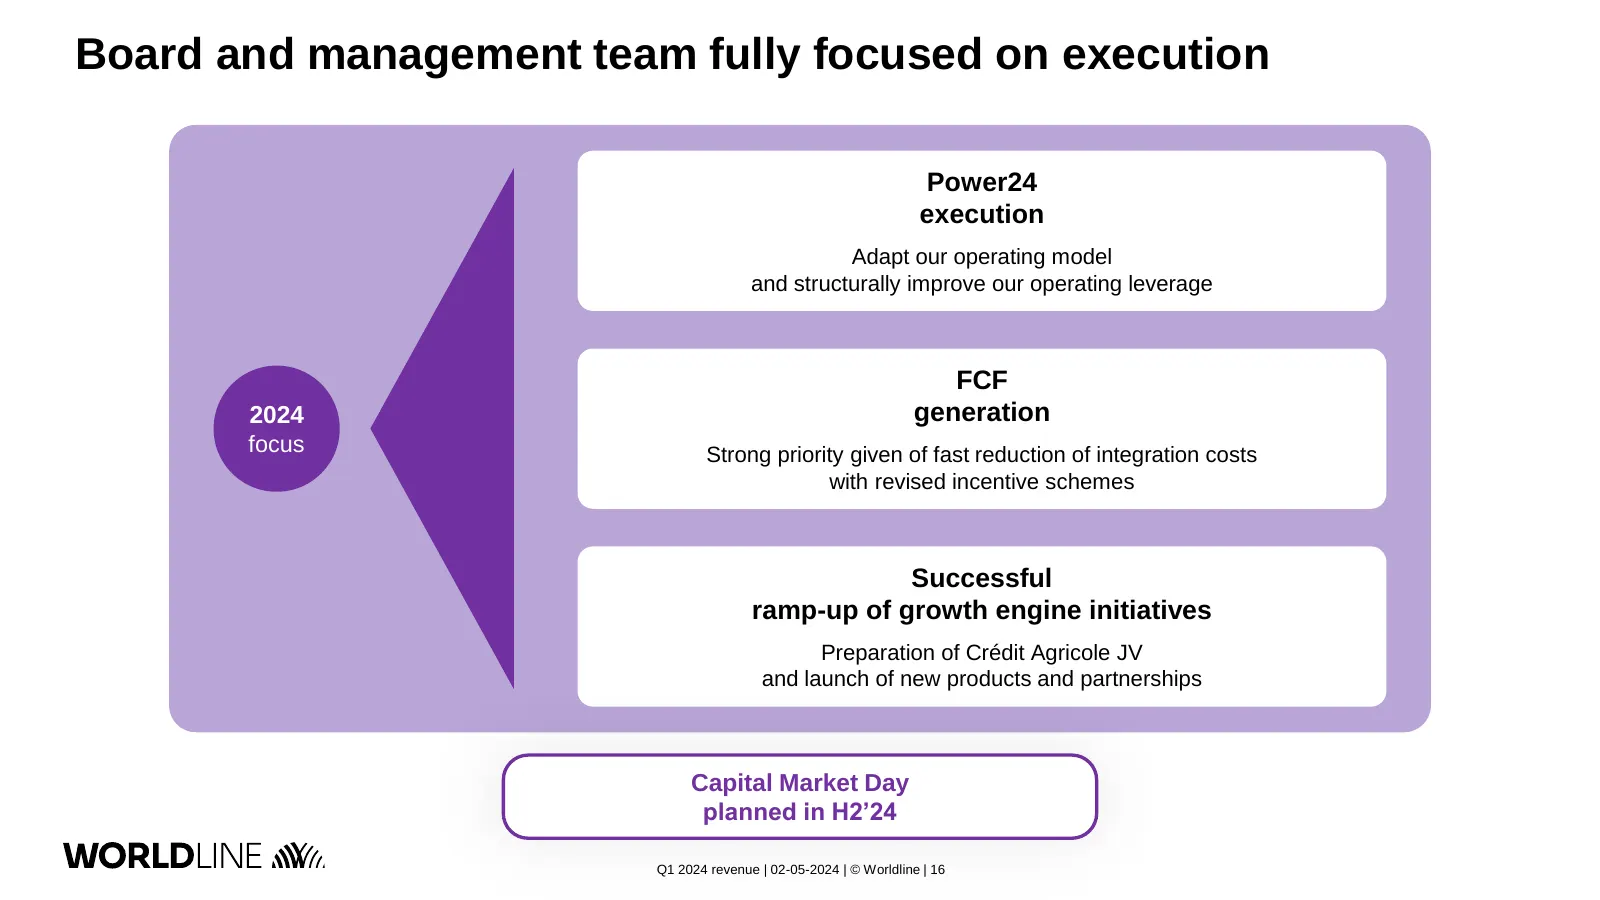
Board and management team fully focused on execution Power24 execution Adapt our operating model and structurally improve our operating leverage FCF 2024 generation focus Strong priority given of fast reduction of integration costs with revised incentive schemes Successful ramp-up of growth engine i
Slide 17: FY 2024 guidance confirmed
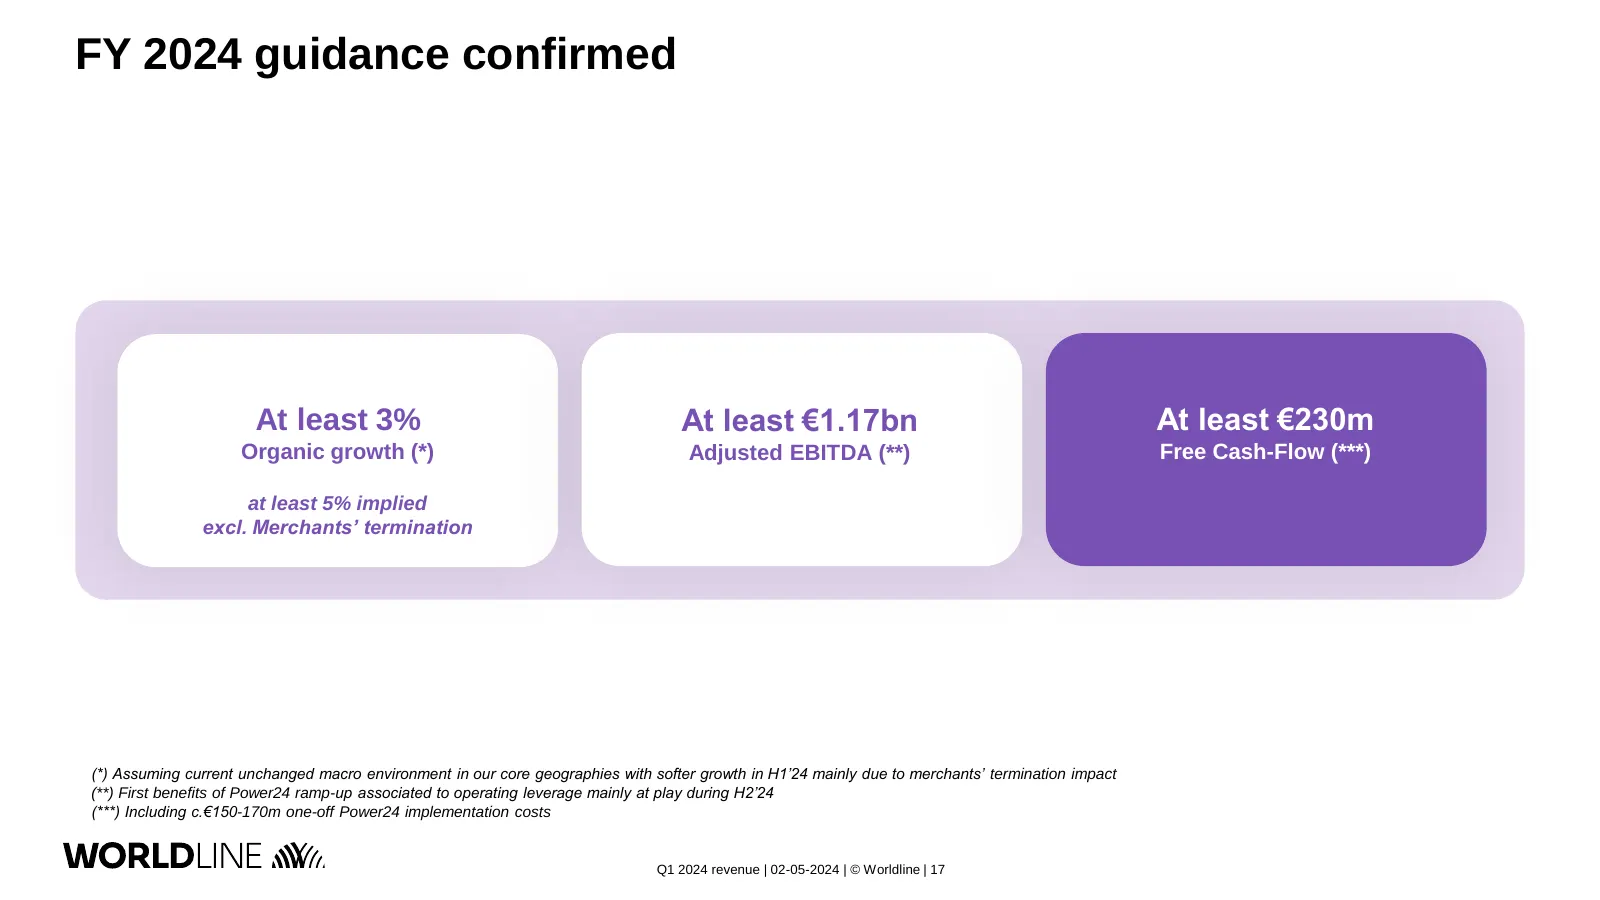
FY 2024 guidance confirmed At least 3% At least €1.17bn At least €230m Organic growth (*) Adjusted EBITDA (**) Free Cash-Flow (***) at least 5% implied excl. Merchants’ termination (*) Assuming current unchanged macro environment in our core geographies with softer growth in H1’24 mainly due to merc
Slide 18: Q&A
Q&A Q1 2024 revenue – 02-05-2024
Slide 19: Appendices
Appendices Q1 2024 revenue – 02-05-2024
Slide 20: Revenue bridge from published to NNR
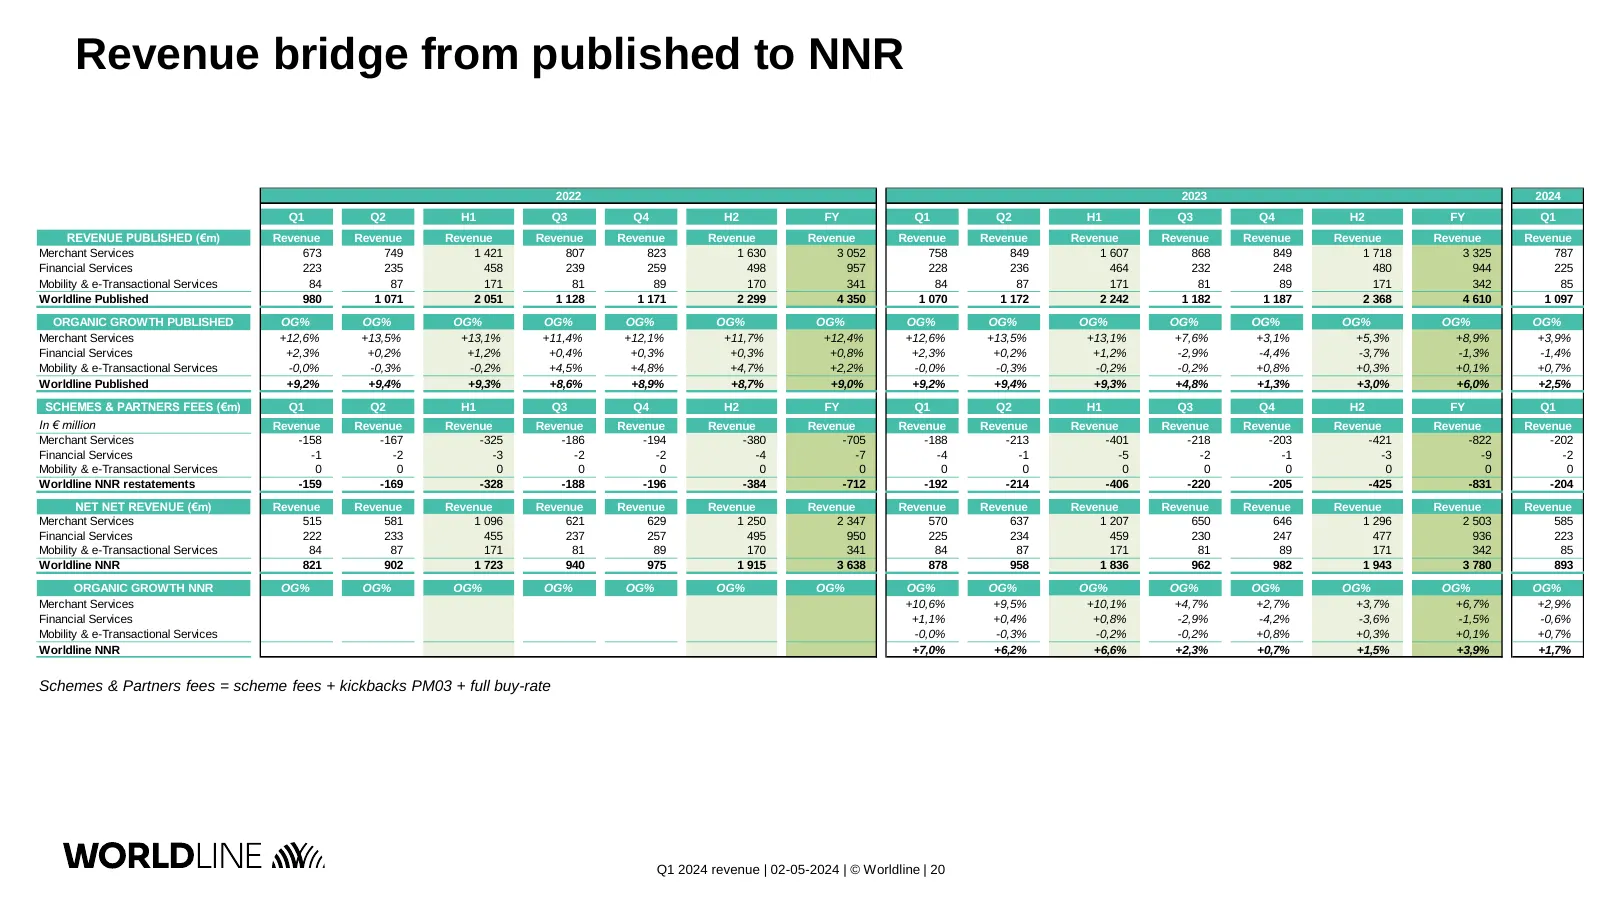
Revenue bridge from published to NNR 2022 2023 2024 Q1 Q2 H1 Q3 Q4 H2 FY Q1 Q2 H1 Q3 Q4 H2 FY Q1 REVENUE PUBLISHED (€m) Revenue Revenue Revenue Revenue Revenue Revenue Revenue Revenue Revenue Revenue Revenue Revenue Revenue Revenue Revenue Merchant Services 673 749 1 421 807 823 1 630 3 052 758 849

Slide 21: Thank you
Laurent Marie Thank you Group Head of Investor Relations laurent.marie@worldline.com For more information, please contact: Guillaume Delaunay Investor Relations Officer guillaume.delaunay@worldline.com Q1 2024 revenue – 02-05-2024
Source: Internet Archive copy of investors.worldline.com
More decks from Worldline SA
 Q3 2026 Earnings Presentation24 slides · Oct 27, 2026
 H1 2026 Earnings Presentation42 slides · Jul 30, 2026
 Shareholder Meeting (June 2026)72 slides · Jun 11, 2026
 Q1 2026 Earnings Presentation21 slides · Apr 28, 2026
 FY 2025 Earnings Presentation45 slides · Feb 25, 2026
 Shareholder Meeting (January 2026)32 slides · Jan 8, 2026