Annapolis Bancorp — Merger or Acquisition (October 2012)
9 slides from Annapolis Bancorp's merger presentation, Oct 22, 2012
Slide 1: F.N.B. Corporation Announces Agreement to Acquire Annapolis Bancorp, Inc.
Exhibit 99.2 F.N.B. Corporation Announces Agreement to Acquire Annapolis Bancorp, Inc. October 22, 2012
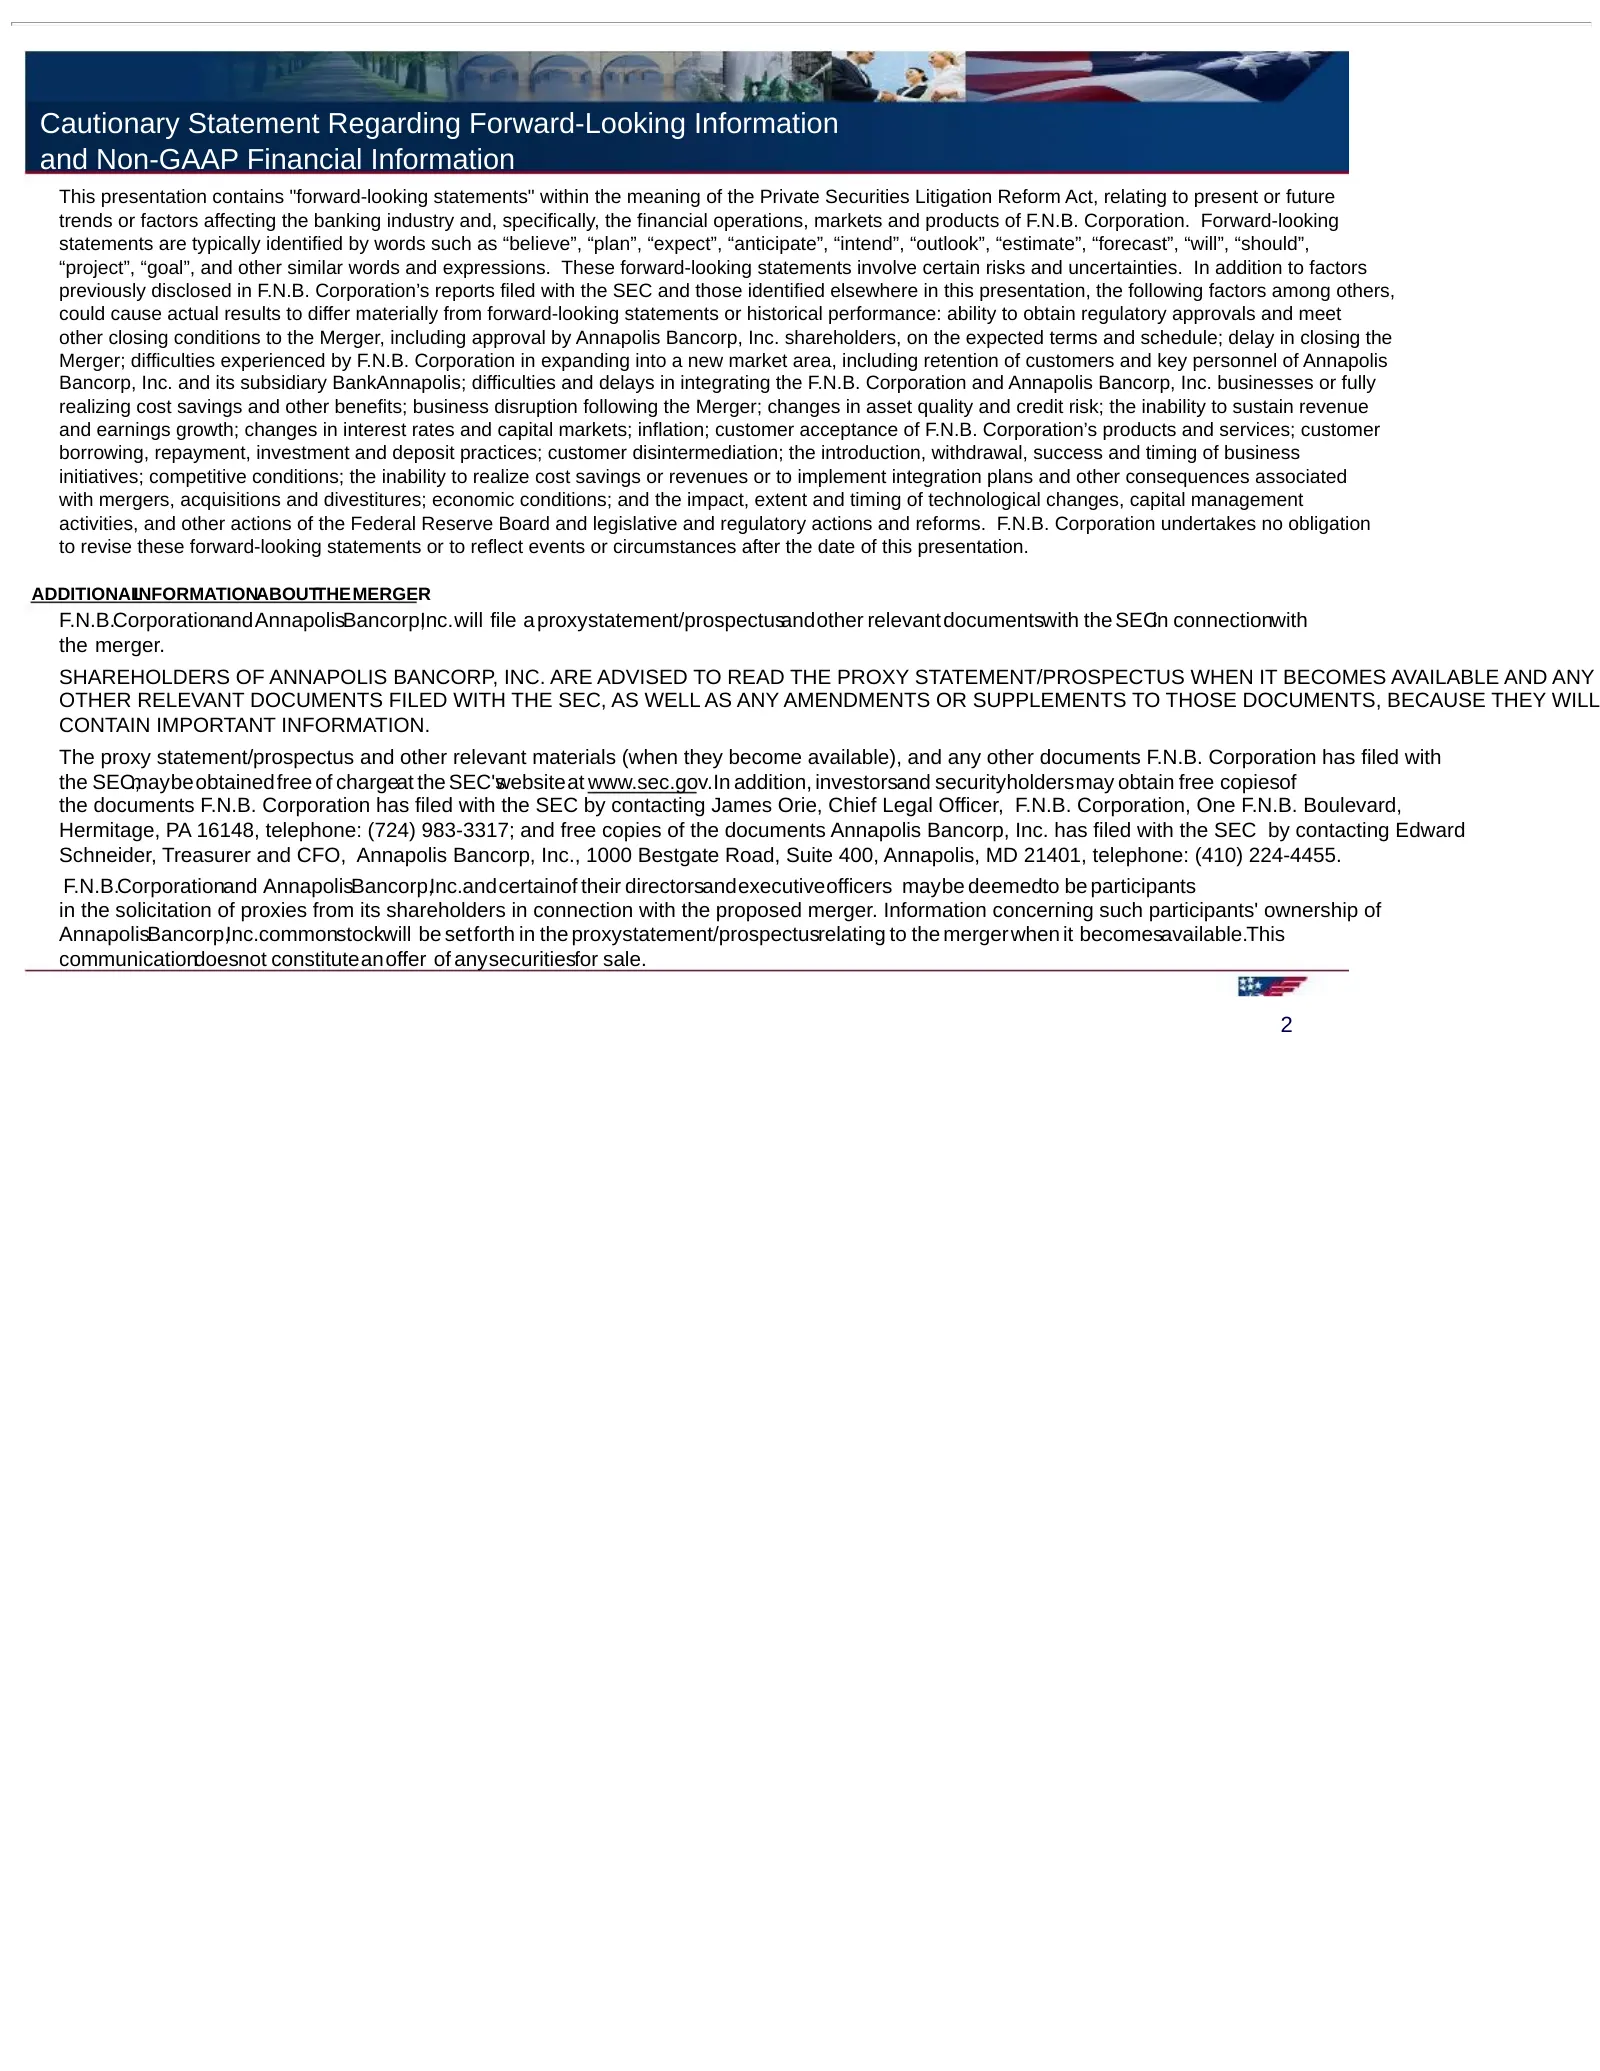
Slide 2: Cautionary Statement Regarding Forward-Looking Information and Non-GAAP Financial Information
Cautionary Statement Regarding Forward-Looking Information and Non-GAAP Financial Information This presentation contains "forward-looking statements" within the meaning of the Private Securities Litigation Reform Act, relating to present or future trends or factors affecting the banking industry and
Slide 3: Opportunity Overview
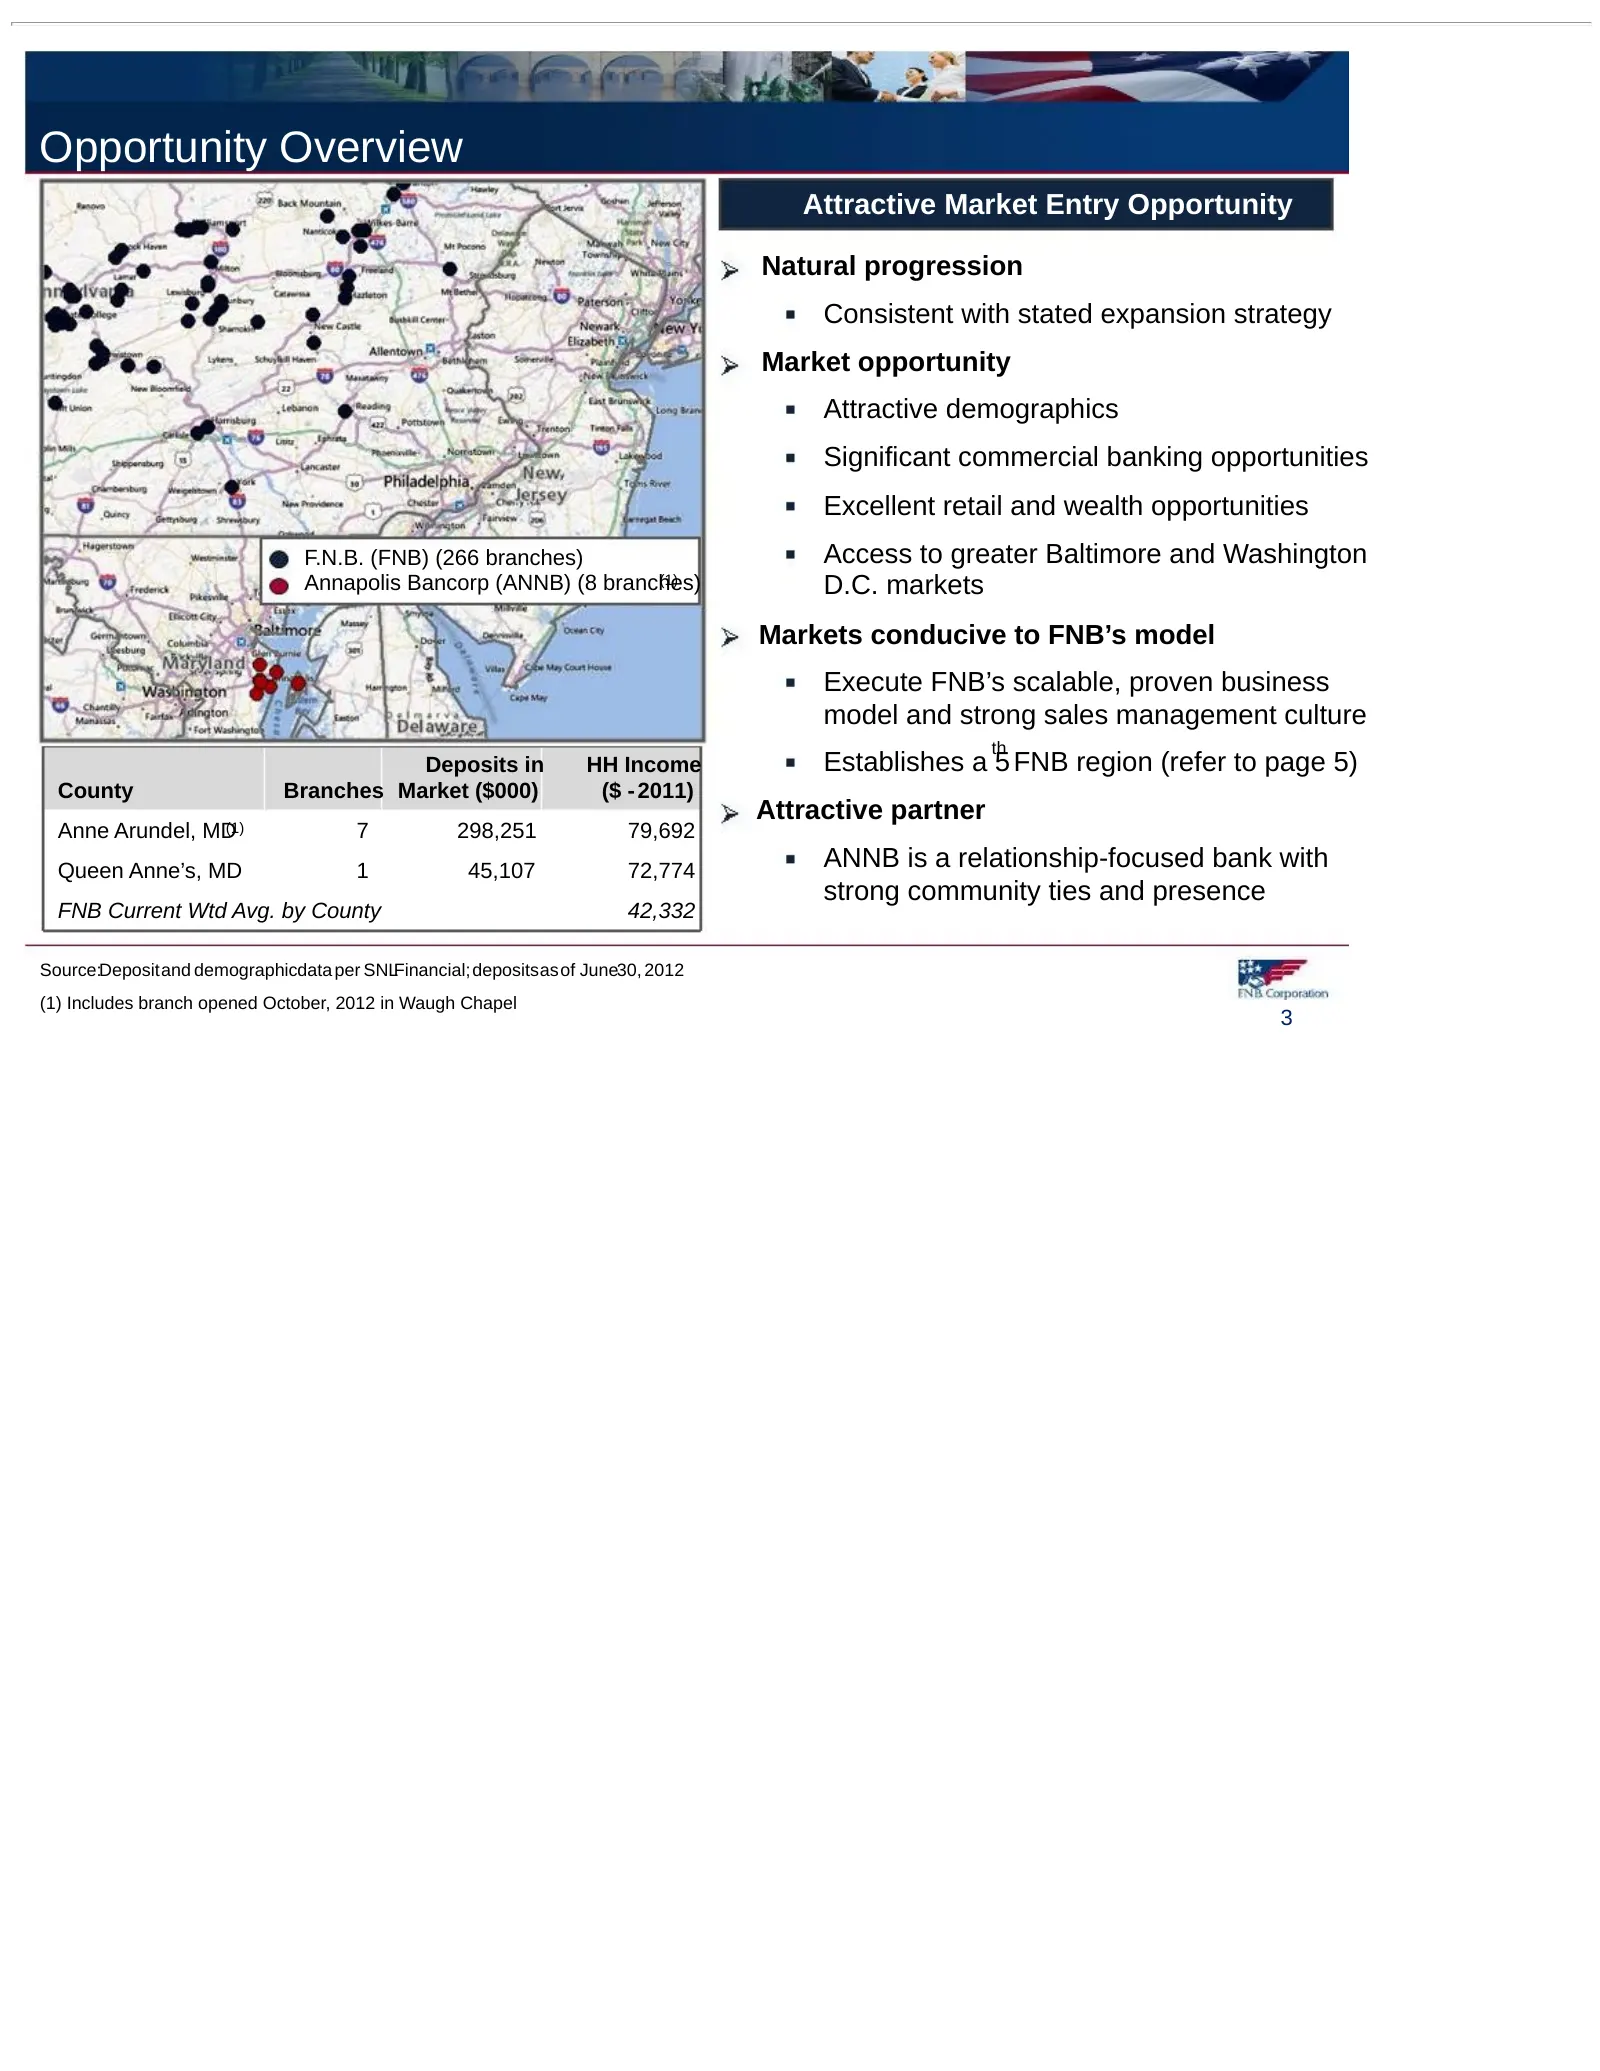
Opportunity Overview Attractive Market Entry Opportunity Natural progression Consistent with stated expansion strategy Market opportunity Attractive demographics Significant commercial banking opportunities Excellent retail and wealth opportunities F.N.B. (FNB) (266 branches) Access to greater Balti
Slide 4: Market Opportunity
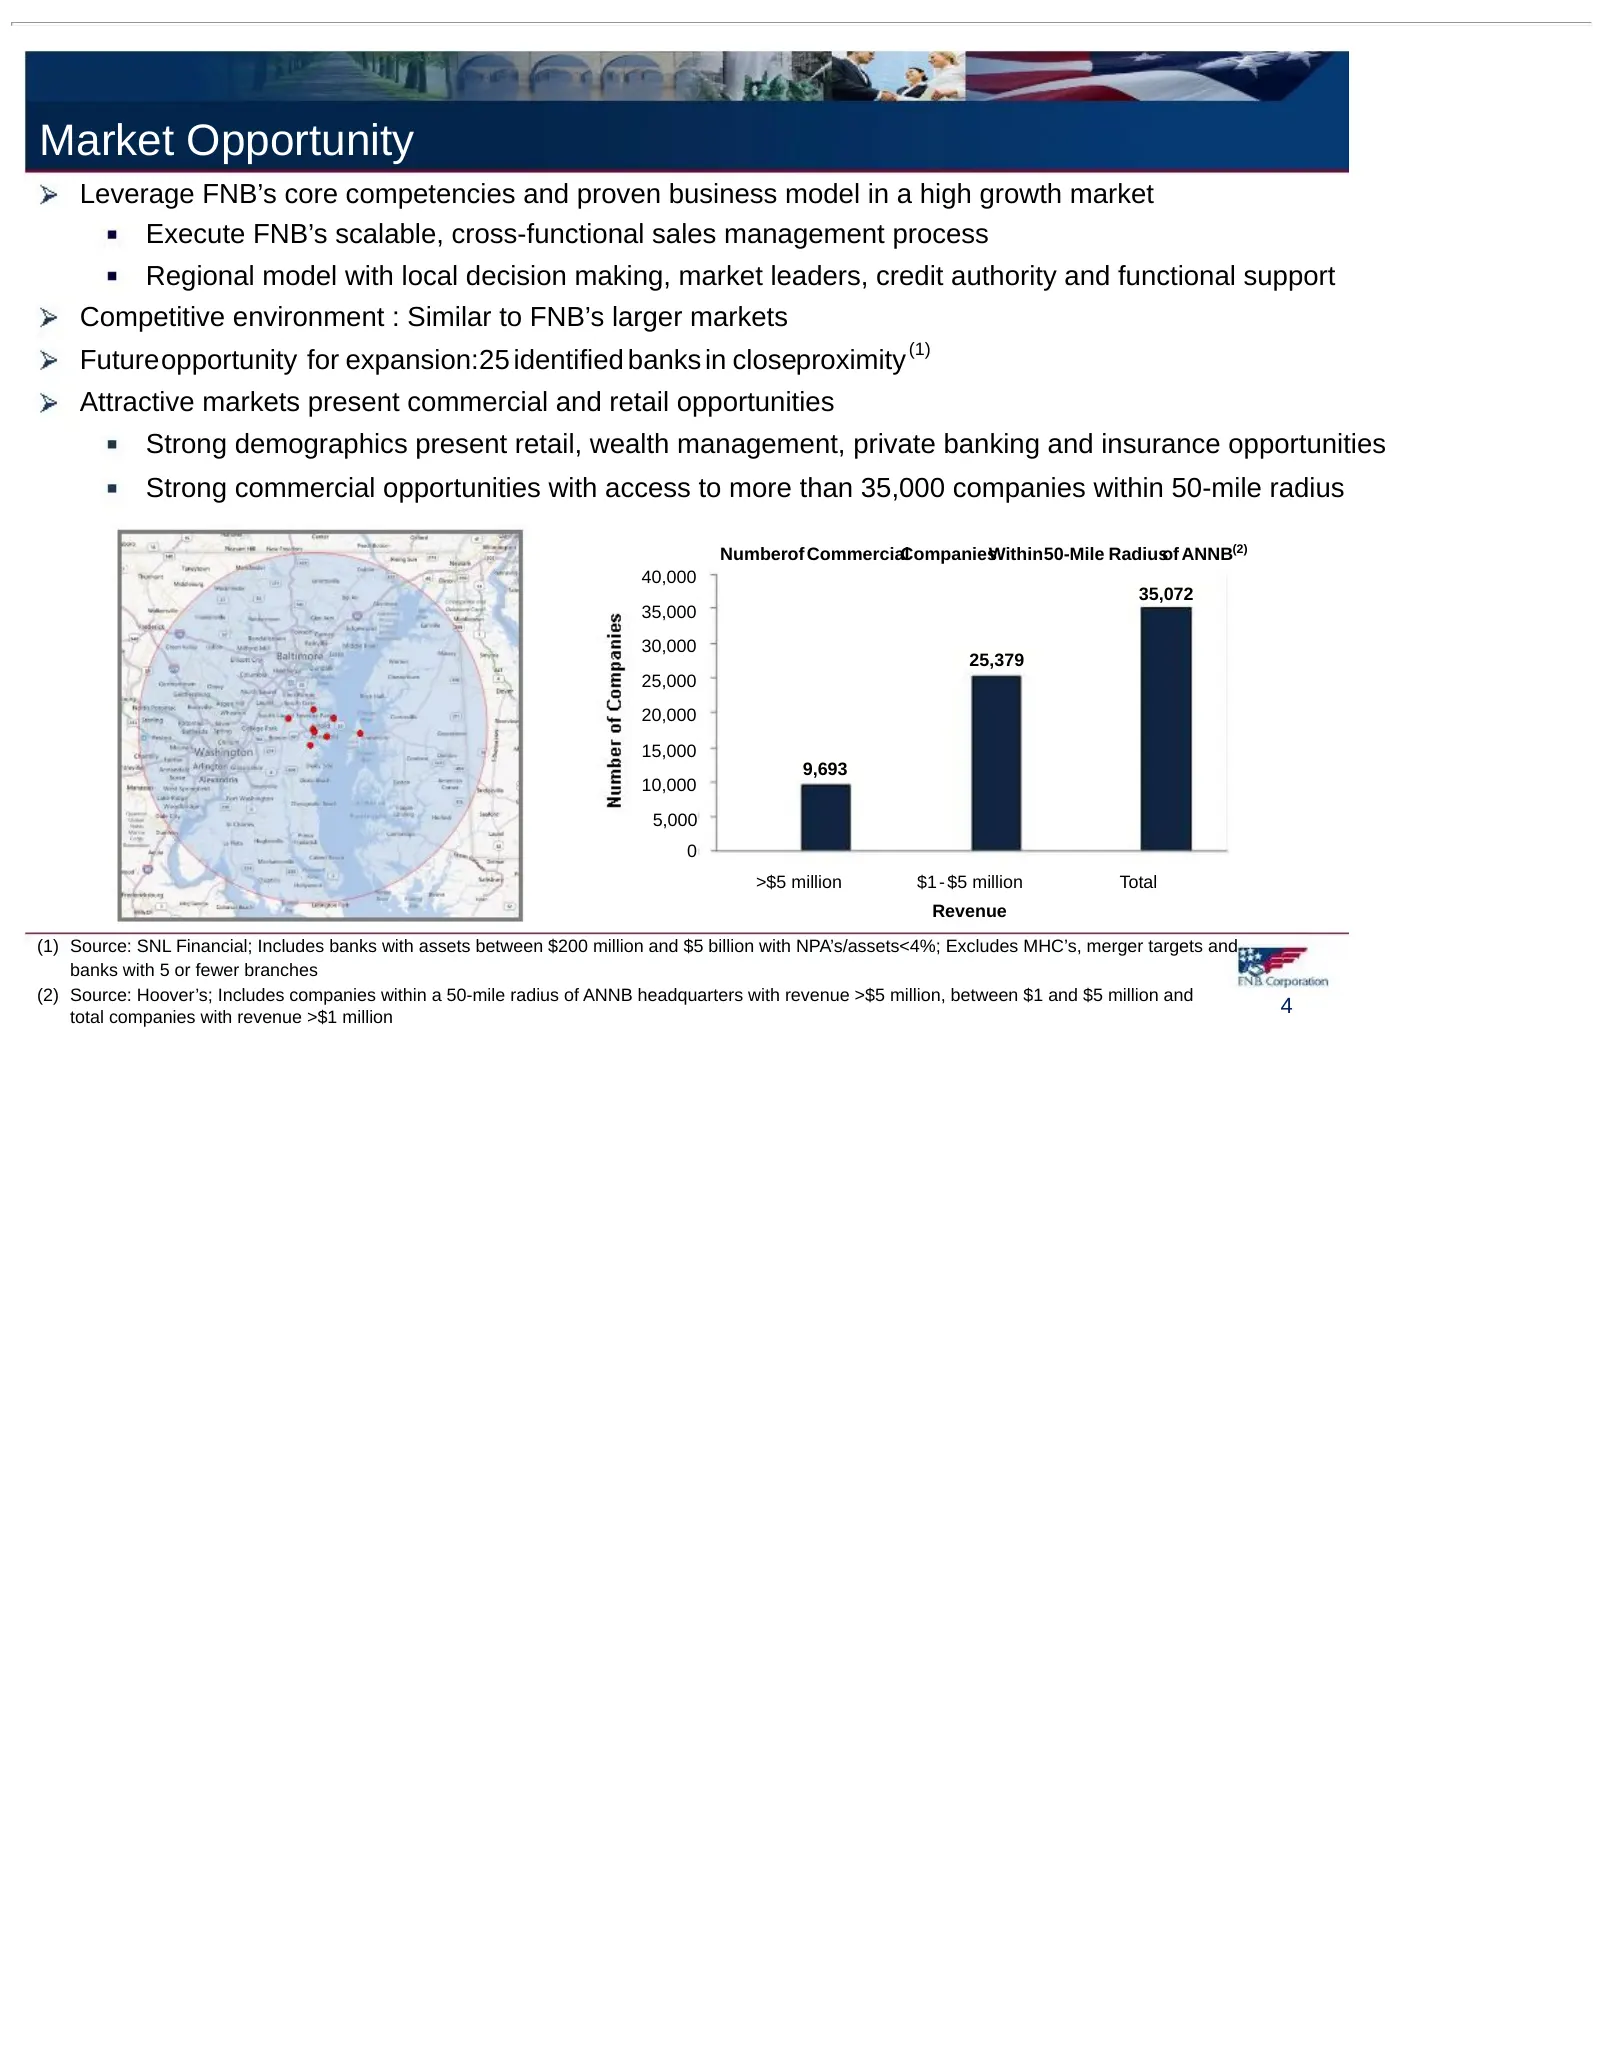
Market Opportunity Leverage FNB’s core competencies and proven business model in a high growth market Execute FNB’s scalable, cross-functional sales management process Regional model with local decision making, market leaders, credit authority and functional support Competitive environment : Similar
Slide 5: FNB's Regional Model
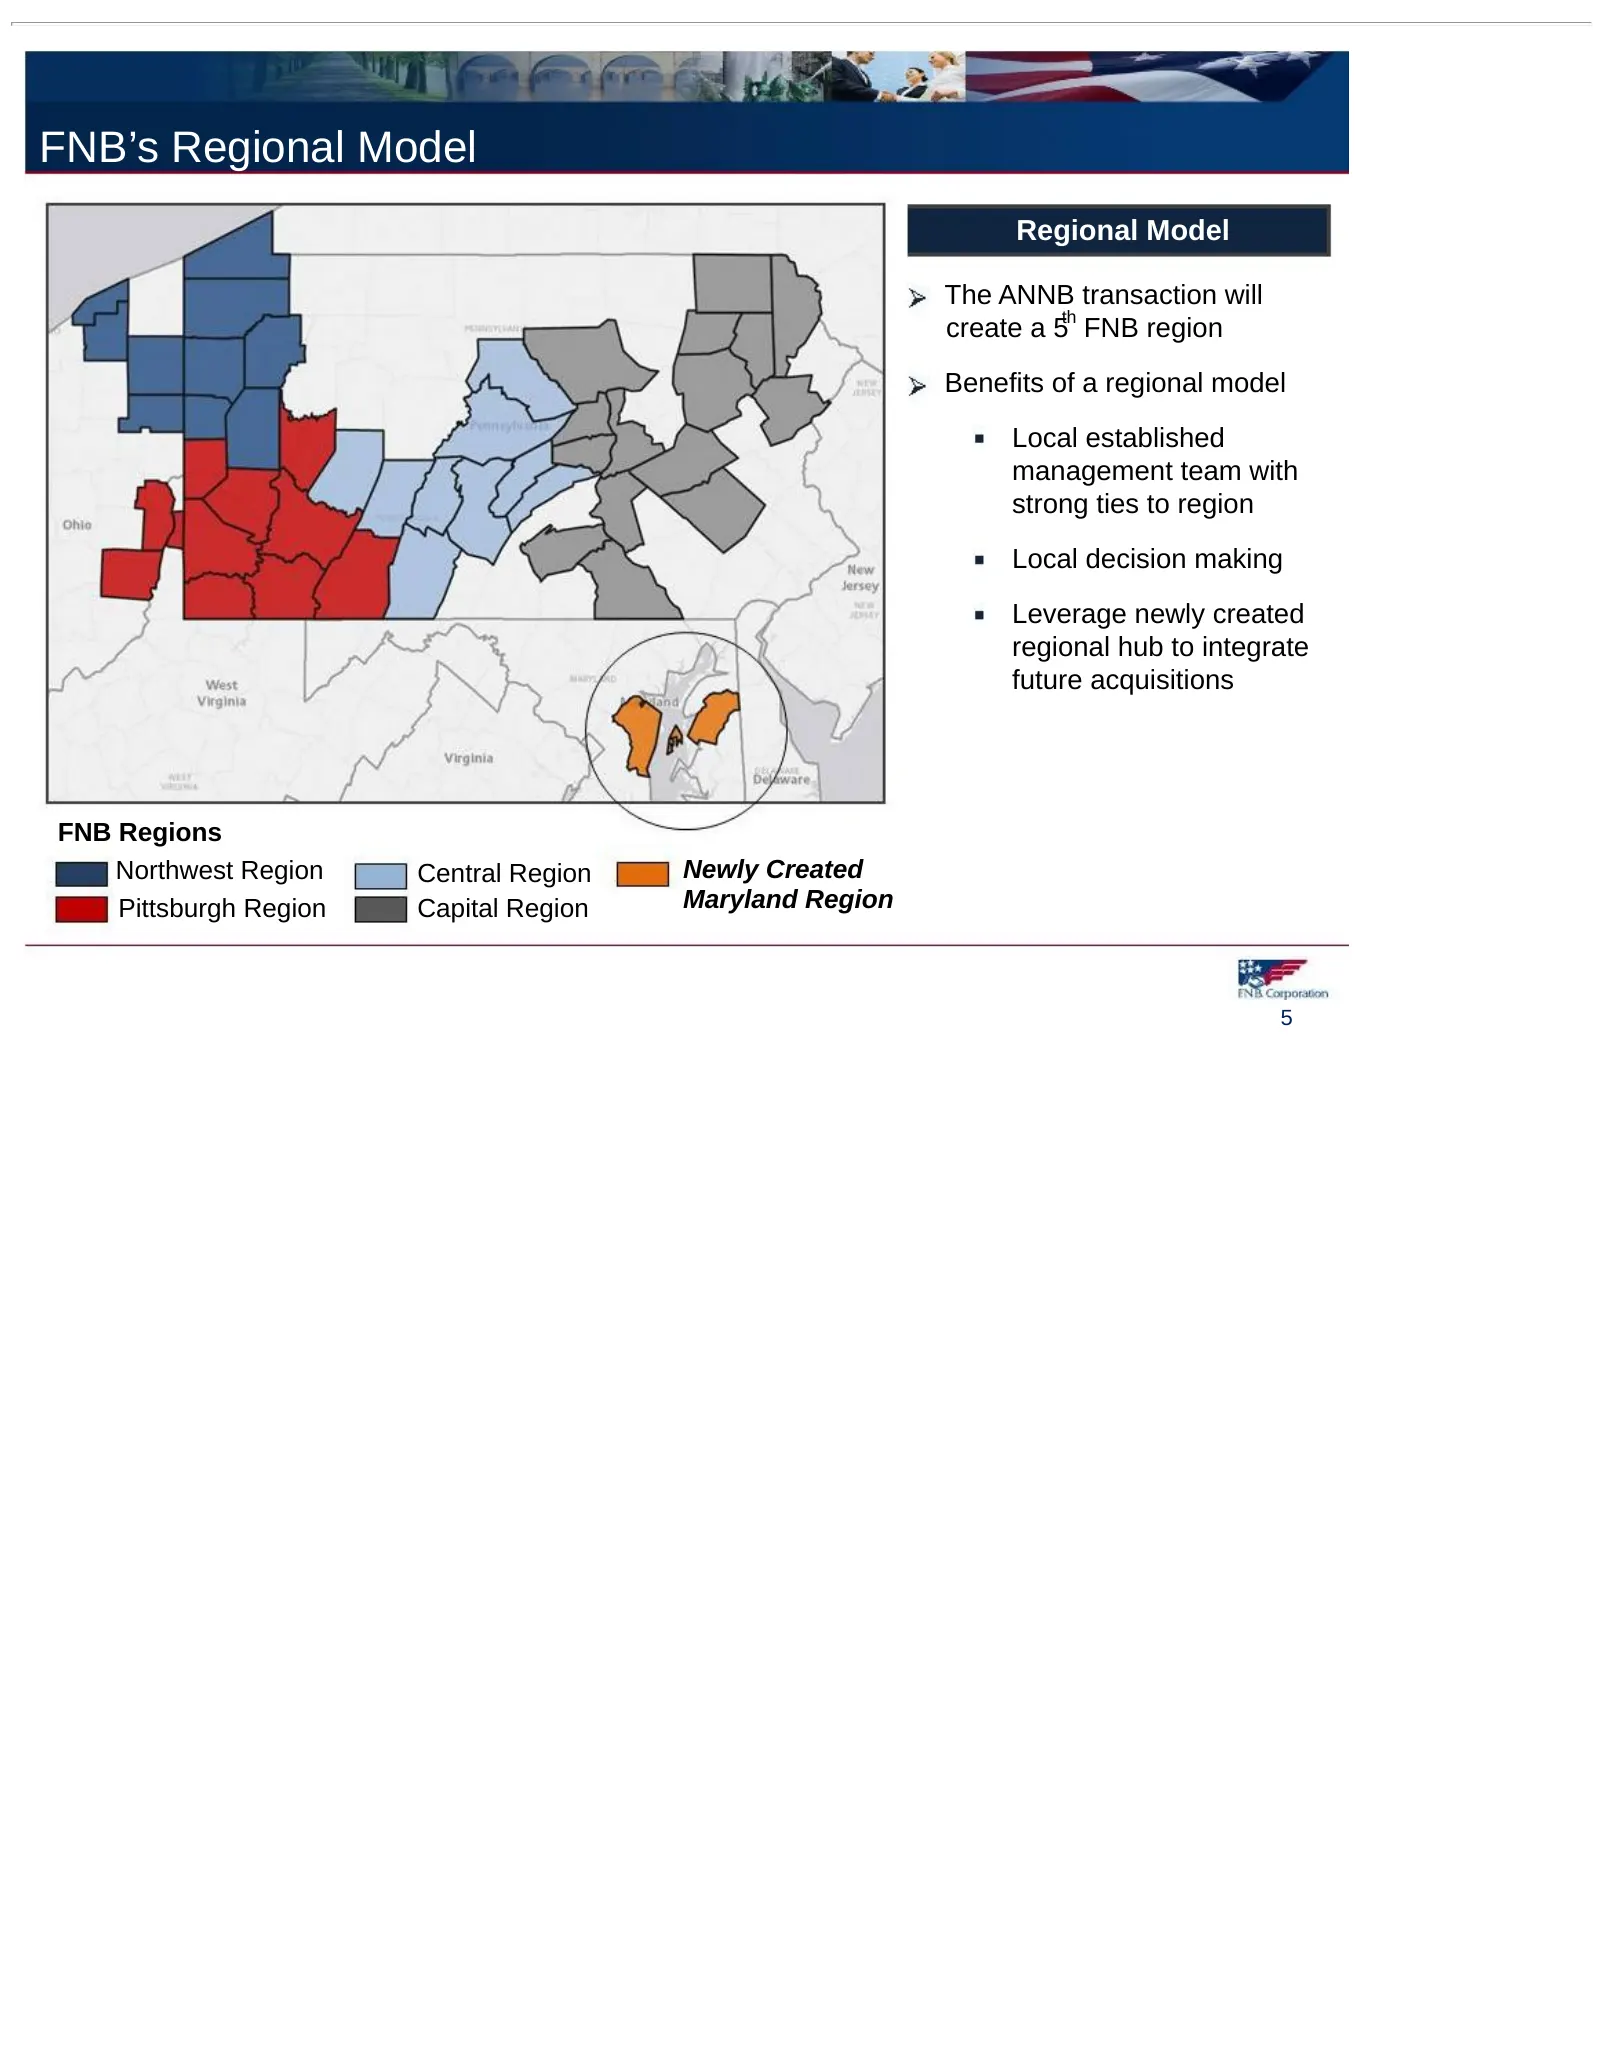
FNB’s Regional Model Regional Model The ANNB transaction will th create a 5 FNB region Benefits of a regional model Local established management team with strong ties to region Local decision making Leverage newly created regional hub to integrate future acquisitions FNB Regions Northwest Region Cen
Slide 6: Transaction Overview
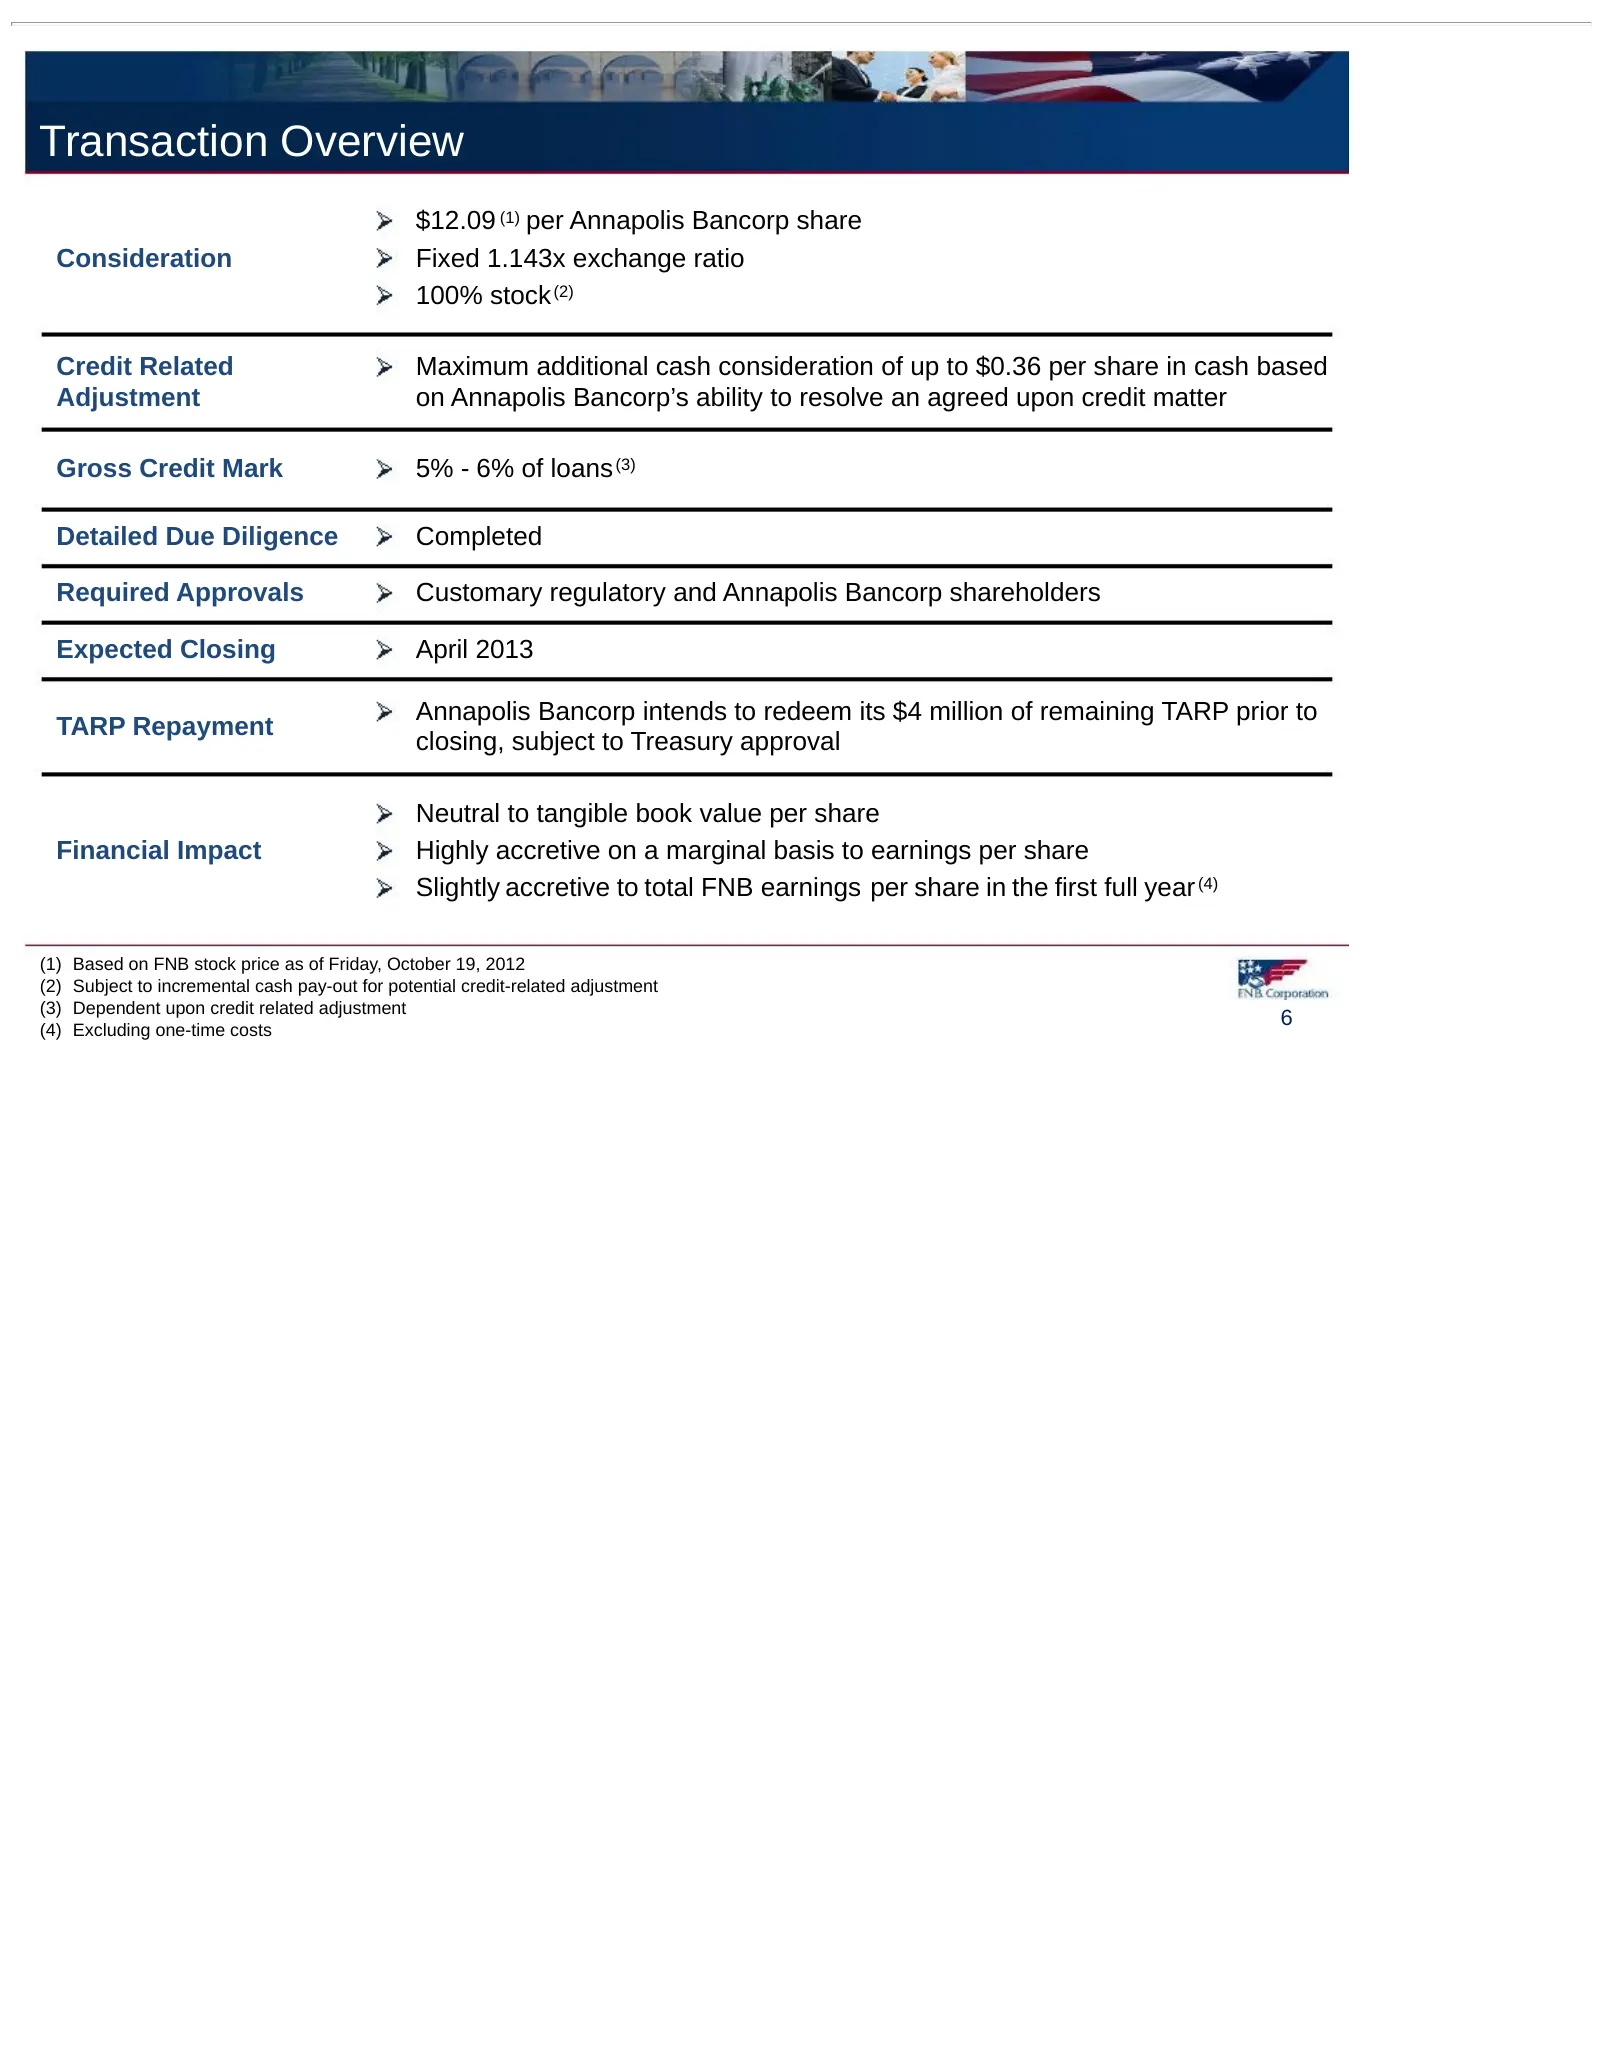
Transaction Overview $12.09 (1) per Annapolis Bancorp share Consideration Fixed 1.143x exchange ratio 100% stock (2) Credit Related Maximum additional cash consideration of up to $0.36 per share in cash based Adjustment on Annapolis Bancorp’s ability to resolve an agreed upon credit matter Gross Cre

Slide 7: Appendix
Appendix 7
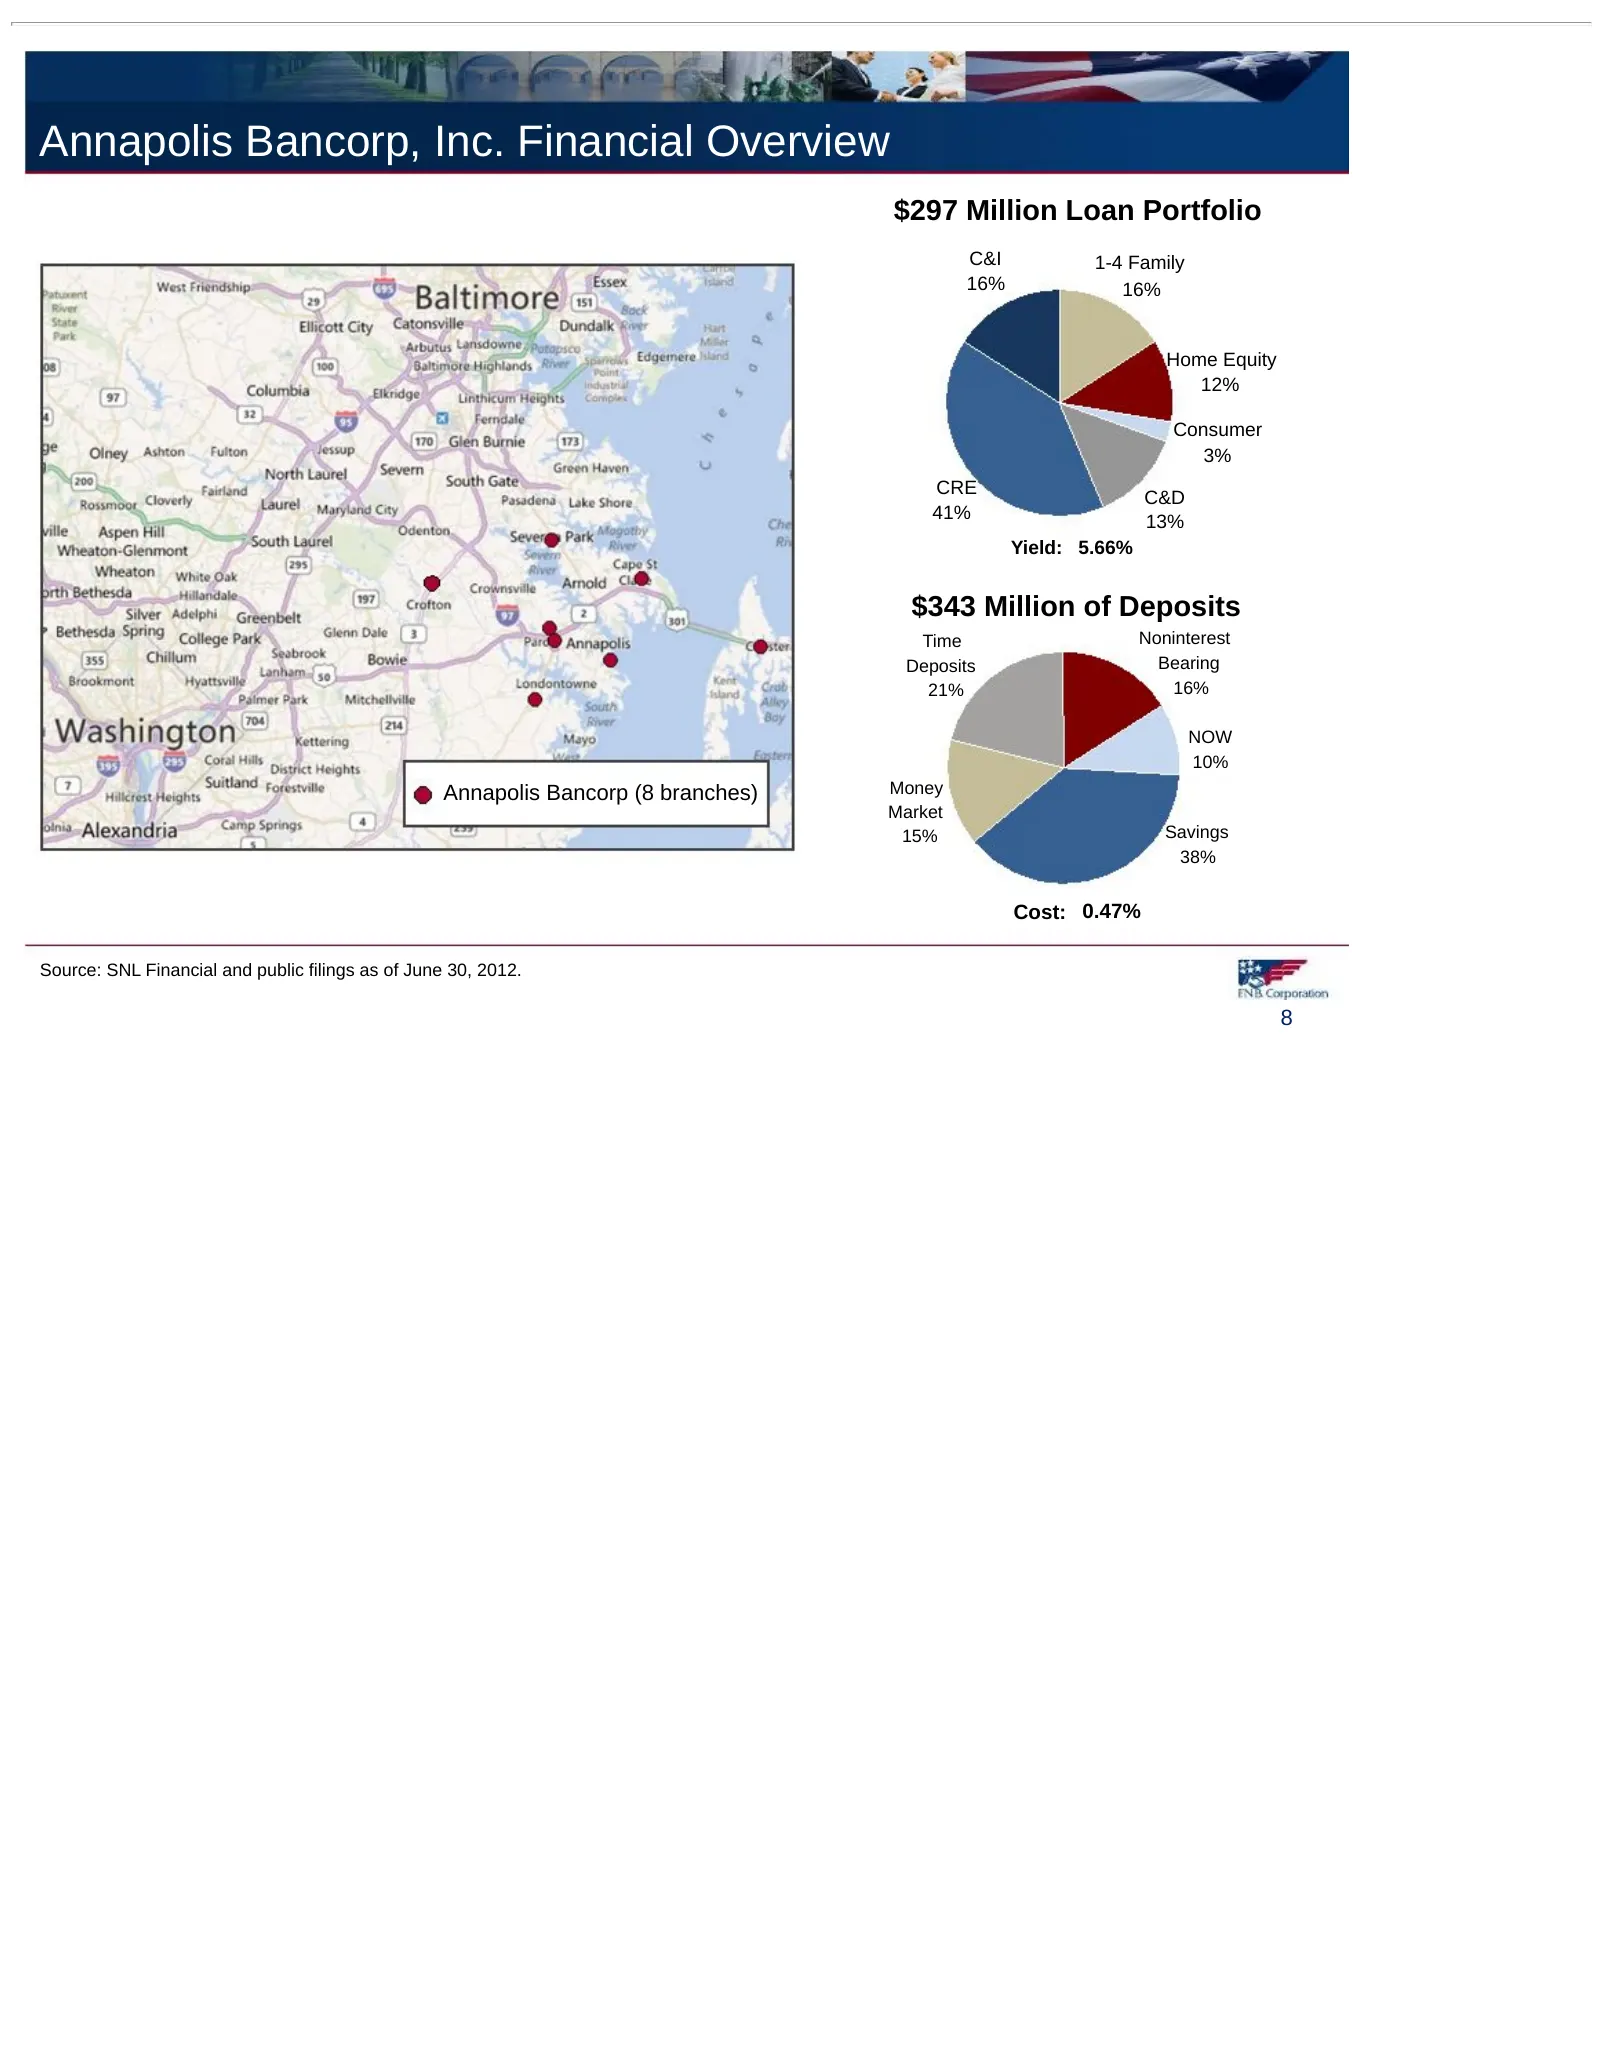
Slide 8: Annapolis Bancorp, Inc. Financial Overview
Annapolis Bancorp, Inc. Financial Overview $297 Million Loan Portfolio C&I 1-4 Family 16% 16% Home Equity 12% Consumer 3% CRE C&D 41% 13% Yield: 5.66% $343 Million of Deposits Time Noninterest Deposits Bearing 21% 16% NOW 10% Annapolis Bancorp (8 branches) Money Market 15% Savings 38% Cost: 0.47% So
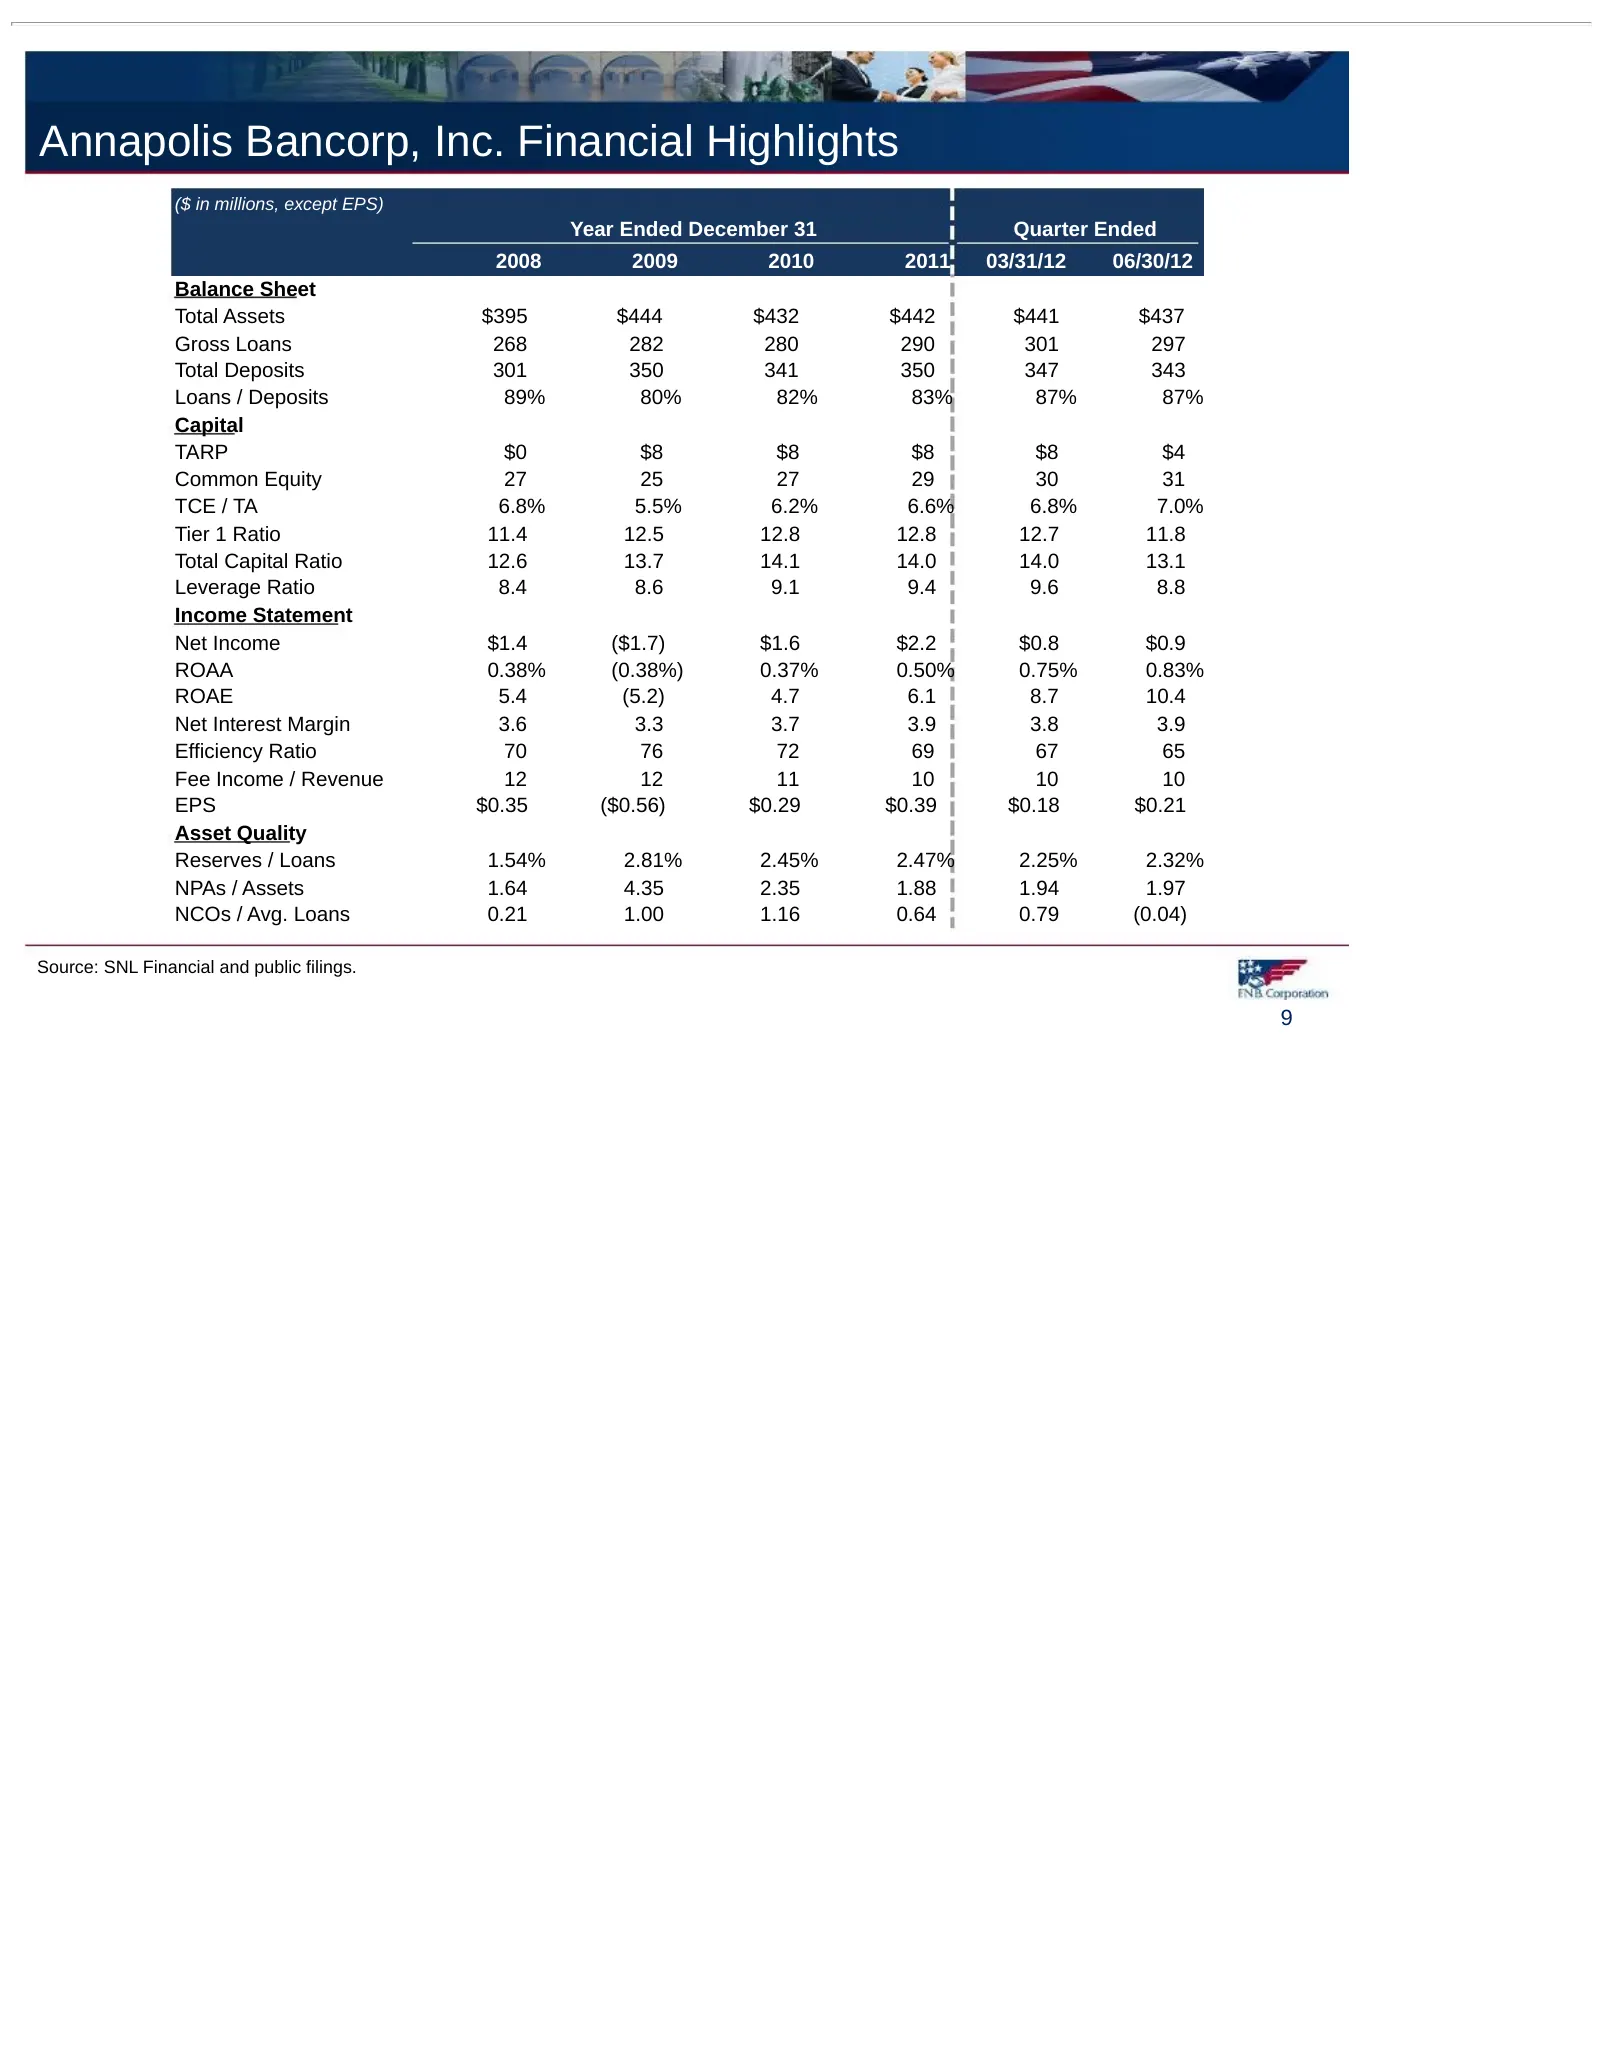
Slide 9: Annapolis Bancorp, Inc. Financial Highlights
Annapolis Bancorp, Inc. Financial Highlights ($ in millions, except EPS) Year Ended December 31 Quarter Ended 2008 2009 2010 2011 03/31/12 06/30/12 Balance Sheet Total Assets $395 $444 $432 $442 $441 $437 Gross Loans 268 282 280 290 301 297 Total Deposits 301 350 341 350 347 343 Loans / Deposits 89%
Source: SEC EDGAR · 425 filed Oct 22, 2012