Annapolis Bancorp — KBW Boston Bank Conference 2013
53 slides from Annapolis Bancorp's conference presentation, Feb 27, 2013
Slide 1: F.N.B. Corporation Investor Presentation
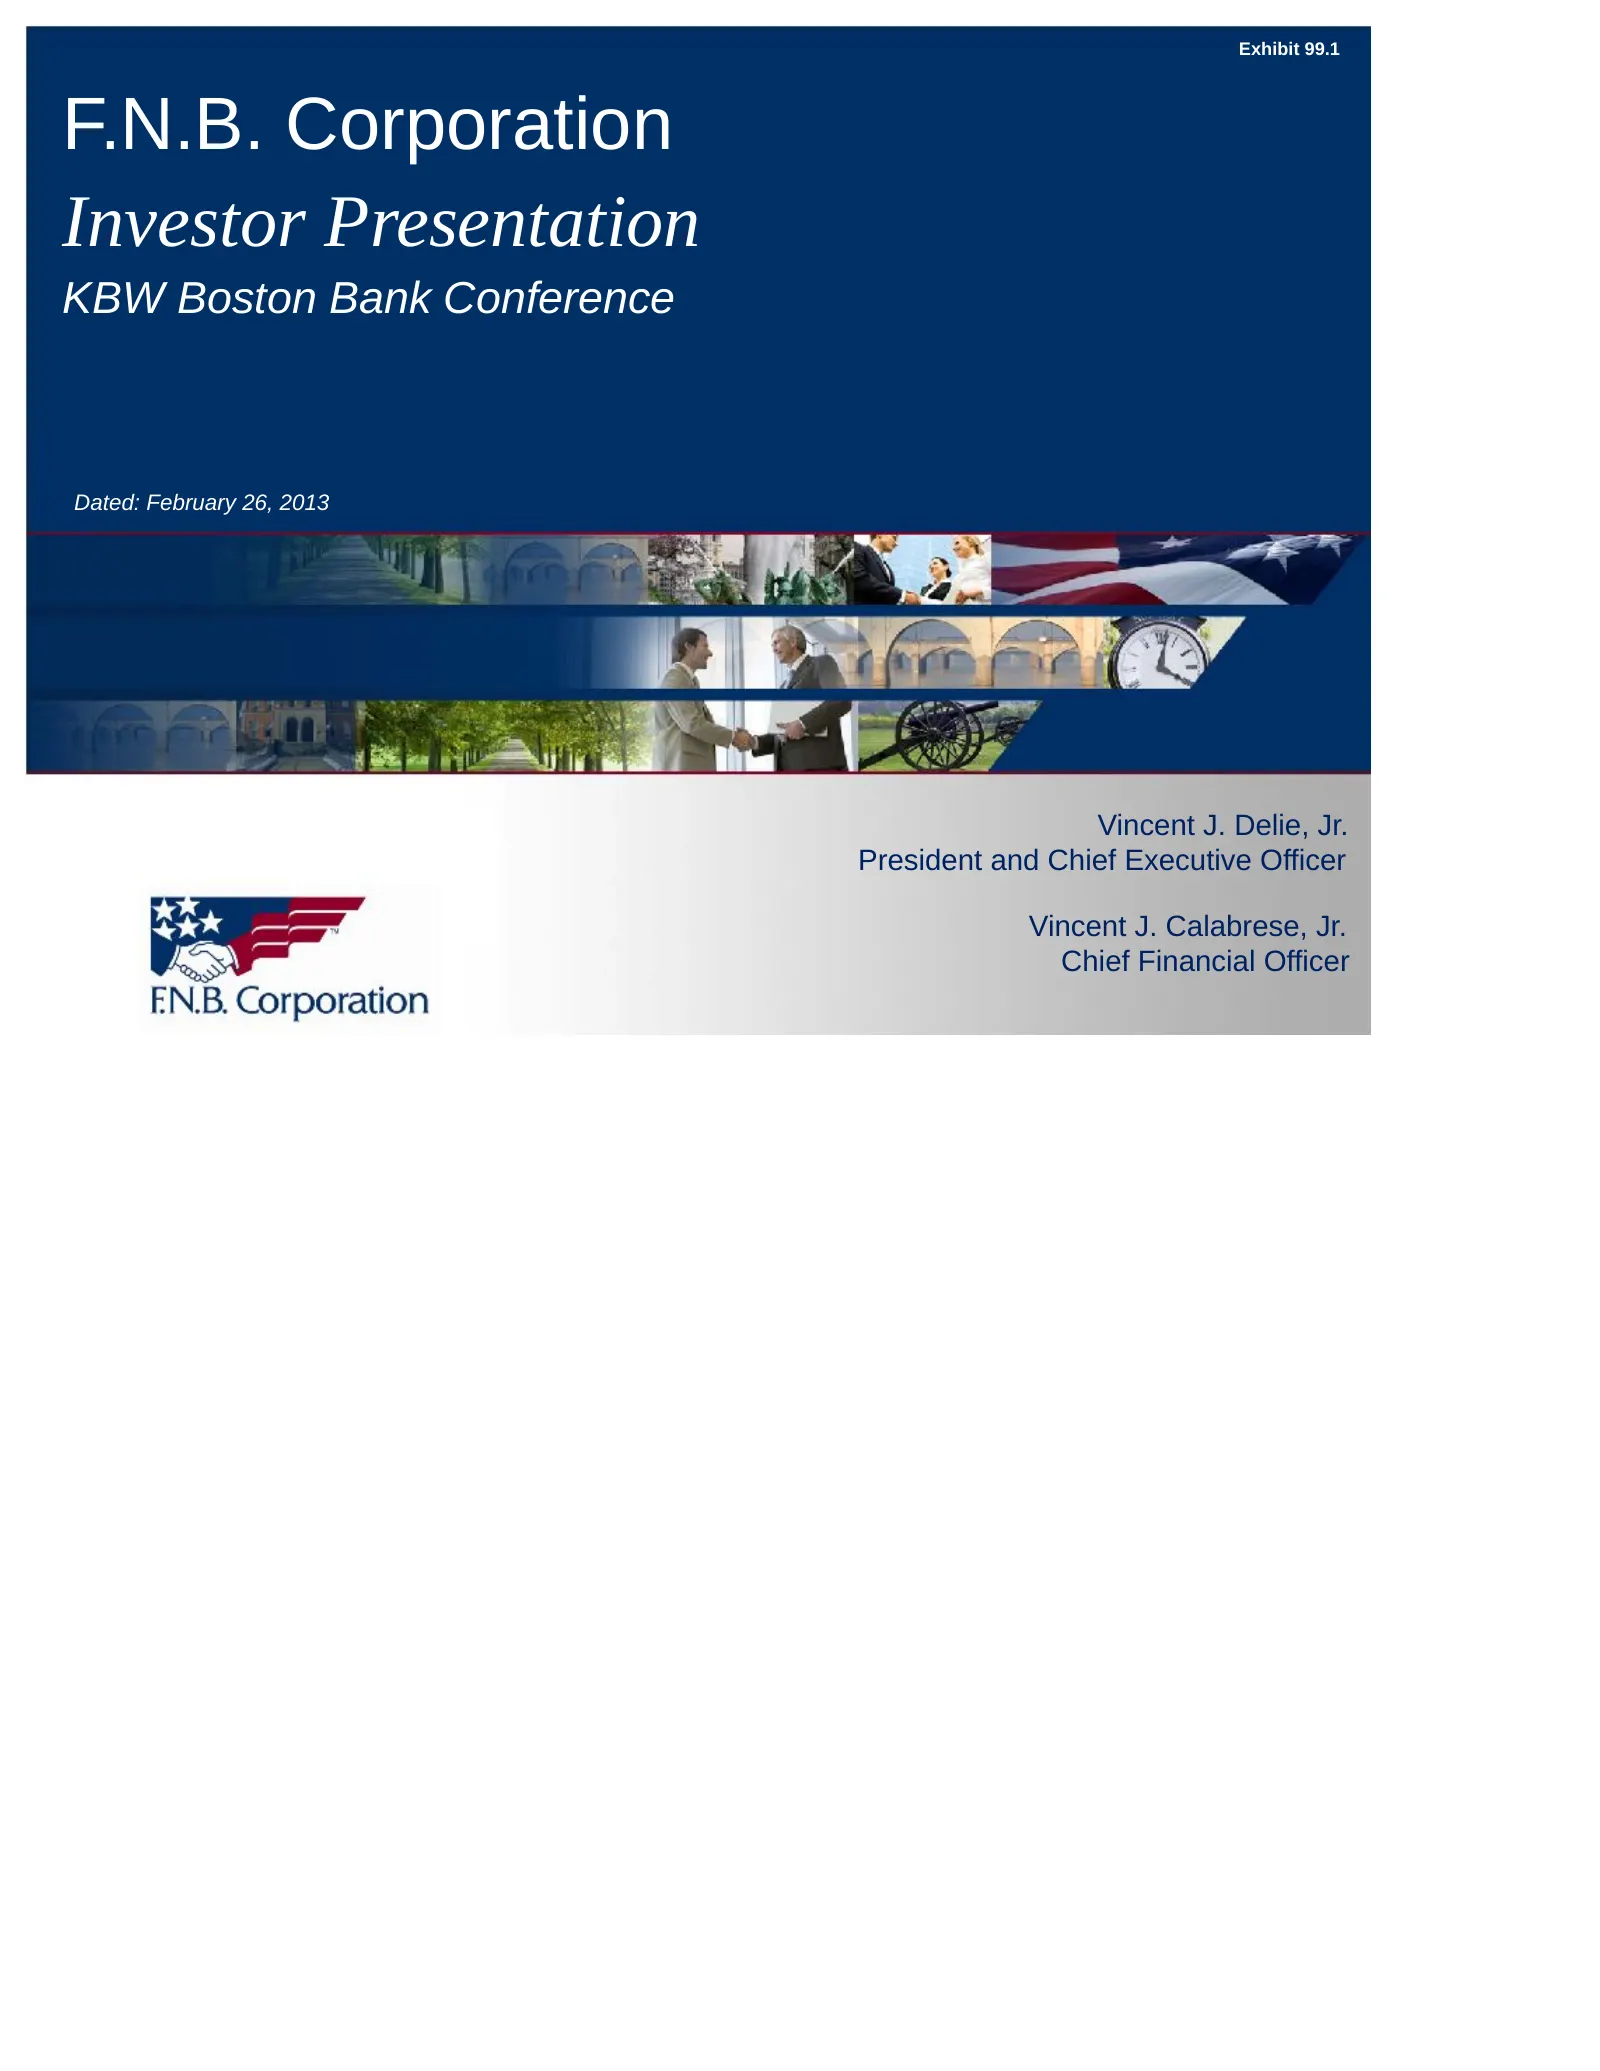
Exhibit 99.1 F.N.B. Corporation Investor Presentation KBW Boston Bank Conference Dated: February 26, 2013 Vincent J. Delie, Jr. President and Chief Executive Officer Vincent J. Calabrese, Jr. Chief Financial Officer
Slide 2: Cautionary Statement Regarding Forward-Looking Information and Non-GAAP Financial Information
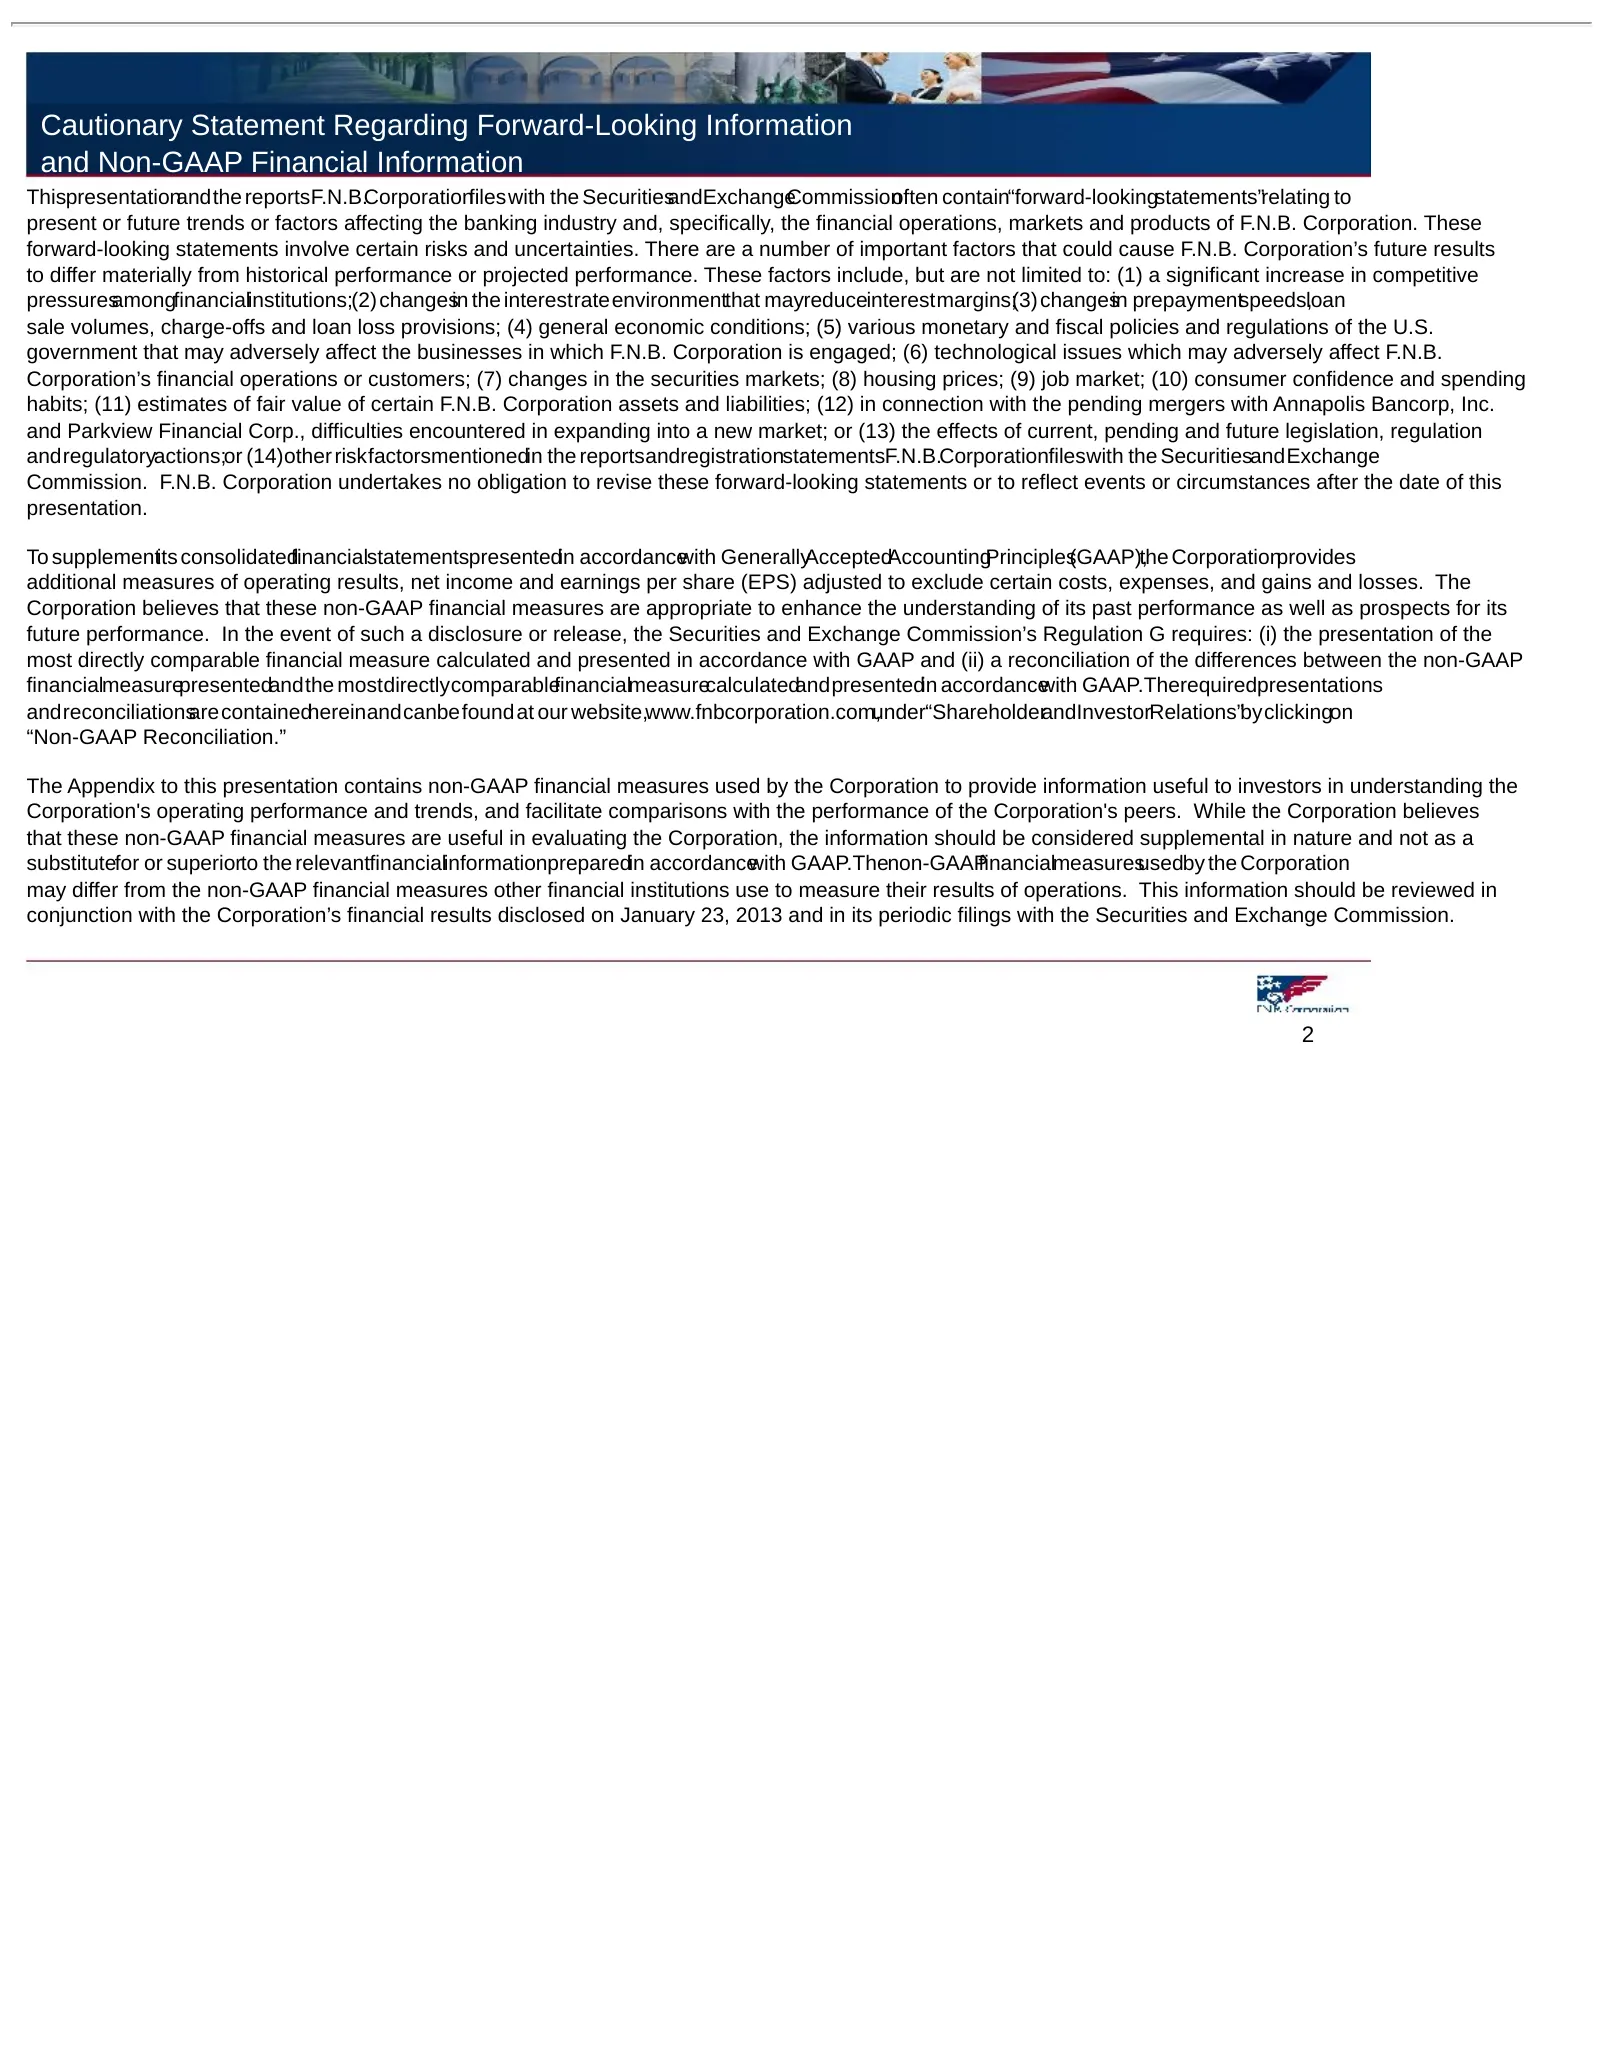
Cautionary Statement Regarding Forward-Looking Information and Non-GAAP Financial Information Thispresentationandthe reportsF.N.B.Corporationfileswith the SecuritiesandExchangeCommission often contain“forward-lookingstatements”relating to present or future trends or factors affecting the banking ind
Slide 3: Additional Information About the Mergers
Additional Information About the Mergers INFORMATION ABOUT THE MERGER WITH PVFC F.N.B. Corporation (FNB) and PVF Capital Corp. (PVFC) will file a proxy statement/prospectus and other relevant documents with the SEC in connection with their pending merger. SHAREHOLDERS OF PVF CAPITAL CORP. ARE ADVISE
Slide 4: F.N.B. Corporation
F.N.B. Corporation 4
Slide 5: Key Investment Considerations
Key Investment Considerations Positioned to Achieve Long-Term Growth 1. Experienced leadership 2. Sustainable business model 3. Attractive market position 4. Consistent, strong operating results and favorable trends 5. Proven, disciplined acquisition strategy 6. Investment thesis geared toward share
Slide 6: F.N.B. Corporation
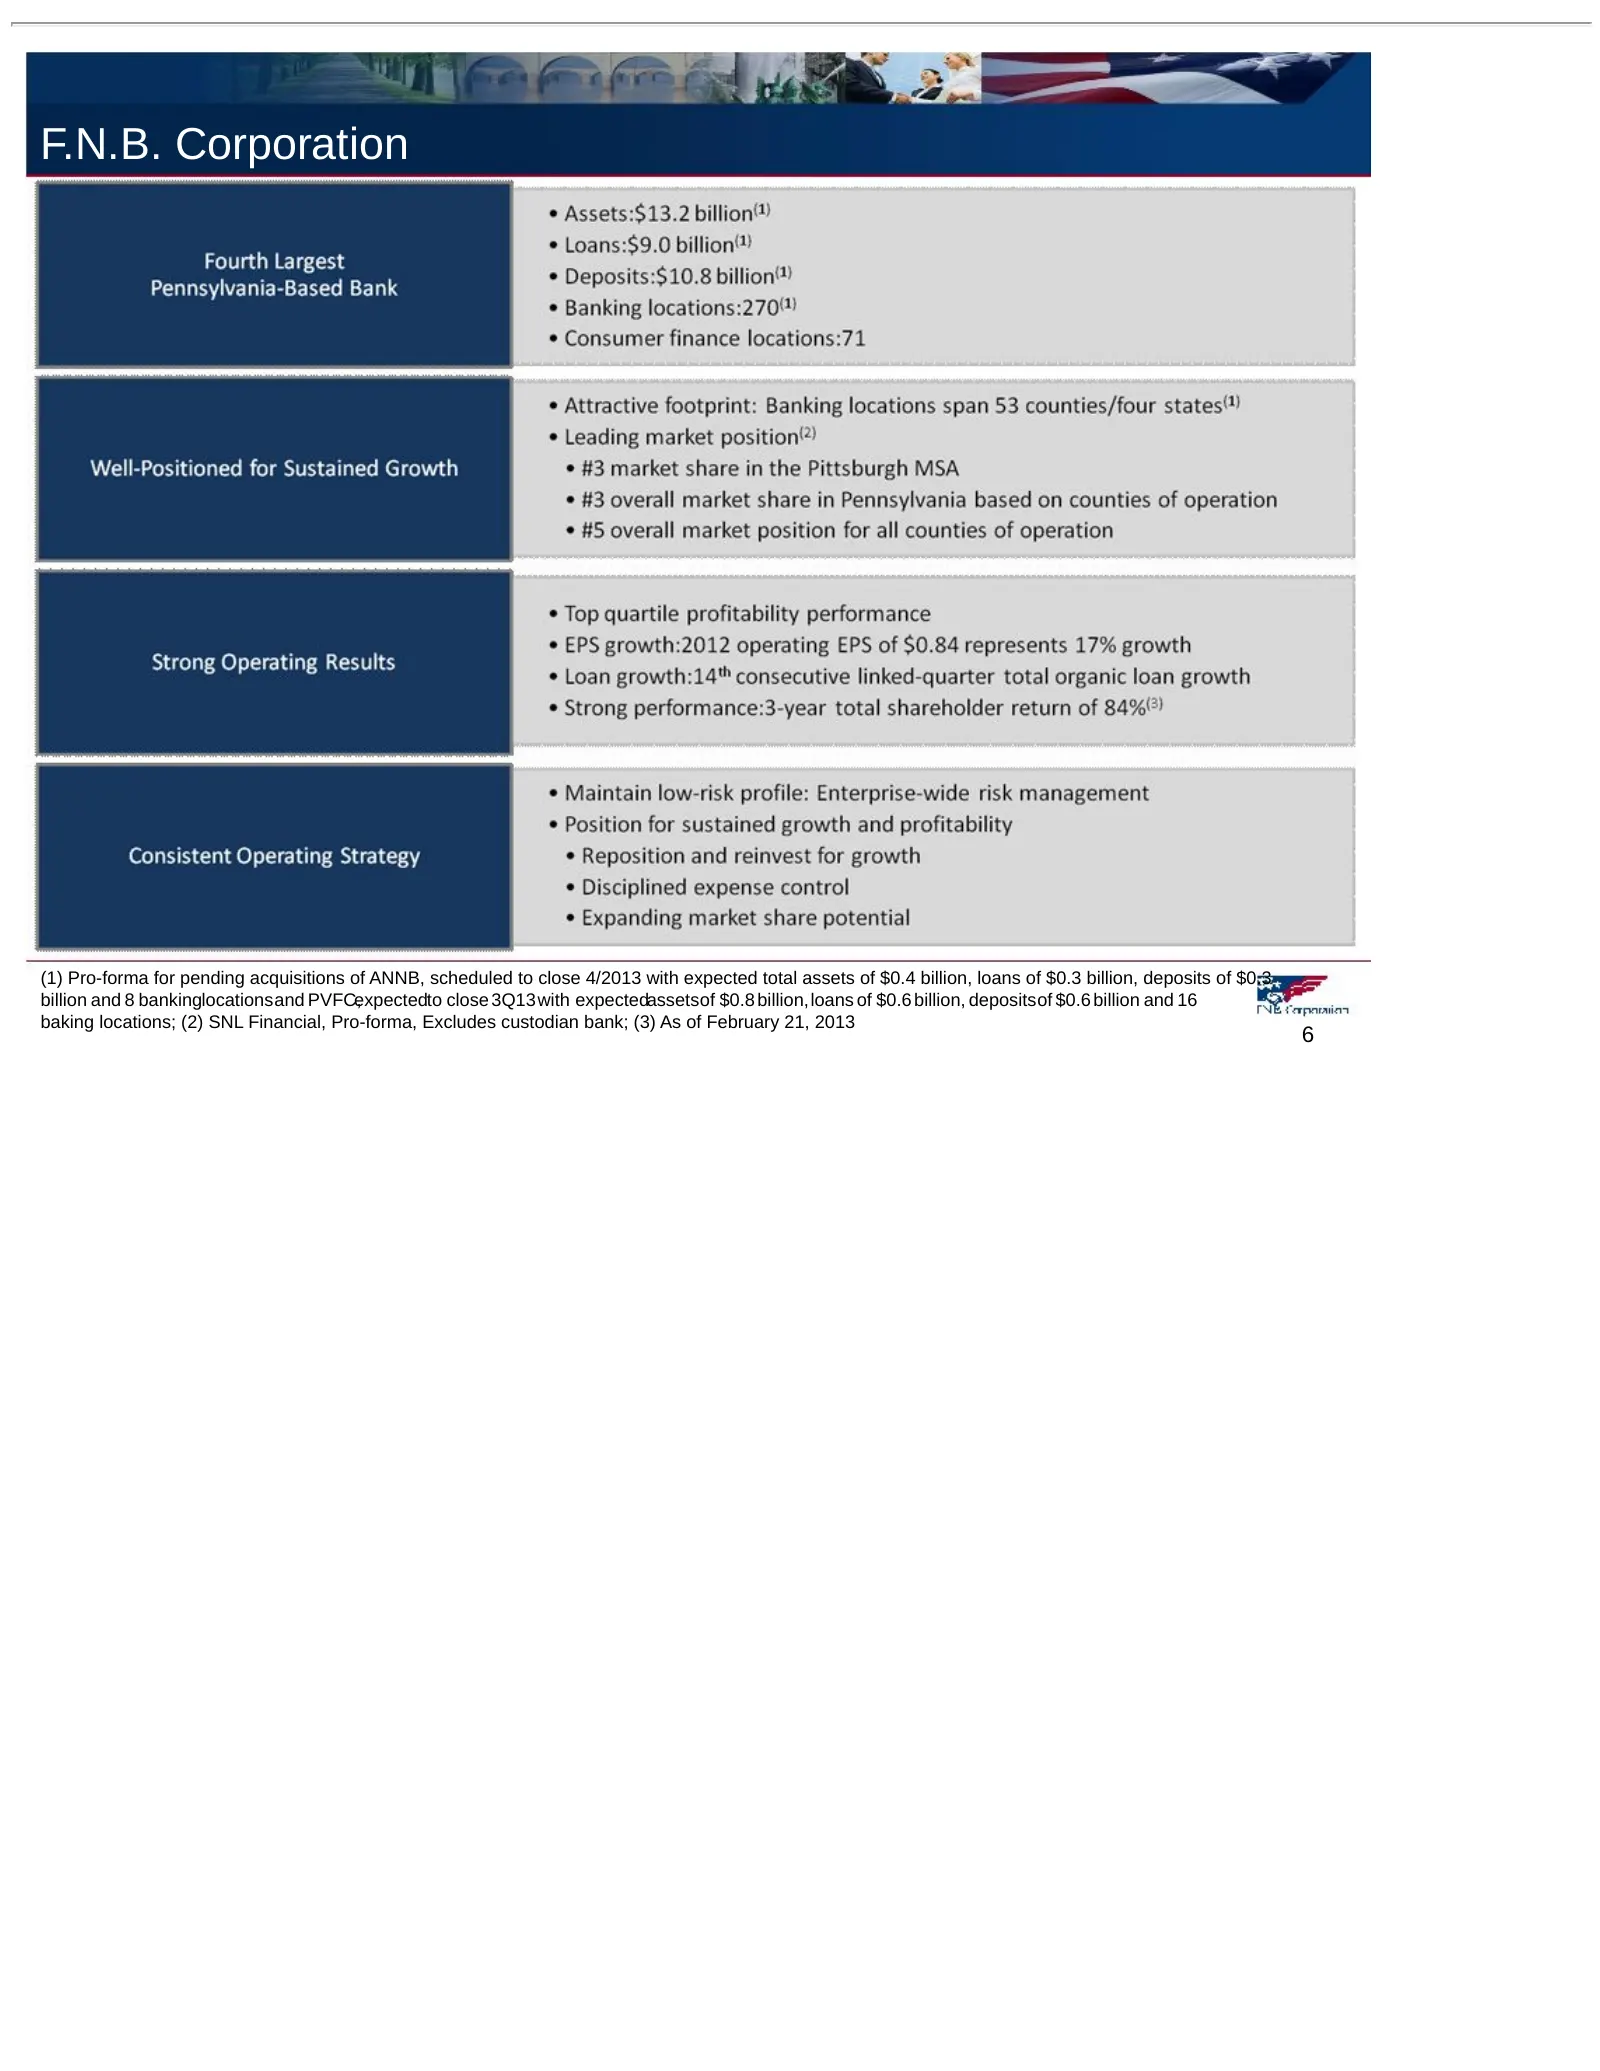
F.N.B. Corporation (1) Pro-forma for pending acquisitions of ANNB, scheduled to close 4/2013 with expected total assets of $0.4 billion, loans of $0.3 billion, deposits of $0.3 billion and 8 bankinglocationsand PVFC,expectedto close 3Q13with expectedassetsof $0.8 billion,loans of $0.6 billion, depos
Slide 7: Experienced Leadership
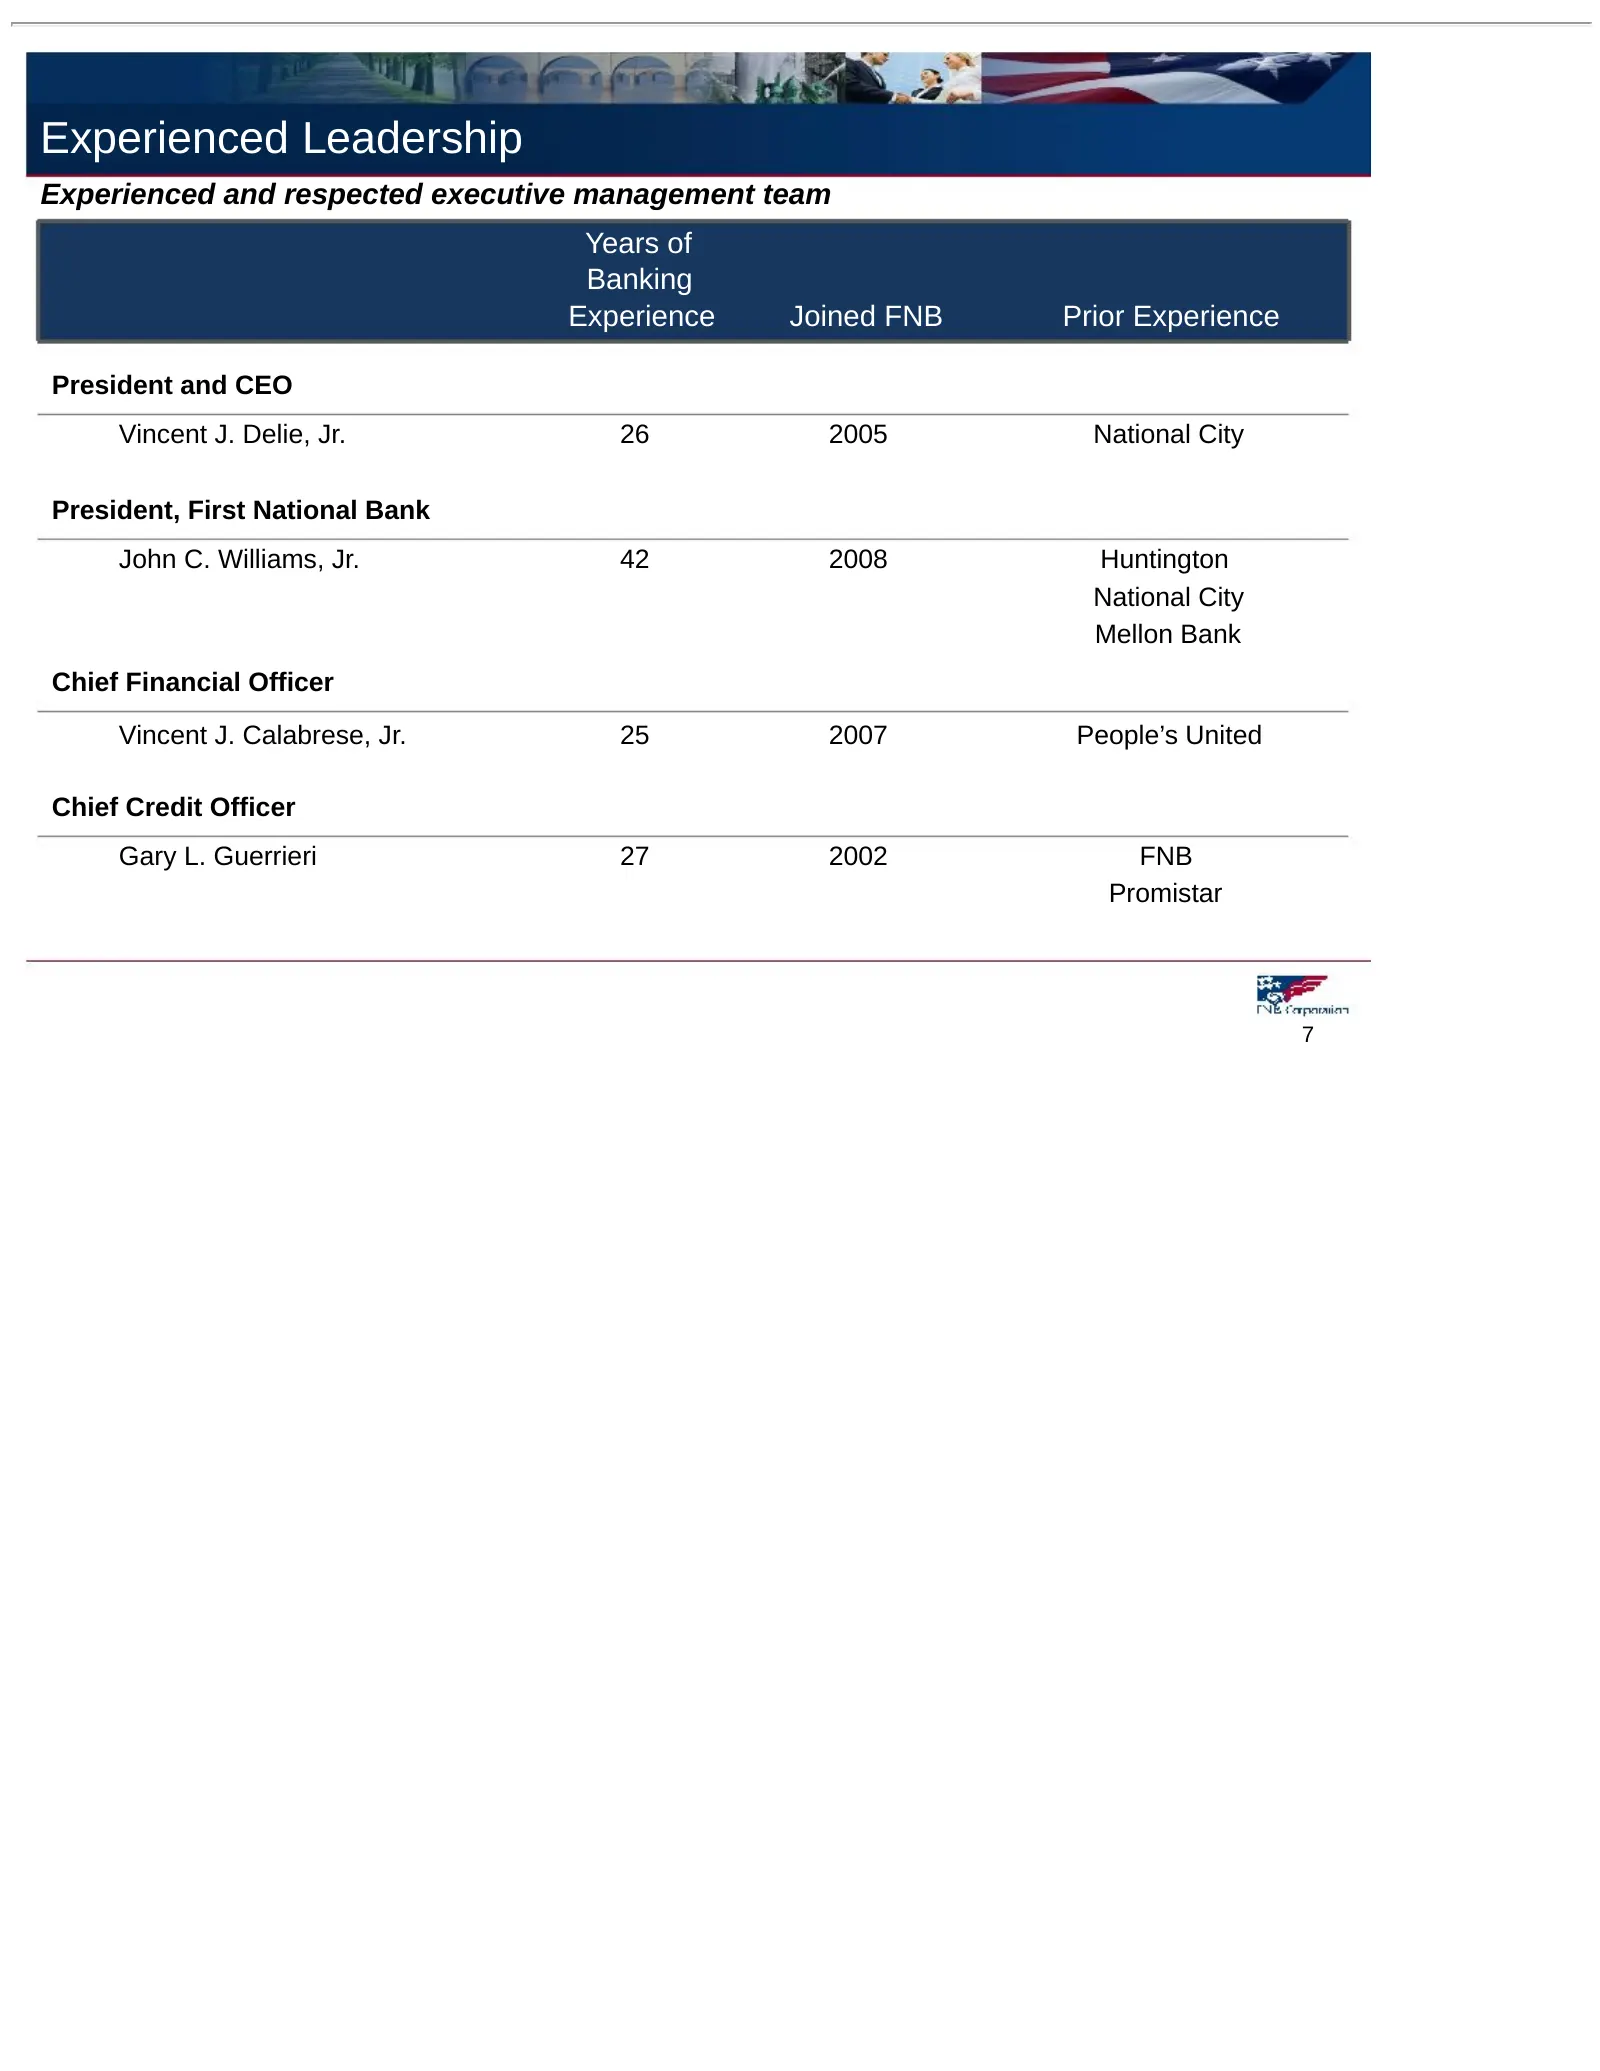
Experienced Leadership Experienced and respected executive management team Years of Banking Experience Joined FNB Prior Experience President and CEO Vincent J. Delie, Jr. 26 2005 National City President, First National Bank John C. Williams, Jr. 42 2008 Huntington National City Mellon Bank Chief Fin
Slide 8: Sustainable Business Model
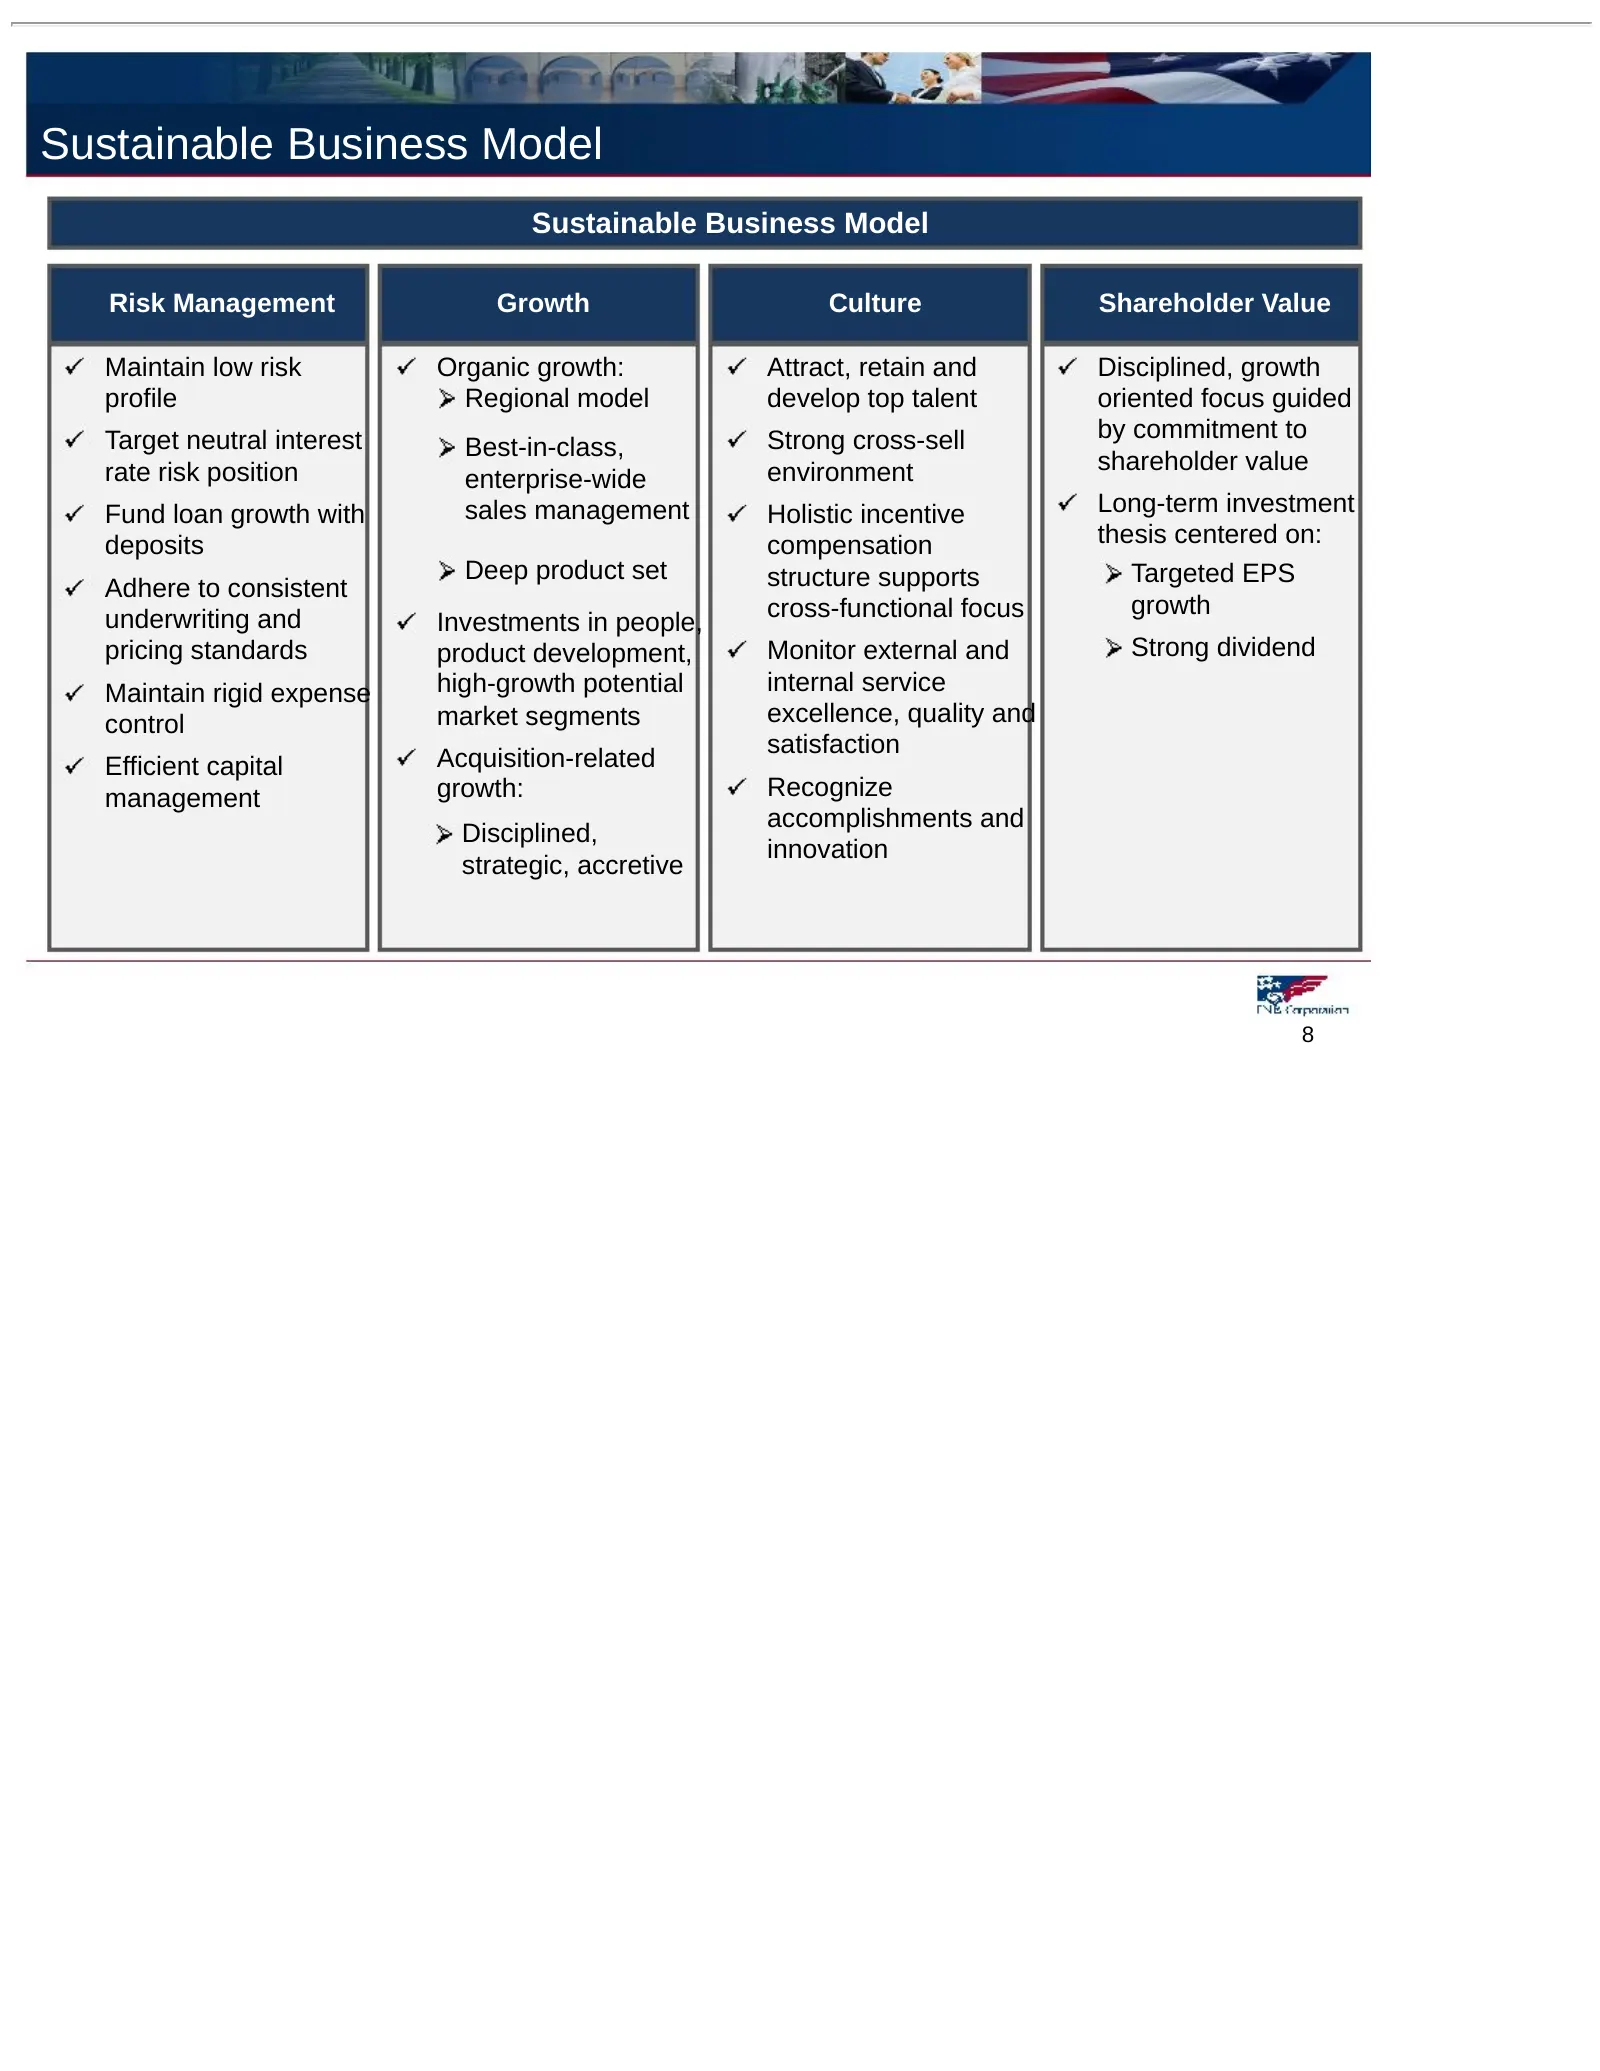
Sustainable Business Model Sustainable Business Model Risk Management Growth Culture Shareholder Value Maintain low risk Organic growth: Attract, retain and Disciplined, growth profile Regional model develop top talent oriented focus guided Target neutral interest Strong cross-sell by commitment to
Slide 9: Reposition and Reinvest Strategy
Reposition and Reinvest Strategy 9
Slide 10: Reposition and Reinvest Strategy
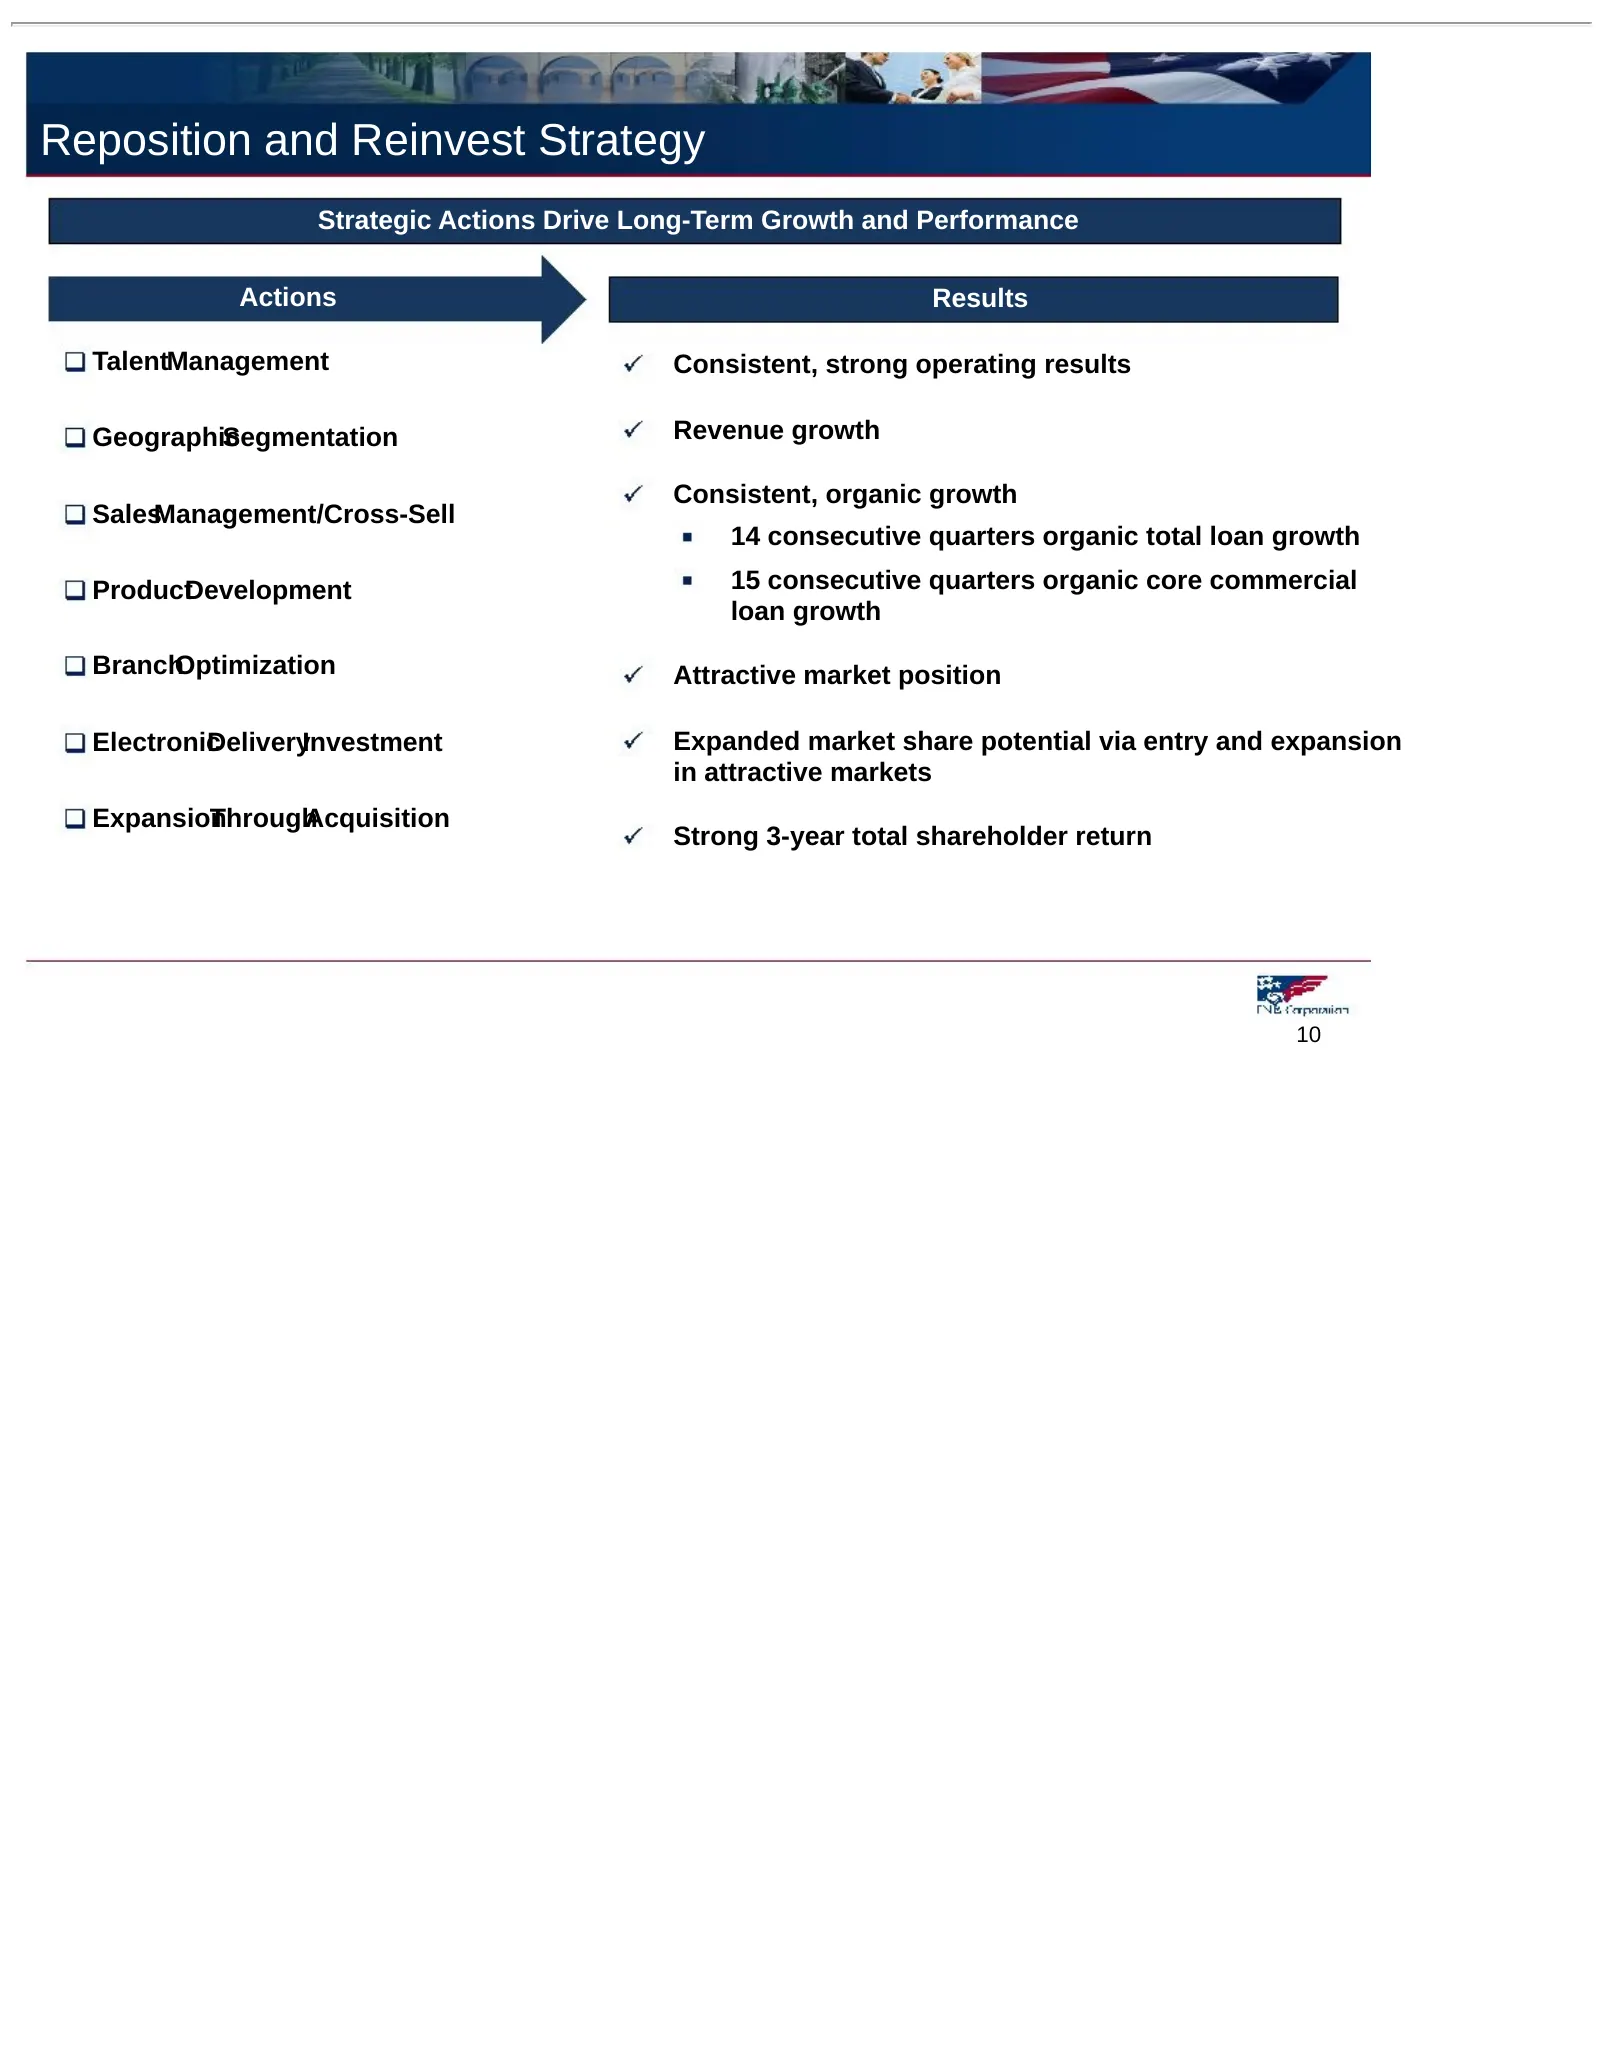
Reposition and Reinvest Strategy Strategic Actions Drive Long-Term Growth and Performance Actions Results TalentManagement Consistent, strong operating results Geographic Segmentation Revenue growth Consistent, organic growth SalesManagement/Cross-Sell 14 consecutive quarters organic total loan grow
Slide 11: Reposition and Reinvest Strategy Significant Actions
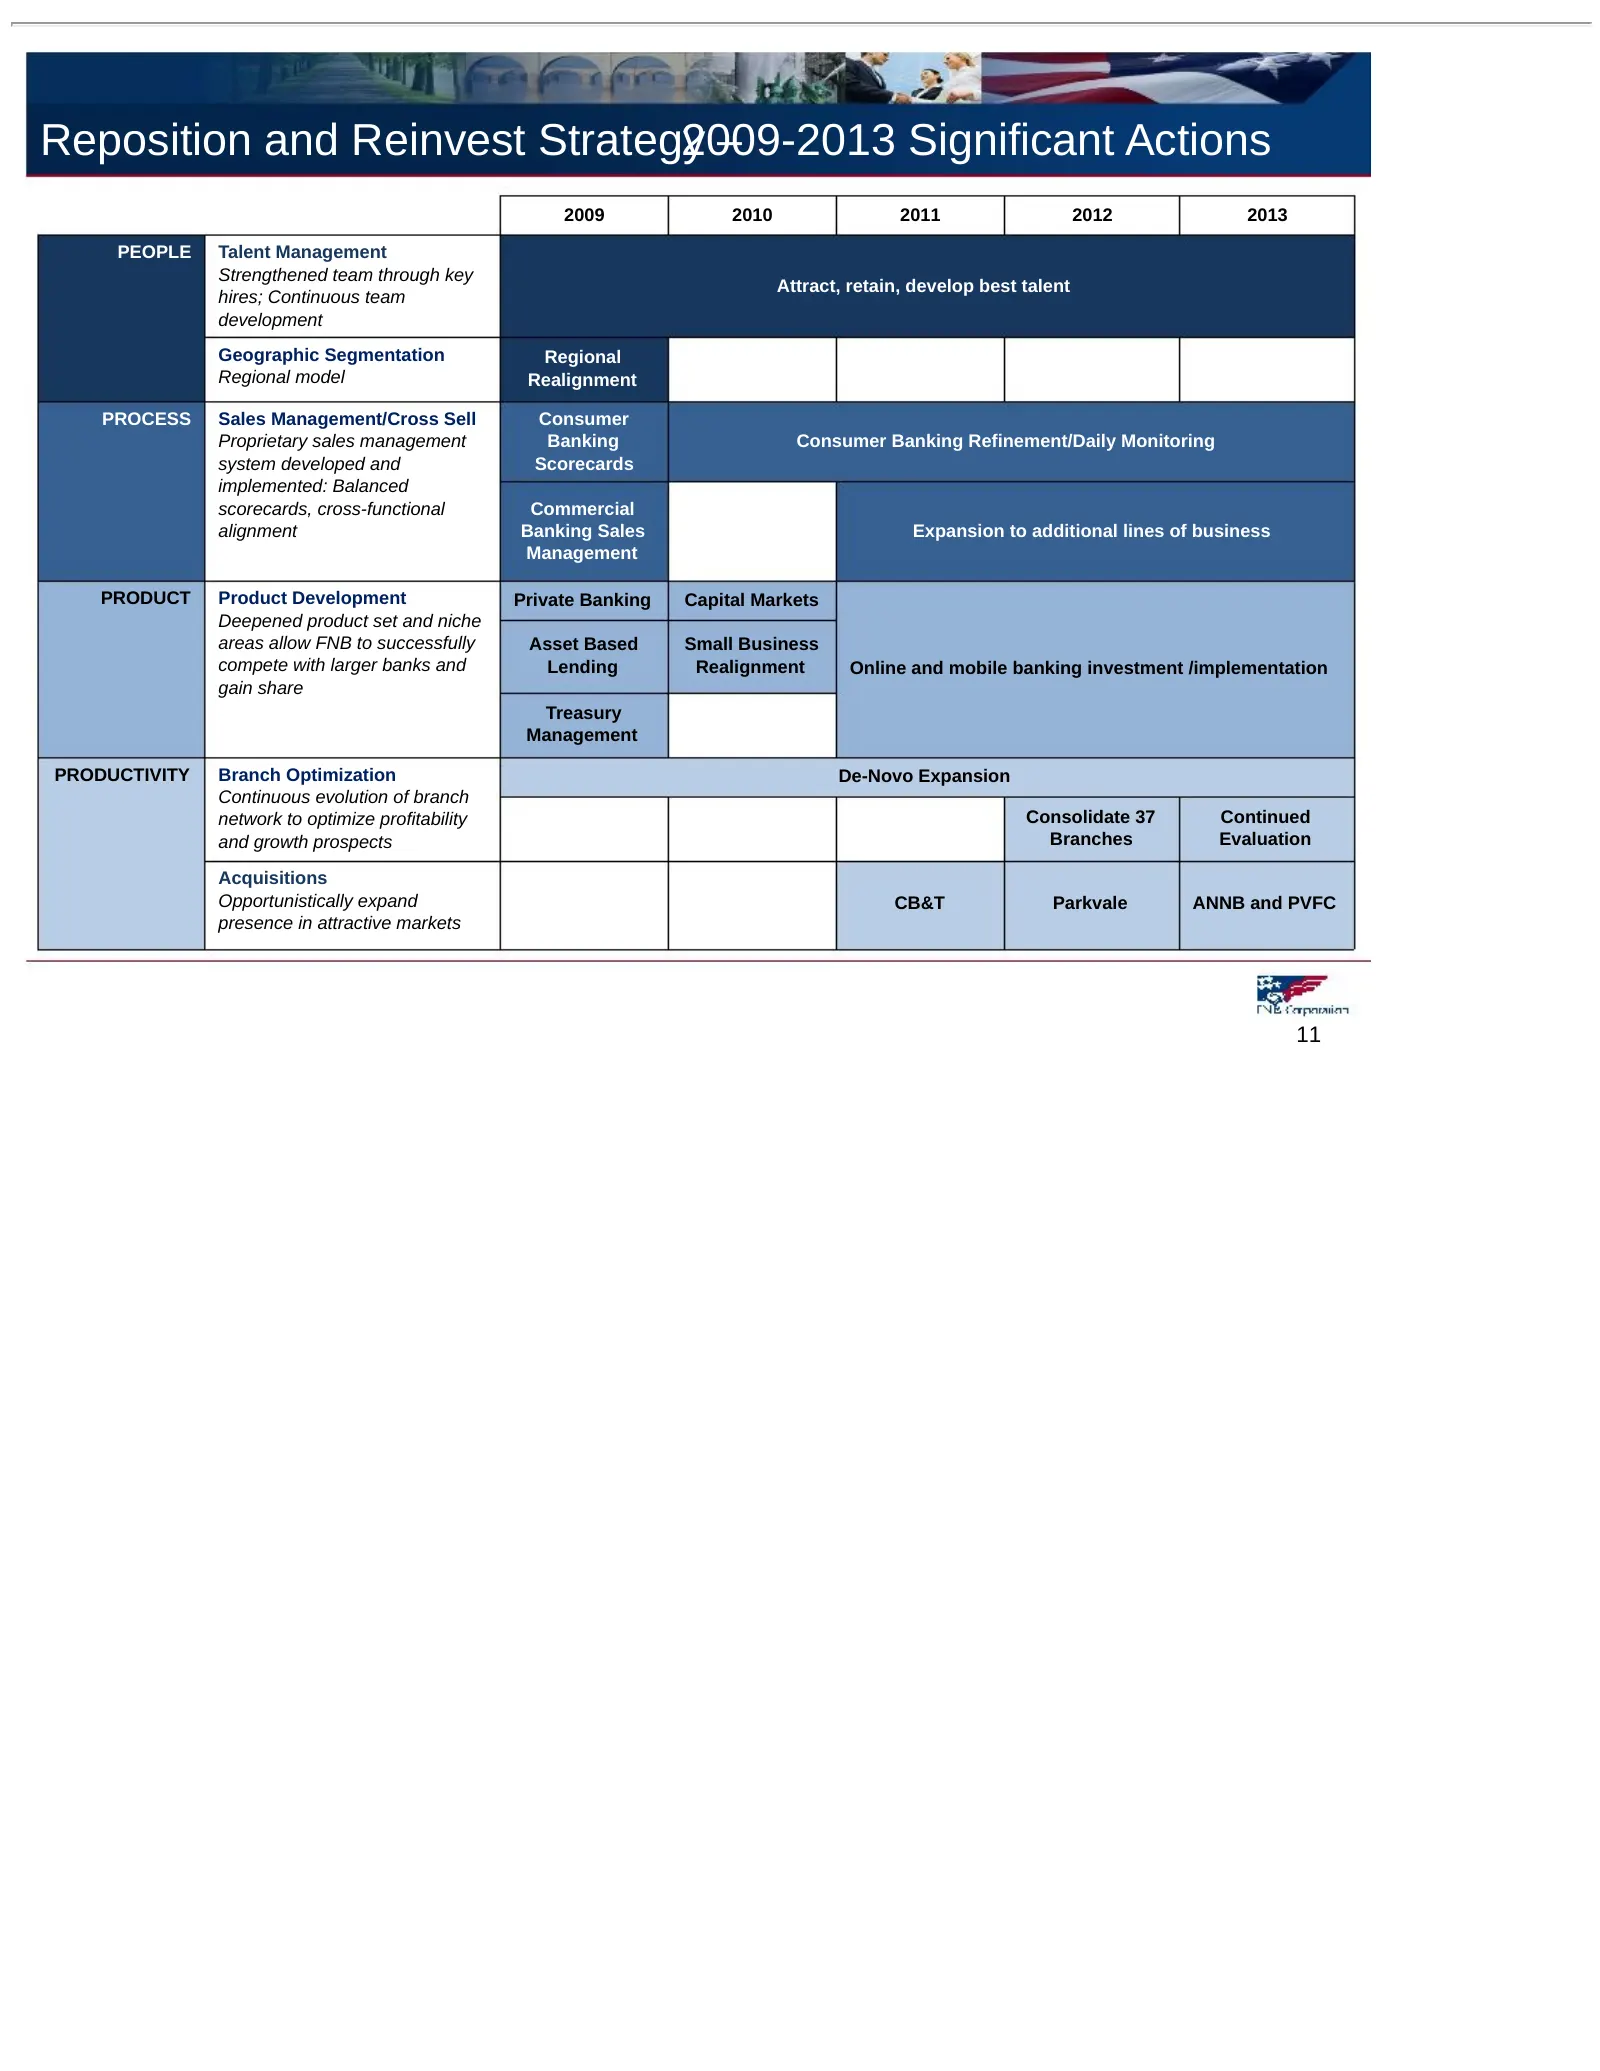
Reposition and Reinvest Strategy 2009-2013 – Significant Actions 2009 2010 2011 2012 2013 PEOPLE Talent Management Strengthened team through key Attract, retain, develop best talent hires; Continuous team development Geographic Segmentation Regional Regional model Realignment PROCESS Sales Managemen
Slide 12: Cross-Functional Sales Management Drives Growth
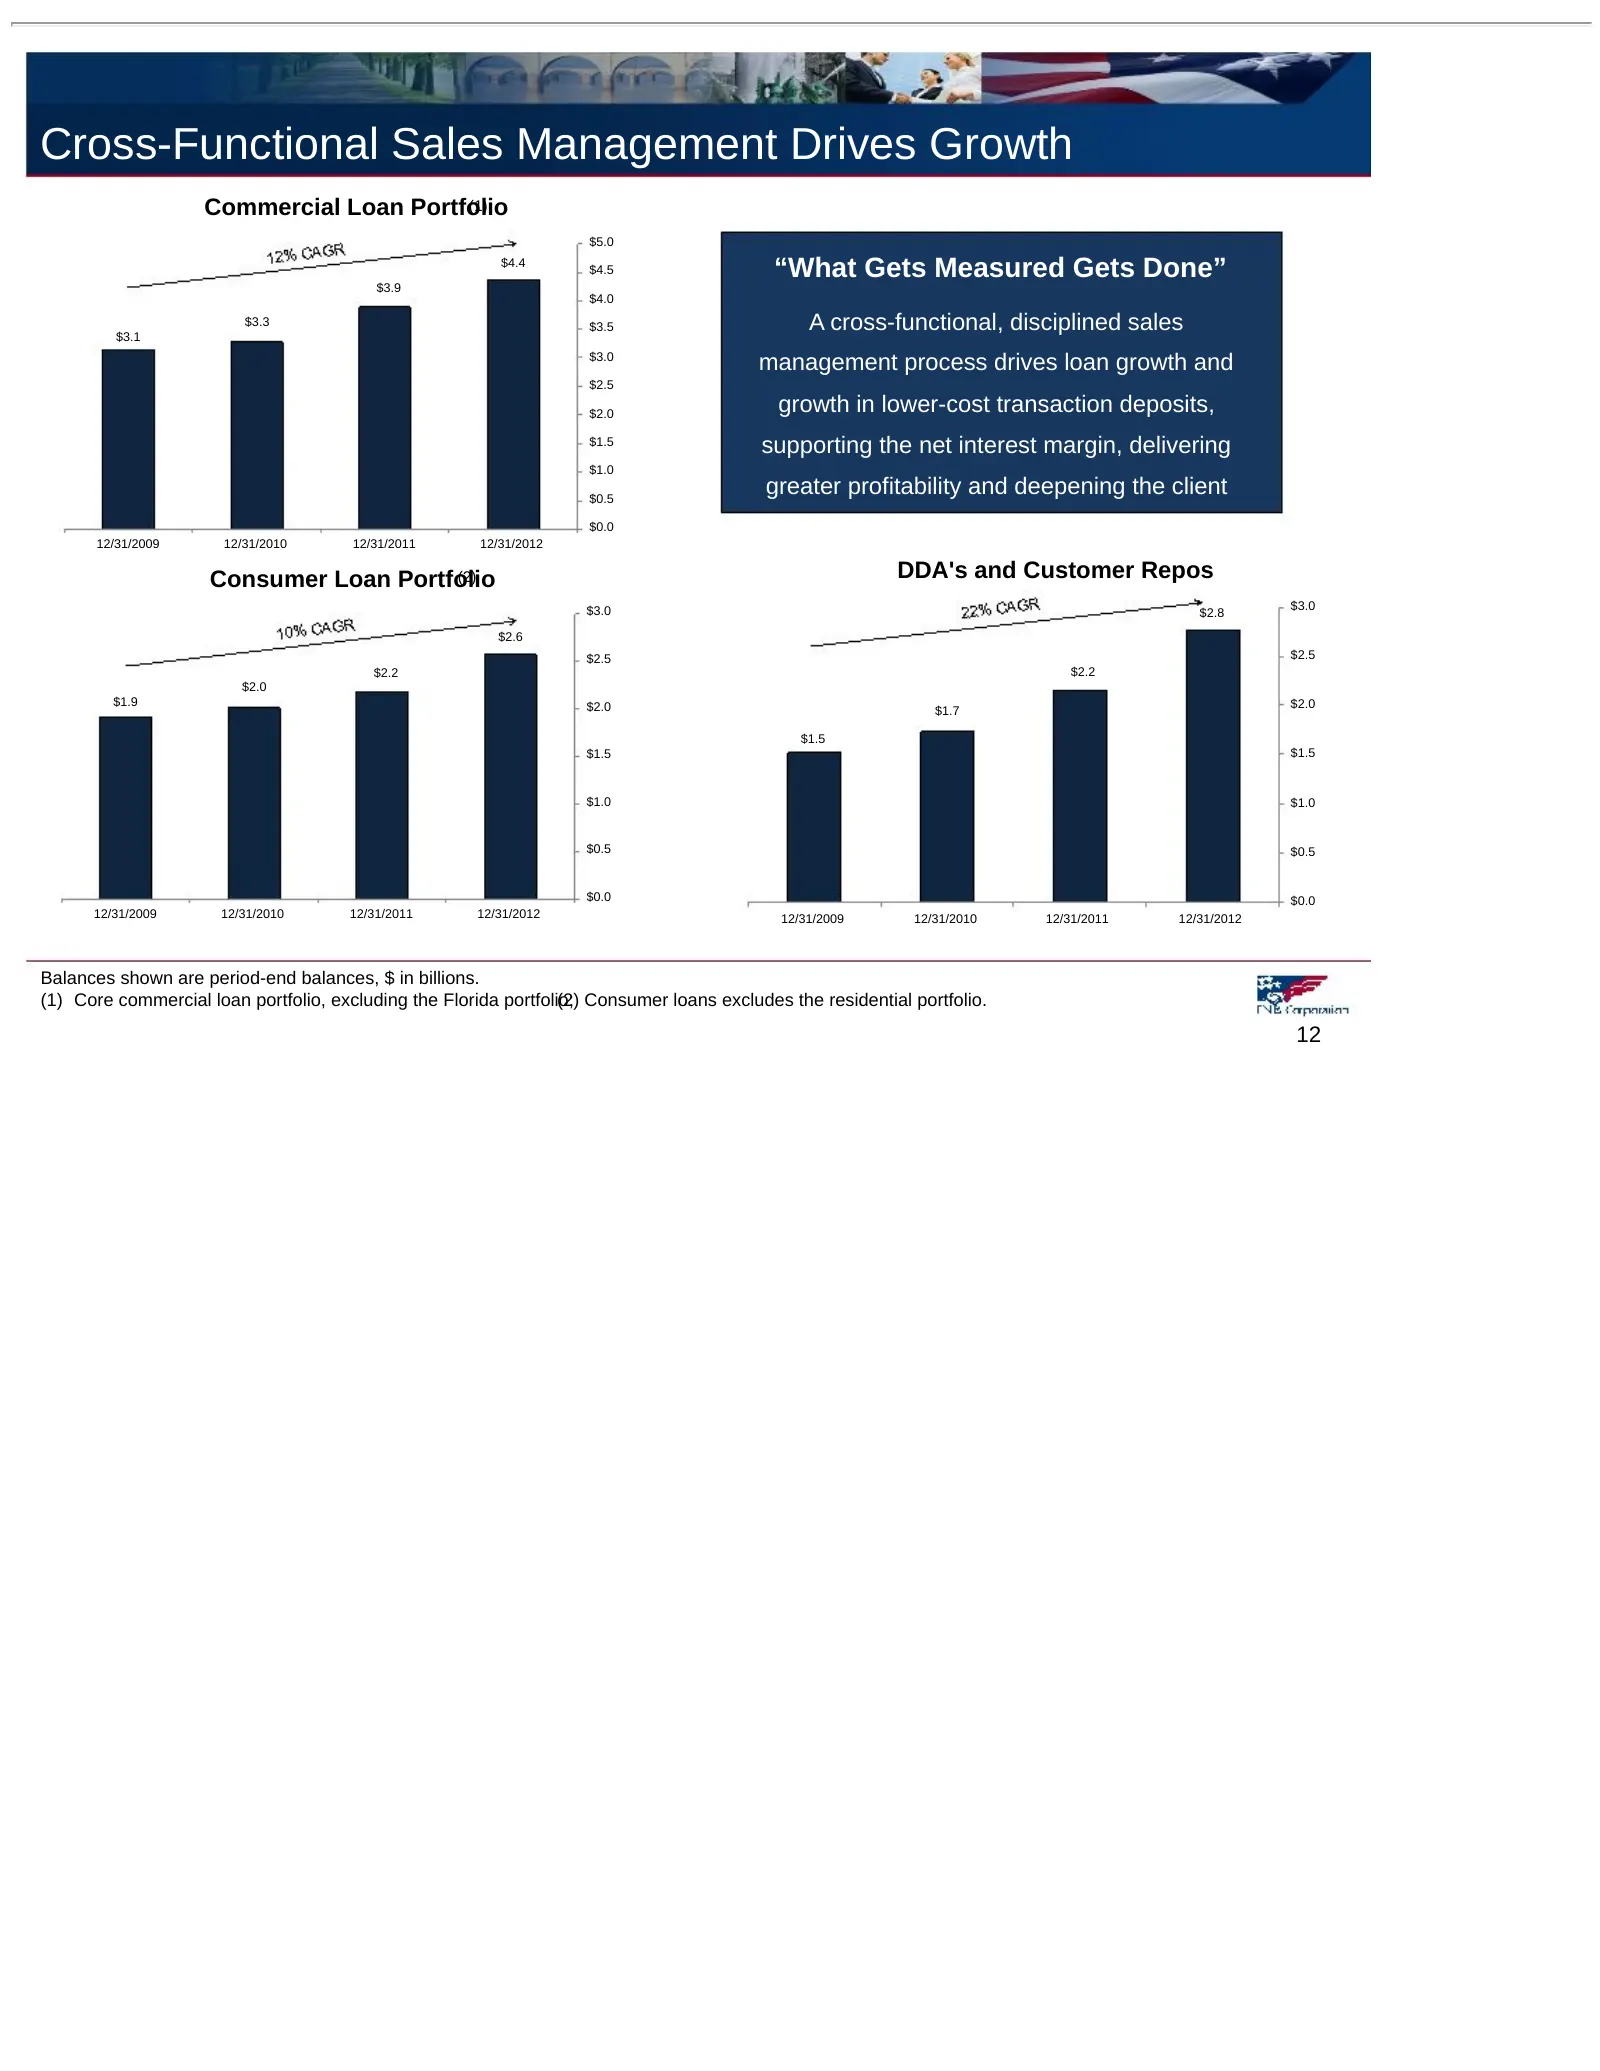
Cross-Functional Sales Management Drives Growth Commercial Loan Portfolio (1) $5.0 $4.4 $4.5 “What Gets Measured Gets Done” $3.9 $4.0 $3.1 $3.3 $3.5 A cross-functional, disciplined sales $3.0 management process drives loan growth and $2.5 $2.0 growth in lower-cost transaction deposits, $1.5 supporti

Slide 13: Market Position
Market Position 13
Slide 14: Top Market Overall Position
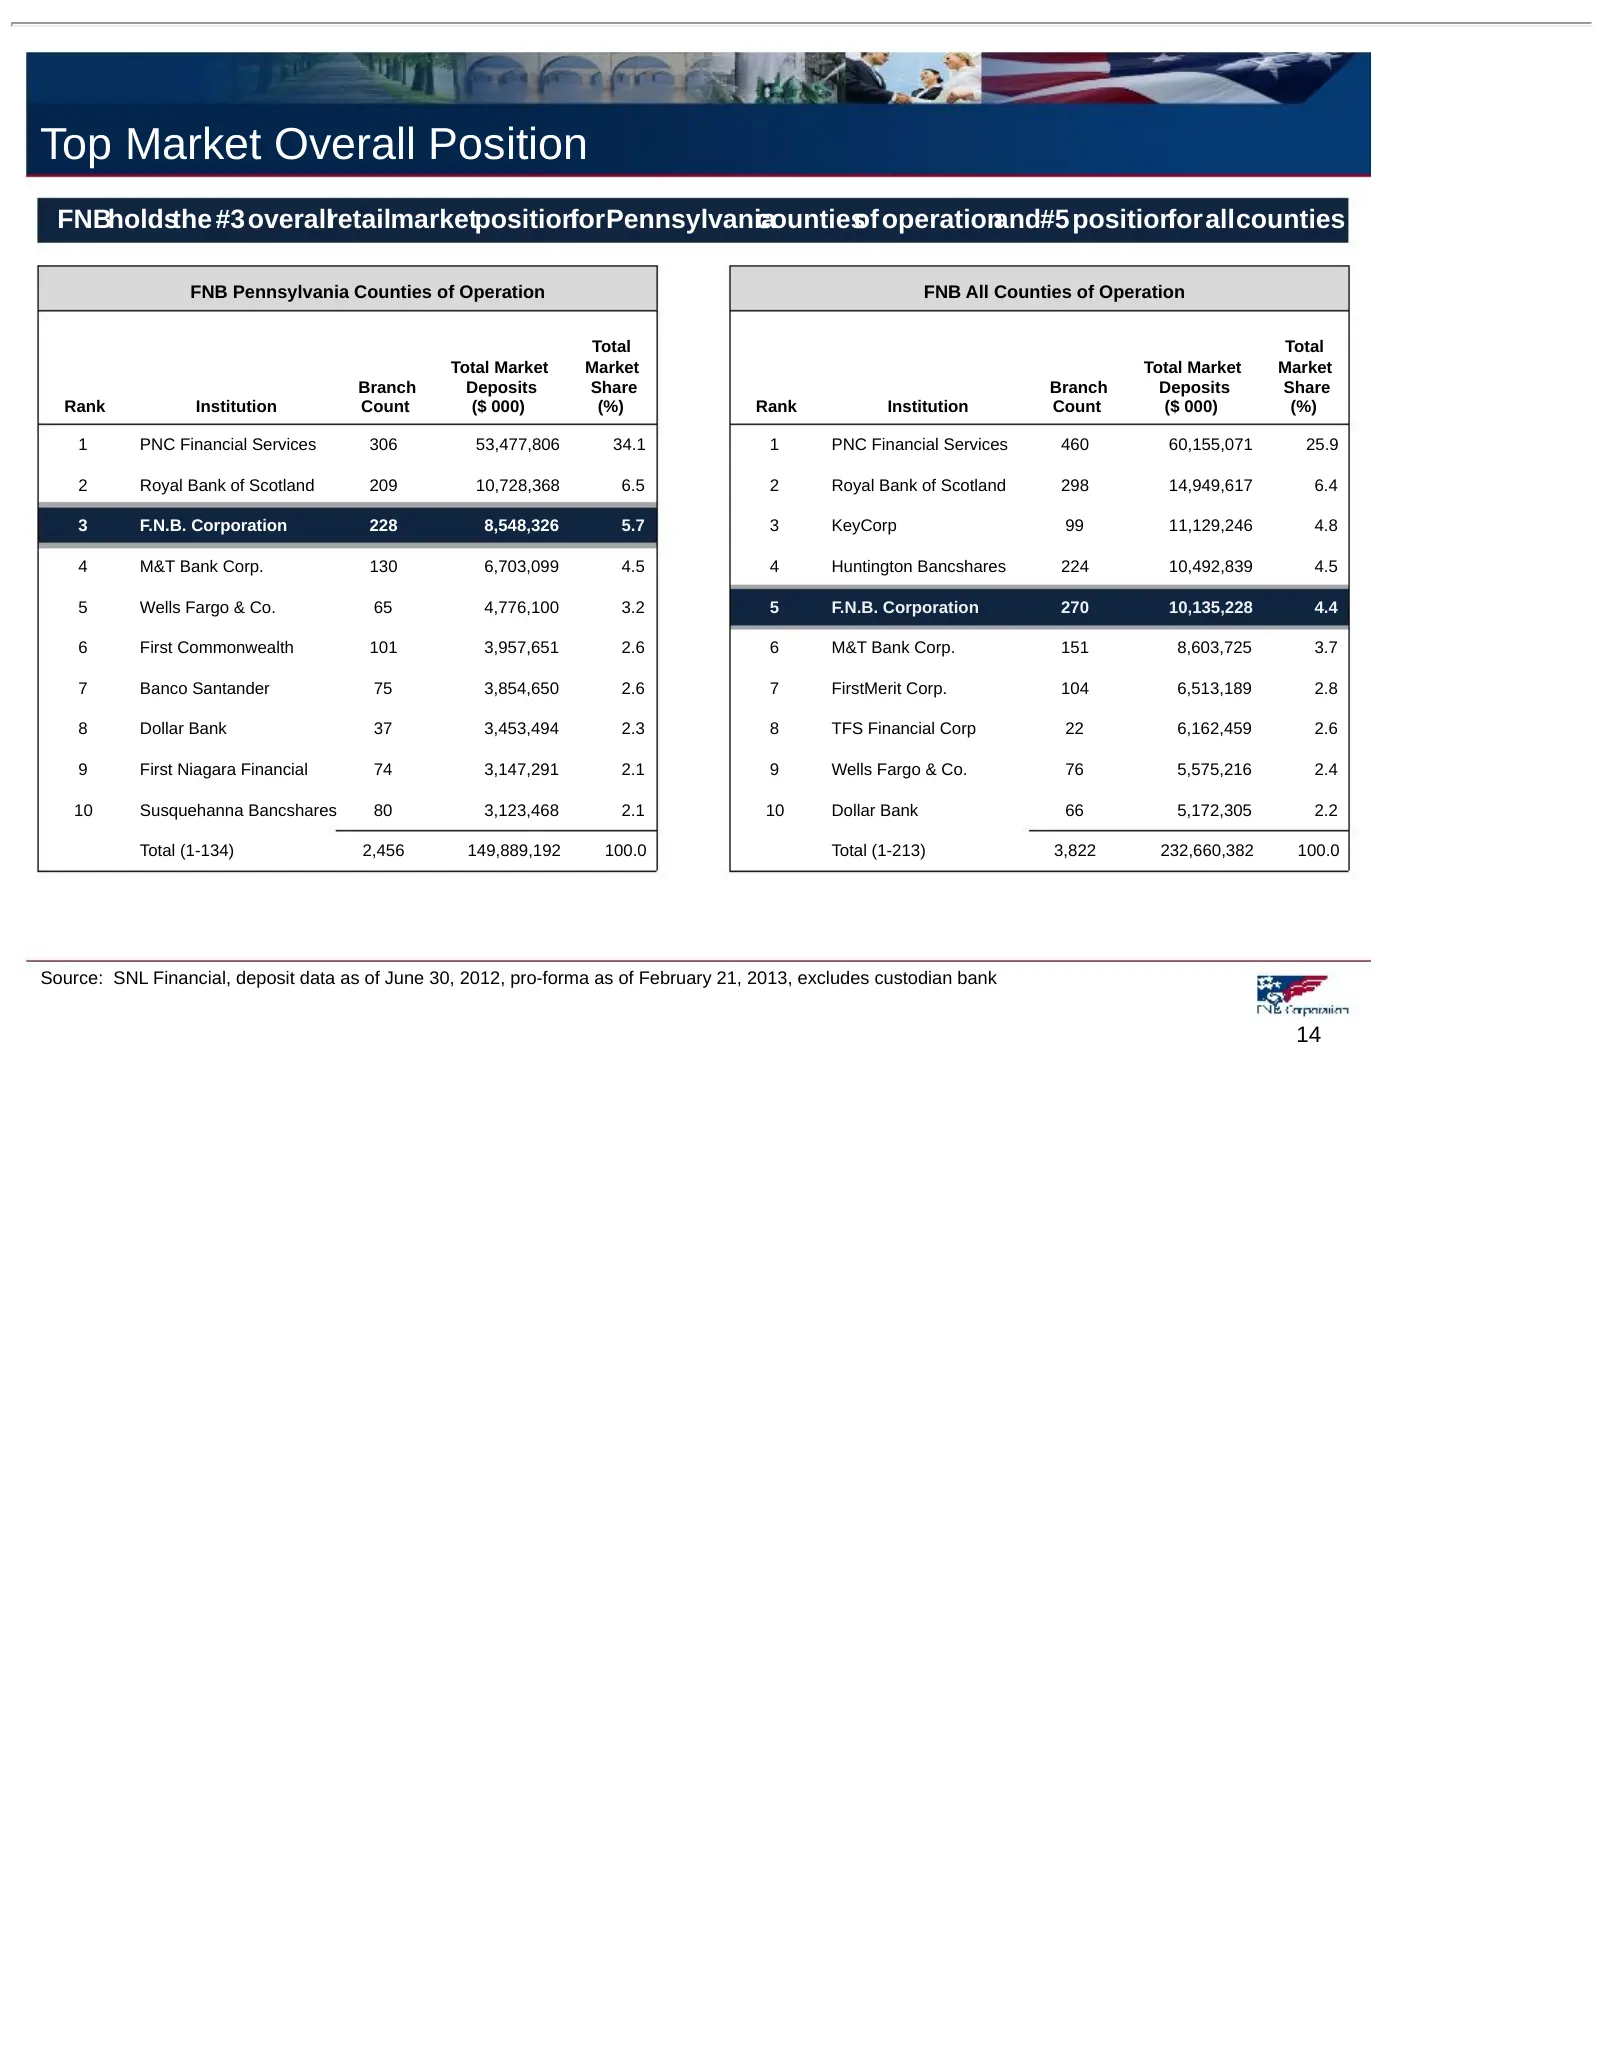
Top Market Overall Position FNBholdsthe #3overallretailmarketpositionforPennsylvania countiesof operationand#5positionforallcounties FNB Pennsylvania Counties of Operation FNB All Counties of Operation Total Total Total Market Market Total Market Market Branch Deposits Share Branch Deposits Share Ra
Slide 15: Banking Footprint – Regional View
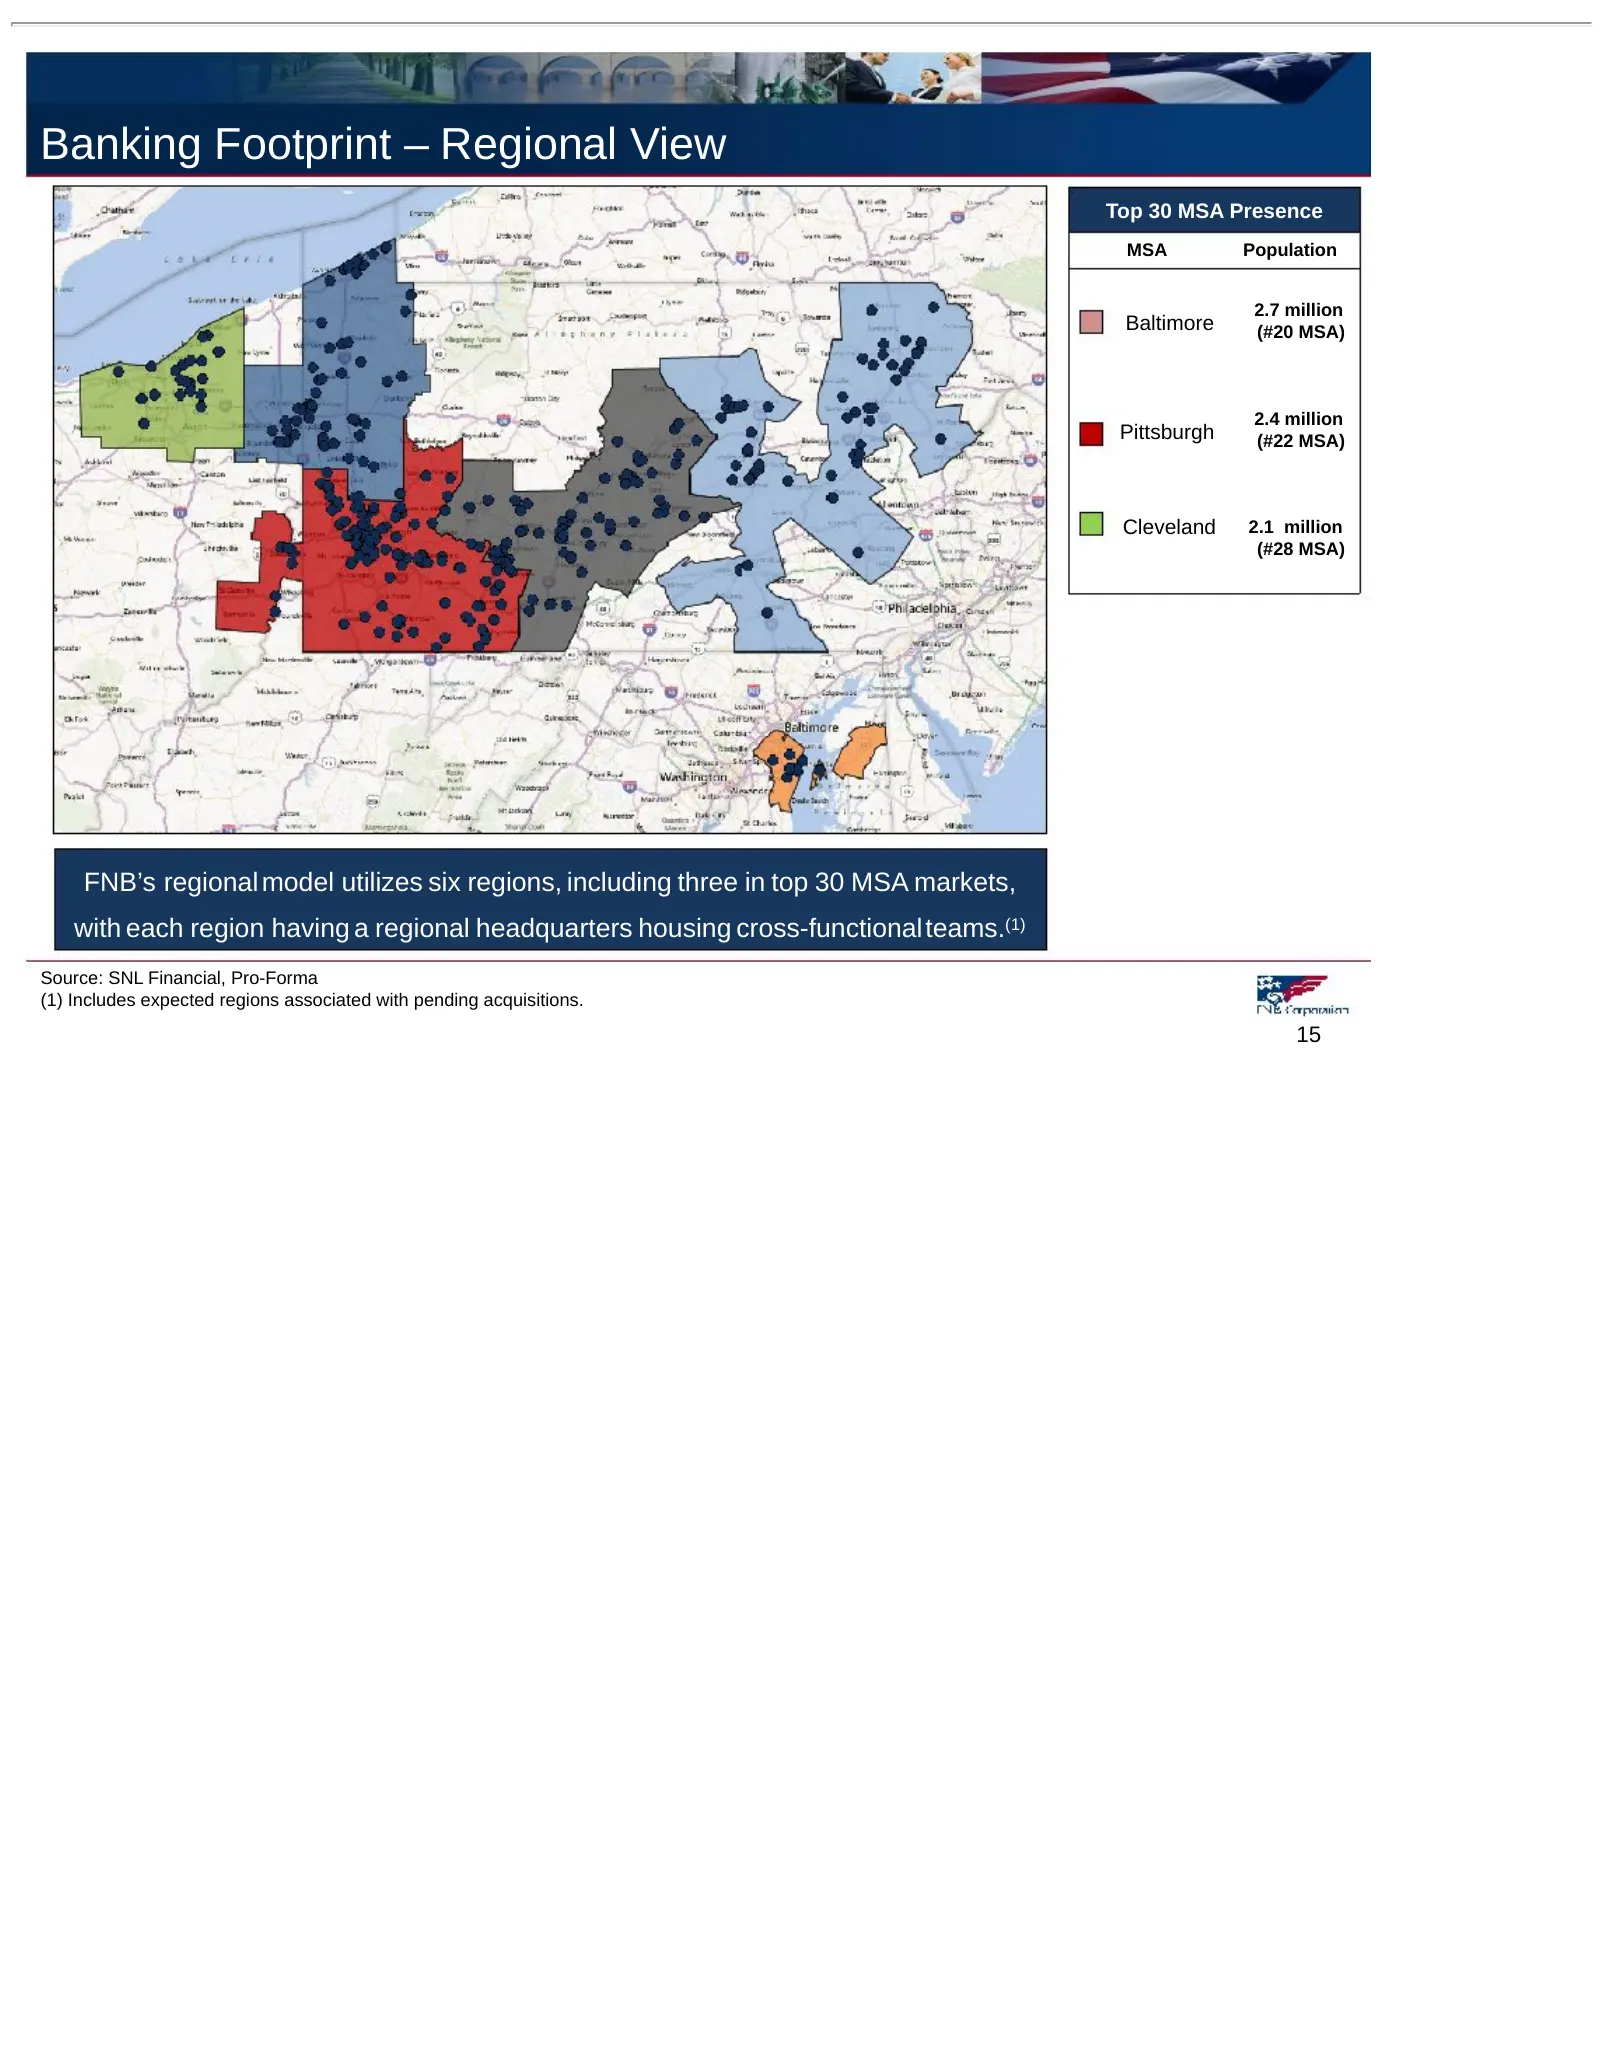
Banking Footprint – Regional View Top 30 MSA Presence MSA Population 2.7 million Baltimore (#20 MSA) 2.4 million Pittsburgh (#22 MSA) Cleveland 2.1 million (#28 MSA) FNB’s regional model utilizes six regions, including three in top 30 MSA markets, with each region having a regional headquarters hous
Slide 16: Market Position and Opportunity
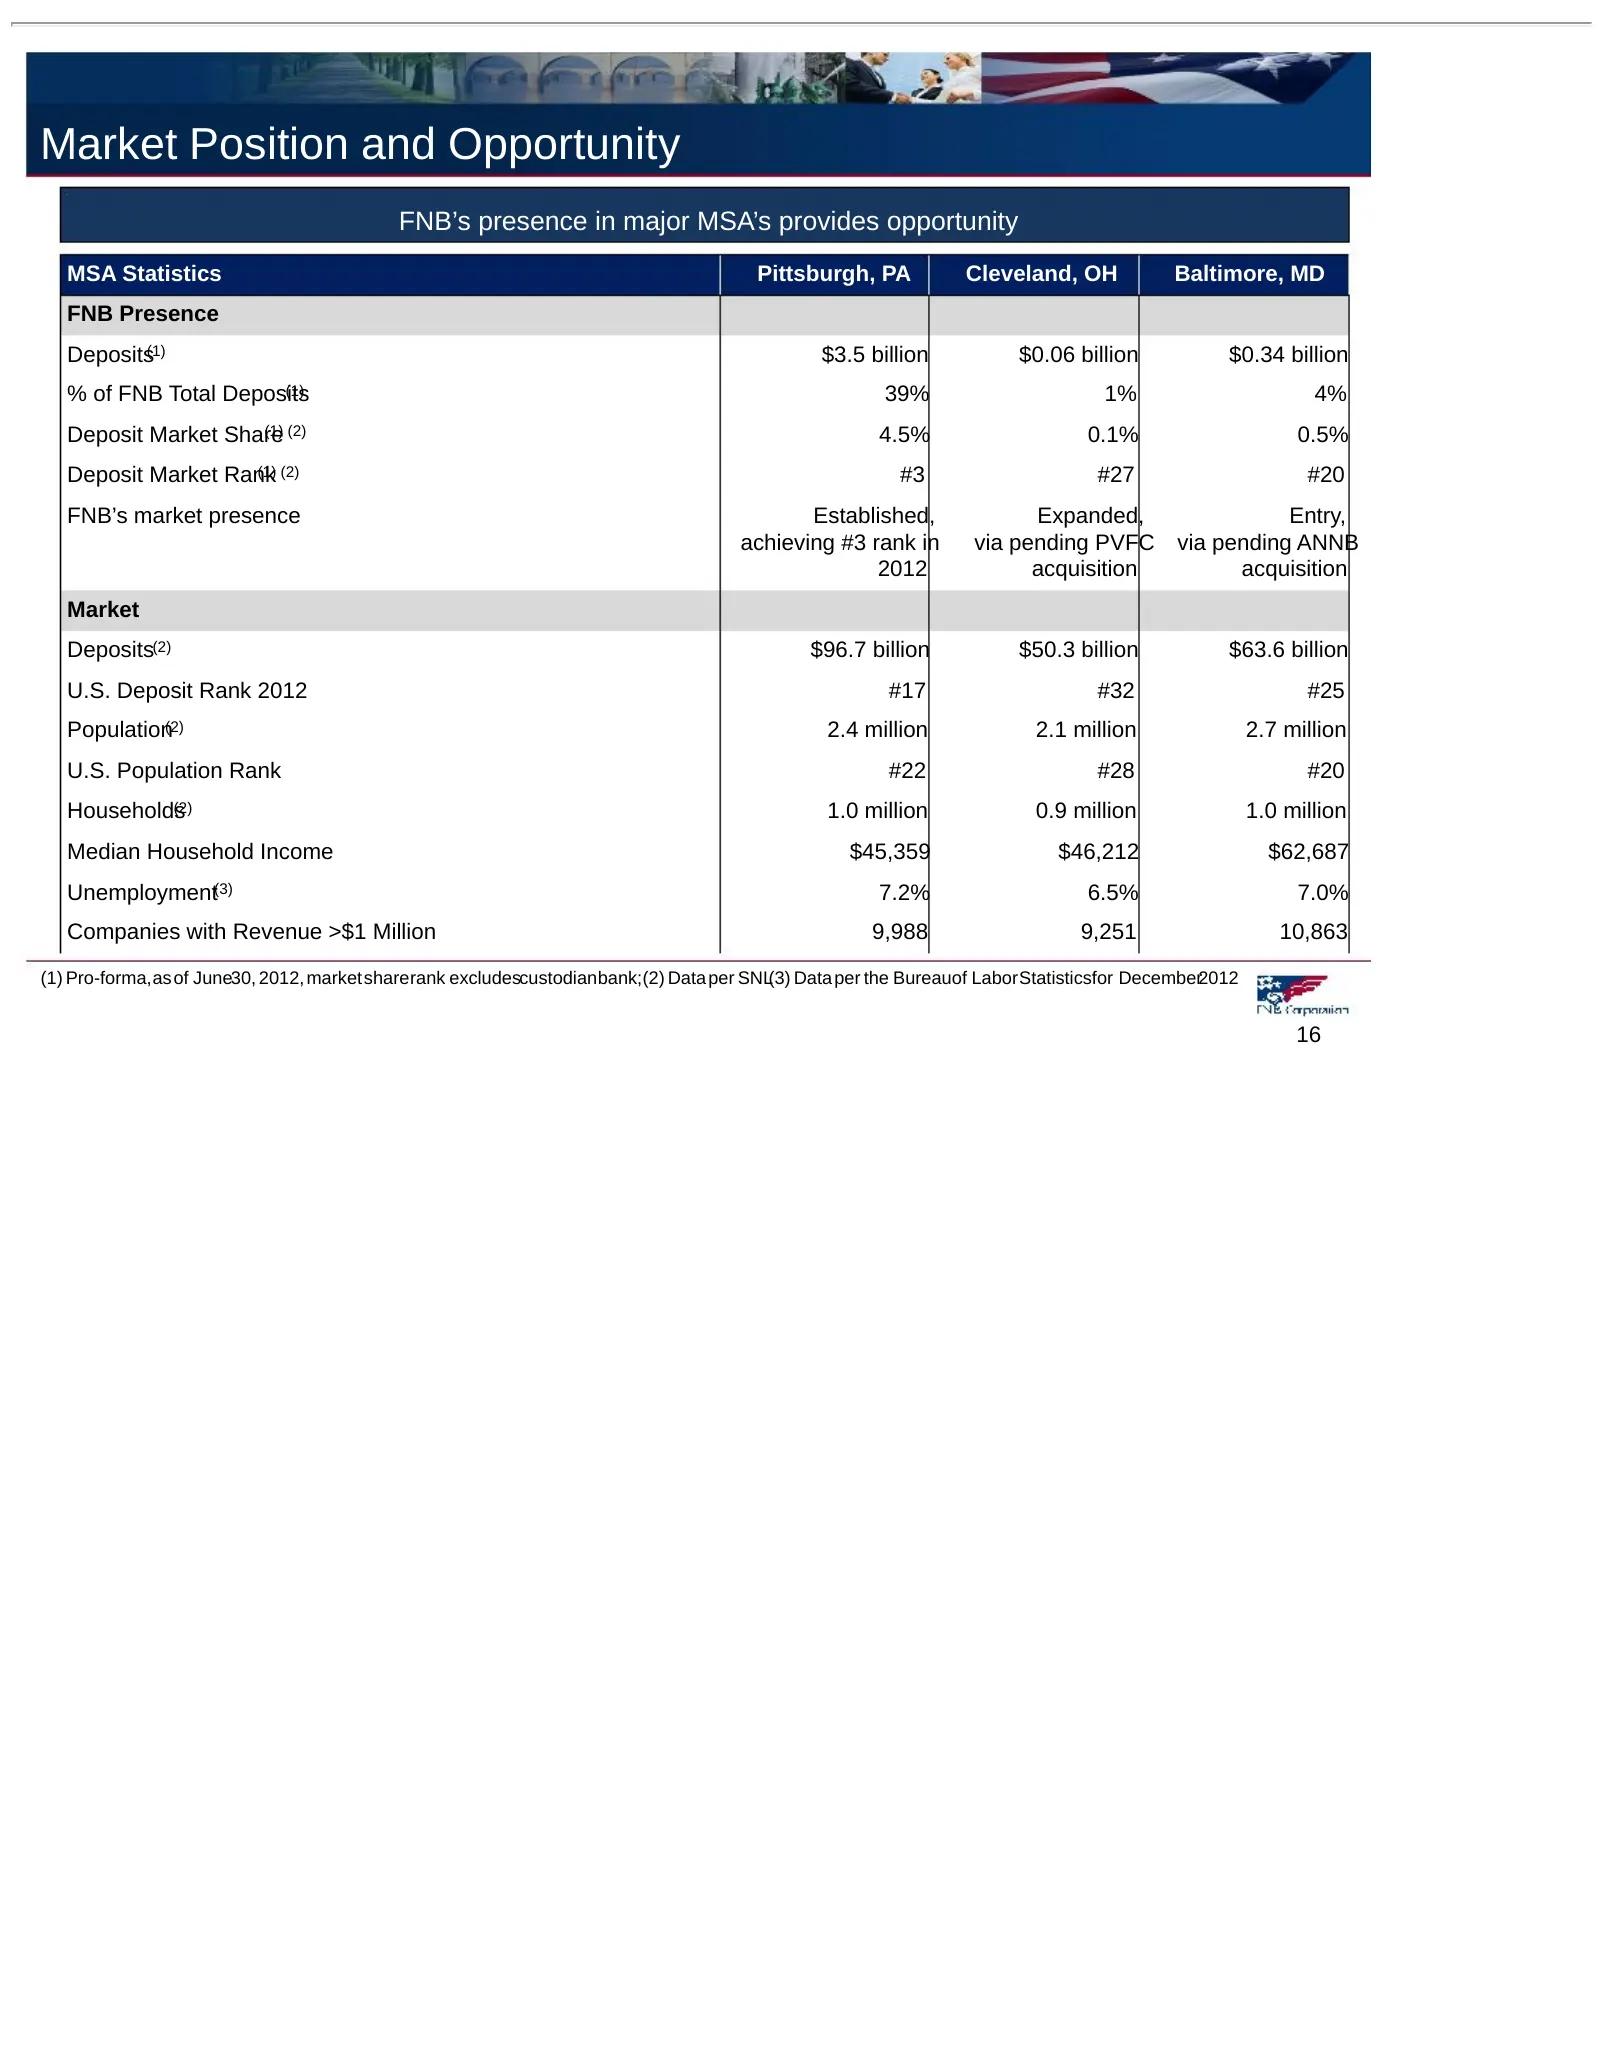
Market Position and Opportunity FNB’s presence in major MSA’s provides opportunity MSA Statistics Pittsburgh, PA Cleveland, OH Baltimore, MD FNB Presence Deposits(1) $3.5 billion $0.06 billion $0.34 billion % of FNB Total Deposits (1) 39% 1% 4% Deposit Market Share (1) (2) 4.5% 0.1% 0.5% Deposit Mar
Slide 17: Market Opportunity
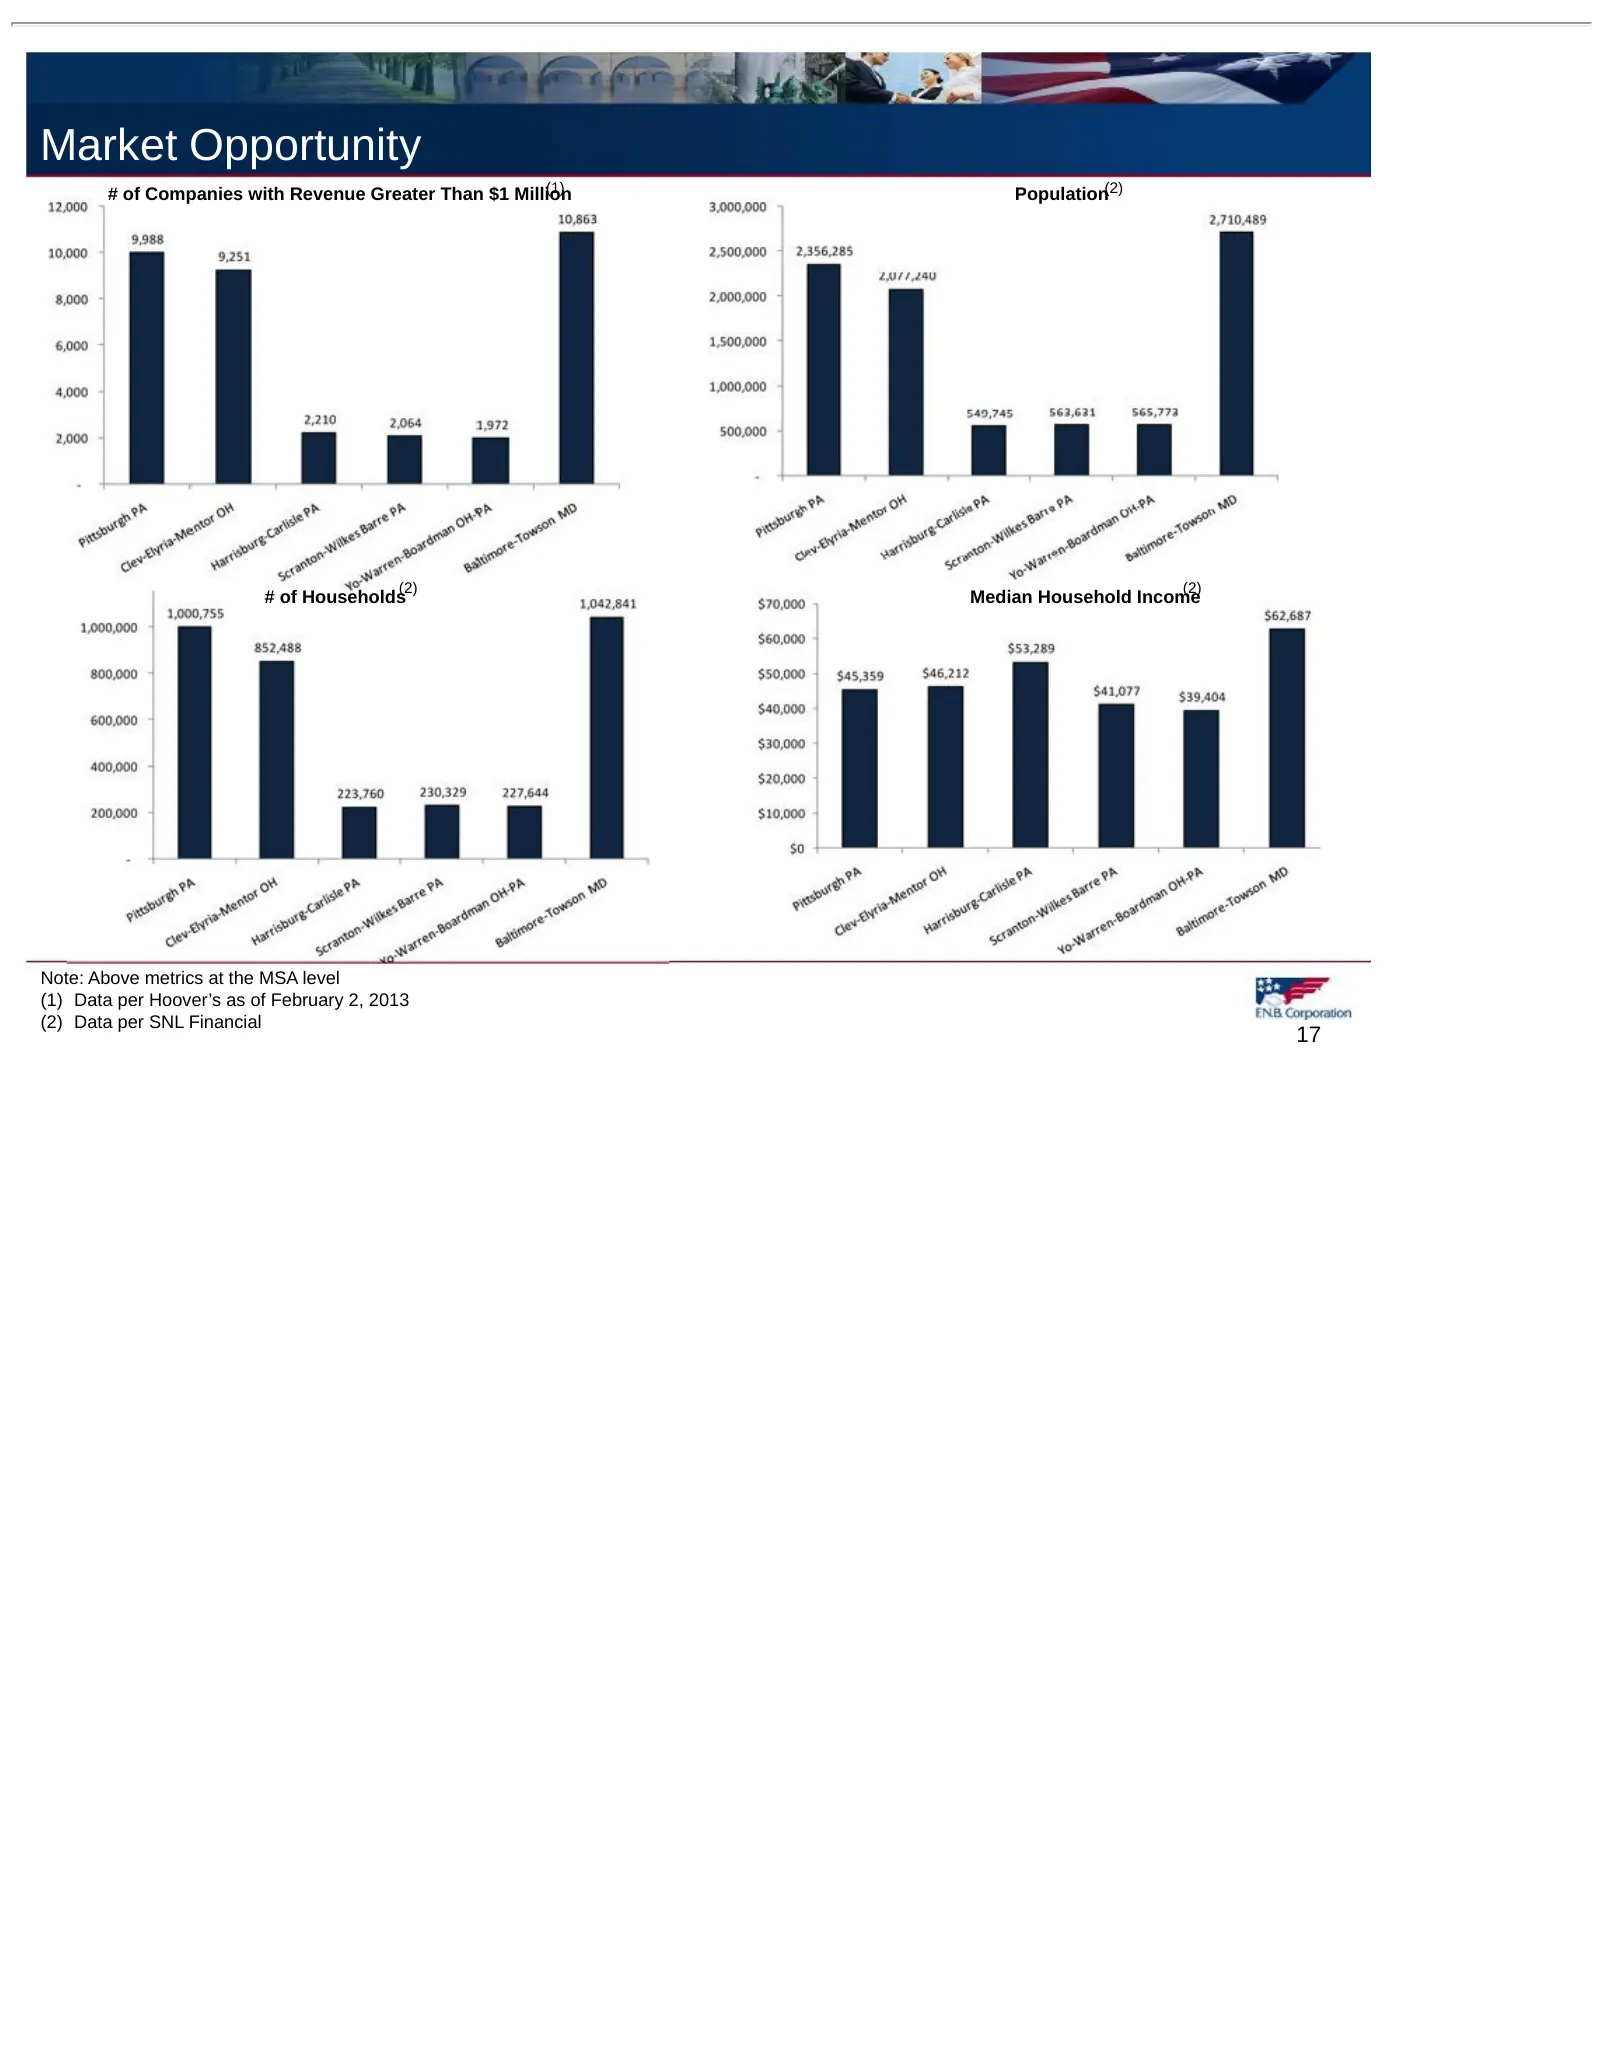
Market Opportunity (1) # of Companies with Revenue Greater Than $1 Million Population(2) (2) (2) # of Households Median Household Income Note: Above metrics at the MSA level (1) Data per Hoover’s as of February 2, 2013 (2) Data per SNL Financial 17
Slide 18: #3 Position in the Pittsburgh MSA
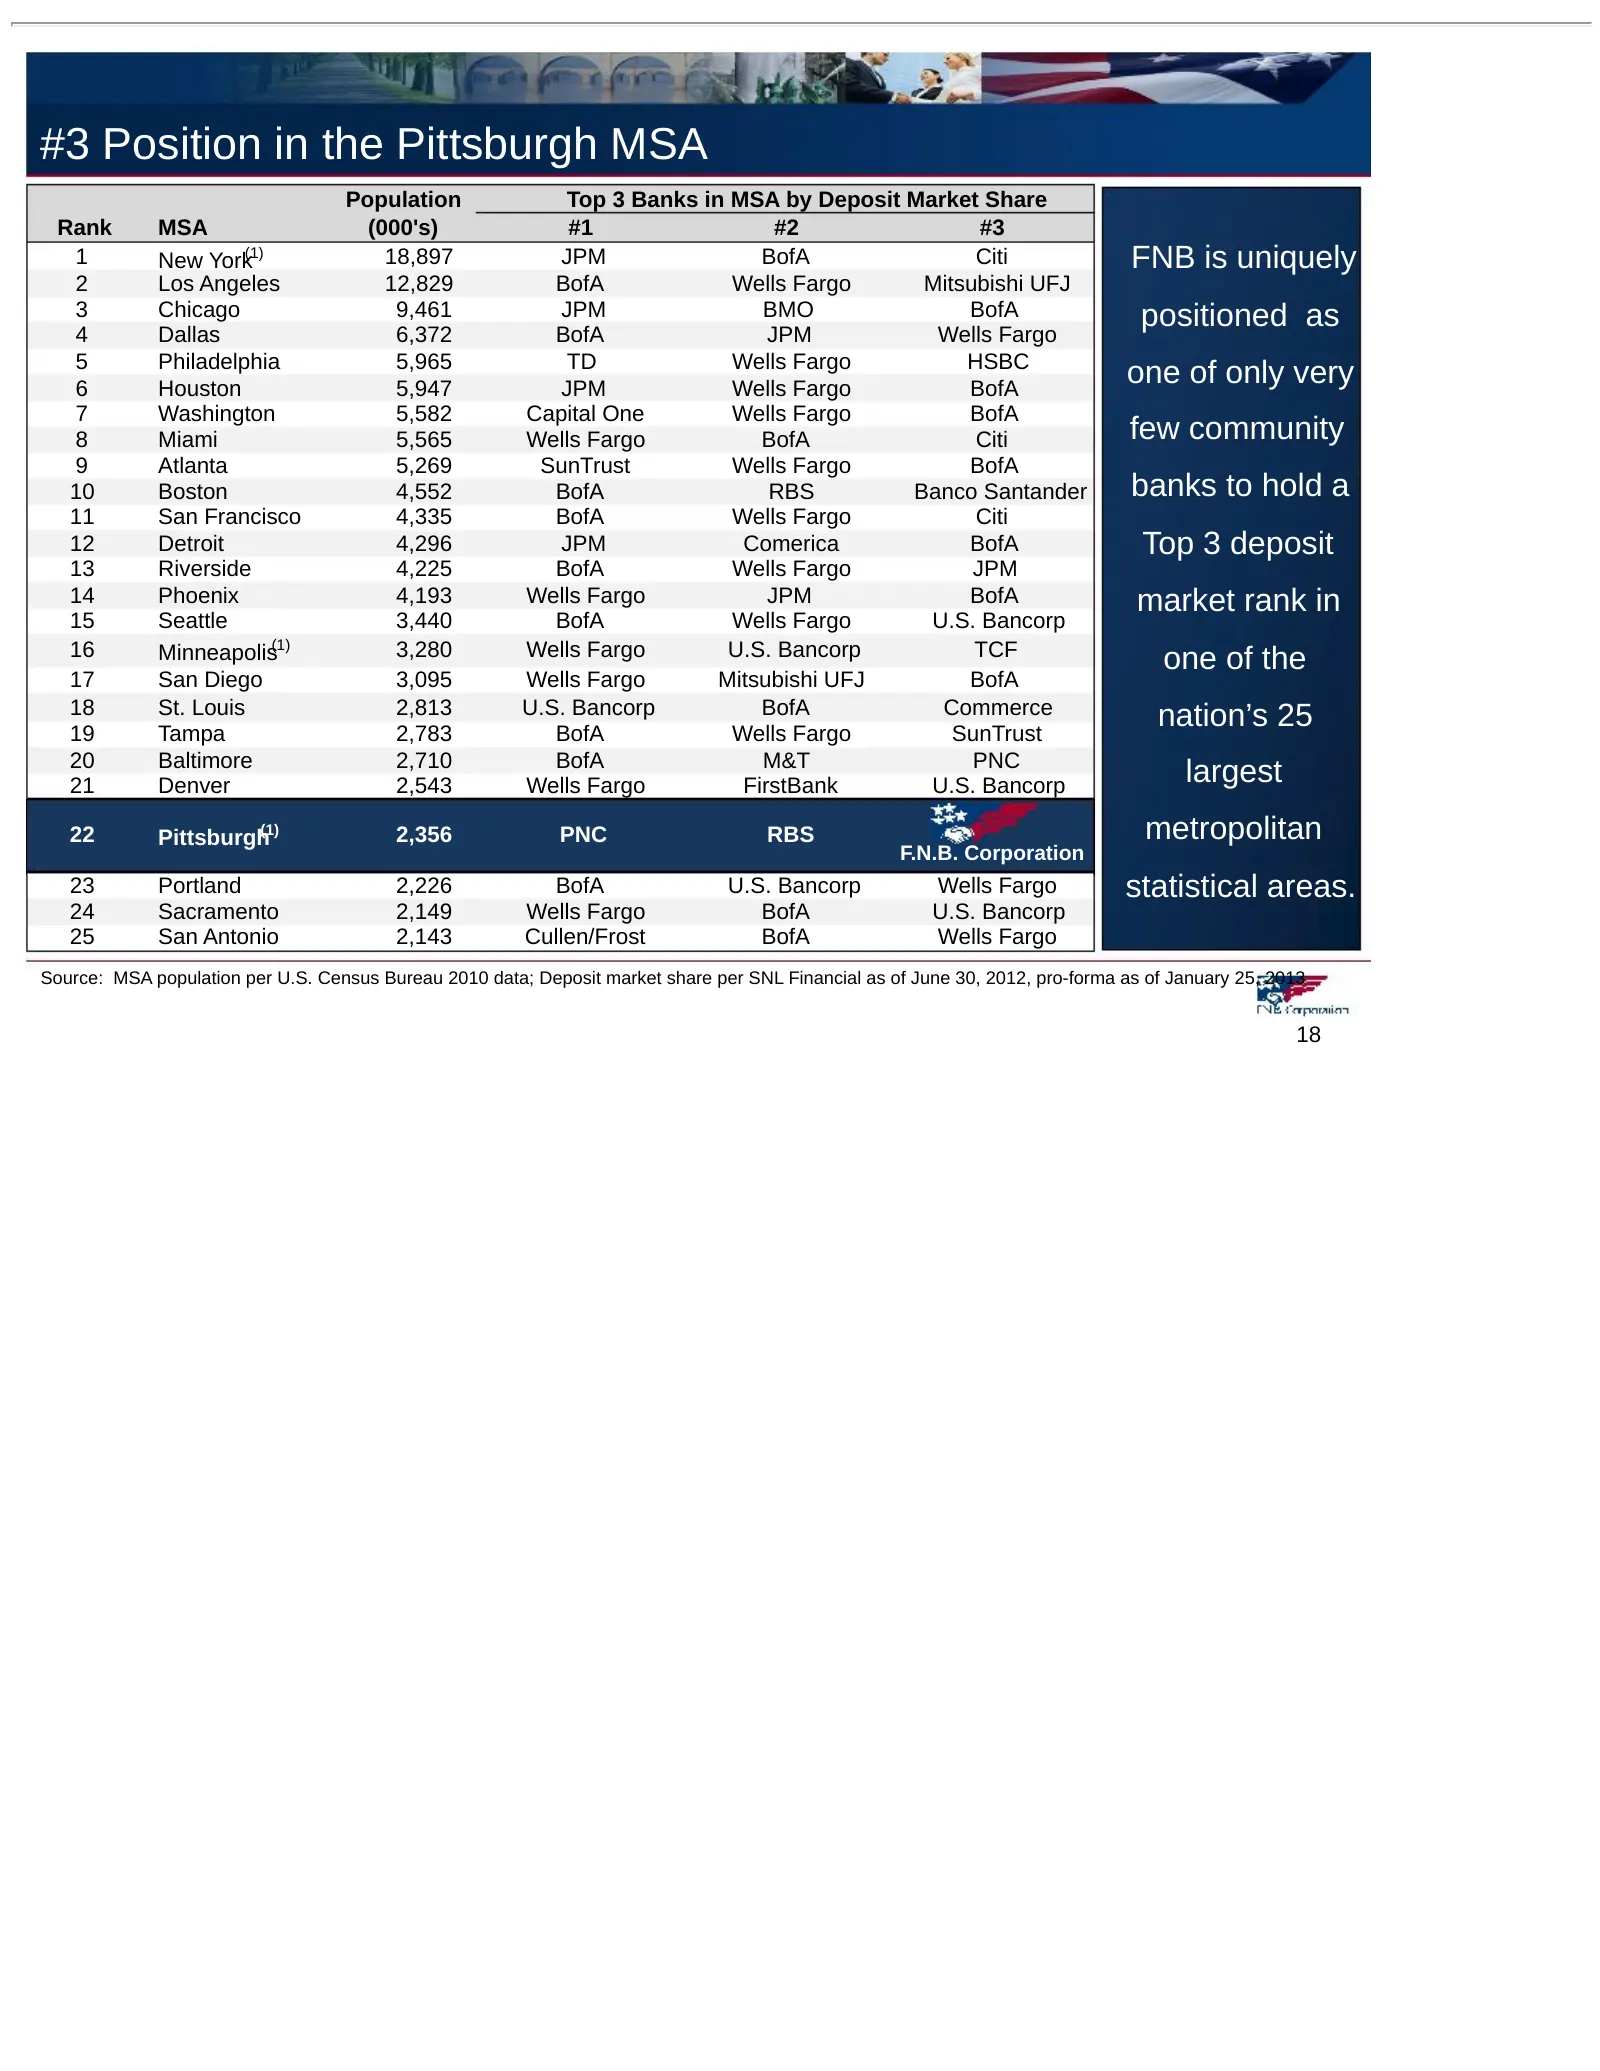
#3 Position in the Pittsburgh MSA Population Top 3 Banks in MSA by Deposit Market Share Rank MSA (000's) #1 #2 #3 1 New York(1) 18,897 JPM BofA Citi FNB is uniquely 2 Los Angeles 12,829 BofA Wells Fargo Mitsubishi UFJ 3 Chicago 9,461 JPM BMO BofA positioned as 4 Dallas 6,372 BofA JPM Wells Fargo 5 P
Slide 19: Strong Operating Results Favorable Trends
Strong Operating Results Favorable Trends 19
Slide 20: Strong Operating Results and Favorable Trends
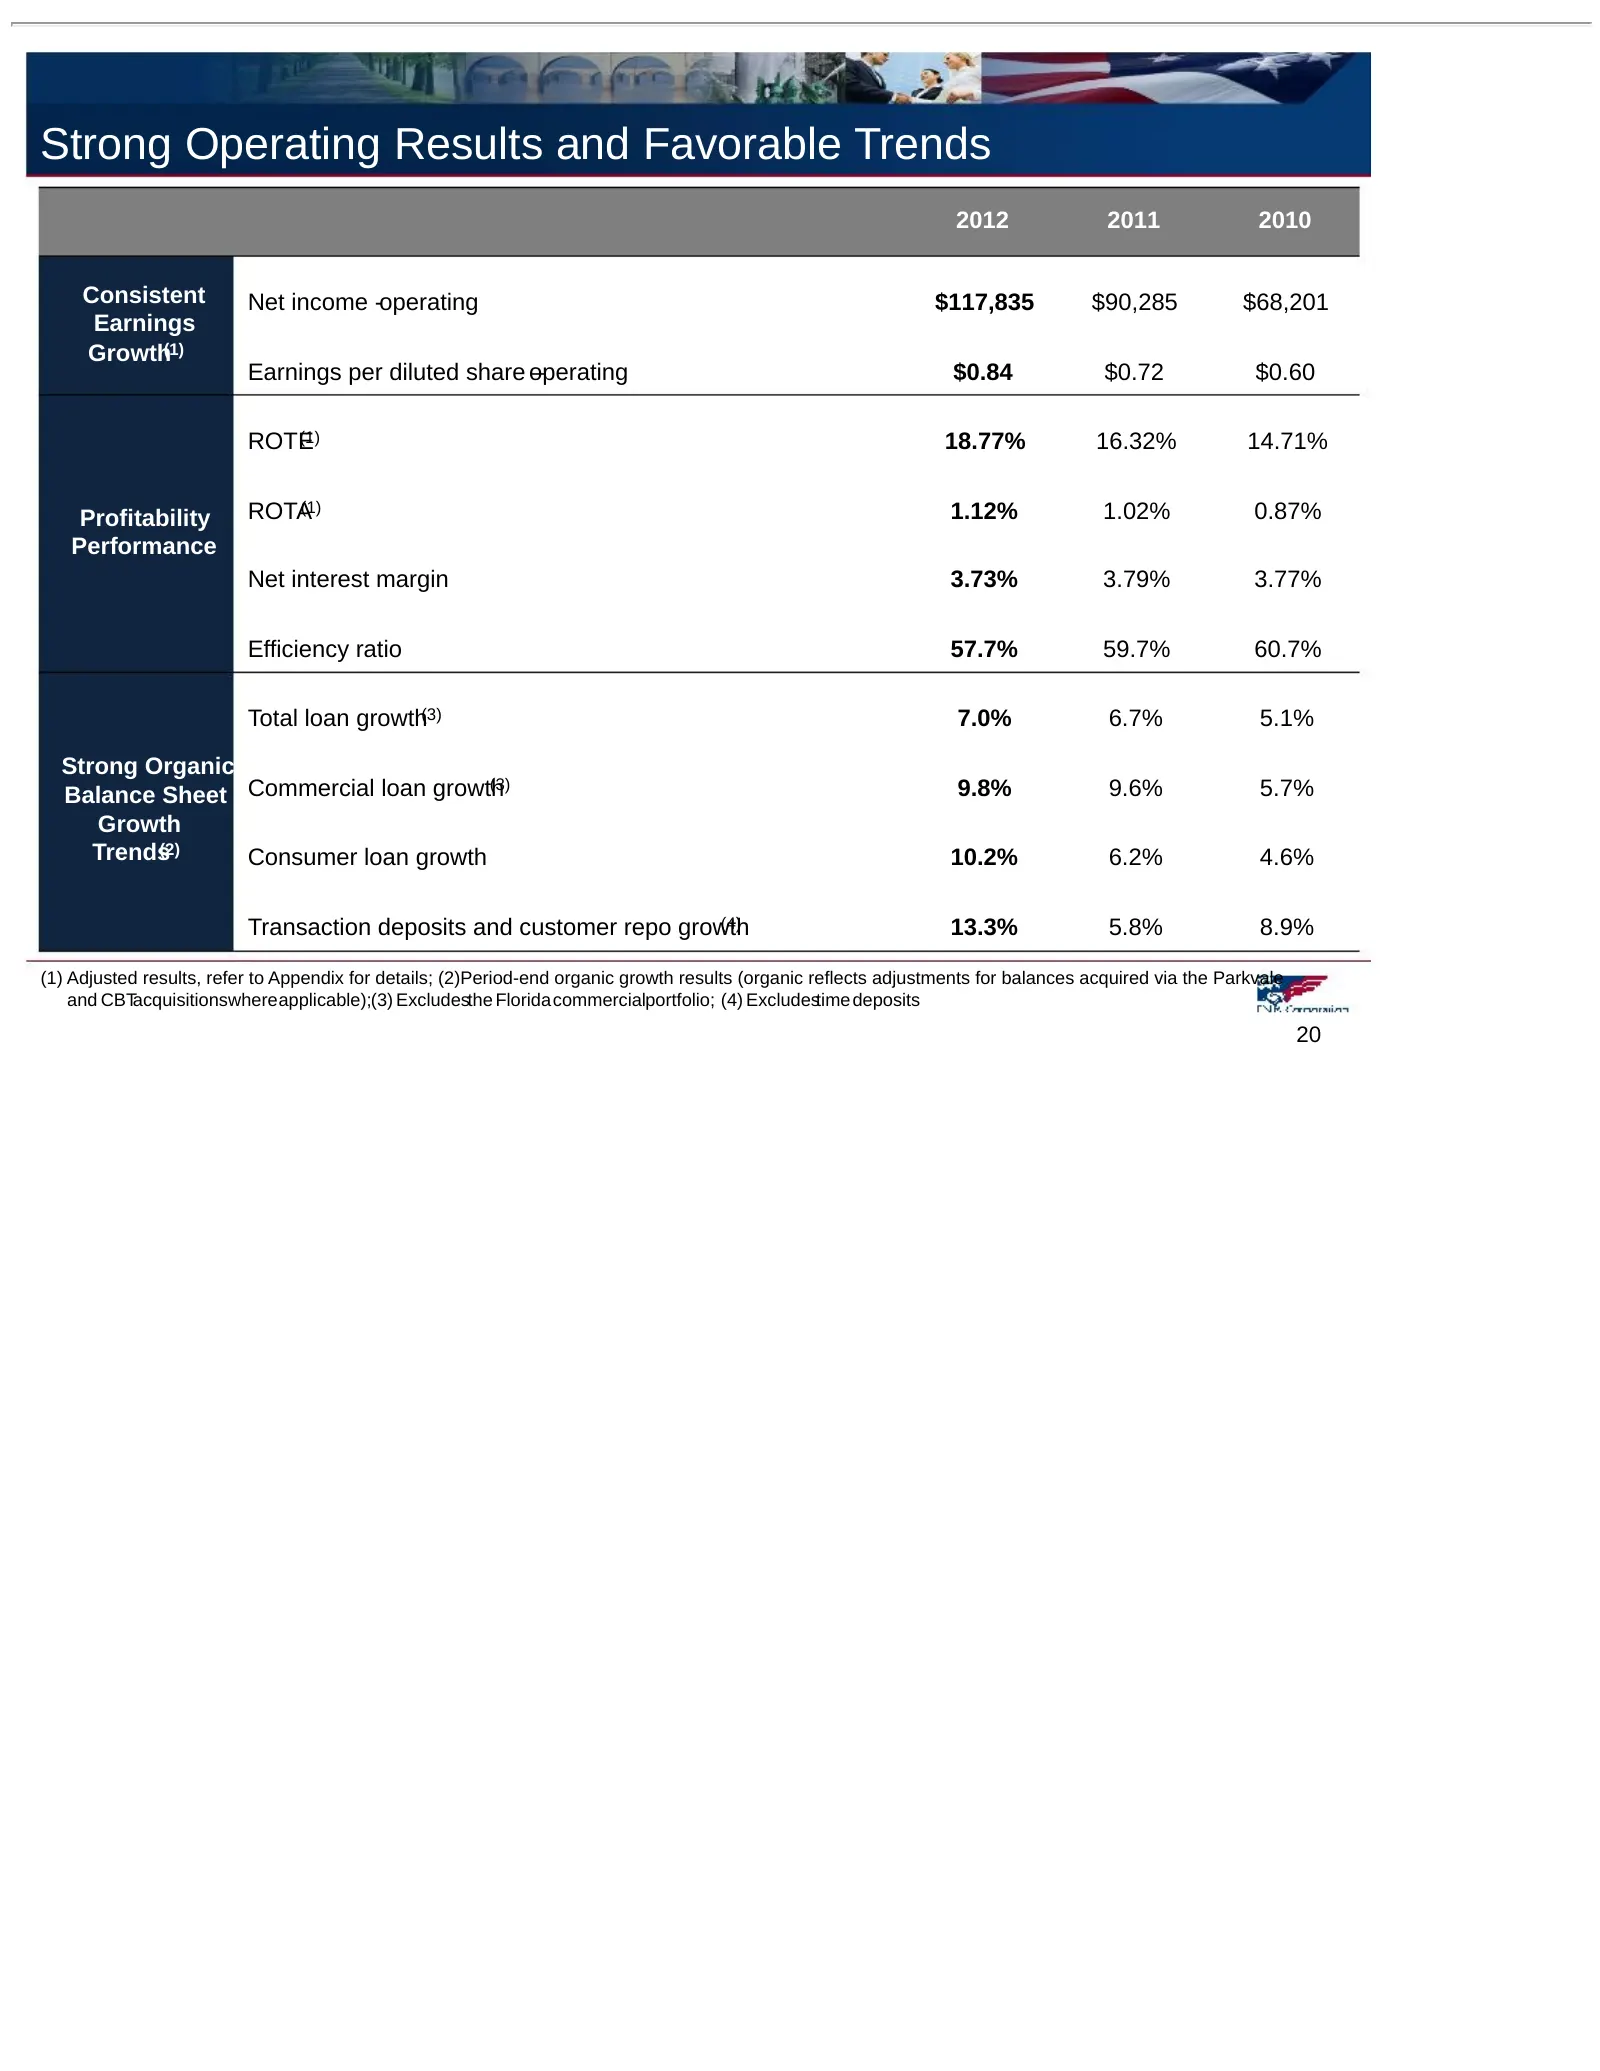
Strong Operating Results and Favorable Trends 2012 2011 2010 Consistent Net income -operating $117,835 $90,285 $68,201 Earnings Growth(1) Earnings per diluted share operating – $0.84 $0.72 $0.60 ROTE (1) 18.77% 16.32% 14.71% Profitability ROTA(1) 1.12% 1.02% 0.87% Performance Net interest margin 3.7
Slide 21: Earnings Per Share Trends
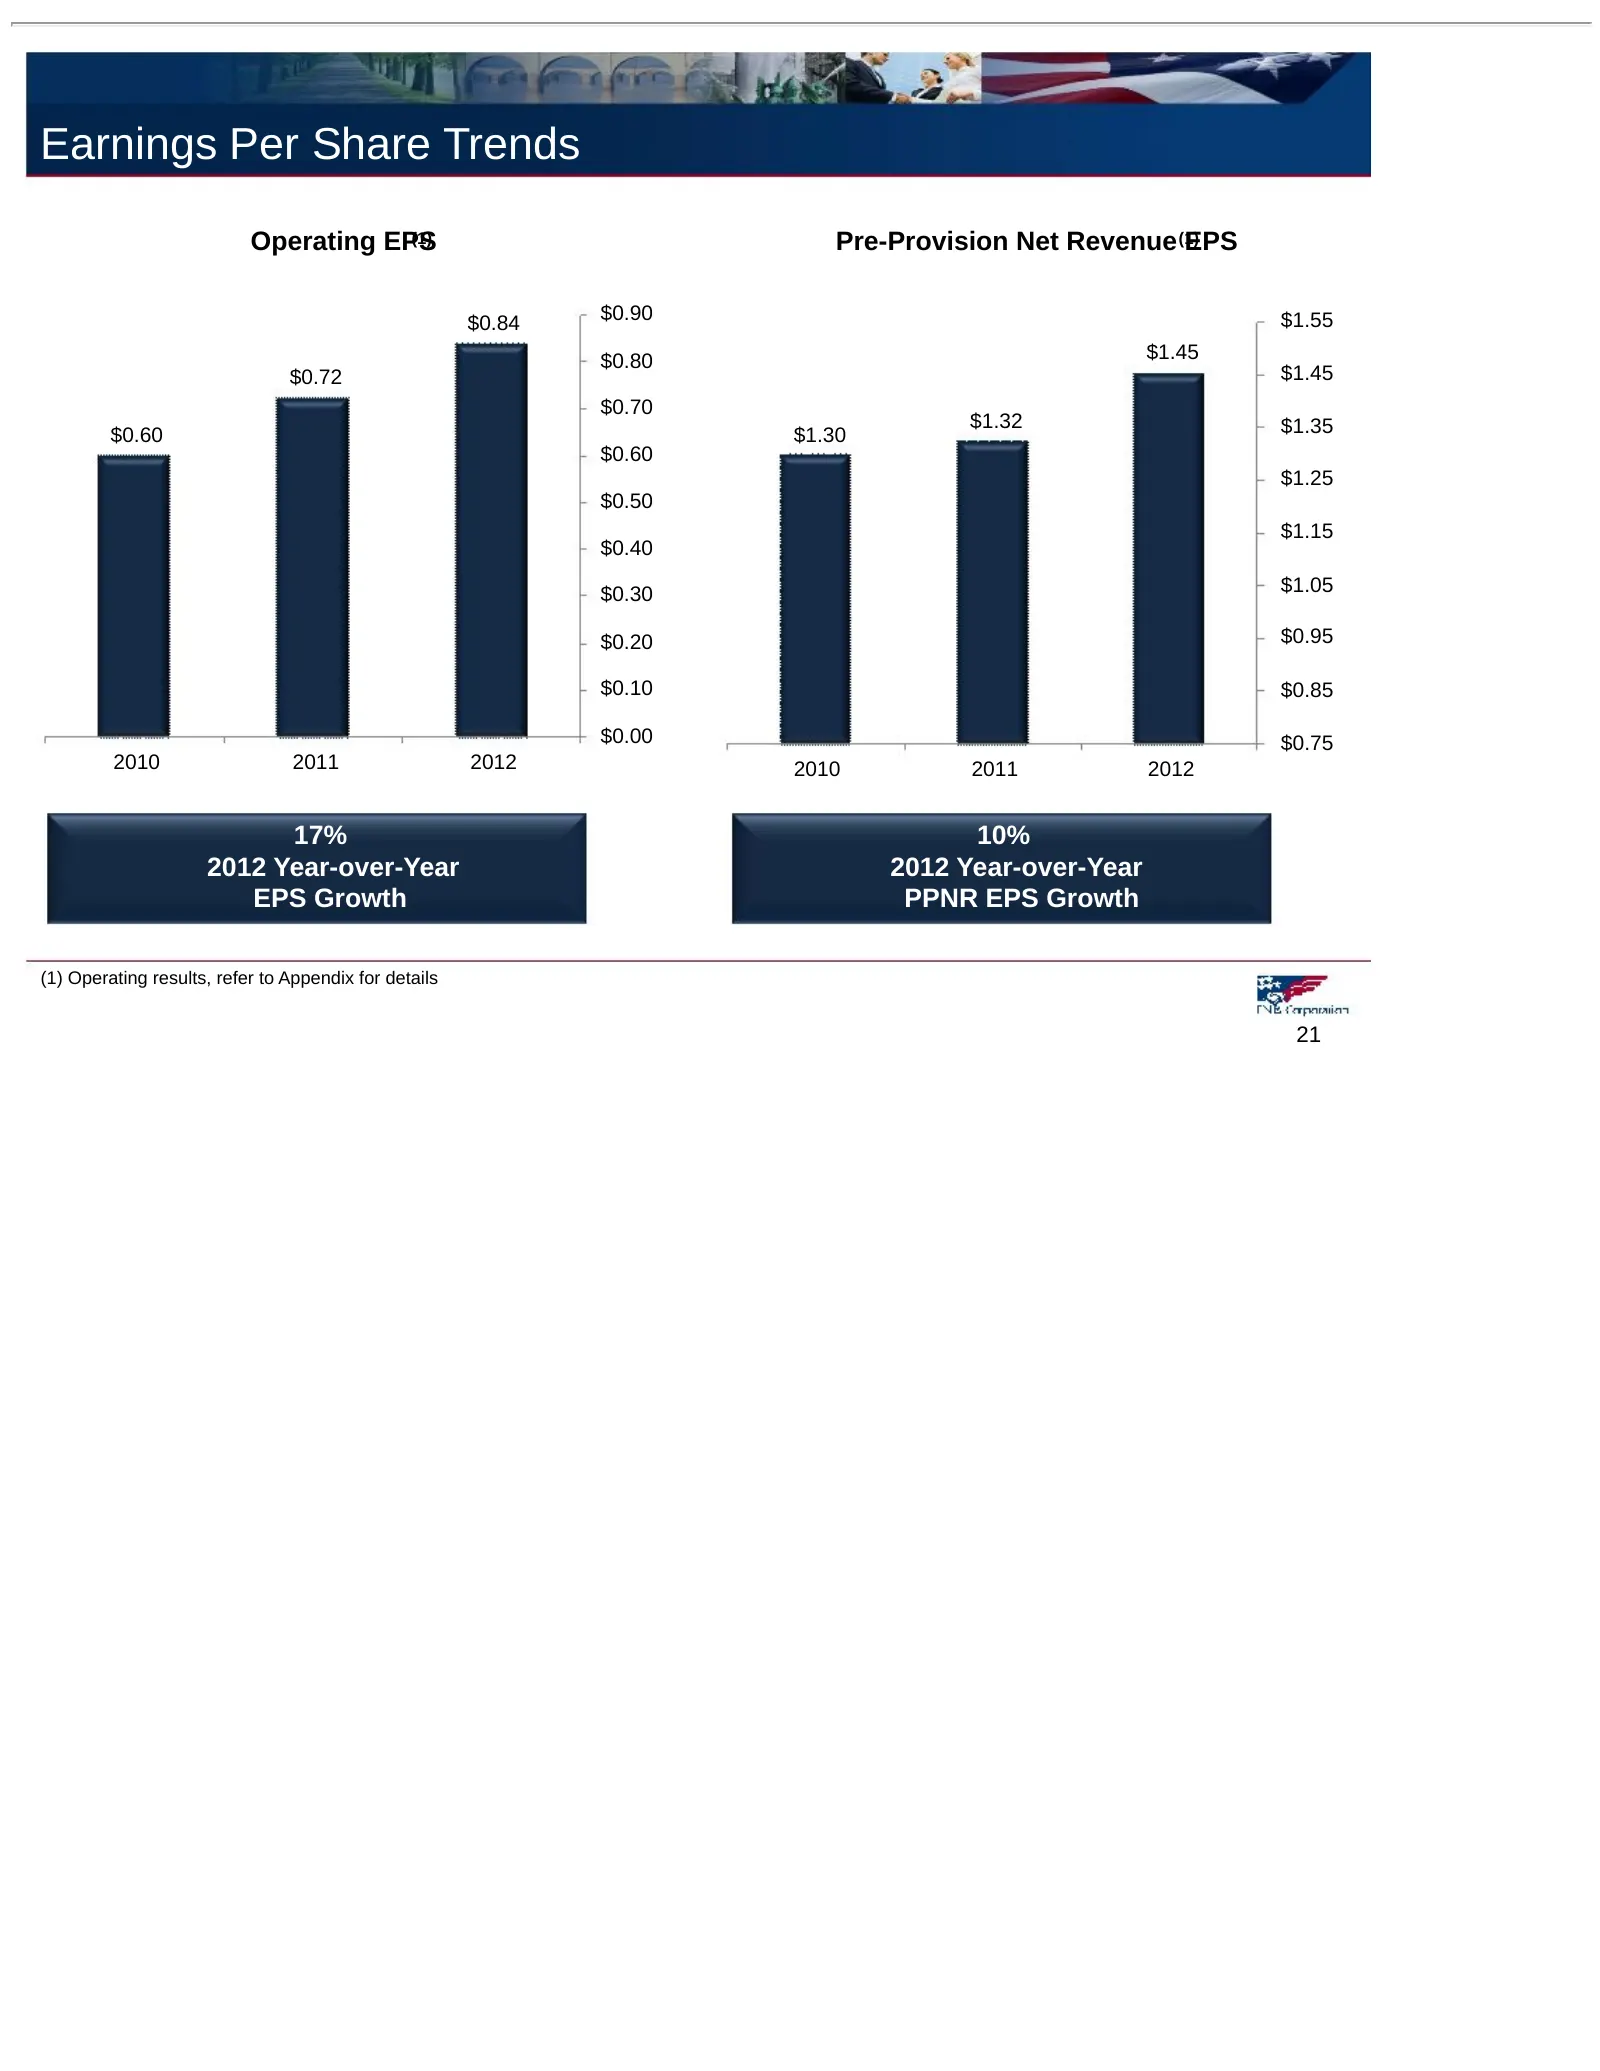
Earnings Per Share Trends Operating EPS (1) Pre-Provision Net Revenue (1) EPS $0.84 $0.90 $1.55 $0.80 $1.45 $0.72 $1.45 $0.70 $1.32 $1.35 $0.60 $1.30 $0.60 $1.25 $0.50 $1.15 $0.40 $0.30 $1.05 $0.20 $0.95 $0.10 $0.85 $0.00 $0.75 2010 2011 2012 2010 2011 2012 17% 10% 2012 Year-over-Year 2012 Year-over
Slide 22: Profitability Trends
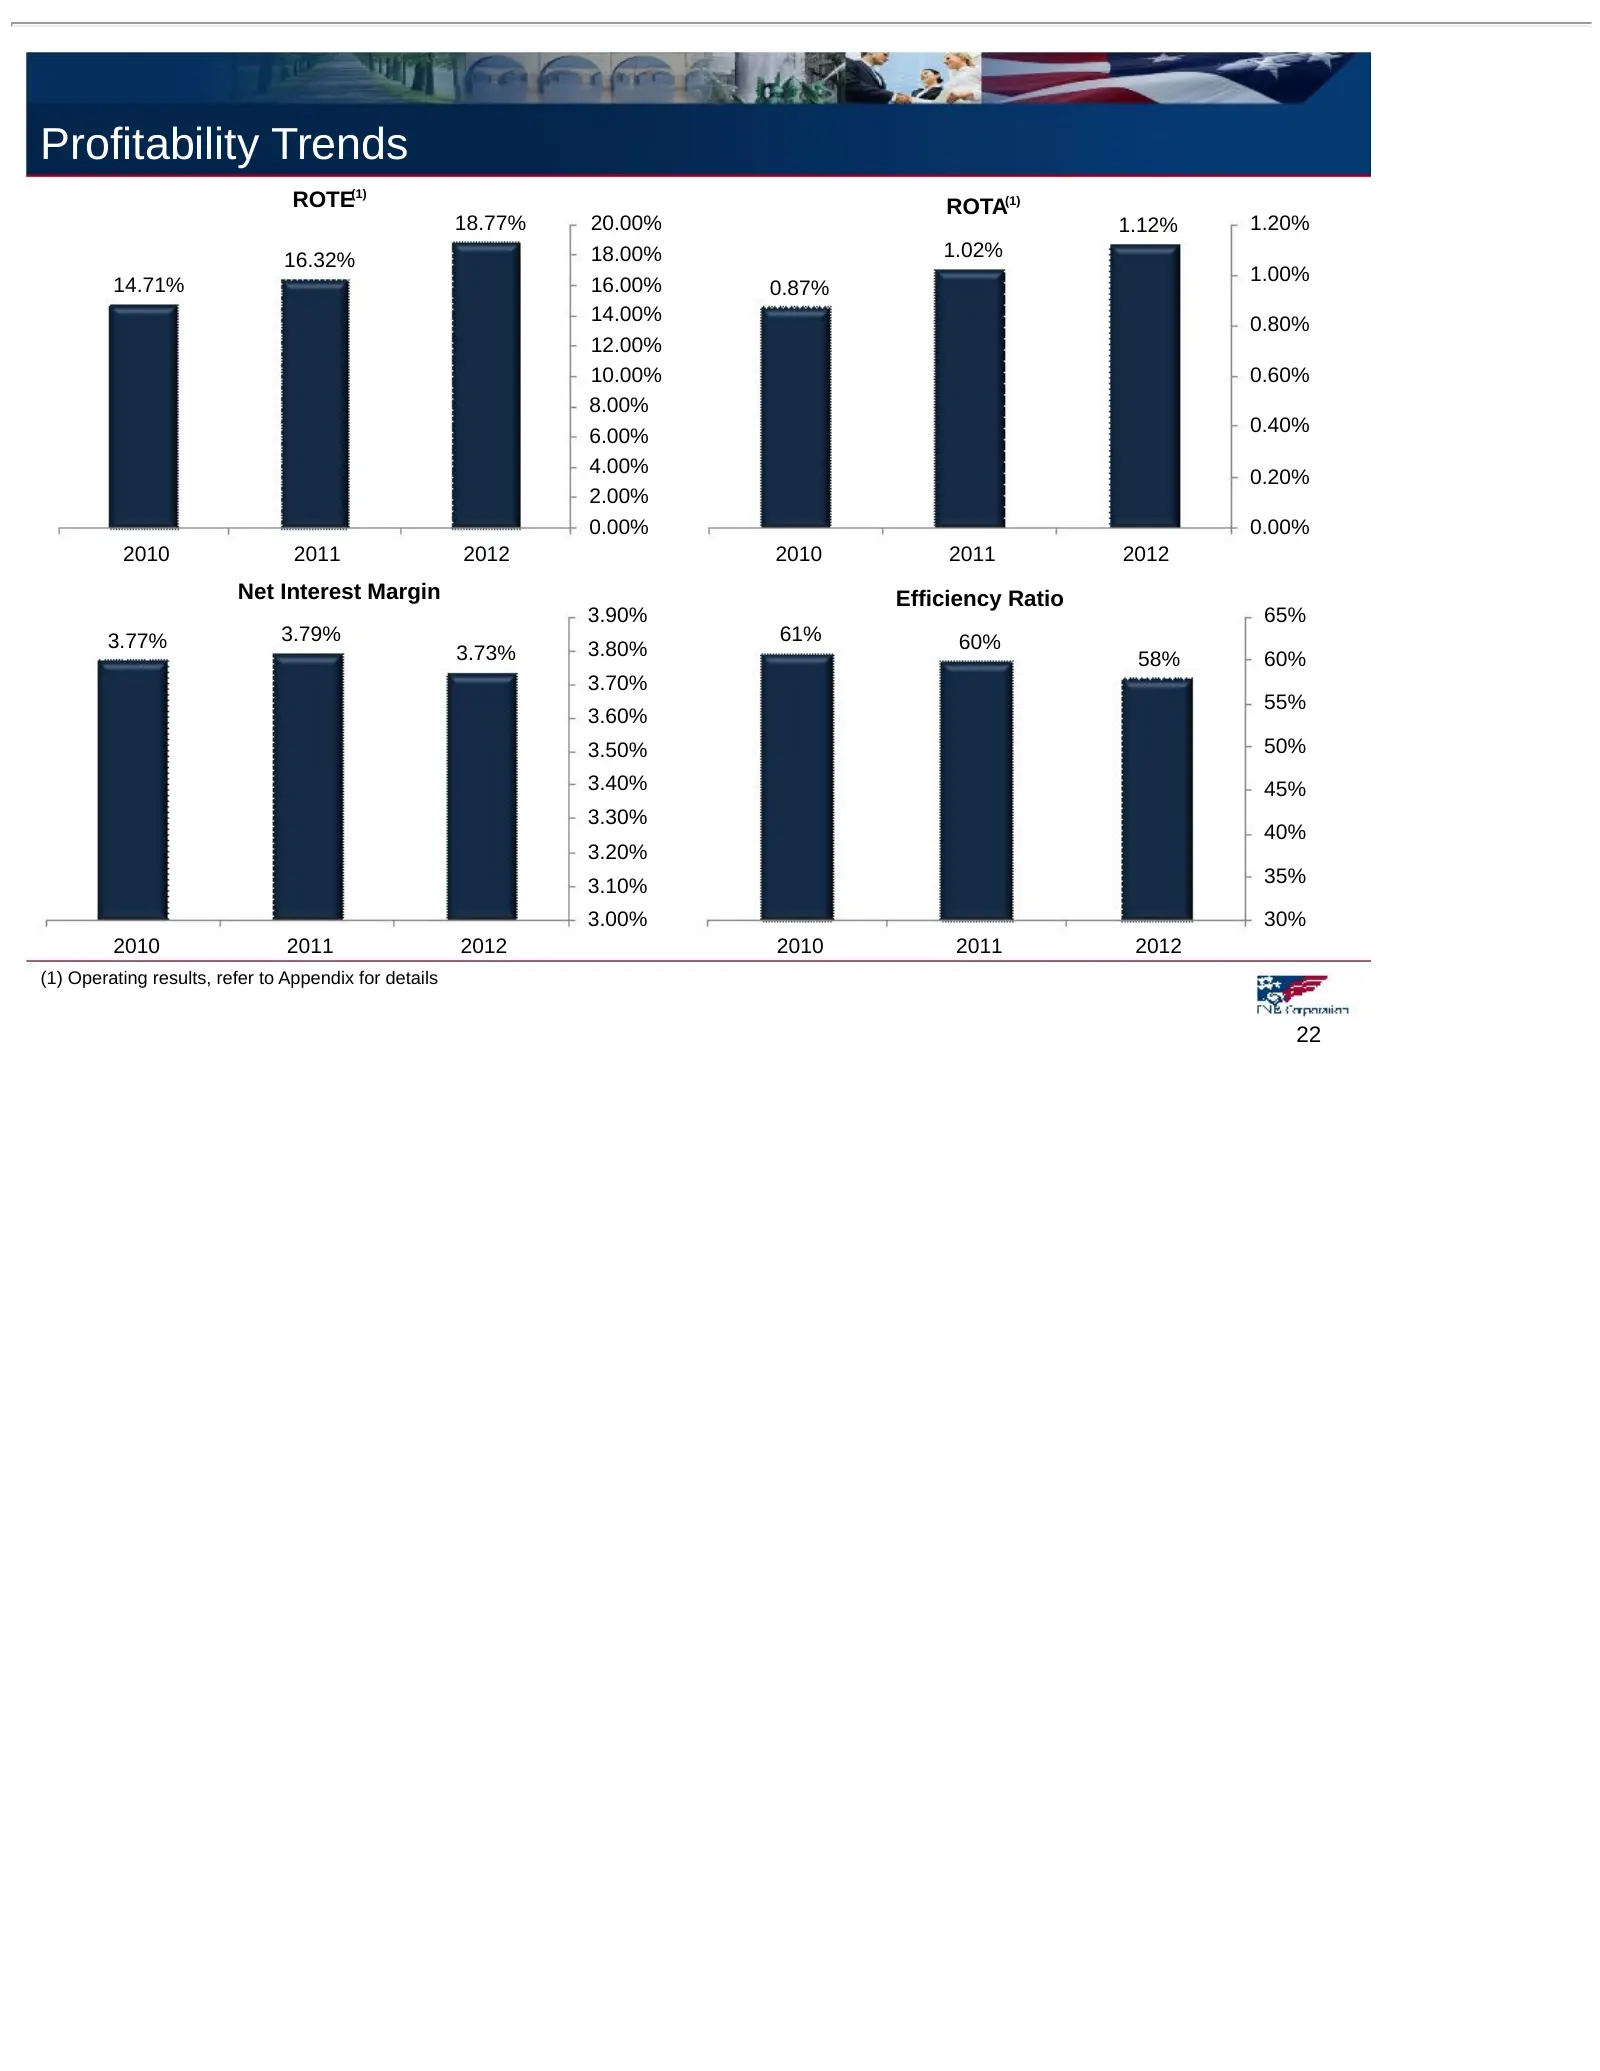
Profitability Trends ROTE(1) ROTA(1) 18.77% 20.00% 1.12% 1.20% 16.32% 18.00% 1.02% 1.00% 14.71% 16.00% 0.87% 14.00% 0.80% 12.00% 10.00% 0.60% 8.00% 0.40% 6.00% 4.00% 0.20% 2.00% 0.00% 0.00% 2010 2011 2012 2010 2011 2012 Net Interest Margin Efficiency Ratio 3.90% 65% 3.77% 3.79% 61% 60% 3.73% 3.80% 5
Slide 23: Industry Leading Loan Growth
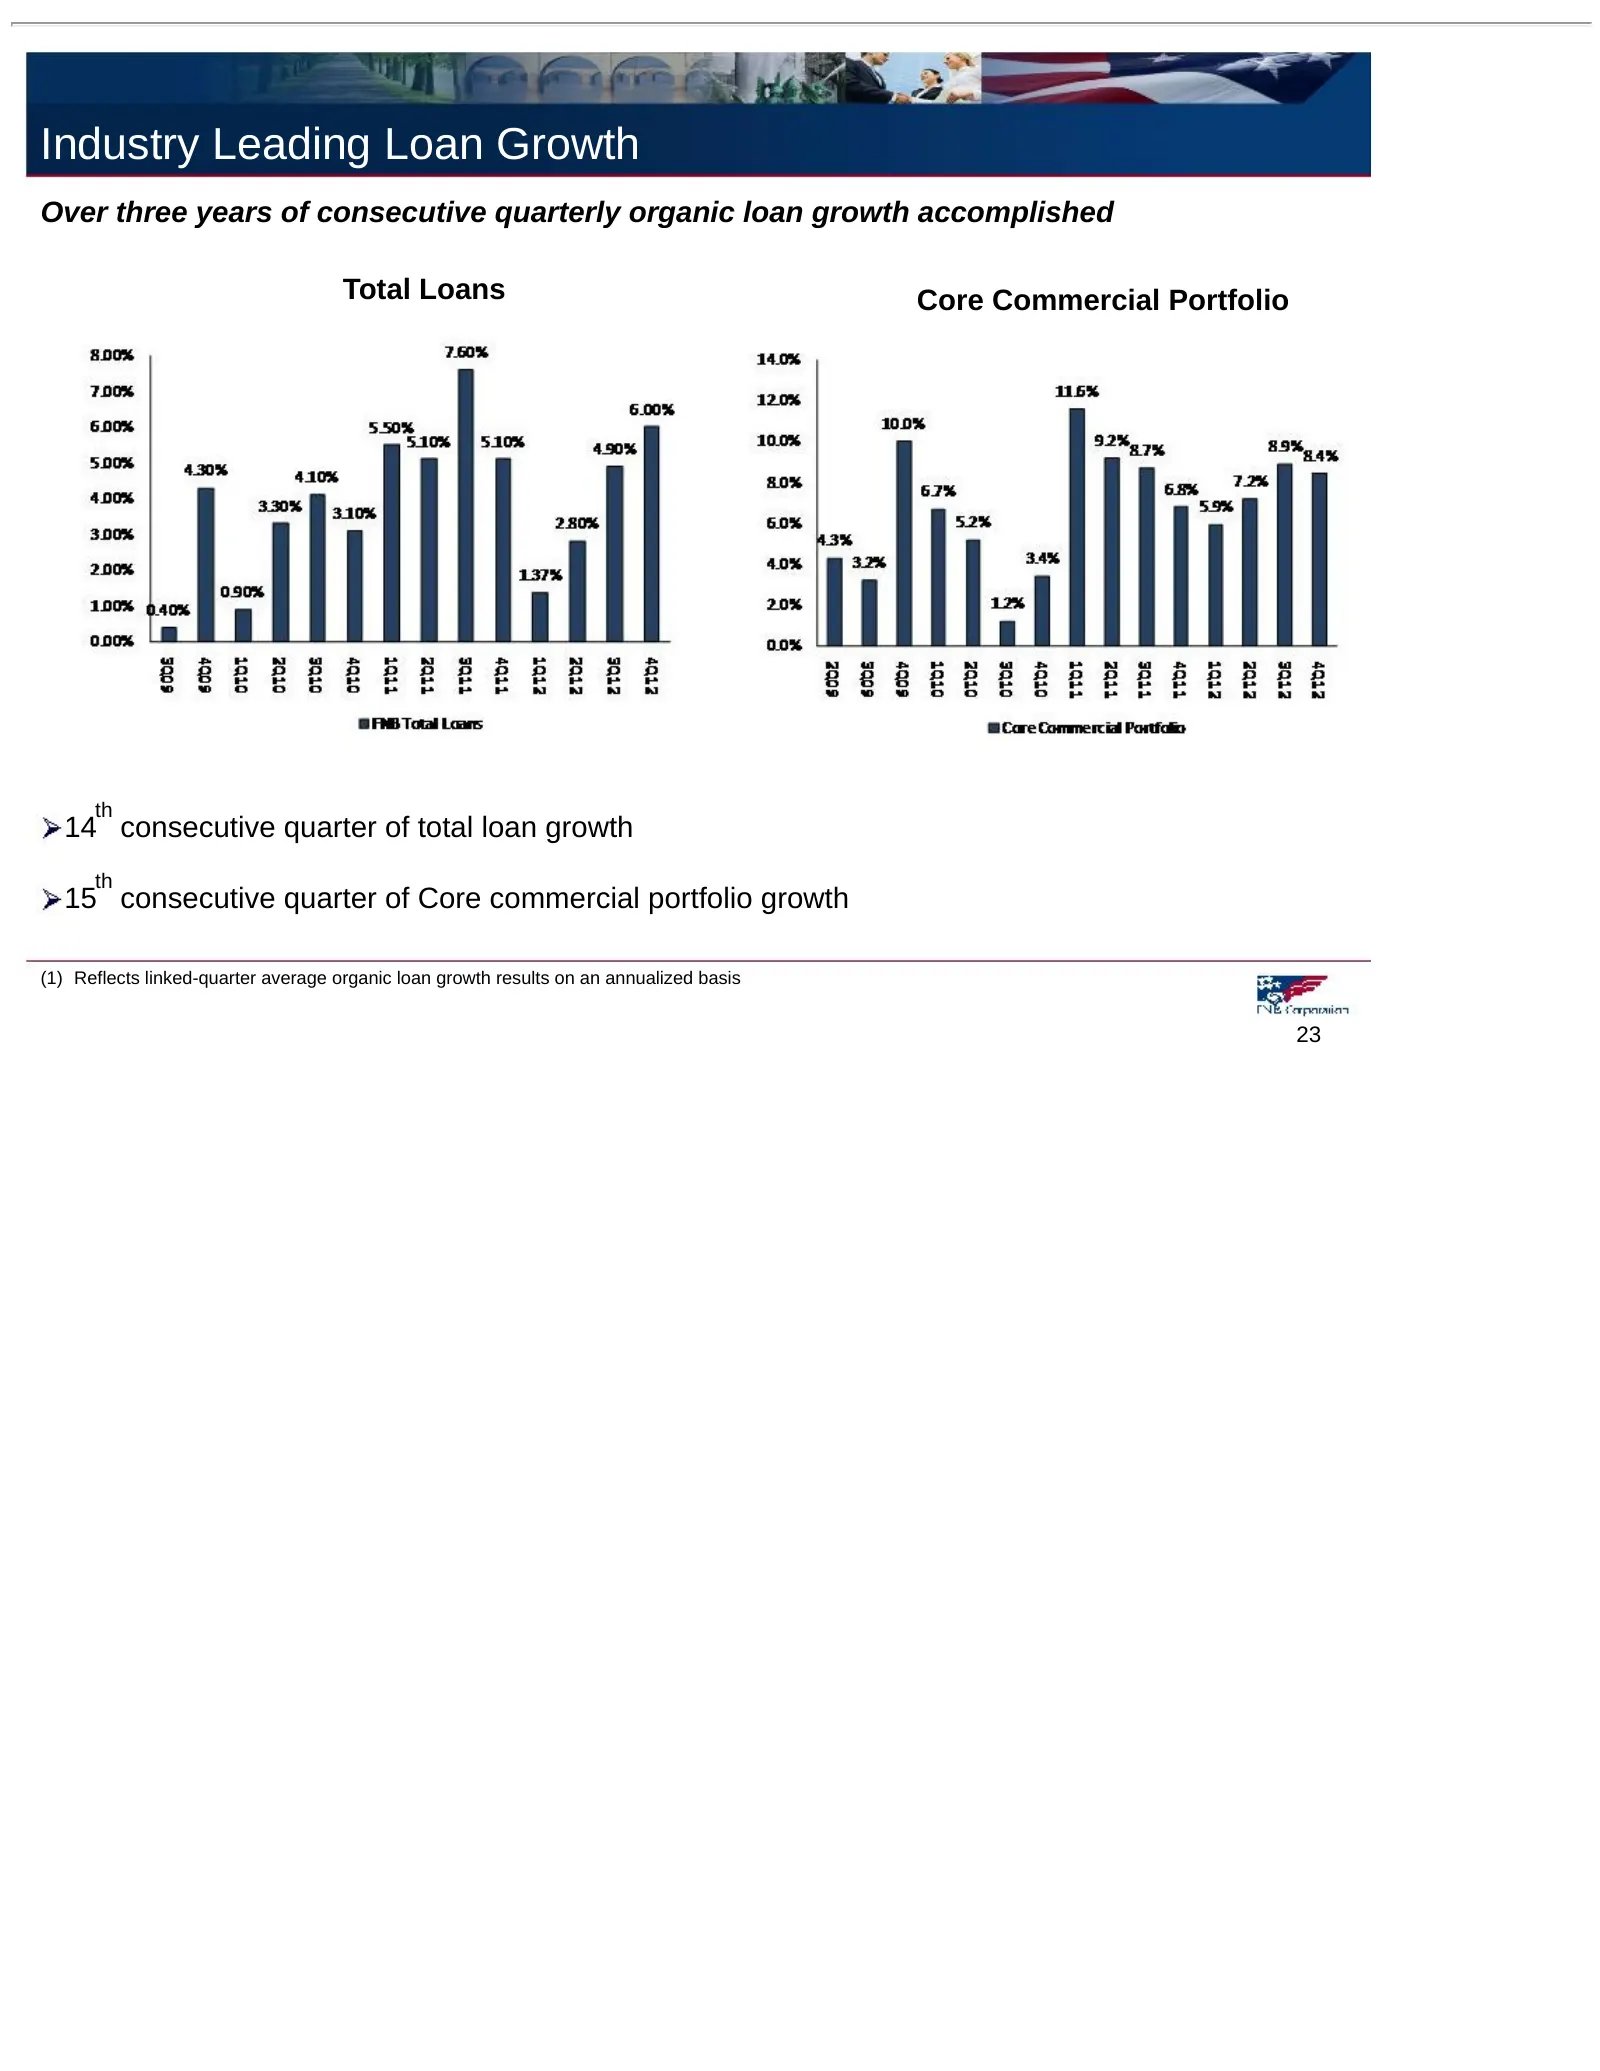
Industry Leading Loan Growth Over three years of consecutive quarterly organic loan growth accomplished Total Loans Core Commercial Portfolio th 14 consecutive quarter of total loan growth th 15 consecutive quarter of Core commercial portfolio growth (1) Reflects linked-quarter average organic loan
Slide 24: Net Interest Margin Trends
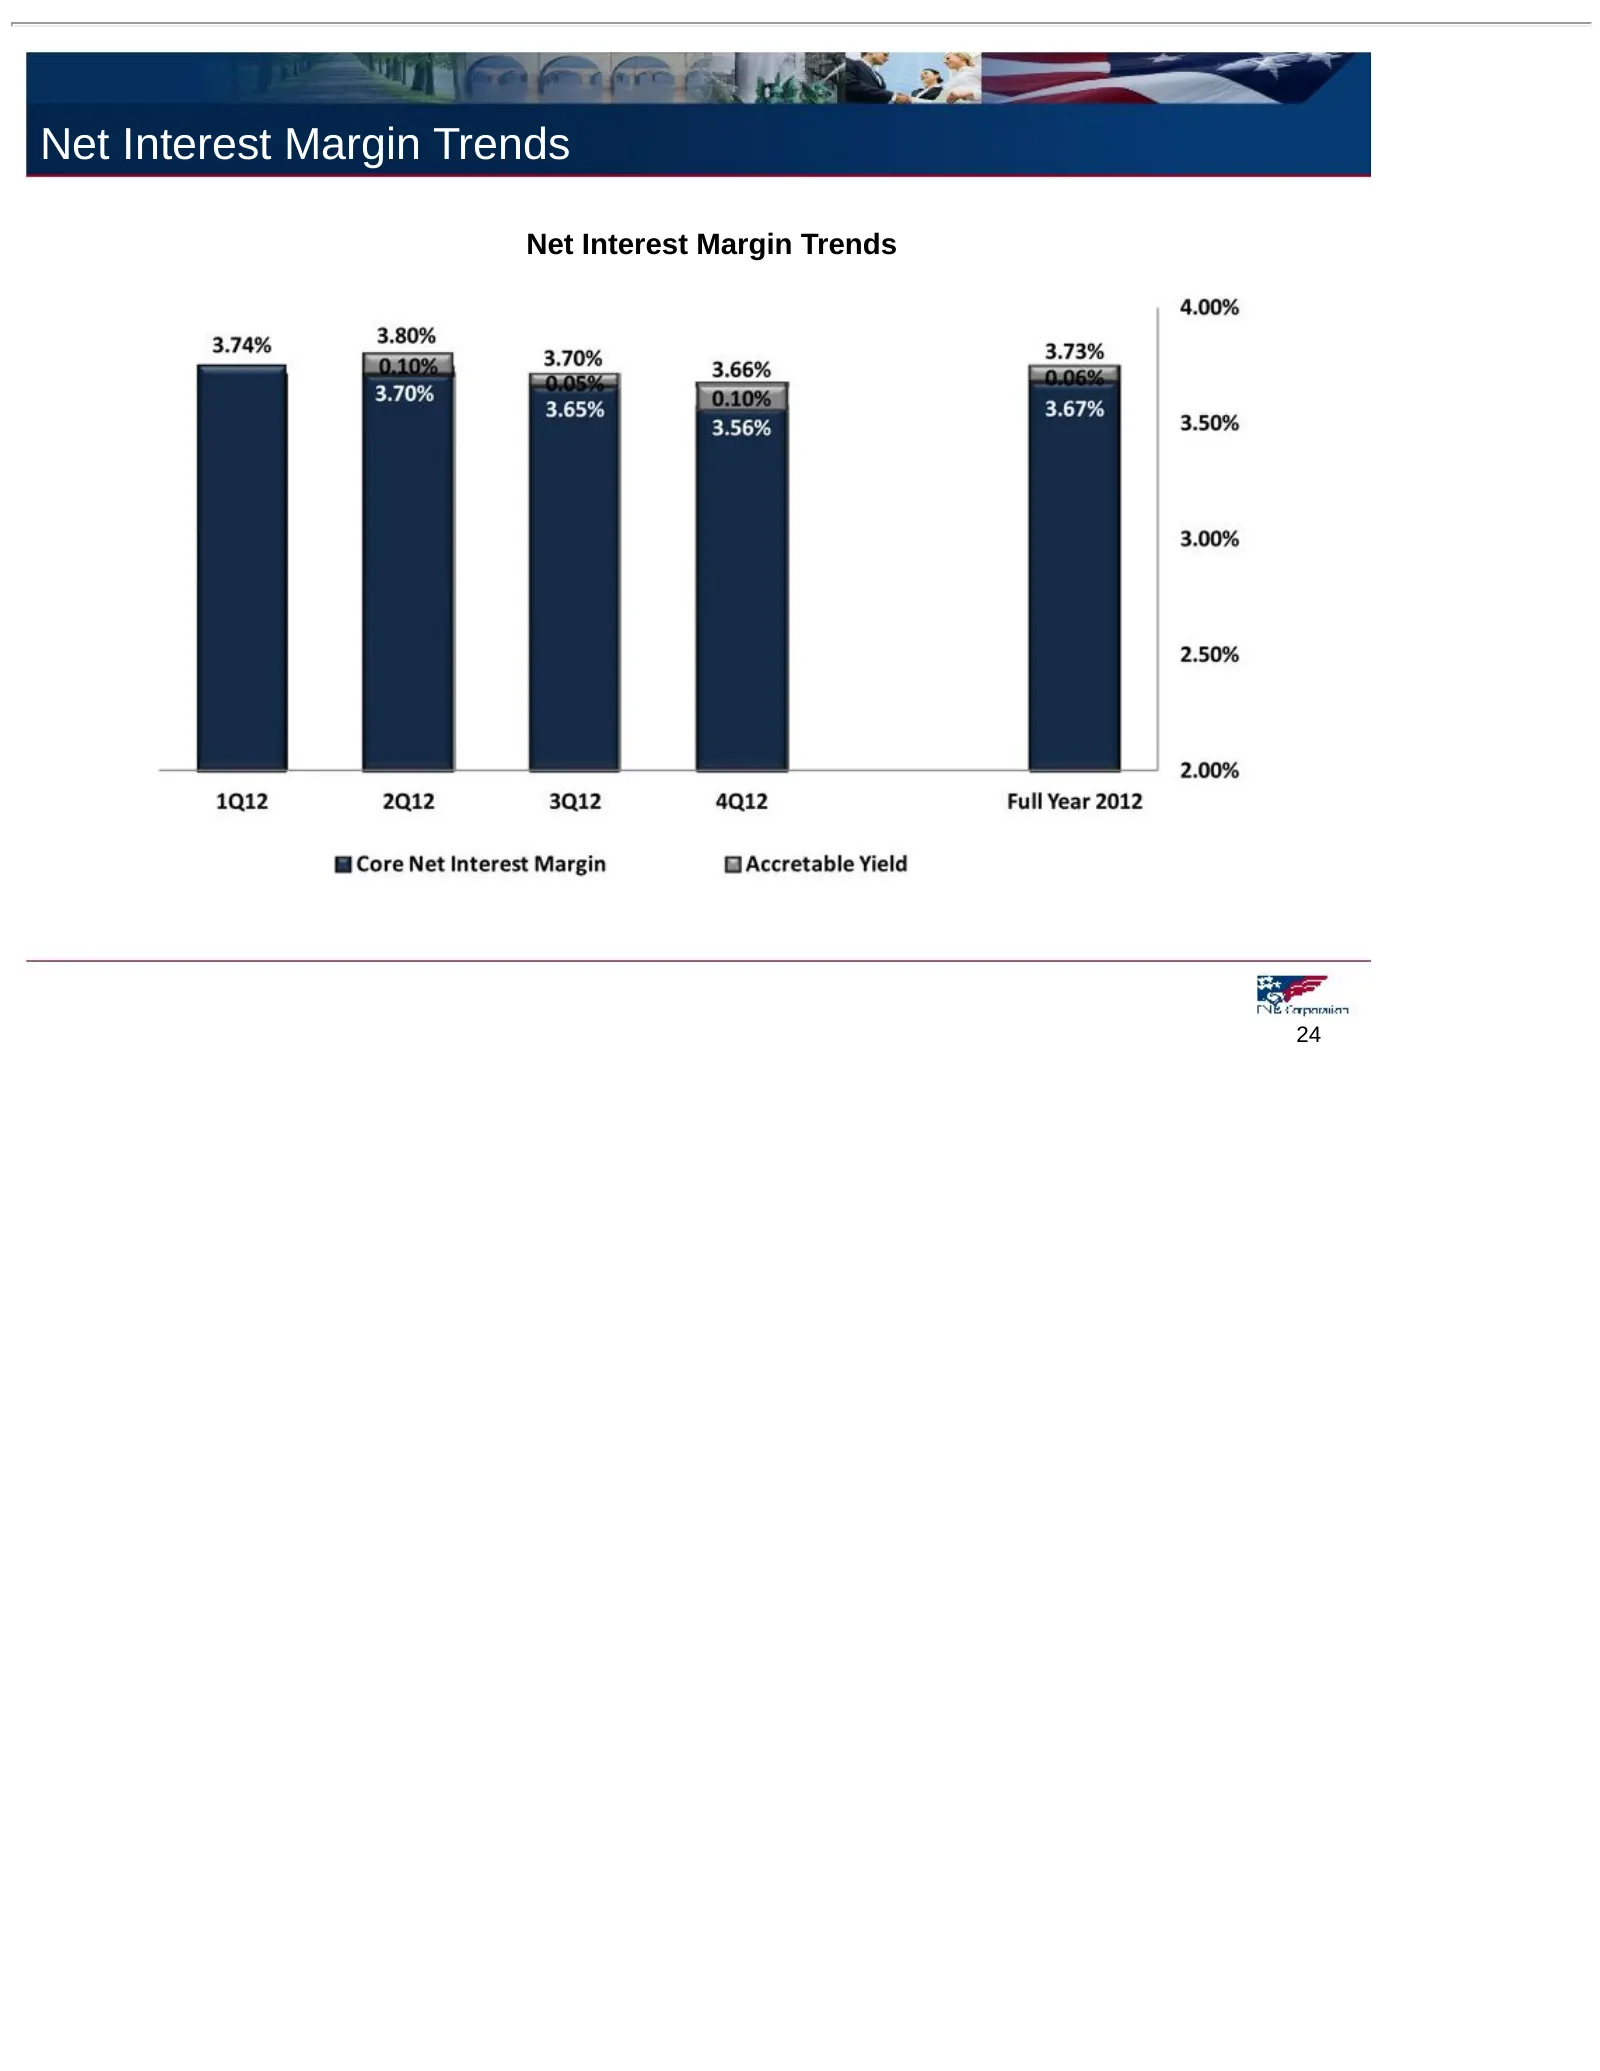
Net Interest Margin Trends Net Interest Margin Trends 24
Slide 25: Asset Quality Results
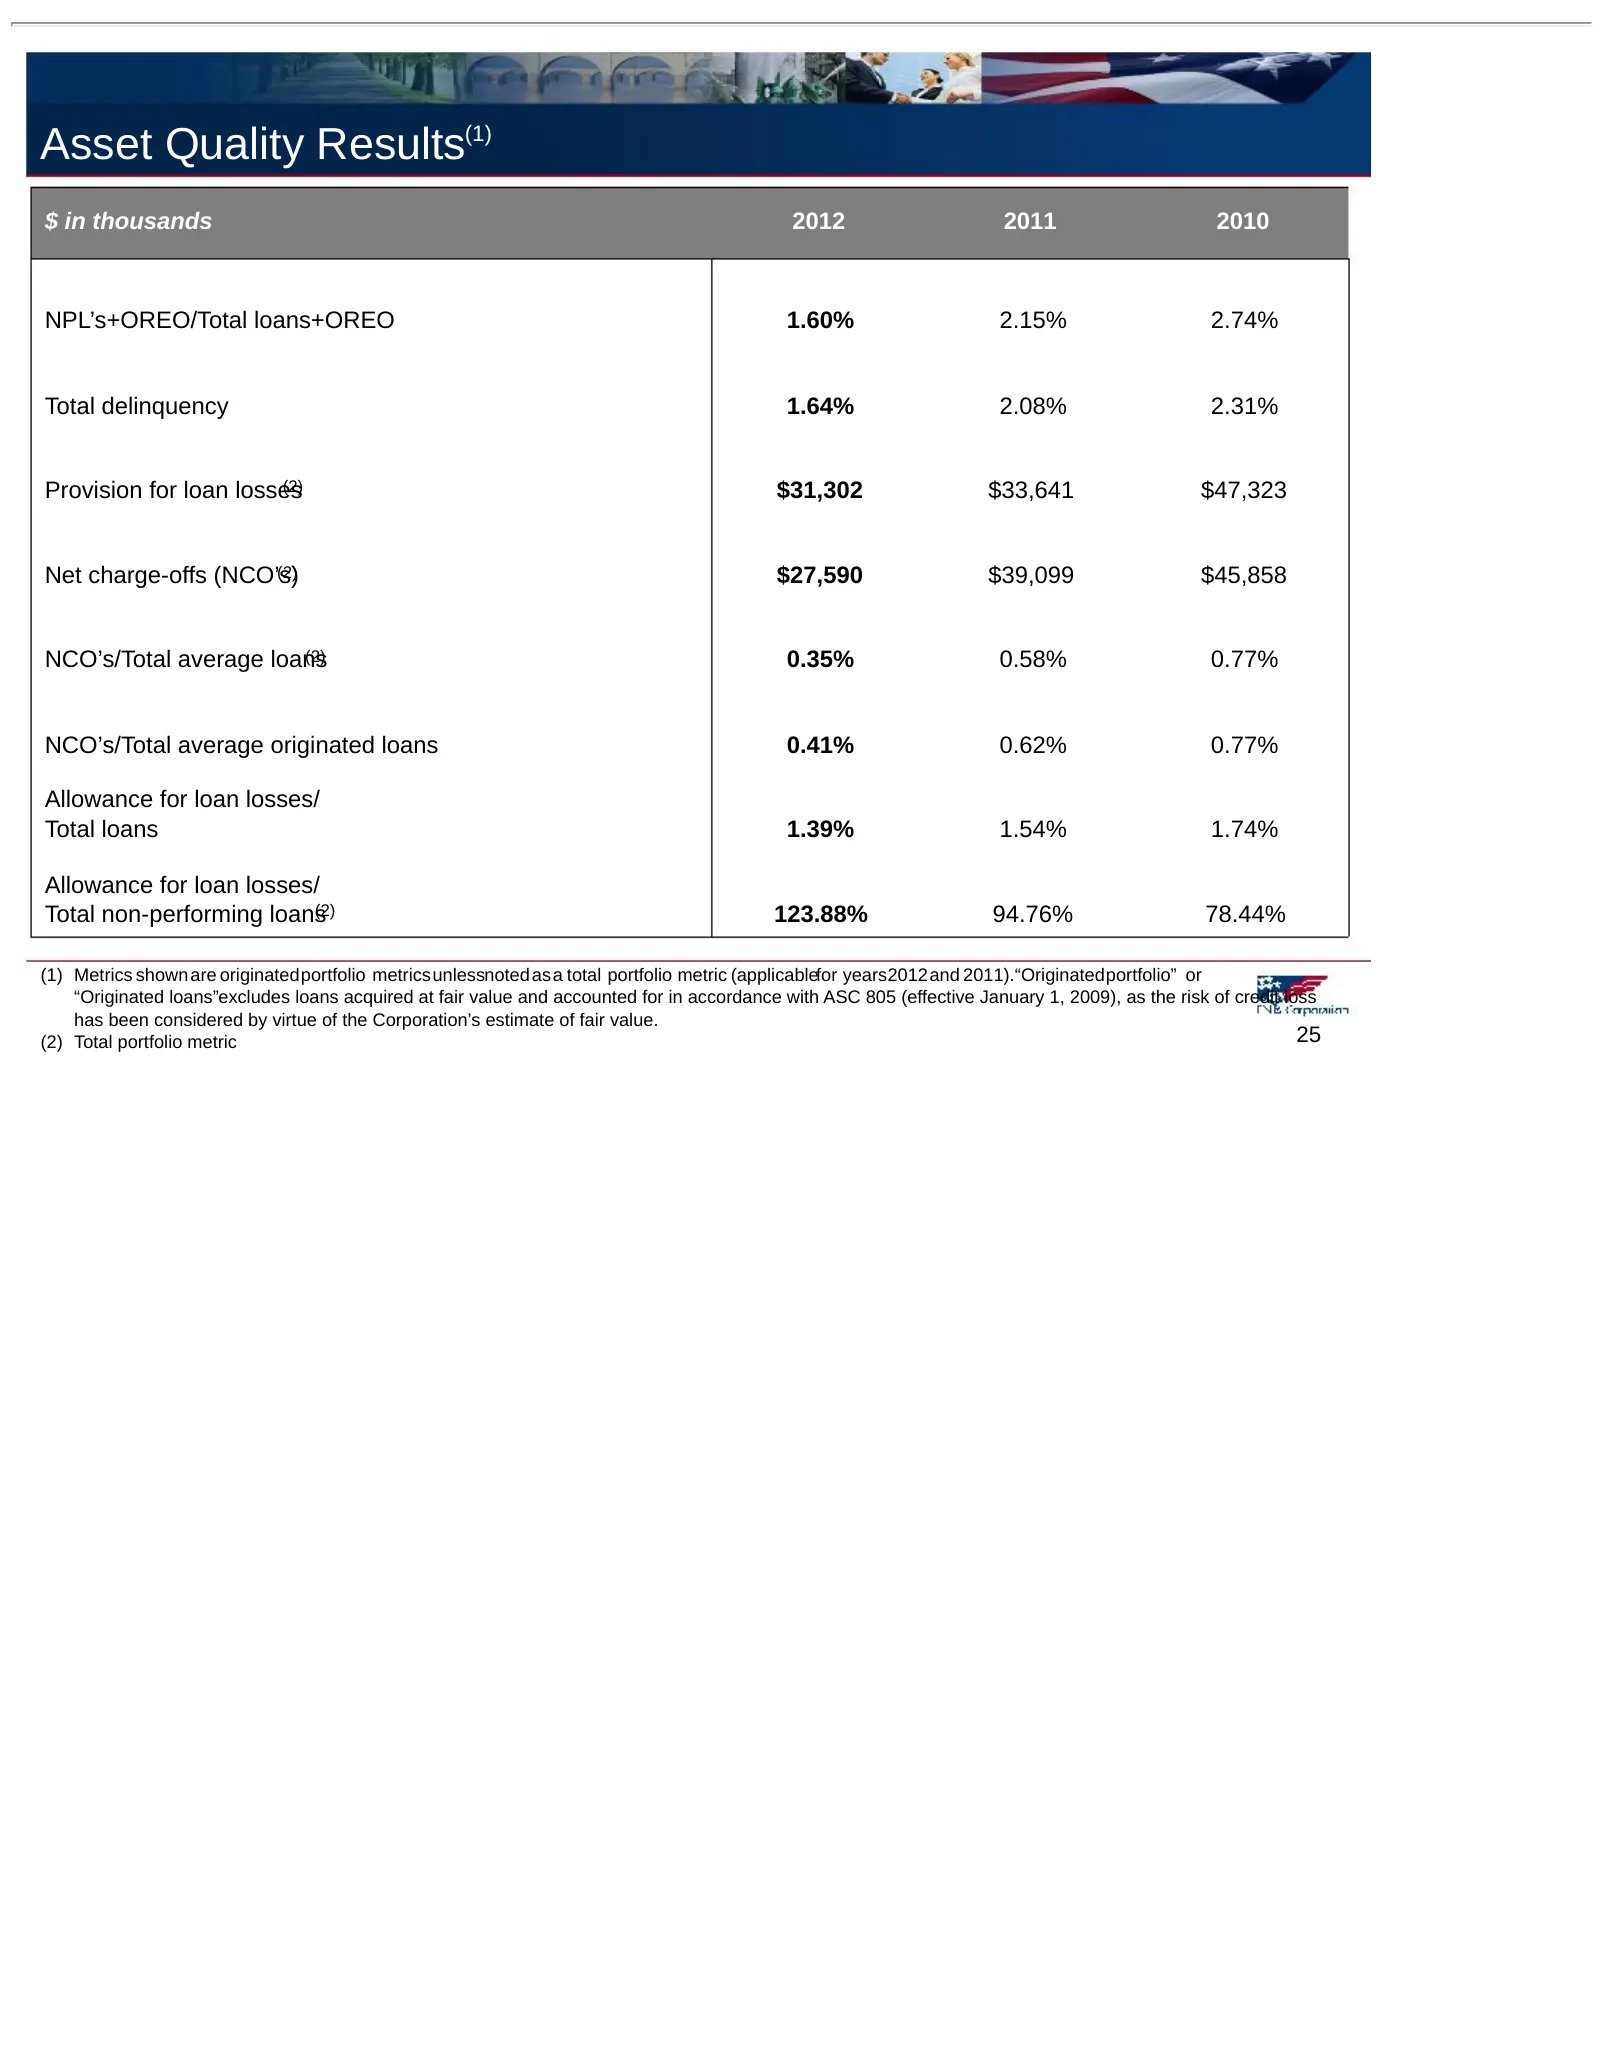
Asset Quality Results(1) $ in thousands 2012 2011 2010 NPL’s+OREO/Total loans+OREO 1.60% 2.15% 2.74% Total delinquency 1.64% 2.08% 2.31% Provision for loan losses (2) $31,302 $33,641 $47,323 Net charge-offs (NCO’s) (2) $27,590 $39,099 $45,858 NCO’s/Total average loans (2) 0.35% 0.58% 0.77% NCO’s/Tot
Slide 26: Asset Quality Trends
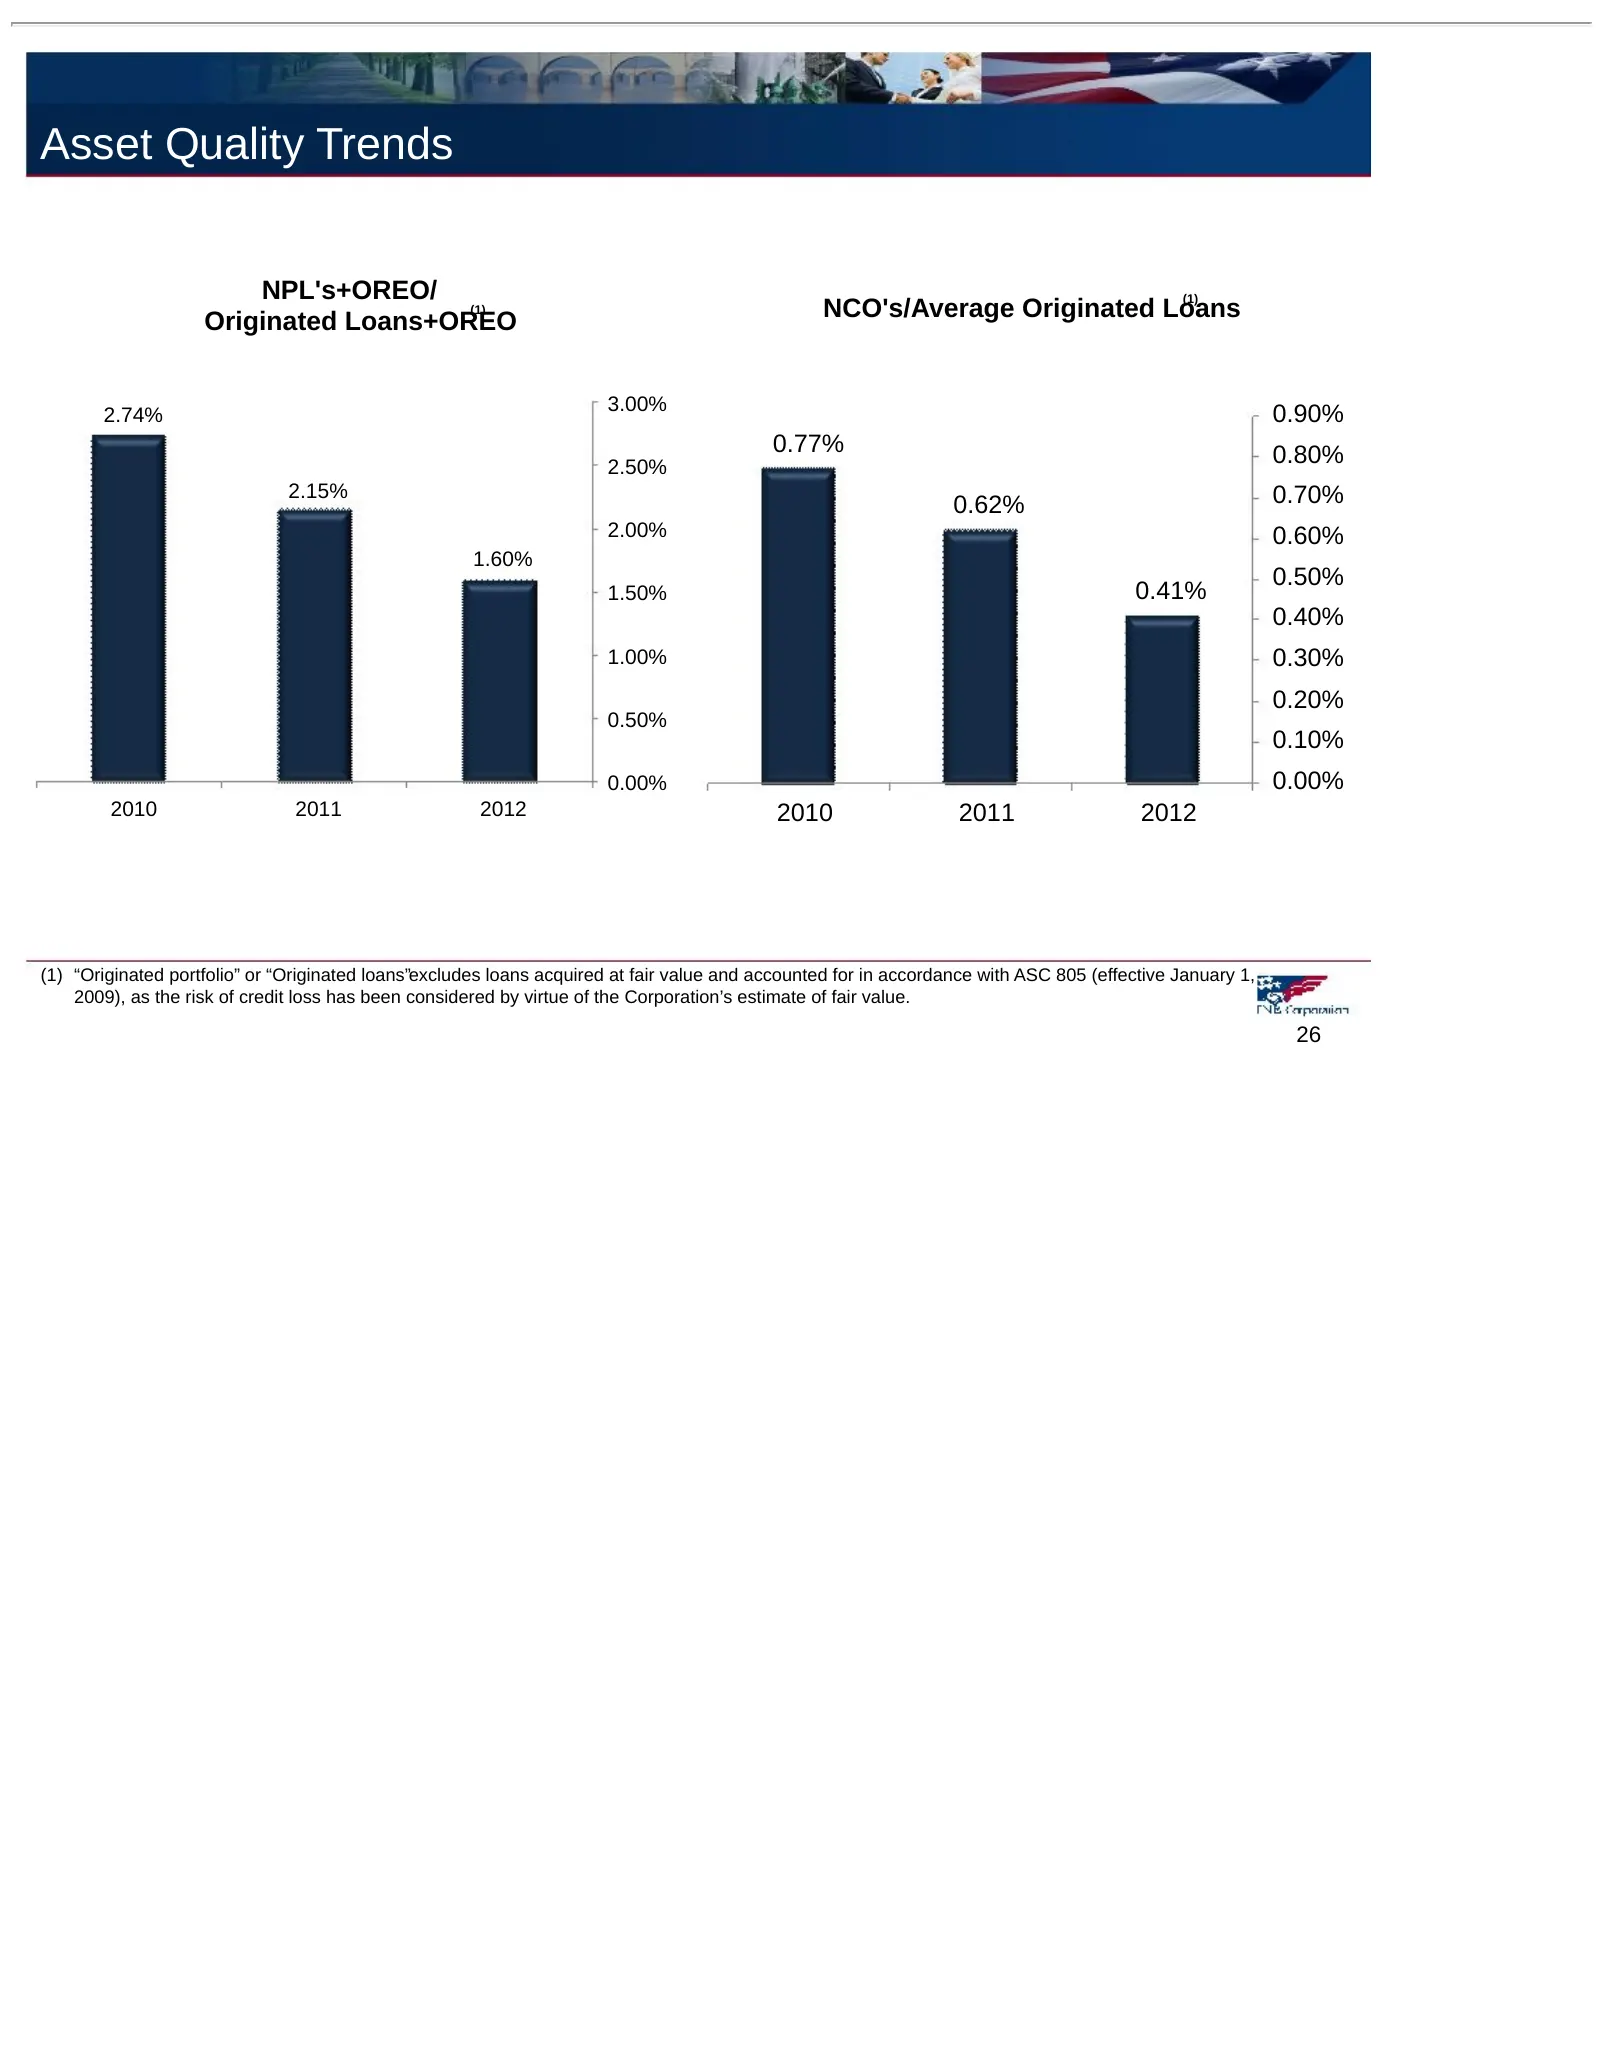
Asset Quality Trends NPL's+OREO/ (1) (1) Originated Loans+OREO NCO's/Average Originated Loans 3.00% 2.74% 0.90% 0.77% 0.80% 2.50% 2.15% 0.70% 0.62% 2.00% 0.60% 1.60% 0.50% 1.50% 0.41% 0.40% 1.00% 0.30% 0.20% 0.50% 0.10% 0.00% 0.00% 2010 2011 2012 2010 2011 2012 (1) “Originated portfolio” or “Origina
Slide 27: Capital Position
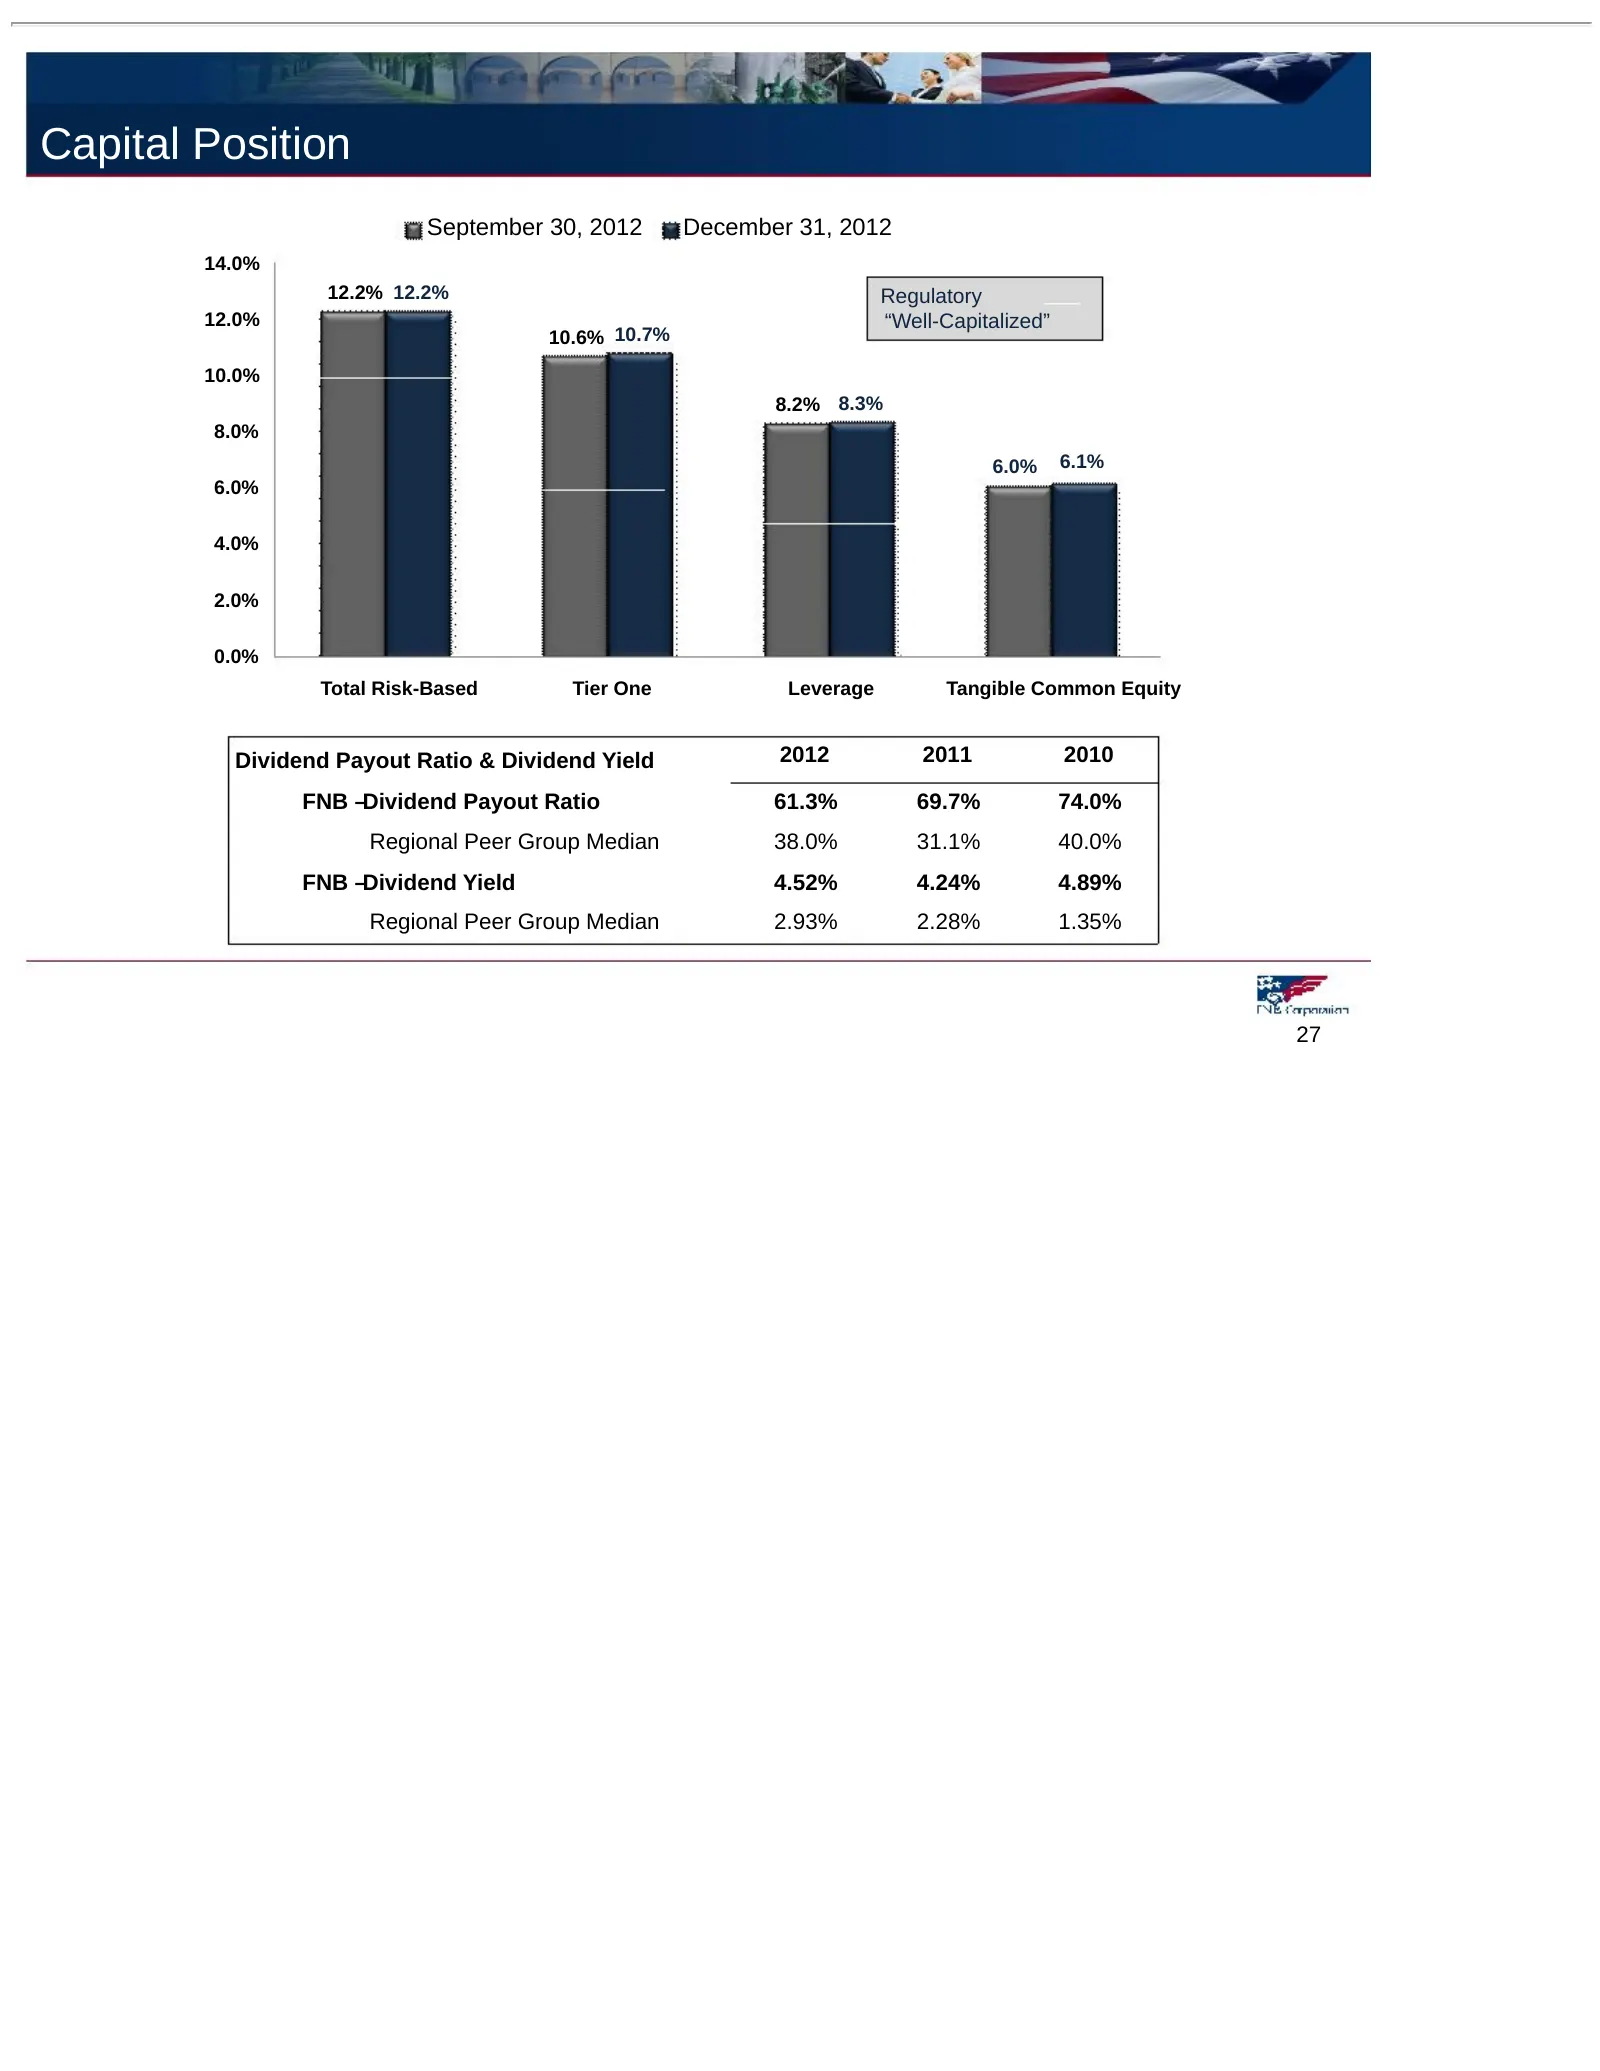
Capital Position September 30, 2012 December 31, 2012 14.0% 12.2% 12.2% Regulatory 12.0% “Well-Capitalized” 10.6% 10.7% 10.0% 8.2% 8.3% 8.0% 6.0% 6.1% 6.0% 4.0% 2.0% 0.0% Total Risk-Based Tier One Leverage Tangible Common Equity Dividend Payout Ratio & Dividend Yield 2012 2011 2010 FNB –Dividend Pay
Slide 28: Acquisition Strategy
Acquisition Strategy 28
Slide 29: Acquisition Strategy
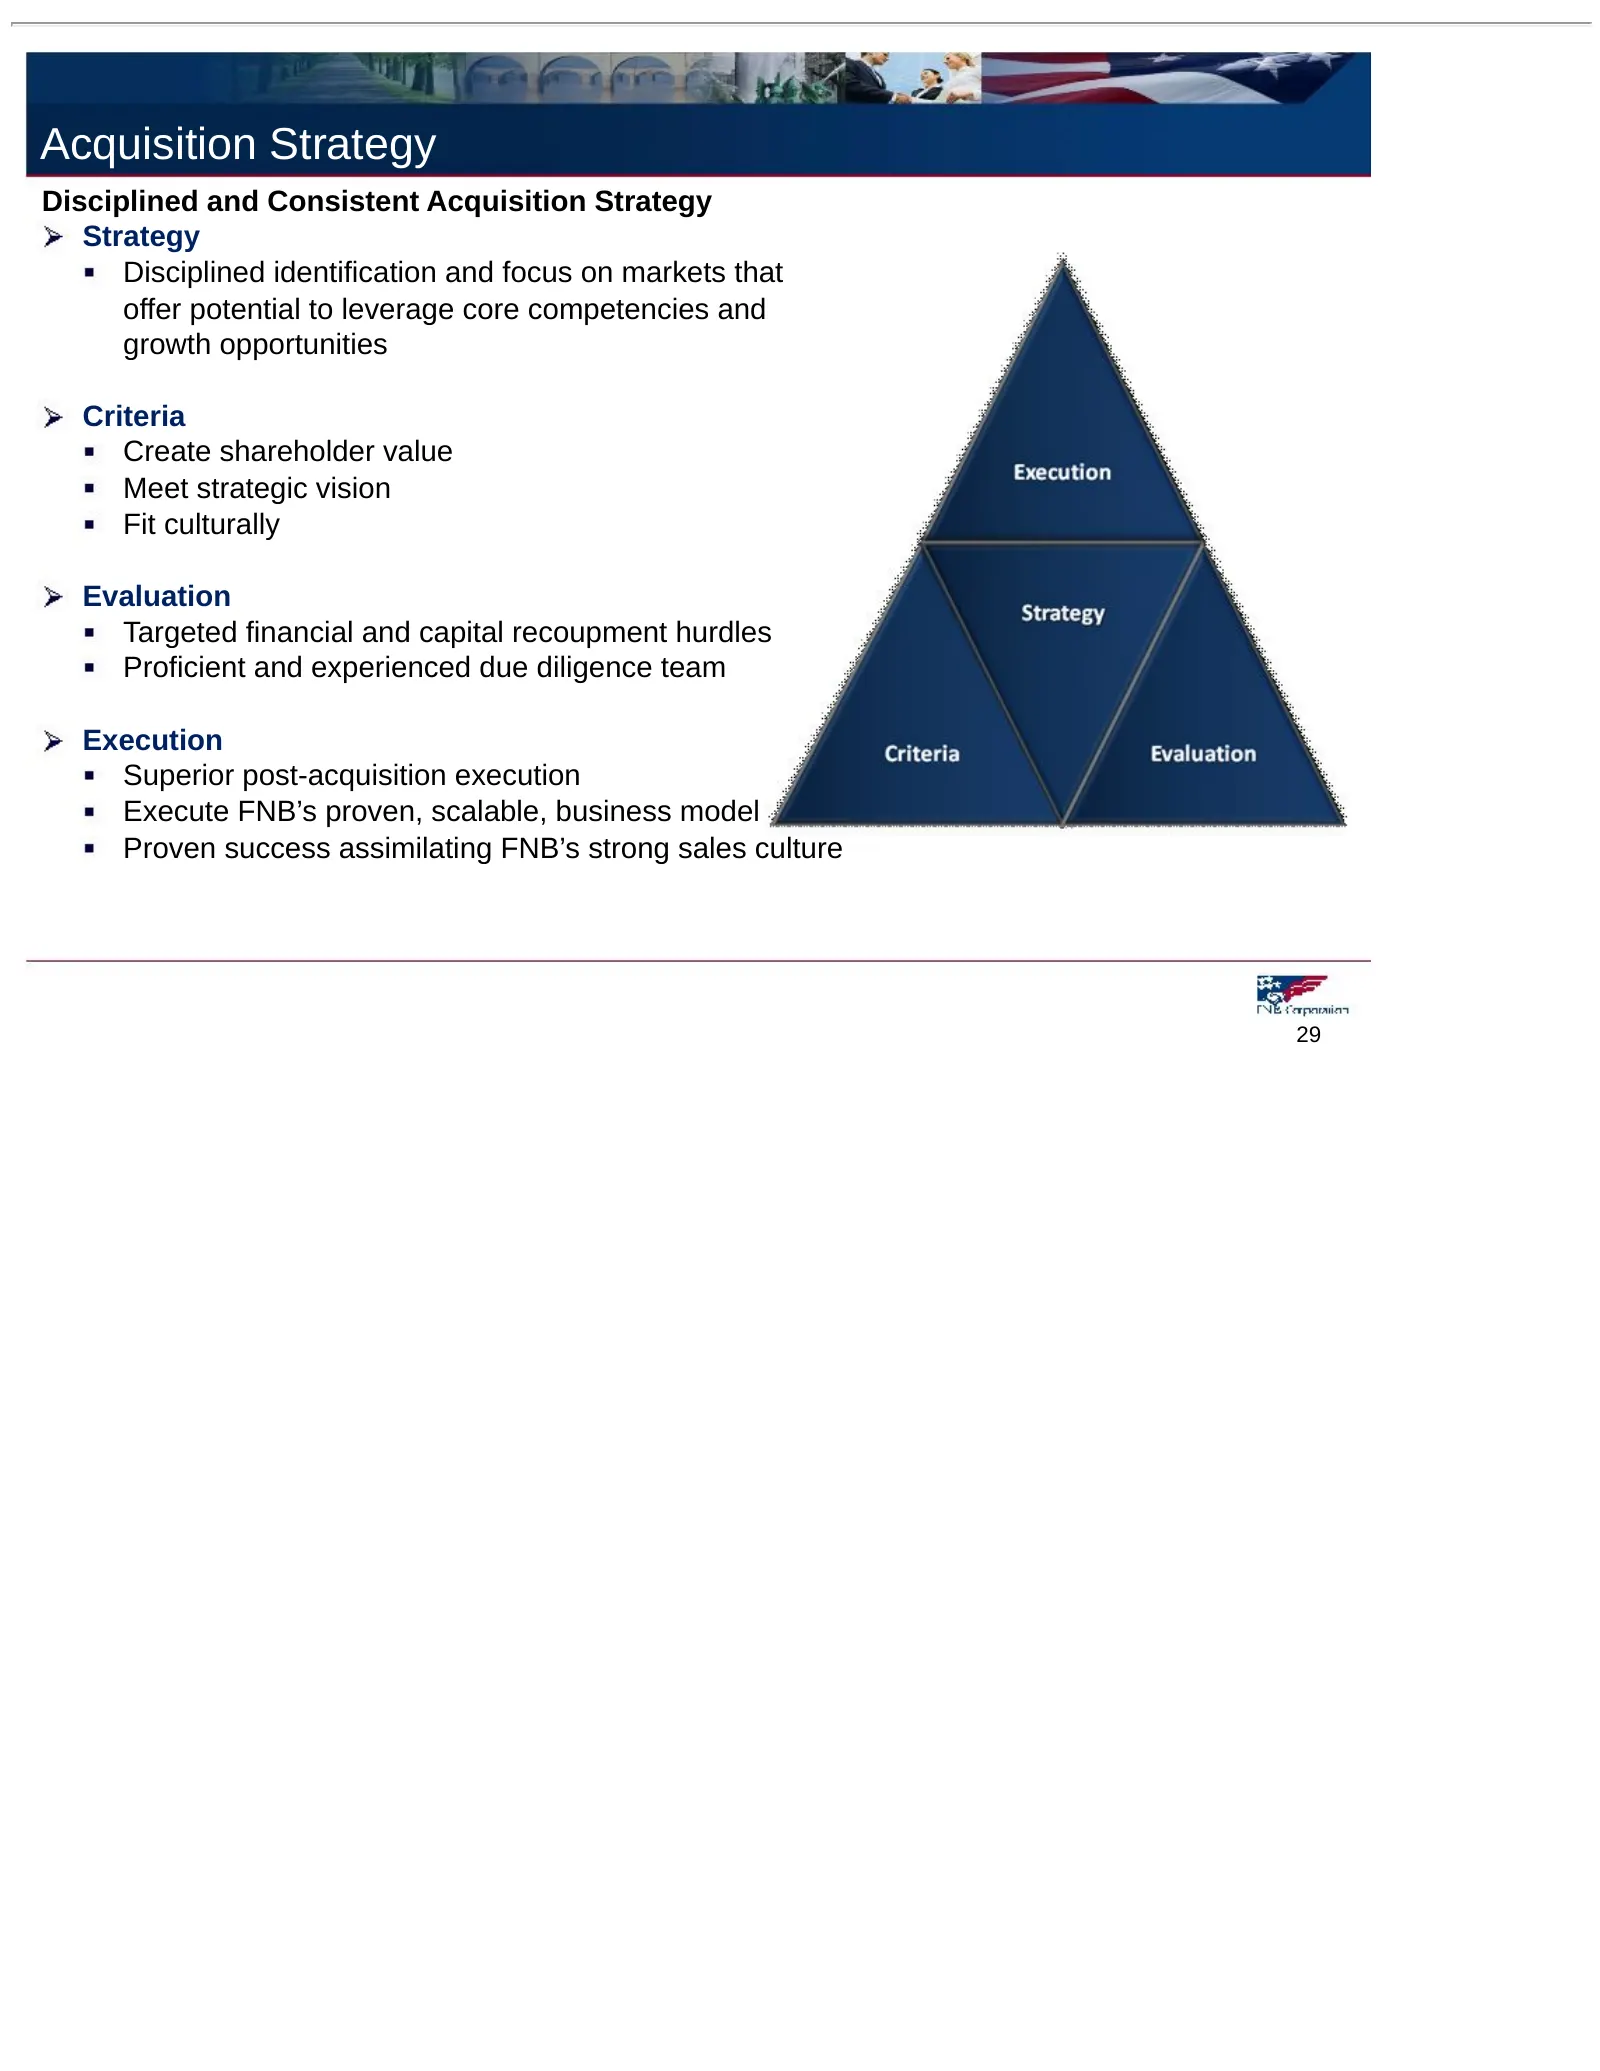
Acquisition Strategy Disciplined and Consistent Acquisition Strategy Strategy Disciplined identification and focus on markets that offer potential to leverage core competencies and growth opportunities Criteria Create shareholder value Meet strategic vision Fit culturally Evaluation Targeted financi
Slide 30: Acquisition-Related Expansion
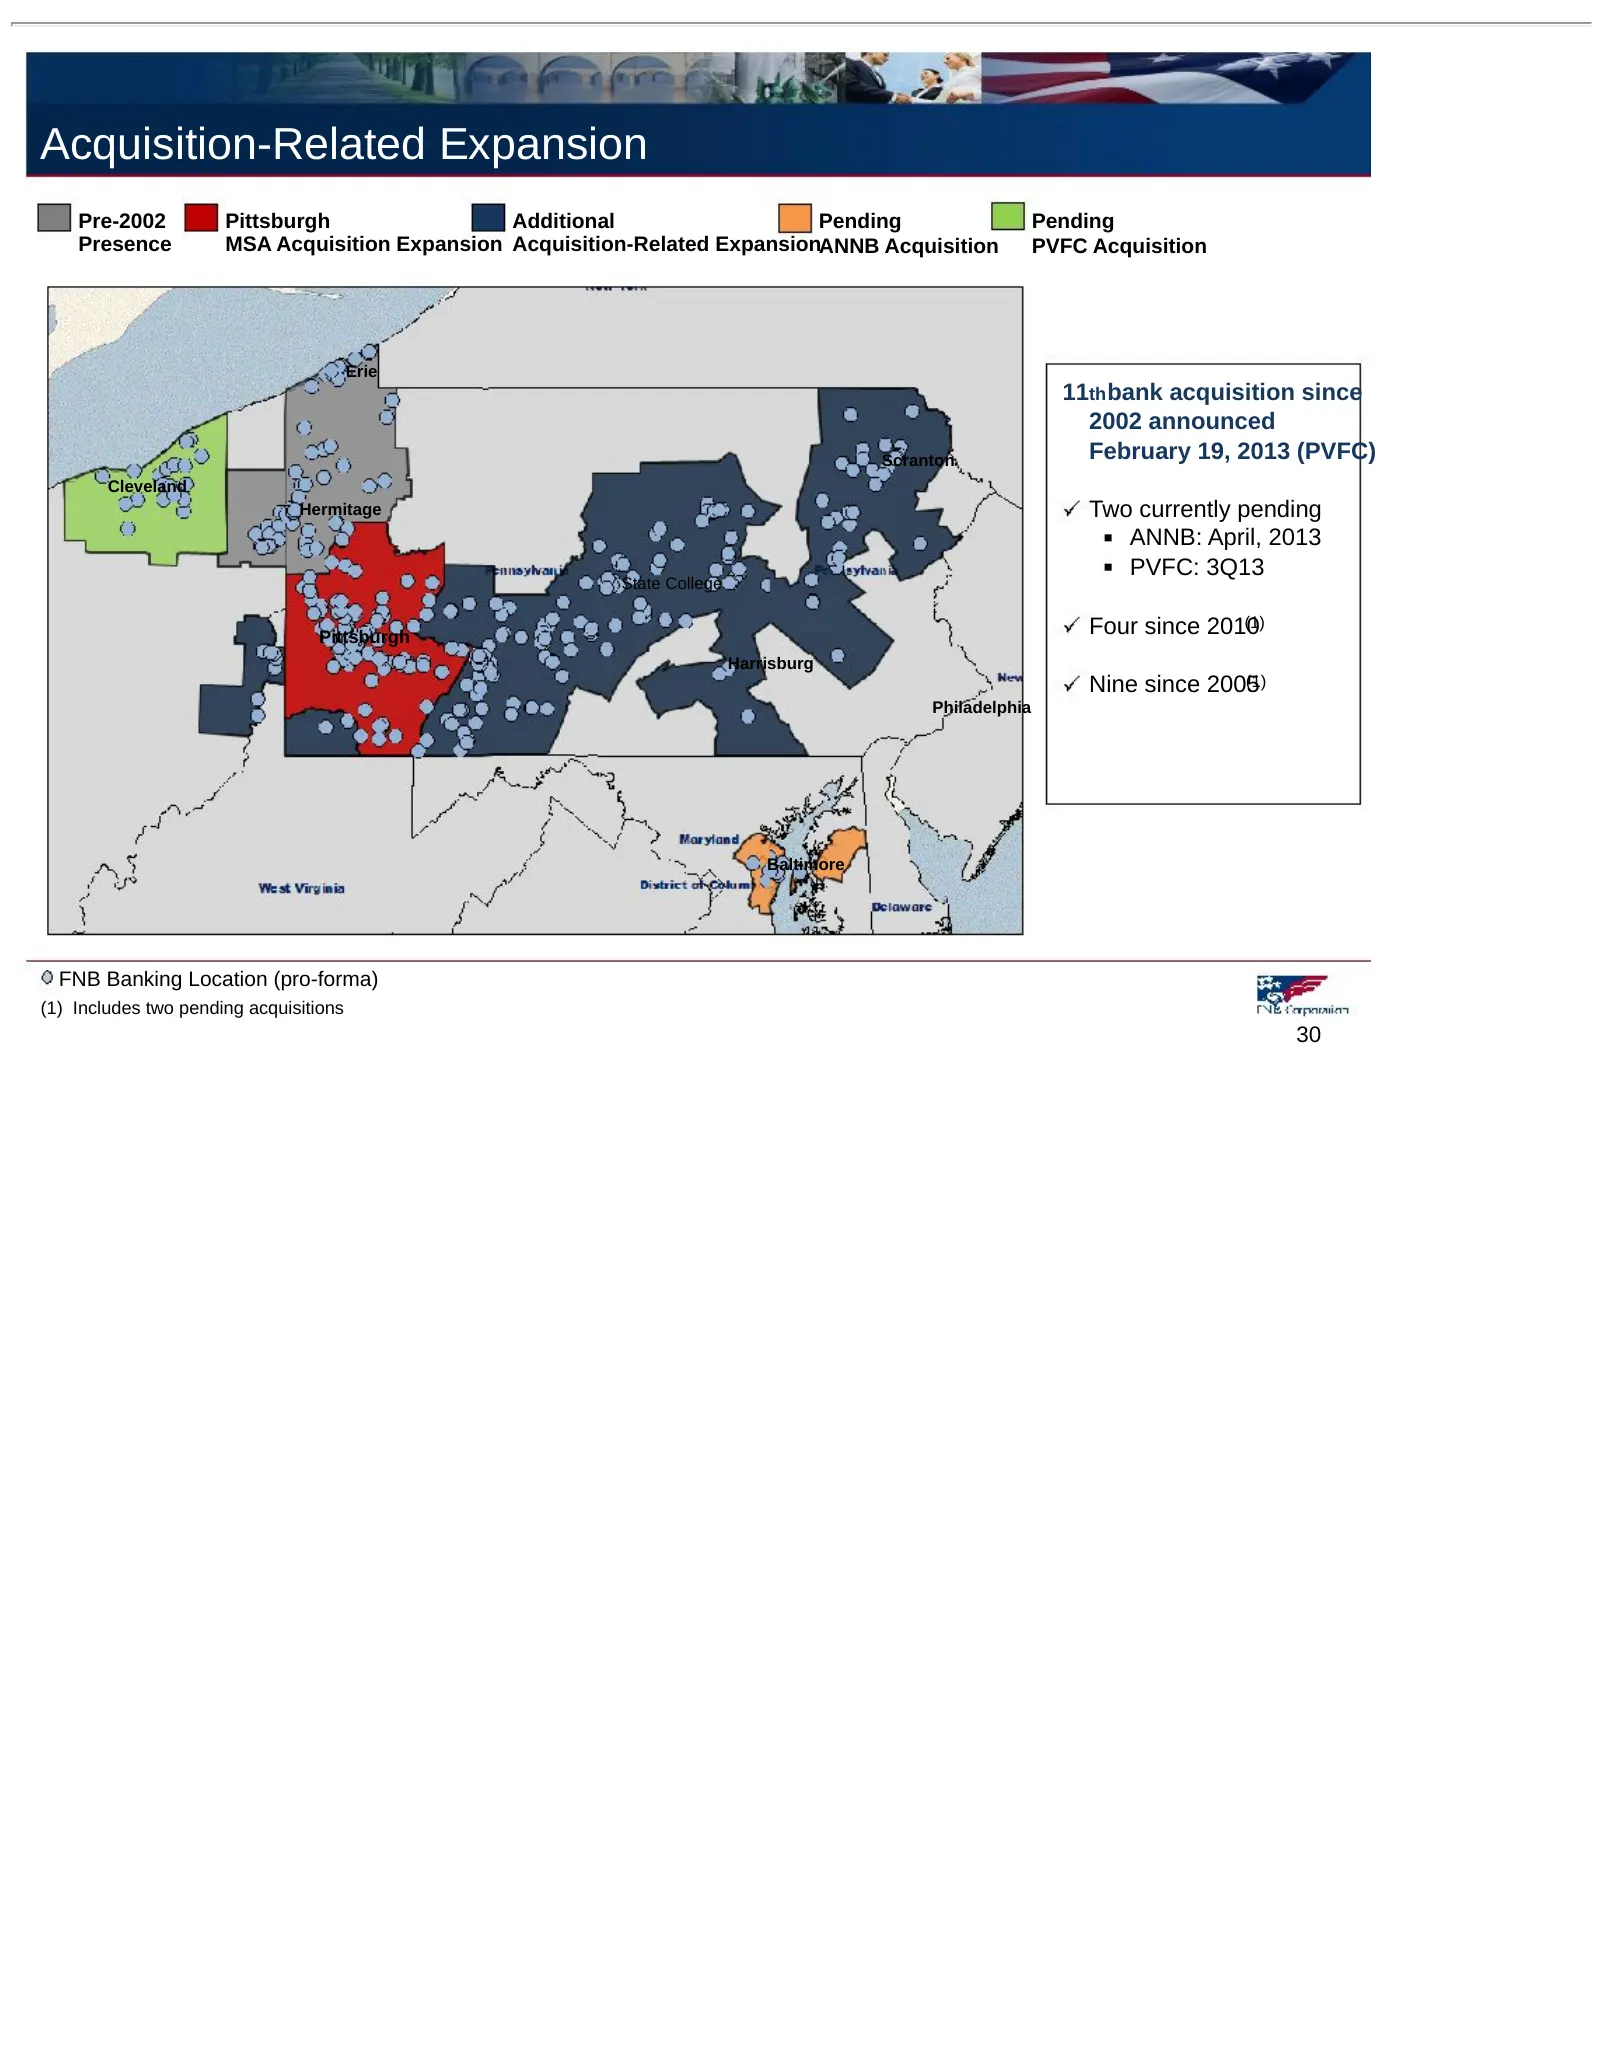
Acquisition-Related Expansion Pre-2002 Pittsburgh Additional Pending Pending Presence MSA Acquisition Expansion Acquisition-Related ExpansionANNB Acquisition PVFC Acquisition Erie 11th bank acquisition since 2002 announced Scranton February 19, 2013 (PVFC) Cleveland Hermitage Two currently pending A
Slide 31: Annapolis Bancorp, Inc. (ANNB) Opportunity Overview
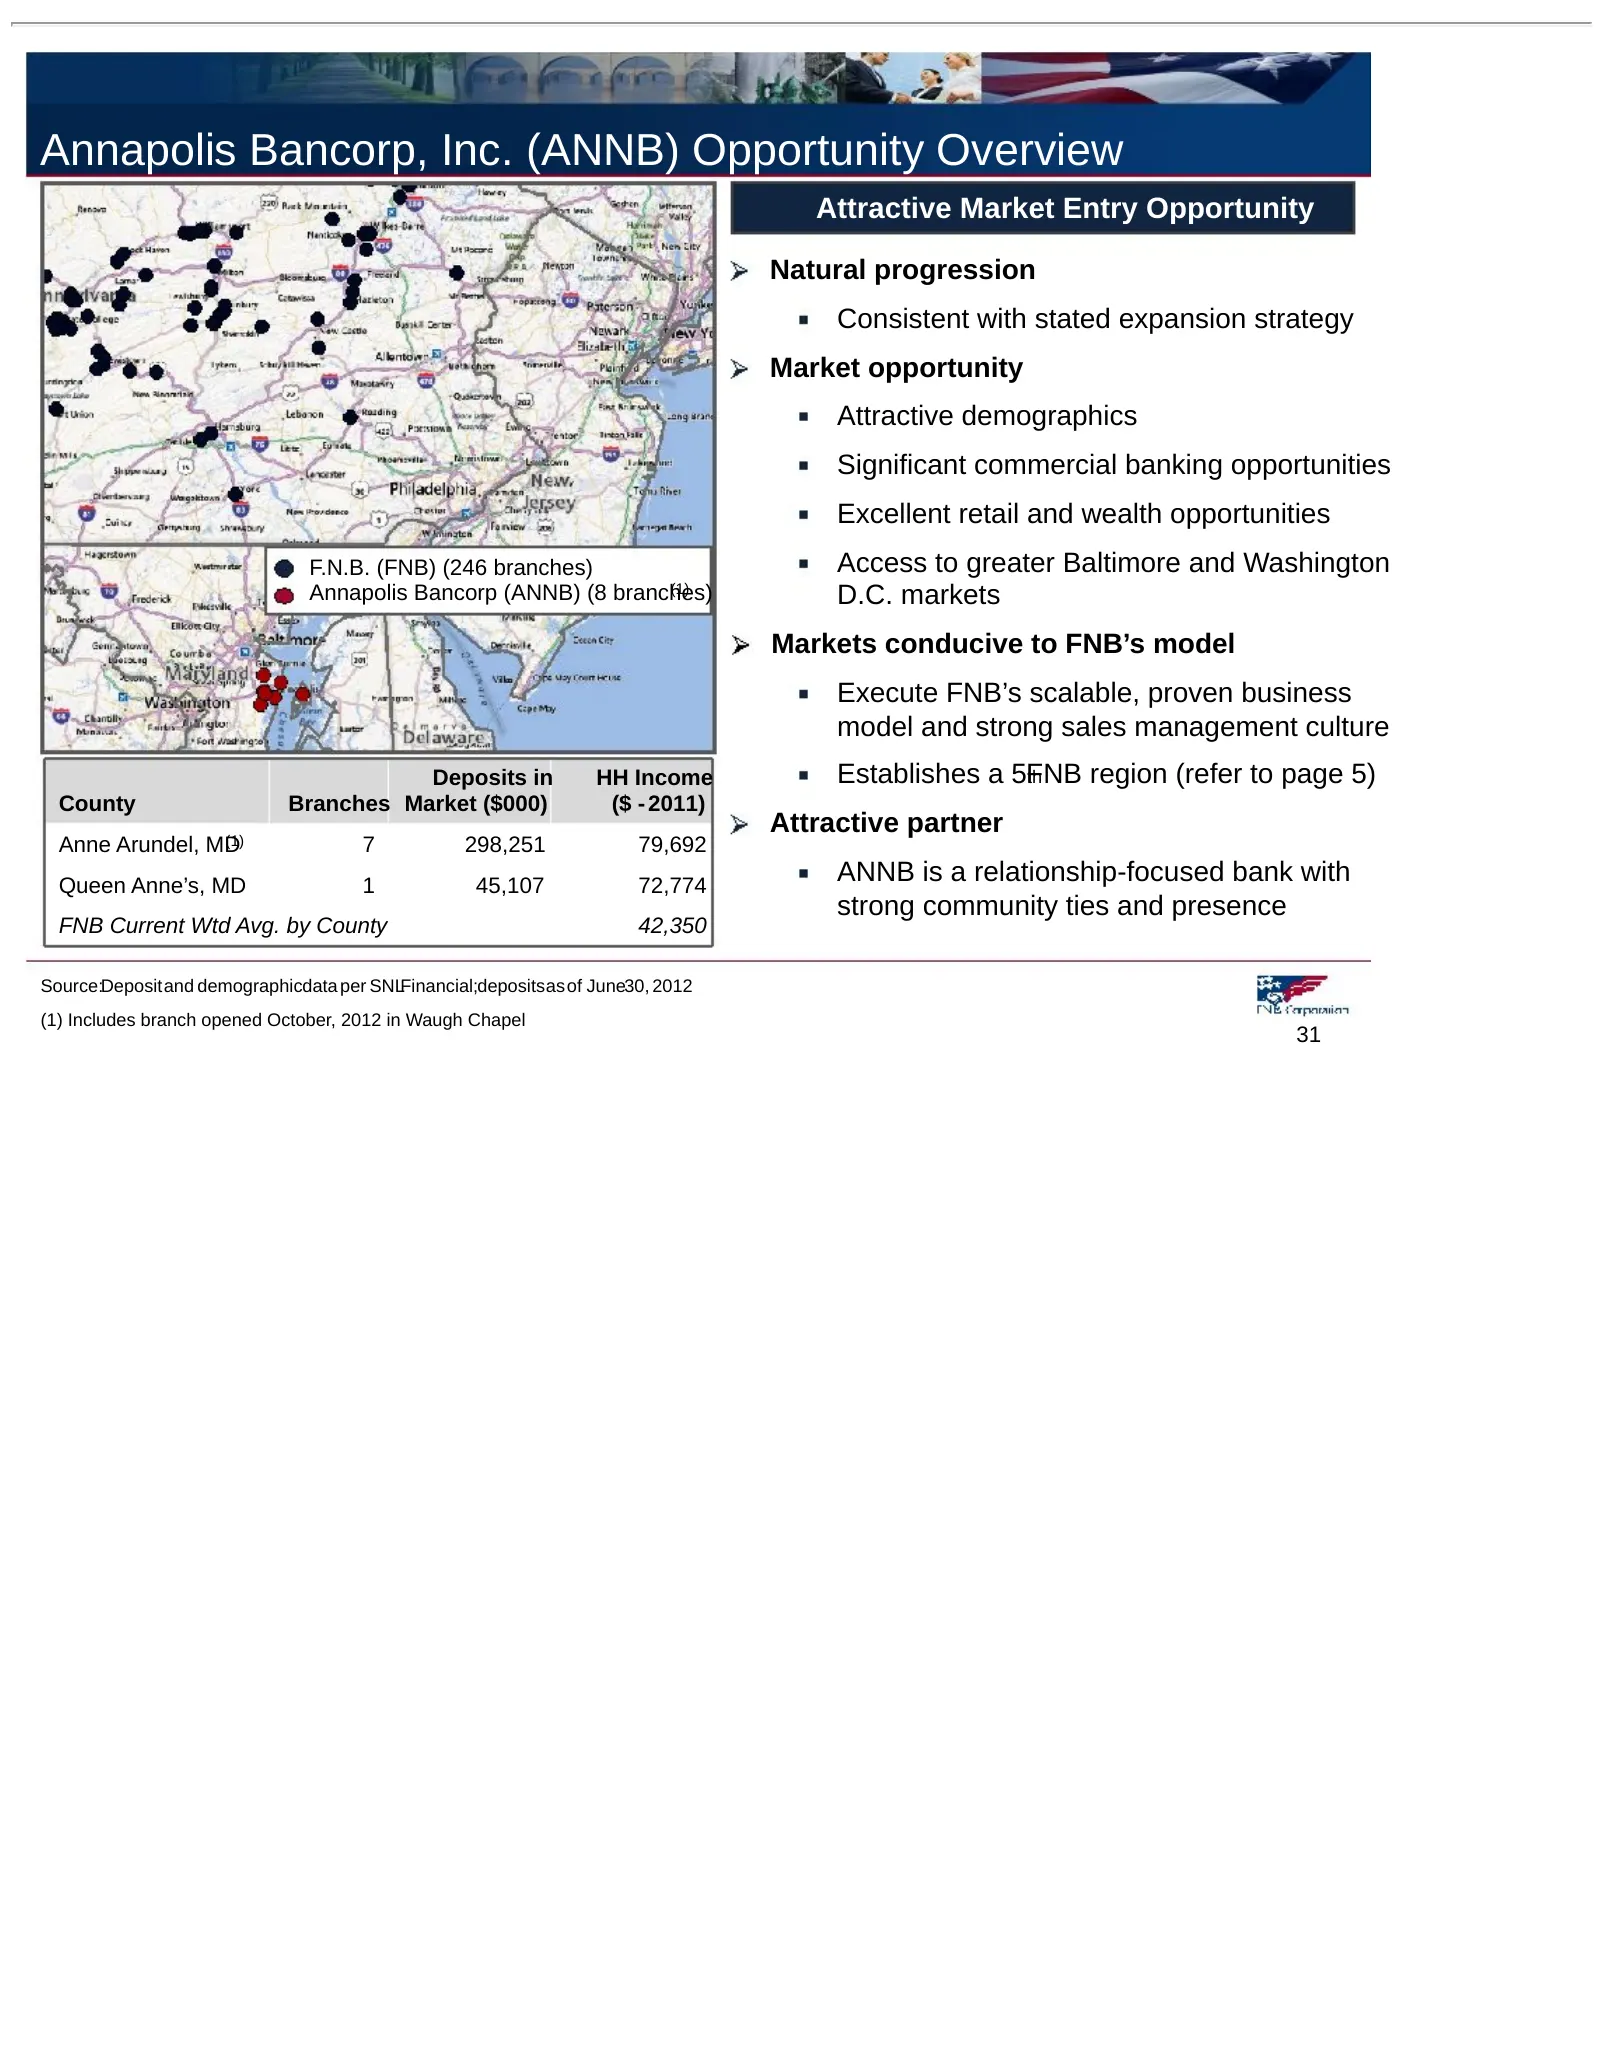
Annapolis Bancorp, Inc. (ANNB) Opportunity Overview Attractive Market Entry Opportunity Natural progression Consistent with stated expansion strategy Market opportunity Attractive demographics Significant commercial banking opportunities Excellent retail and wealth opportunities F.N.B. (FNB) (246 br
Slide 32: Annapolis Bancorp, Inc. (ANNB) Market Opportunity
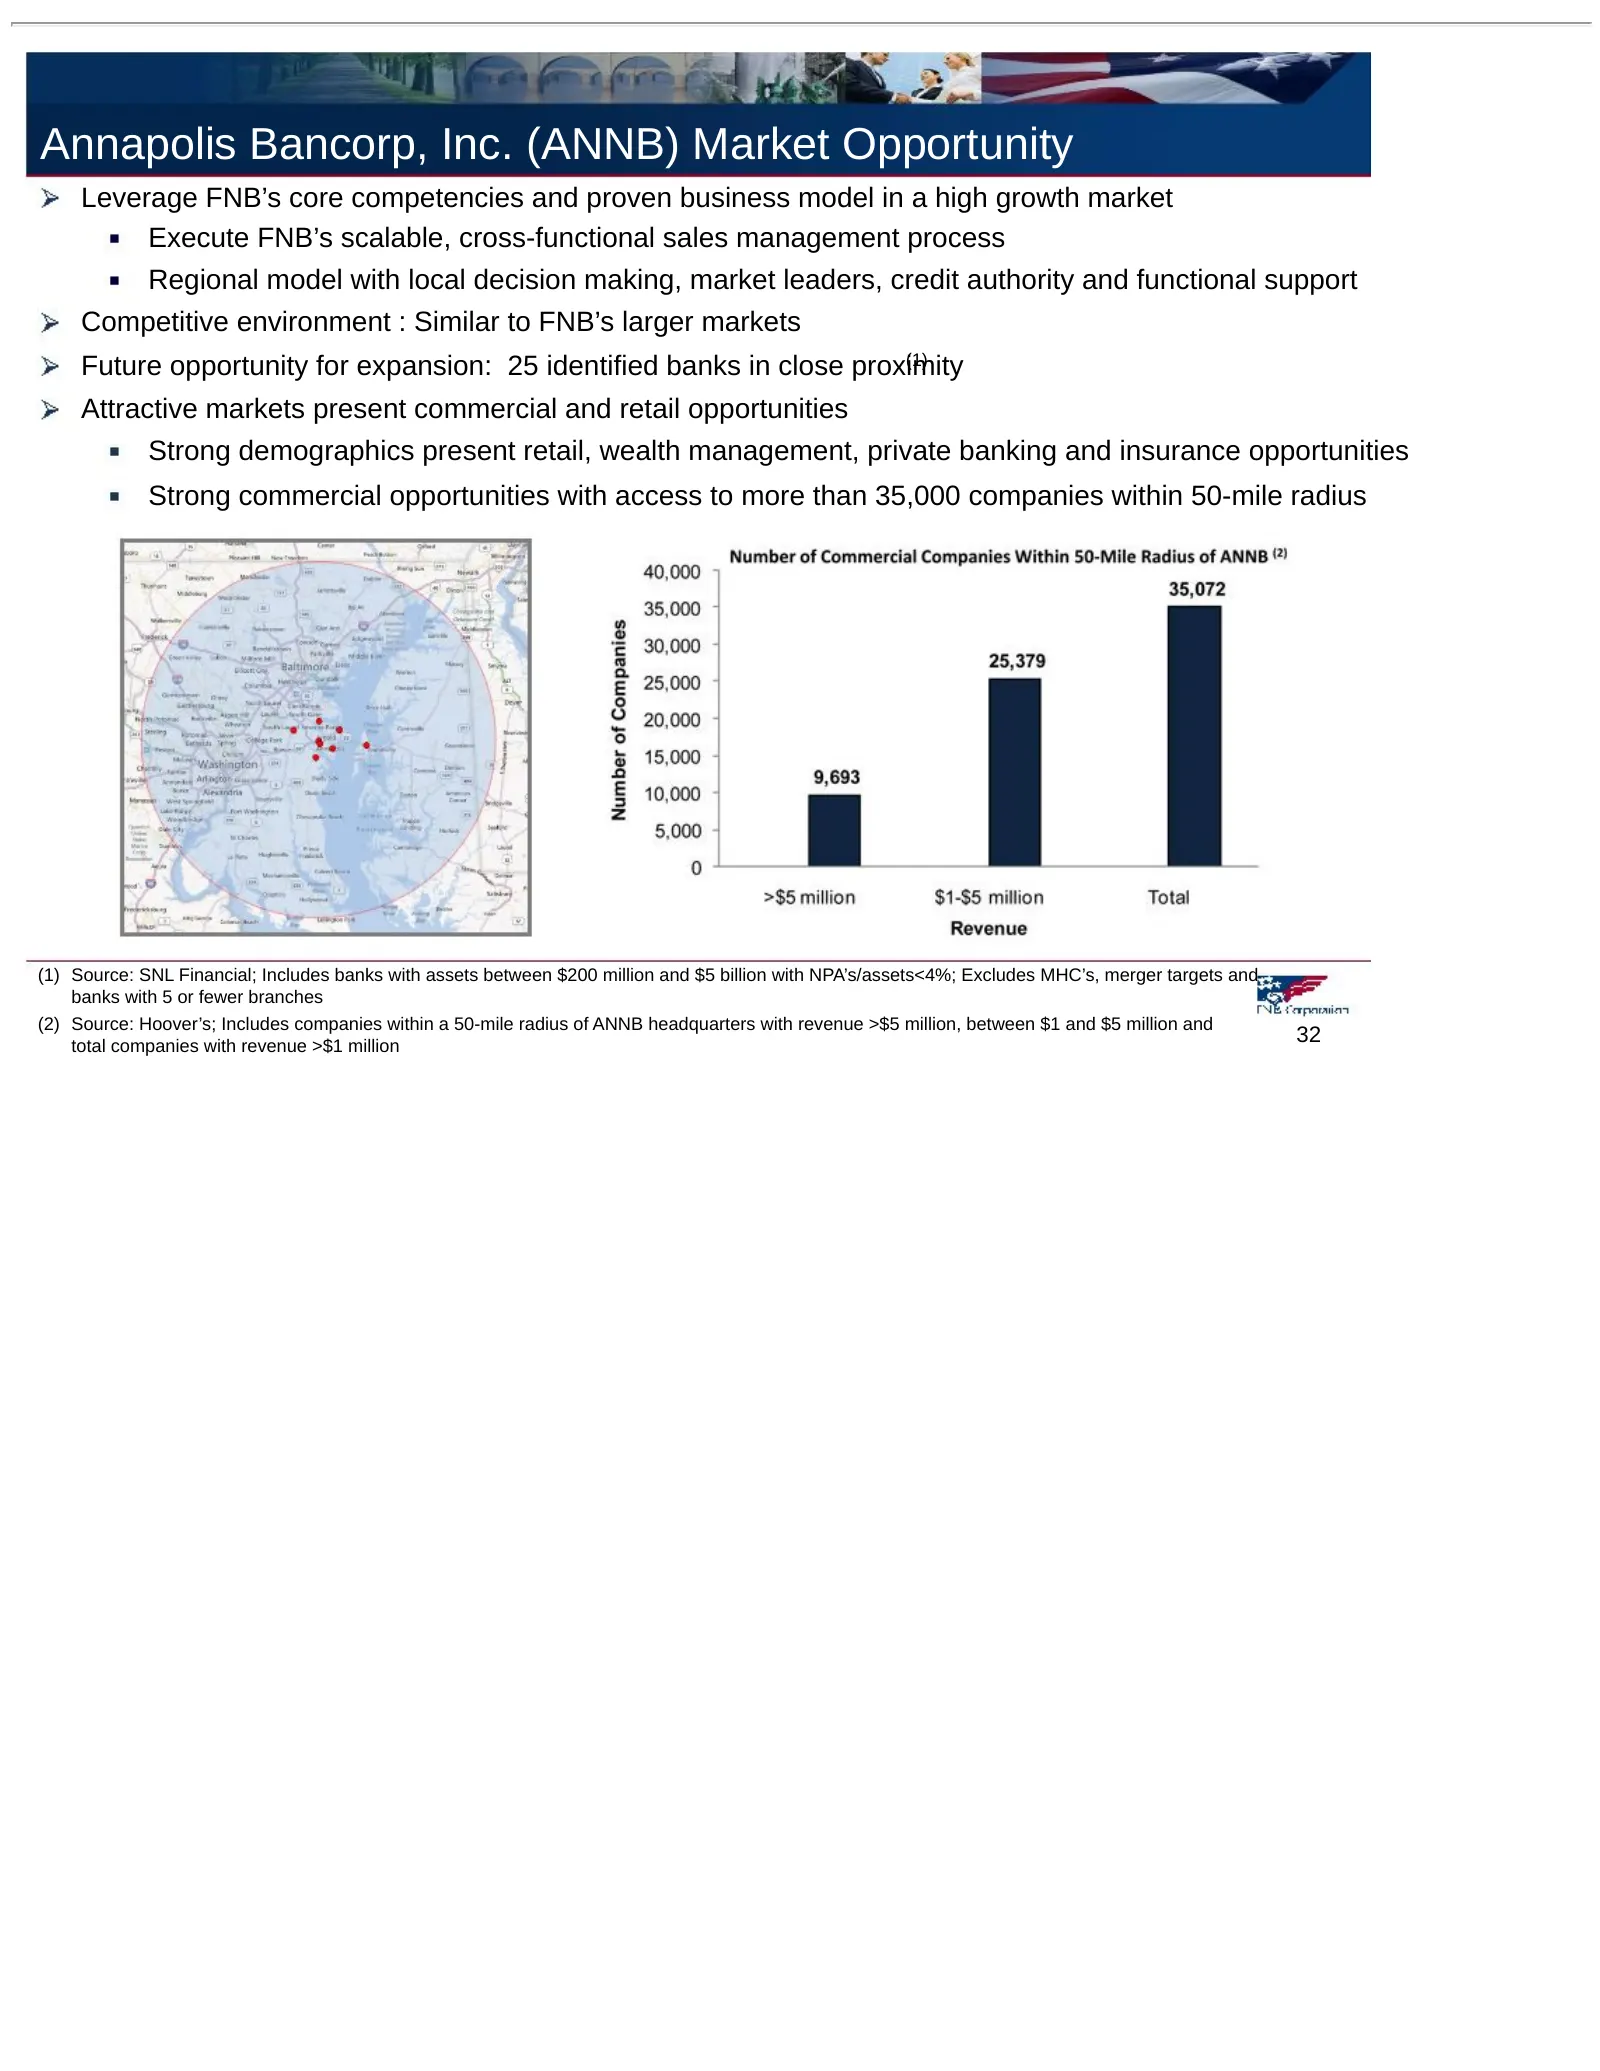
Annapolis Bancorp, Inc. (ANNB) Market Opportunity Leverage FNB’s core competencies and proven business model in a high growth market Execute FNB’s scalable, cross-functional sales management process Regional model with local decision making, market leaders, credit authority and functional support Co
Slide 33: Parkview Financial Corp. (PVFC) Pro Forma Franchise
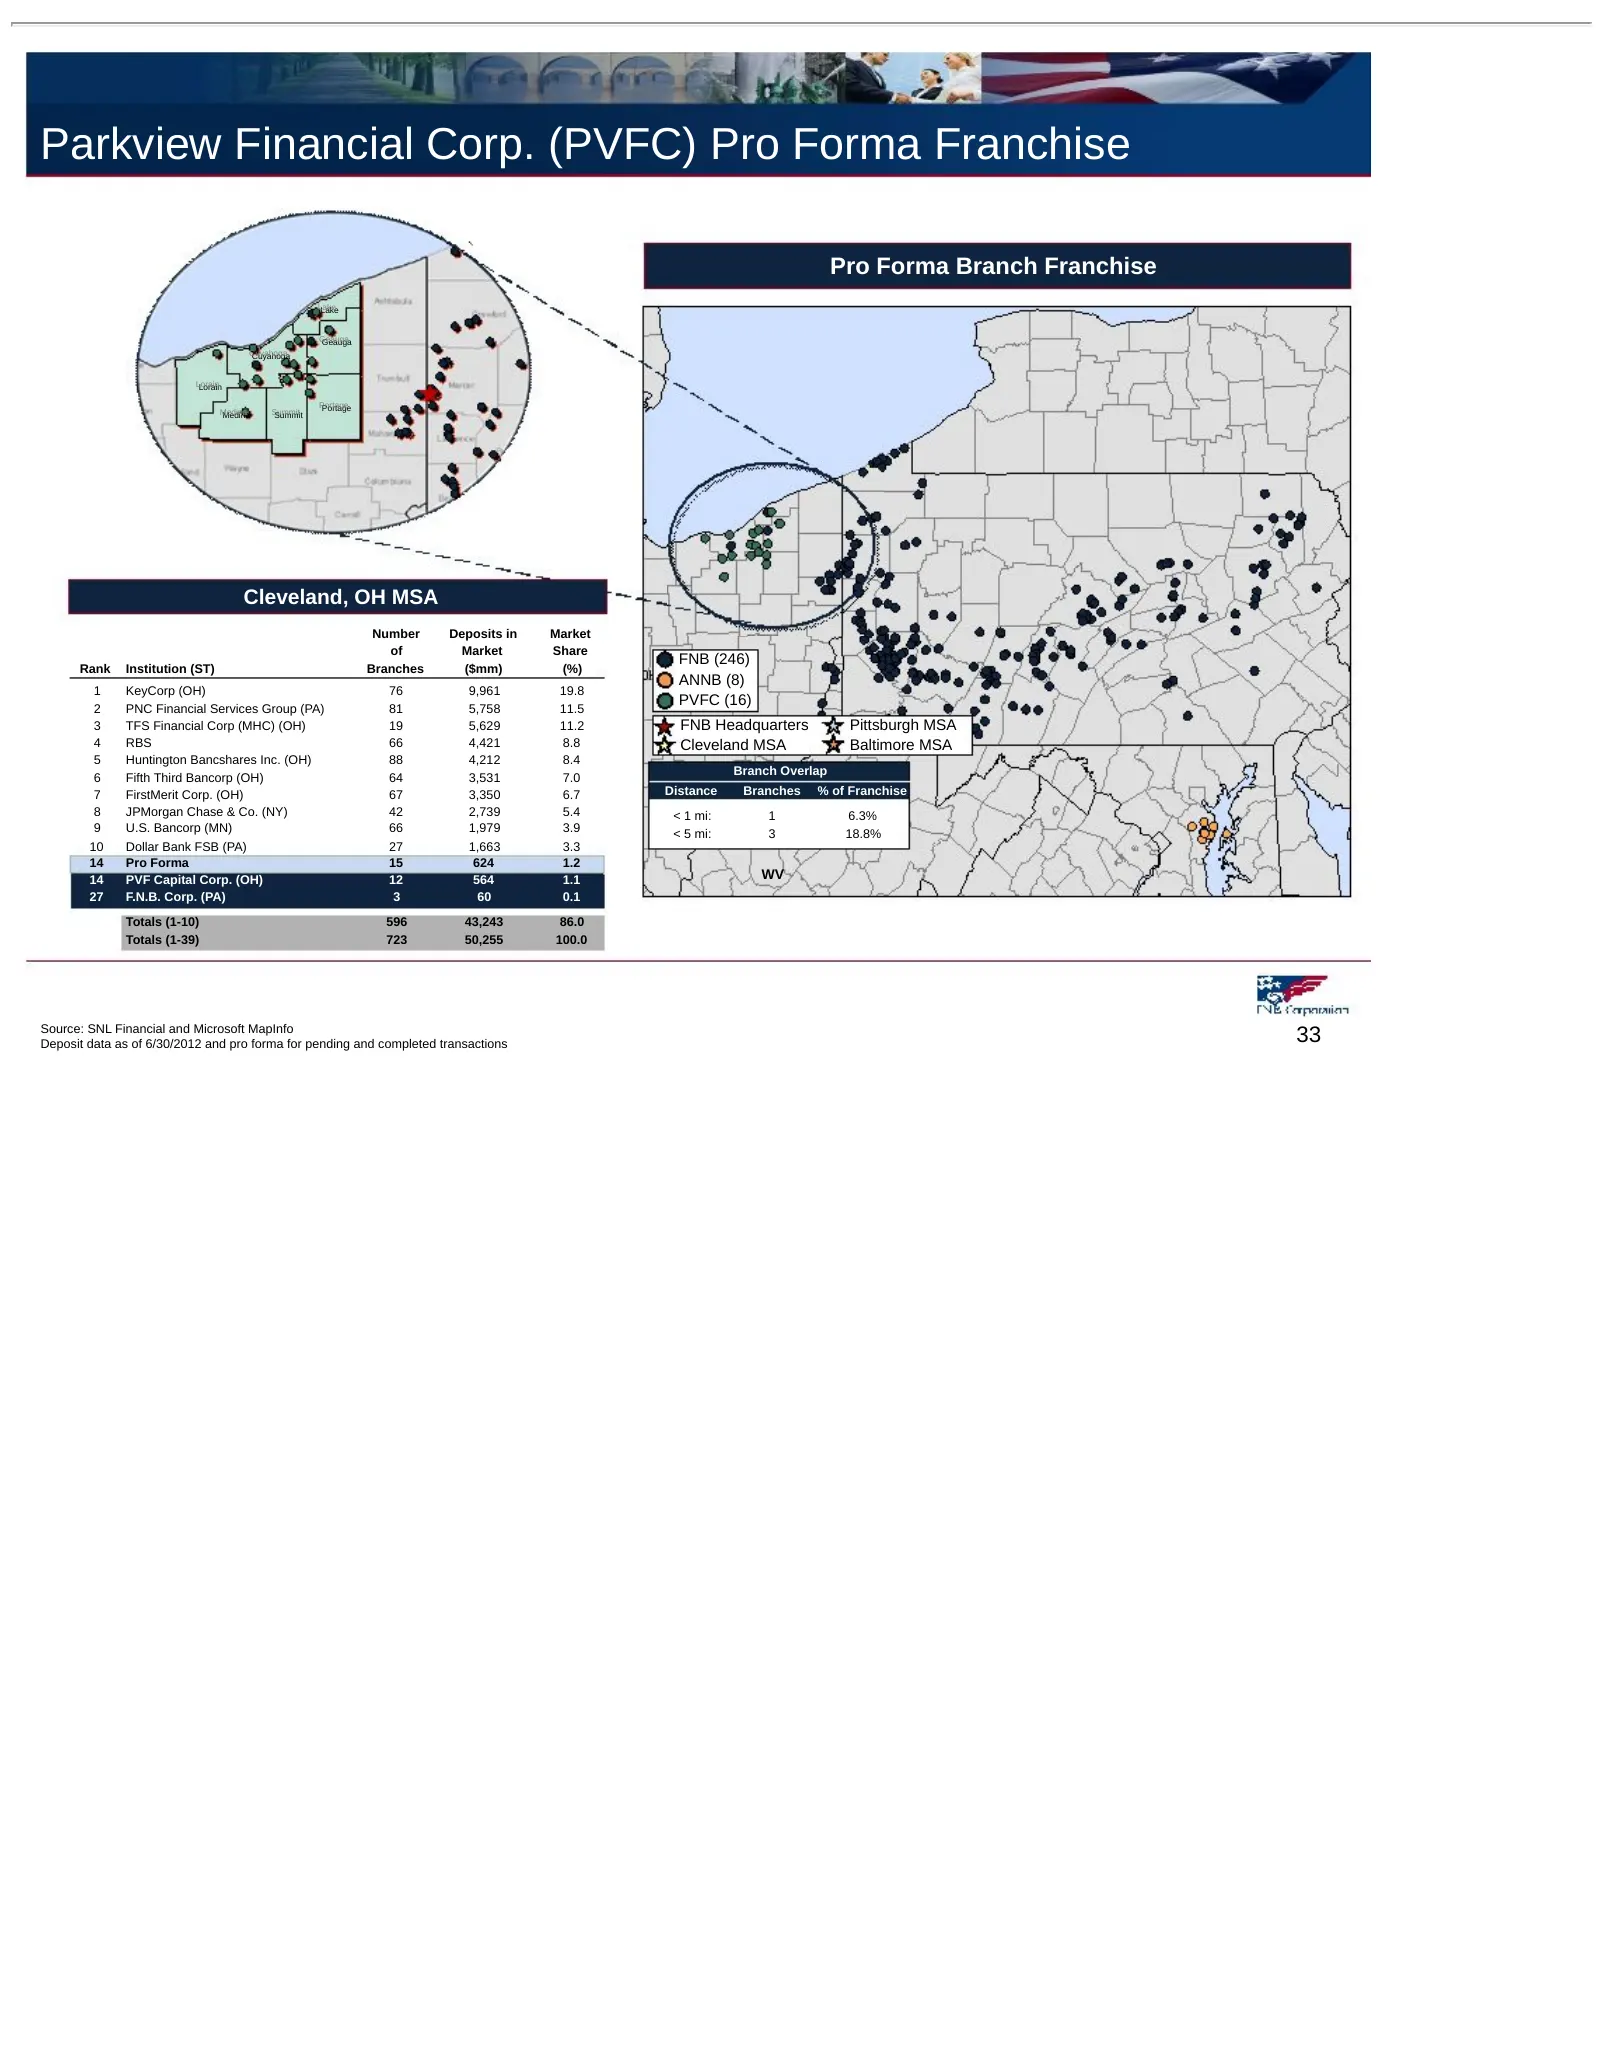
Parkview Financial Corp. (PVFC) Pro Forma Franchise Pro Forma Branch Franchise Lake Lake Geauga Geauga Cuyahoga Cuyahoga Lorain Lorain Portage Portage Medina Medina Summit Summit Cleveland, OH MSA Number Deposits in Market of Market Share FNB (246) Rank Institution (ST) Branches ($mm) (%) ANNB (8) 1
Slide 34: Parkview Financial Corp. (PVFC) Market Opportunity
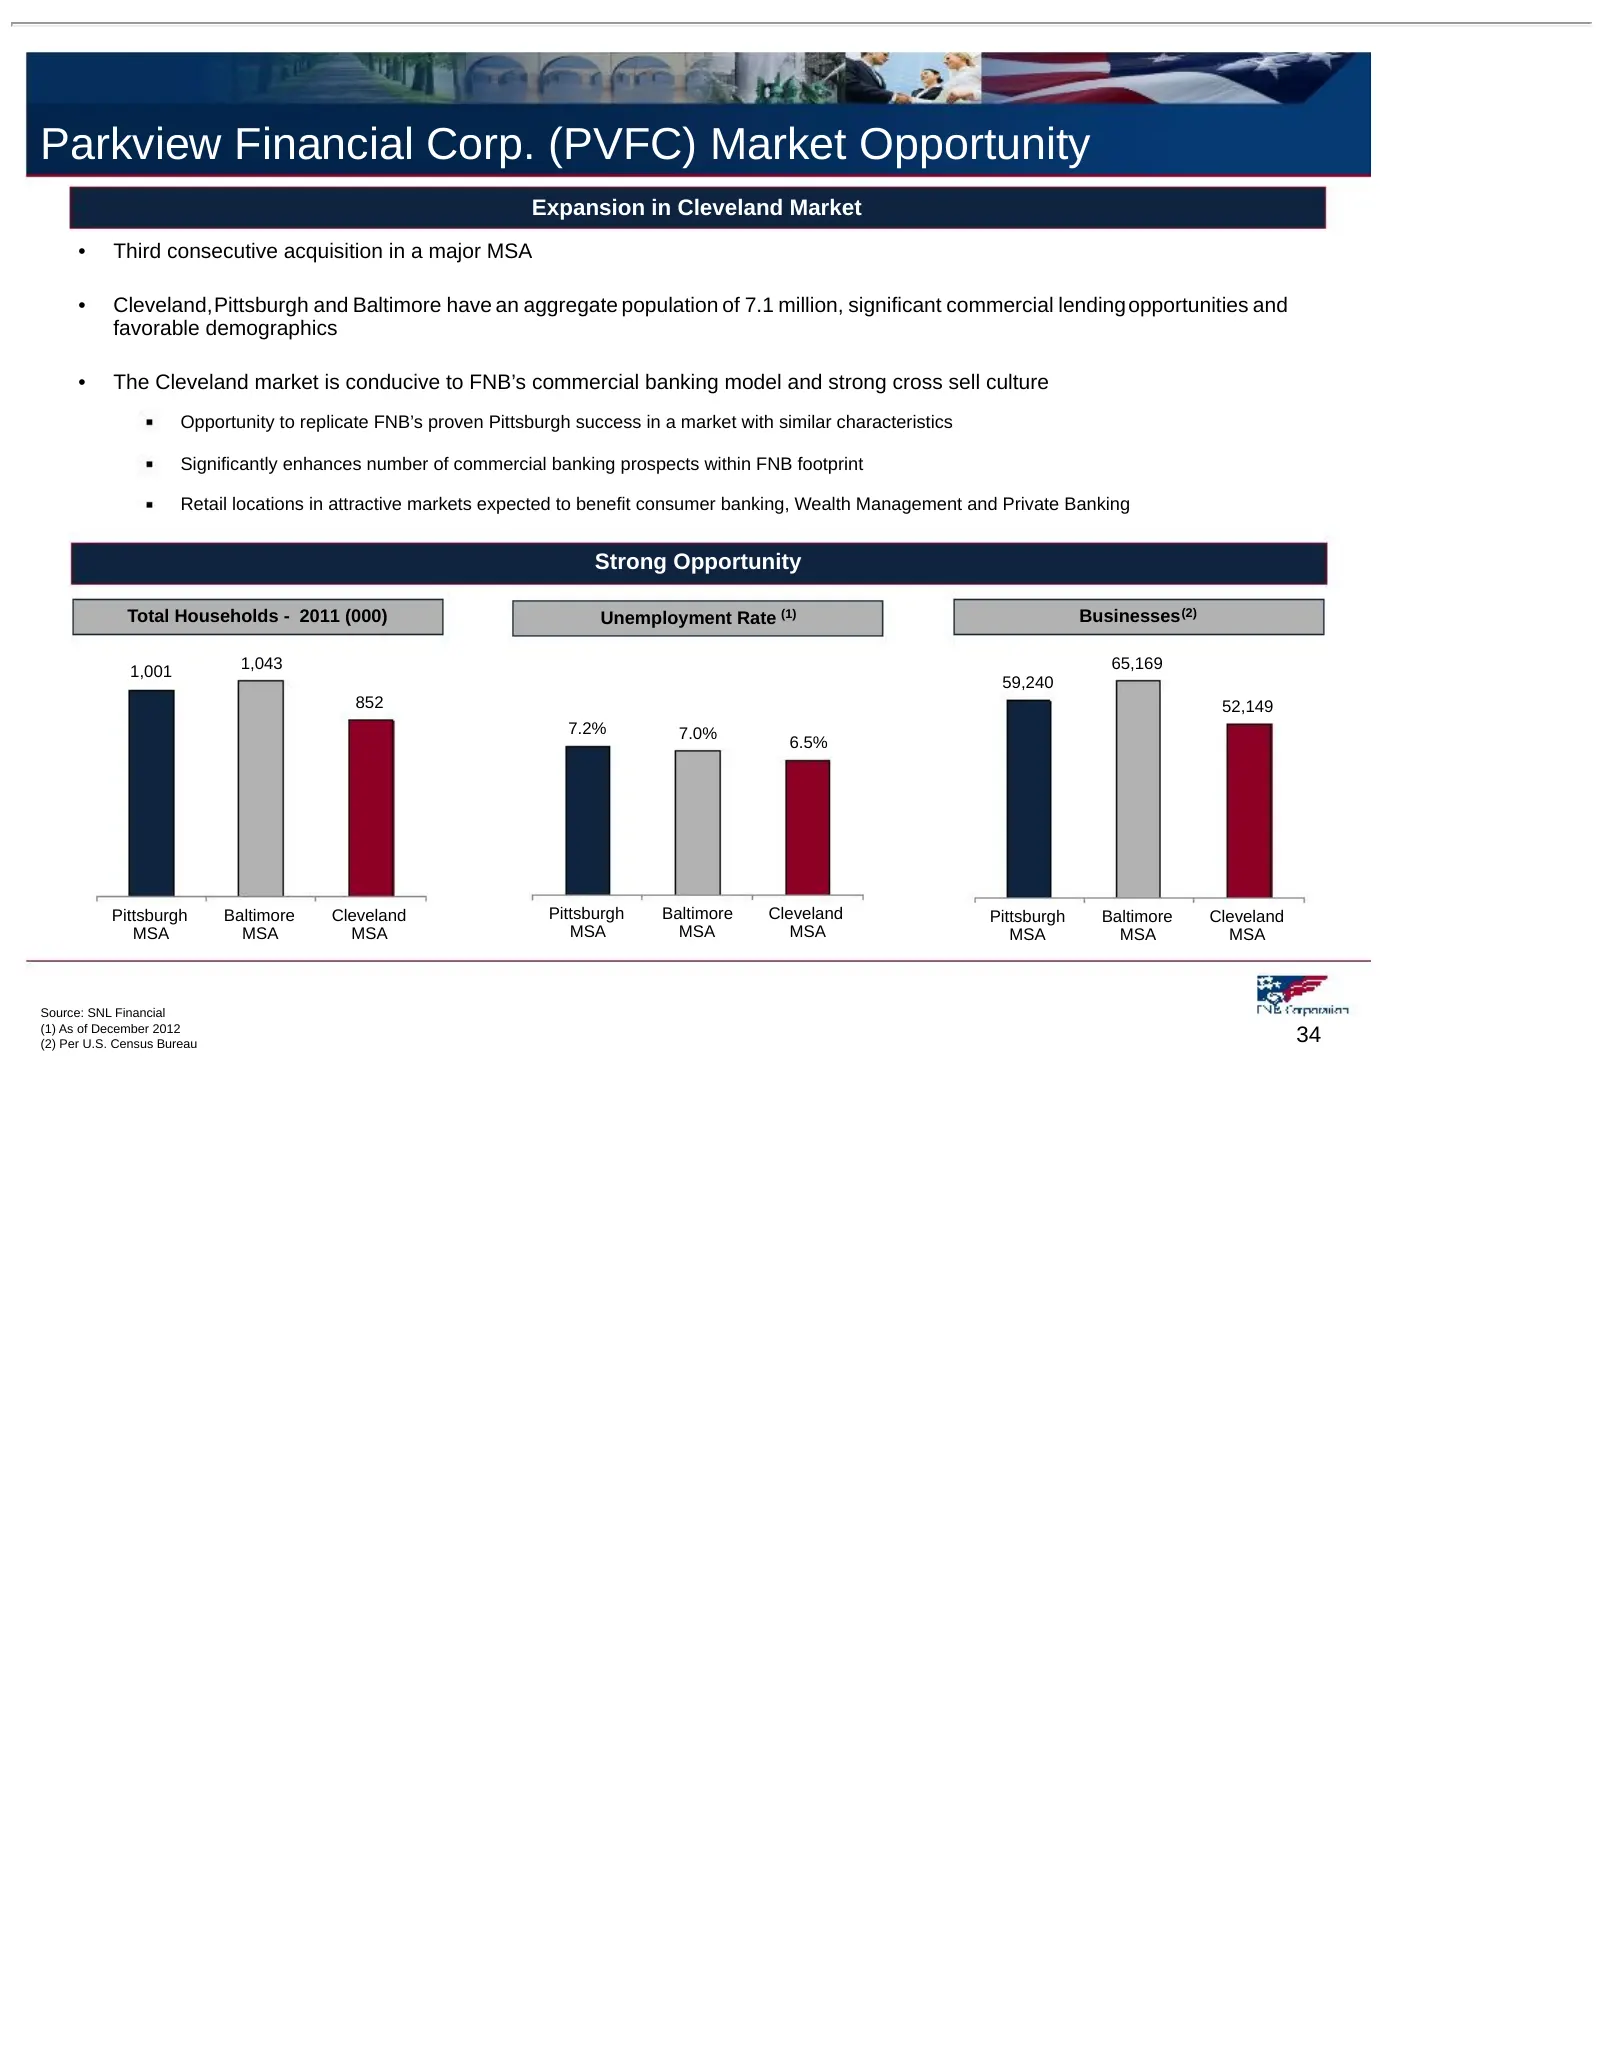
Parkview Financial Corp. (PVFC) Market Opportunity Expansion in Cleveland Market • Third consecutive acquisition in a major MSA • Cleveland,Pittsburgh and Baltimore have an aggregate population of 7.1 million, significant commercial lending opportunities and favorable demographics • The Cleveland ma

Slide 35: Investment Thesis
Investment Thesis 35
Slide 36: Long-Term Investment Thesis
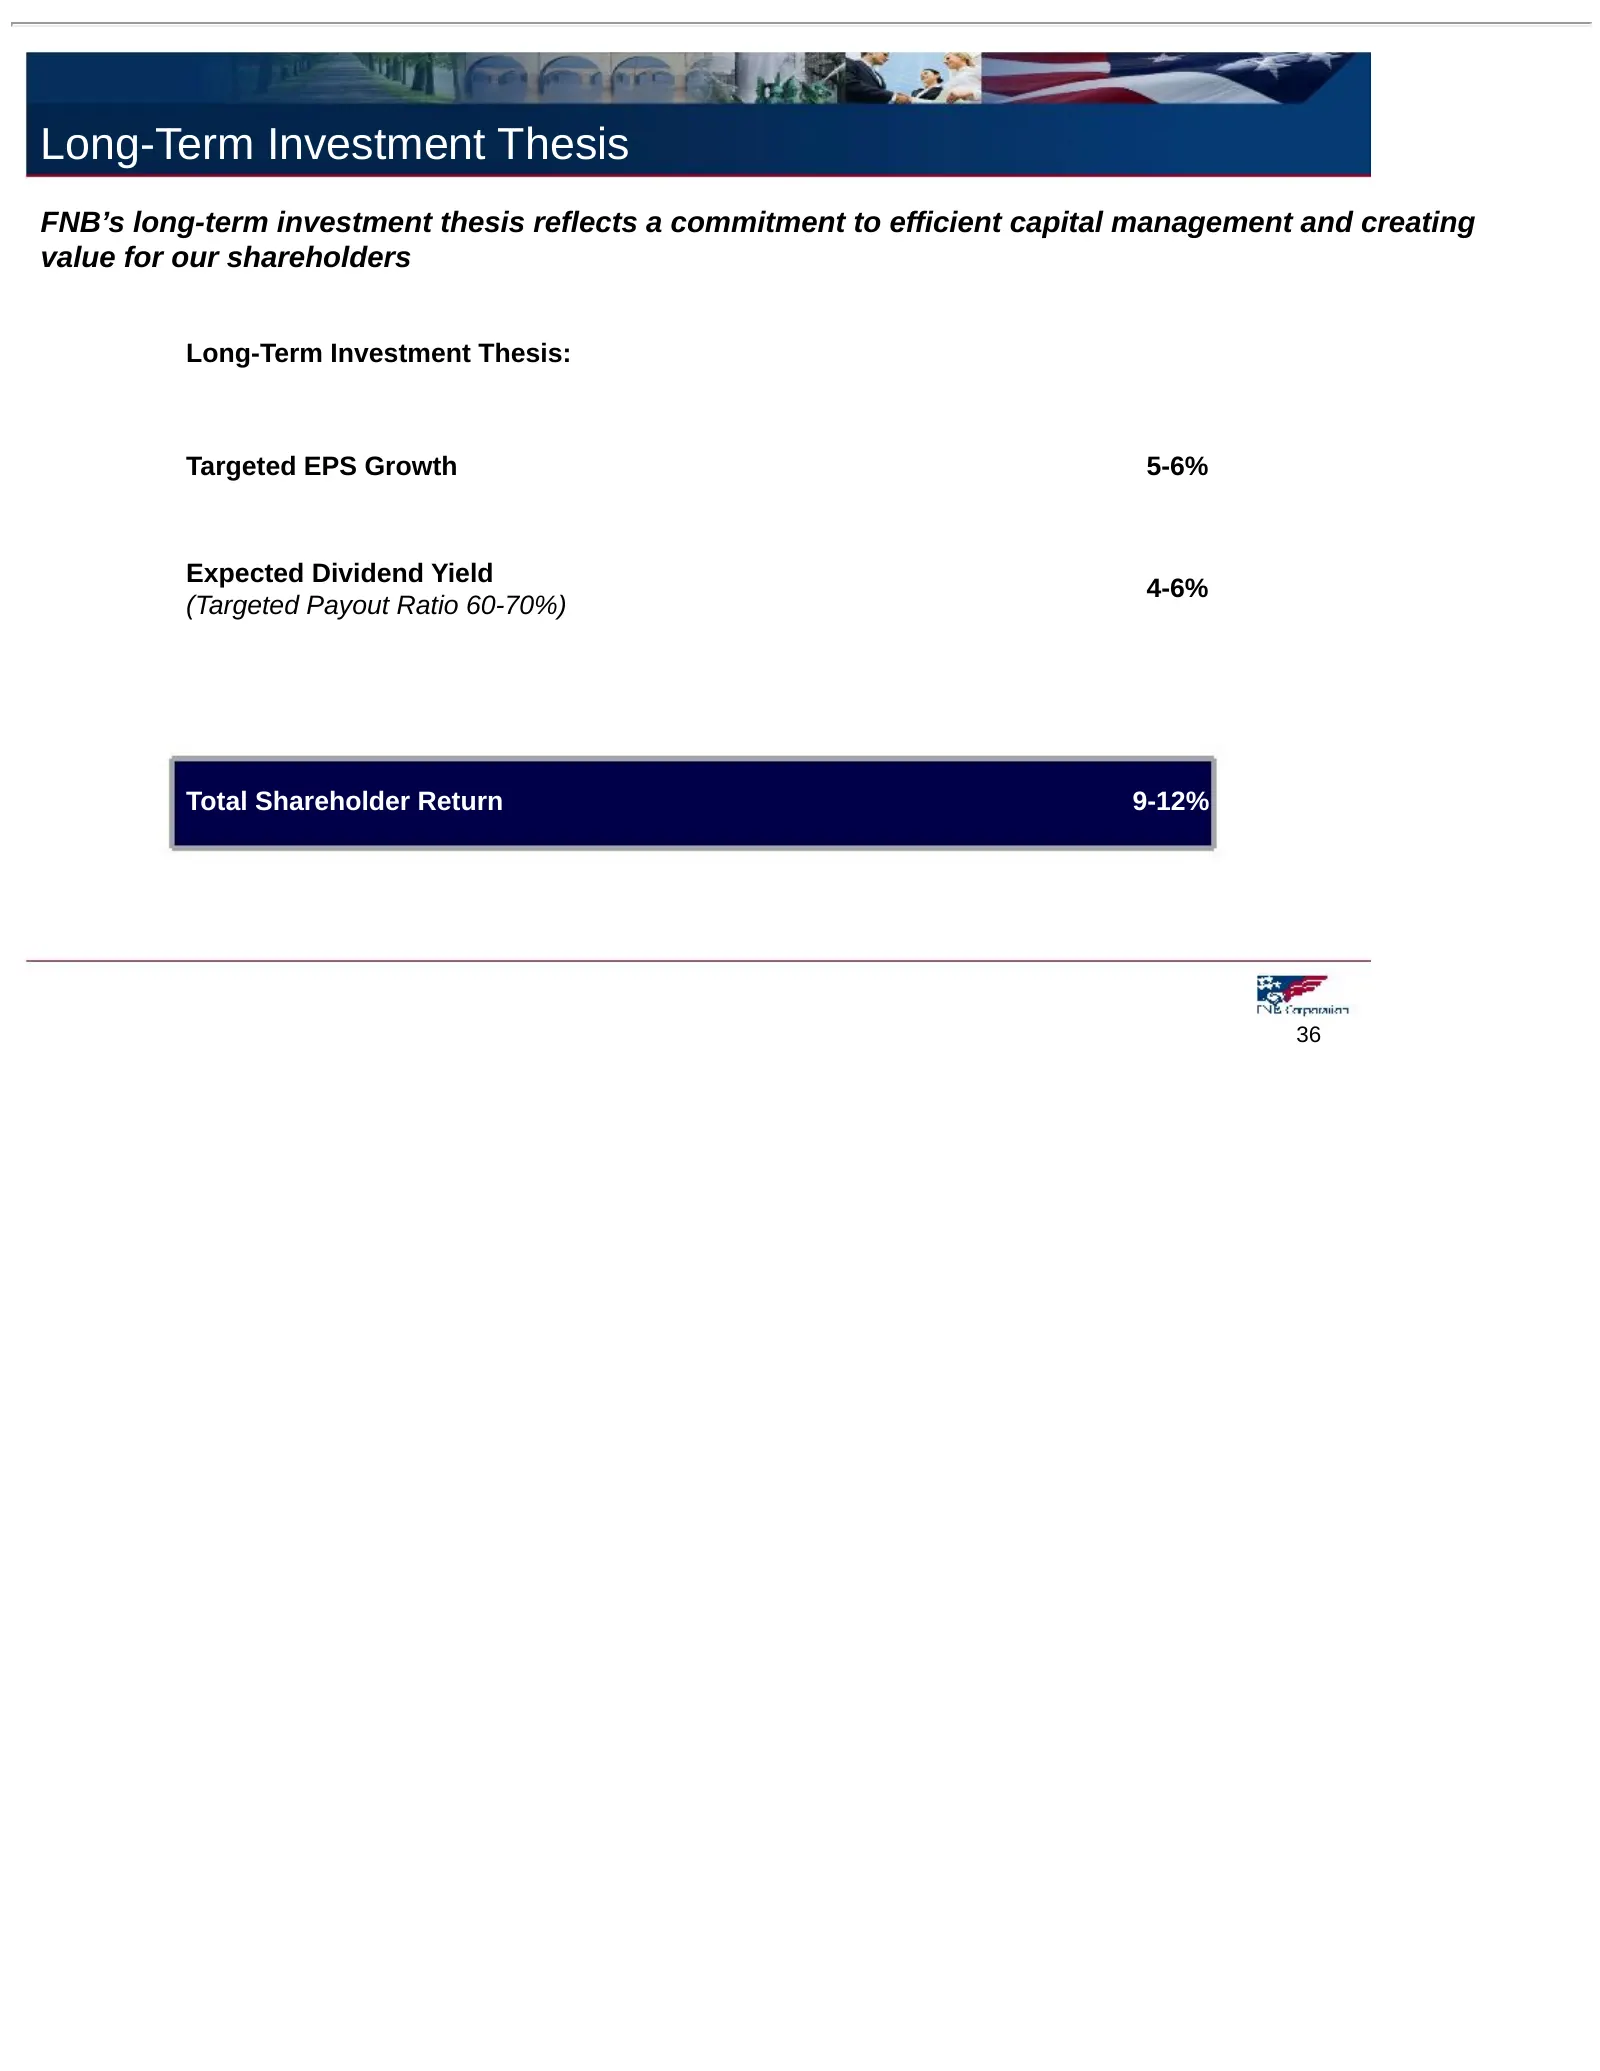
Long-Term Investment Thesis FNB’s long-term investment thesis reflects a commitment to efficient capital management and creating value for our shareholders Long-Term Investment Thesis: Targeted EPS Growth 5-6% Expected Dividend Yield 4-6% (Targeted Payout Ratio 60-70%) Total Shareholder Return 9-12%
Slide 37: Relative Valuation Multiples
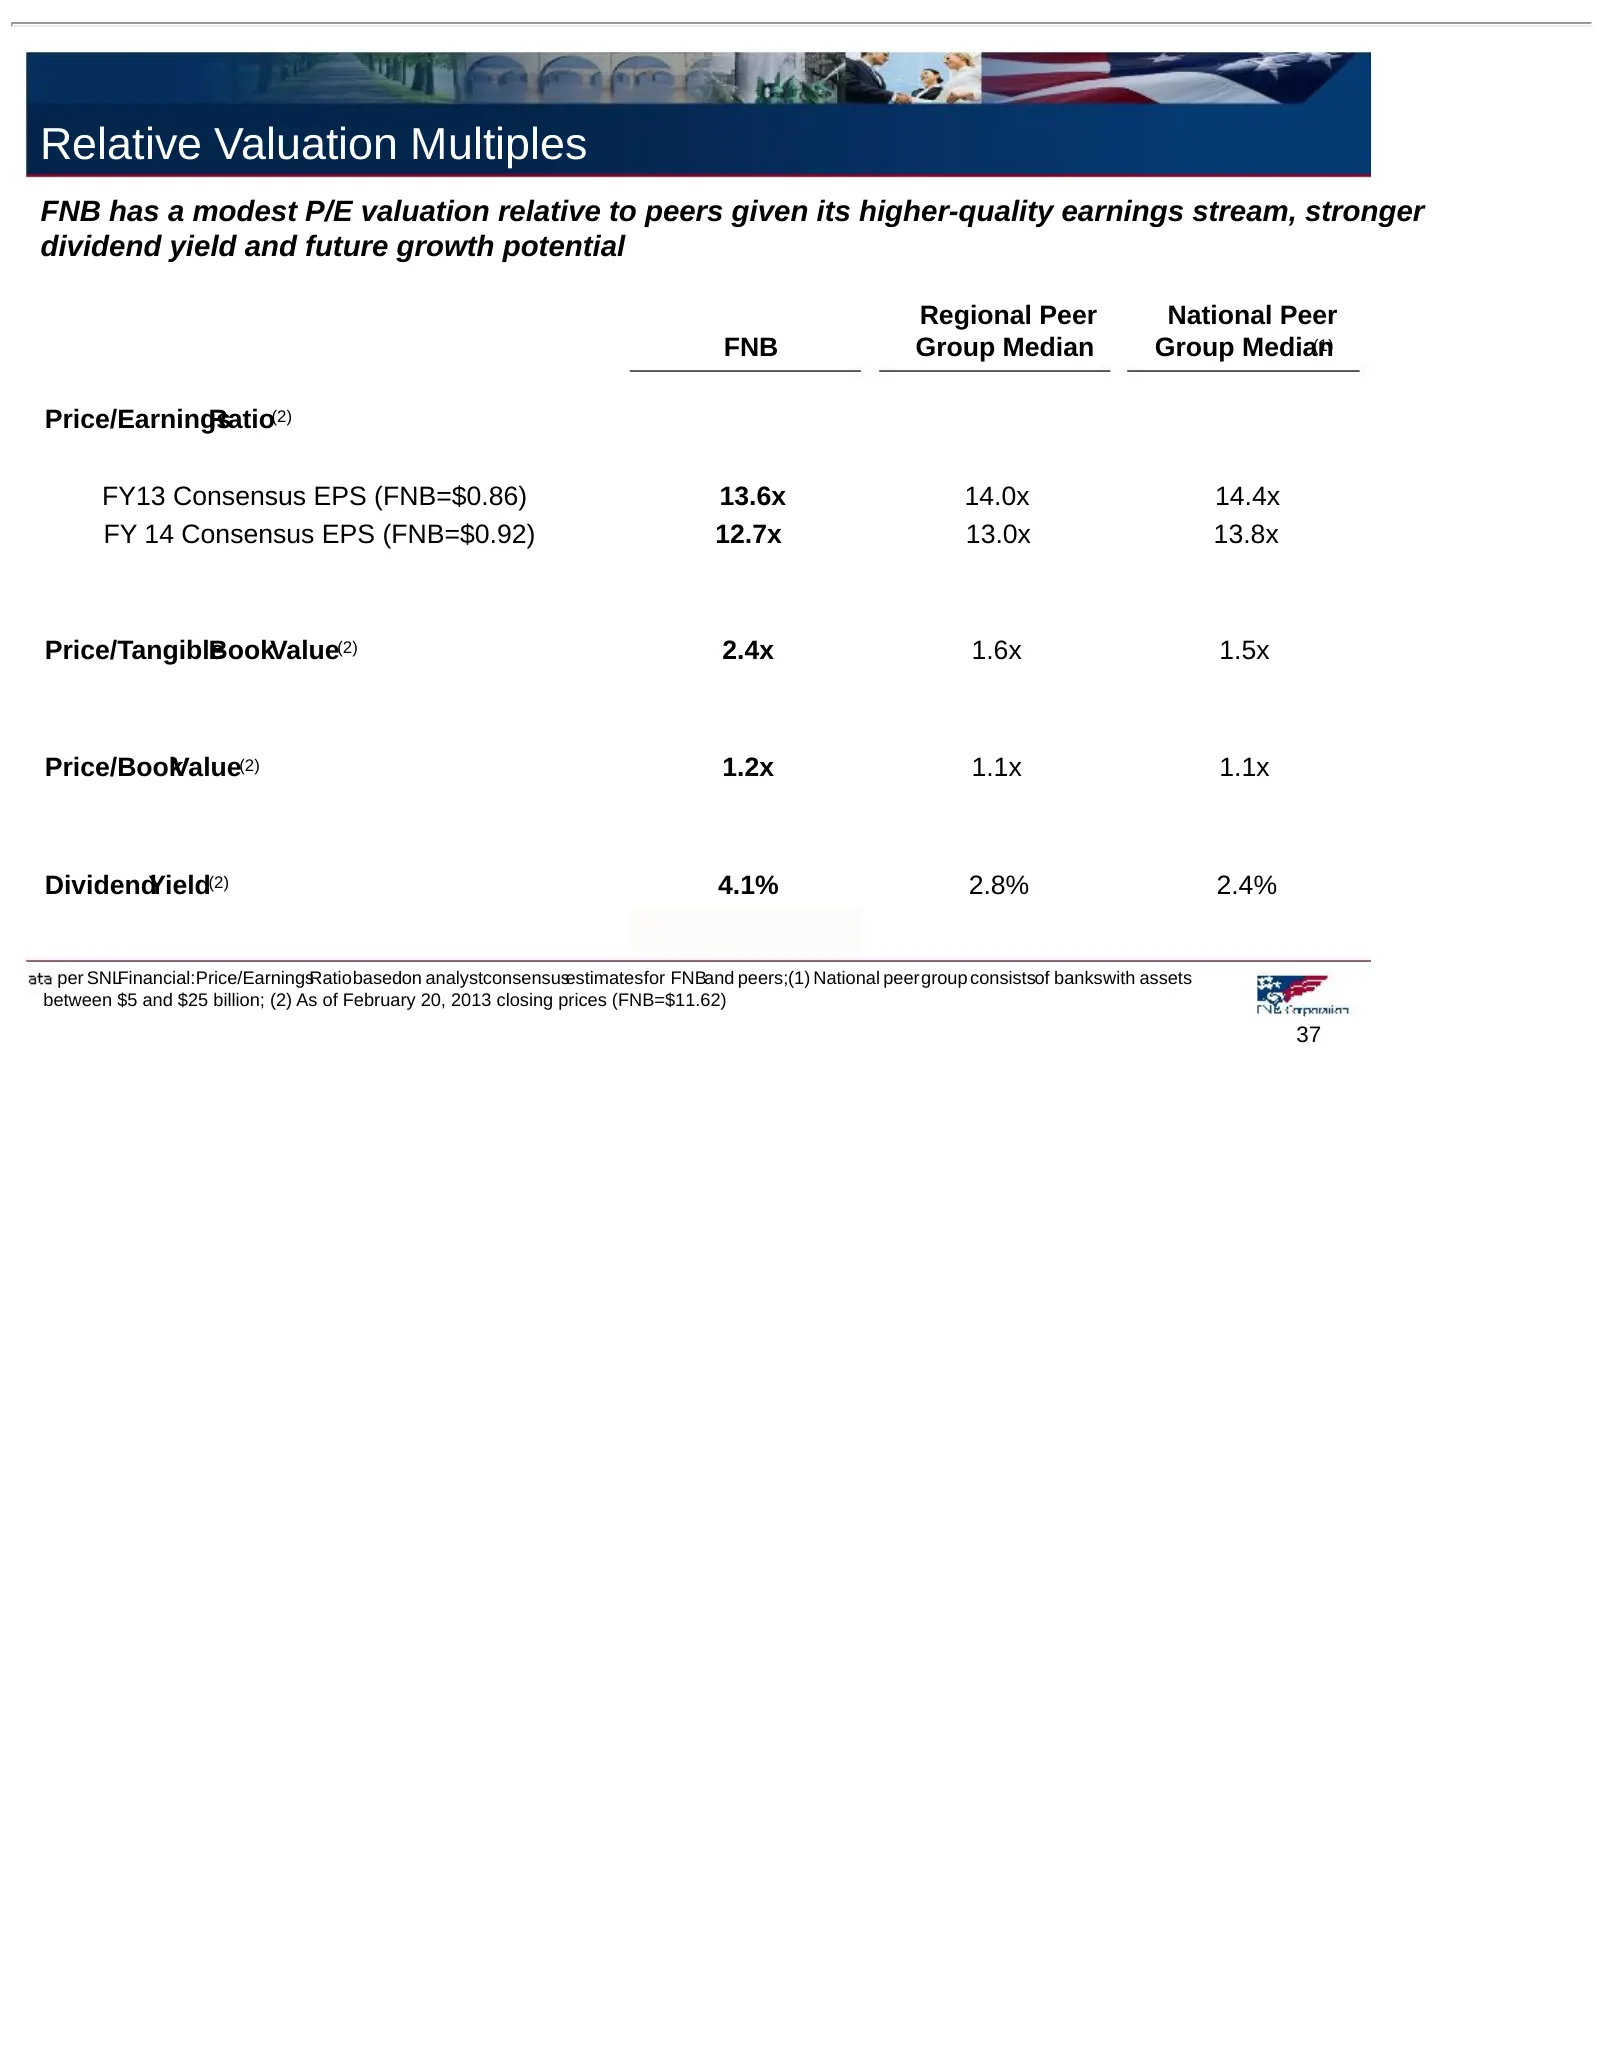
Relative Valuation Multiples FNB has a modest P/E valuation relative to peers given its higher-quality earnings stream, stronger dividend yield and future growth potential Regional Peer National Peer FNB Group Median Group Median(1) Price/Earnings Ratio(2) FY13 Consensus EPS (FNB=$0.86) 13.6x 14.0x
Slide 38: FNB Among Top Performing Banks
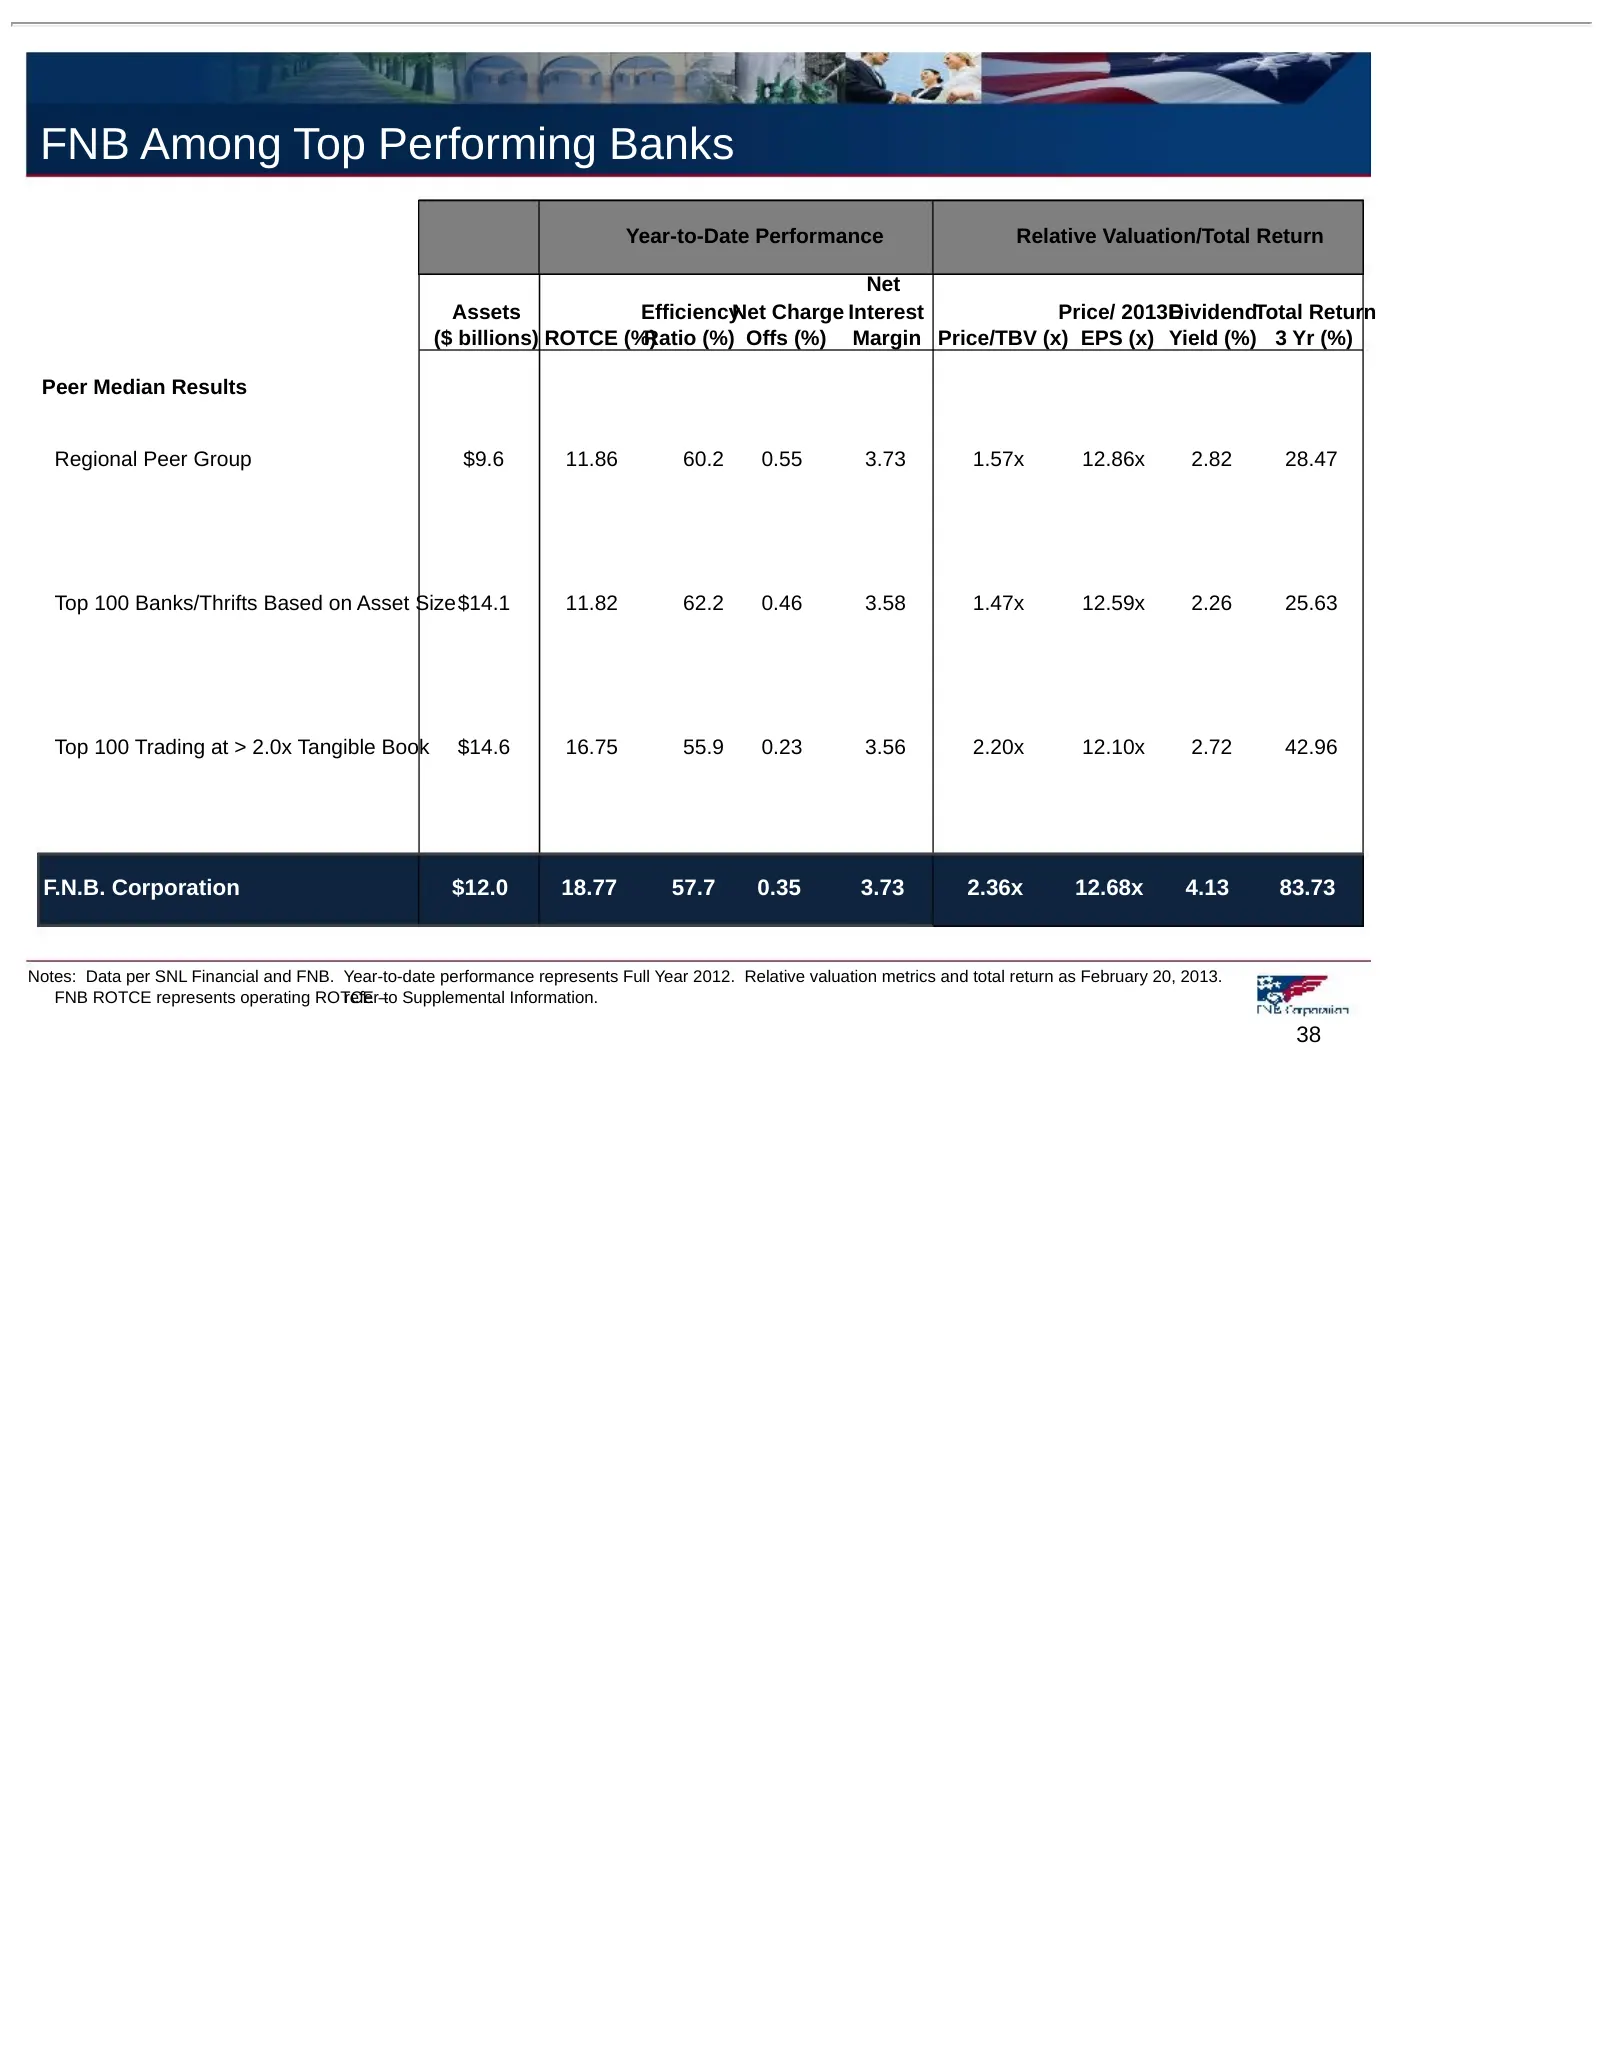
FNB Among Top Performing Banks Year-to-Date Performance Relative Valuation/Total Return Net Assets EfficiencyNet Charge Interest Price/ 2013E DividendTotal Return ($ billions) ROTCE (%) Ratio (%) Offs (%) Margin Price/TBV (x) EPS (x) Yield (%) 3 Yr (%) Peer Median Results Regional Peer Group $9.6 11
Slide 39: Relative Valuation Analysis
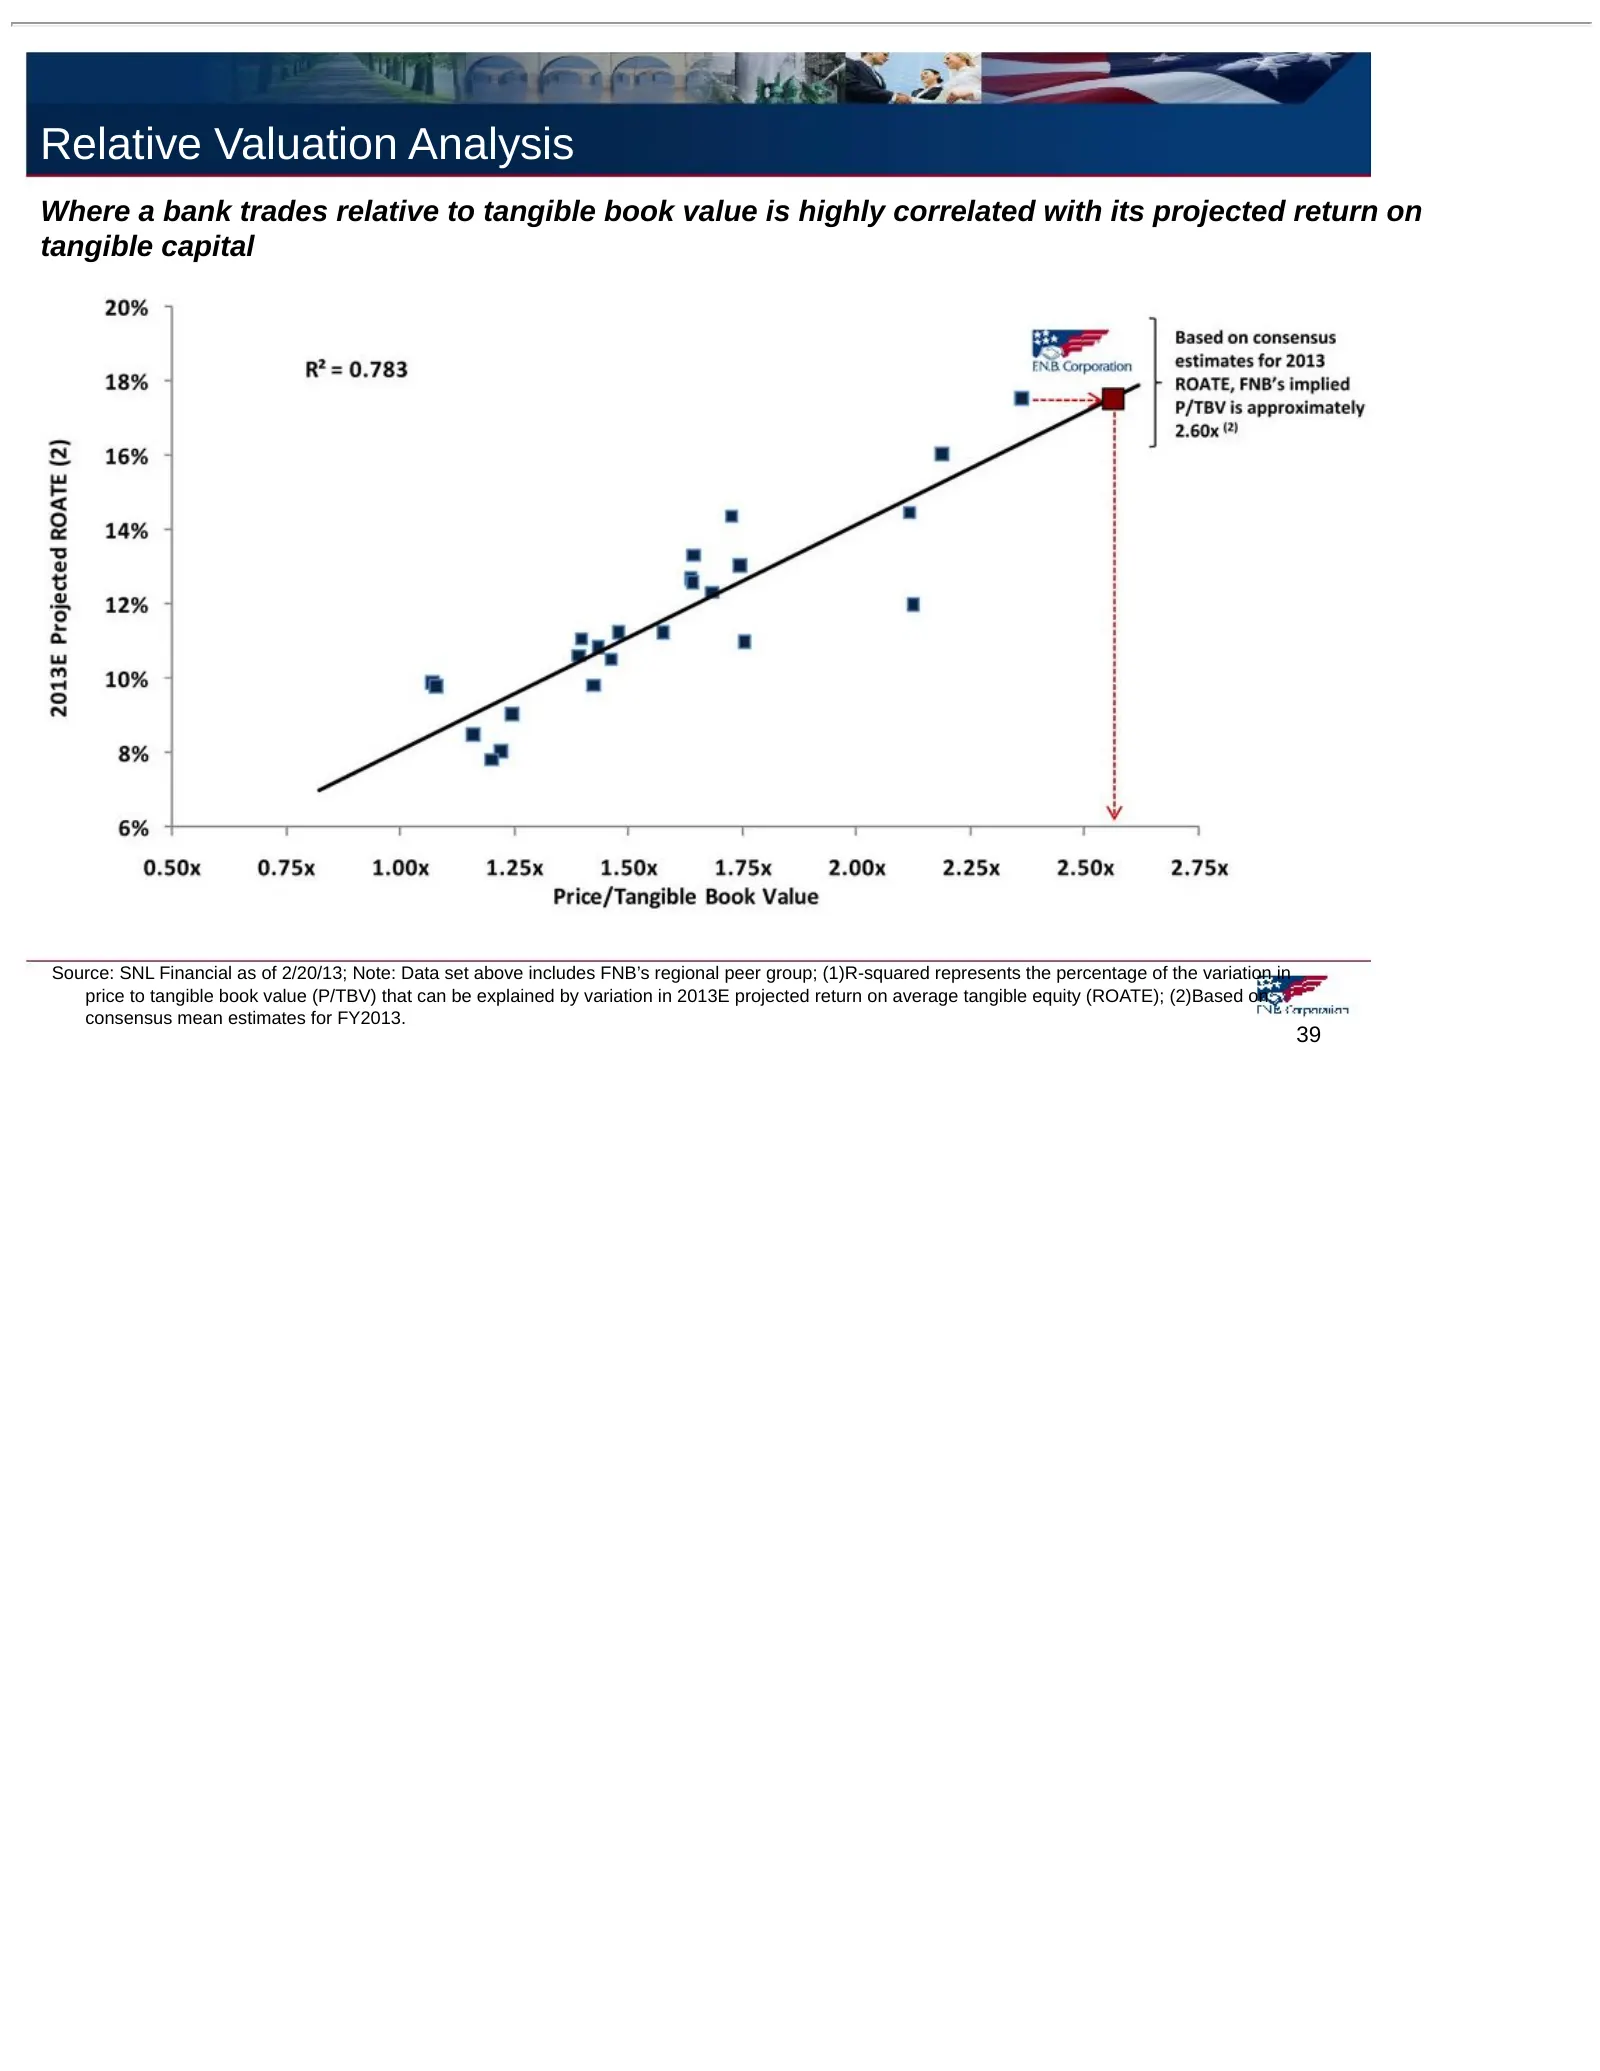
Relative Valuation Analysis Where a bank trades relative to tangible book value is highly correlated with its projected return on tangible capital Source: SNL Financial as of 2/20/13; Note: Data set above includes FNB’s regional peer group; (1)R-squared represents the percentage of the variation in
Slide 40: Relative Valuation – Price/TBV Trends
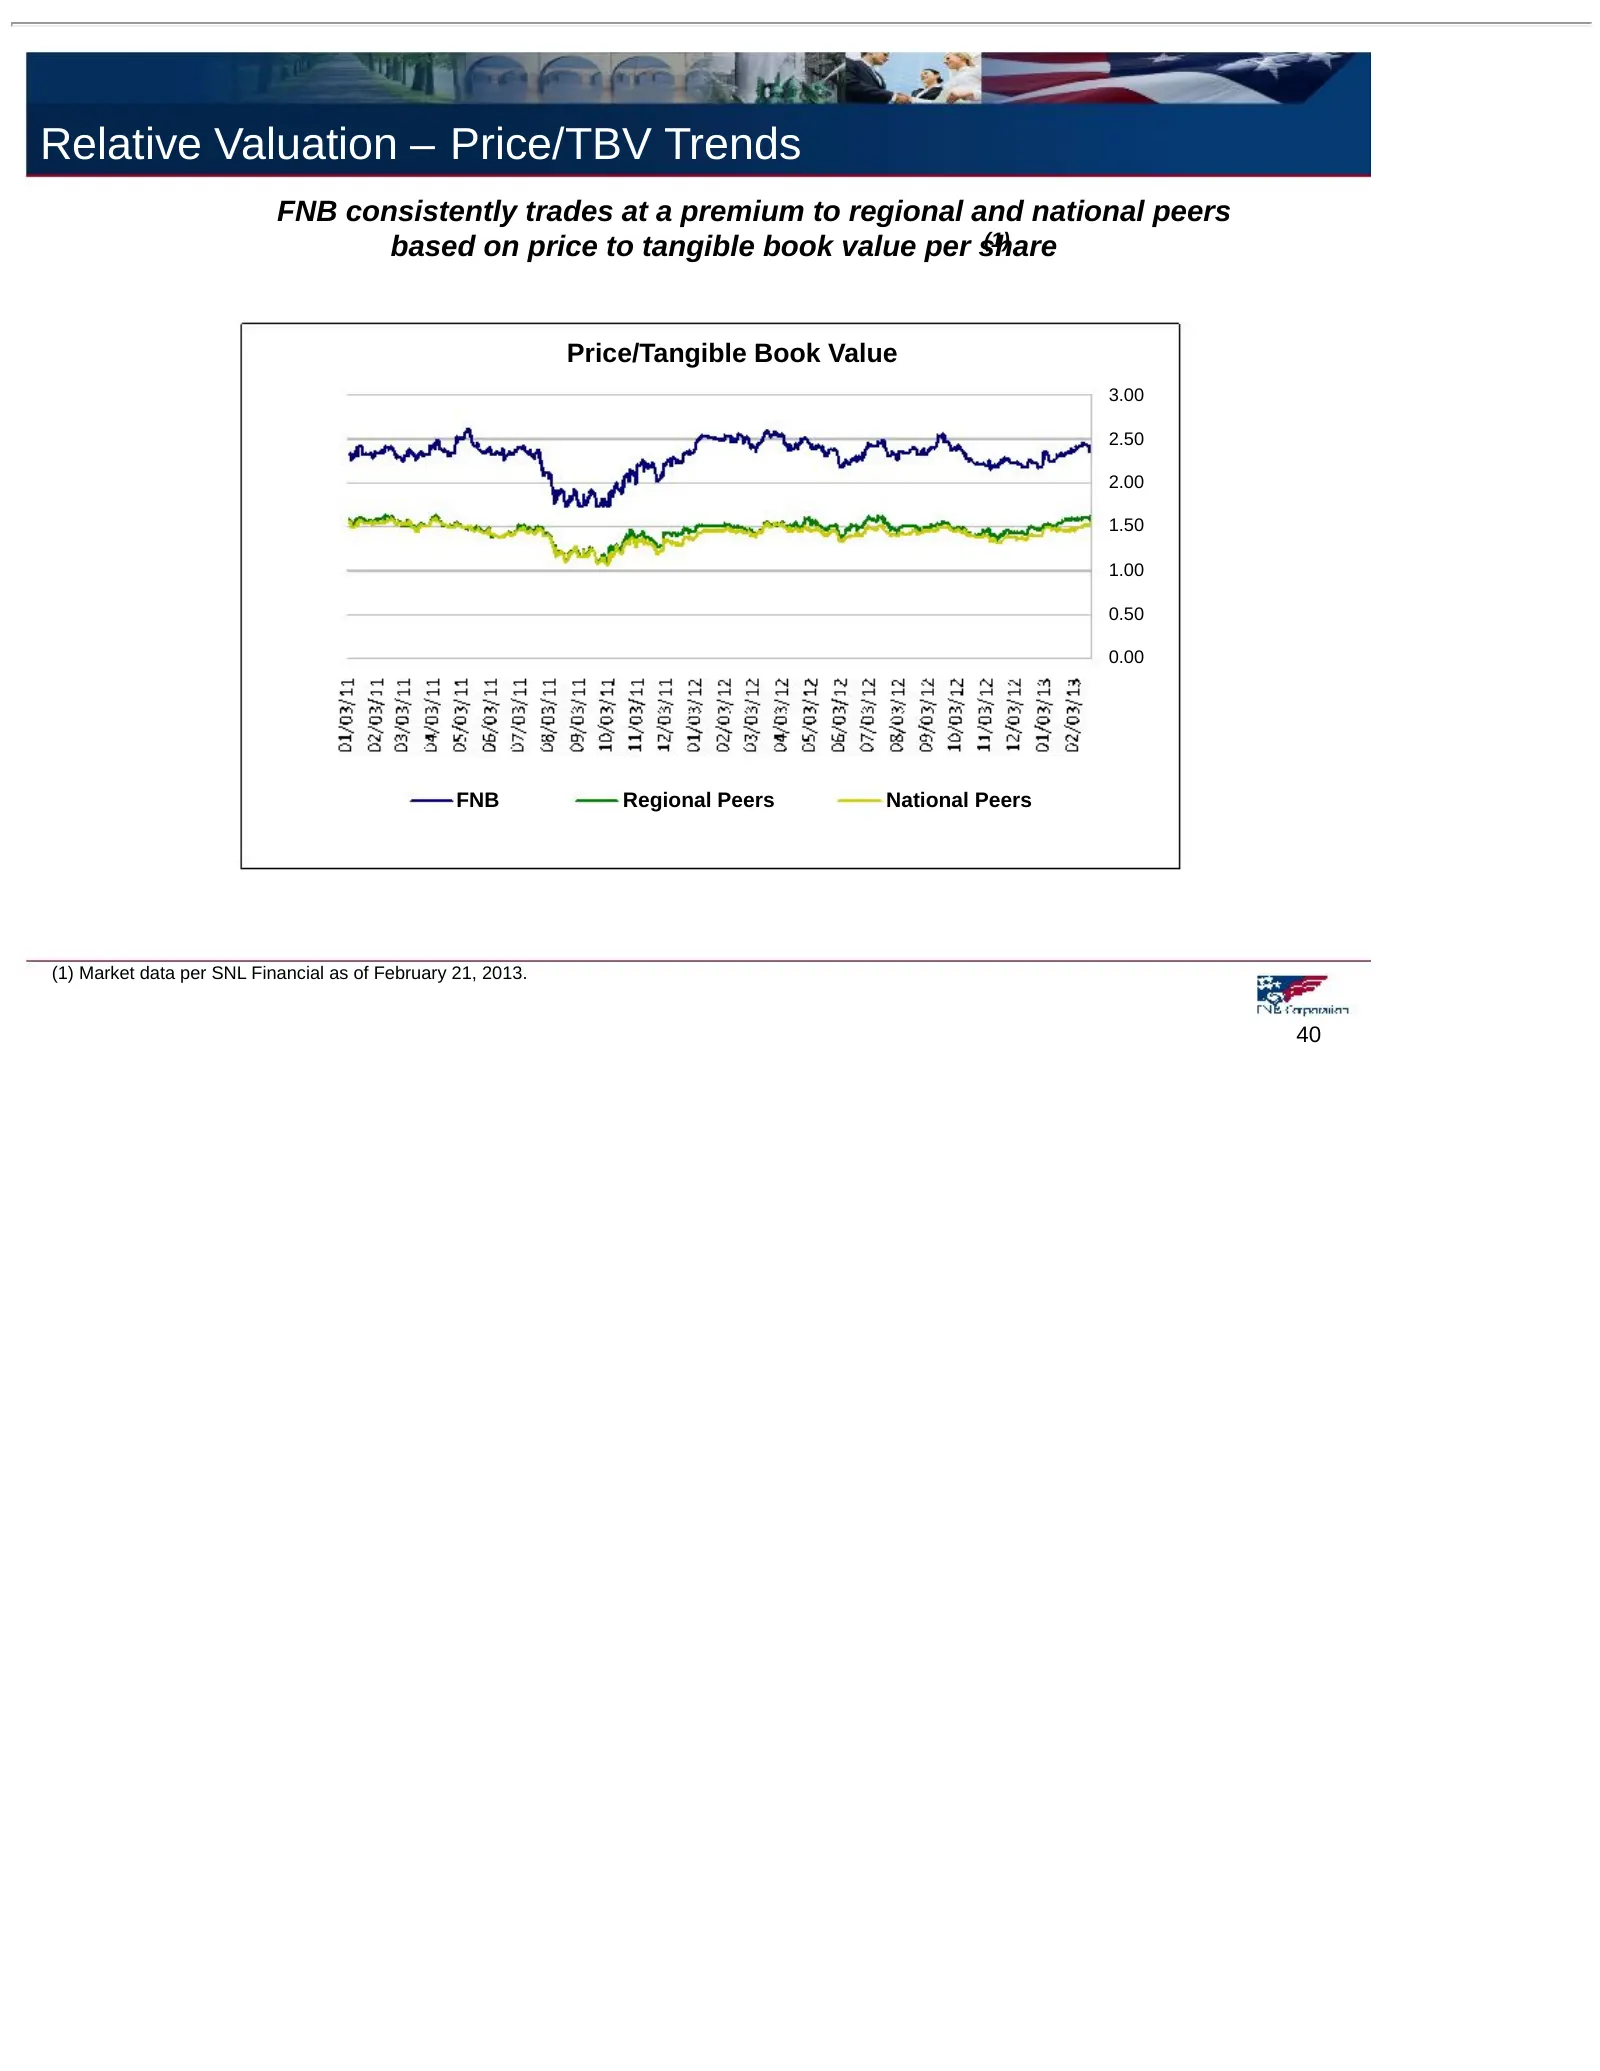
Relative Valuation – Price/TBV Trends FNB consistently trades at a premium to regional and national peers (1) based on price to tangible book value per share Price/Tangible Book Value 3.00 2.50 2.00 1.50 1.00 0.50 0.00 FNB Regional Peers National Peers (1) Market data per SNL Financial as of Februar

Slide 41: Supplemental Information
Supplemental Information 41
Slide 42: Supplemental Information Index
Supplemental Information Index Diversified Loan Portfolio Deposits and Customer Repurchase Agreements Investment Portfolio Loan Risk Profile (December 31, 2012) Regency Finance Company Profile Marcellus and Utica Shale Exposure and Focus Regional Peer Group Listing GAAP to Non-GAAP Reconciliation 42
Slide 43: Diversified Loan Portfolio
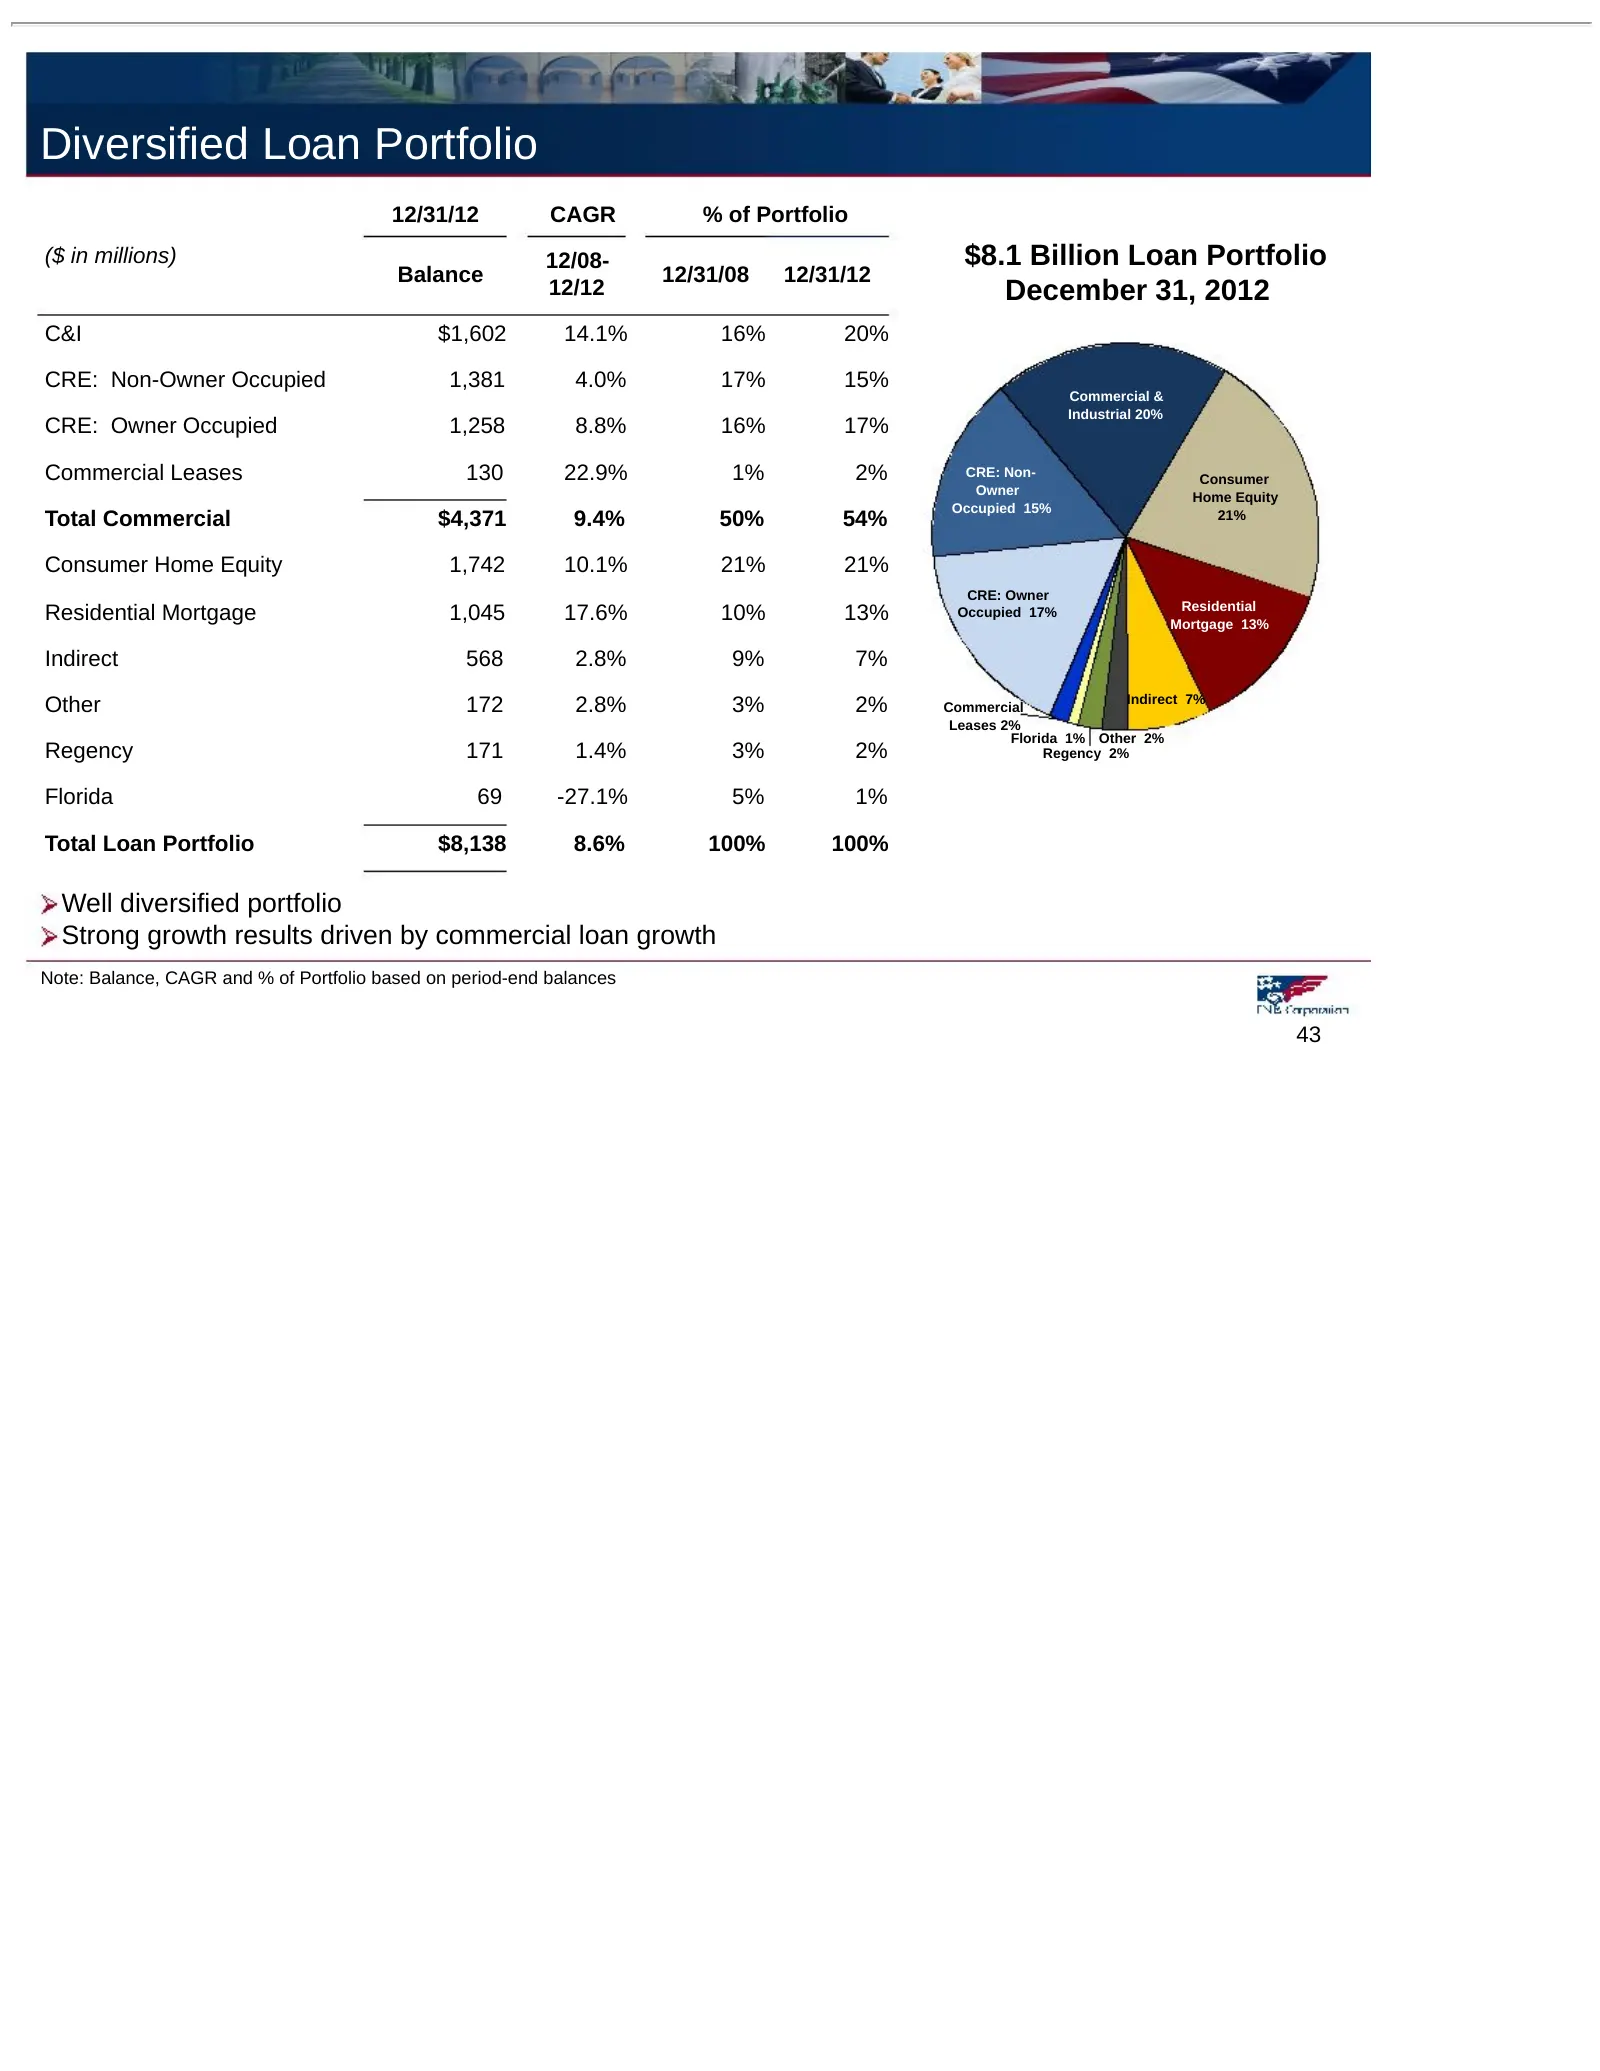
Diversified Loan Portfolio 12/31/12 CAGR % of Portfolio ($ in millions) 12/08- $8.1 Billion Loan Portfolio Balance 12/31/08 12/31/12 12/12 December 31, 2012 C&I $1,602 14.1% 16% 20% CRE: Non-Owner Occupied 1,381 4.0% 17% 15% Commercial & Industrial 20% CRE: Owner Occupied 1,258 8.8% 16% 17% Commerci
Slide 44: Deposits and Customer Repurchase Agreements
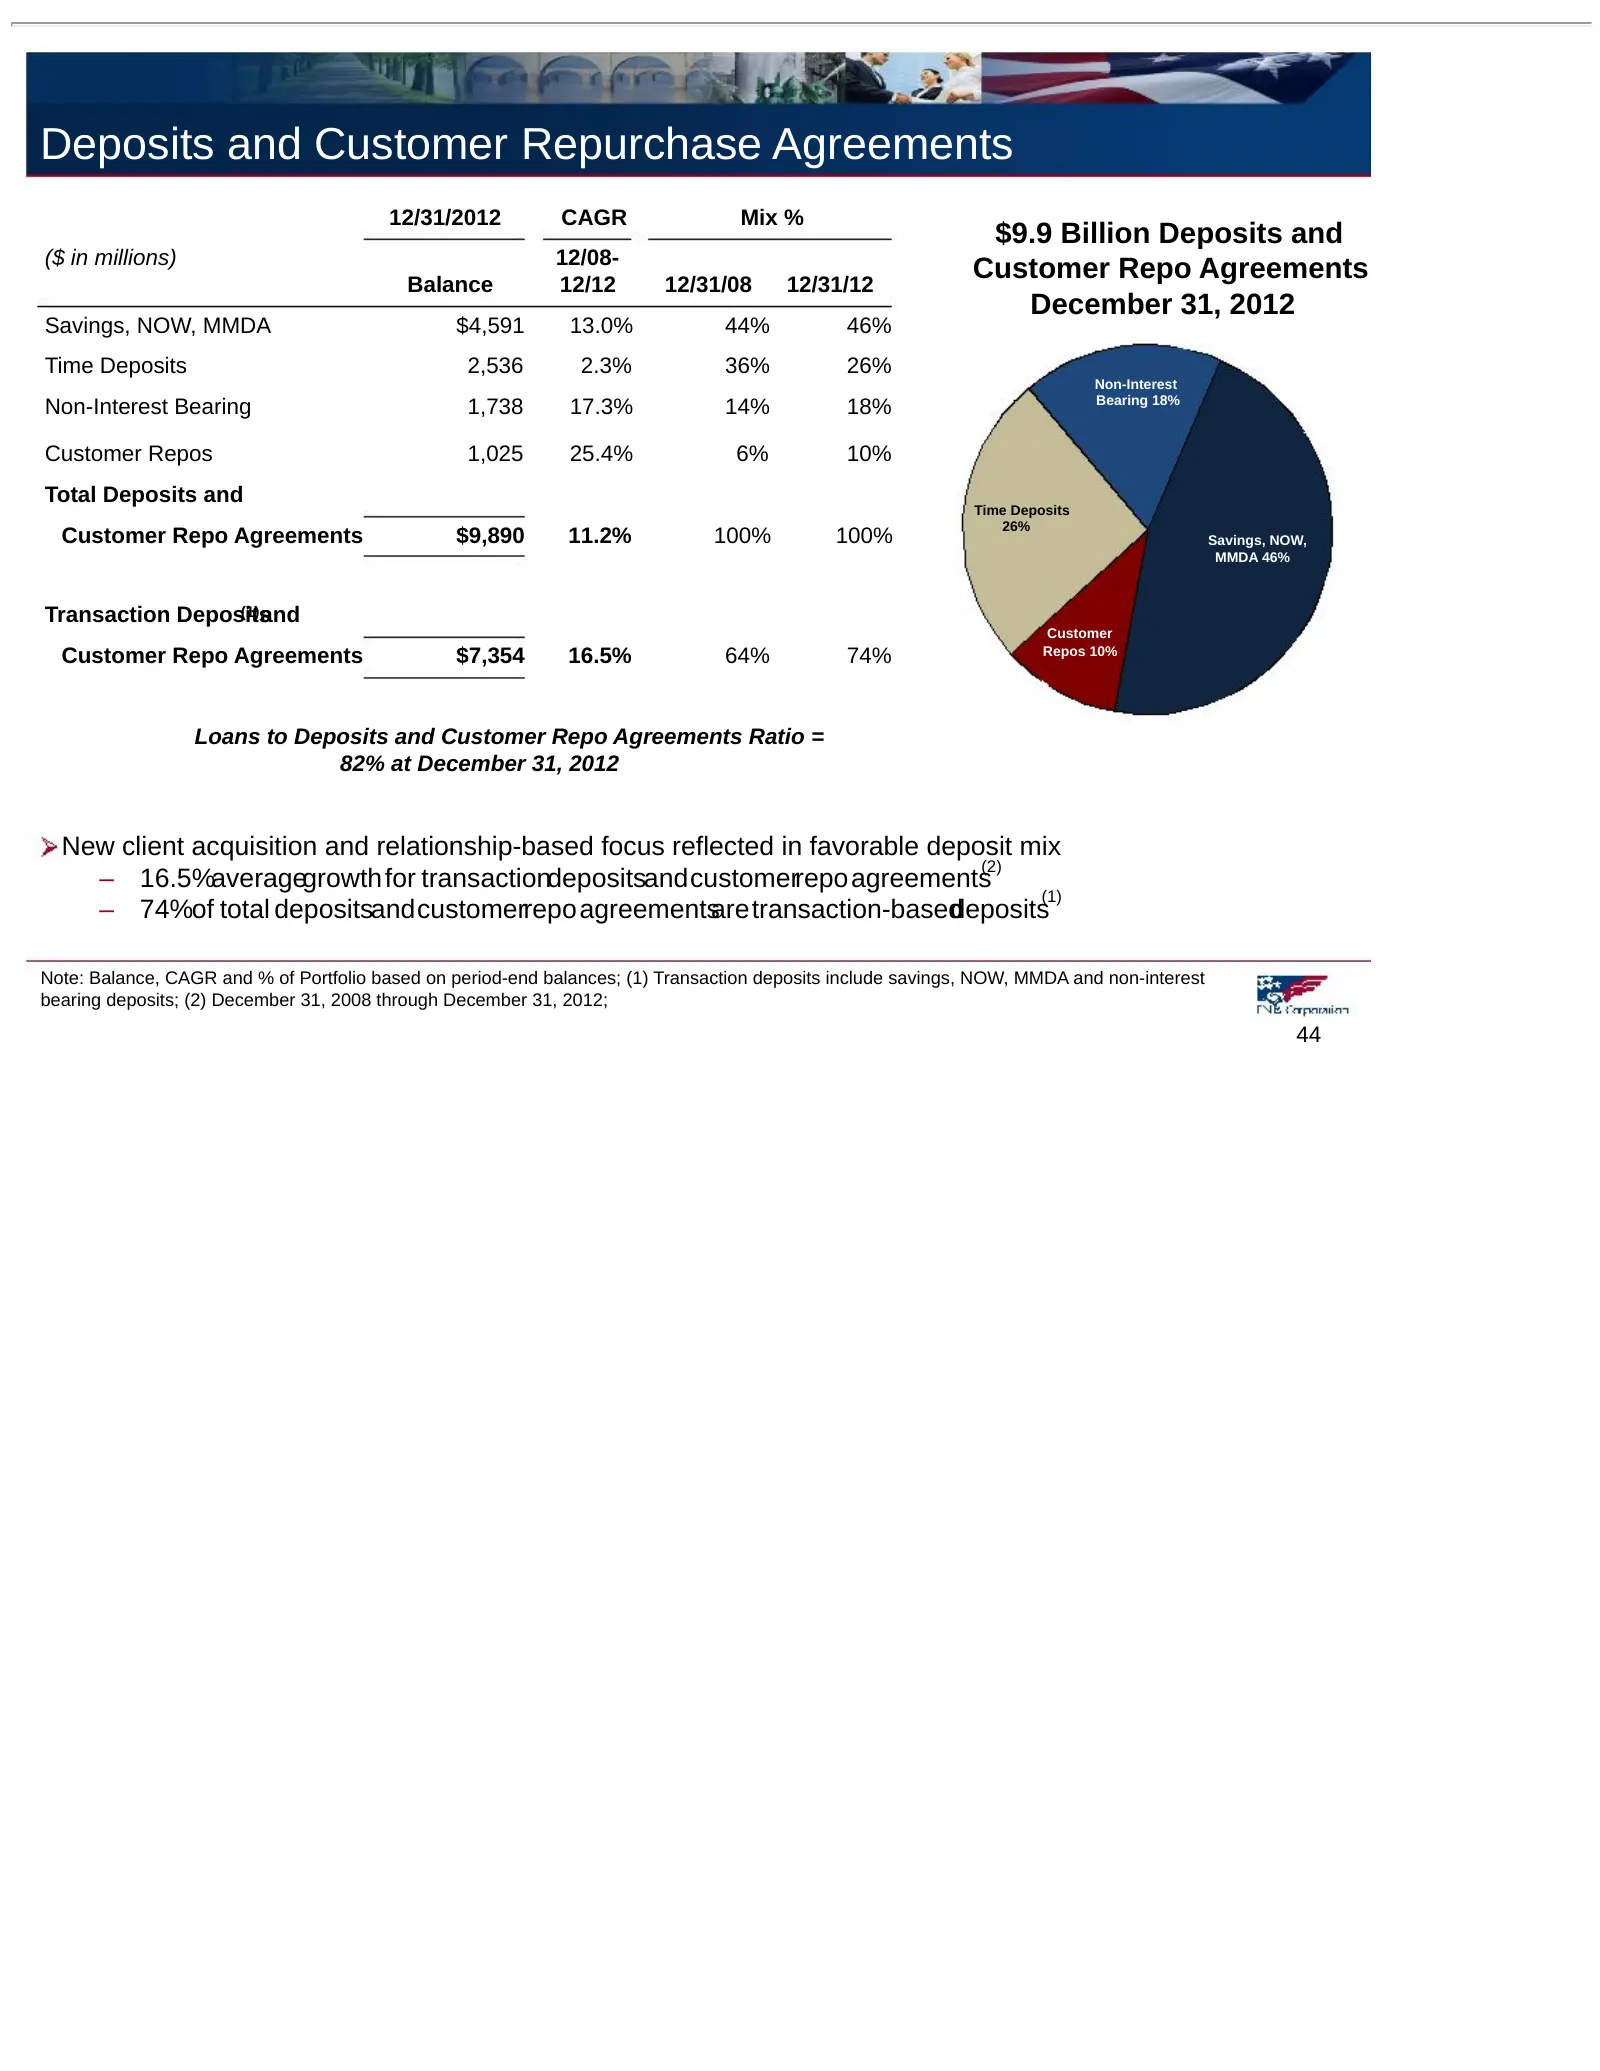
Deposits and Customer Repurchase Agreements 12/31/2012 CAGR Mix % $9.9 Billion Deposits and ($ in millions) 12/08- Balance 12/12 12/31/08 12/31/12 Customer Repo Agreements December 31, 2012 Savings, NOW, MMDA $4,591 13.0% 44% 46% Time Deposits 2,536 2.3% 36% 26% Non-Interest Bearing 18% Non-Interest
Slide 45: Investment Portfolio
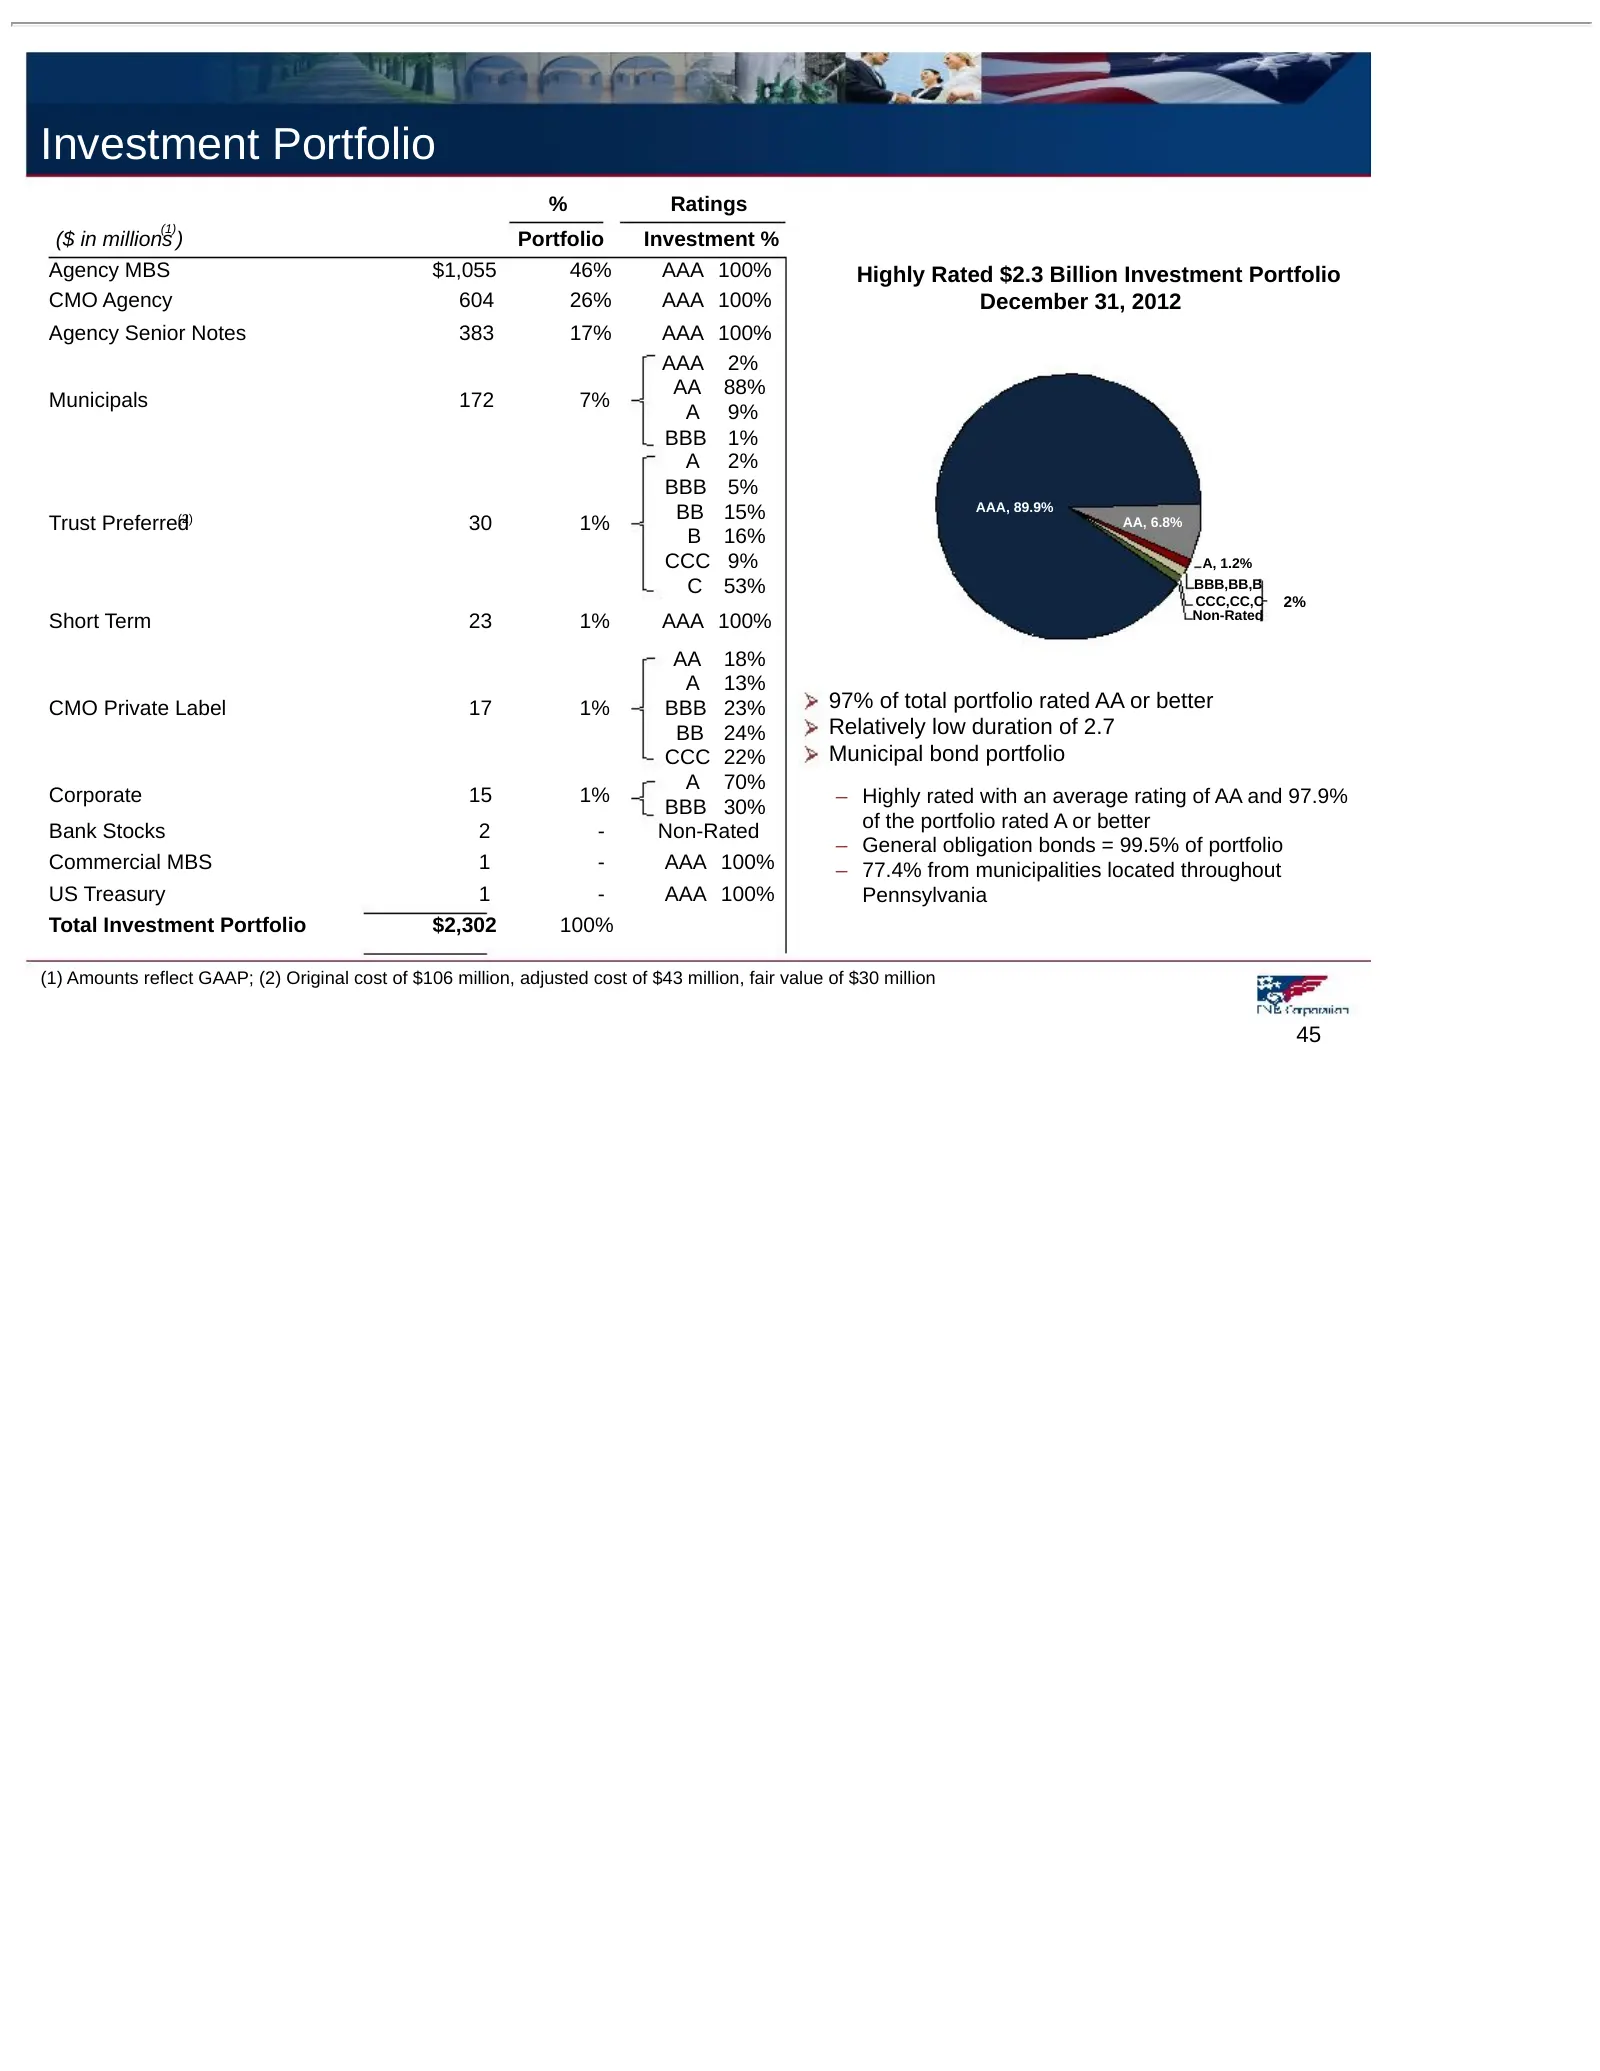
Investment Portfolio % Ratings (1) ($ in millions ) Portfolio Investment % Agency MBS $1,055 46% AAA 100% Highly Rated $2.3 Billion Investment Portfolio CMO Agency 604 26% AAA 100% December 31, 2012 Agency Senior Notes 383 17% AAA 100% AAA 2% AA 88% Municipals 172 7% A 9% BBB 1% A 2% BBB 5% AAA, 89.
Slide 46: Loan Risk Profile
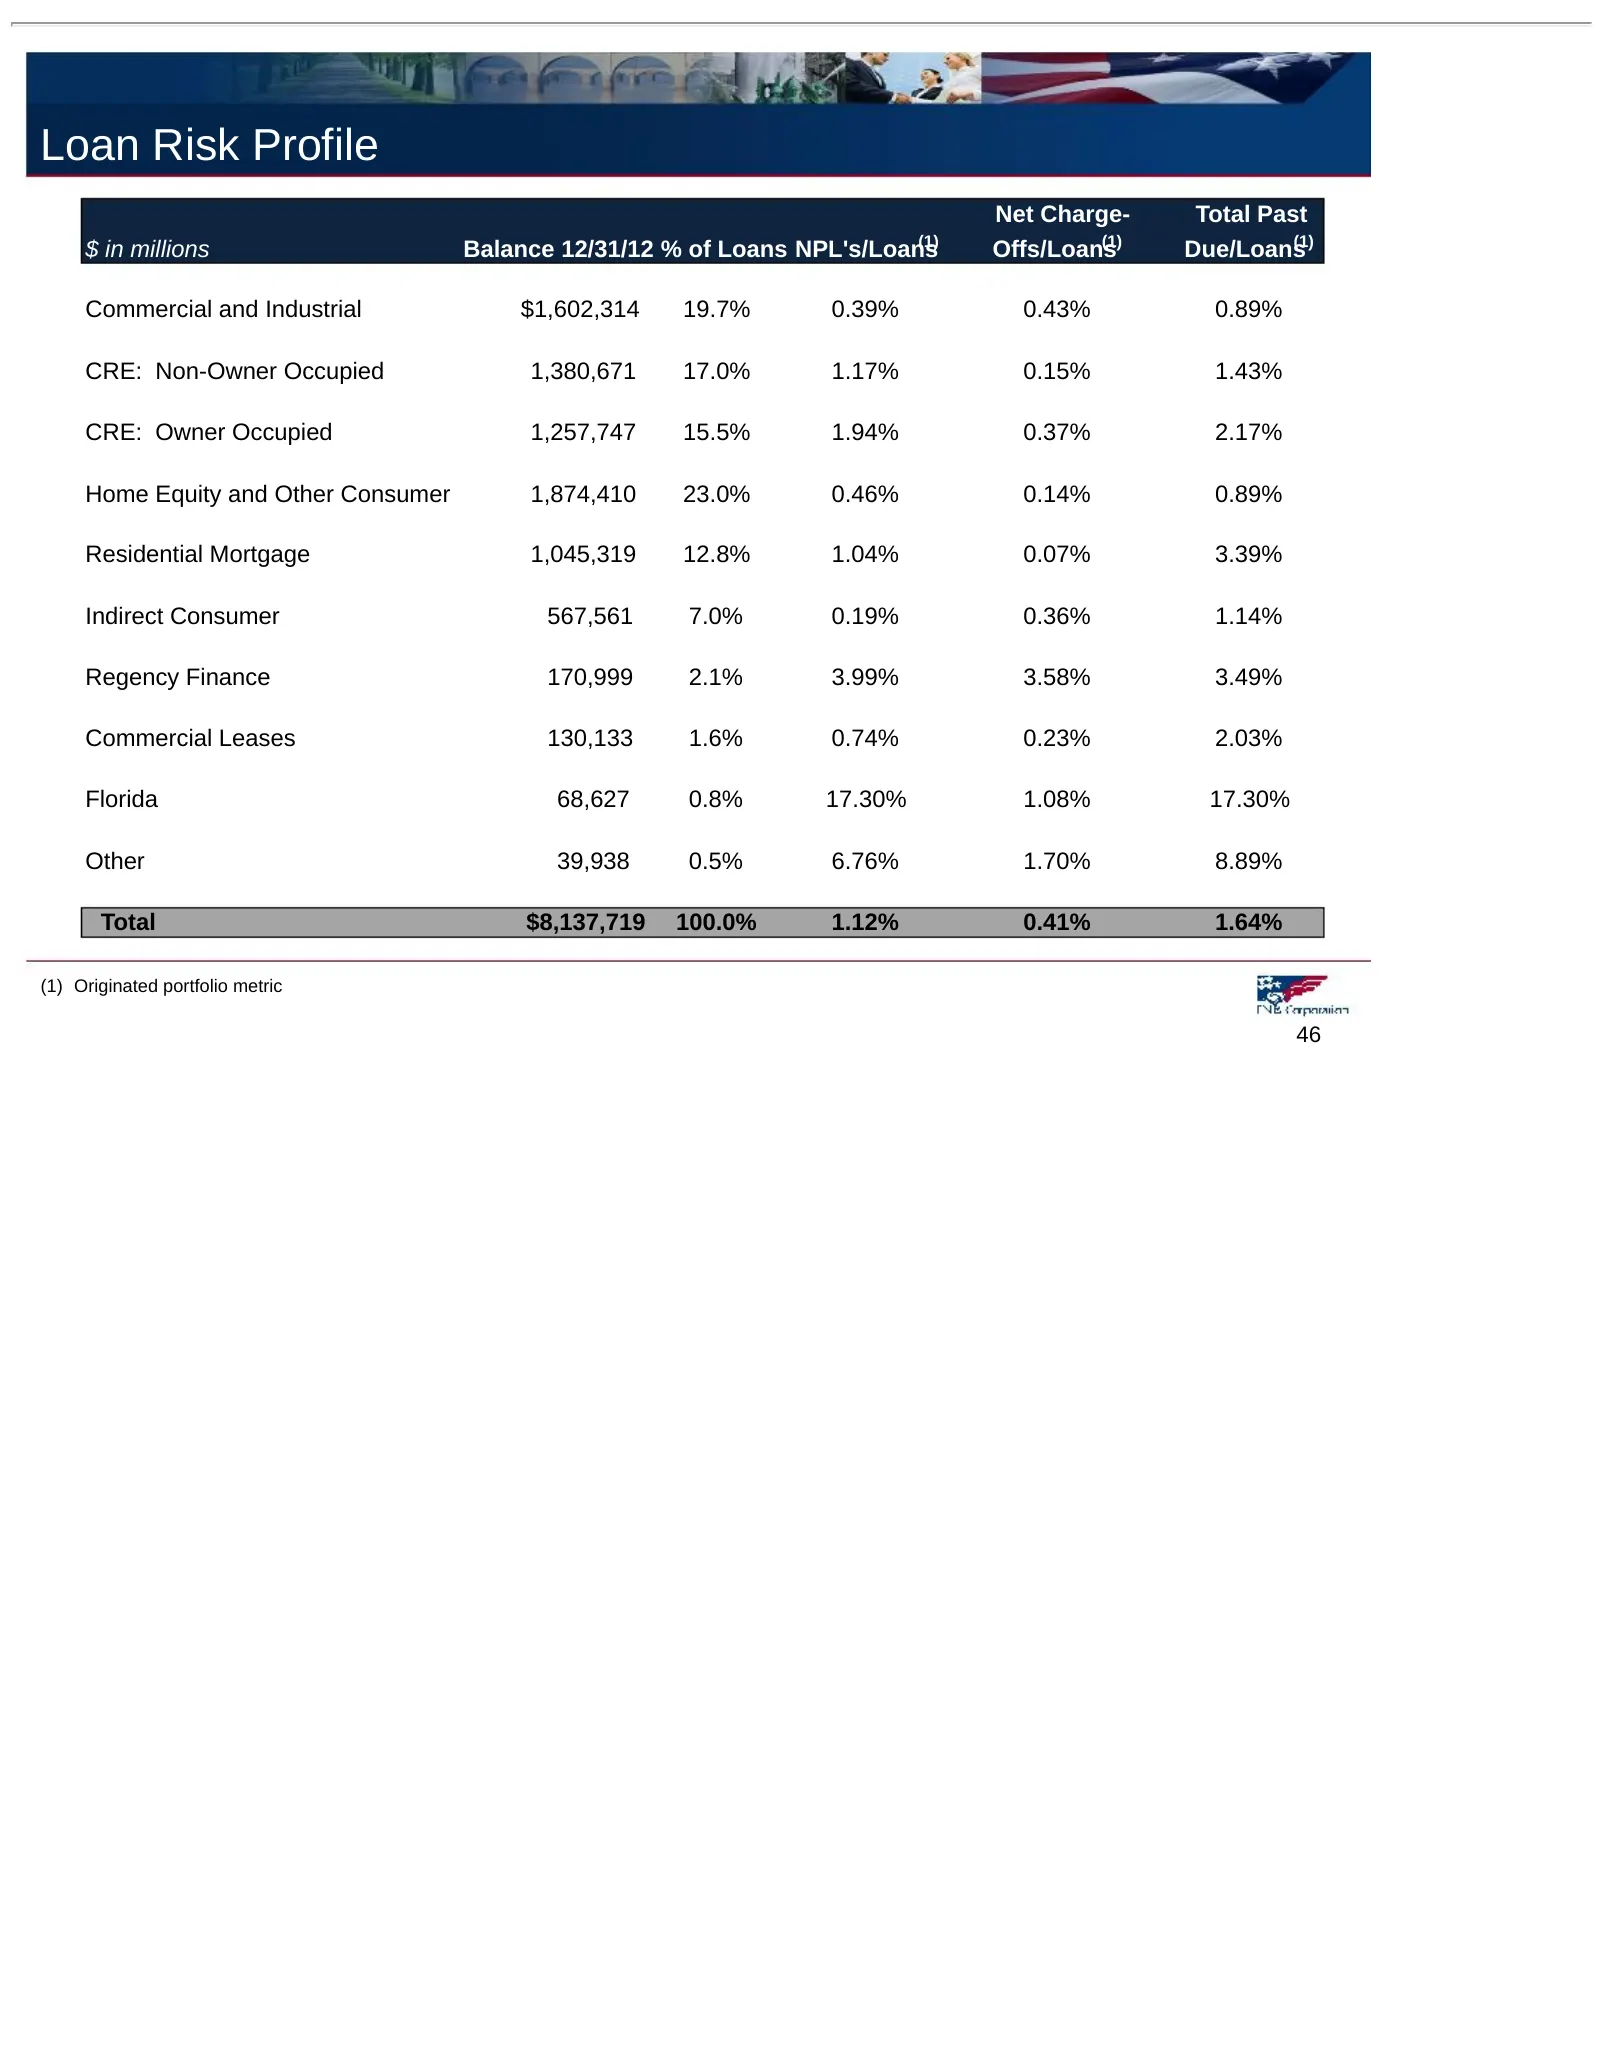
Loan Risk Profile Net Charge- Total Past (1) (1) (1) $ in millions Balance 12/31/12 % of Loans NPL's/Loans Offs/Loans Due/Loans Commercial and Industrial $1,602,314 19.7% 0.39% 0.43% 0.89% CRE: Non-Owner Occupied 1,380,671 17.0% 1.17% 0.15% 1.43% CRE: Owner Occupied 1,257,747 15.5% 1.94% 0.37% 2.17%
Slide 47: Regency Finance Company Profile
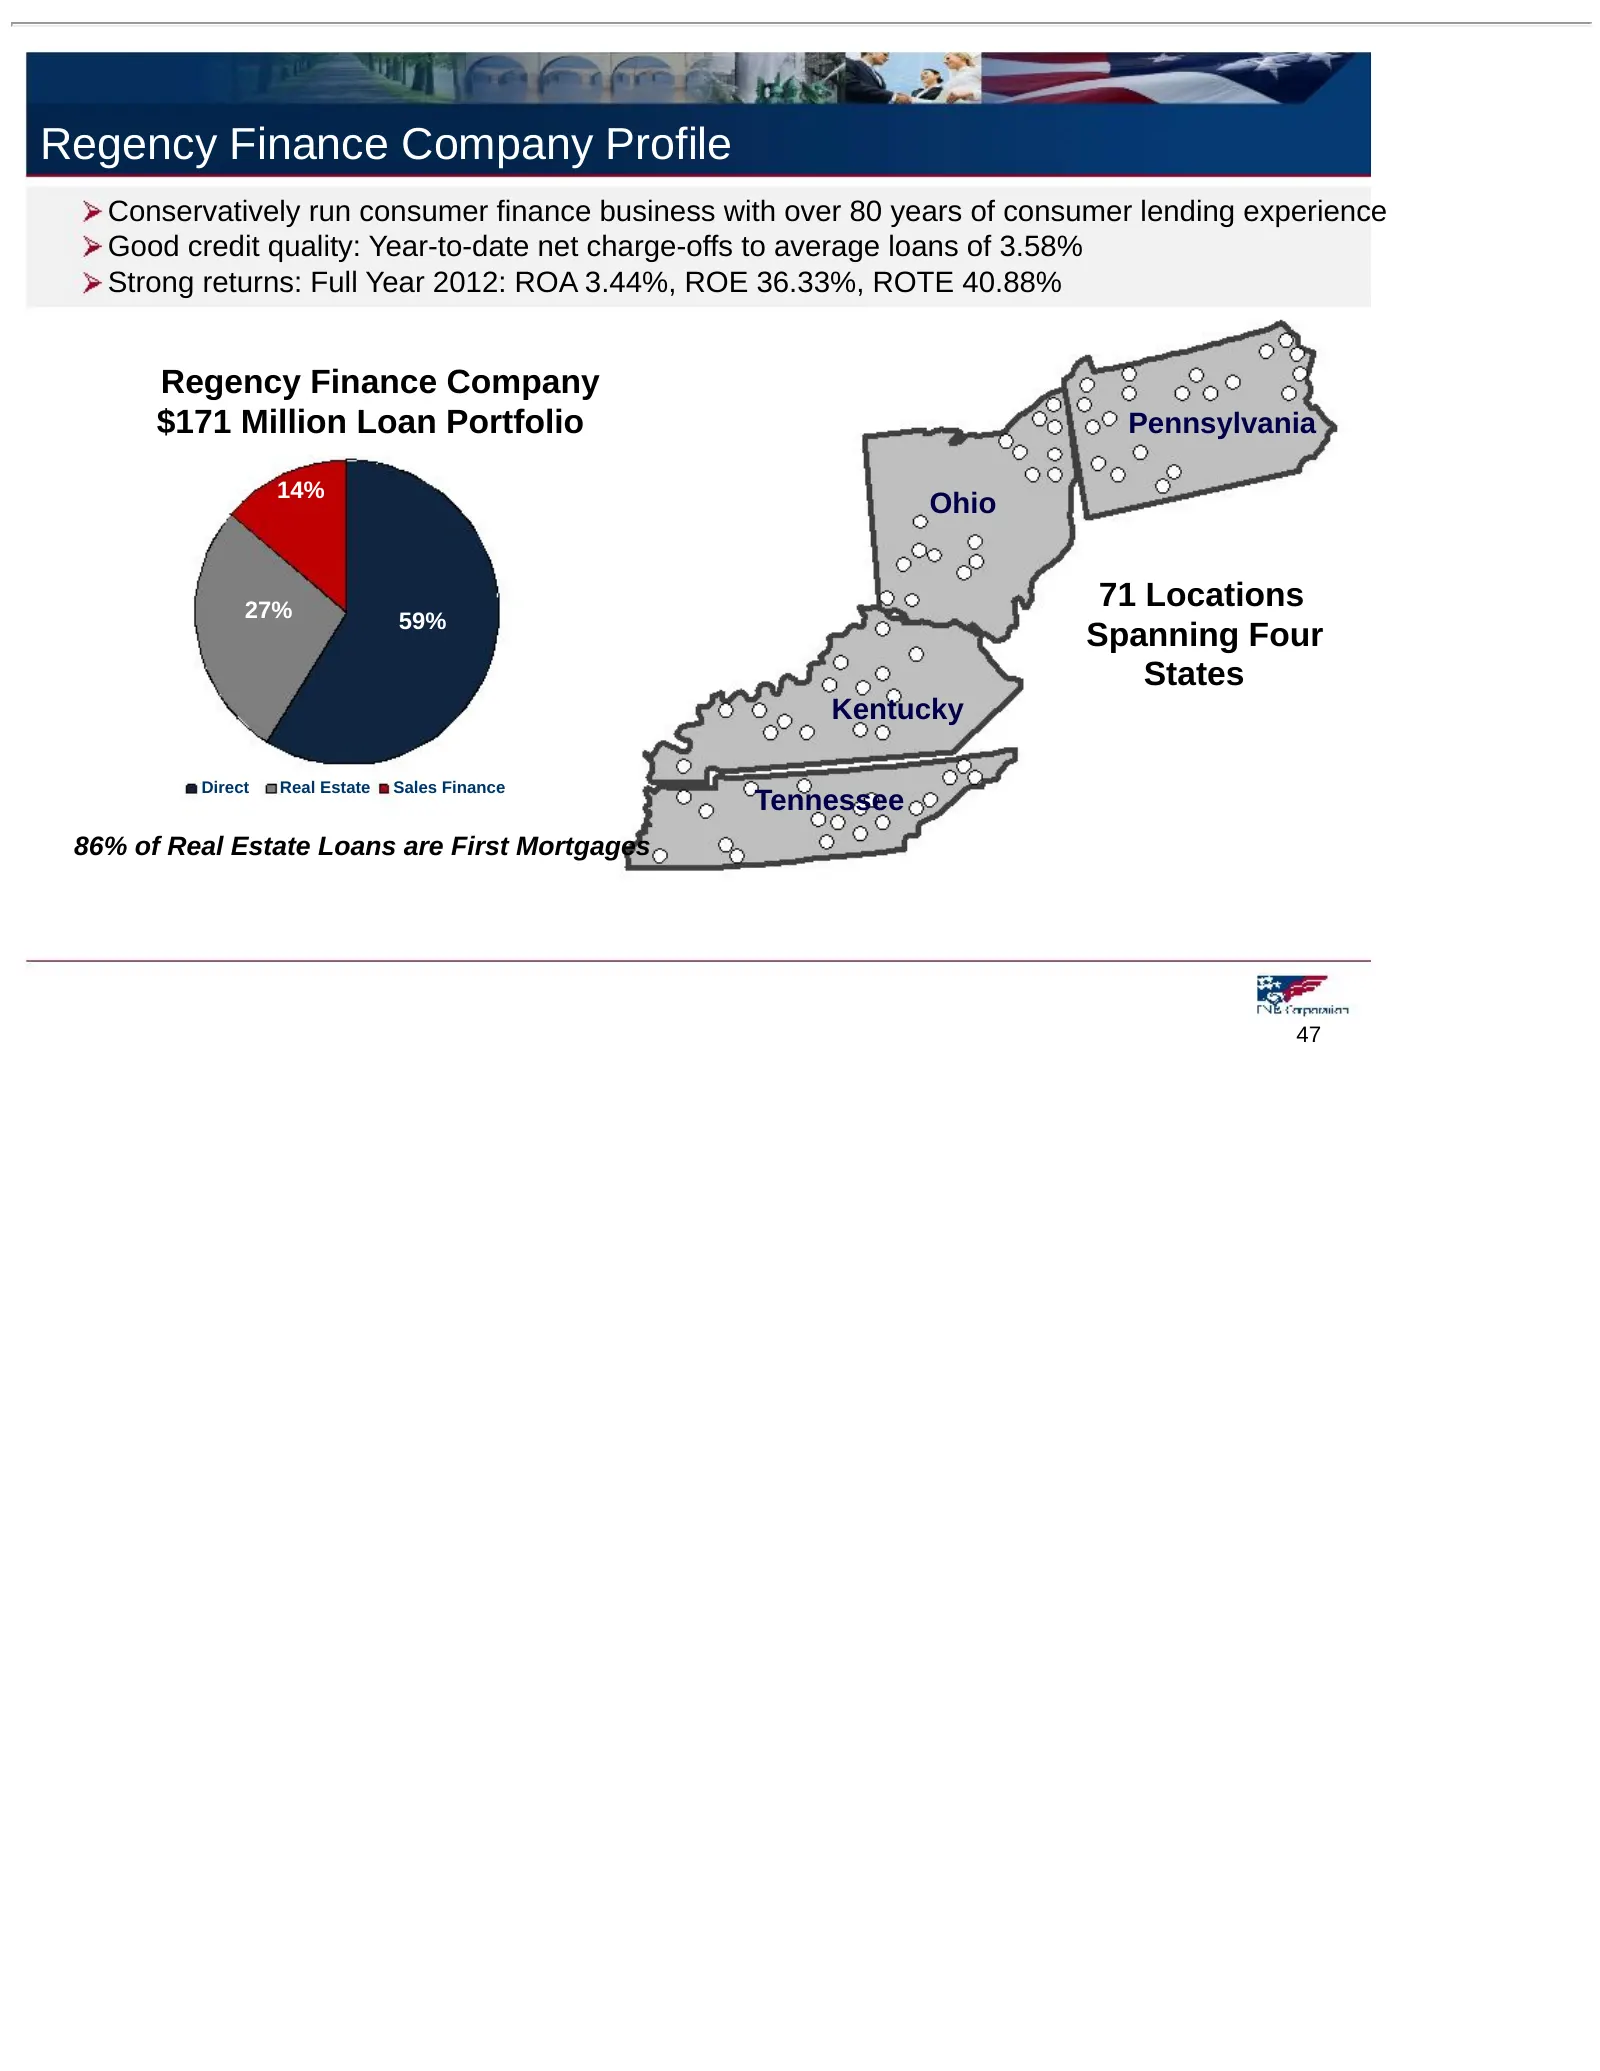
Regency Finance Company Profile Conservatively run consumer finance business with over 80 years of consumer lending experience Good credit quality: Year-to-date net charge-offs to average loans of 3.58% Strong returns: Full Year 2012: ROA 3.44%, ROE 36.33%, ROTE 40.88% Regency Finance Company $171 M
Slide 48: Marcellus and Utica Shale Exposure
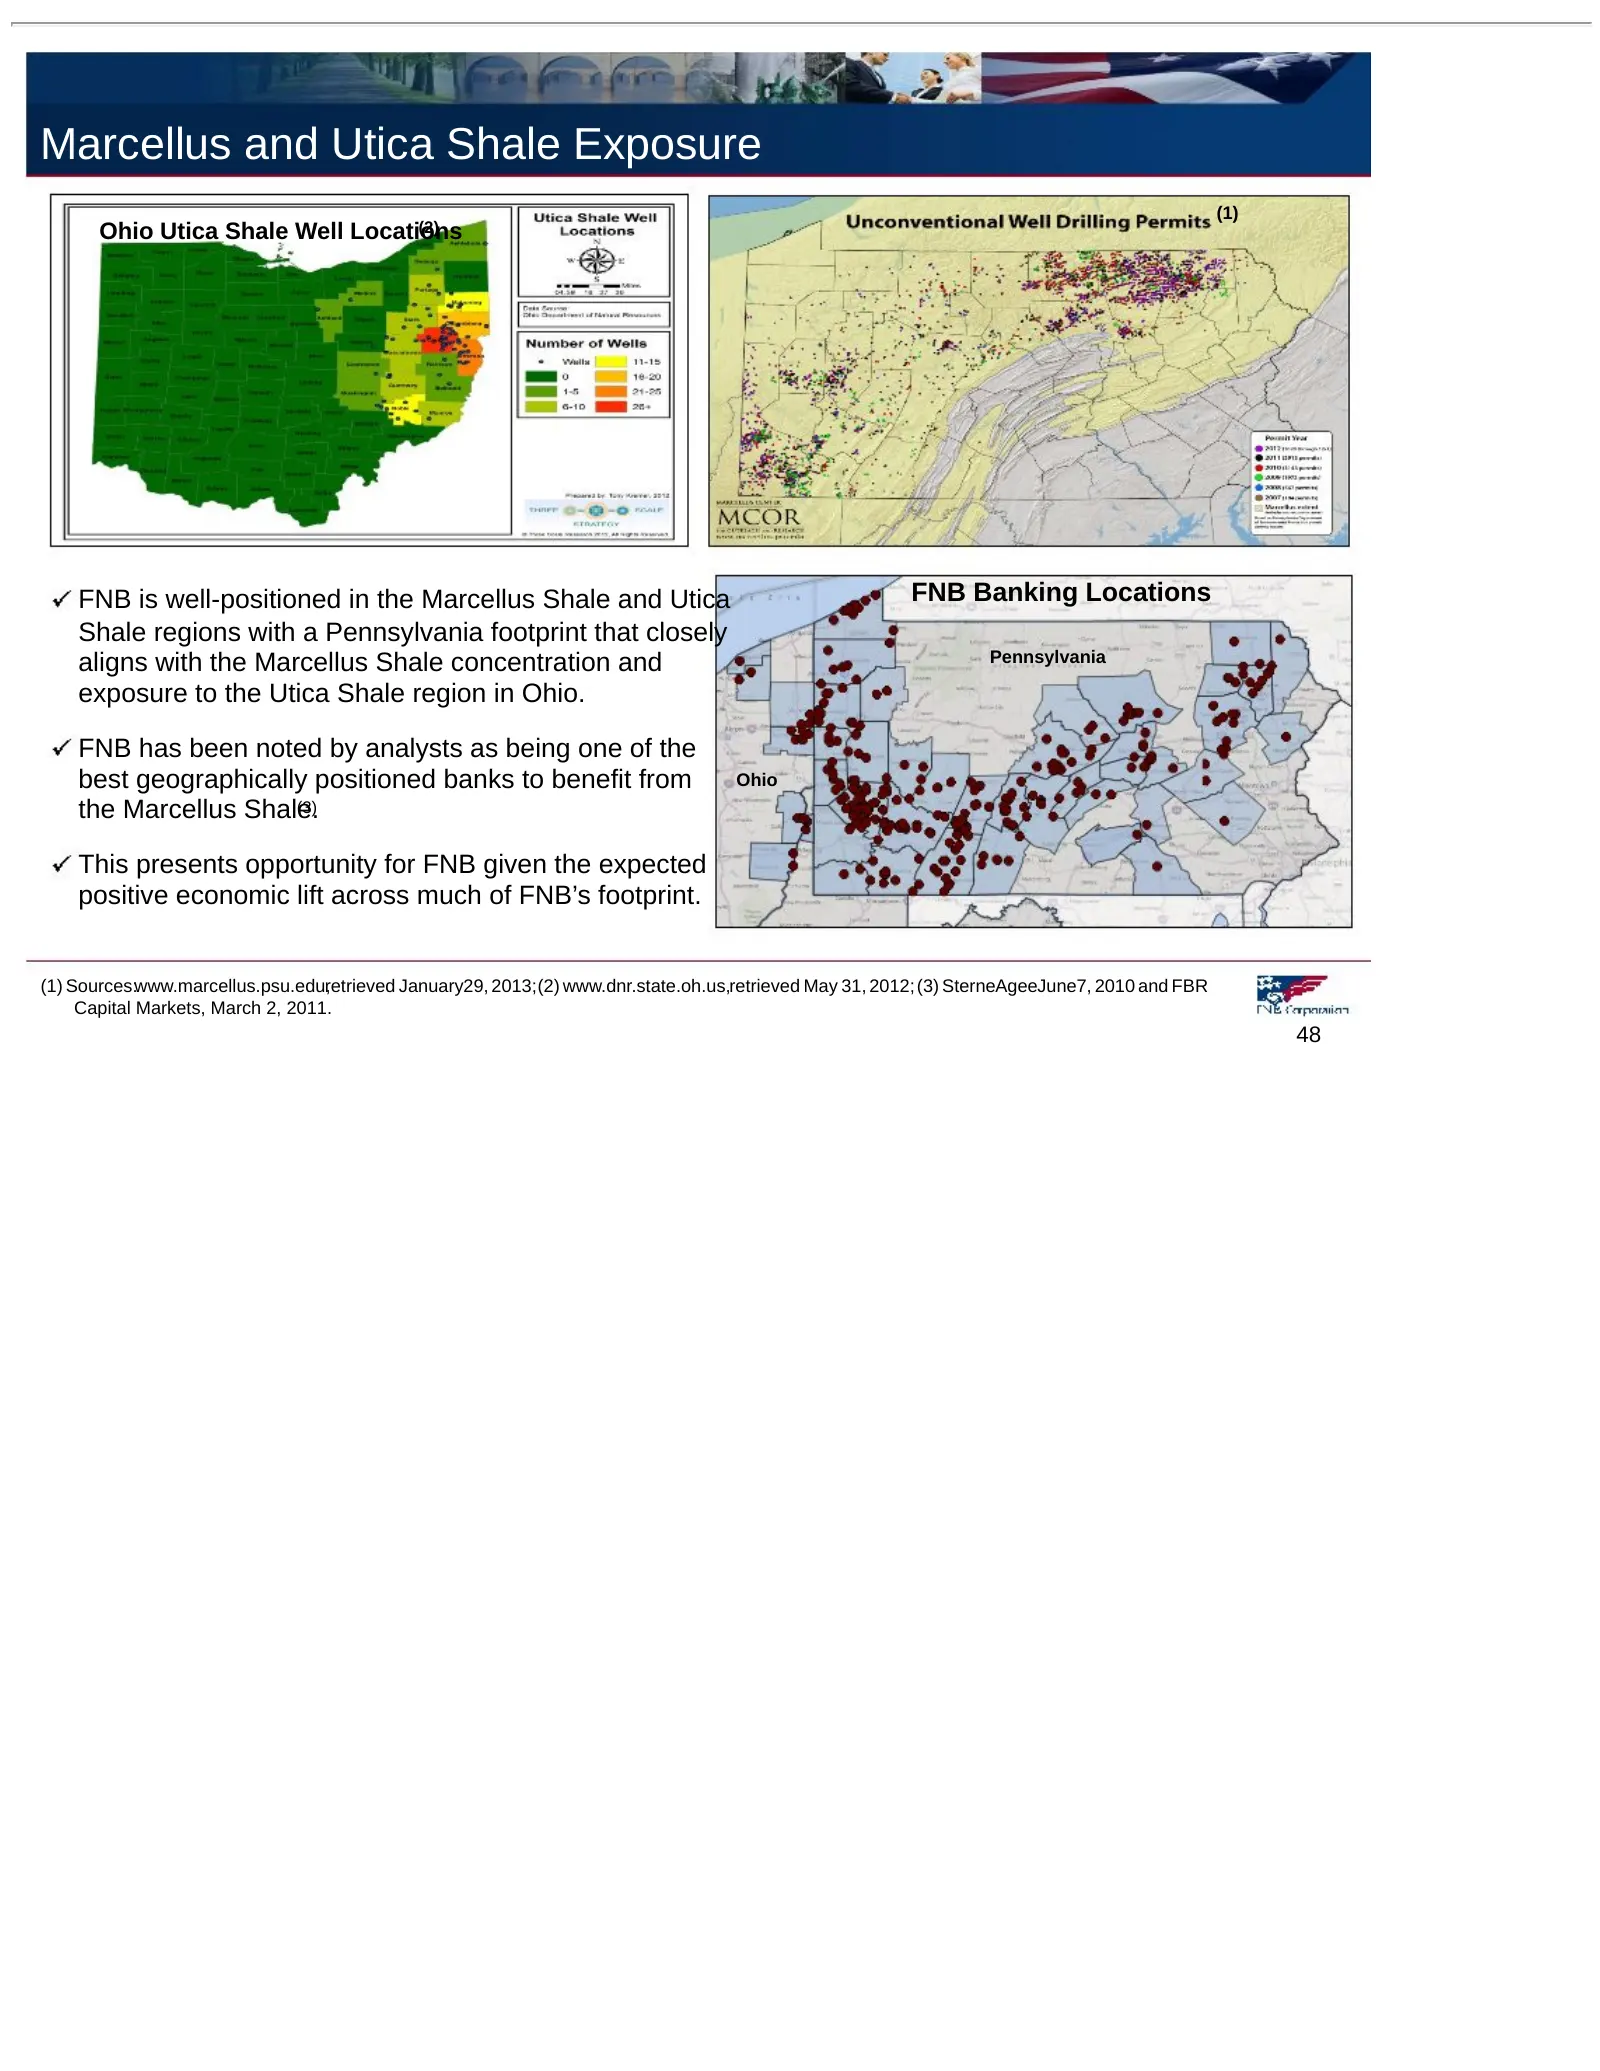
Marcellus and Utica Shale Exposure (1) Ohio Utica Shale Well Locations (2) FNB is well-positioned in the Marcellus Shale and Utica FNB Banking Locations Shale regions with a Pennsylvania footprint that closely aligns with the Marcellus Shale concentration and Pennsylvania exposure to the Utica Shale
Slide 49: Marcellus and Utica Shale FNB Strategic Focus
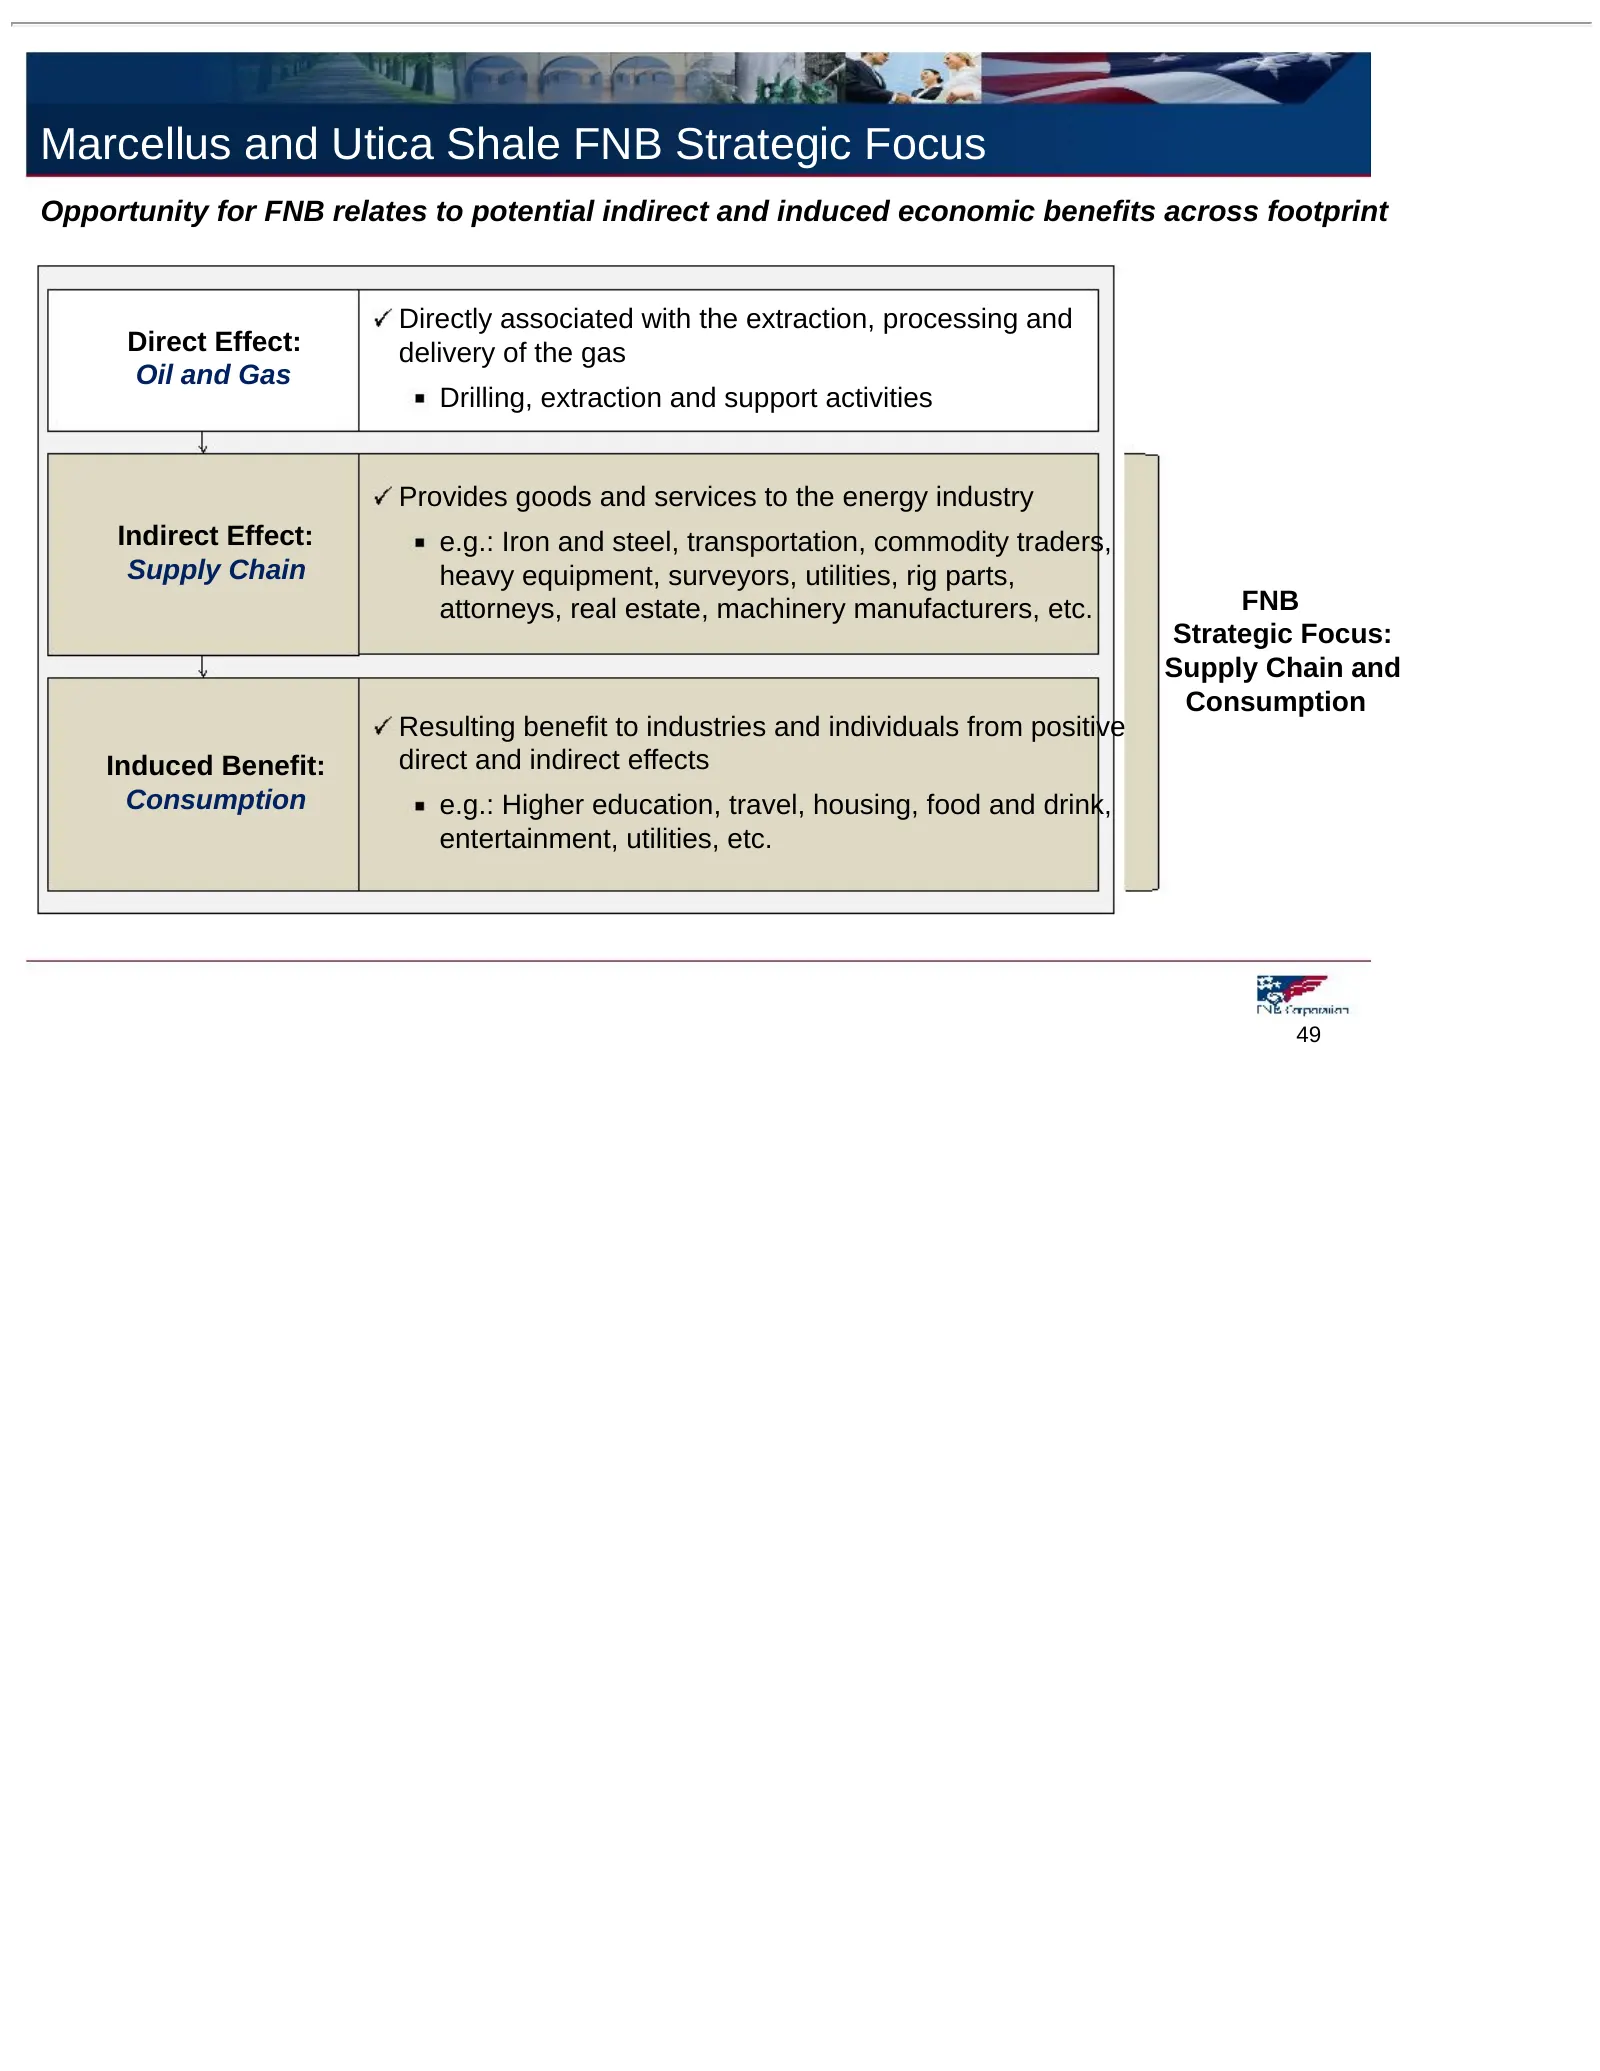
Marcellus and Utica Shale FNB Strategic Focus Opportunity for FNB relates to potential indirect and induced economic benefits across footprint Directly associated with the extraction, processing and Direct Effect: delivery of the gas Oil and Gas Drilling, extraction and support activities Provides g
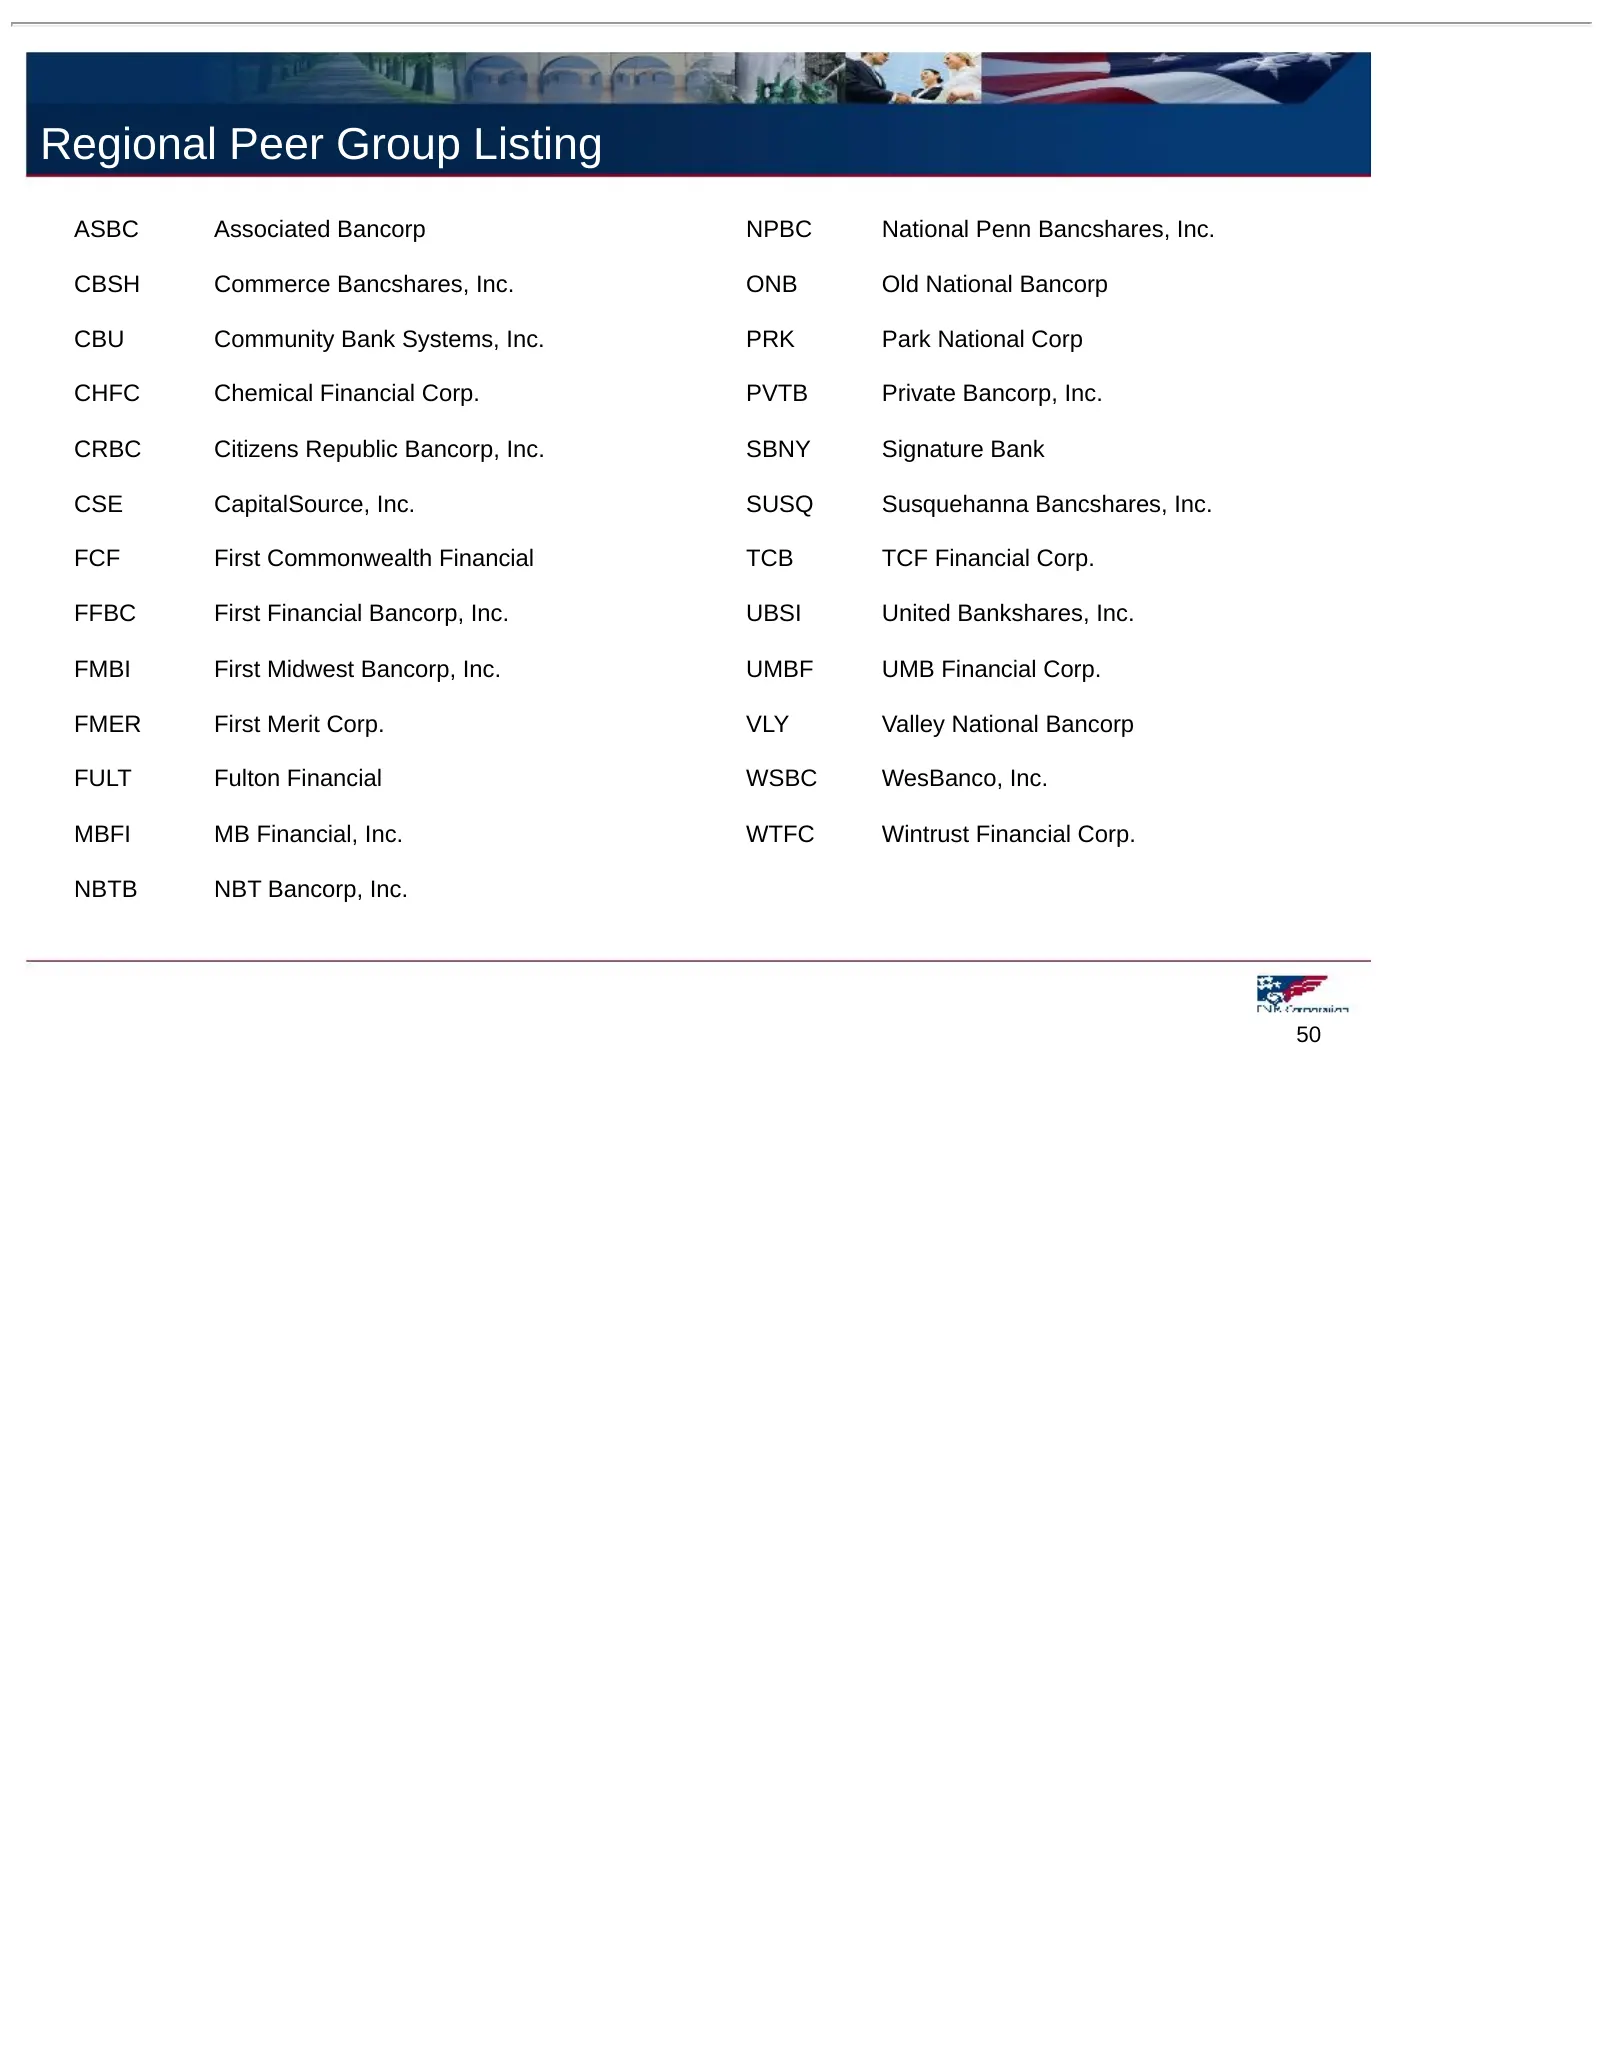
Slide 50: Regional Peer Group Listing
Regional Peer Group Listing ASBC Associated Bancorp NPBC National Penn Bancshares, Inc. CBSH Commerce Bancshares, Inc. ONB Old National Bancorp CBU Community Bank Systems, Inc. PRK Park National Corp CHFC Chemical Financial Corp. PVTB Private Bancorp, Inc. CRBC Citizens Republic Bancorp, Inc. SBNY S
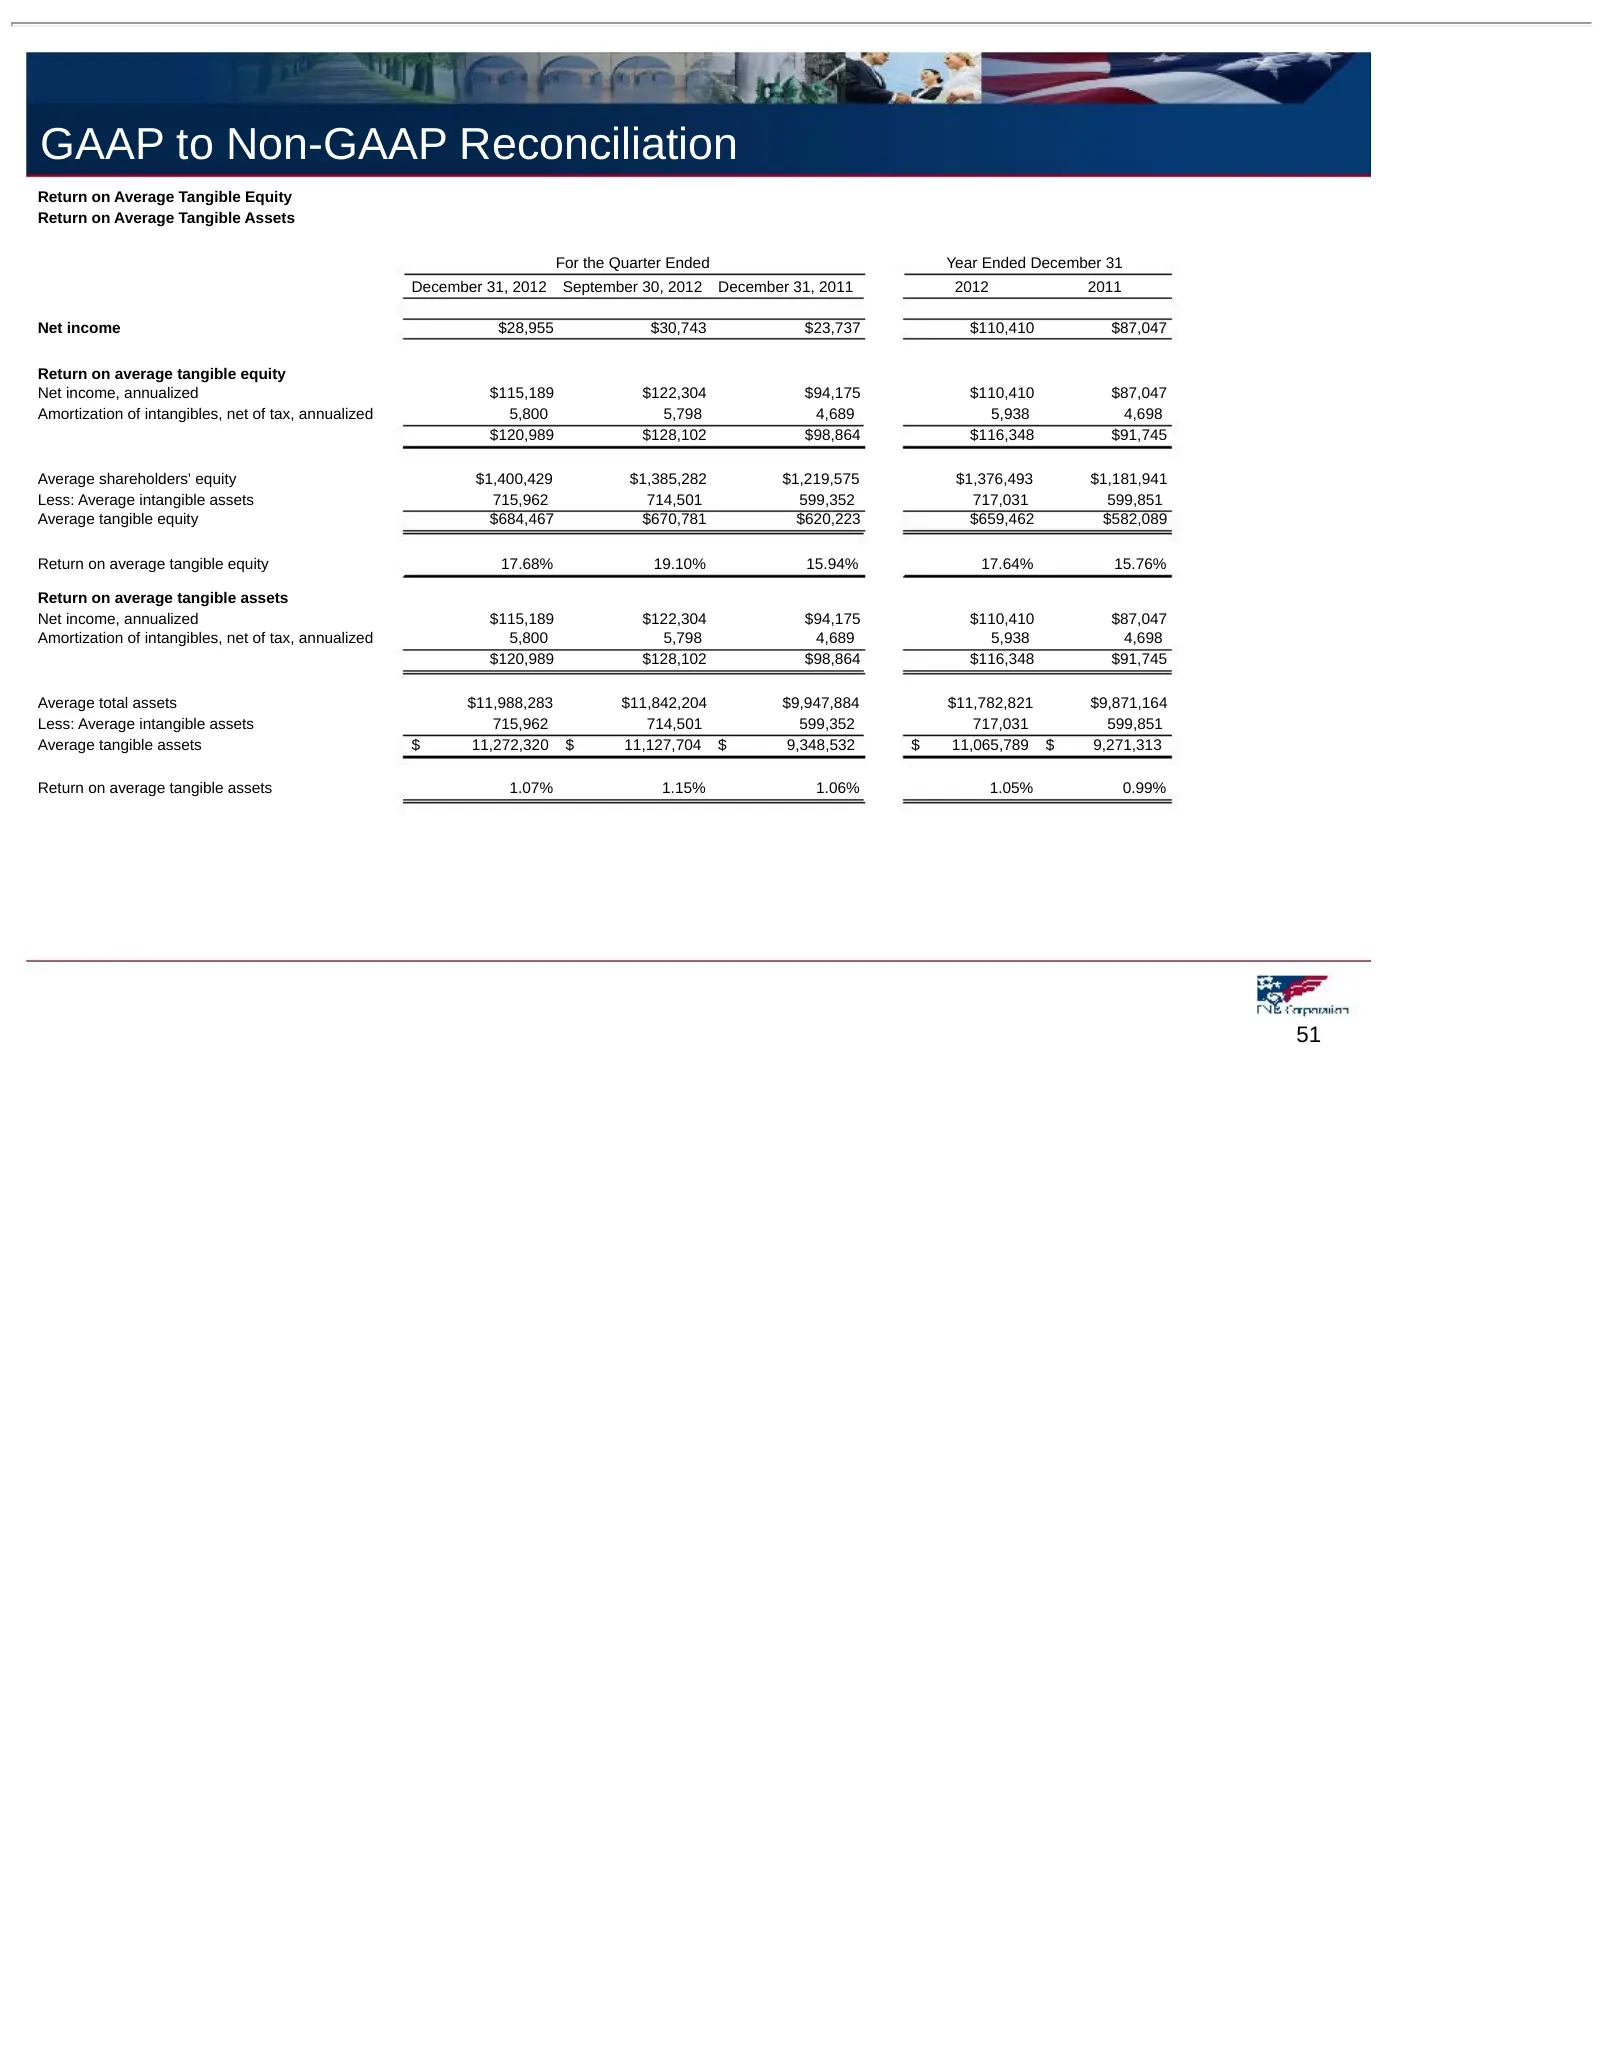
Slide 51: GAAP to Non-GAAP Reconciliation
GAAP to Non-GAAP Reconciliation Return on Average Tangible Equity Return on Average Tangible Assets For the Quarter Ended Year Ended December 31 December 31, 2012 September 30, 2012 December 31, 2011 2012 2011 Net income $28,955 $30,743 $23,737 $110,410 $87,047 Return on average tangible equity Net
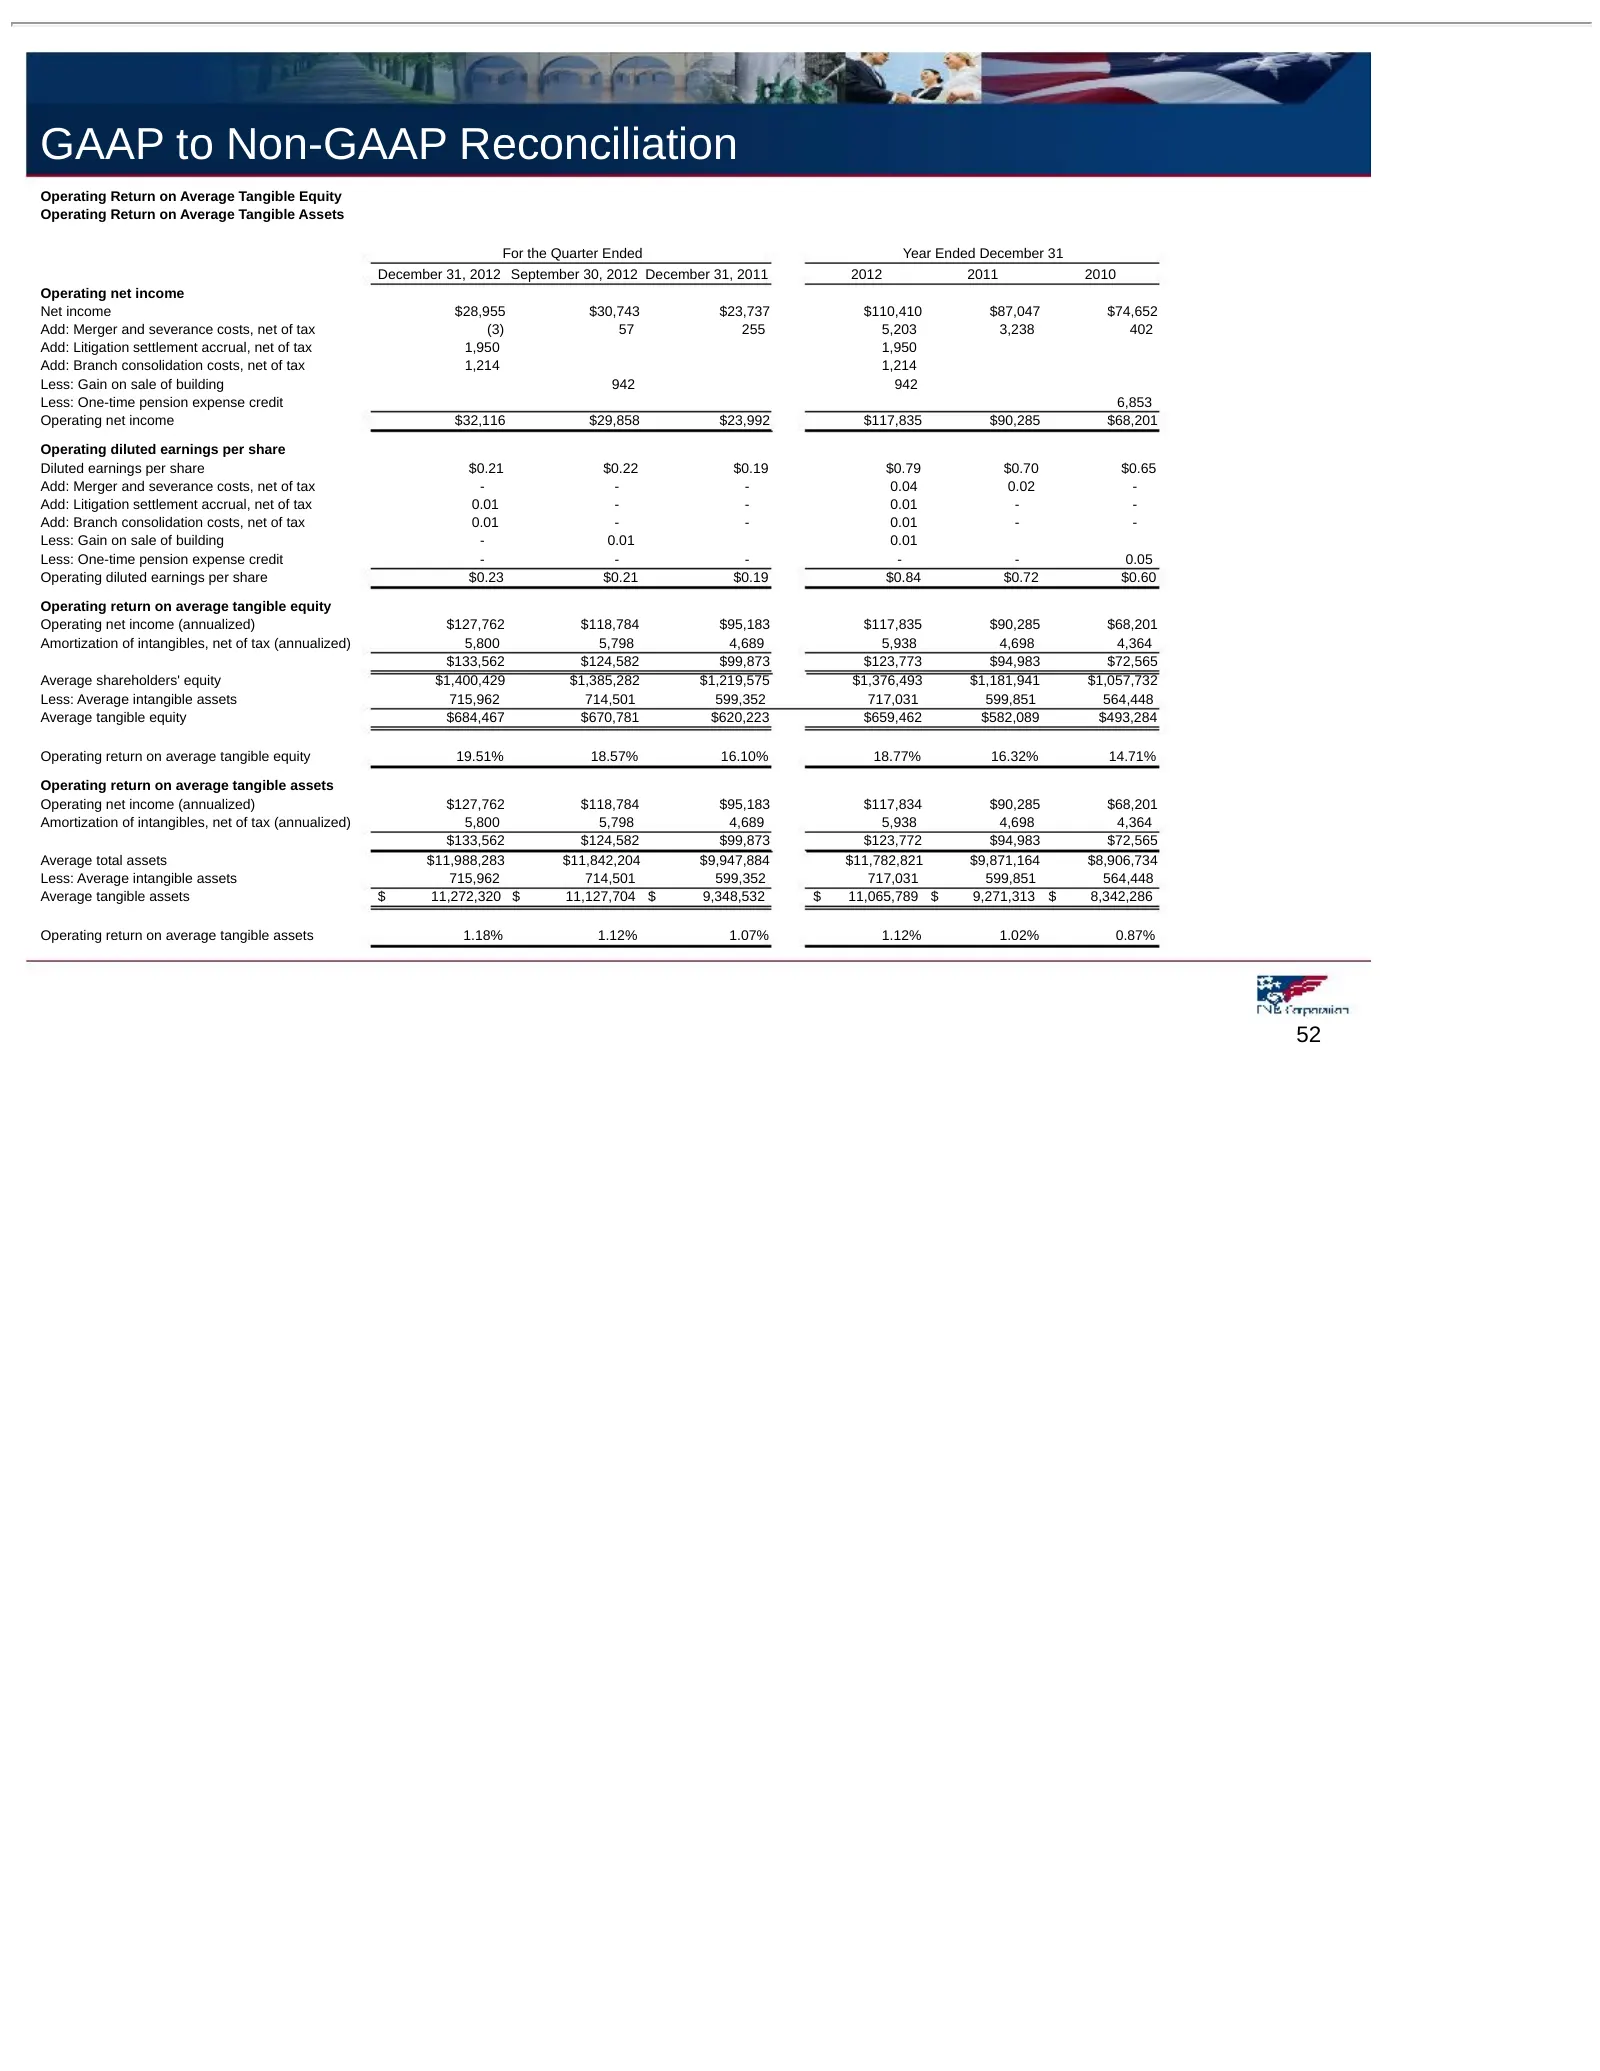
Slide 52: GAAP to Non-GAAP Reconciliation
GAAP to Non-GAAP Reconciliation Operating Return on Average Tangible Equity Operating Return on Average Tangible Assets For the Quarter Ended Year Ended December 31 December 31, 2012 September 30, 2012 December 31, 2011 2012 2011 2010 Operating net income Net income $28,955 $30,743 $23,737 $110,410
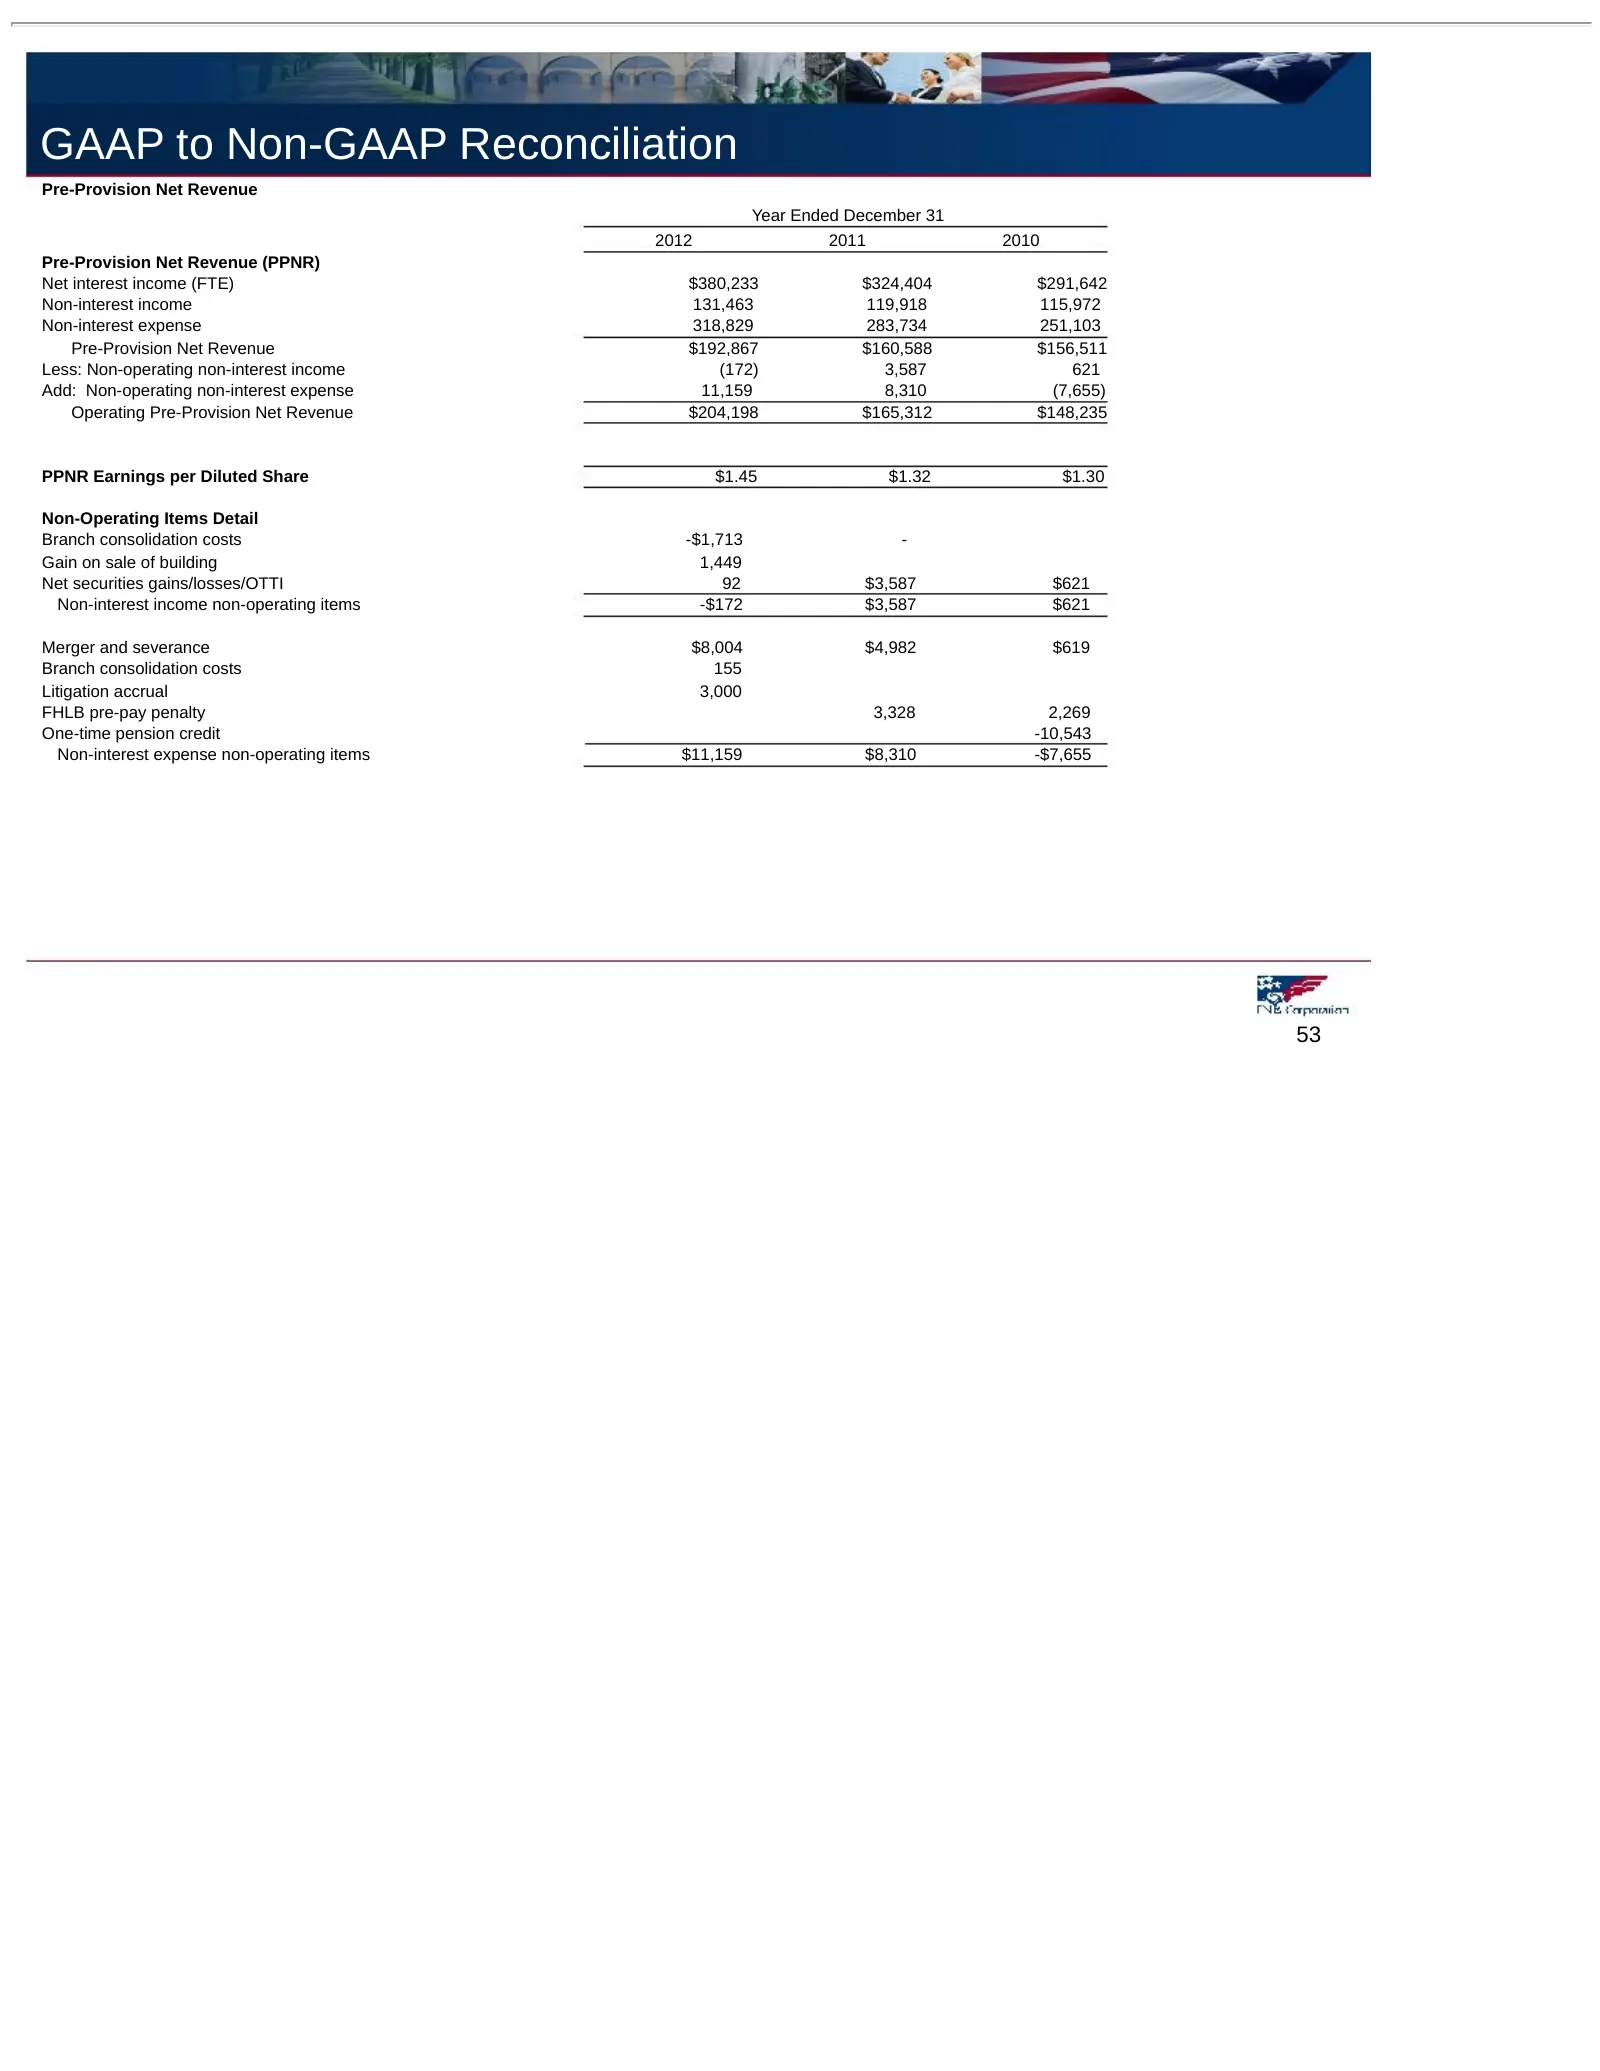
Slide 53: GAAP to Non-GAAP Reconciliation
GAAP to Non-GAAP Reconciliation Pre-Provision Net Revenue Year Ended December 31 2012 2011 2010 Pre-Provision Net Revenue (PPNR) Net interest income (FTE) $380,233 $324,404 $291,642 Non-interest income 131,463 119,918 115,972 Non-interest expense 318,829 283,734 251,103 Pre-Provision Net Revenue $19
Source: SEC EDGAR · 425 filed Feb 27, 2013