Copano Energy L.L.C — Investor Presentation (March 2008)
31 slides from Copano Energy L.L.C's investor presentation, Mar 5, 2008
Slide 1: Copano Energy Investor Presentation
Copano Energy NASDAQ: CPNO Investor Presentation March 2008
Slide 2: Disclaimer
Disclaimer Statements made by representatives of Copano Energy, L.L.C. (the "Company") during this presentation may constitute "forward-looking statements" as defined by the Securities and Exchange Commission. All statements, other than statements of historical facts, made by representatives of the
Slide 3: Introduction to Copano Energy, L.L.C.
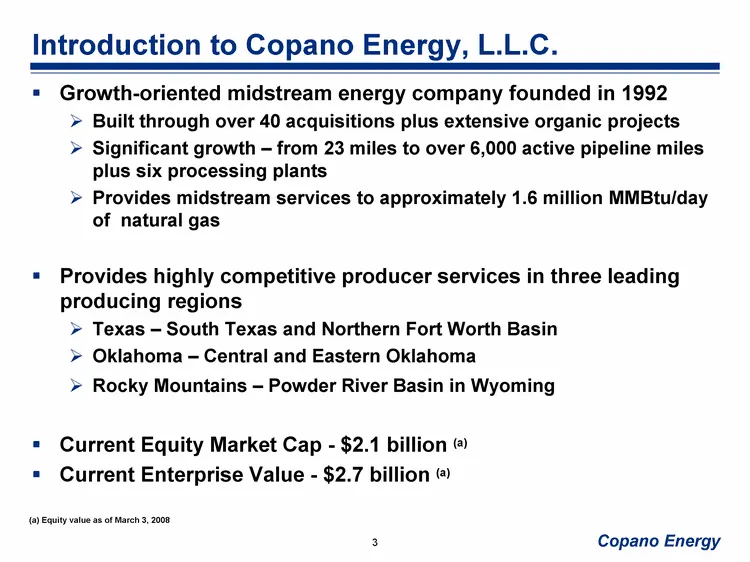
Introduction to Copano Energy, L.L.C. Growth-oriented midstream energy company founded in 1992 Built through over 40 acquisitions plus extensive organic projects Significant growth - from 23 miles to over 6,000 active pipeline miles plus six processing plants Provides midstream services to approxima
Slide 4: Copano Assets
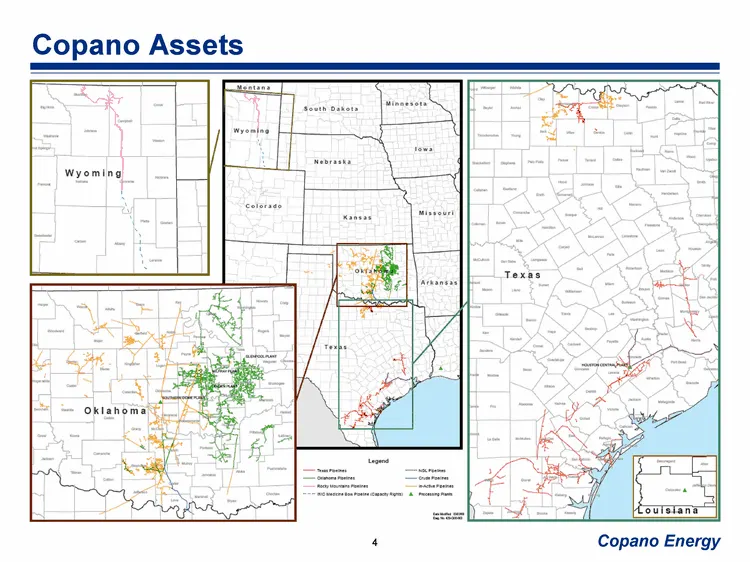
Copano Assets 4 Copano Energy
Slide 5: Copano's LLC Structure & Benefits
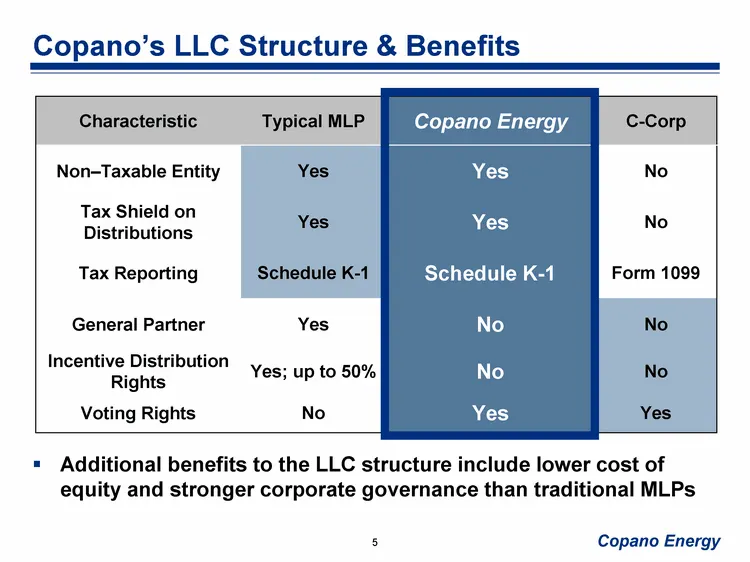
Copano's LLC Structure & Benefits Characteristic Typical MLP Copano Energy C-Corp Non-Taxable Entity Yes Yes No Tax Shield on Distributions Yes Yes No Tax Reporting Schedule K-1 Schedule K-1 Form 1099 General Partner Yes No No Incentive Distribution Rights Yes; up to 50% No No Voting Rights No Yes Y
Slide 6: CPNO Distributions vs. Typical MLP
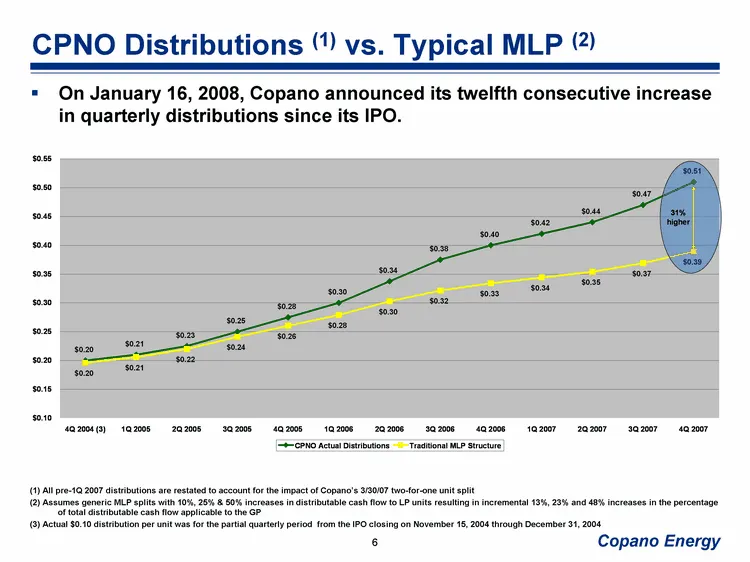
CPNO Distributions (1) vs. Typical MLP (2) (1) All pre-1Q 2007 distributions are restated to account for the impact of Copano's 3/30/07 two-for-one unit split (2) Assumes generic MLP splits with 10%, 25% & 50% increases in distributable cash flow to LP units resulting in incremental 13%, 23% and 48%
Slide 7: General Partner Incentive Distribution Loads
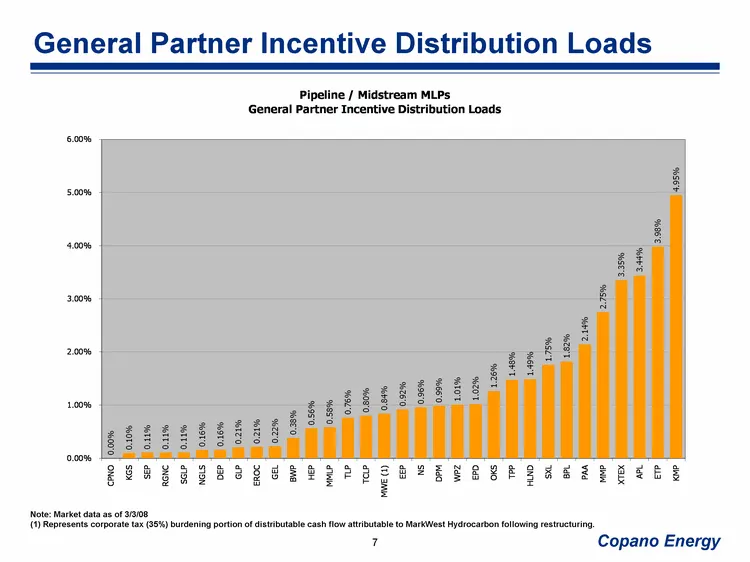
General Partner Incentive Distribution Loads Note: Market data as of 3/3/08 (1) Represents corporate tax (35%) burdening portion of distributable cash flow attributable to MarkWest Hydrocarbon following restructuring.
Slide 8: Total Return Performance
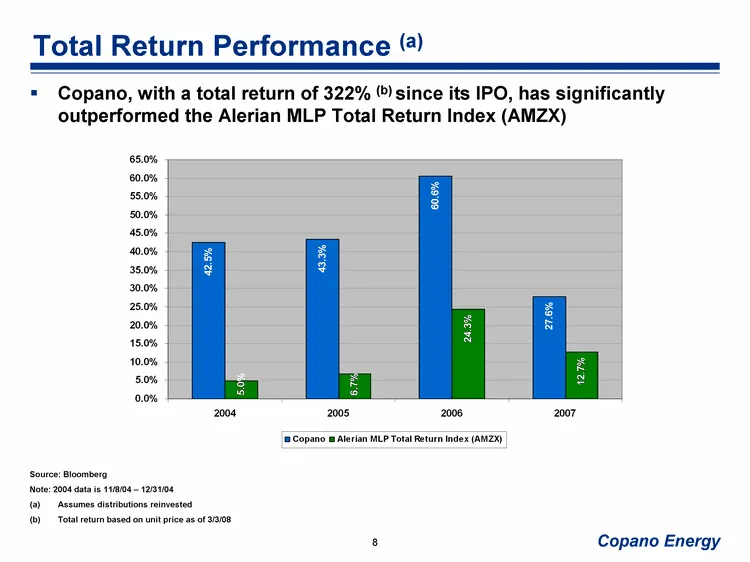
Total Return Performance (a) Copano, with a total return of 322% (b) since its IPO, has significantly outperformed the Alerian MLP Total Return Index (AMZX) Source: Bloomberg Note: 2004 data is 11/8/04 - 12/31/04 Assumes distributions reinvested Total return based on unit price as of 3/3/08
Slide 9: Comparative Distribution Yield
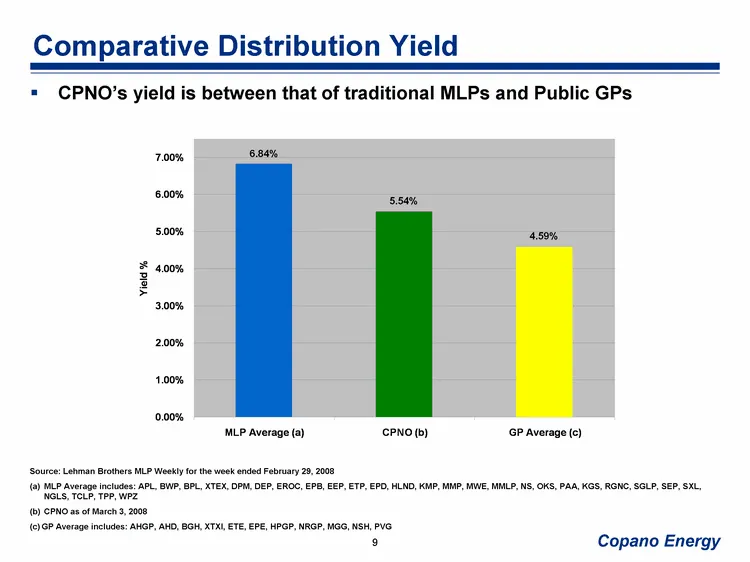
Comparative Distribution Yield CPNO's yield is between that of traditional MLPs and Public GPs Source: Lehman Brothers MLP Weekly for the week ended February 29, 2008 MLP Average includes: APL, BWP, BPL, XTEX, DPM, DEP, EROC, EPB, EEP, ETP, EPD, HLND, KMP, MMP, MWE, MMLP, NS, OKS, PAA, KGS, RGNC, SG
Slide 10: Business Strategy
Business Strategy
Slide 11: Business Strategy
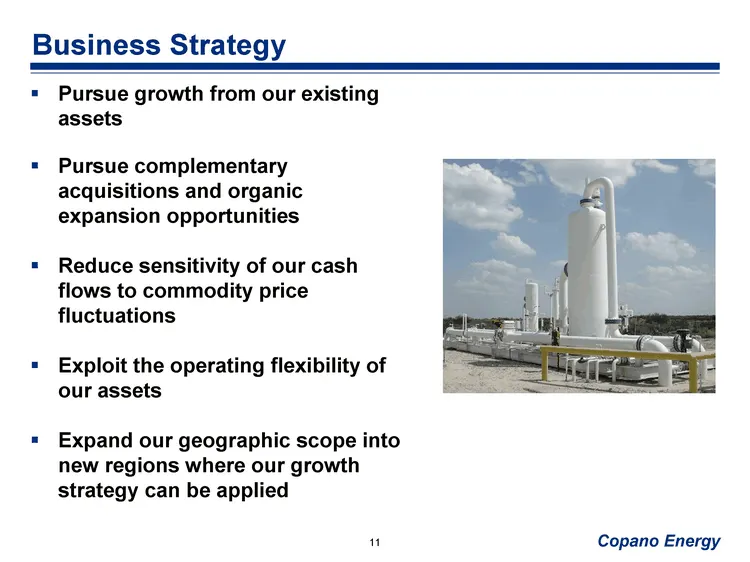
Business Strategy Pursue growth from our existing assets Pursue complementary acquisitions and organic expansion opportunities Reduce sensitivity of our cash flows to commodity price fluctuations Exploit the operating flexibility of our assets Expand our geographic scope into new regions where our g
Slide 12: Oklahoma
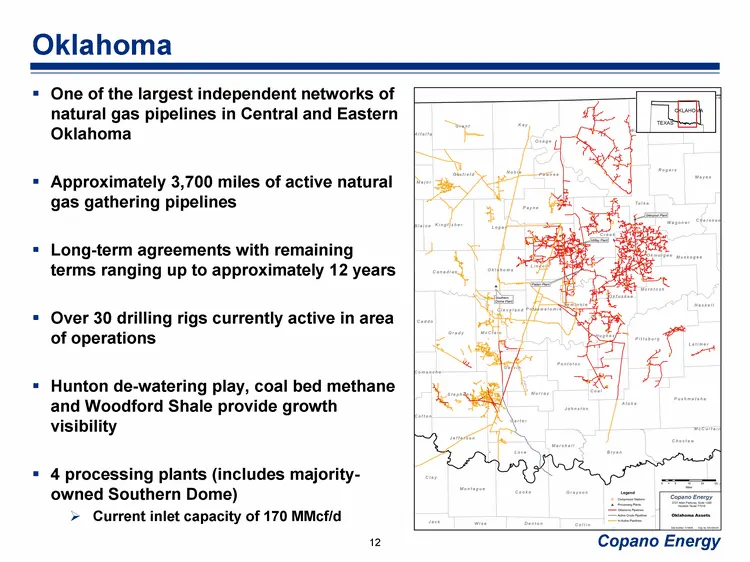
Oklahoma One of the largest independent networks of natural gas pipelines in Central and Eastern Oklahoma Approximately 3,700 miles of active natural gas gathering pipelines Long-term agreements with remaining terms ranging up to approximately 12 years Over 30 drilling rigs currently active in area
Slide 13: Texas
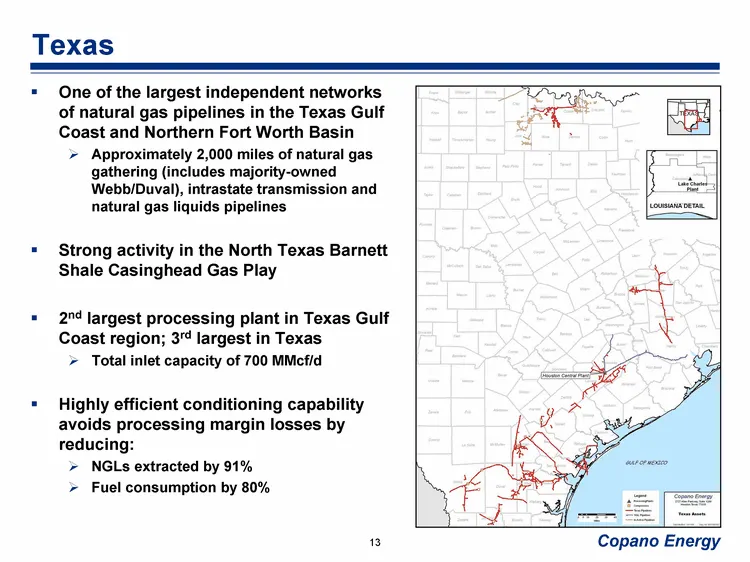
Texas One of the largest independent networks of natural gas pipelines in the Texas Gulf Coast and Northern Fort Worth Basin Approximately 2,000 miles of natural gas gathering (includes majority-owned Webb/Duval), intrastate transmission and natural gas liquids pipelines Strong activity in the North
Slide 14: Rocky Mountains
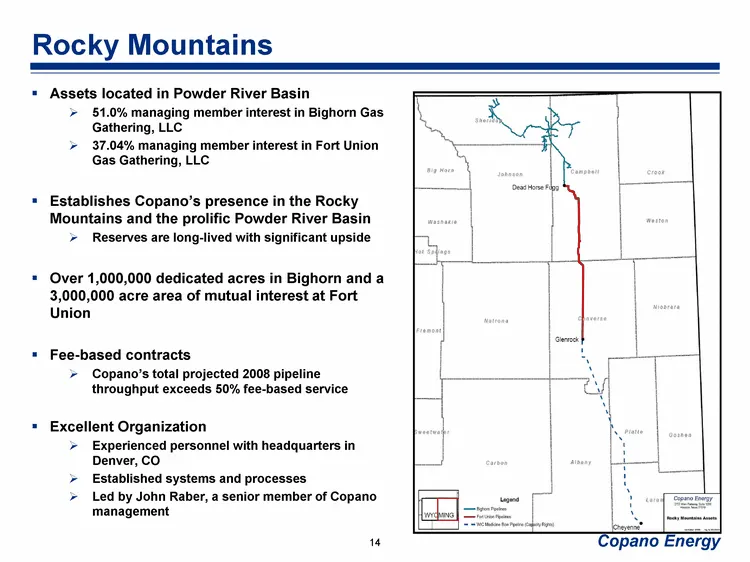
Rocky Mountains Assets located in Powder River Basin 51.0% managing member interest in Bighorn Gas Gathering, LLC 37.04% managing member interest in Fort Union Gas Gathering, LLC Establishes Copano's presence in the Rocky Mountains and the prolific Powder River Basin Reserves are long-lived with sig
Slide 15: Impact of Resource Play Gas in Strategic Acquisitions
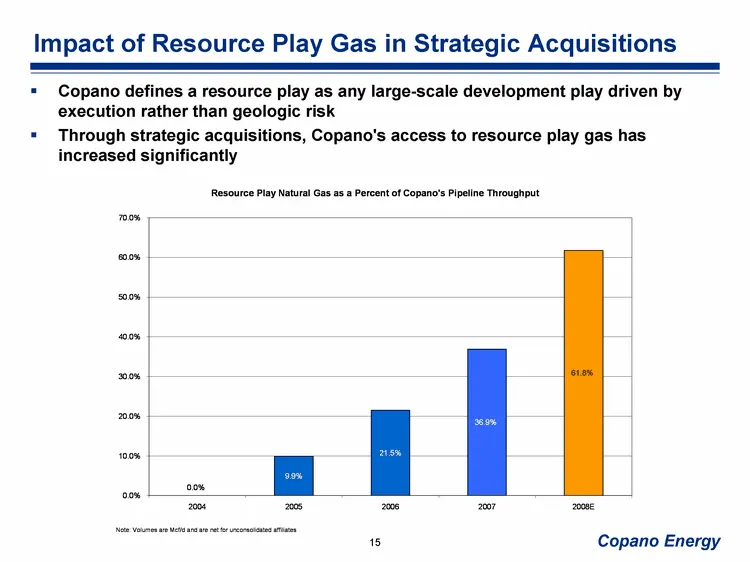
Impact of Resource Play Gas in Strategic Acquisitions Copano defines a resource play as any large-scale development play driven by execution rather than geologic risk Through strategic acquisitions, Copano's access to resource play gas has increased significantly
Slide 16: Copano's Natural Gas Resource Plays
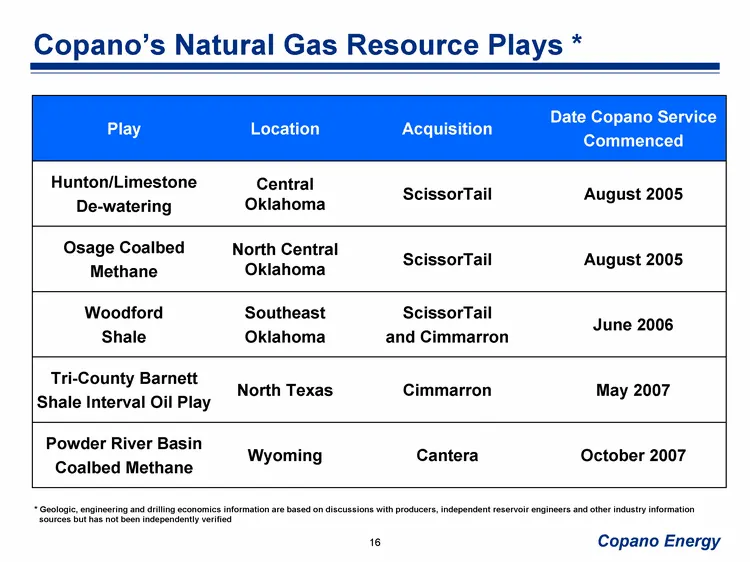
Copano's Natural Gas Resource Plays * Play Location Acquisition Date Copano Service Commenced Hunton/Limestone De-watering Central Oklahoma ScissorTail August 2005 Osage Coalbed Methane North Central Oklahoma ScissorTail August 2005 Woodford Shale Southeast Oklahoma ScissorTail and Cimmarron June 20
Slide 17: Hunton/Limestone De-watering
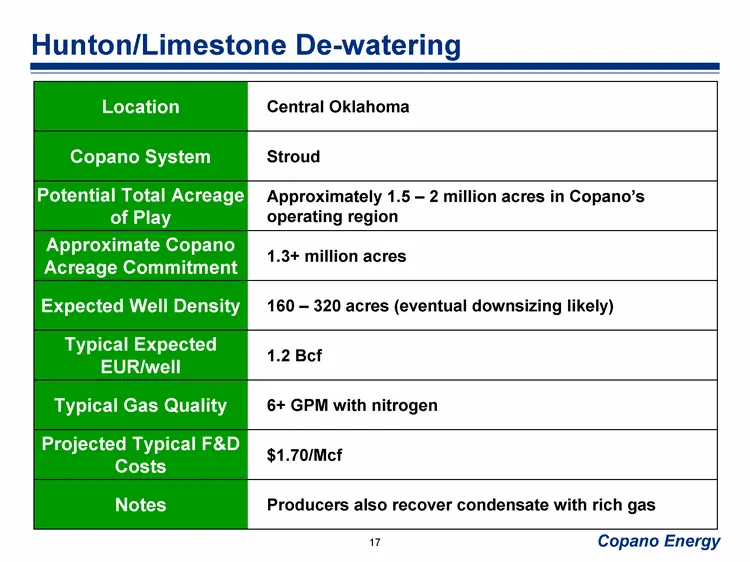
Hunton/Limestone De-watering Location Central Oklahoma Copano System Stroud Potential Total Acreage of Play Approximately 1.5 - 2 million acres in Copano's operating region Approximate Copano Acreage Commitment 1.3+ million acres Expected Well Density 160 - 320 acres (eventual downsizing likely) Typ
Slide 18: Powder River Basin Coalbed Methane
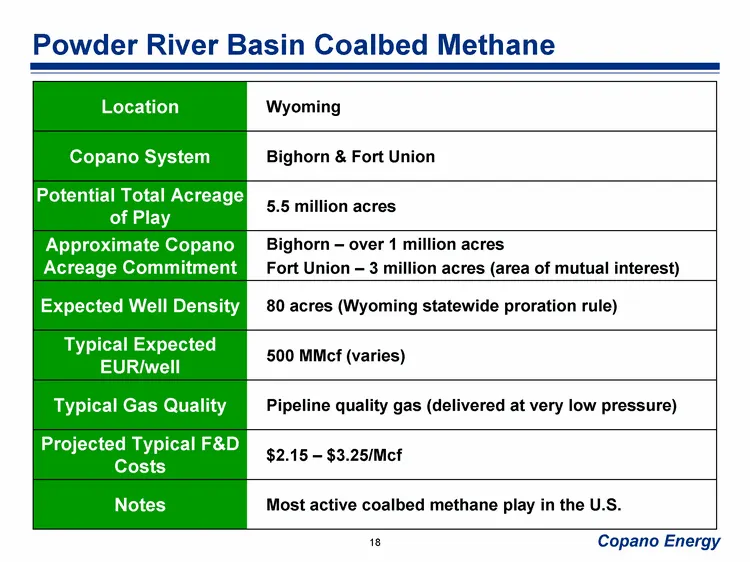
Powder River Basin Coalbed Methane Location Wyoming Copano System Bighorn & Fort Union Potential Total Acreage of Play 5.5 million acres Approximate Copano Acreage Commitment Bighorn - over 1 million acres Fort Union - 3 million acres (area of mutual interest) Expected Well Density 80 acres (Wyoming
Slide 19: Organic Growth & Bolt-on Capital Spending
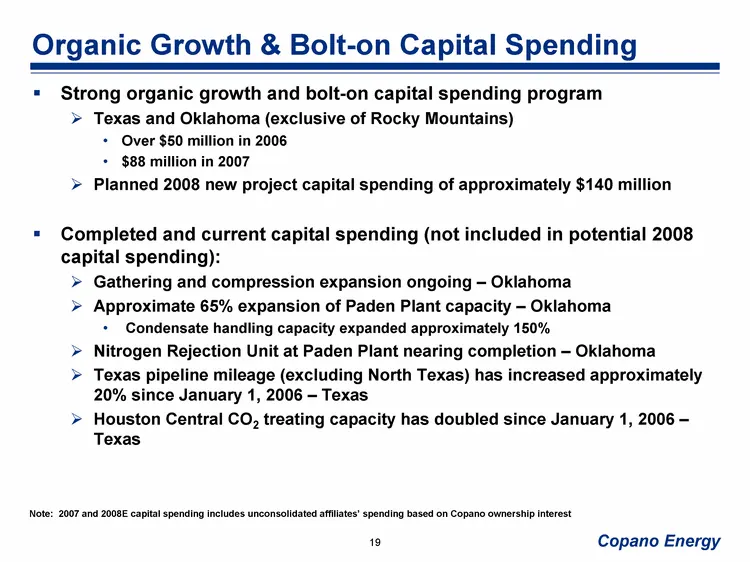
Organic Growth & Bolt-on Capital Spending Strong organic growth and bolt-on capital spending program Texas and Oklahoma (exclusive of Rocky Mountains) Over $50 million in 2006 $88 million in 2007 Planned 2008 new project capital spending of approximately $140 million Completed and current capital sp
Slide 20: Hedging Program and Risk Management
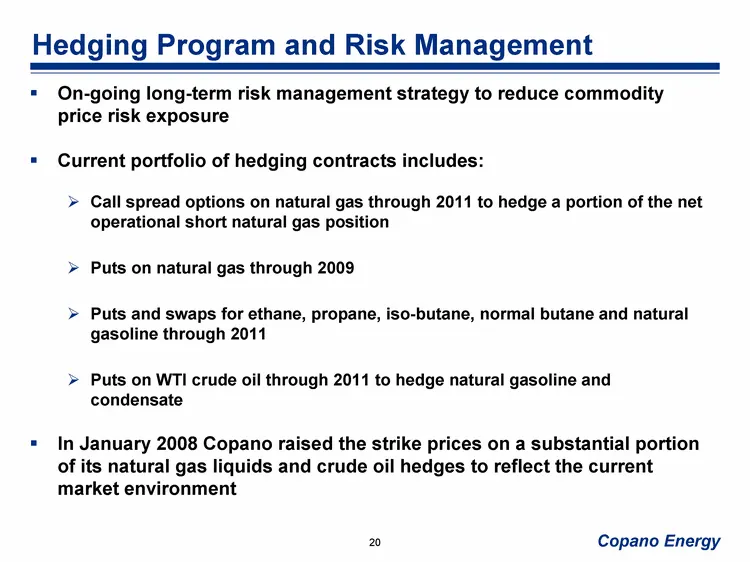
Hedging Program and Risk Management On-going long-term risk management strategy to reduce commodity price risk exposure Current portfolio of hedging contracts includes: Call spread options on natural gas through 2011 to hedge a portion of the net operational short natural gas position Puts on natura

Slide 21: Financial Information
Financial Information
Slide 22: Financial Policy
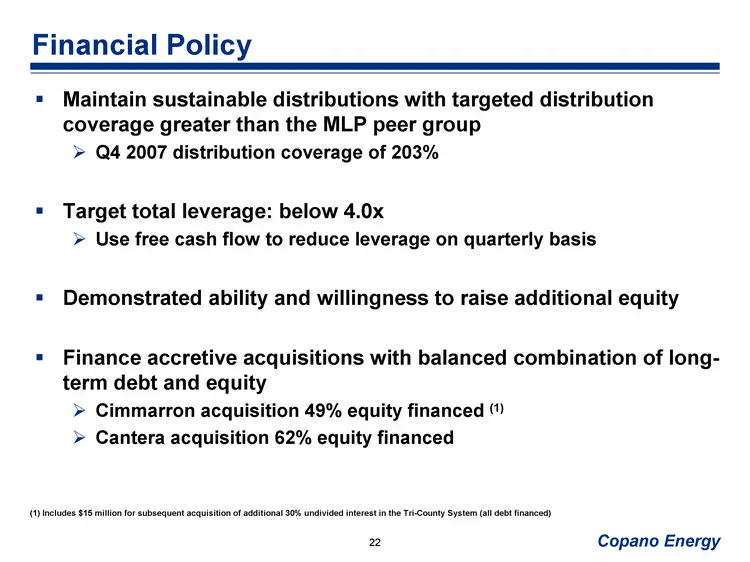
Financial Policy Maintain sustainable distributions with targeted distribution coverage greater than the MLP peer group Q4 2007 distribution coverage of 203% Target total leverage: below 4.0x Use free cash flow to reduce leverage on quarterly basis Demonstrated ability and willingness to raise addit
Slide 23: Financial Structure
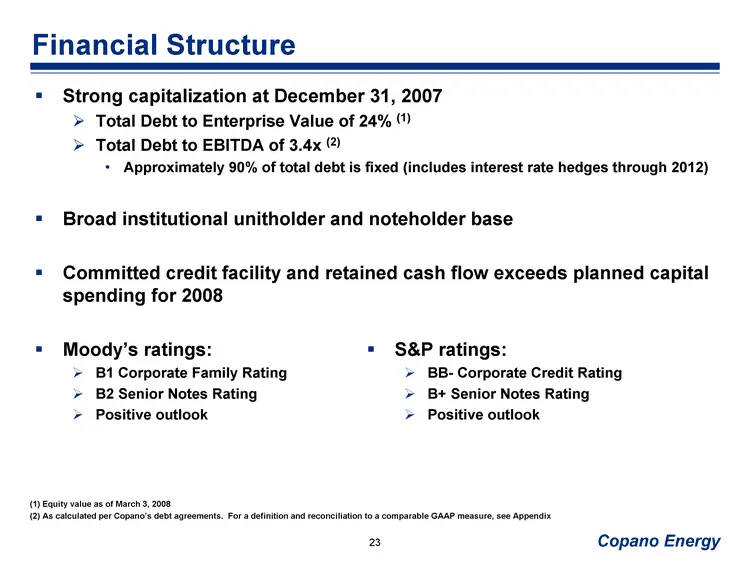
Financial Structure Strong capitalization at December 31, 2007 Total Debt to Enterprise Value of 24% (1) Total Debt to EBITDA of 3.4x (2) Approximately 90% of total debt is fixed (includes interest rate hedges through 2012) Broad institutional unitholder and noteholder base Committed credit facility
Slide 24: Experienced Management Team and Board of Directors
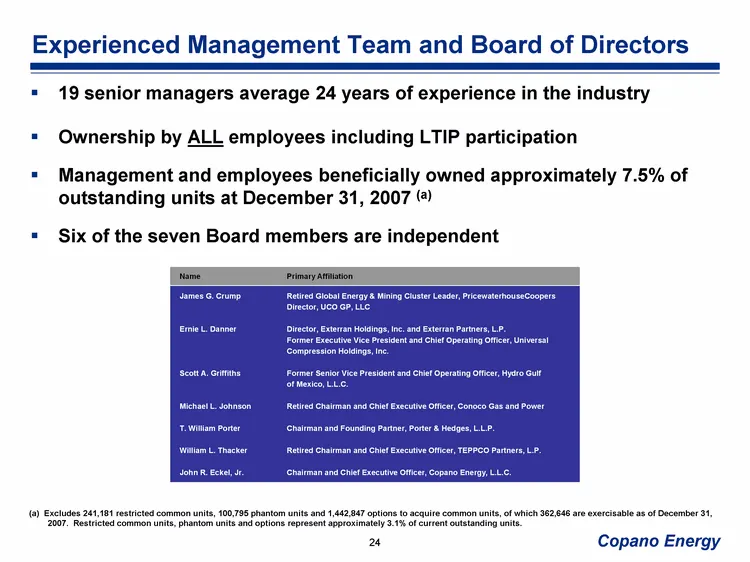
Experienced Management Team and Board of Directors 19 senior managers average 24 years of experience in the industry Ownership by ALL employees including LTIP participation Management and employees beneficially owned approximately 7.5% of outstanding units at December 31, 2007 (a) Six of the seven B
Slide 25: Total Segment Gross Margin
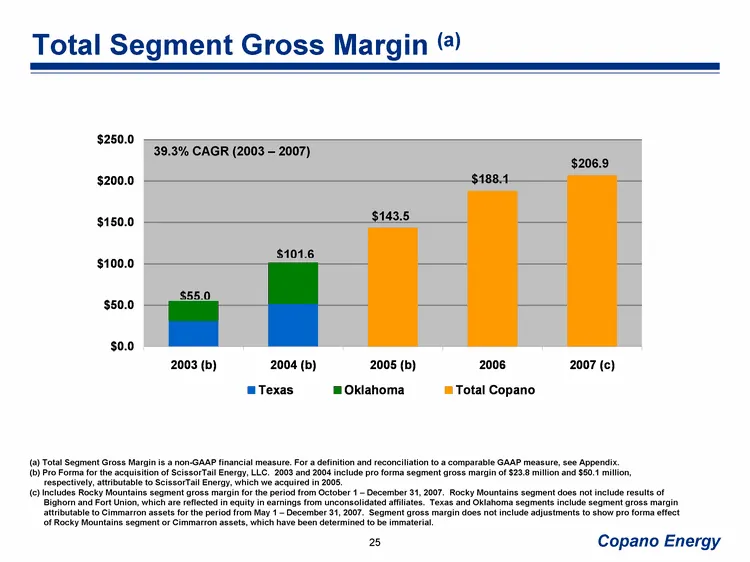
39.3% CAGR (2003 - 2007) Total Segment Gross Margin (a) (a) Total Segment Gross Margin is a non-GAAP financial measure. For a definition and reconciliation to a comparable GAAP measure, see Appendix. (b) Pro Forma for the acquisition of ScissorTail Energy, LLC. 2003 and 2004 include pro forma segmen
Slide 26: Combined EBITDA and Adjusted EBITDA
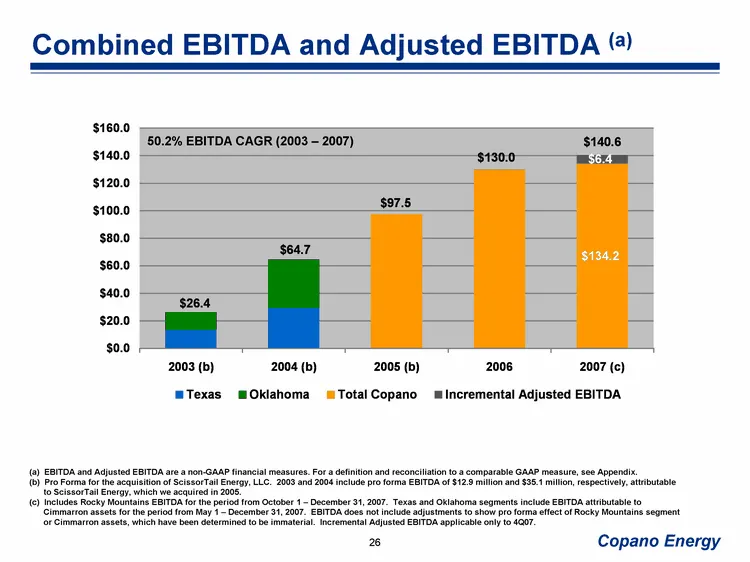
Combined EBITDA and Adjusted EBITDA (a) 50.2% EBITDA CAGR (2003 - 2007) (a) EBITDA and Adjusted EBITDA are a non-GAAP financial measures. For a definition and reconciliation to a comparable GAAP measure, see Appendix. (b) Pro Forma for the acquisition of ScissorTail Energy, LLC. 2003 and 2004 includ
Slide 27: Appendix
Appendix
Slide 28: Reconciliation of Non-GAAP Financial Measures: EBITDA
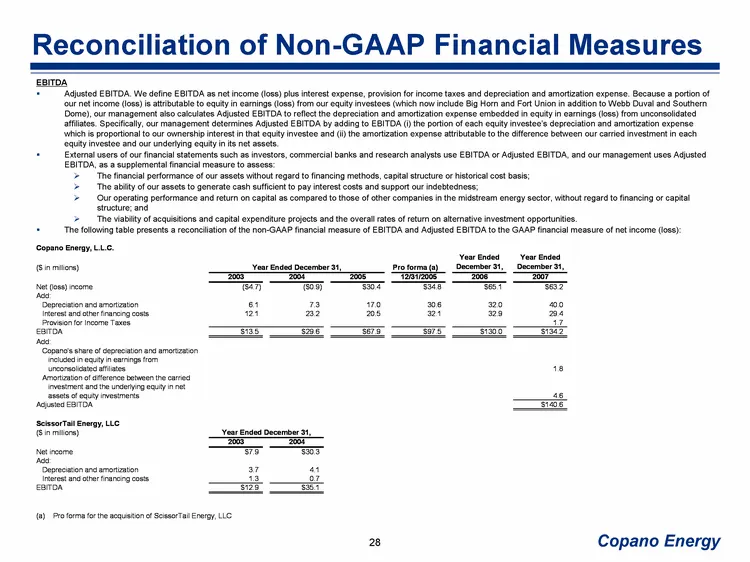
Reconciliation of Non-GAAP Financial Measures EBITDA Adjusted EBITDA. We define EBITDA as net income (loss) plus interest expense, provision for income taxes and depreciation and amortization expense. Because a portion of our net income (loss) is attributable to equity in earnings (loss) from our eq
Slide 29: Reconciliation of Non-GAAP Financial Measures: Consolidated EBITDA
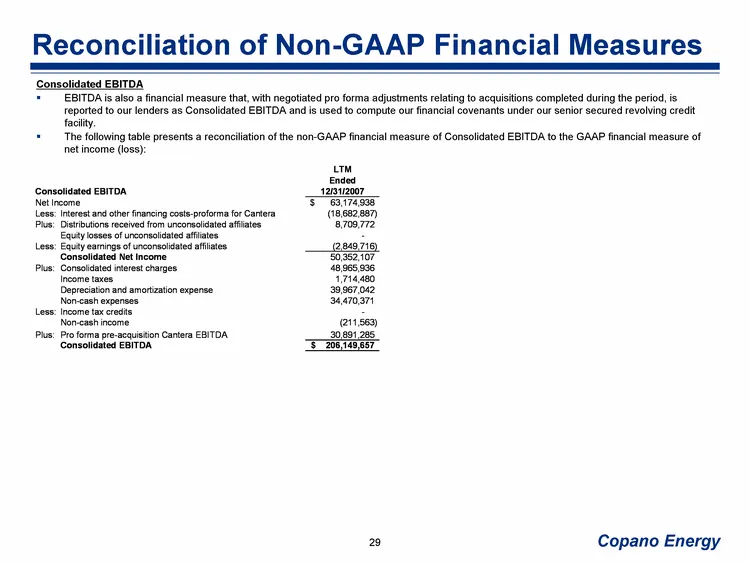
Reconciliation of Non-GAAP Financial Measures Consolidated EBITDA EBITDA is also a financial measure that, with negotiated pro forma adjustments relating to acquisitions completed during the period, is reported to our lenders as Consolidated EBITDA and is used to compute our financial covenants unde
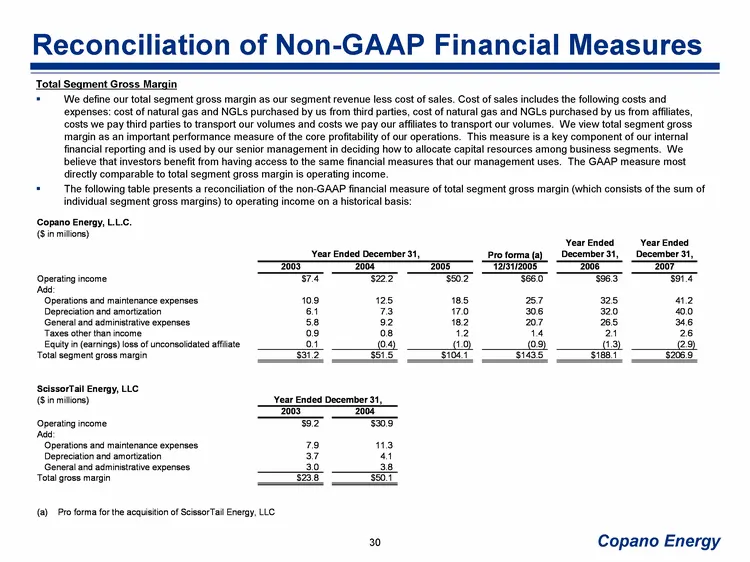
Slide 30: Reconciliation of Non-GAAP Financial Measures: Total Segment Gross Margin
Reconciliation of Non-GAAP Financial Measures Total Segment Gross Margin We define our total segment gross margin as our segment revenue less cost of sales. Cost of sales includes the following costs and expenses: cost of natural gas and NGLs purchased by us from third parties, cost of natural gas a
Slide 31: Copano Energy
Copano Energy NASDAQ: CPNO
Source: SEC EDGAR · 8-K filed Mar 5, 2008
More decks from Copano Energy L.L.C.
 2012 RBC Capital Markets MLP Conference35 slides · Nov 15, 2012
 2012 Citi One-on-One MLP/Midstream Infrastructure Conference35 slides · Aug 21, 2012
 Investor Presentation (June 2012)34 slides · Jun 18, 2012
 NAPTP 2012 MLP Investor Conference34 slides · May 22, 2012
 Morgan Stanley MLP and Diversified Natural Gas Corporate Access Day 201245 slides · Mar 7, 2012
 2011 RBC Capital Markets MLP Conference42 slides · Nov 17, 2011