Perion Network Ltd · NASDAQ:PERI
Perion Network — Q3 2015 Earnings Presentation
24 slides from Perion Network's earnings presentation, November 2015

Slide 1: Investor Presentation
Investor Presentation November 2015 Confidential
Slide 2: Forward Looking Statements
Forward Looking Statements This presentation contains historical information and forward-looking statements within the meaning of The Private Securities Litigation Reform Act of 1995 with respect to the business, financial condition and results of operations of Perion. The words “will”, “believe,” “
Slide 3: What Do We Do?
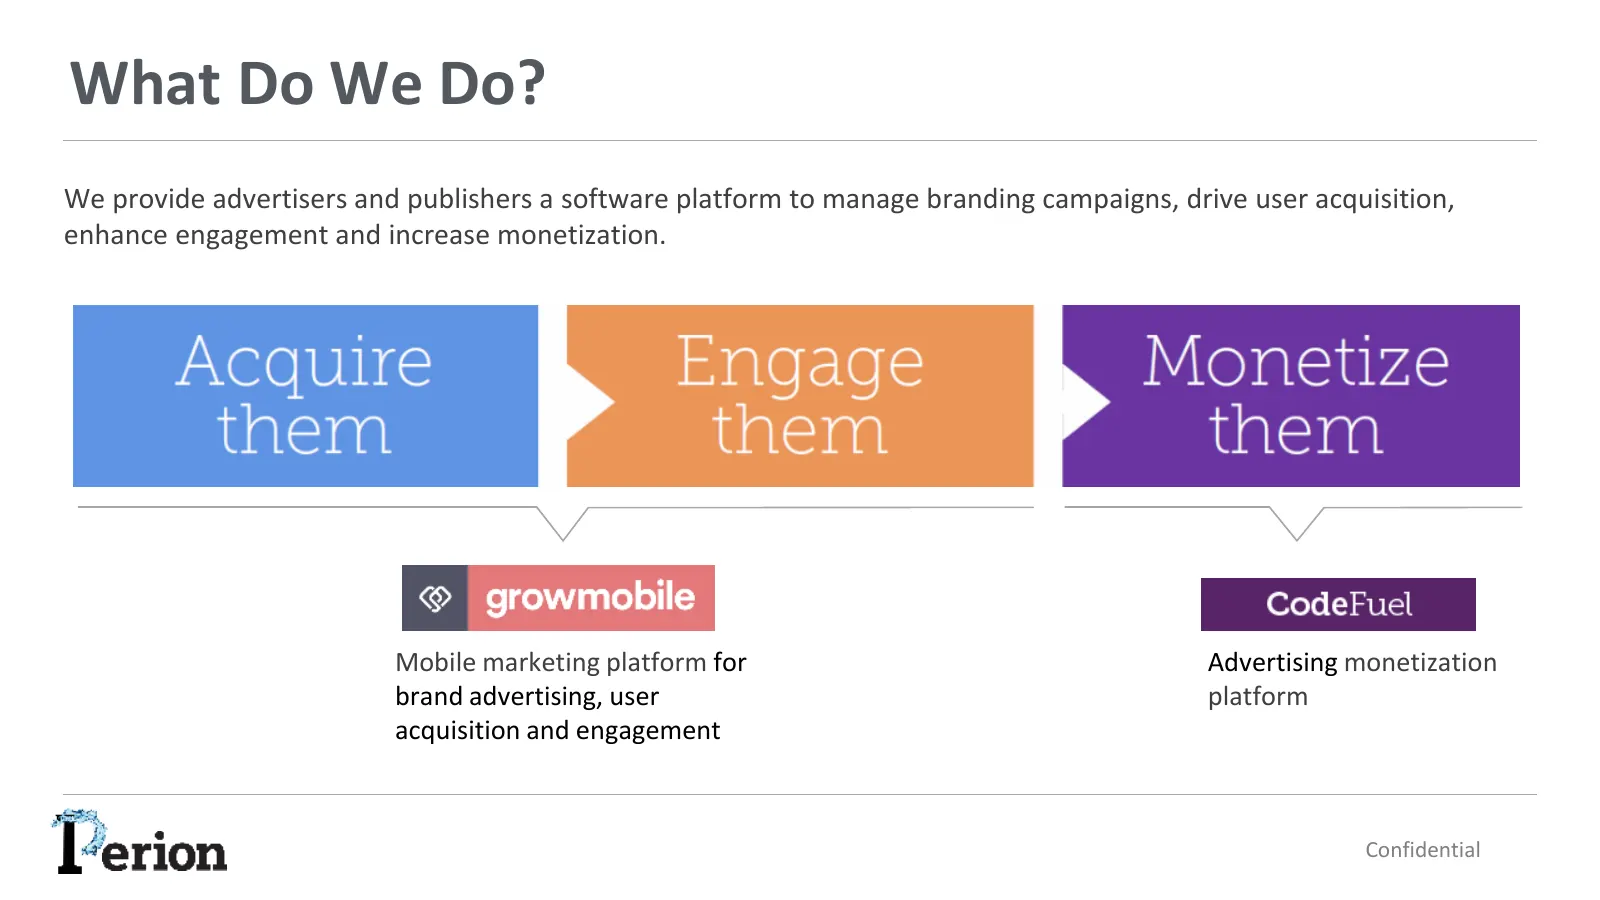
What Do We Do? We provide advertisers and publishers a software platform to manage branding campaigns, drive user acquisition, enhance engagement and increase monetization. Mobile marketing platform for Advertising monetization brand advertising, user platform acquisition and engagement Confidential
Slide 4: Perion Overview
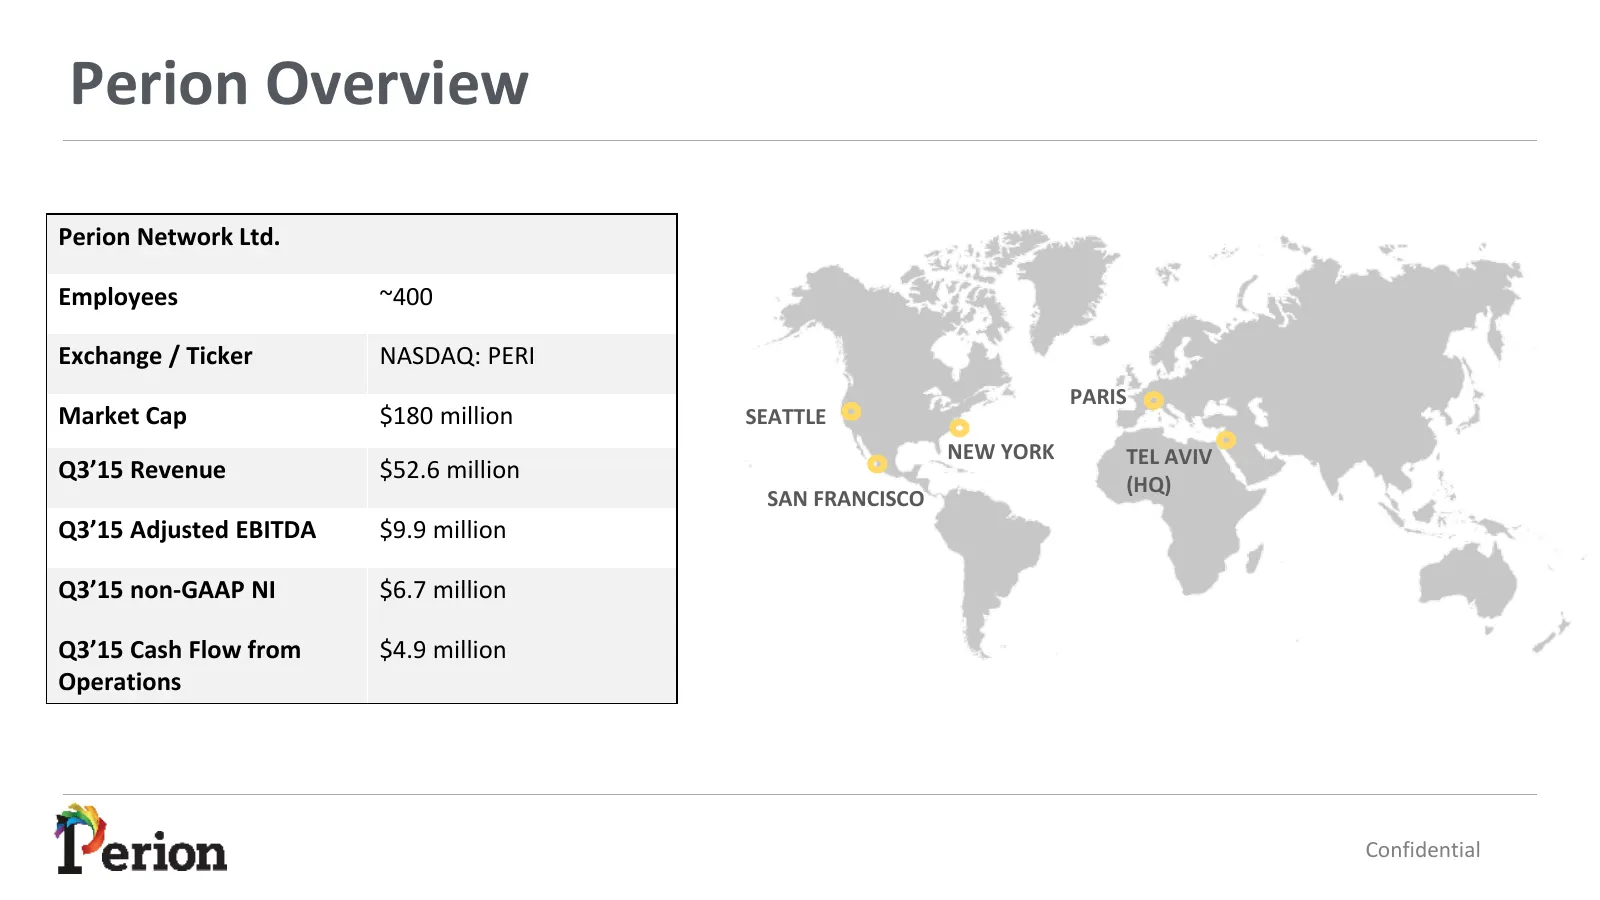
Perion Overview Perion Network Ltd. Employees ~400 Exchange / Ticker NASDAQ: PERI PARIS Market Cap $180 million SEATTLE NEW YORK TEL AVIV Q3’15 Revenue $52.6 million (HQ) SAN FRANCISCO Q3’15 Adjusted EBITDA $9.9 million Q3’15 non-GAAP NI $6.7 million Q3’15 Cash Flow from $4.9 million Operations Conf

Slide 5: CodeFuel
CodeFuel Confidential
Slide 6: CodeFuel Value Proposition
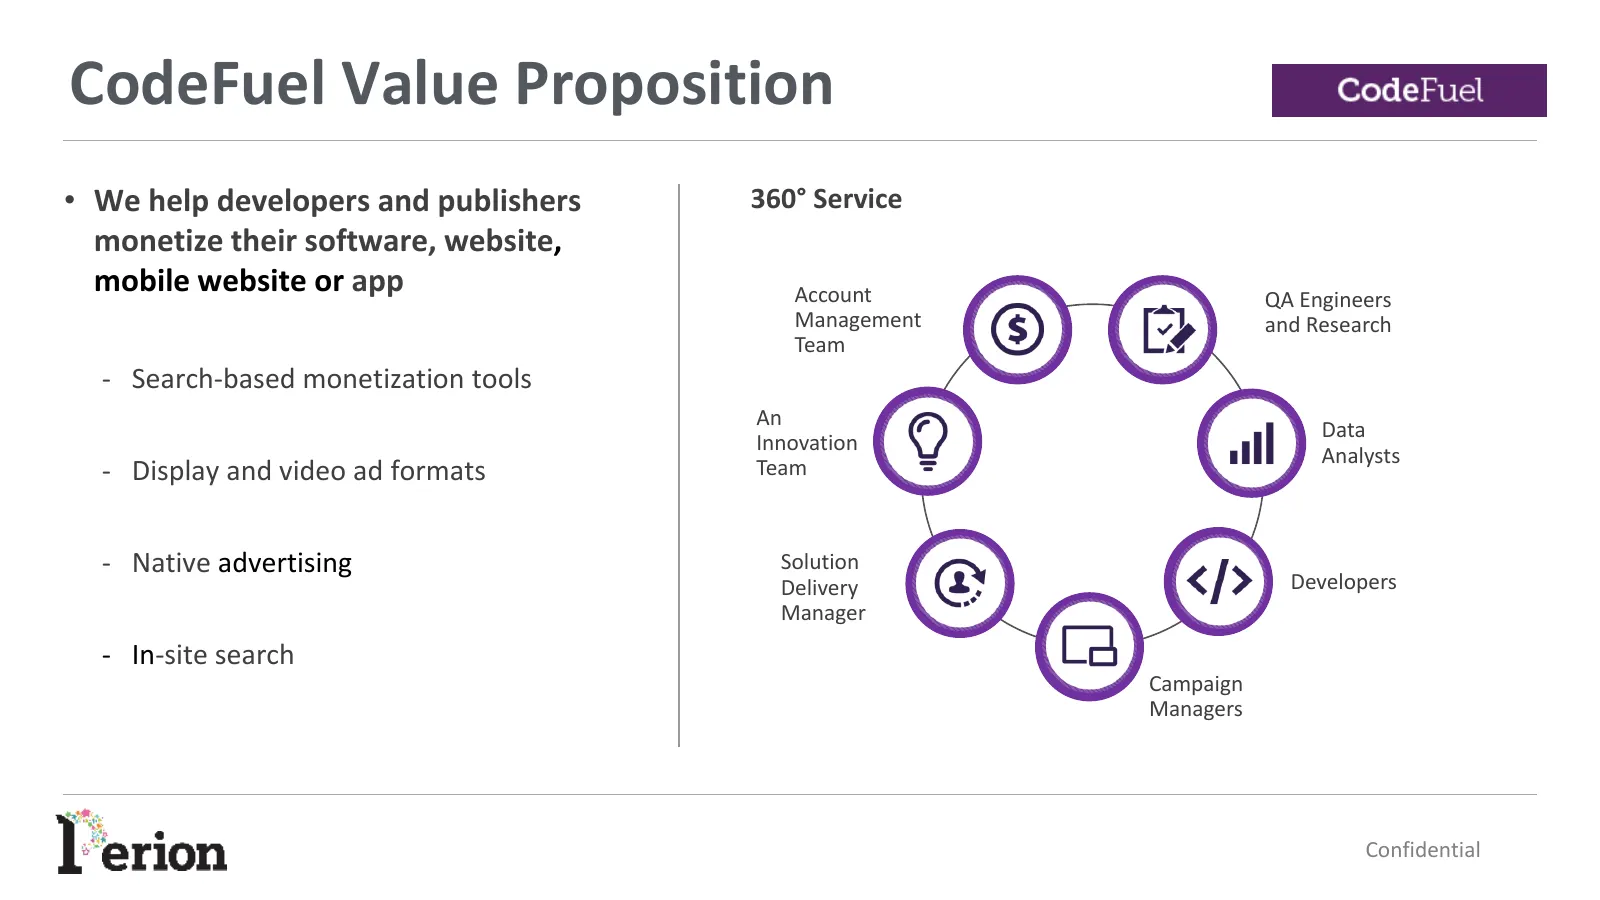
CodeFuel Value Proposition • We help developers and publishers 360° Service monetize their software, website, mobile website or app Account QA Engineers Management and Research Team - Search-based monetization tools An Data Innovation Analysts - Display and video ad formats Team - Native advertising
Slide 7: CodeFuel Monetization Platform
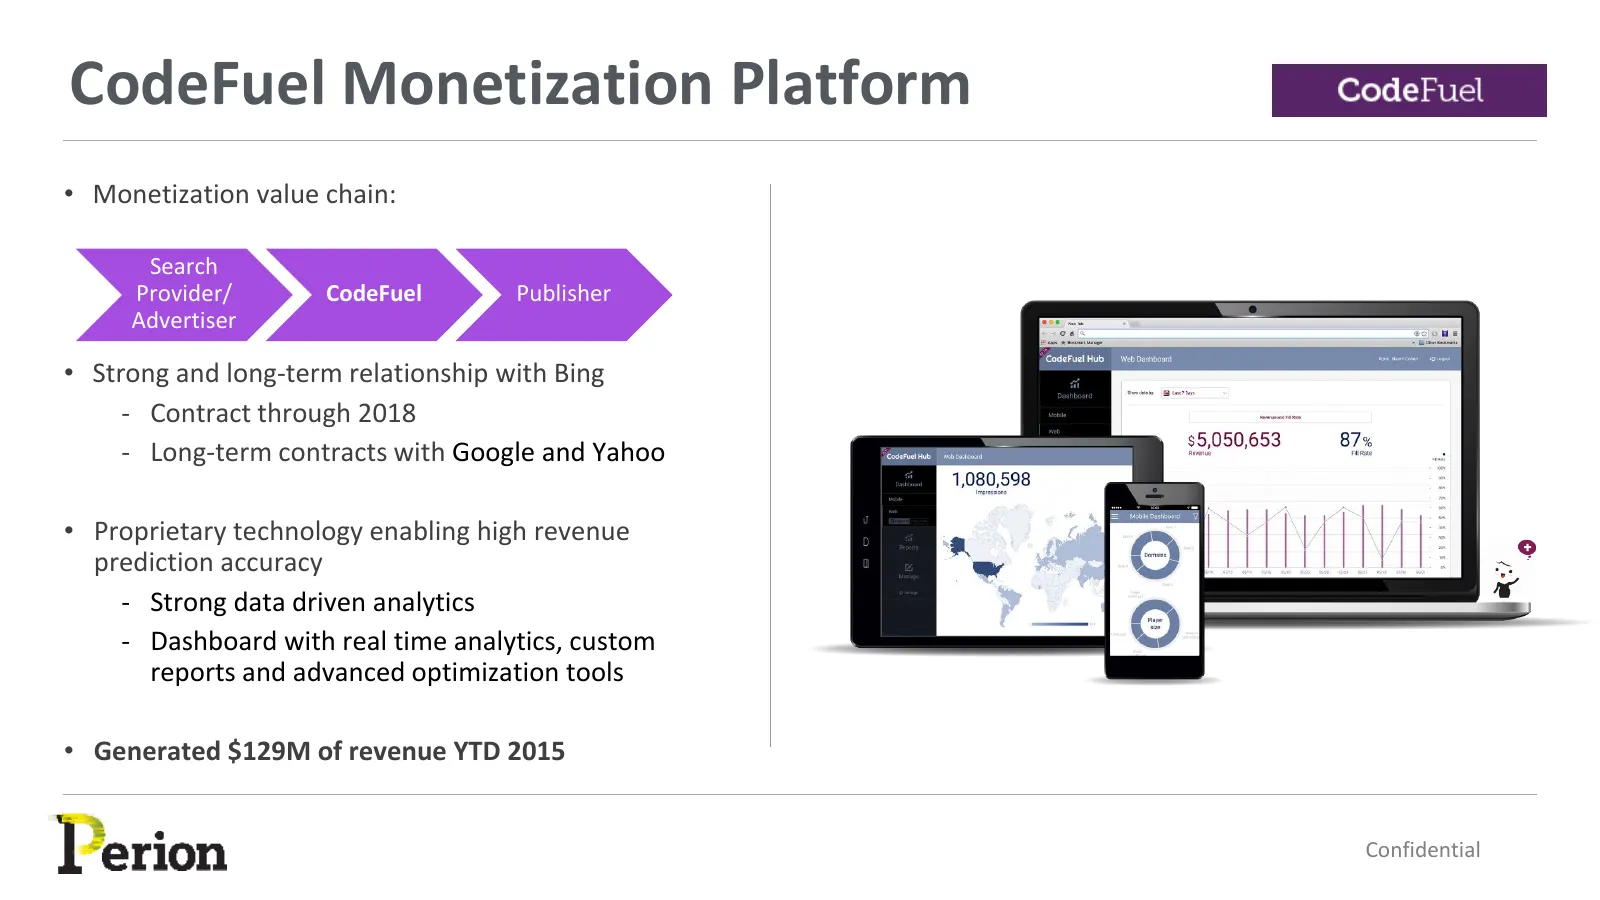
CodeFuel Monetization Platform • Monetization value chain: Search Provider/ CodeFuel Publisher Consumer Advertiser • Strong and long-term relationship with Bing - Contract through 2018 - Long-term contracts with Google and Yahoo • Proprietary technology enabling high revenue prediction accuracy - St
Slide 8: Evolving Revenue Model
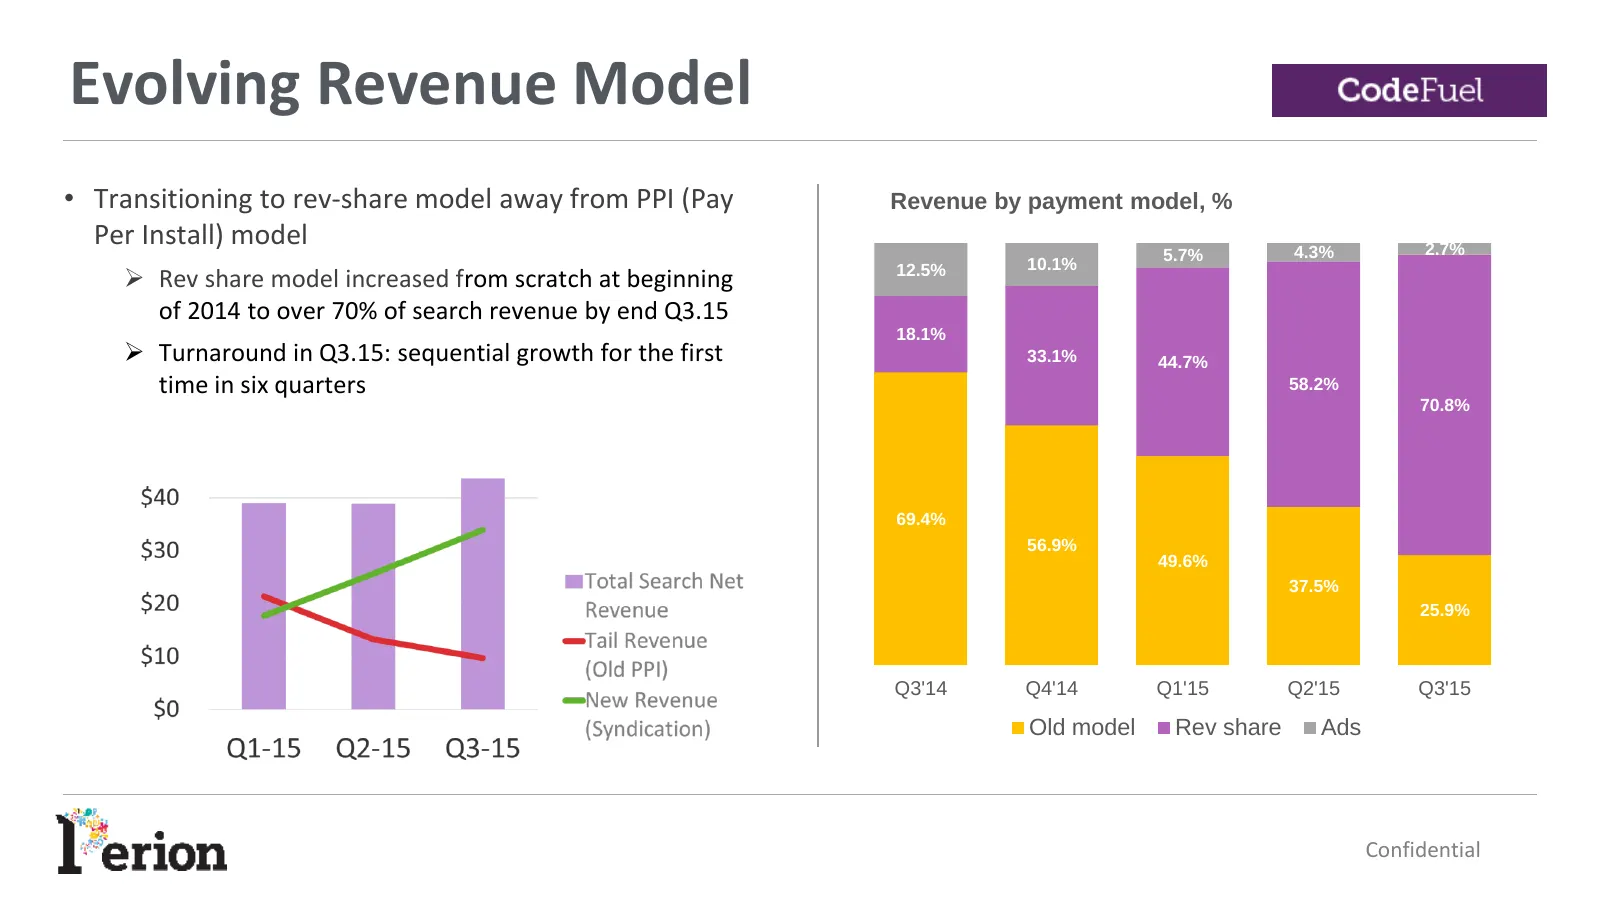
Evolving Revenue Model • Transitioning to rev-share model away from PPI (Pay Revenue by payment model, % Per Install) model 4.3% 2.7% 5.7% 10.1% Rev share model increased from scratch at beginning 12.5% of 2014 to over 70% of search revenue by end Q3.15 18.1% Turnaround in Q3.15: sequential grow
Slide 9: Big Market Opportunity on the Supply Side
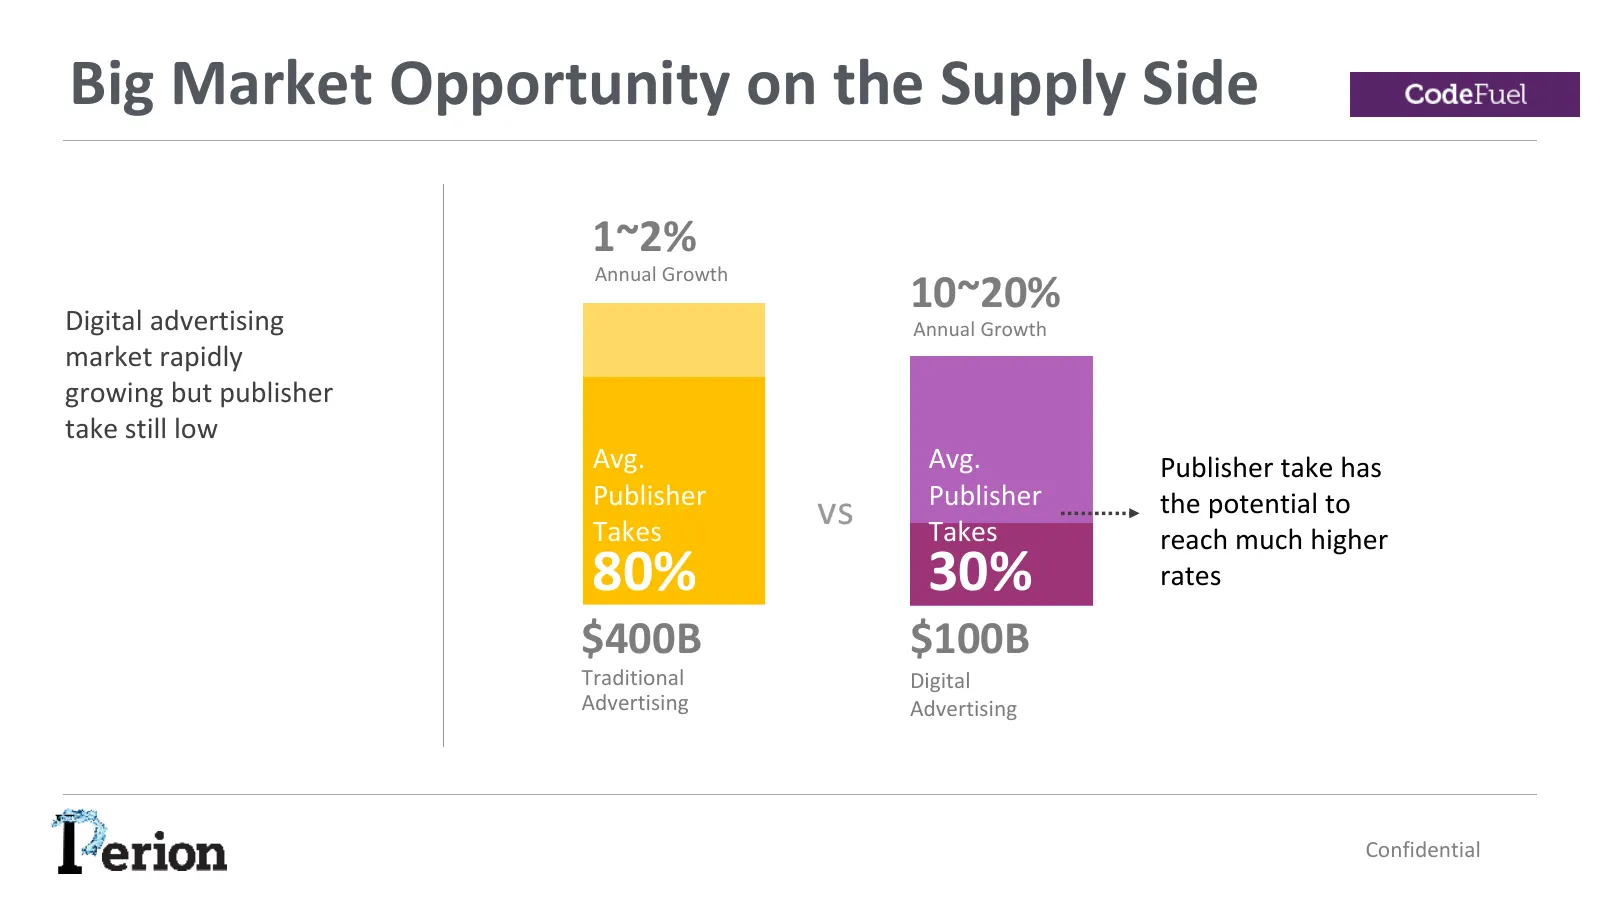
Big Market Opportunity on the Supply Side 1~2% Annual Growth 10~20% Digital advertising Annual Growth market rapidly growing but publisher take still low Avg. Avg. Publisher take has Publisher Publisher the potential to Takes vs Takes reach much higher 80% 30% rates $400B $100B Traditional Digital A
Slide 10: Investing in Future Growth
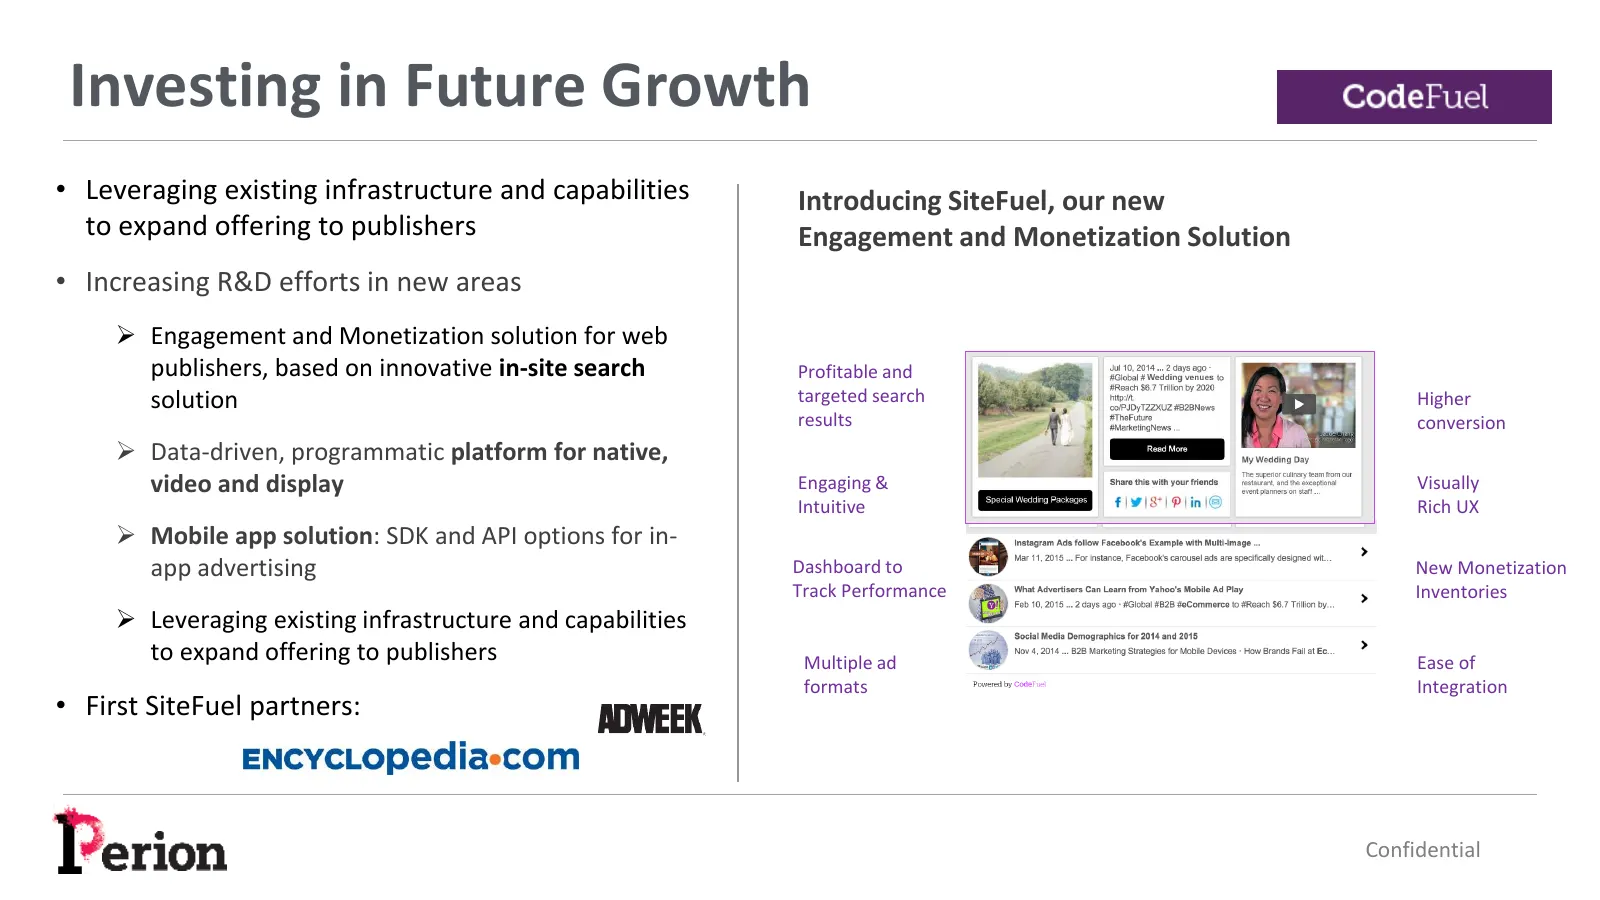
Investing in Future Growth • Leveraging existing infrastructure and capabilities Introducing SiteFuel, our new to expand offering to publishers Engagement and Monetization Solution • Increasing R&D efforts in new areas Engagement and Monetization solution for web publishers, based on innovative in

Slide 11: Growmobile
Growmobile Confidential
Slide 12: Ad Spend Shifting to Mobile…
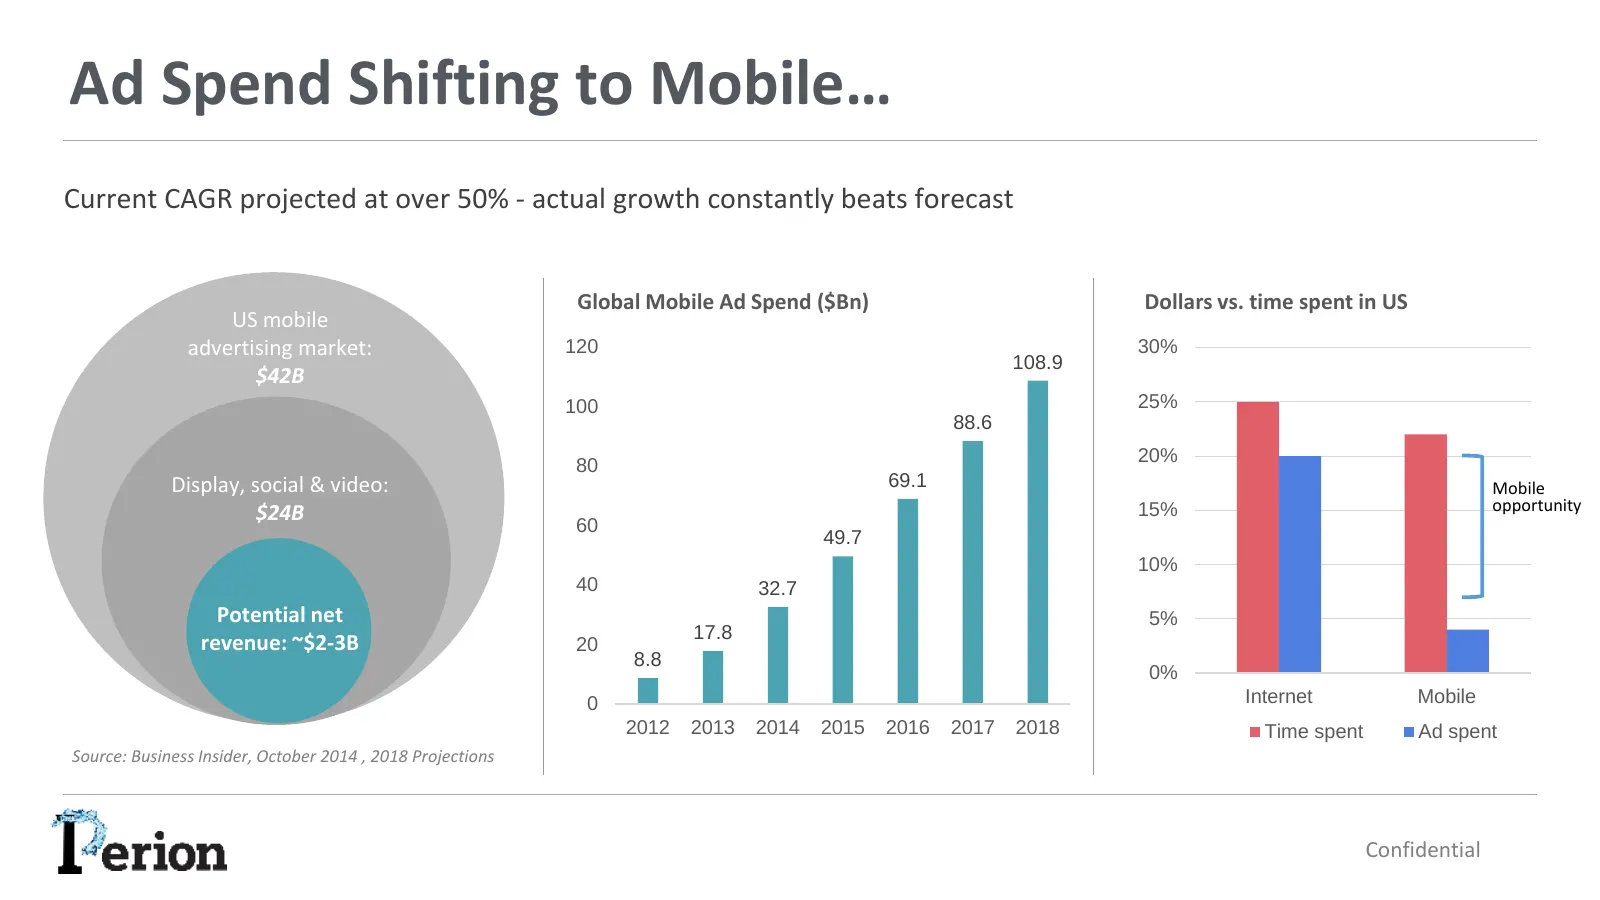
Ad Spend Shifting to Mobile… Current CAGR projected at over 50% - actual growth constantly beats forecast Global Mobile Ad Spend ($Bn) Dollars vs. time spent in US US mobile advertising market: 120 30% 108.9 $42B 100 25% 88.6 20% 80 Display, social & video: 69.1 Mobile $24B 15% opportunity 60 49.7 1
Slide 13: …and Social
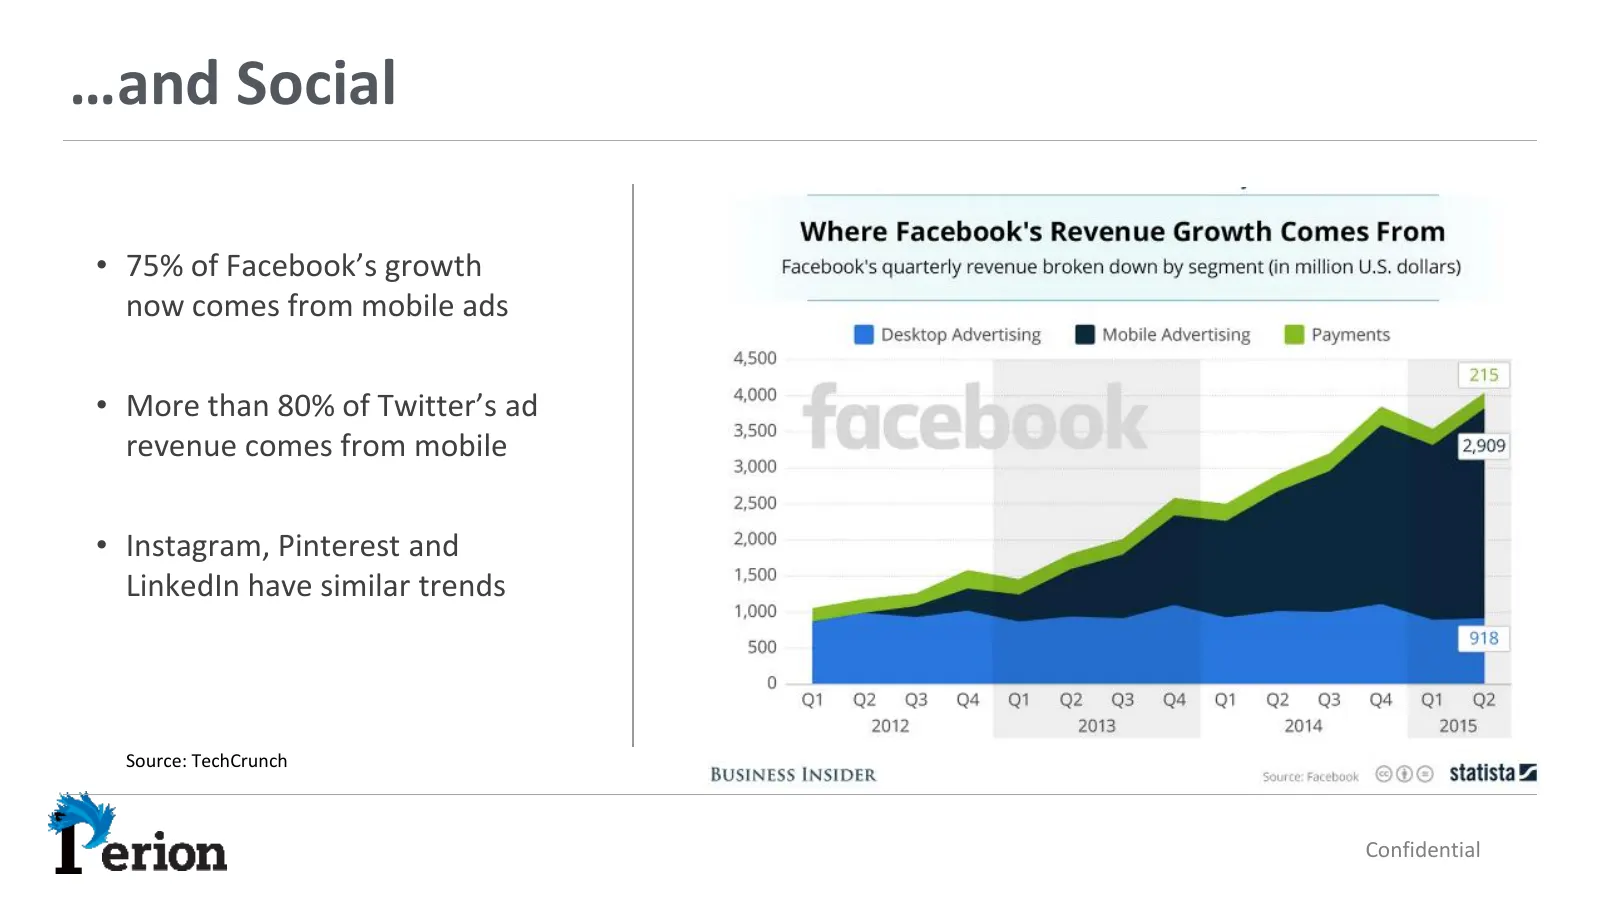
…and Social • 75% of Facebook’s growth now comes from mobile ads • More than 80% of Twitter’s ad revenue comes from mobile • Instagram, Pinterest and LinkedIn have similar trends Source: TechCrunch Confidential
Slide 14: The Mobile Marketer’s Challenge
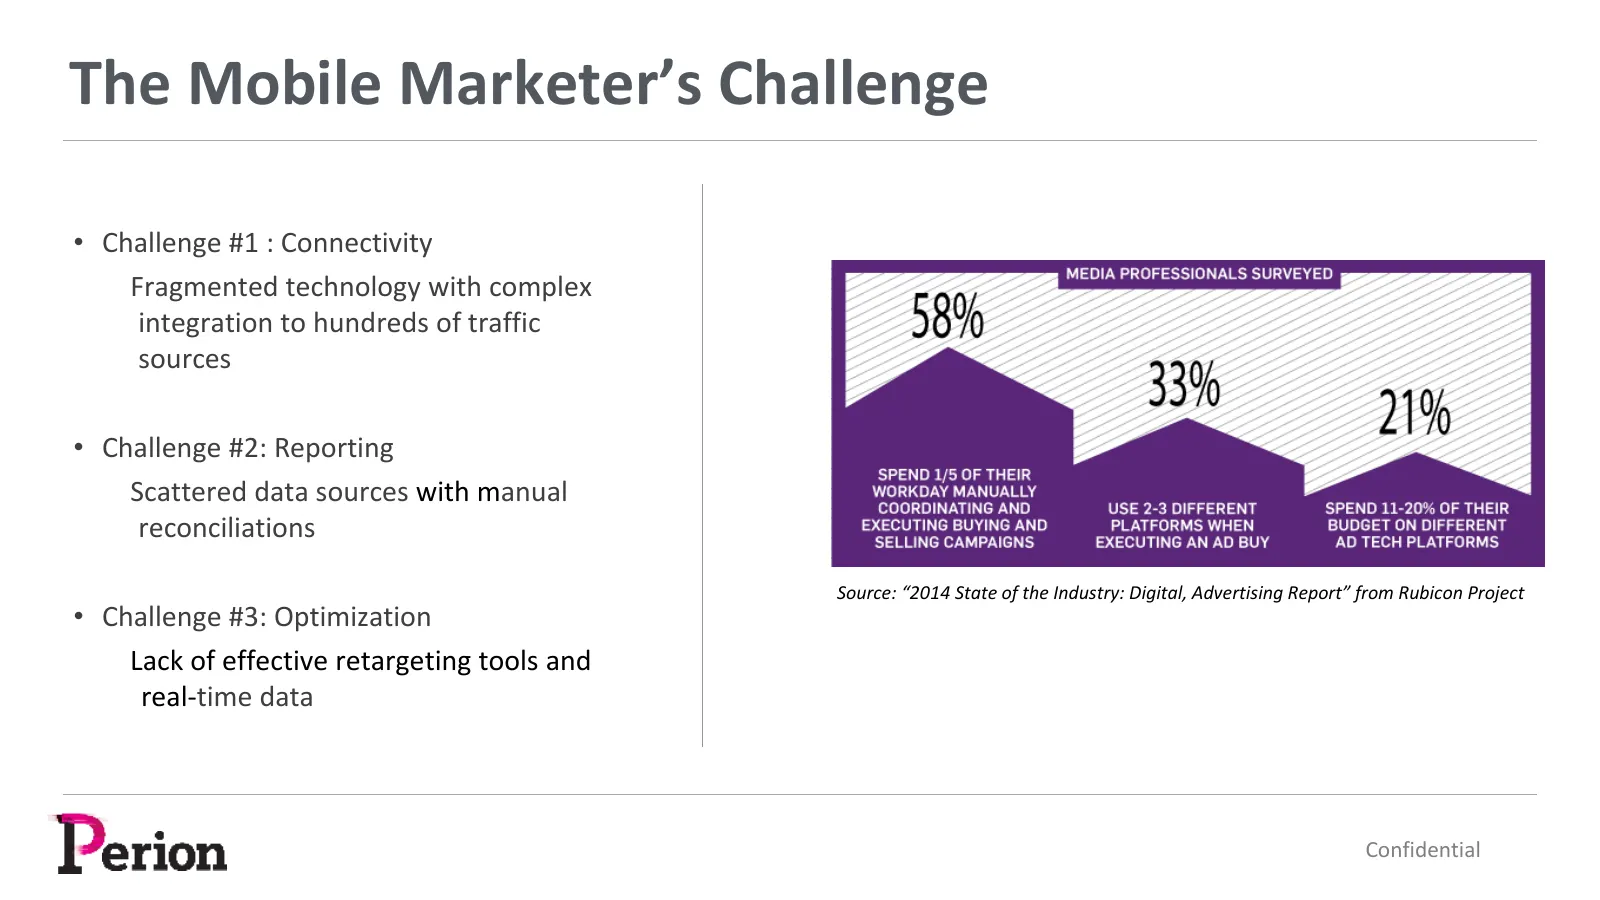
The Mobile Marketer’s Challenge • Challenge #1 : Connectivity Fragmented technology with complex integration to hundreds of traffic sources • Challenge #2: Reporting Scattered data sources with manual reconciliations Source: “2014 State of the Industry: Digital, Advertising Report” from Rubicon Proj
Slide 15: Our Comprehensive Solution
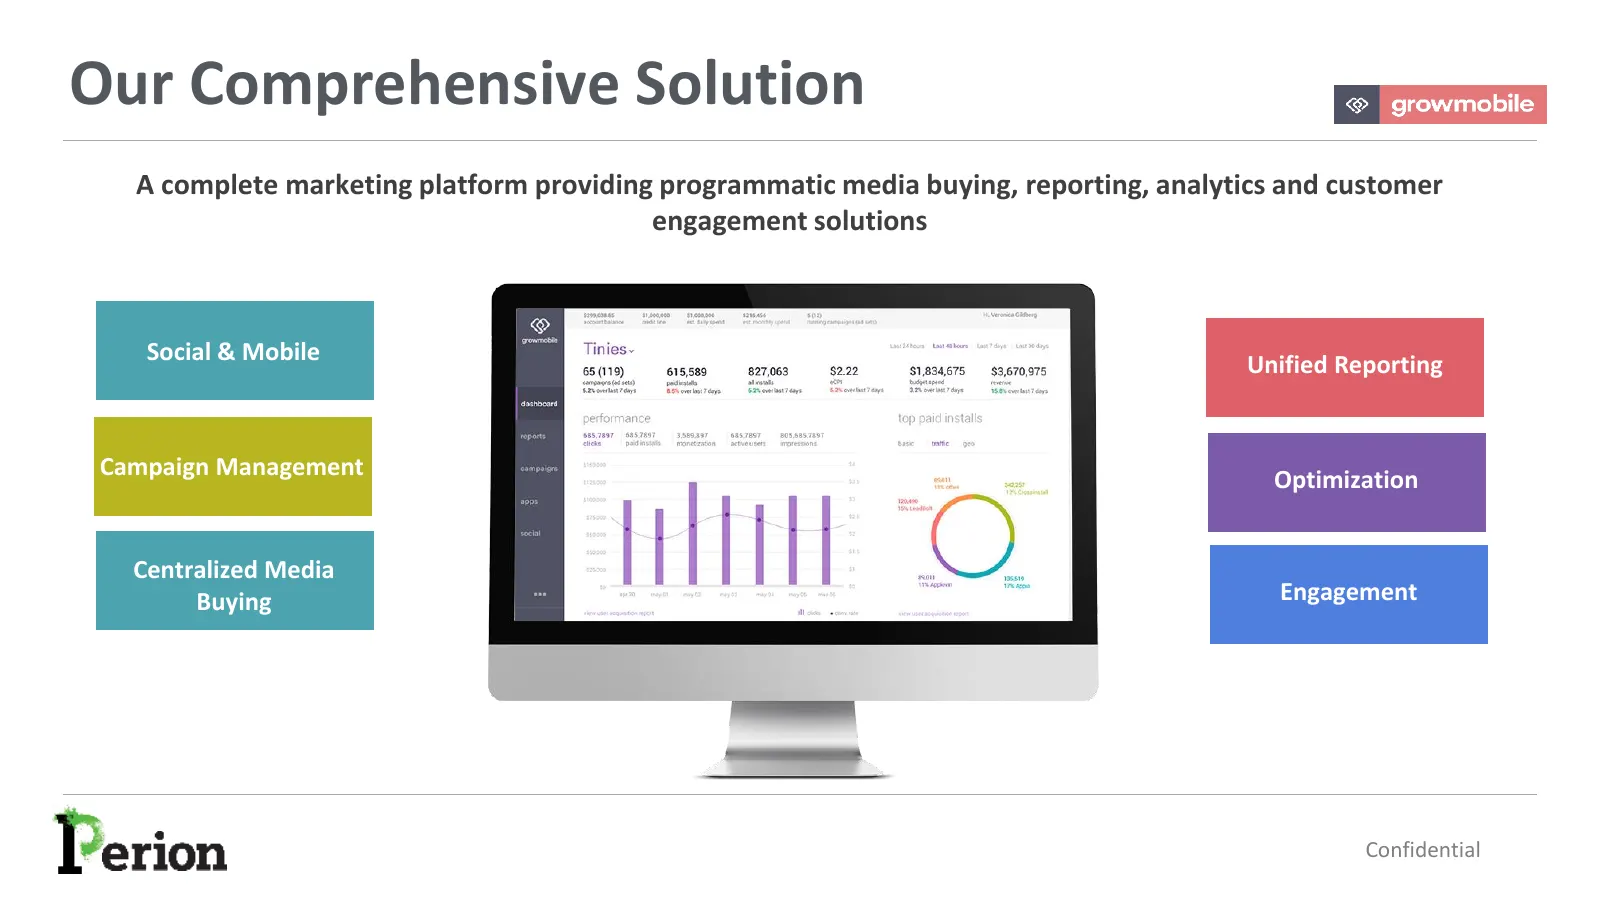
Our Comprehensive Solution A complete marketing platform providing programmatic media buying, reporting, analytics and customer engagement solutions Social & Mobile Unified Reporting Campaign Management Optimization Centralized Media Buying Engagement Confidential
Slide 16: For Mobile and Social
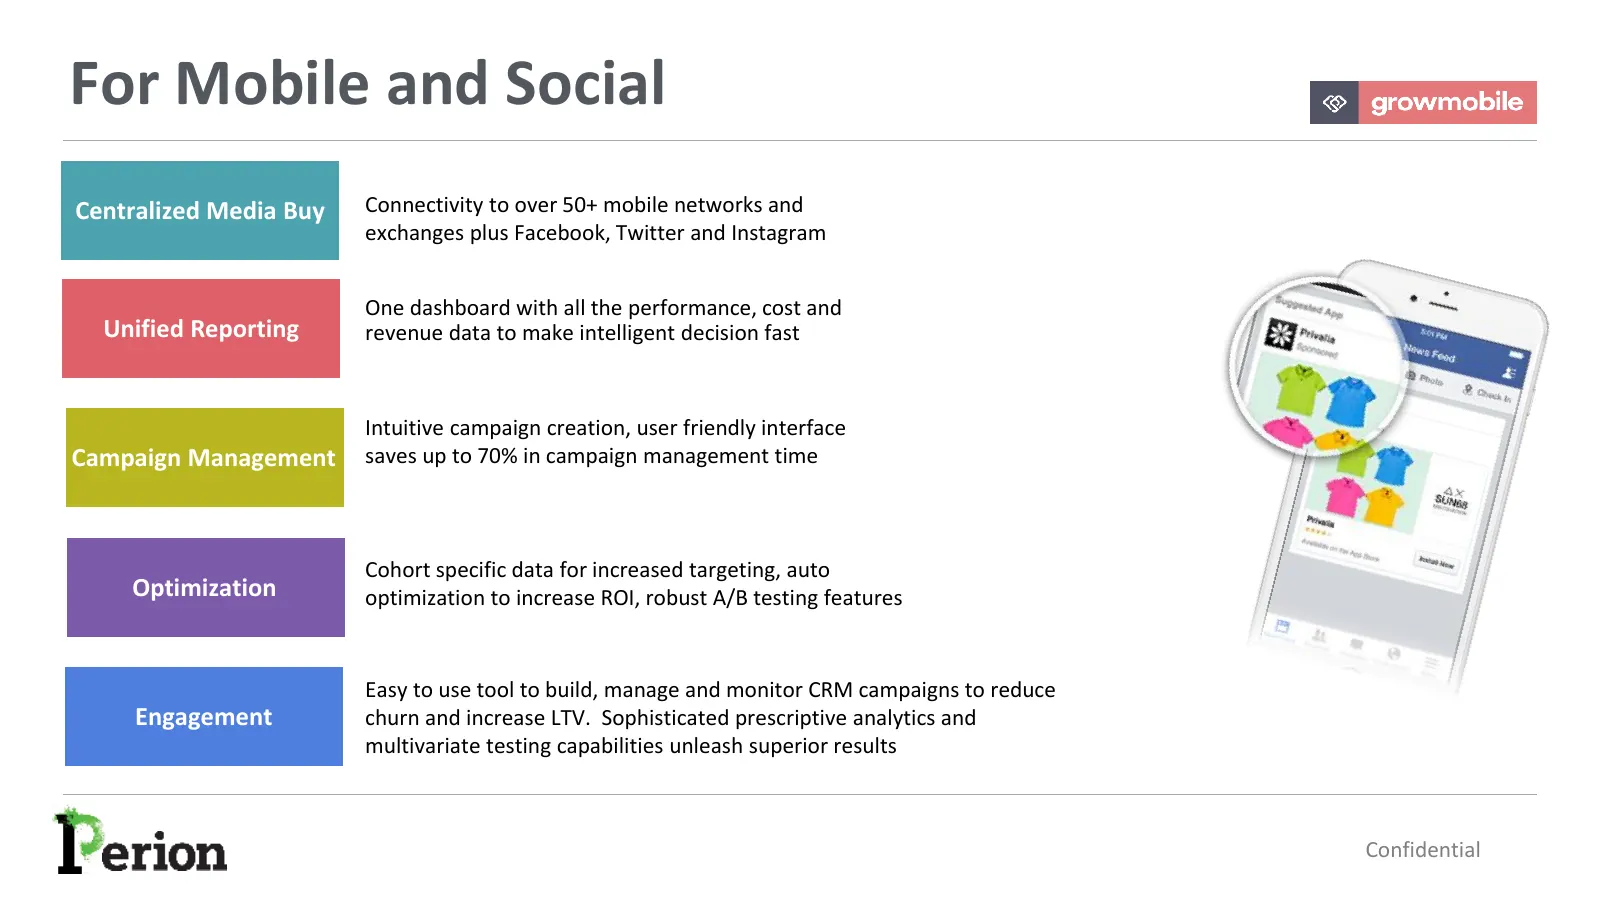
For Mobile and Social Centralized Media Buy Connectivity to over 50+ mobile networks and exchanges plus Facebook, Twitter and Instagram One dashboard with all the performance, cost and Unified Reporting revenue data to make intelligent decision fast Intuitive campaign creation, user friendly interfa
Slide 17: Our Business Model
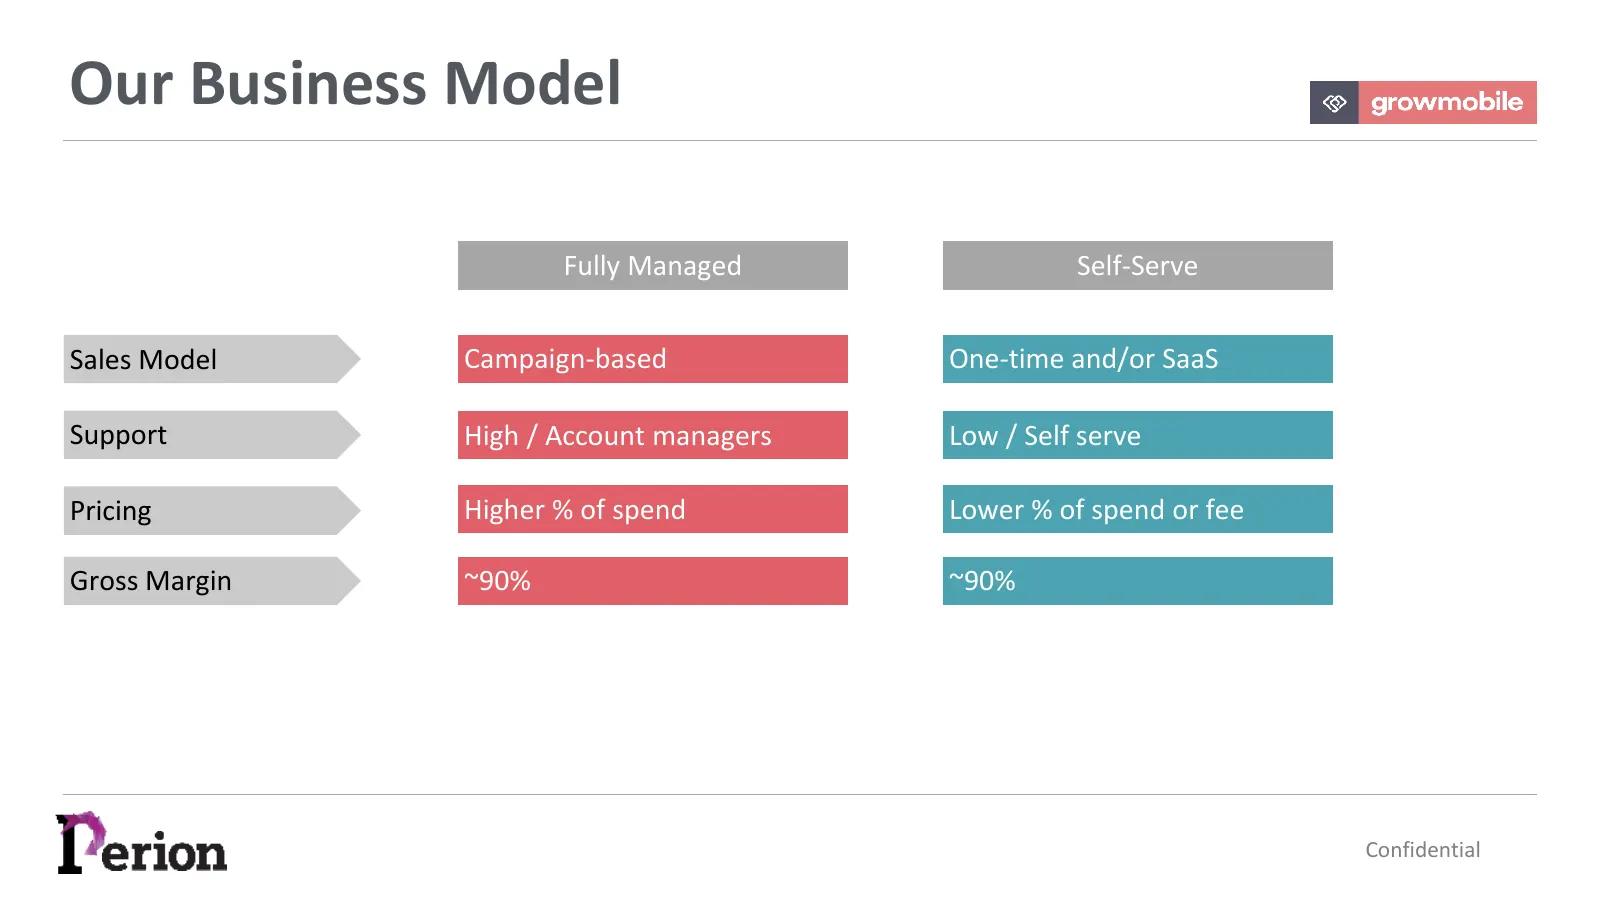
Our Business Model Fully Managed Self-Serve Sales Model Campaign-based One-time and/or SaaS Support High / Account managers Low / Self serve Pricing Higher % of spend Lower % of spend or fee Gross Margin ~90% ~90% Confidential
Slide 18: Growing Fast
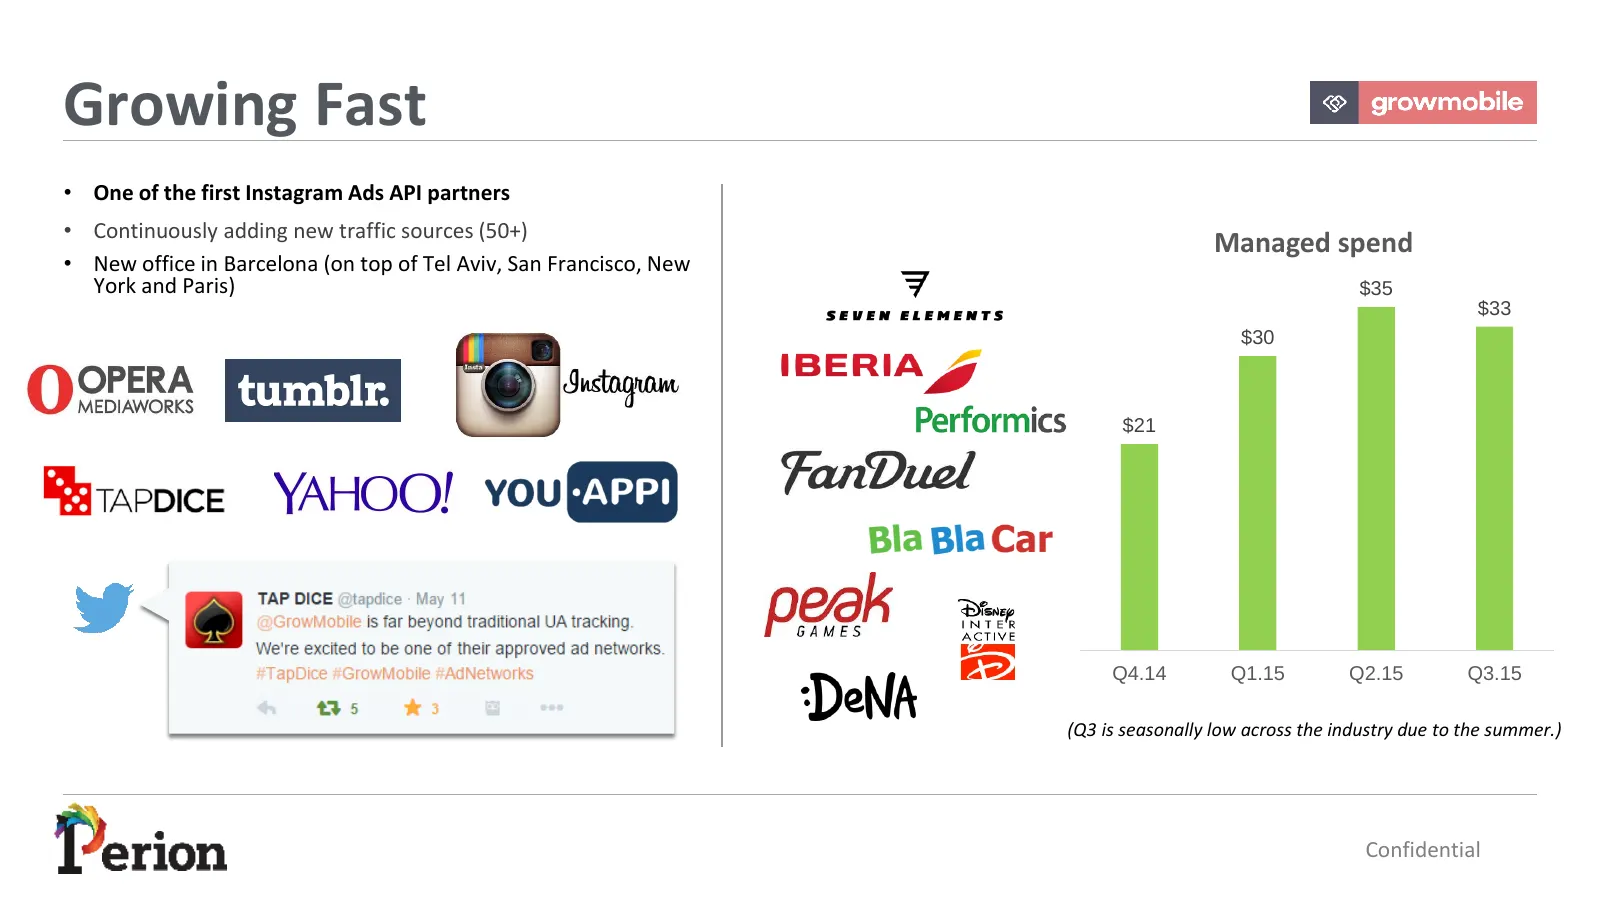
Growing Fast • One of the first Instagram Ads API partners • Continuously adding new traffic sources (50+) Managed spend • New office in Barcelona (on top of Tel Aviv, San Francisco, New York and Paris) $35 $33 $30 $21 Q4.14 Q1.15 Q2.15 Q3.15 (Q3 is seasonally low across the industry due to the summ

Slide 19: Financials
Financials Confidential
Slide 20: Revenue Trend
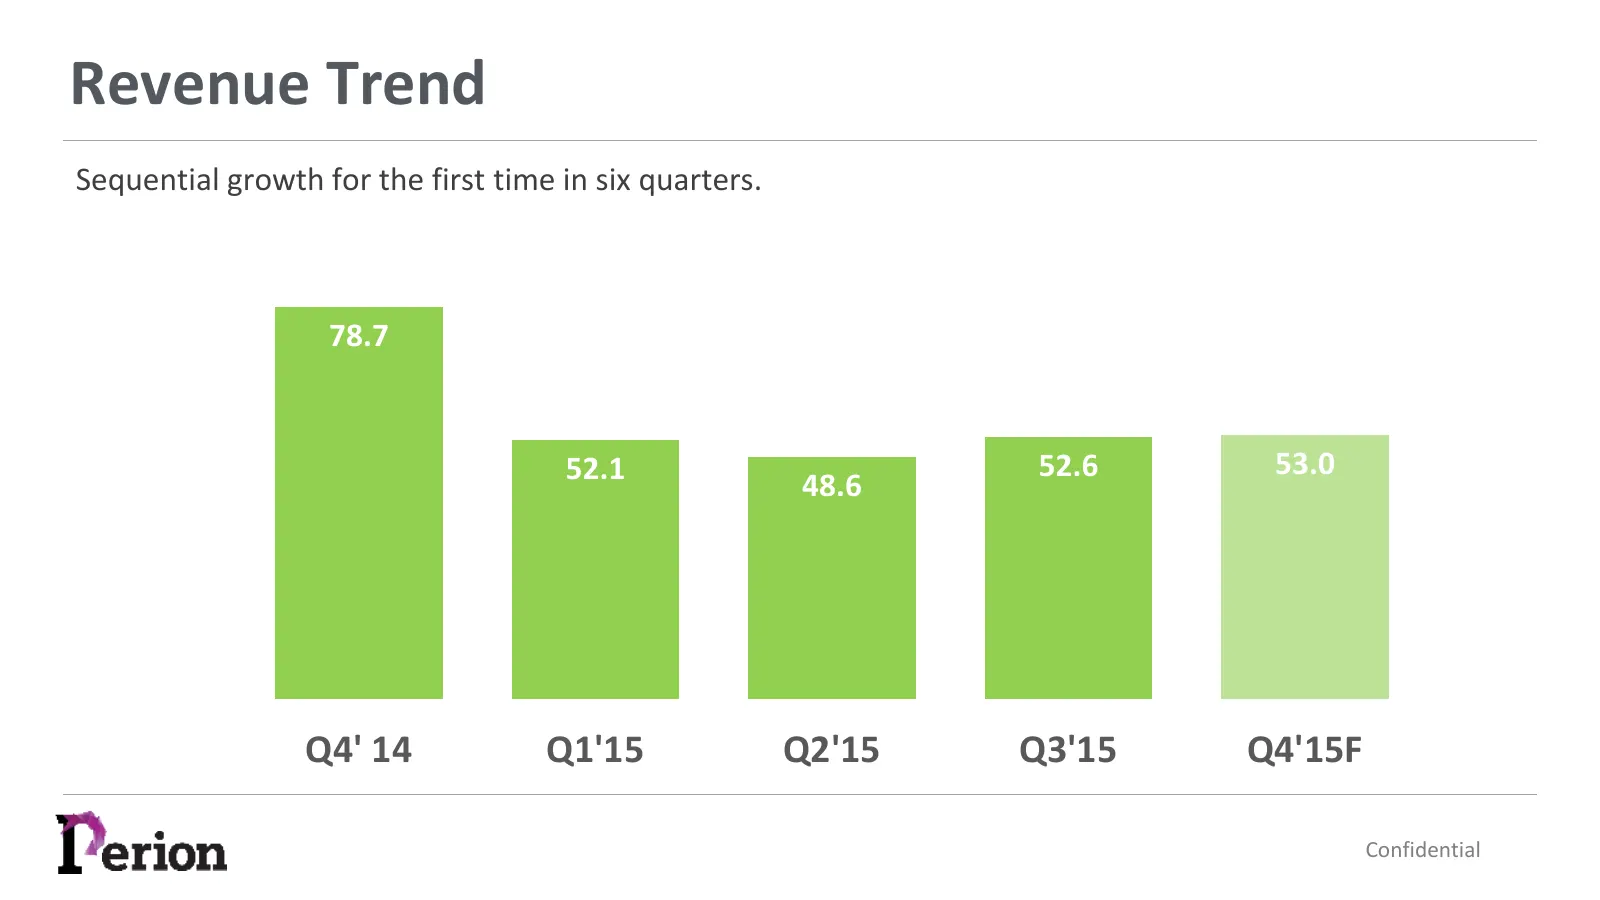
Revenue Trend Sequential growth for the first time in six quarters. 78.7 52.1 52.6 53.0 48.6 Q4' 14 Q1'15 Q2'15 Q3'15 Q4'15F Confidential
Slide 21: 2015 EBITDA Trends
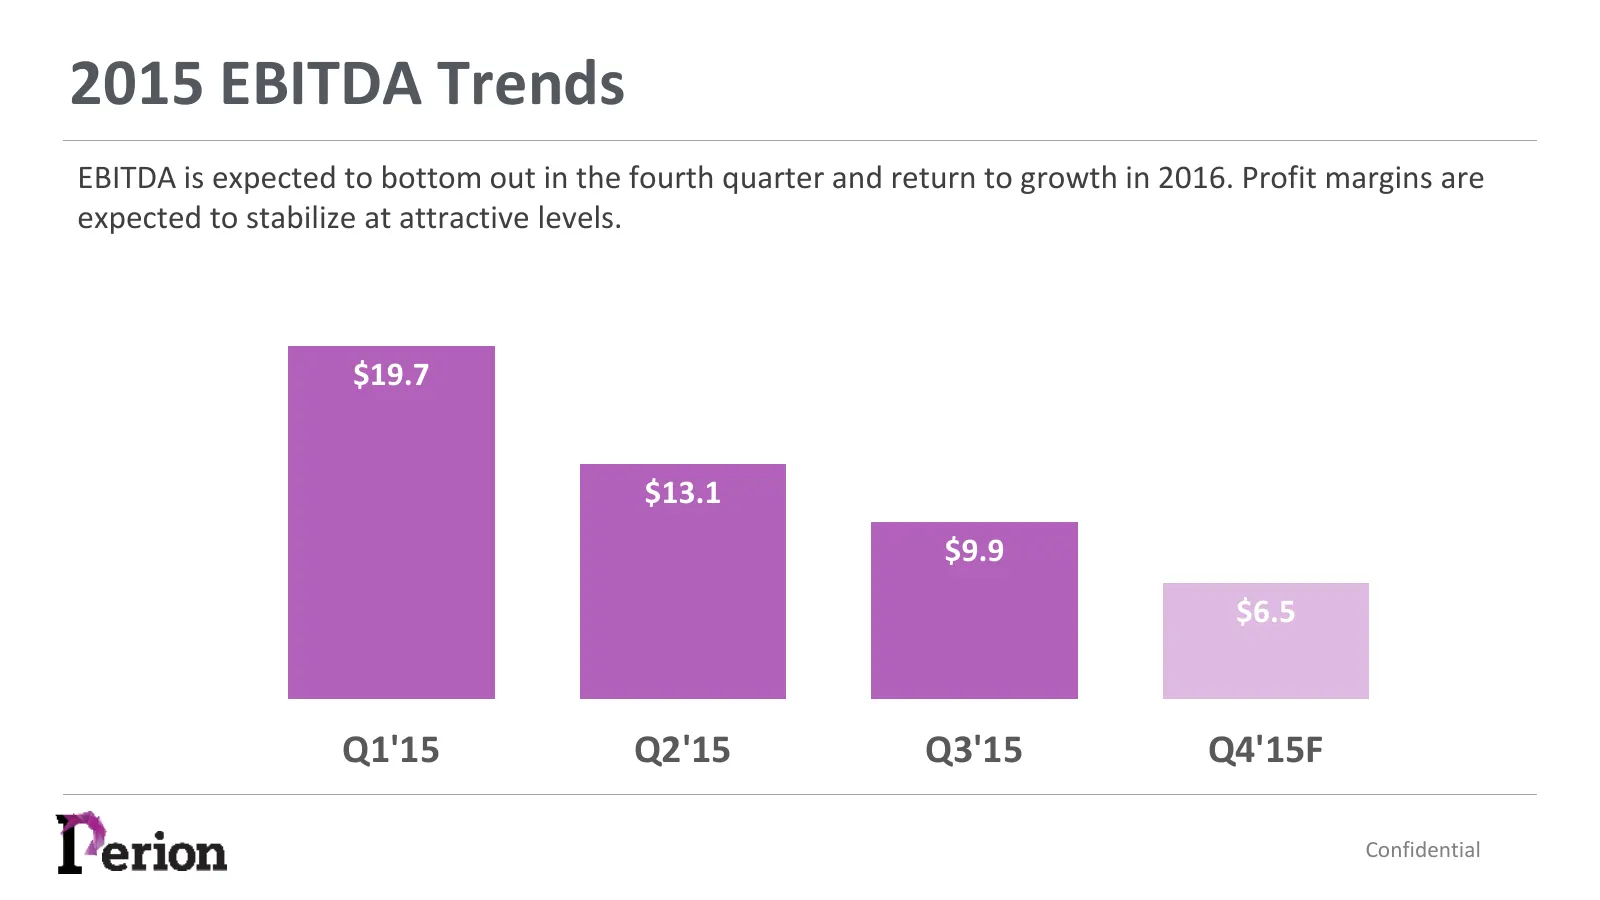
2015 EBITDA Trends EBITDA is expected to bottom out in the fourth quarter and return to growth in 2016. Profit margins are expected to stabilize at attractive levels. $19.7 $13.1 $9.9 $6.5 Q1'15 Q2'15 Q3'15 Q4'15F Confidential
Slide 22: Cash Flow Trend
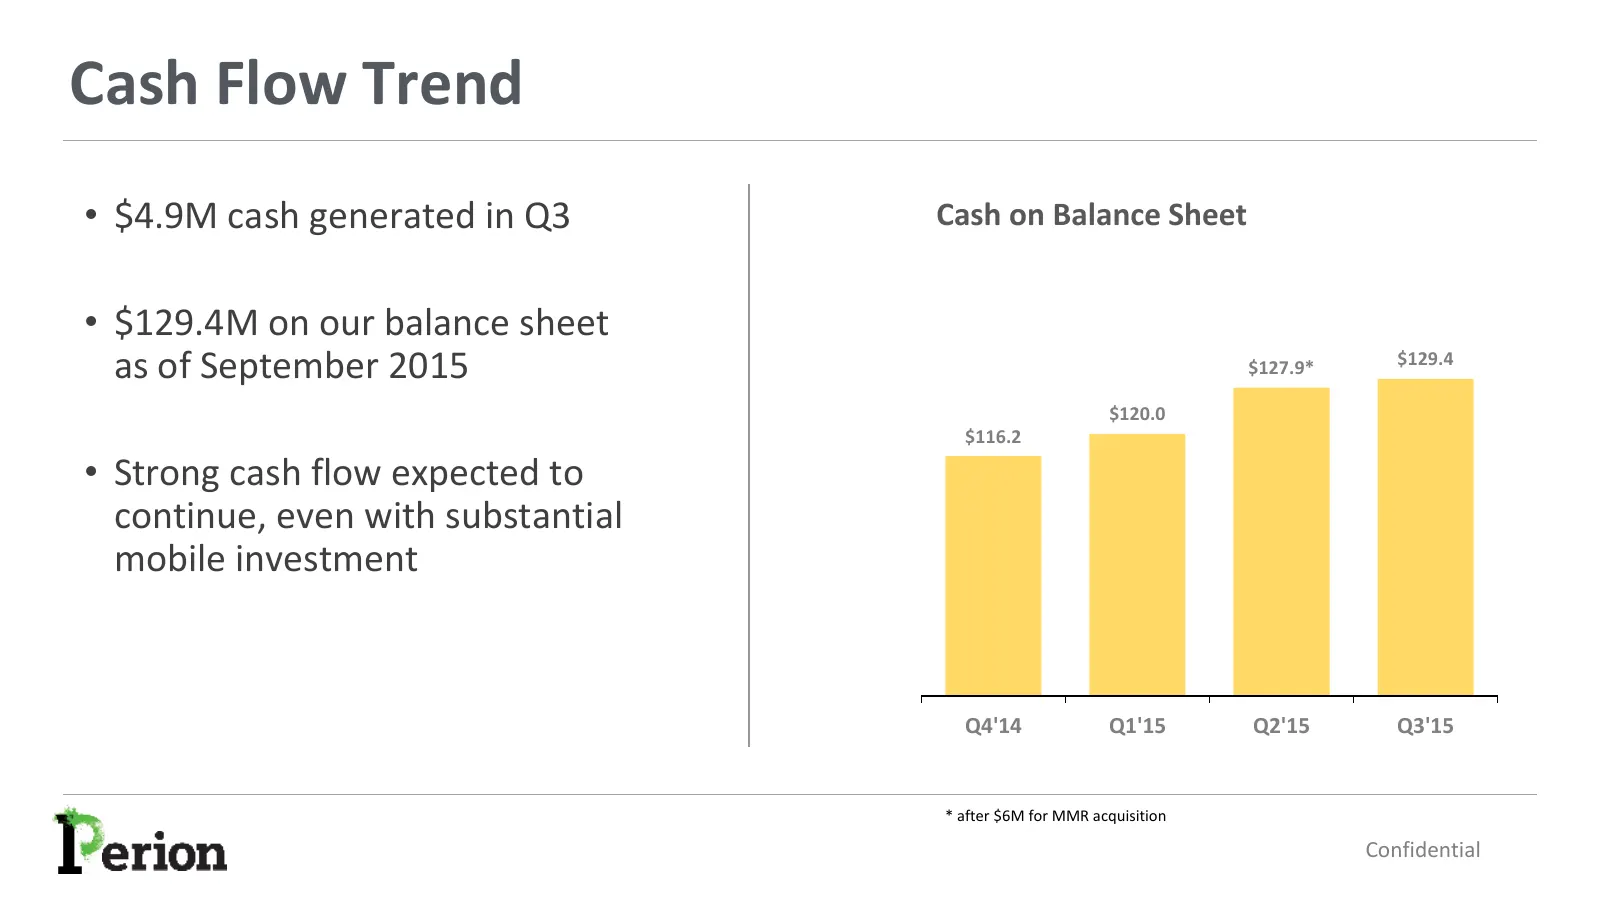
Cash Flow Trend • $4.9M cash generated in Q3 Cash on Balance Sheet • $129.4M on our balance sheet as of September 2015 $127.9* $129.4 $120.0 $116.2 • Strong cash flow expected to continue, even with substantial mobile investment Q4'14 Q1'15 Q2'15 Q3'15 * after $6M for MMR acquisition Confidential

Slide 23: Thank You
Thank You Confidential
Slide 24: Use of Non-GAAP Measures
Use of Non-GAAP Measures Non-GAAP financial measures, as well as adjusted EBITDA, consist of GAAP financial measures adjusted to include the results of discontinued operations, and to exclude acquisition related expenses, share-based compensation expenses, amortization of acquired intangible assets
Source: Internet Archive copy of perion.com
More decks from Perion Network Ltd
 Q2 2026 Earnings Presentation43 slides · Aug 10, 2026
 Investor Presentation (August 2026)83 slides · August 2026
 Investor Presentation (June 2026)80 slides · Jun 29, 2026
 Q1 2026 Earnings Presentation39 slides · May 20, 2026
 Q4 2025 Earnings Presentation54 slides · Feb 18, 2026
 Q3 2025 Earnings Presentation40 slides · Nov 12, 2025