Snap-On Incorporated · NYSE:SNA
Snap-On — Jefferies Industrial Conference 2015
30 slides from Snap-On's conference presentation, August 2015

Slide 1: Jefferies Industrial Conference
Jefferies Industrial Conference August 2015
Slide 2: Cautionary Statement
CAUTIONARY STATEMENT Information included in this presentation may contain statements, including earnings projections, that are forward-looking in nature and, accordingly, are subject to risks and uncertainties regarding Snap-on’s expected results. Statements made that (i) are in the future tense; (
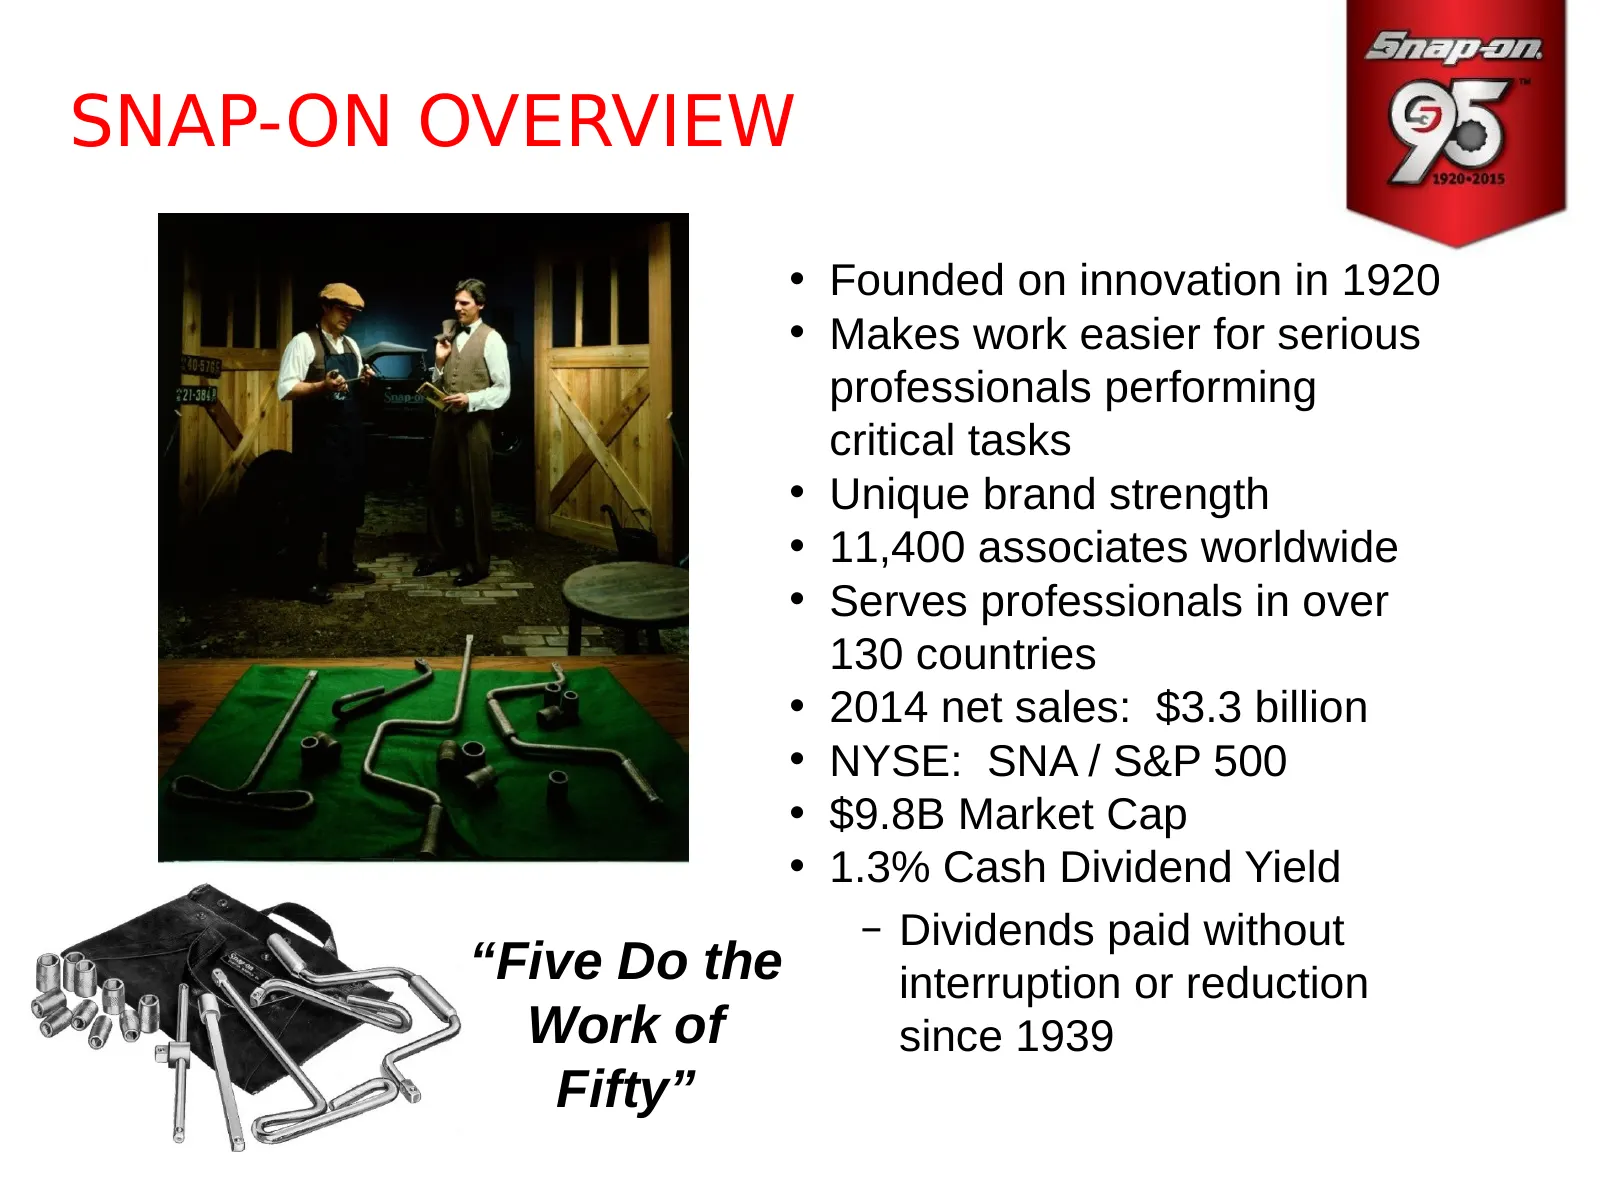
Slide 3: Snap-on Overview
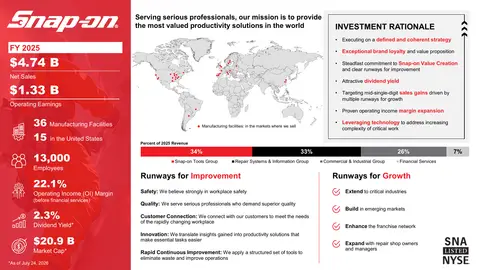
SNAP-ON OVERVIEW • Founded on innovation in 1920 • Makes work easier for serious professionals performing critical tasks • Unique brand strength • 11,400 associates worldwide • Serves professionals in over 130 countries • 2014 net sales: $3.3 billion • NYSE: SNA / S&P 500 • $9.8B Market Cap • 1.3% C
Slide 4: Snap-on Is Shaped by Work
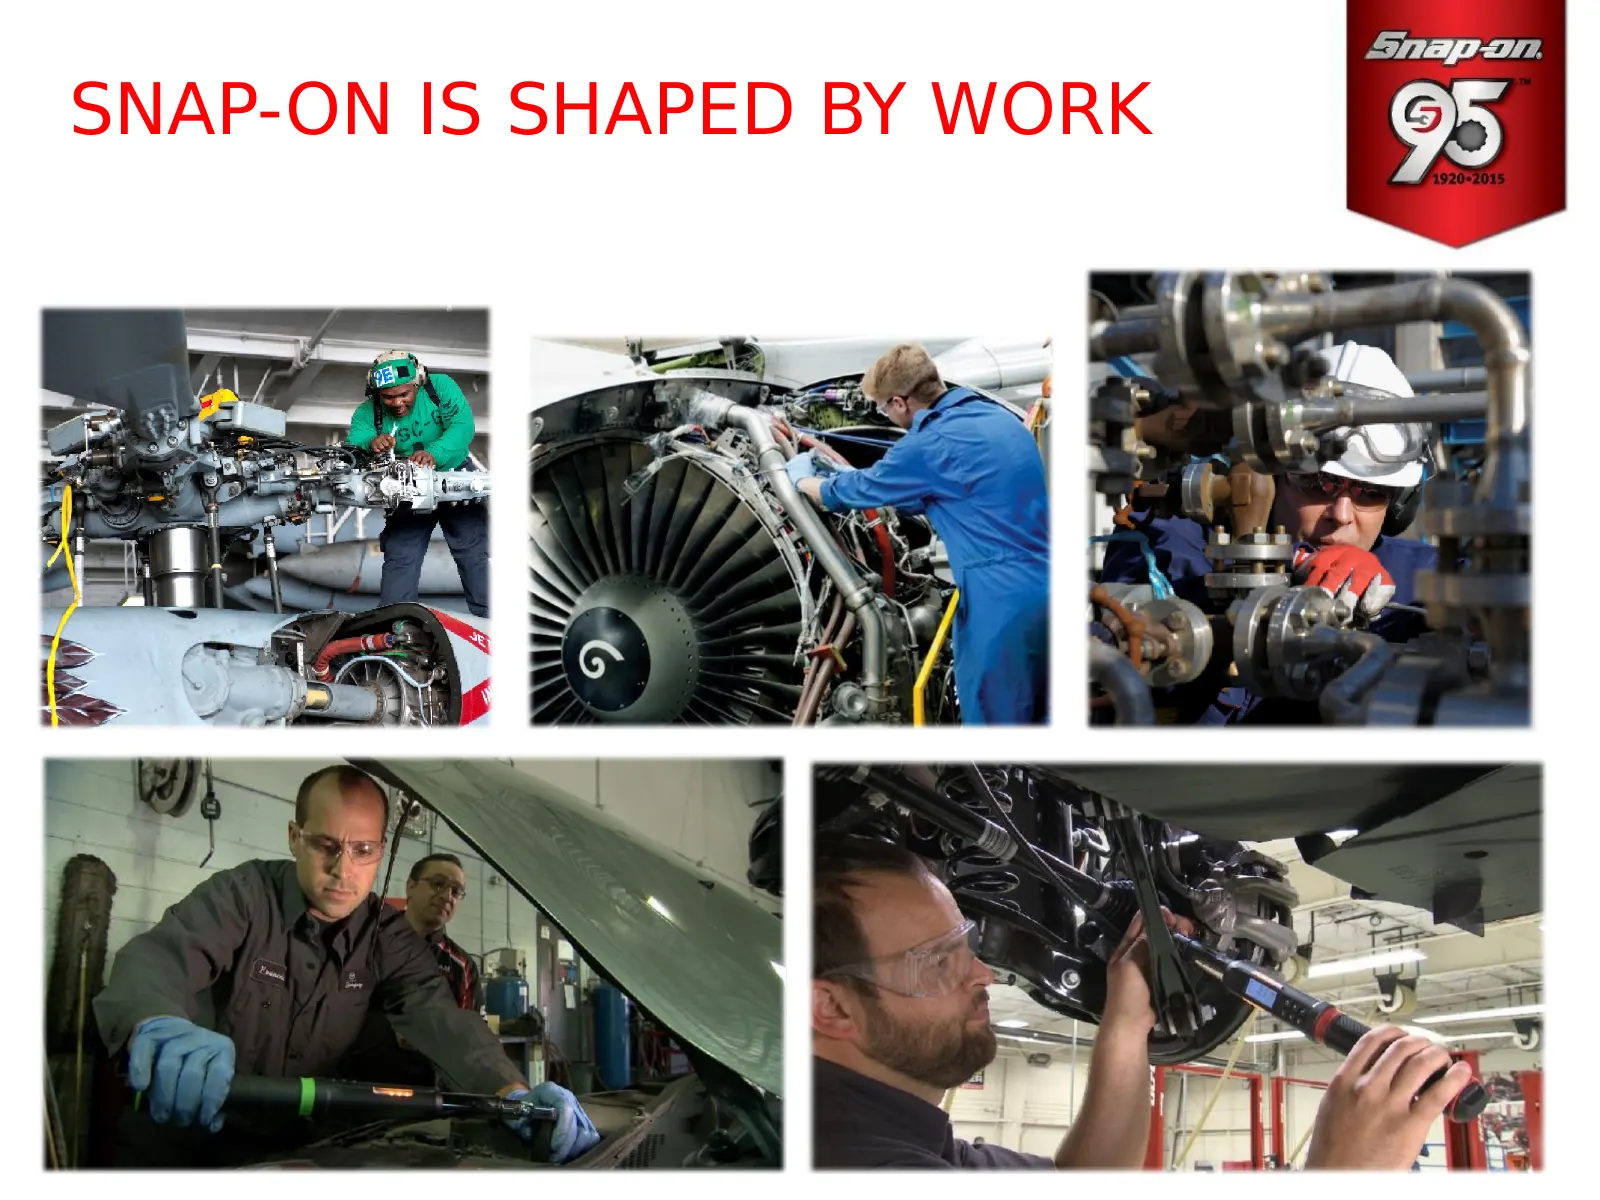
SNAP-ON IS SHAPED BY WORK
Slide 5: Snap-on Is Sparked by Ideas - Unique Productivity Solutions
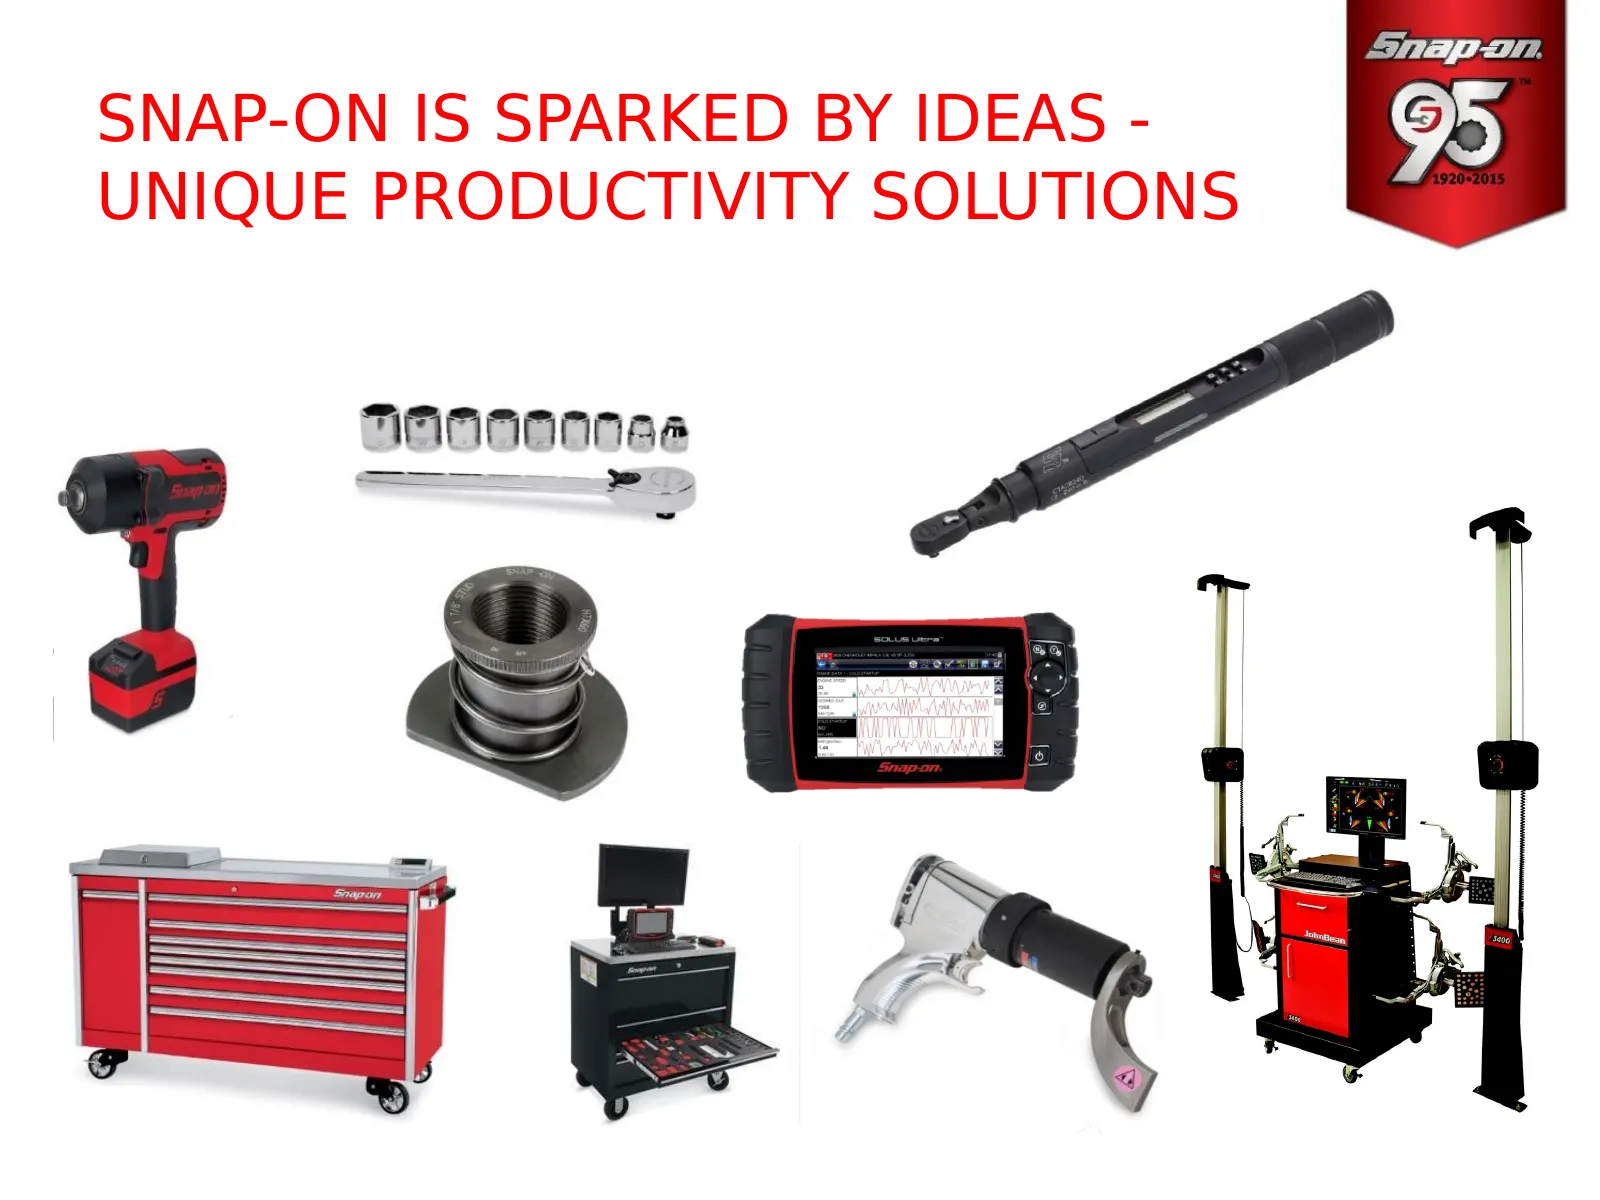
SNAP-ON IS SPARKED BY IDEAS - UNIQUE PRODUCTIVITY SOLUTIONS
Slide 6: Snap-on Is Celebrated by Professionals
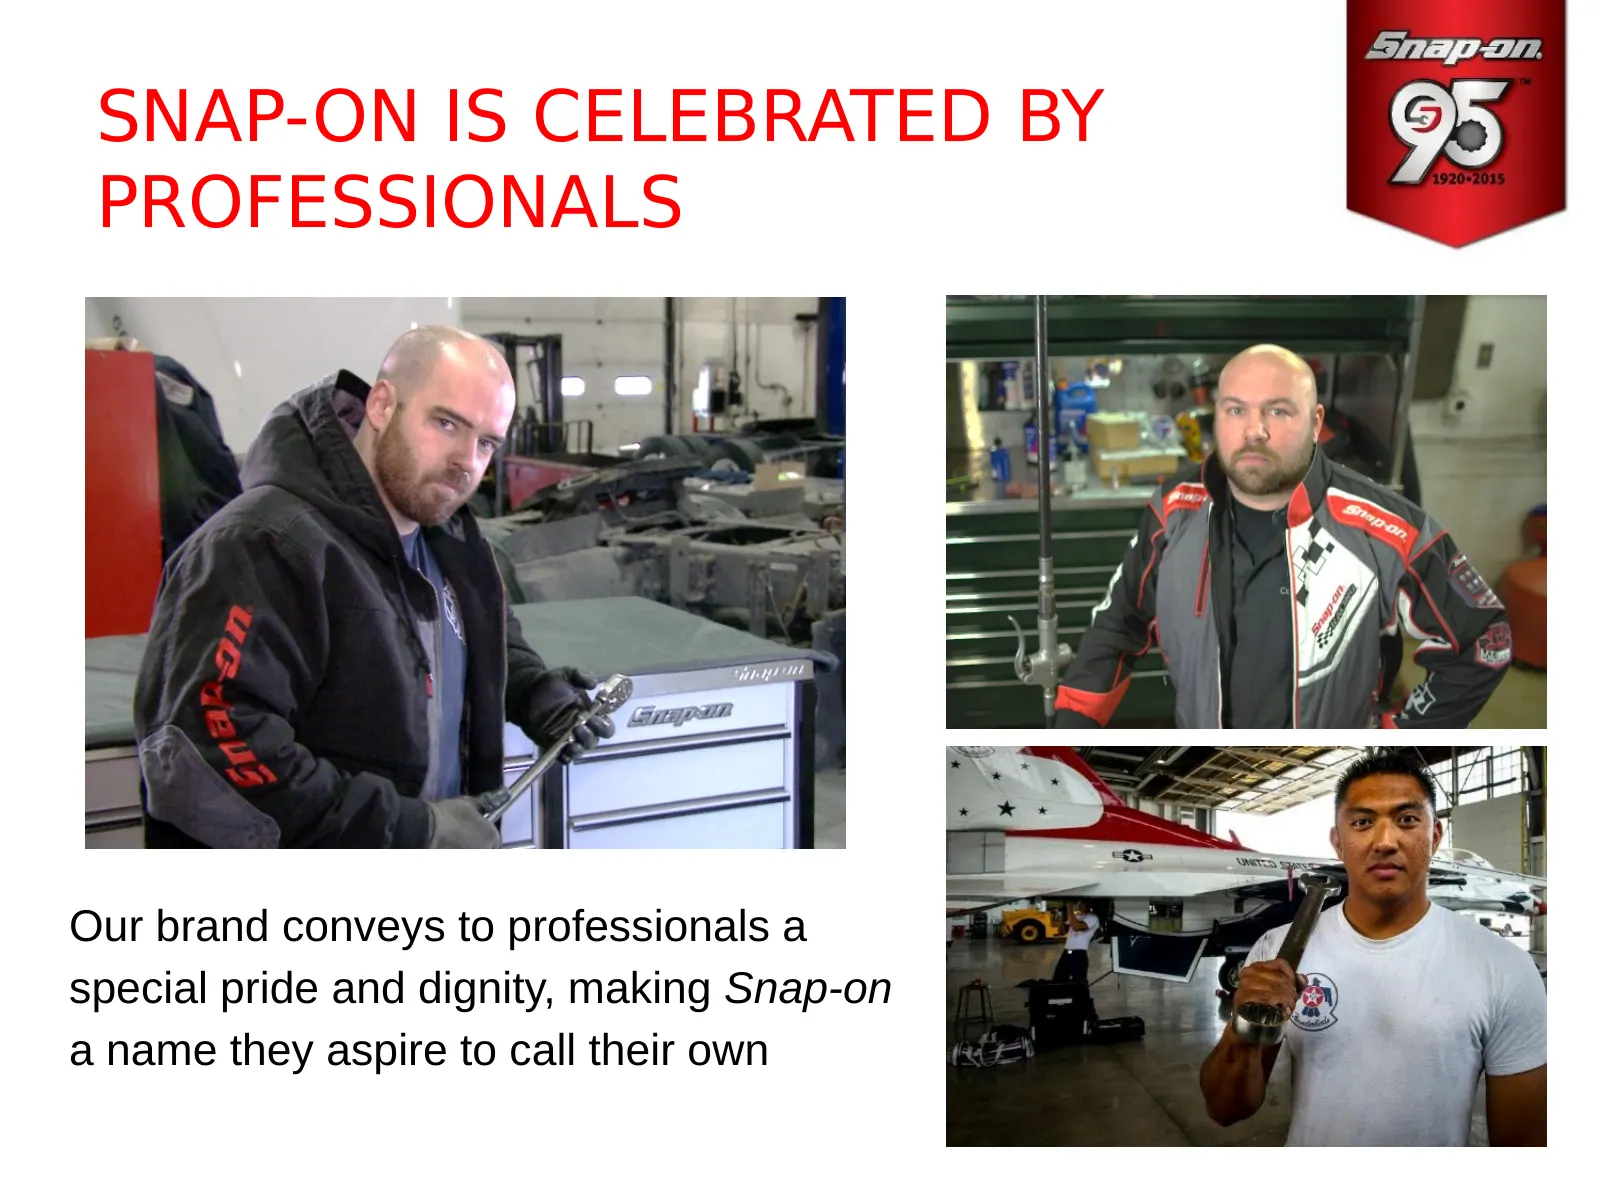
SNAP-ON IS CELEBRATED BY PROFESSIONALS Our brand conveys to professionals a special pride and dignity, making Snap-on a name they aspire to call their own
Slide 7: Unique Brand Strength
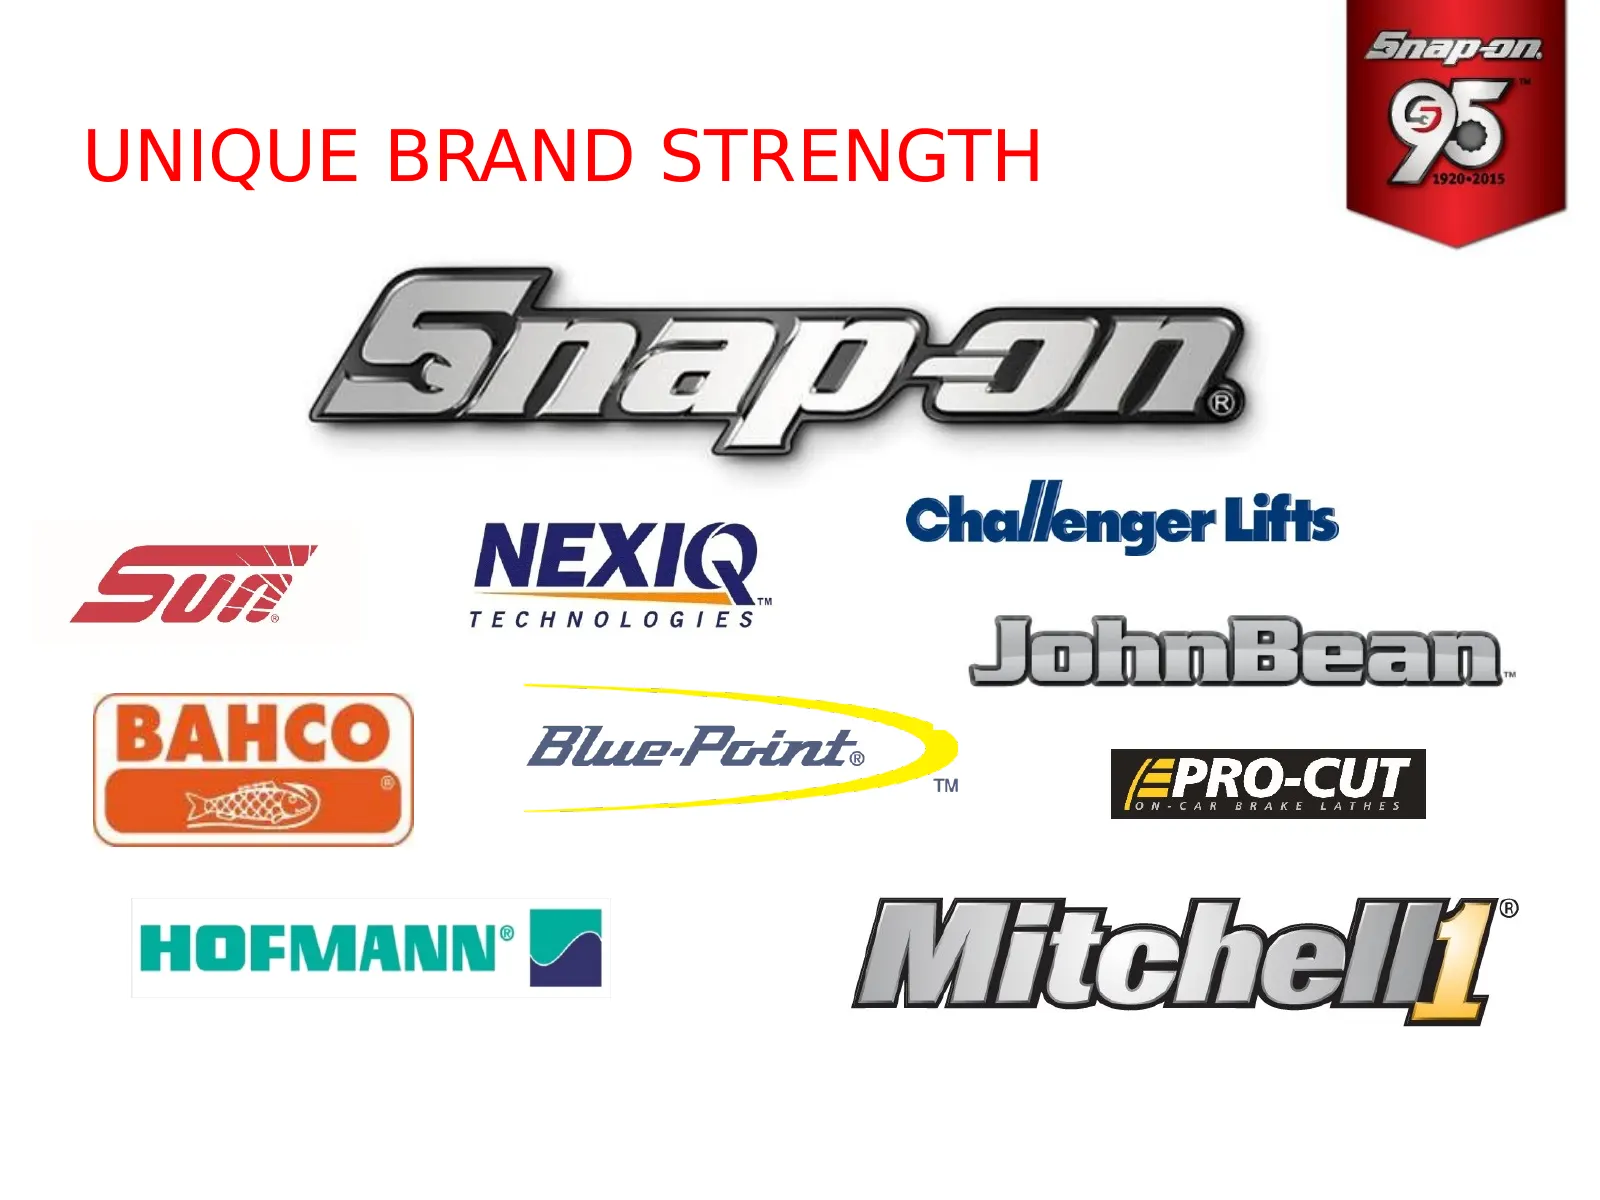
UNIQUE BRAND STRENGTH LITT DIB Chailenger Lifts Di NEXIQ Sohmosean /=PRO-CUT Flue-FPrirt
Slide 8: Organized to Reach Our Primary Customers: Operating Segments
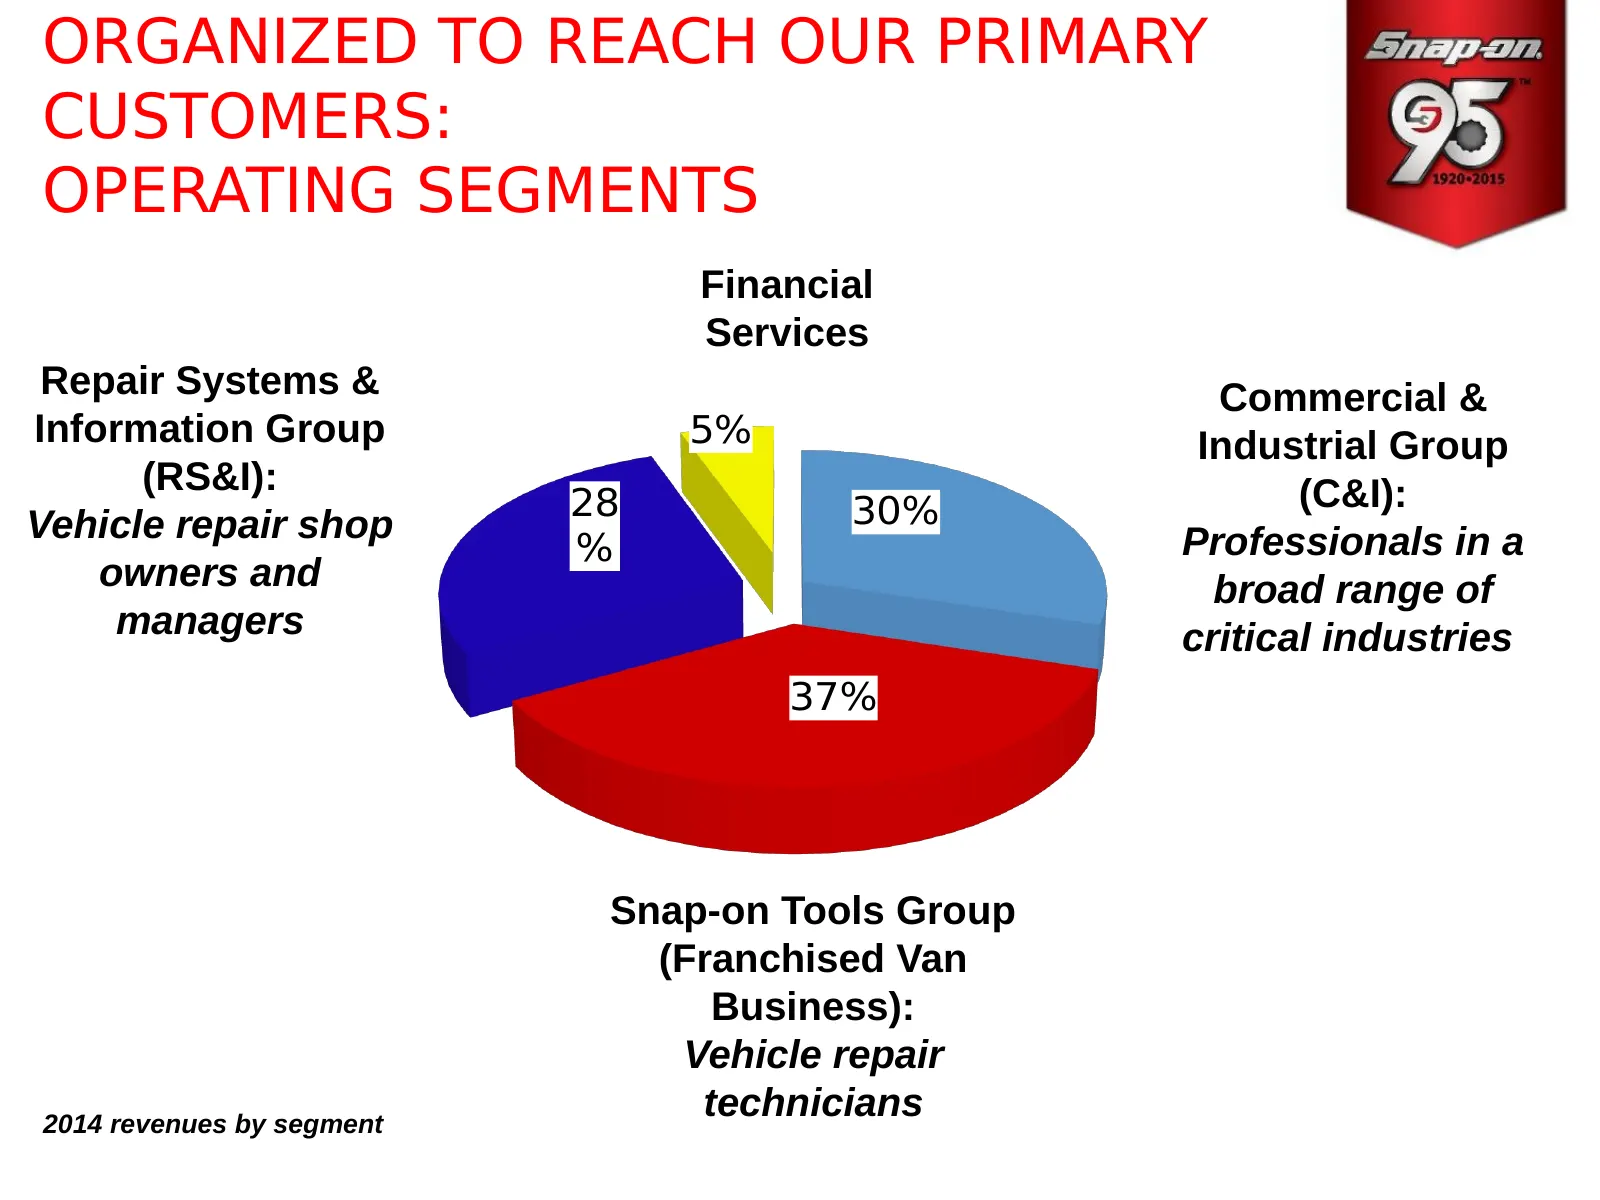
ORGANIZED TO REACH OUR PRIMARY CUSTOMERS: OPERATING SEGMENTS Financial Services Repair Systems & Commercial & Information Group 5% Industrial Group (RS&I): (C&I): 28 30% Vehicle repair shop Professionals in a % owners and broad range of managers critical industries 37% Snap-on Tools Group (Franchise
Slide 9: U.S. Vehicle Aging Drives Service Growth
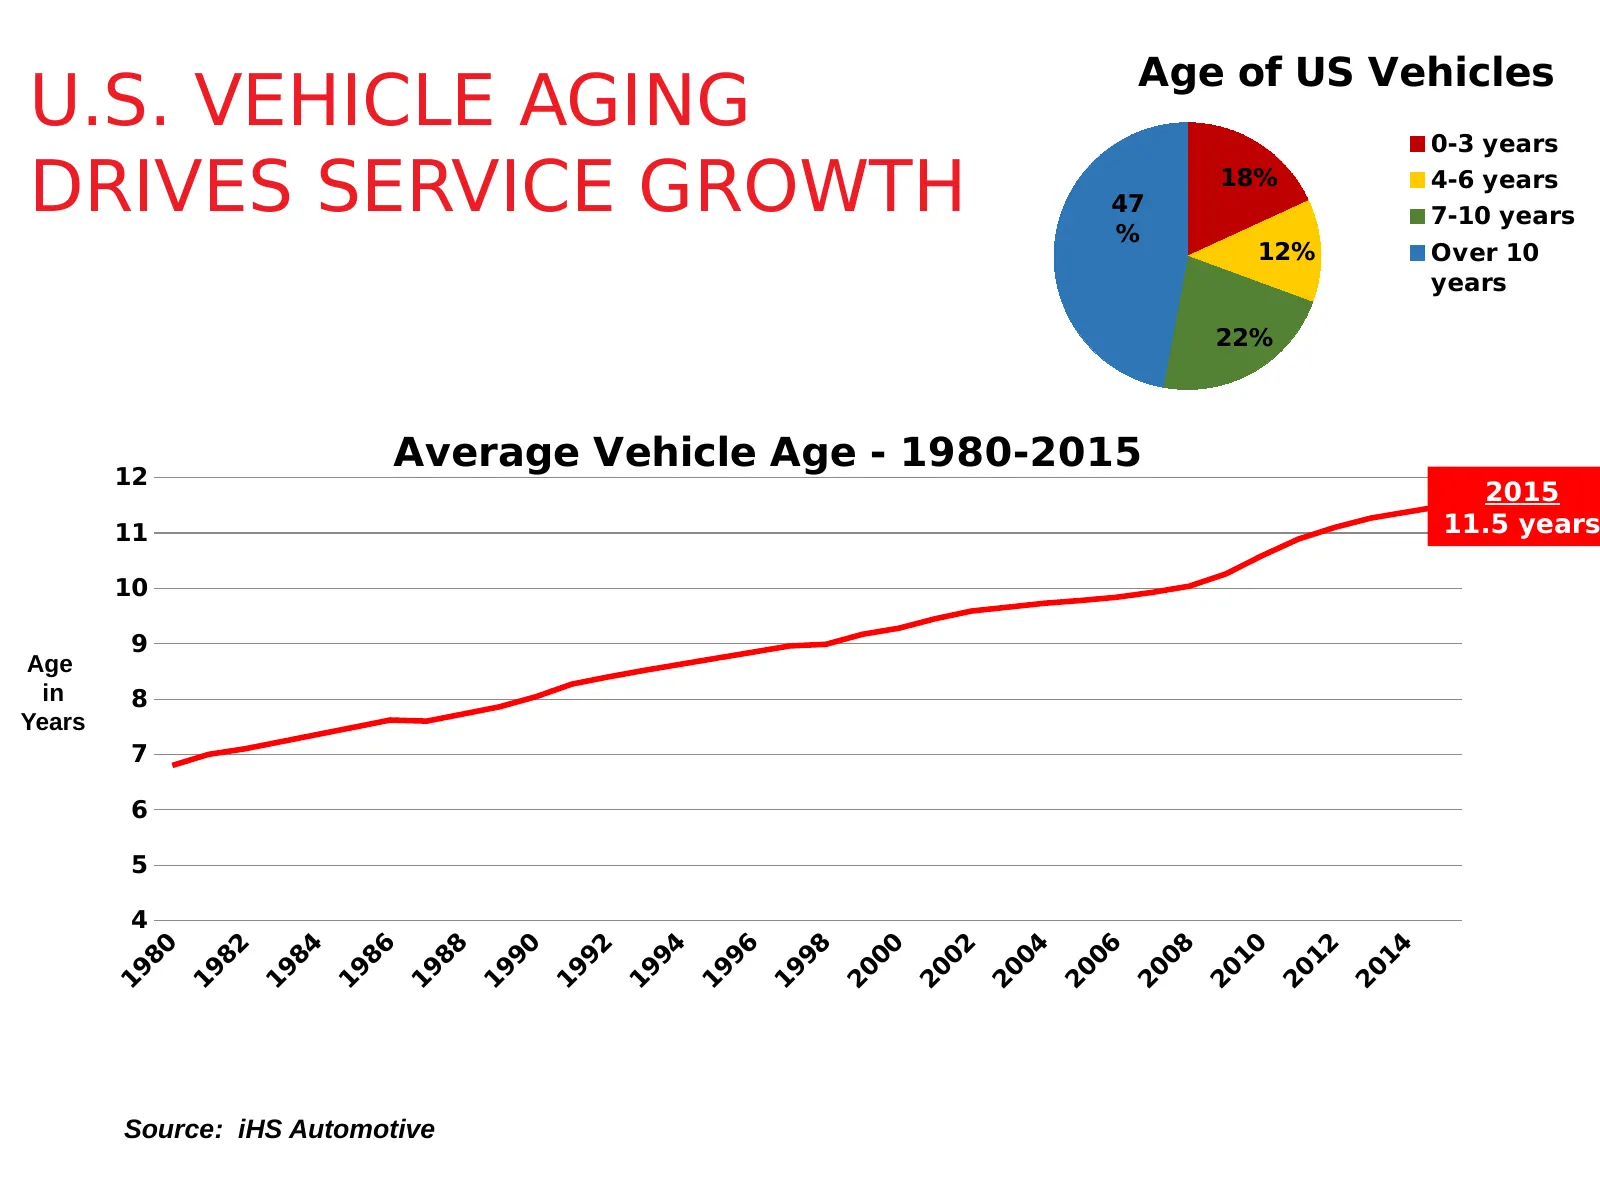
Age of US Vehicles U.S. VEHICLE AGING 0-3 years DRIVES SERVICE GROWTH 47 % 18% 4-6 years 7-10 years 12% Over 10 years 22% 12 Average Vehicle Age - 1980-2015 2015 11 11.5 years 10 9 Age in 8 Years 7 6 5 4 980 982 984 986 988 990 992 994 996 998 000 002 004 006 008 010 012 014 1 1 1 1 1 1 1 1 1 1 2 2
Slide 10: Vehicle Technology & Complexity Provides Opportunity
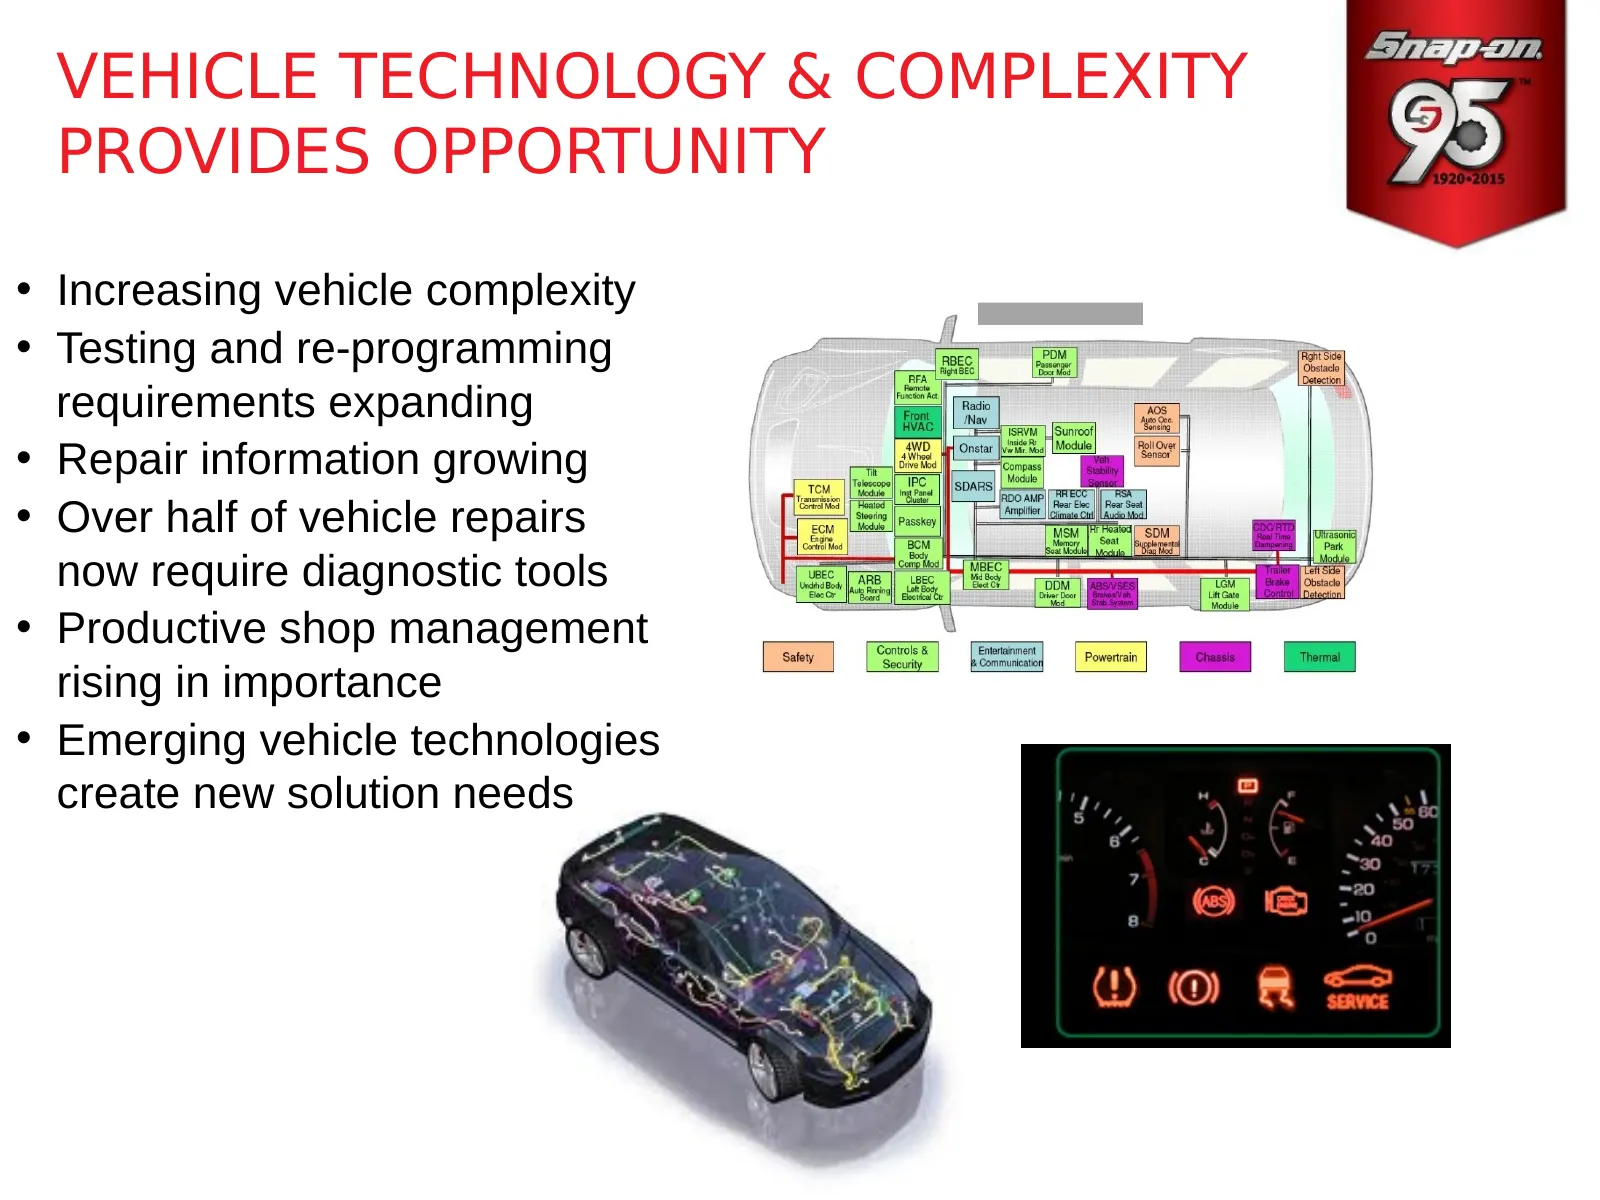
VEHICLE TECHNOLOGY & COMPLEXITY PROVIDES OPPORTUNITY • Increasing vehicle complexity • Testing and re-programming requirements expanding • Repair information growing • Over half of vehicle repairs now require diagnostic tools • Productive shop management rising in importance • Emerging vehicle techn

Slide 11: The Way Forward: Runways for Improvement
The Way Forward: Runways for Improvement Runways for Growth
Slide 12: Runways for Improvement: Snap-on Value Creation
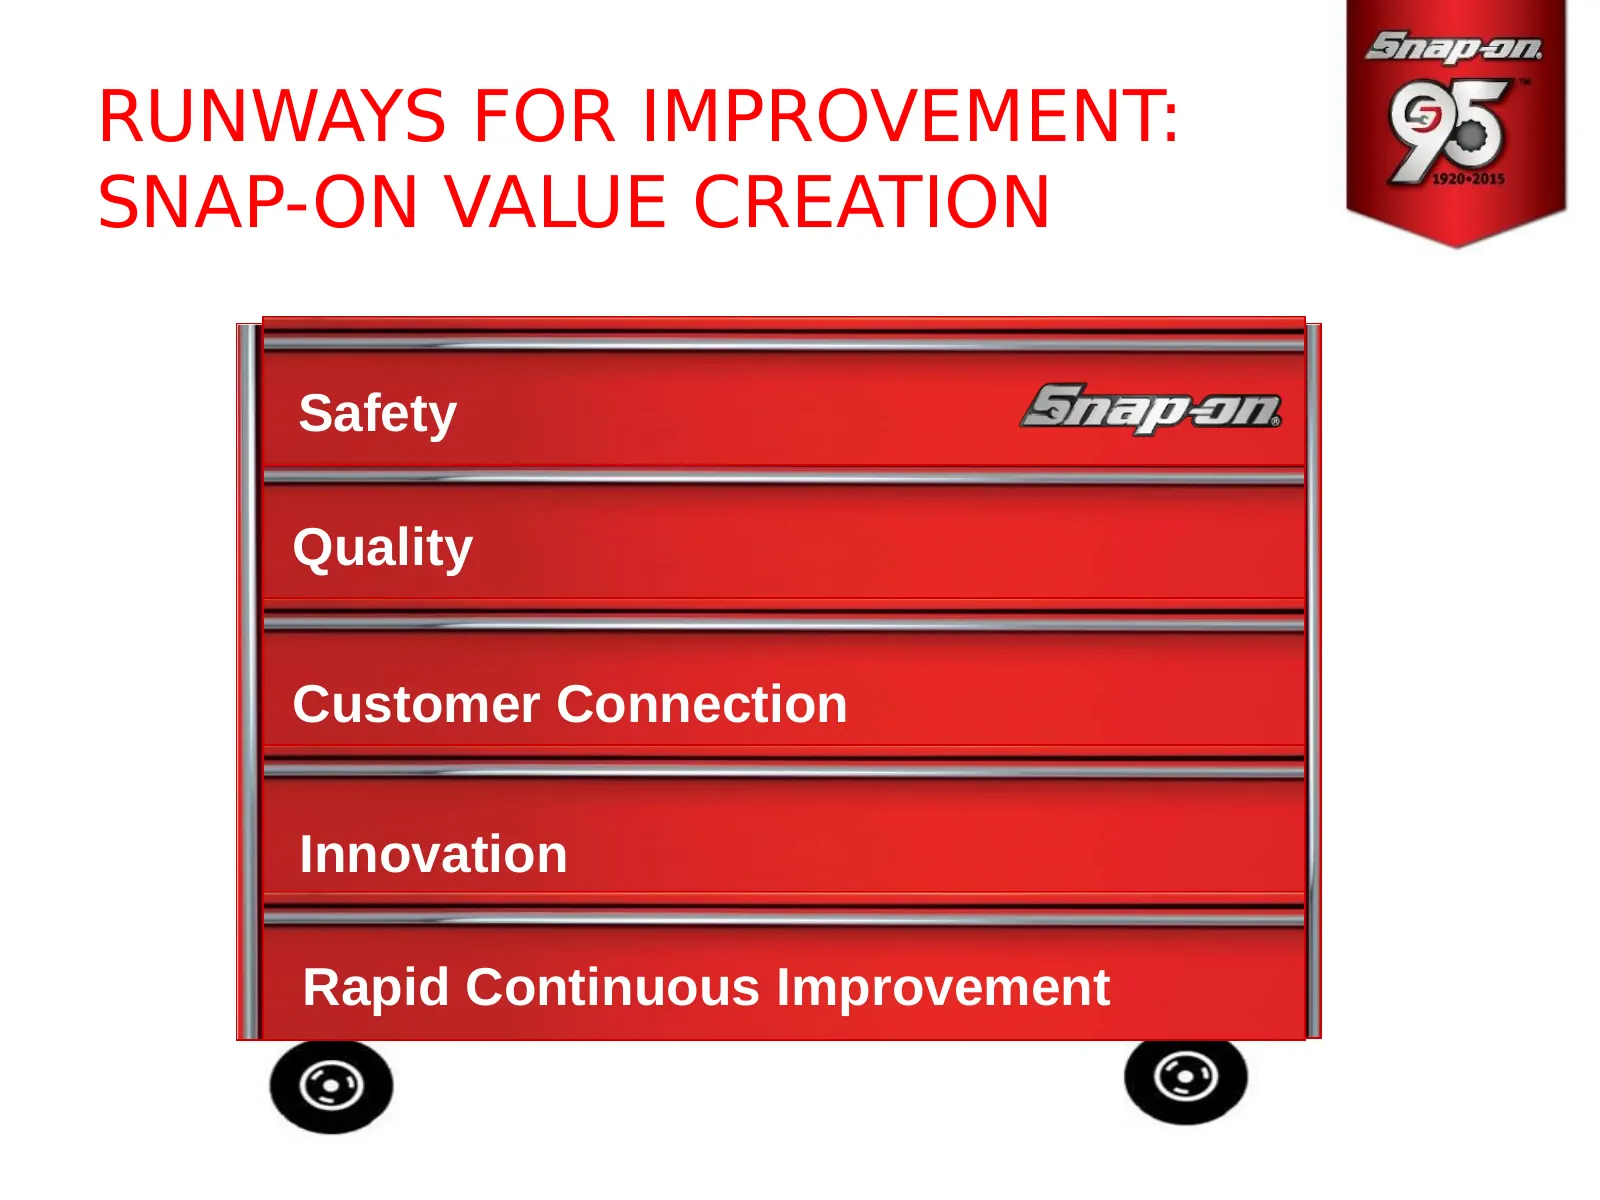
RUNWAYS FOR IMPROVEMENT: SNAP-ON VALUE CREATION Safety Cell Design Quality Customer Connection Innovation Rapid Continuous Improvement
Slide 13: Snap-on Value Creation: Safety
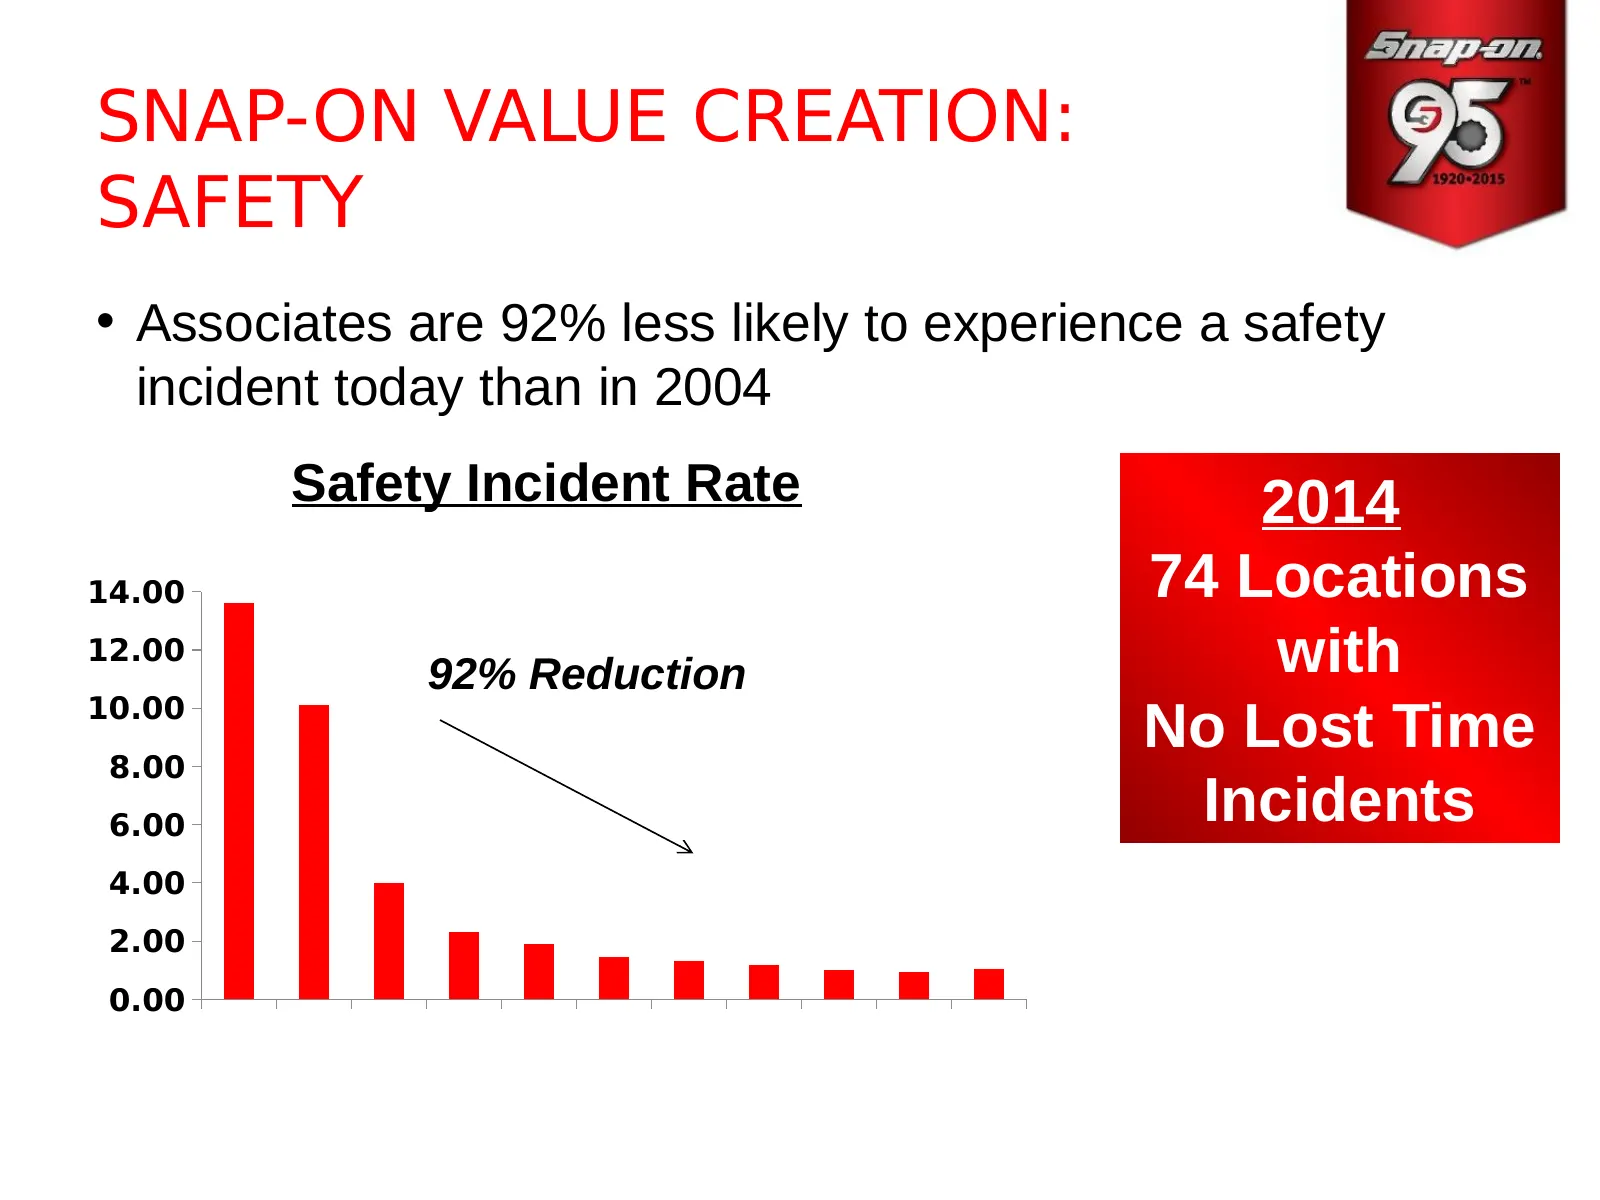
SNAP-ON VALUE CREATION: SAFETY • Associates are 92% less likely to experience a safety incident today than in 2004 Safety Incident Rate 2014 14.00 74 Locations 12.00 92% Reduction with 10.00 8.00 No Lost Time 6.00 Incidents 4.00 2.00 0.00
Slide 14: Snap-on Value Creation: Quality
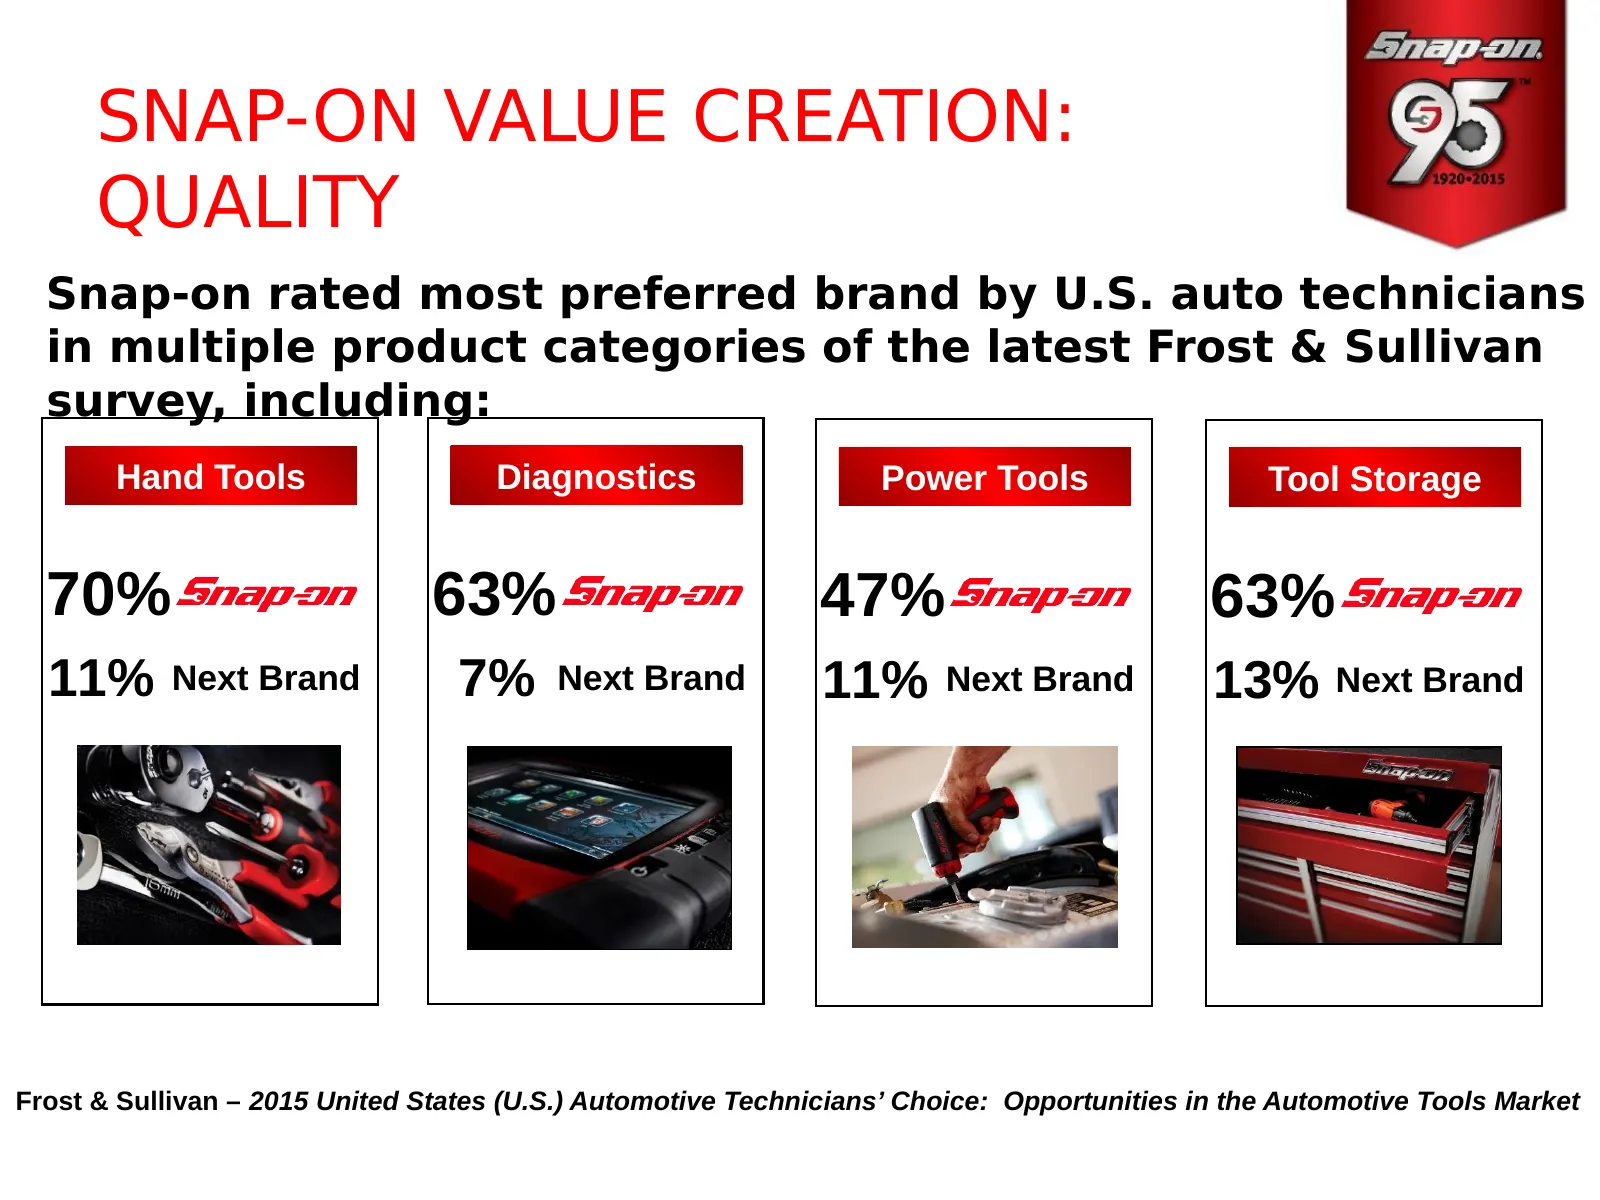
SNAP-ON VALUE CREATION: QUALITY Snap-on rated most preferred brand by U.S. auto technicians in multiple product categories of the latest Frost & Sullivan survey, including: Hand Tools Diagnostics Power Tools Tool Storage 70% 63% 47% 63% 11% Next Brand 7% Next Brand 11% Next Brand 13% Next Brand Fros
Slide 15: Snap-on Value Creation: Customer Connection
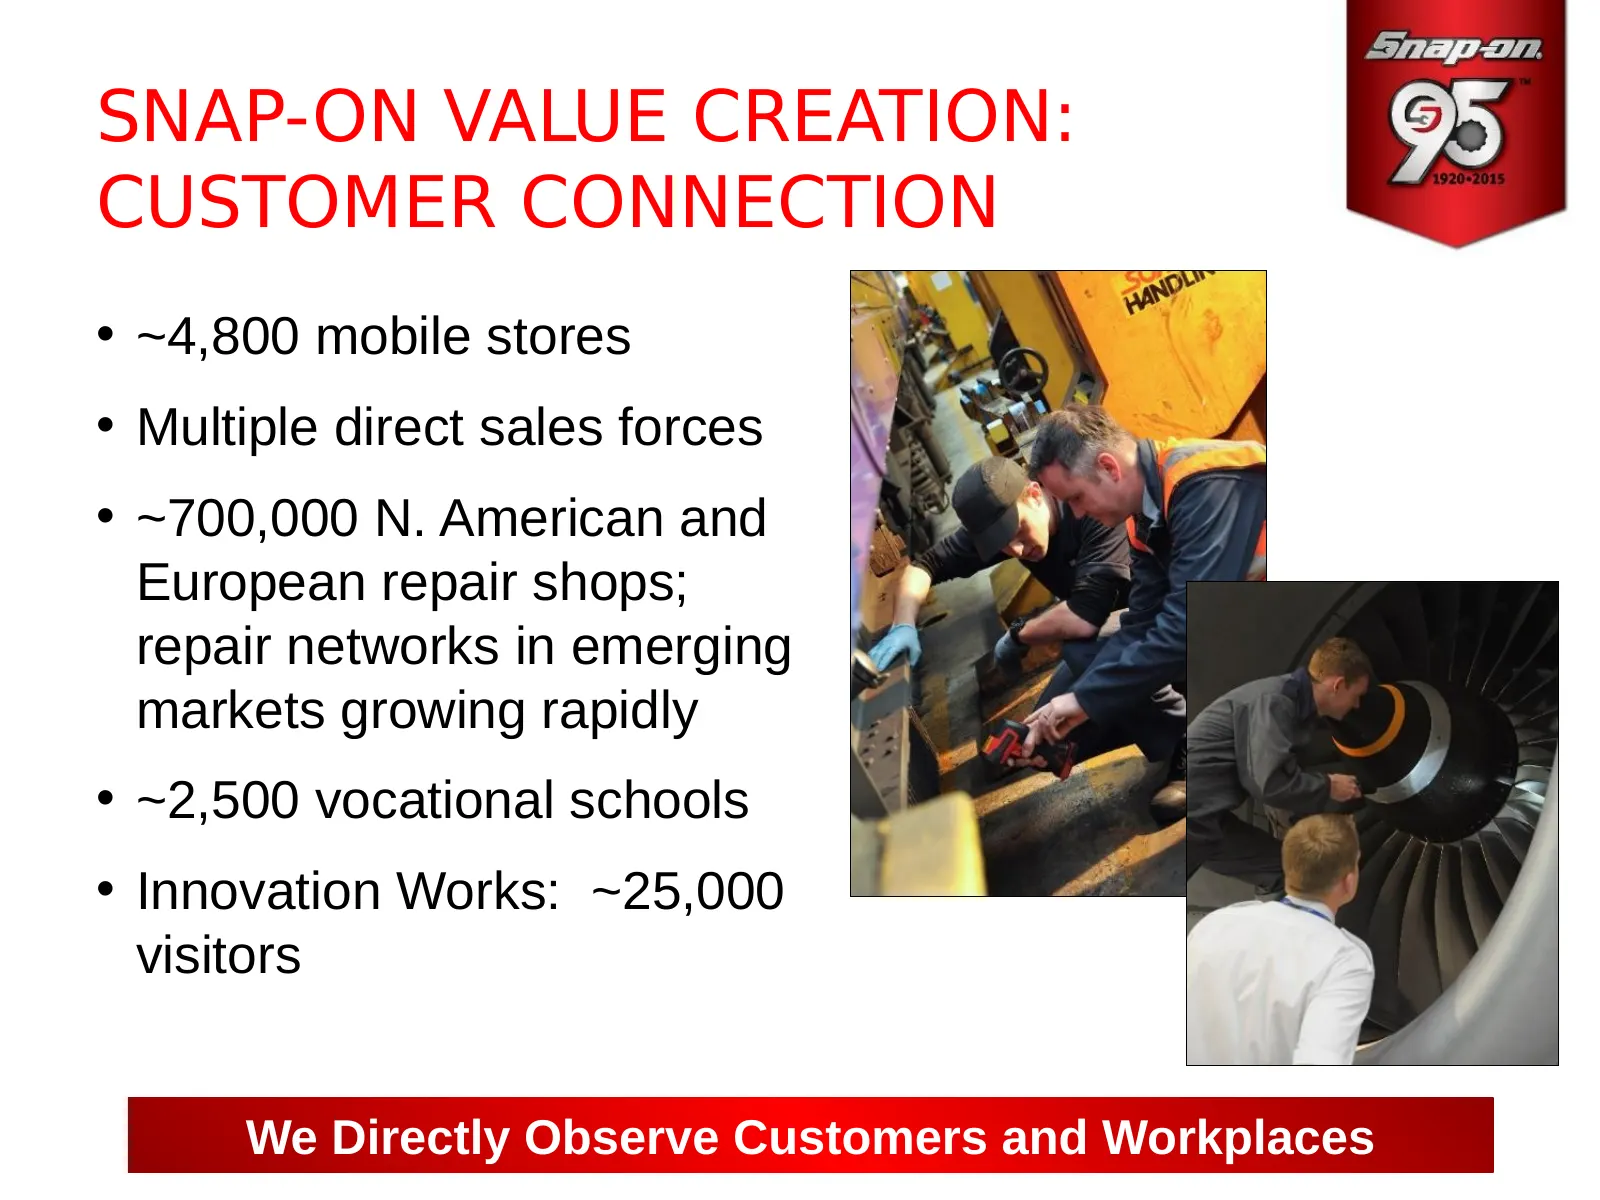
SNAP-ON VALUE CREATION: CUSTOMER CONNECTION • ~4,800 mobile stores • Multiple direct sales forces • ~700,000 N. American and European repair shops; repair networks in emerging markets growing rapidly • ~2,500 vocational schools • Innovation Works: ~25,000 visitors We Directly Observe Customers and W

Slide 16: Innovation - New Product Awards and Successes
SNAP-ON VALUE CREATION: INNOVATION - NEW PRODUCT AWARDS AND SUCCESSES Possible + Practical = Innovation
Slide 17: Snap-on Value Creation: Rapid Continuous Improvement (RCI)
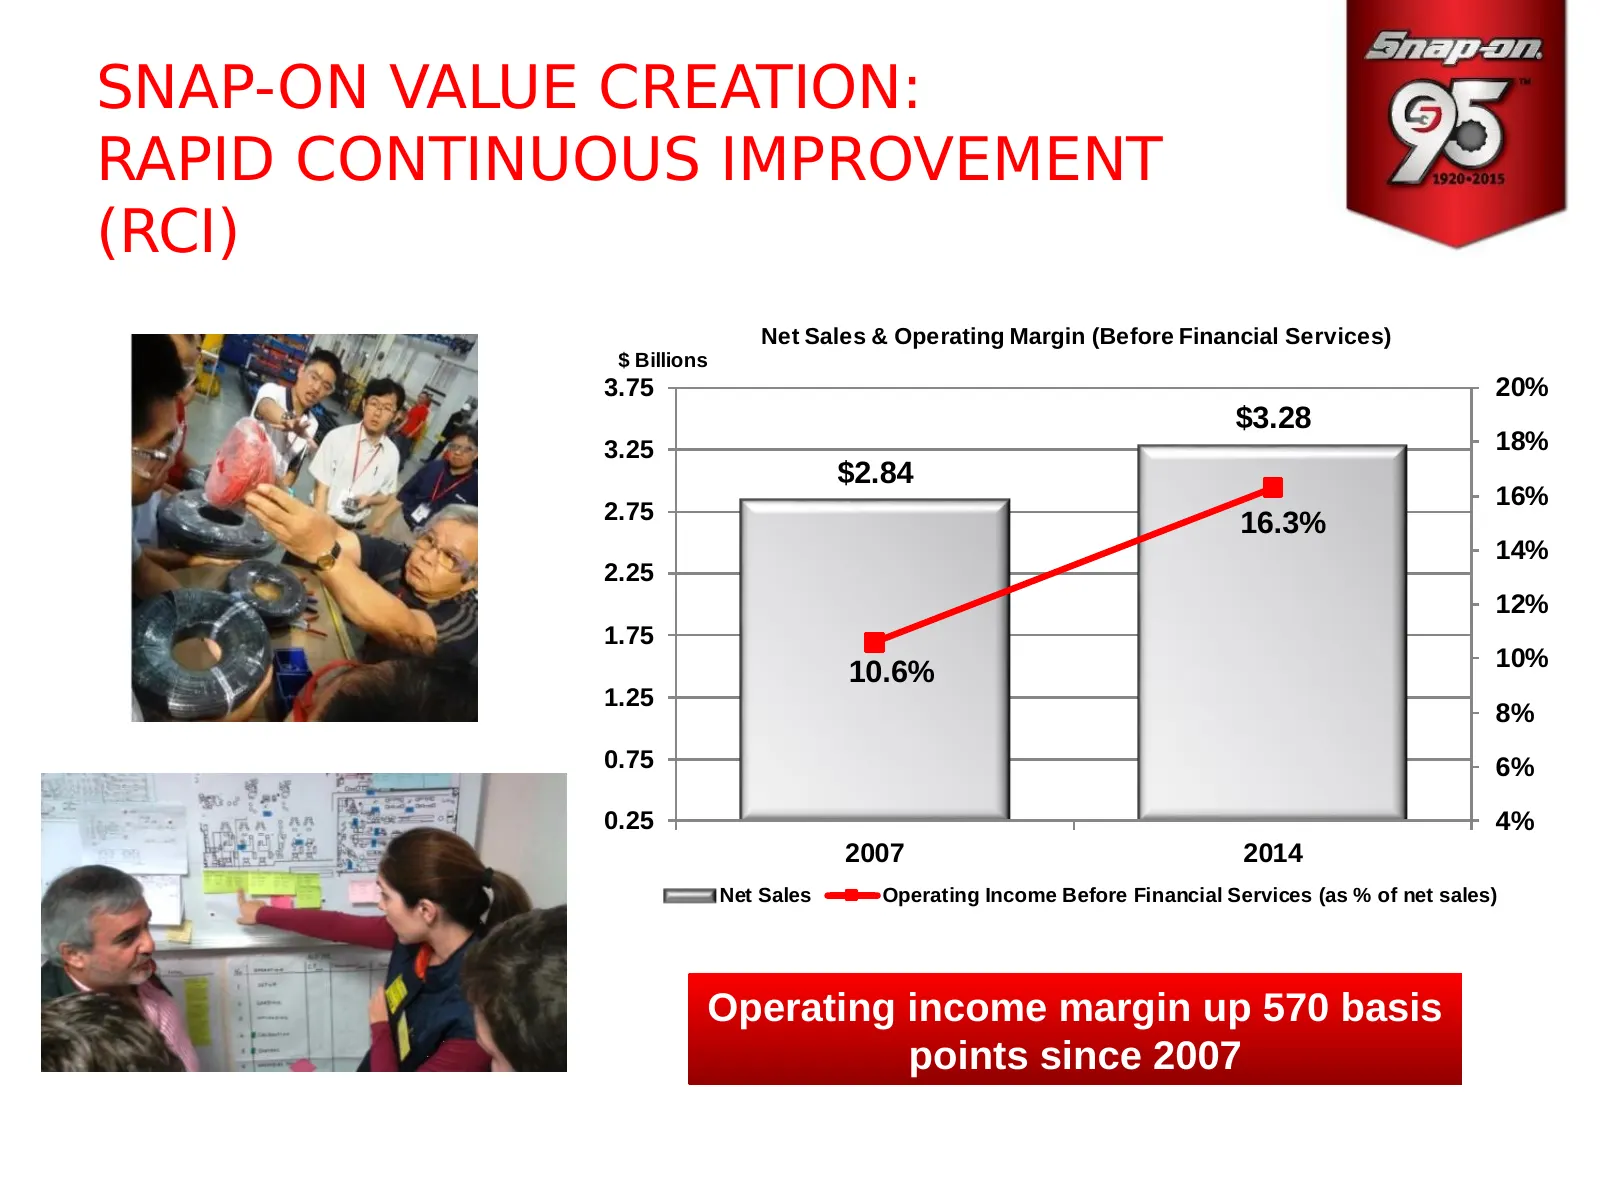
SNAP-ON VALUE CREATION: RAPID CONTINUOUS IMPROVEMENT (RCI) Net Sales & Operating Margin (Before Financial Services) $ Billions 3.75 20% $3.28 3.25 18% $2.84 16% 2.75 16.3% 14% 2.25 12% 1.75 10% 10.6% 1.25 8% 0.75 6% 0.25 4% 2007 2014 Net Sales Operating Income Before Financial Services (as % of net
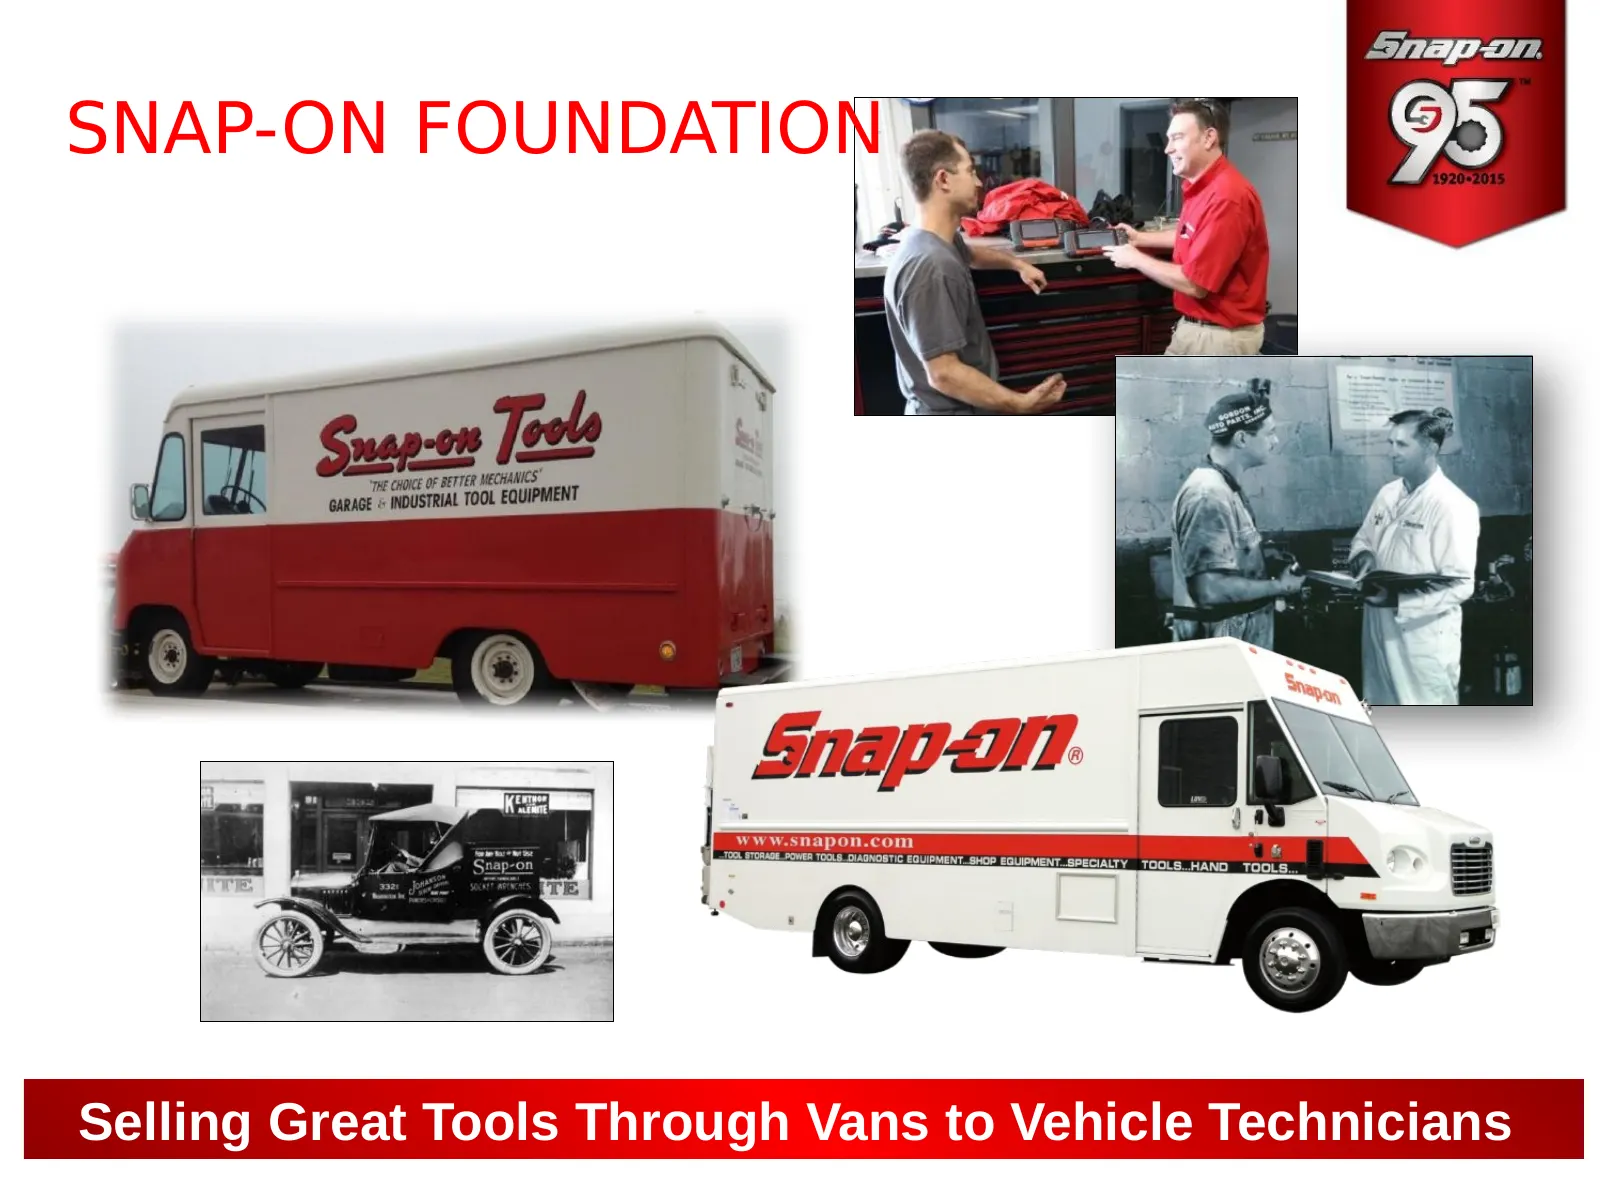
Slide 18: Snap-on Foundation
SNAP-ON FOUNDATION Selling Great Tools Through Vans to Vehicle Technicians
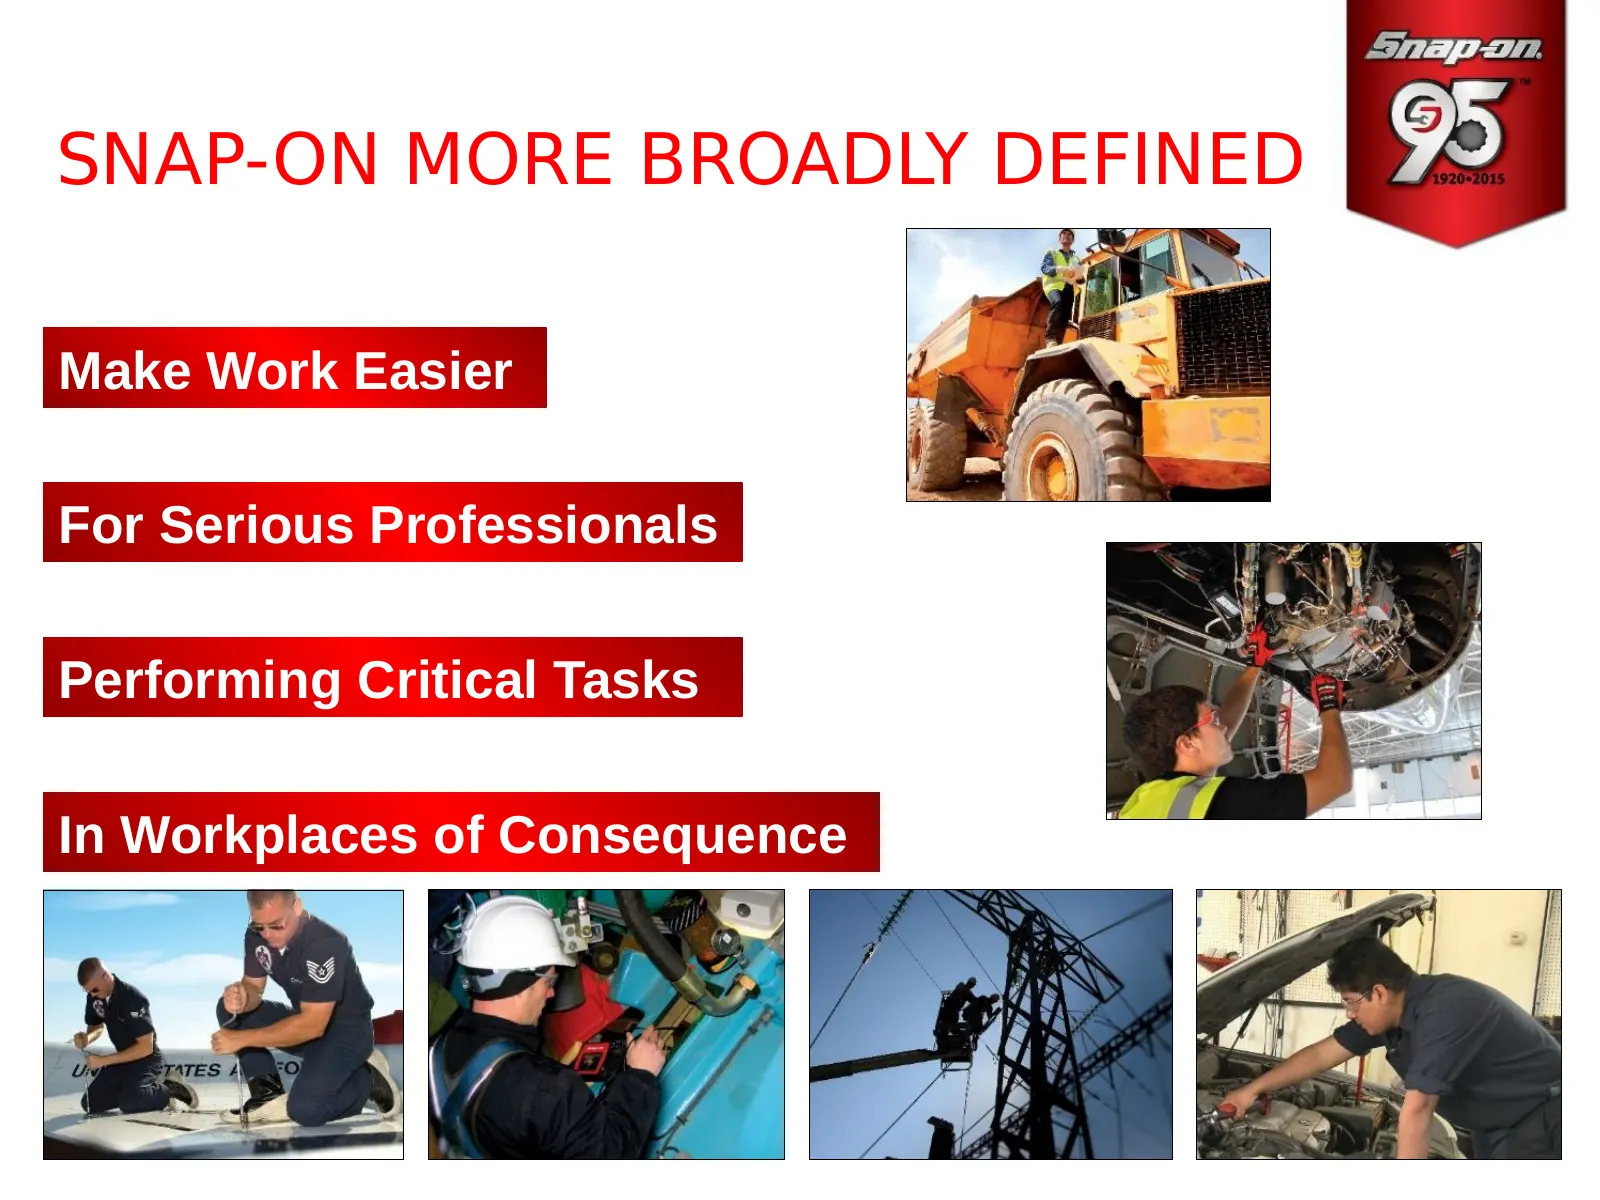
Slide 19: Snap-on More Broadly Defined
SNAP-ON MORE BROADLY DEFINED Make Work Easier For Serious Professionals Performing Critical Tasks In Workplaces of Consequence
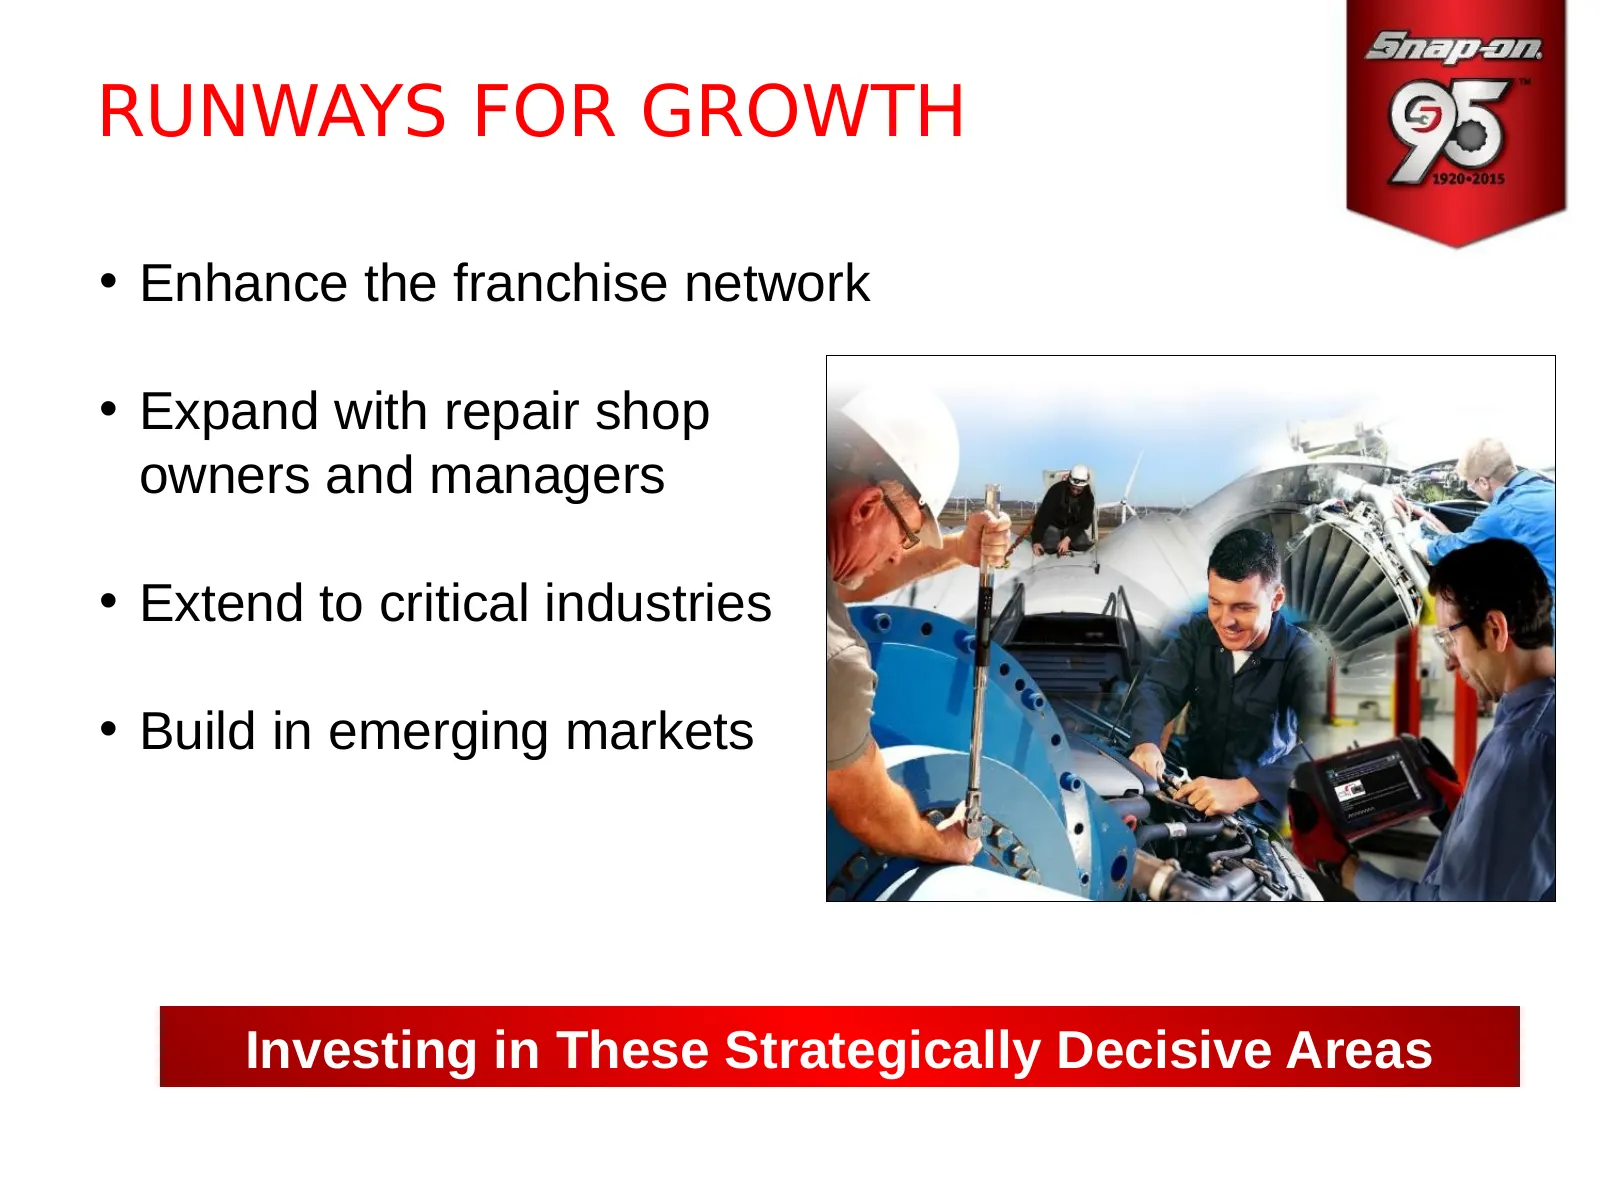
Slide 20: Runways for Growth
RUNWAYS FOR GROWTH • Enhance the franchise network • Expand with repair shop owners and managers • Extend to critical industries • Build in emerging markets Investing in These Strategically Decisive Areas
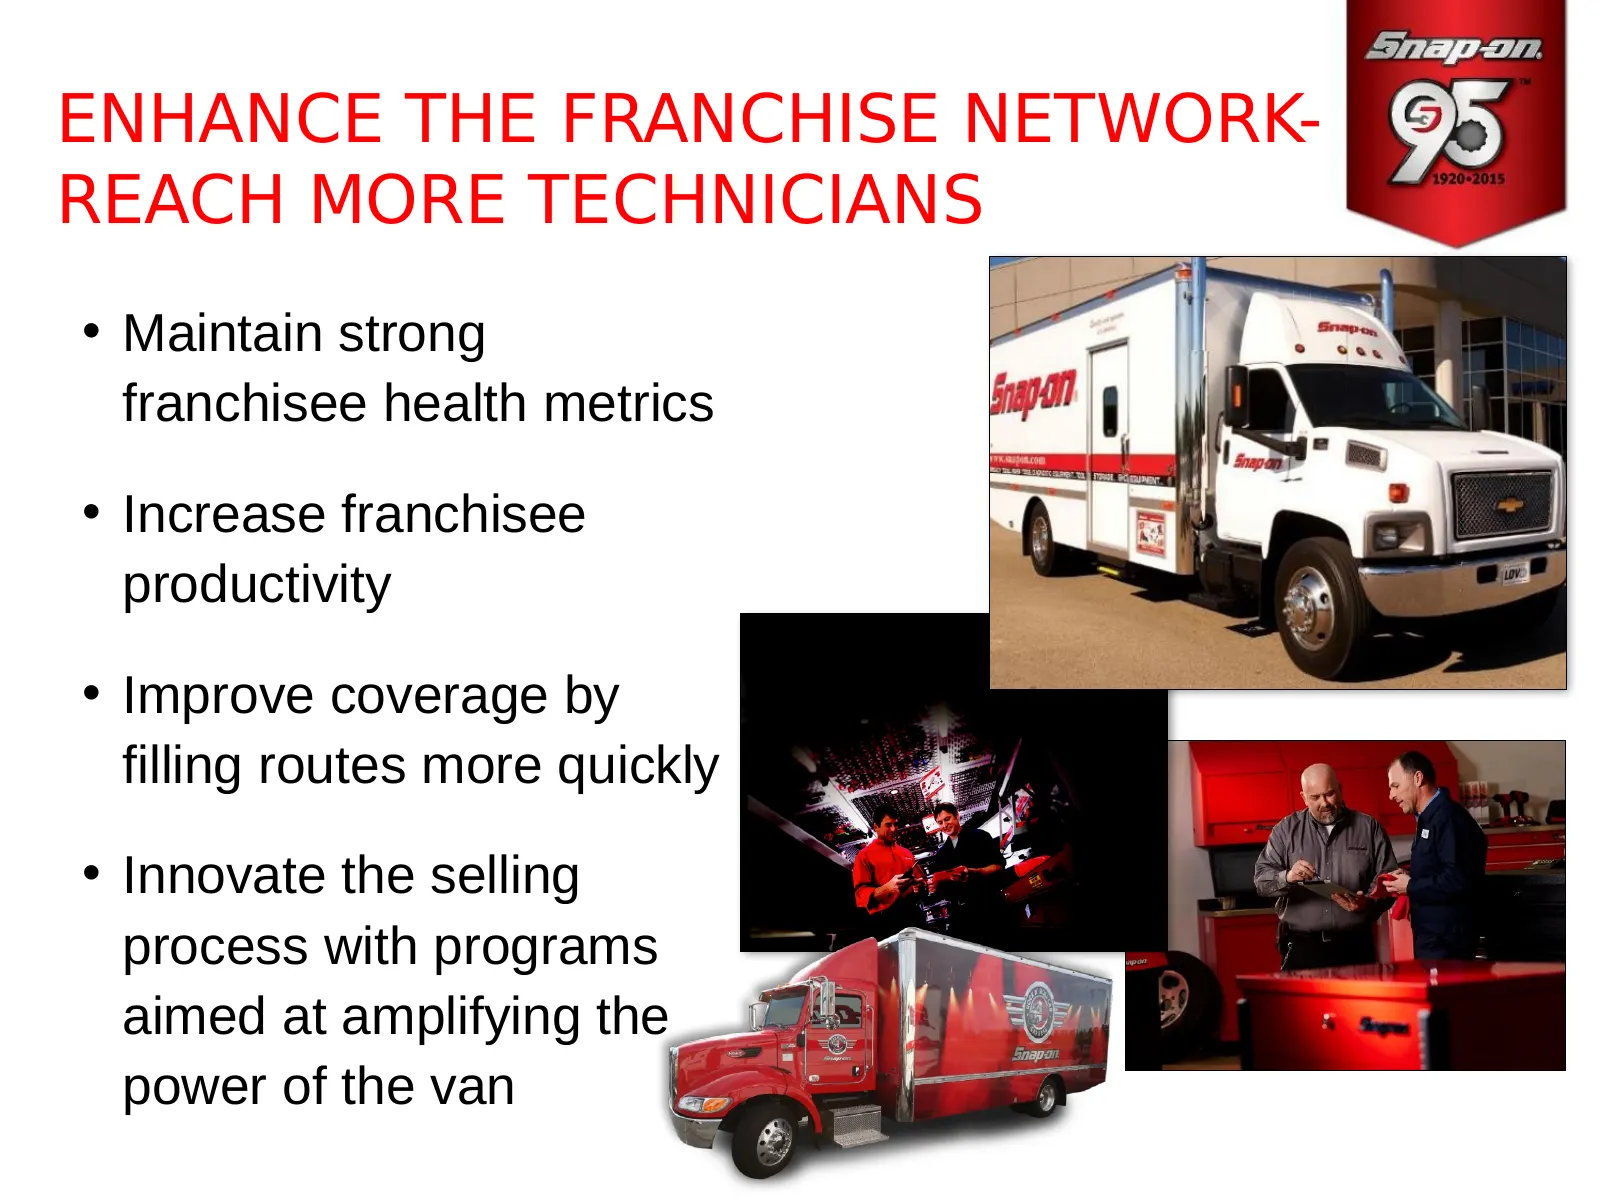
Slide 21: Enhance the Franchise Network - Reach More Technicians
ENHANCE THE FRANCHISE NETWORK- REACH MORE TECHNICIANS • Maintain strong franchisee health metrics • Increase franchisee productivity • Improve coverage by filling routes more quickly • Innovate the selling process with programs aimed at amplifying the power of the van
Slide 22: Expand with Repair Shop Owners and Managers
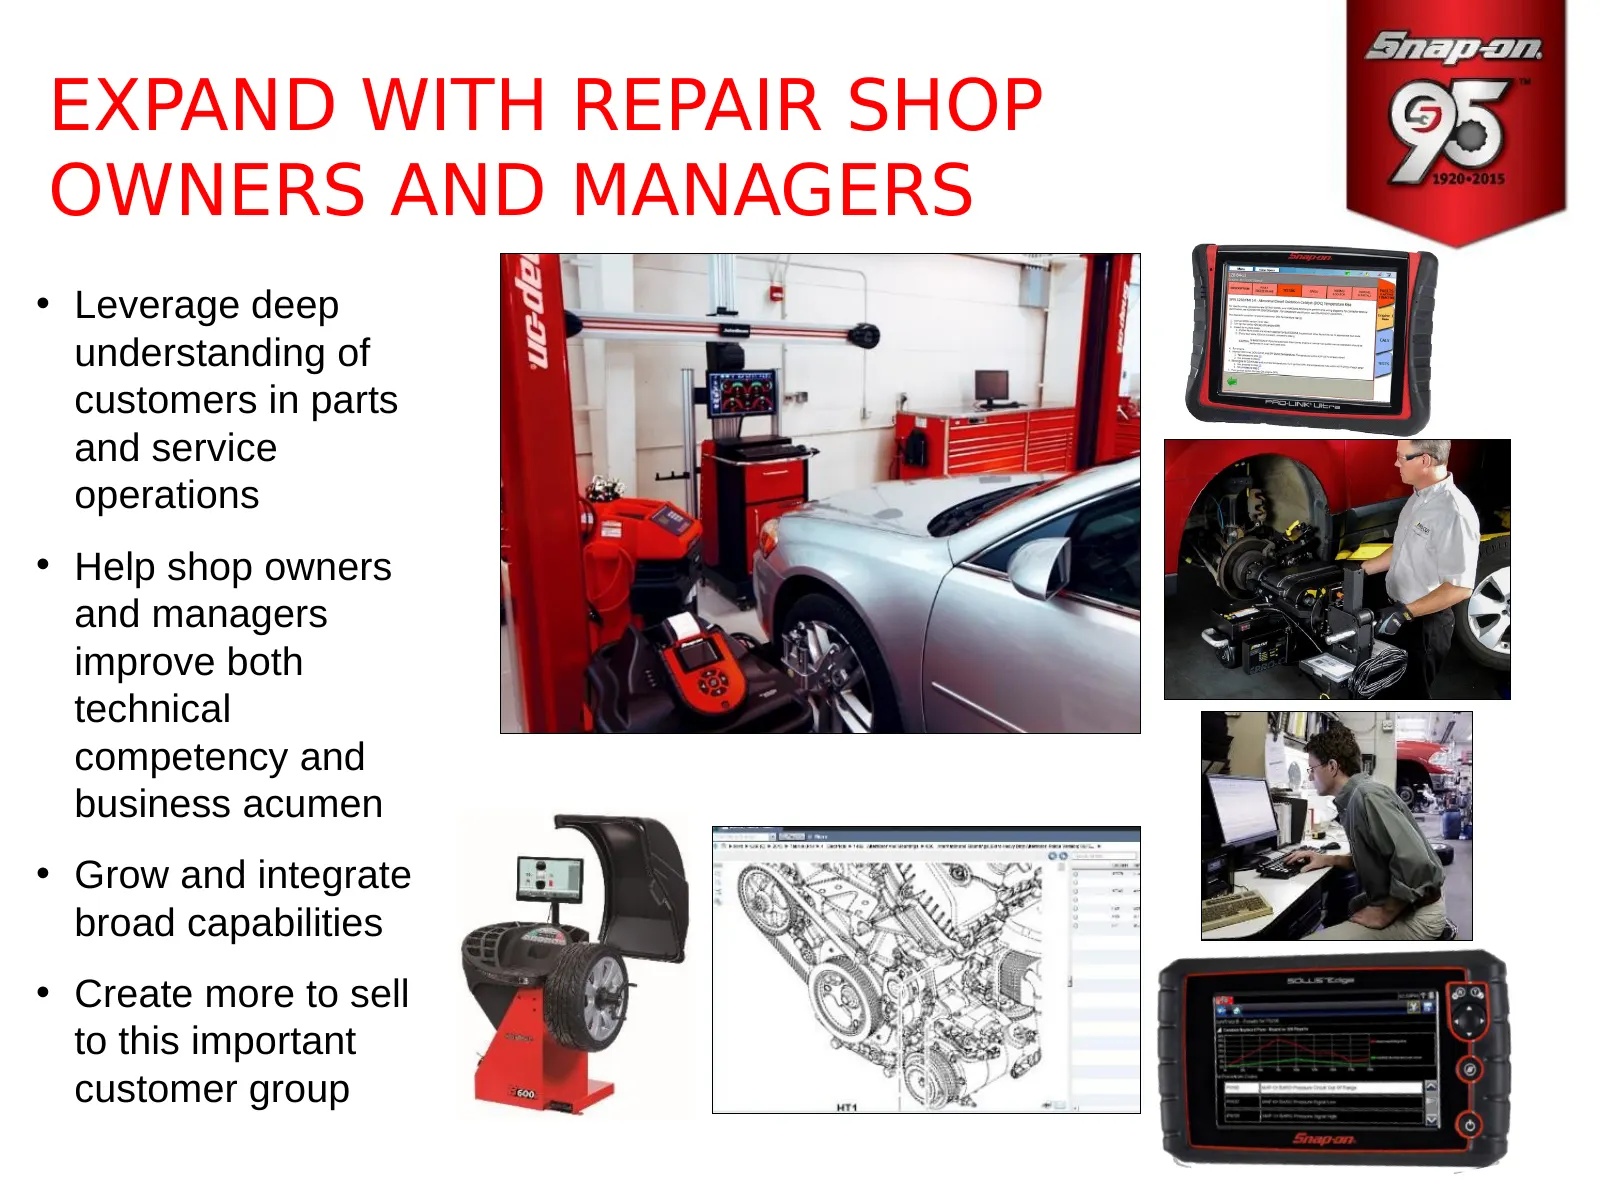
EXPAND WITH REPAIR SHOP OWNERS AND MANAGERS • Leverage deep understanding of customers in parts and service operations • Help shop owners and managers improve both technical competency and business acumen • Grow and integrate broad capabilities • Create more to sell to this important customer group
Slide 23: Extend to Critical Industries
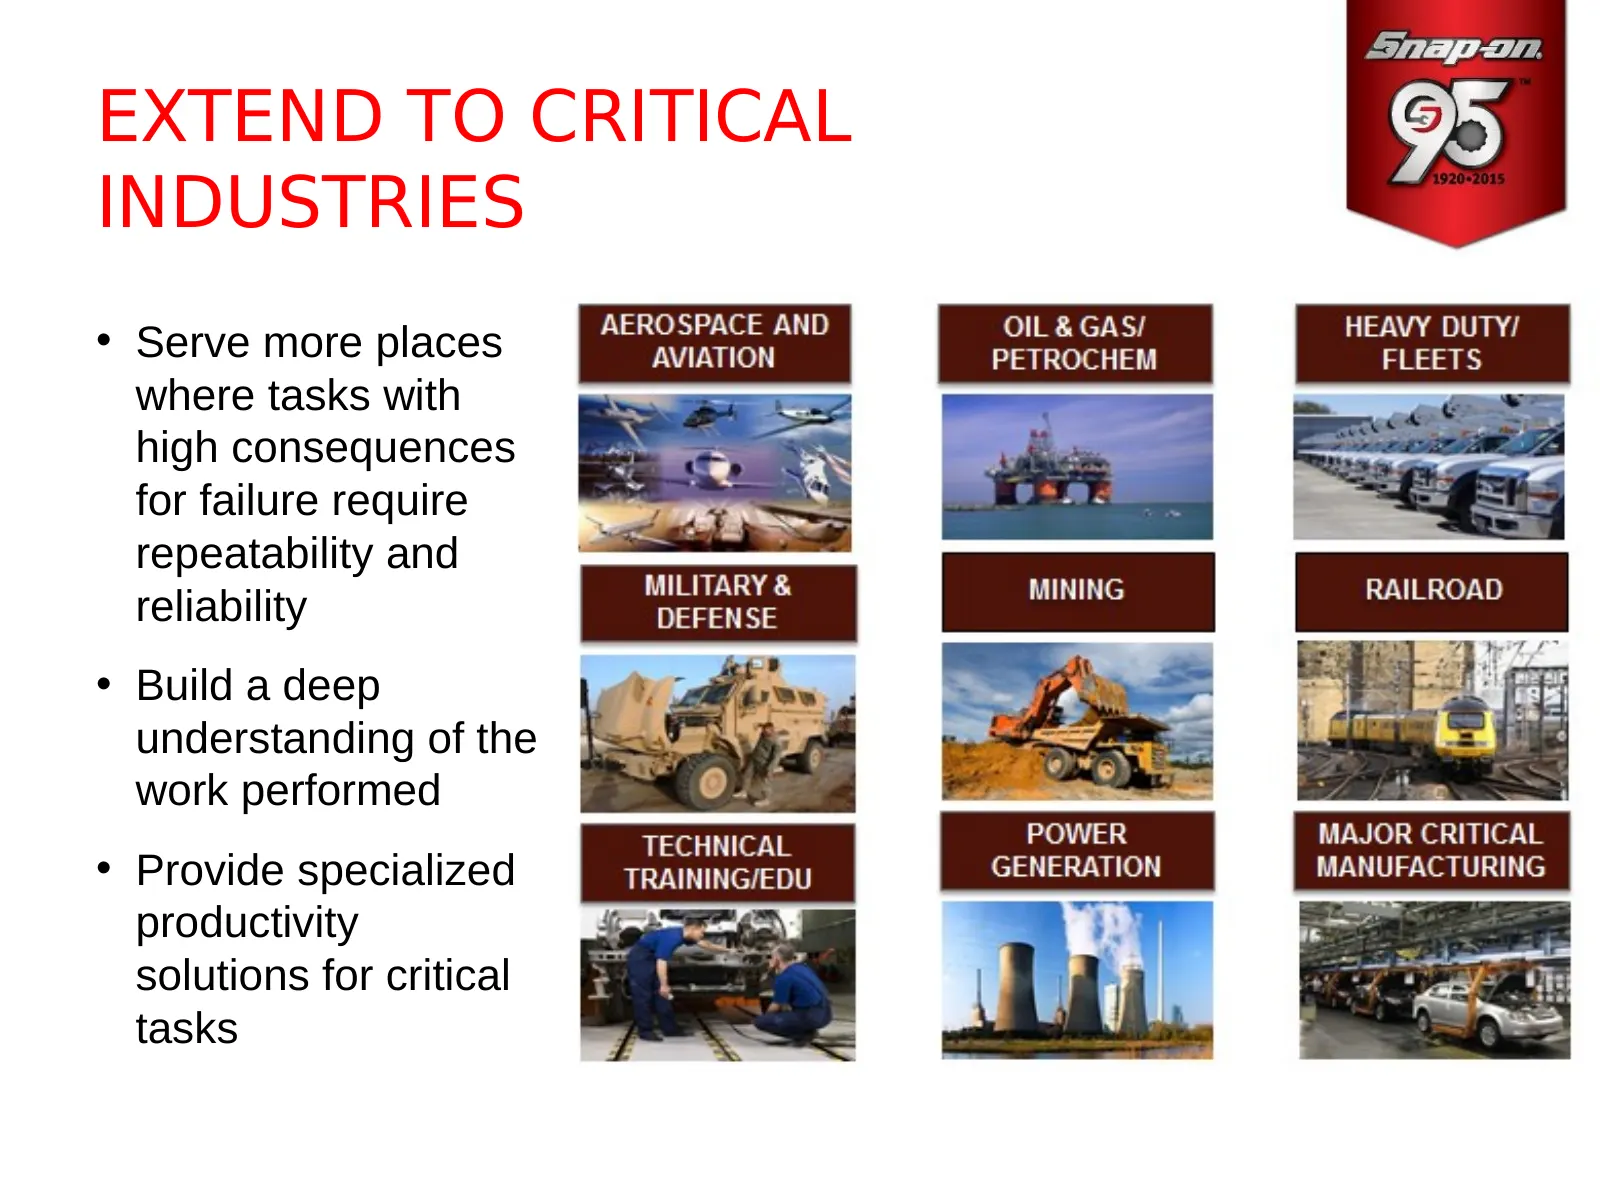
EXTEND TO CRITICAL INDUSTRIES • Serve more places where tasks with high consequences for failure require repeatability and reliability • Build a deep understanding of the work performed • Provide specialized productivity solutions for critical tasks
Slide 24: Build in Emerging Markets
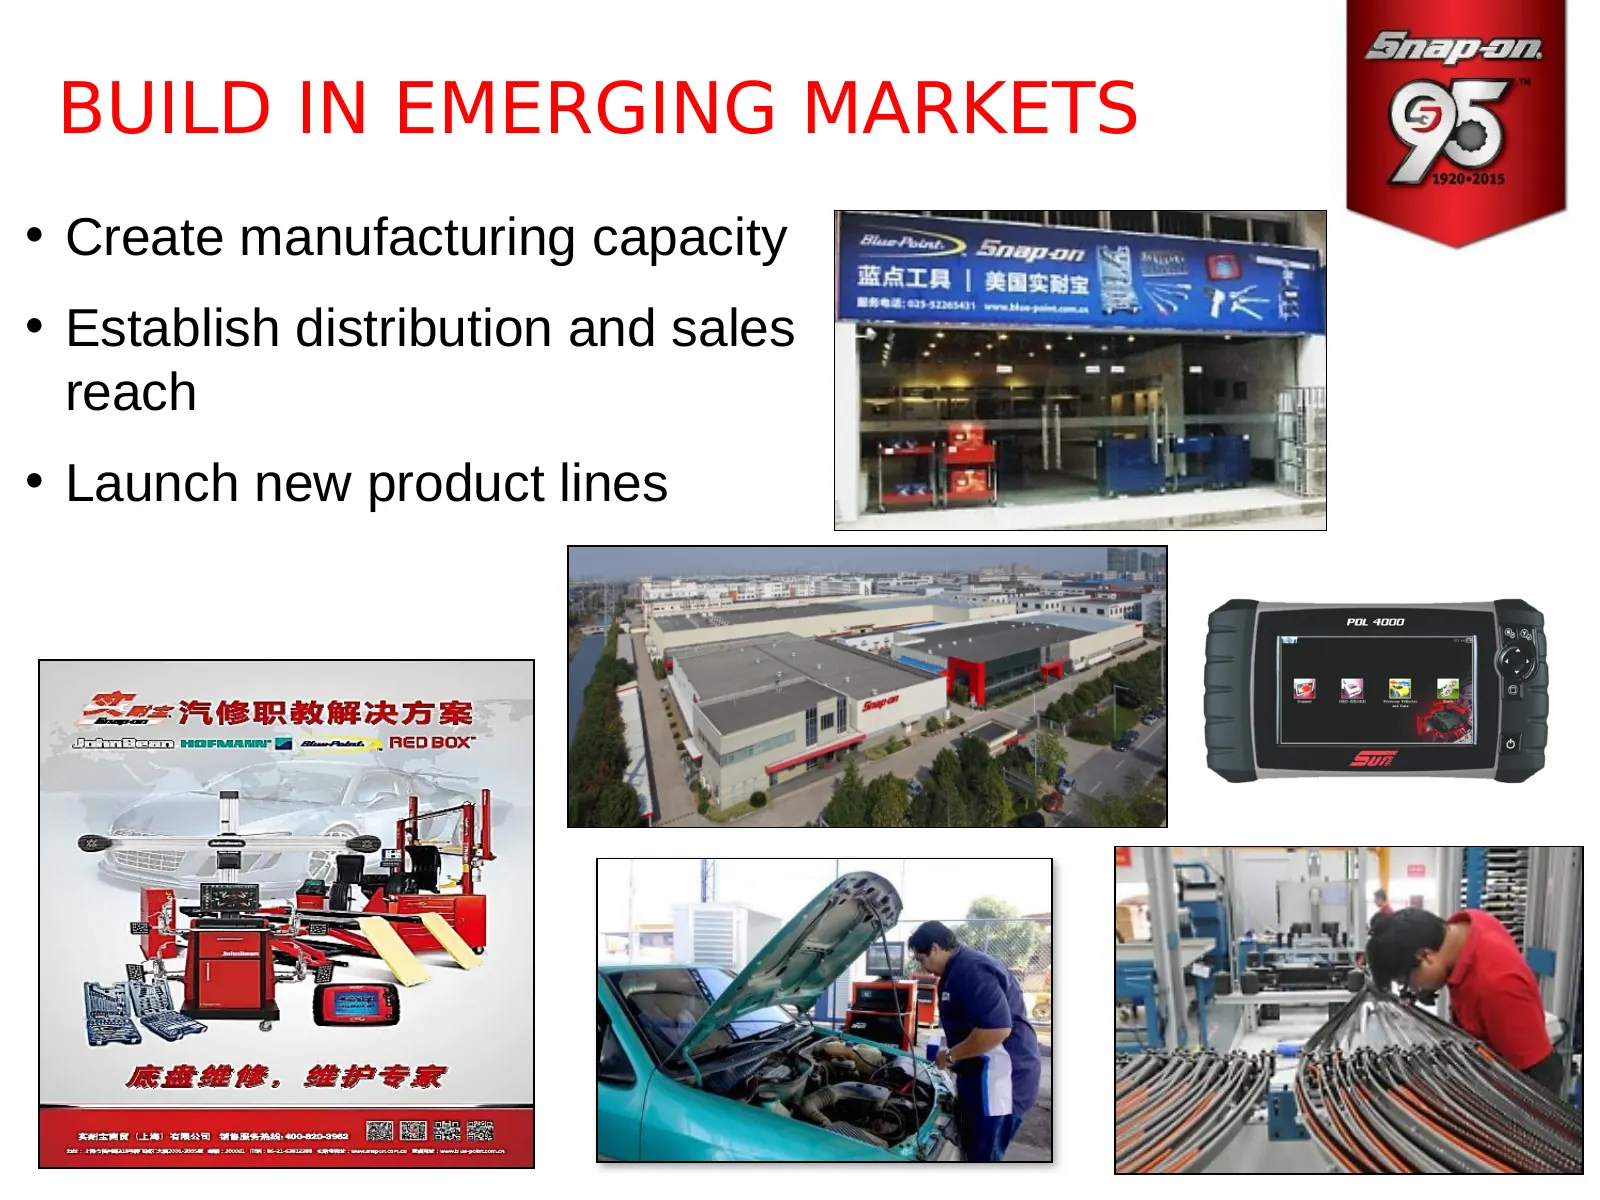
BUILD IN EMERGING MARKETS • Create manufacturing capacity • Establish distribution and sales reach • Launch new product lines New handheld introduction - Brazil
Slide 25: Net Sales and OI Margin Trend
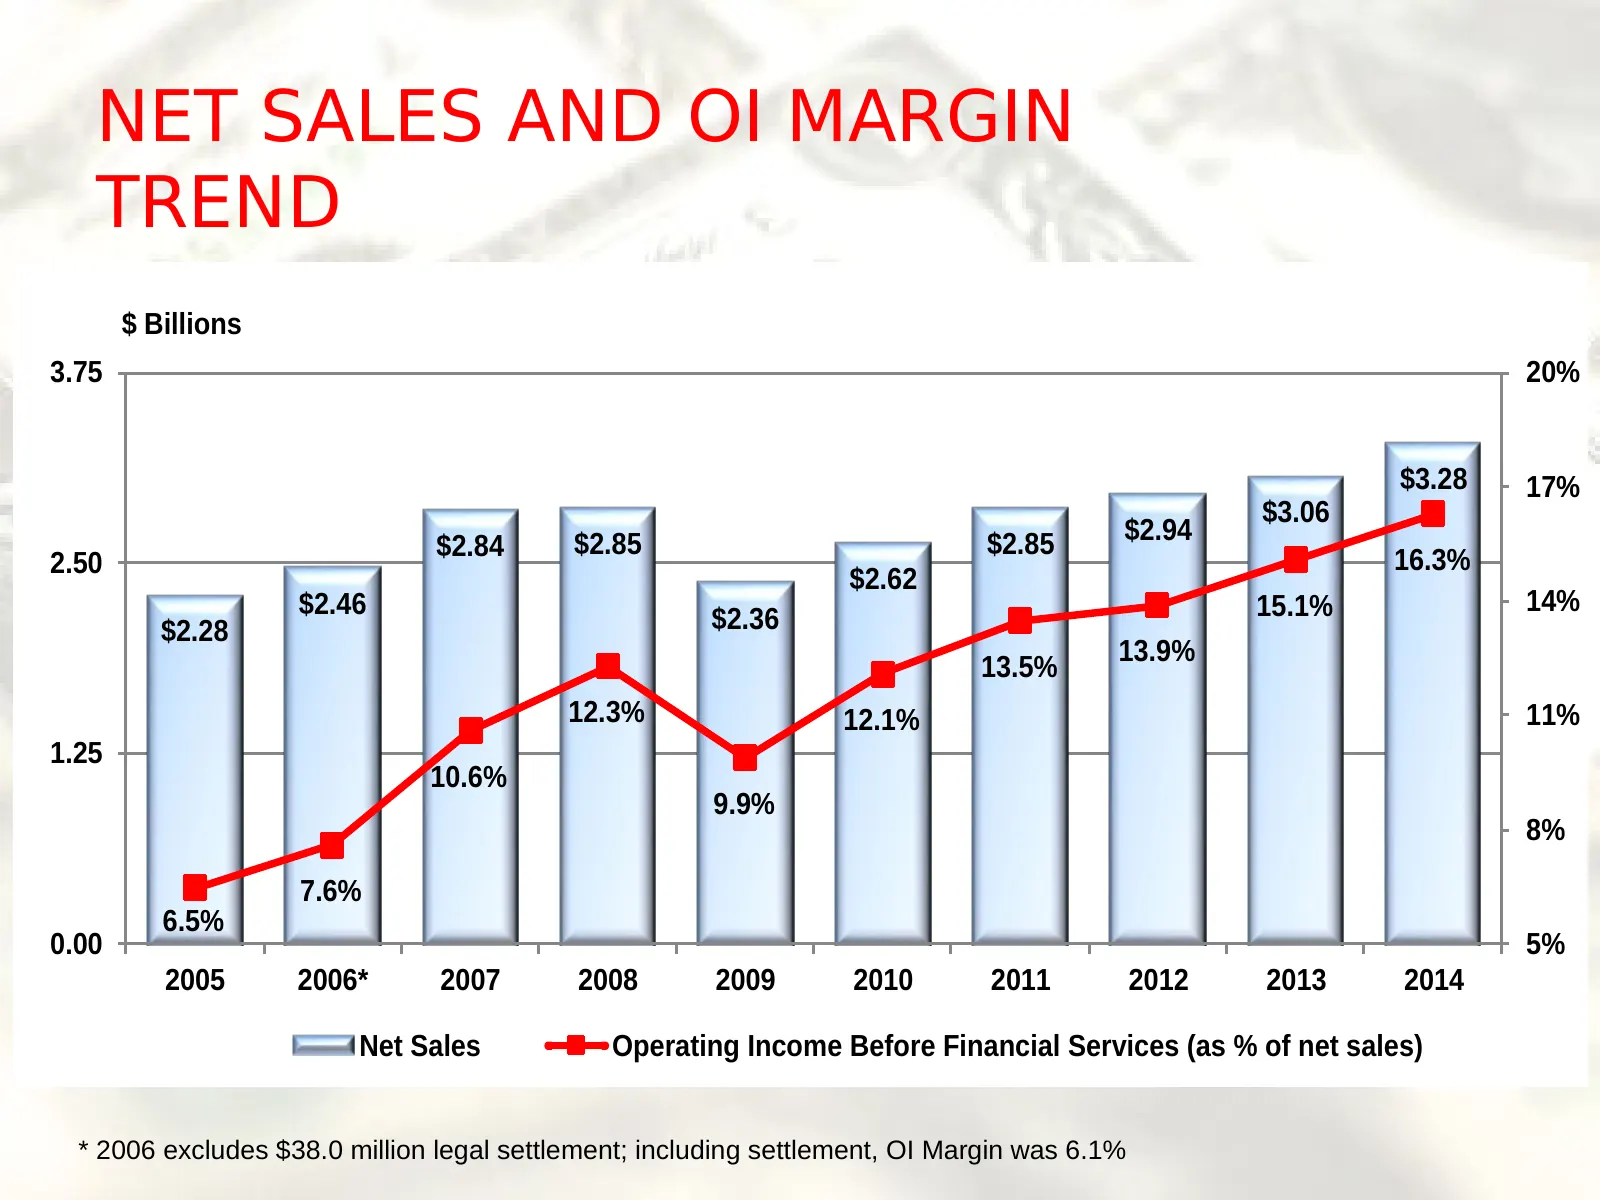
NET SALES AND OI MARGIN TREND $ Billions 3.75 20% $3.28 17% $3.06 $2.84 $2.85 $2.85 $2.94 2.50 16.3% $2.62 $2.46 15.1% 14% $2.28 $2.36 13.9% 13.5% 12.3% 12.1% 11% 1.25 10.6% 9.9% 8% 7.6% 6.5% 0.00 5% 2005 2006* 2007 2008 2009 2010 2011 2012 2013 2014 Net Sales Operating Income Before Financial Servi
Slide 26: Financial Services
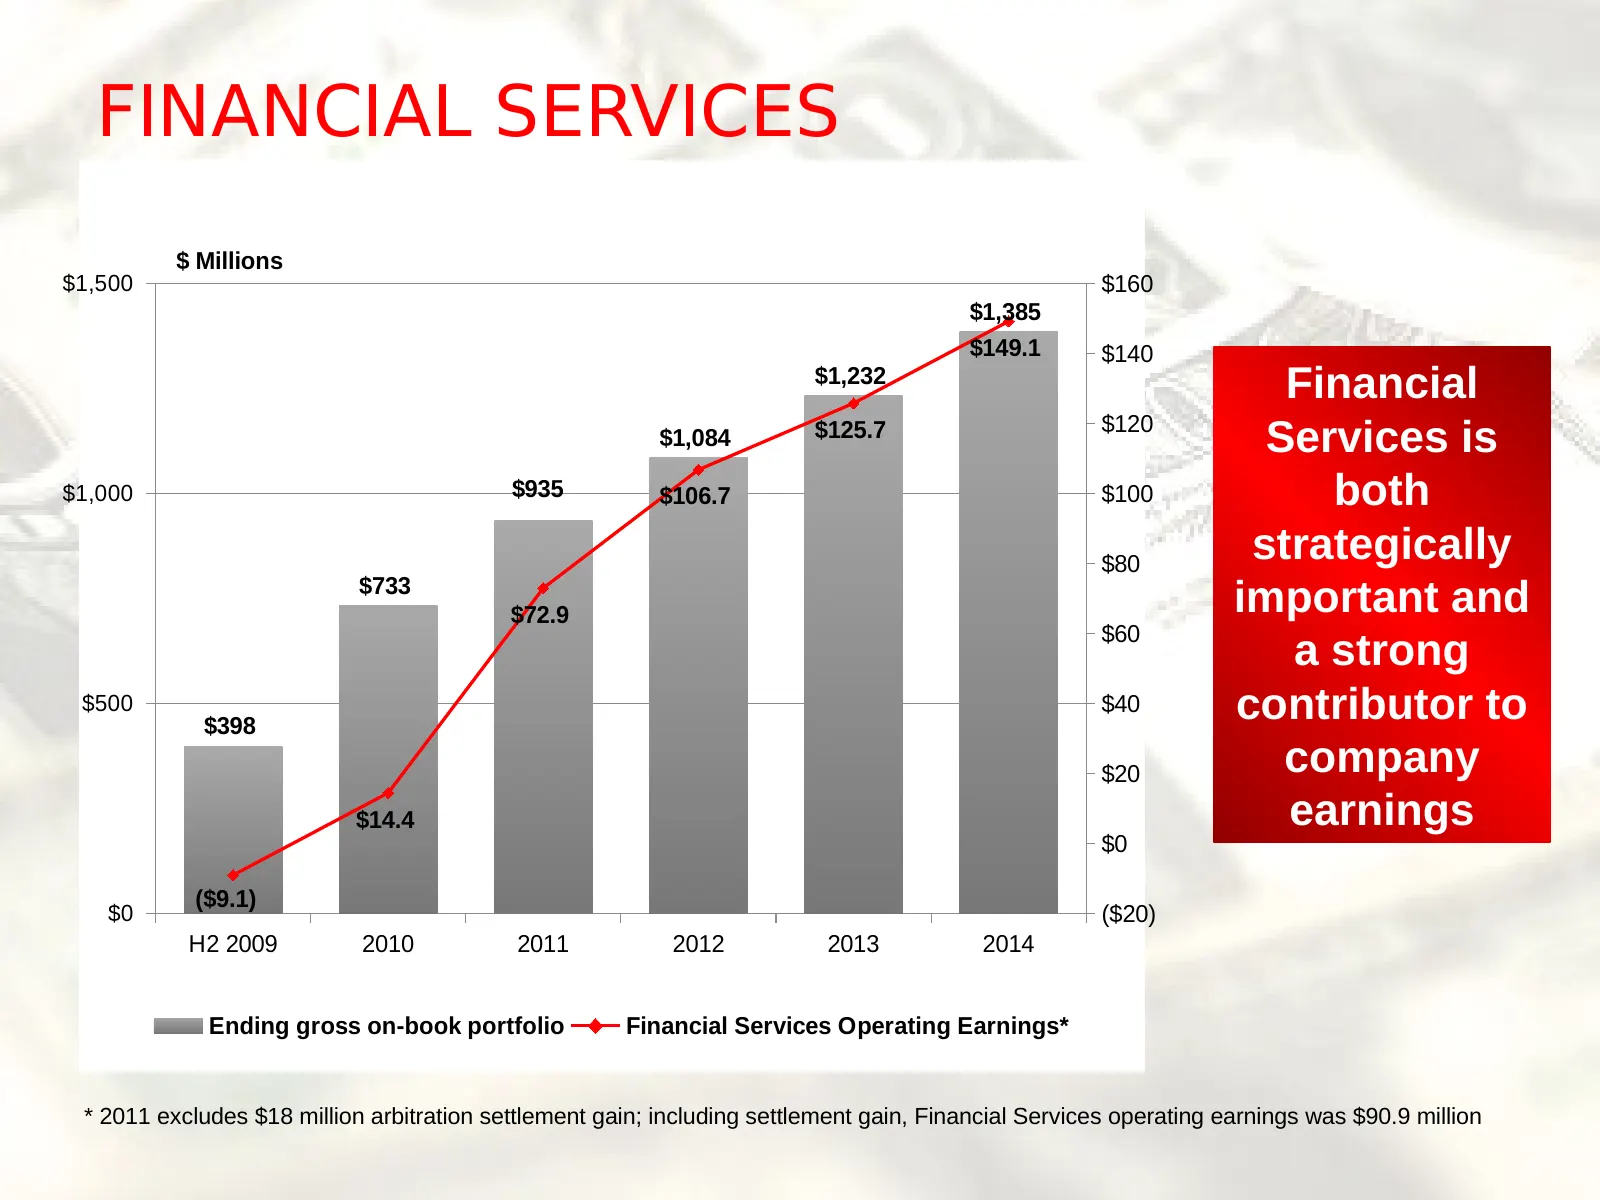
FINANCIAL SERVICES $ Millions $1,500 $160 $1,385 $149.1 $140 $1,232 Financial $120 $1,084 $125.7 Services is $1,000 $935 $106.7 $100 both $80 strategically $733 $72.9 important and $60 a strong $500 $398 $40 contributor to $20 company $14.4 earnings $0 ($9.1) $0 ($20) H2 2009 2010 2011 2012 2013 201
Slide 27: Increased Dividends
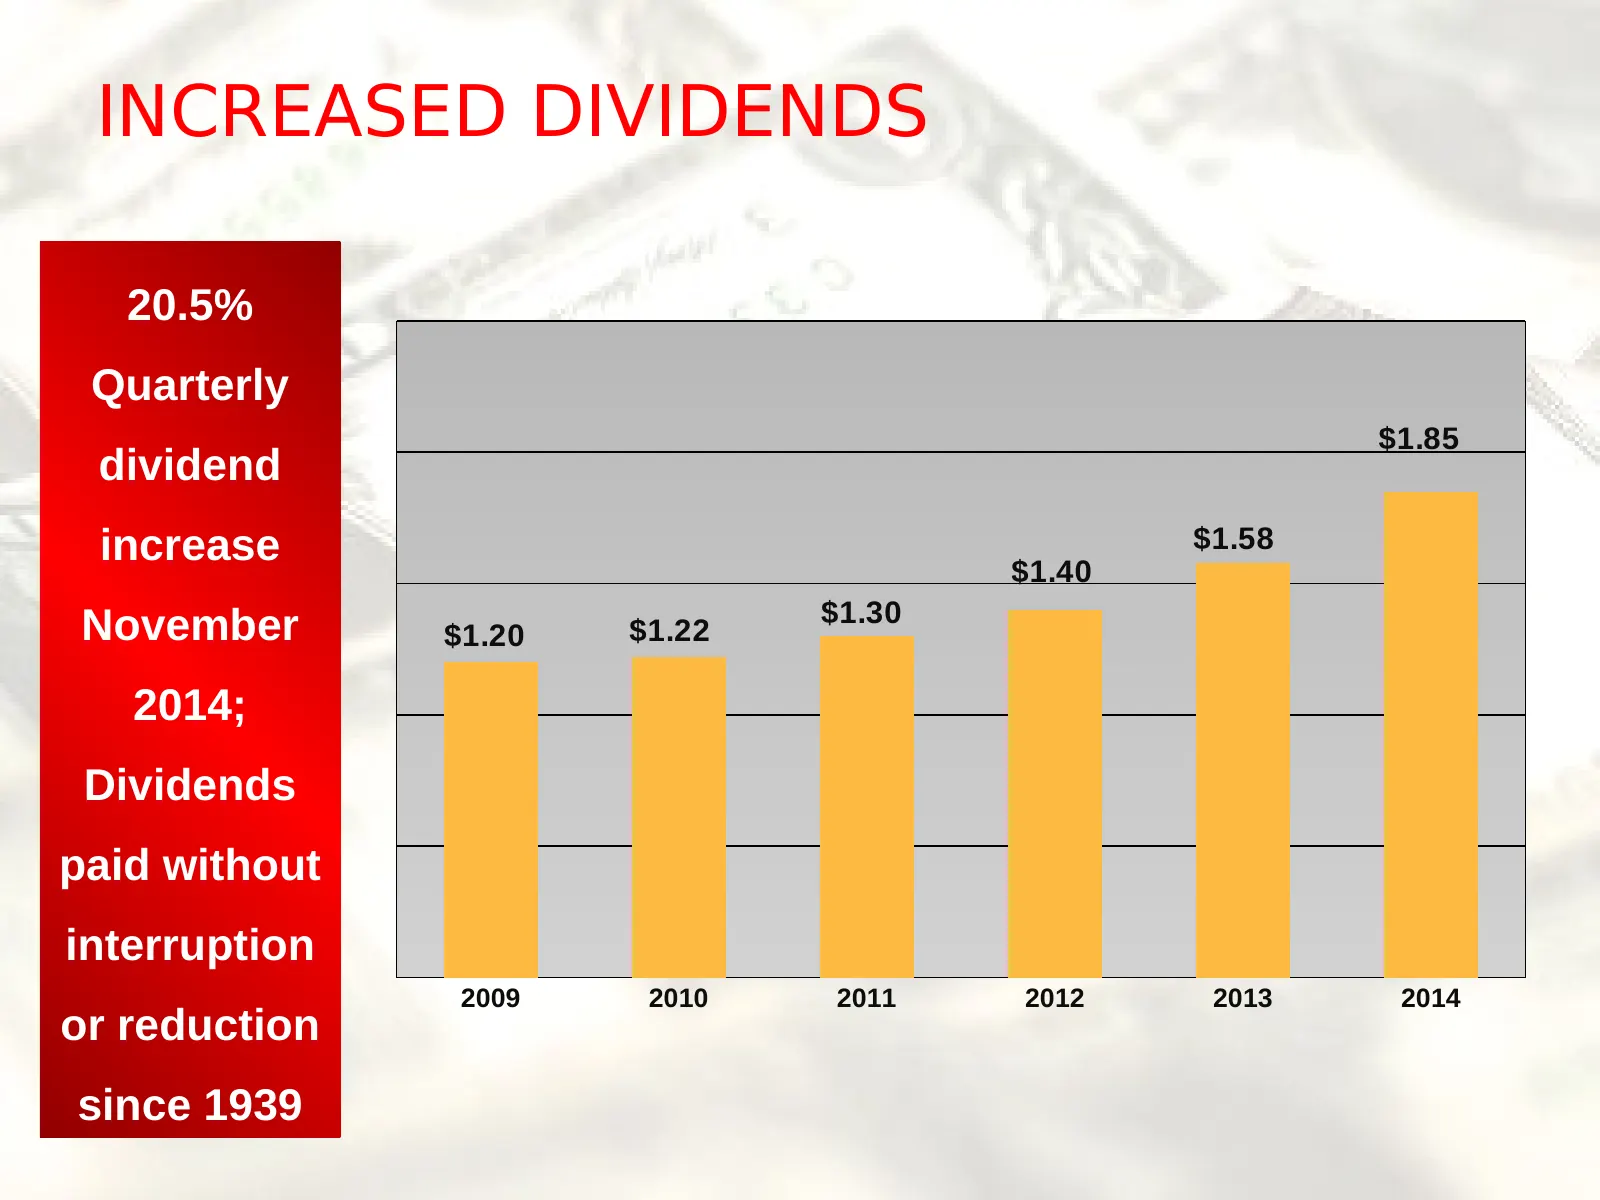
INCREASED DIVIDENDS 20.5% Quarterly $1.85 dividend increase $1.40 $1.58 $1.30 November $1.20 $1.22 2014; Dividends paid without interruption 2009 2010 2011 2012 2013 2014 or reduction since 1939
Slide 28: Q2 2015 Summary Results
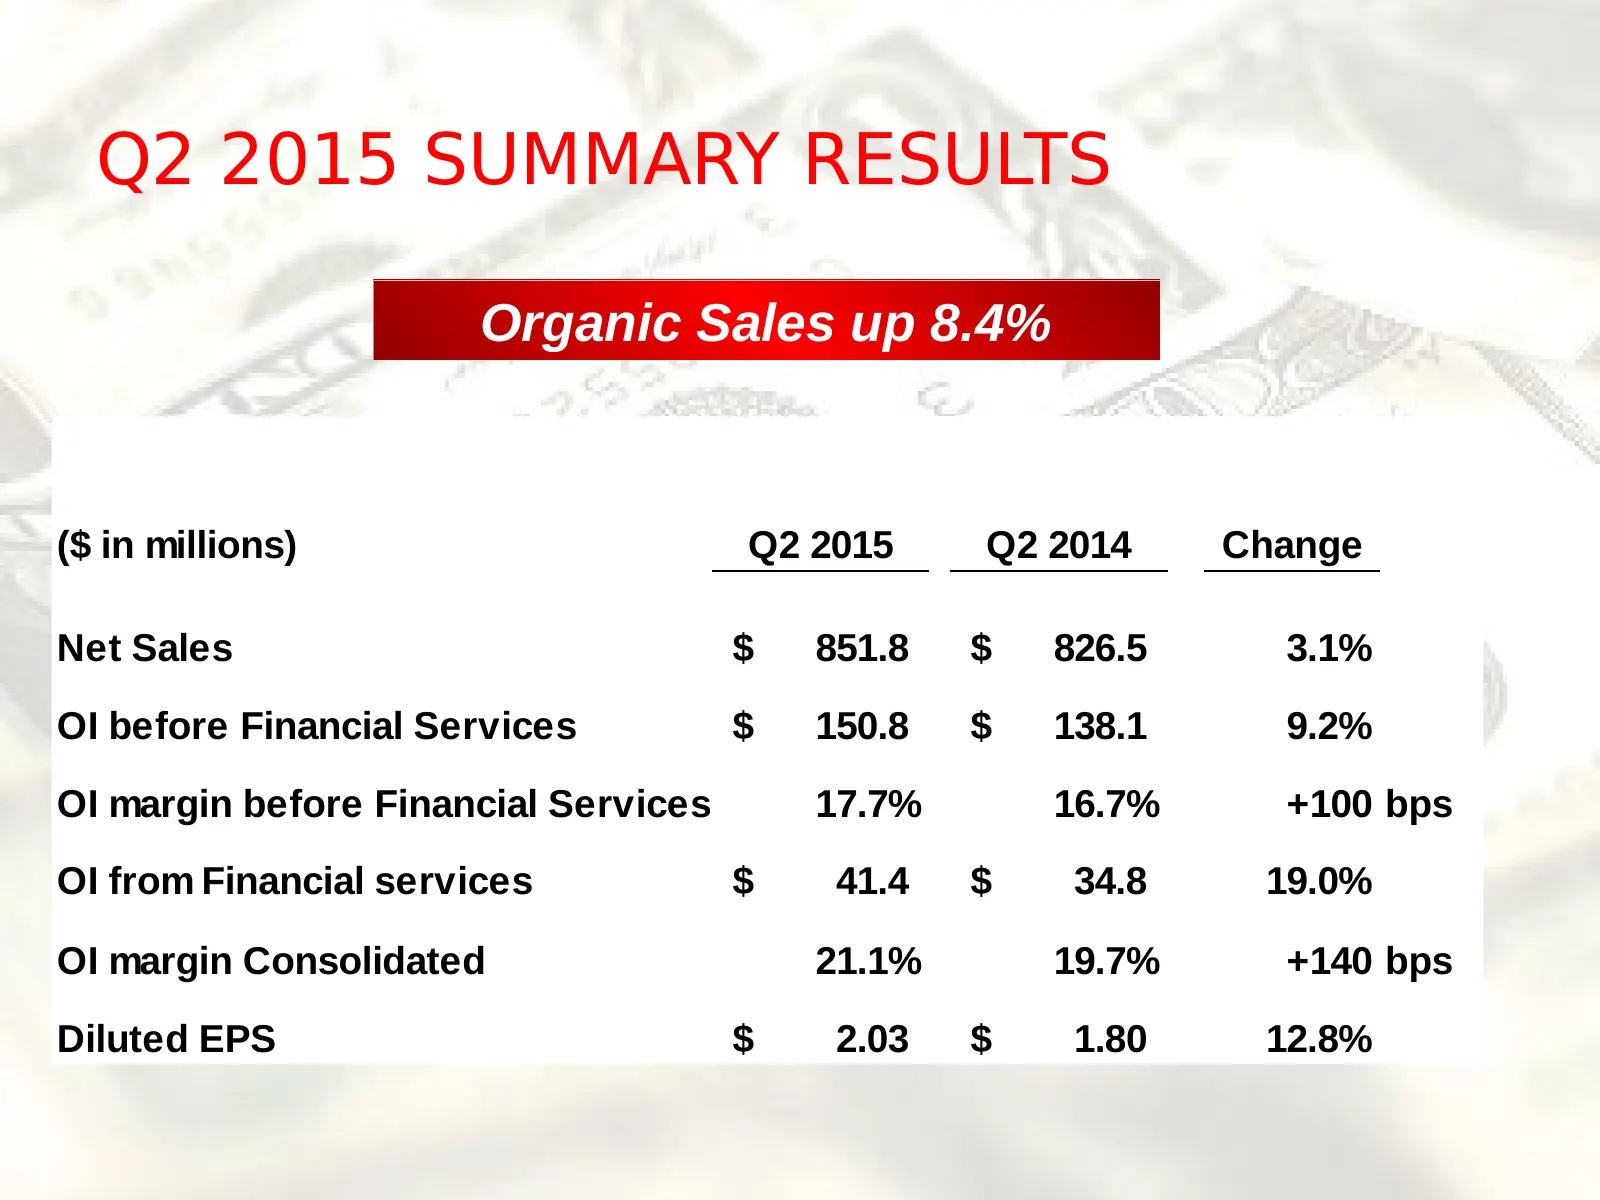
Q2 2015 SUMMARY RESULTS Organic Sales up 8.4% ($ in millions) Q2 2015 Q2 2014 Change Net Sales $ 851.8 $ 826.5 3.1% OI before Financial Services $ 150.8 $ 138.1 9.2% OI margin before Financial Services 17.7% 16.7% +100 bps OI from Financial services $ 41.4 $ 34.8 19.0% OI margin Consolidated 21.1% 1
Slide 29: Investment Rationale
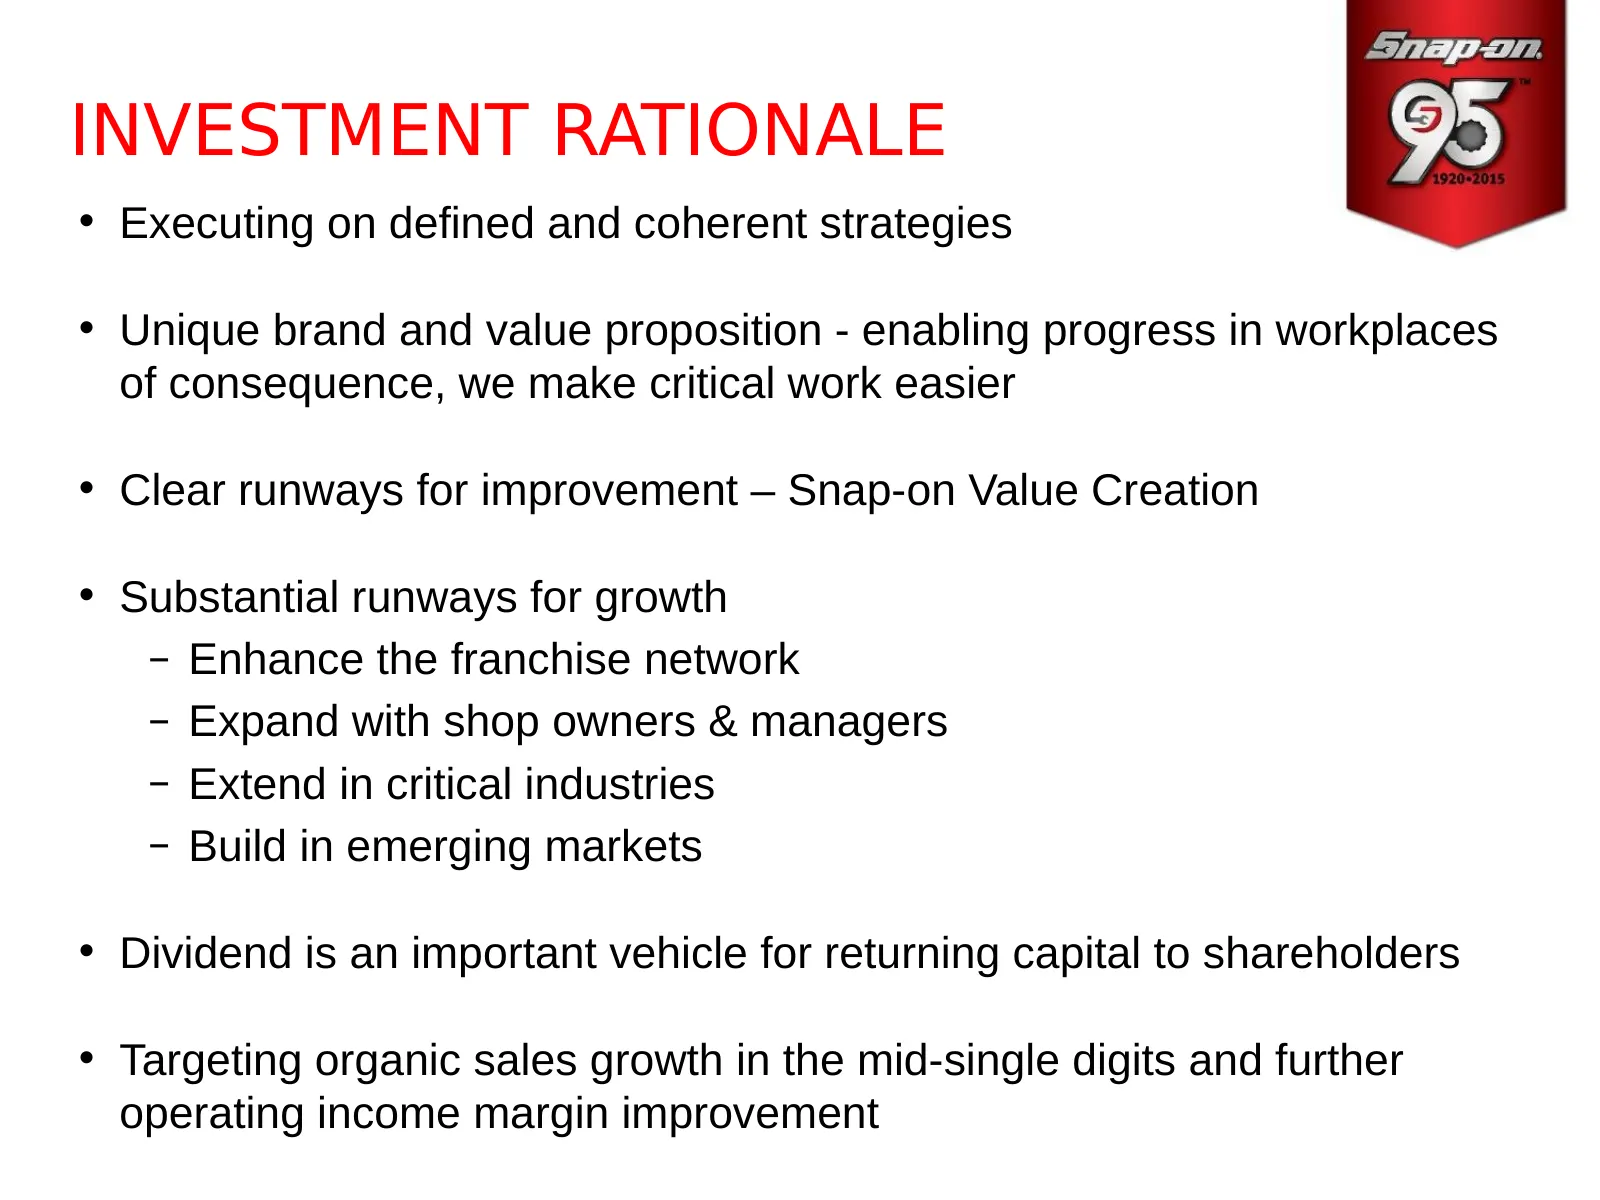
INVESTMENT RATIONALE • Executing on defined and coherent strategies • Unique brand and value proposition - enabling progress in workplaces of consequence, we make critical work easier • Clear runways for improvement – Snap-on Value Creation • Substantial runways for growth – Enhance the franchise ne

Slide 30: Jefferies Industrial Conference
Jefferies Industrial Conference August 2015
Source: Internet Archive copy of snapon.com