Aryzta AG · SIX:ARYN
Aryzta — FY2023 Earnings Presentation
40 slides from Aryzta's earnings presentation, Oct 2, 2023
Slide 1: ARYZTA AG 12-month results to July 2023
ARYZTA AG 12-month results to July 2023 2 October 2023
Slide 2: Forward looking statement
Forward looking statement This document contains forward looking statements which reflect the Board of Directors' current views and estimates. The forward-looking statements involve certain risks and uncertainties that could cause actual results to differ materially from those contained in the forwa
Slide 3: Strategic overview
Strategic ove | ARYZTA SERVING INSPIRATION
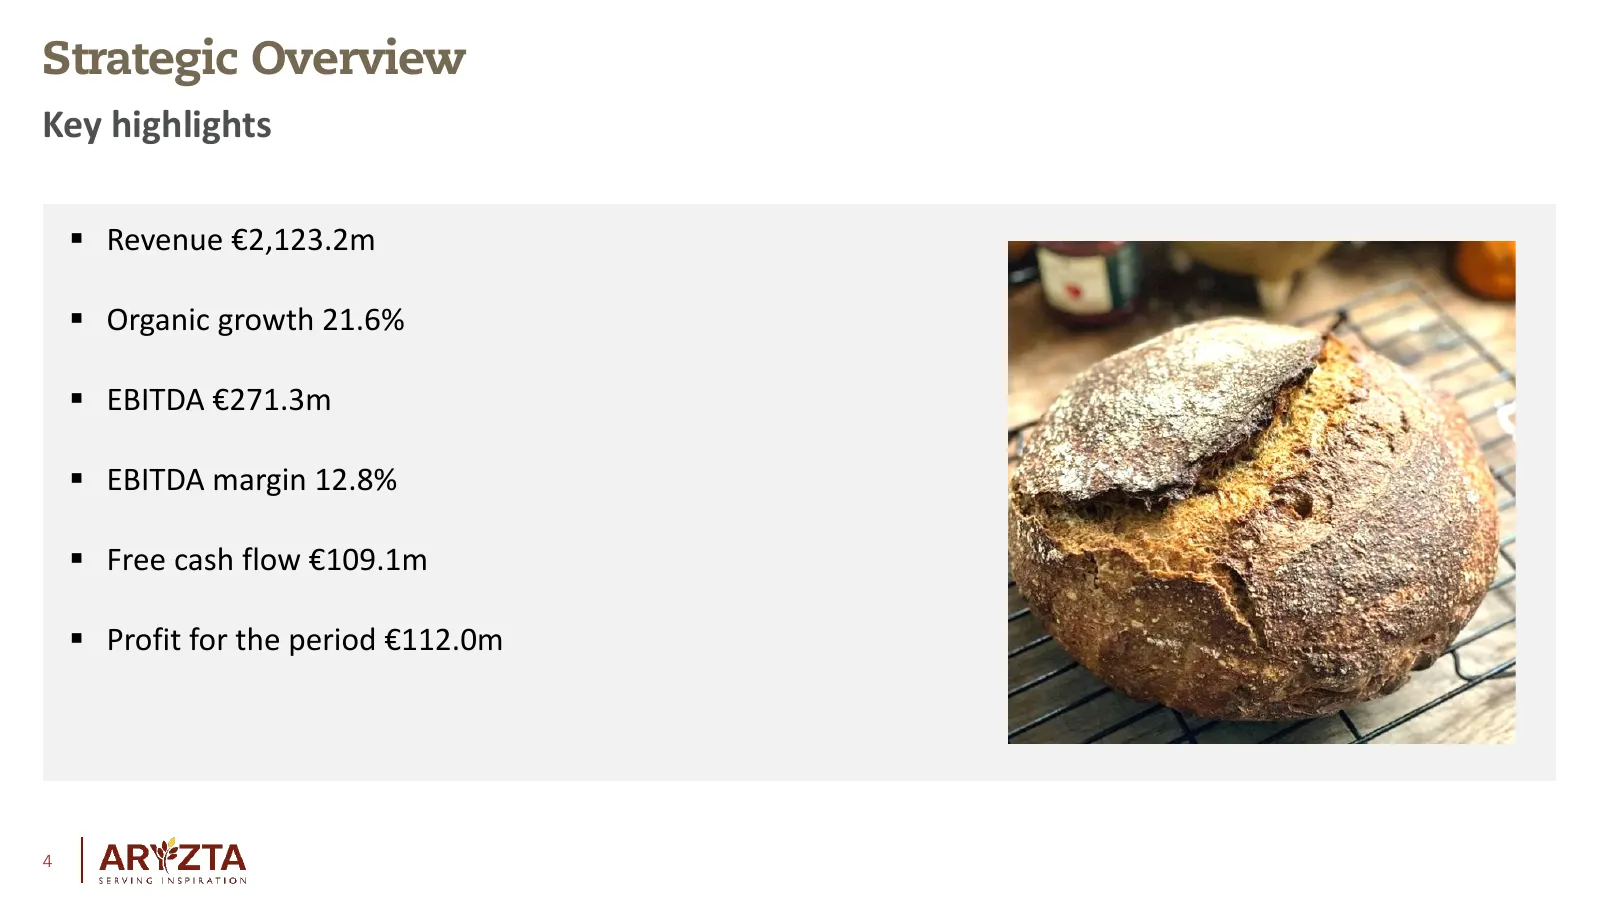
Slide 4: Key highlights
Strategic Overview Key highlights Revenue €2,123.2m Organic growth 21.6% EBITDA €271.3m EBITDA margin 12.8% Free cash flow €109.1m Profit for the period €112.0m 4
Slide 5: Strategy Delivering
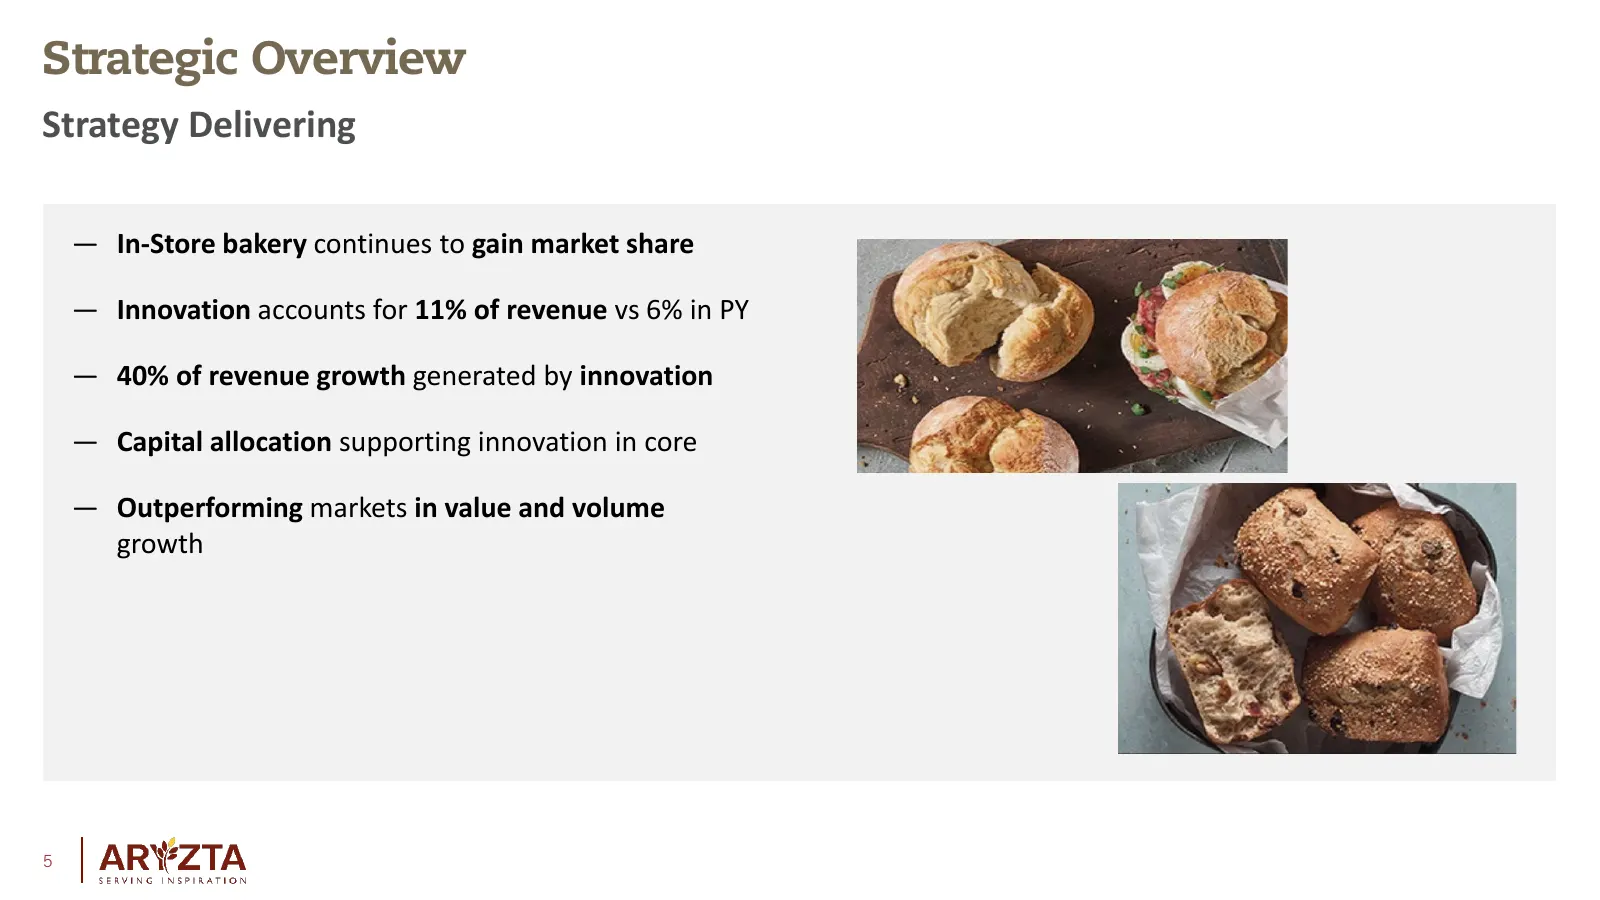
Strategic Overview Strategy Delivering — In-Store bakery continues to gain market share — Innovation accounts for 11% of revenue vs 6% in PY — 40% of revenue growth generated by innovation — Capital allocation supporting innovation in core — Outperforming markets in value and volume growth 5
Slide 6: Inflation continues
Strategic Overview Inflation continues — Volatile inflationary environment continues to persist — Commodity prices moderating but at historical elevated levels — Cost of living increases impacting labour and services — Consumption trends remain unchanged — Bakery products competing well for share of
Slide 7: ESG strategy
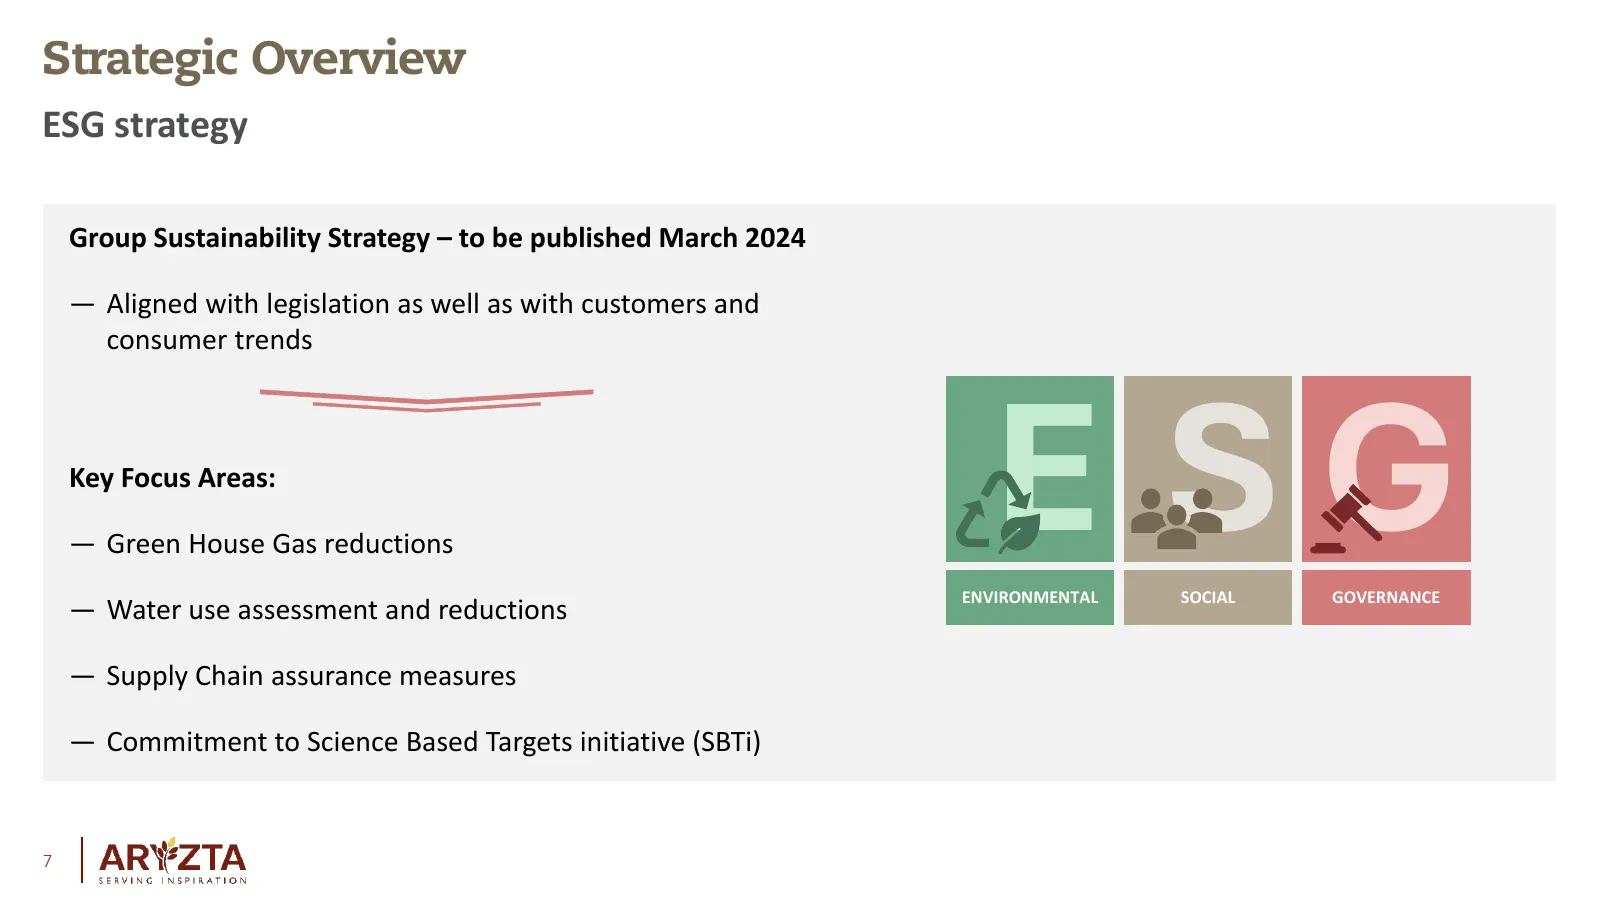
Strategic Overview ESG strategy Group Sustainability Strategy – to be published March 2024 — Aligned with legislation as well as with customers and consumer trends Key Focus Areas: — Green House Gas reductions — Water use assessment and reductions E SG ENVIRONMENTAL SOCIAL GOVERNANCE — Supply Chain
Slide 8: Guidance 2023 (17-month to December 2023)
Strategic Overview Guidance 2023 (17-month to December 2023) Further improvements in all key metrics expected in 2023 — Organic growth to moderate to mid to high teens supported by volume and price — EBITDA margin expansion supported by growth, efficiencies and cost discipline — Further improvement
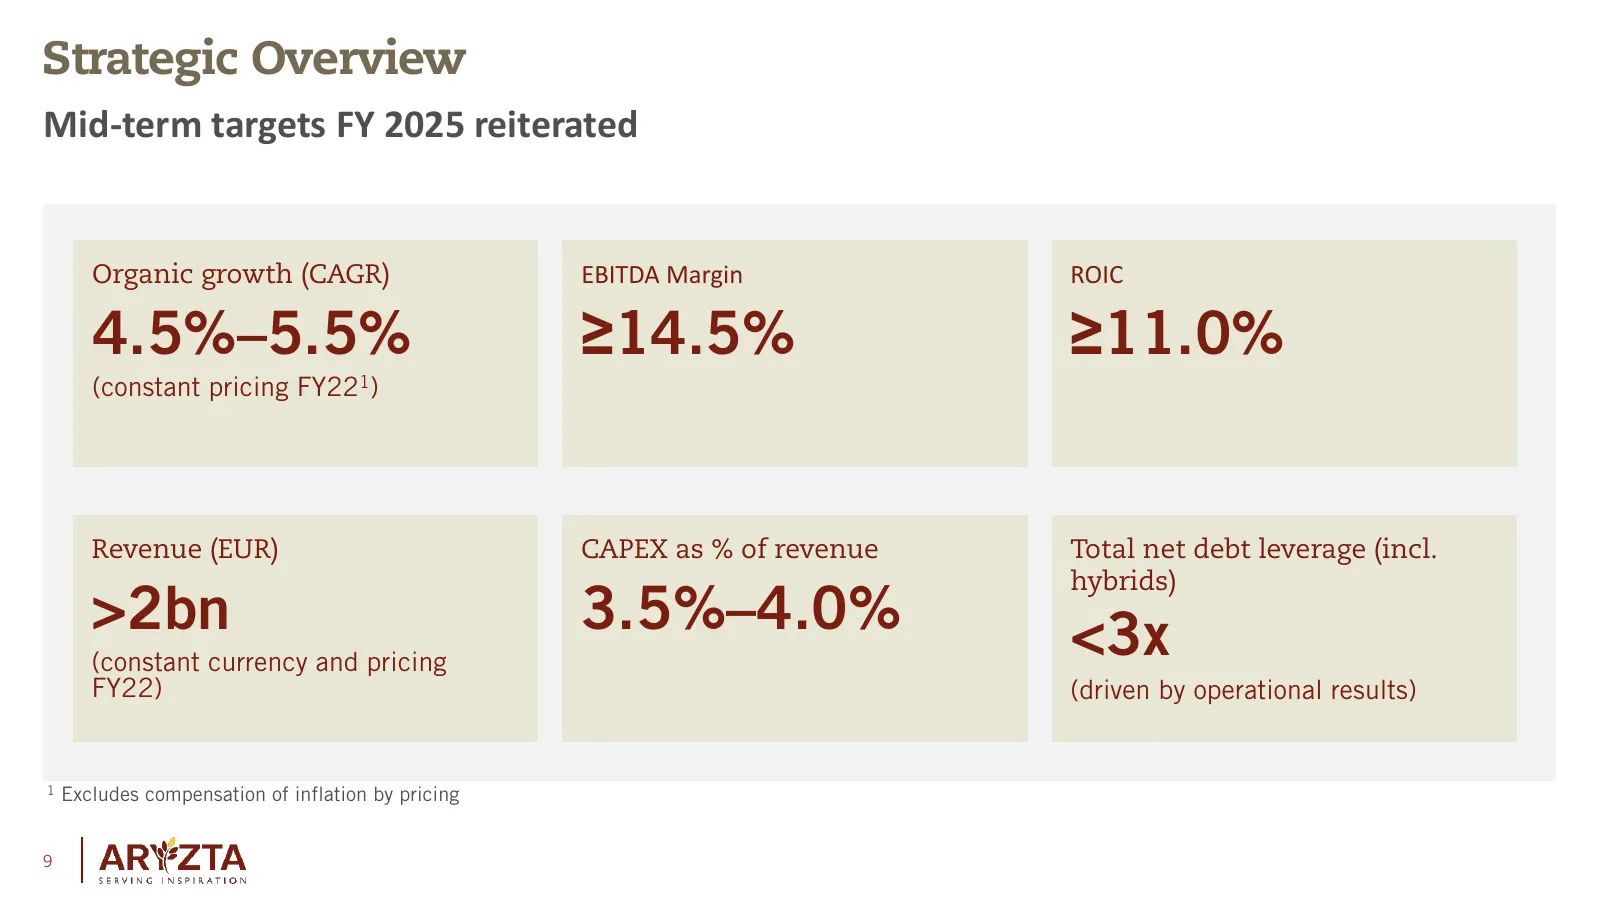
Slide 9: Mid-term targets FY 2025 reiterated
Strategic Overview Mid-term targets FY 2025 reiterated Organic growth (CAGR) EBITDA Margin ROIC 4.5%–5.5% ≥14.5% ≥11.0% (constant pricing FY221) Revenue (EUR) CAPEX as % of revenue Total net debt leverage (incl. hybrids) >2bn 3.5%–4.0% <3x (constant currency and pricing FY22) (driven by operational
Slide 10: Financial review
iew CF Ales 3 Financial rev | ARYZTA SERVING INSPIRATION
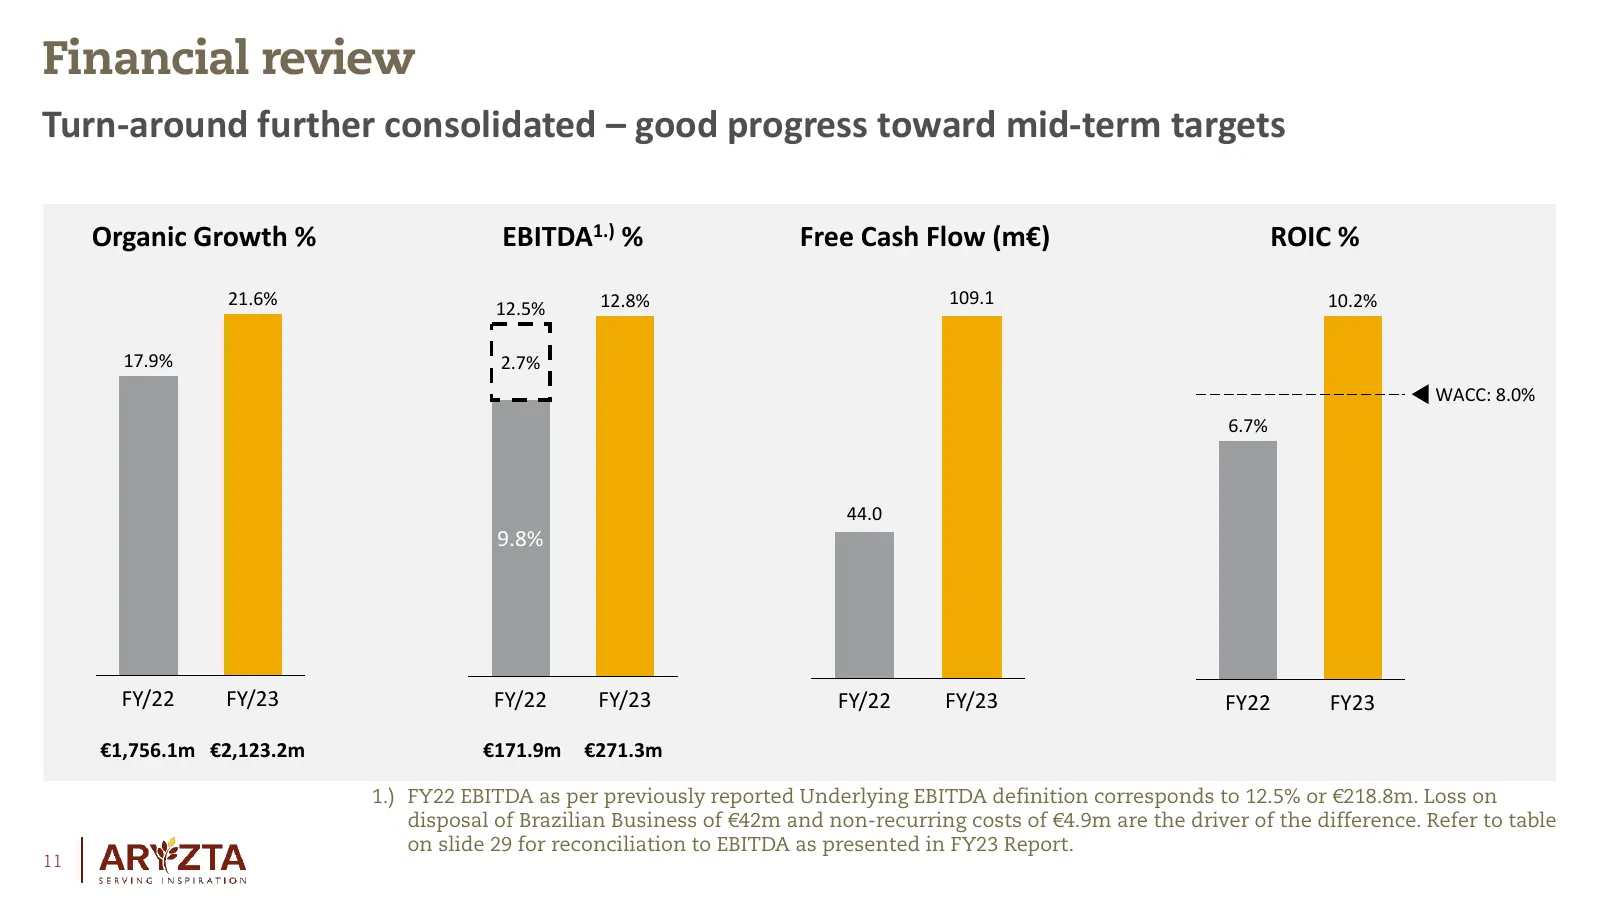
Slide 11: Turn-around further consolidated – good progress toward mid-term targets
Financial review Turn-around further consolidated – good progress toward mid-term targets Organic Growth % EBITDA1.) % Free Cash Flow (m€) ROIC % 21.6% 12.8% 109.1 10.2% 12.5% 17.9% 2.7% WACC: 8.0% 6.7% 44.0 9.8% FY/22 FY/23 FY/22 FY/23 FY/22 FY/23 FY22 FY23 €1,756.1m €2,123.2m €171.9m €271.3m 1.) F
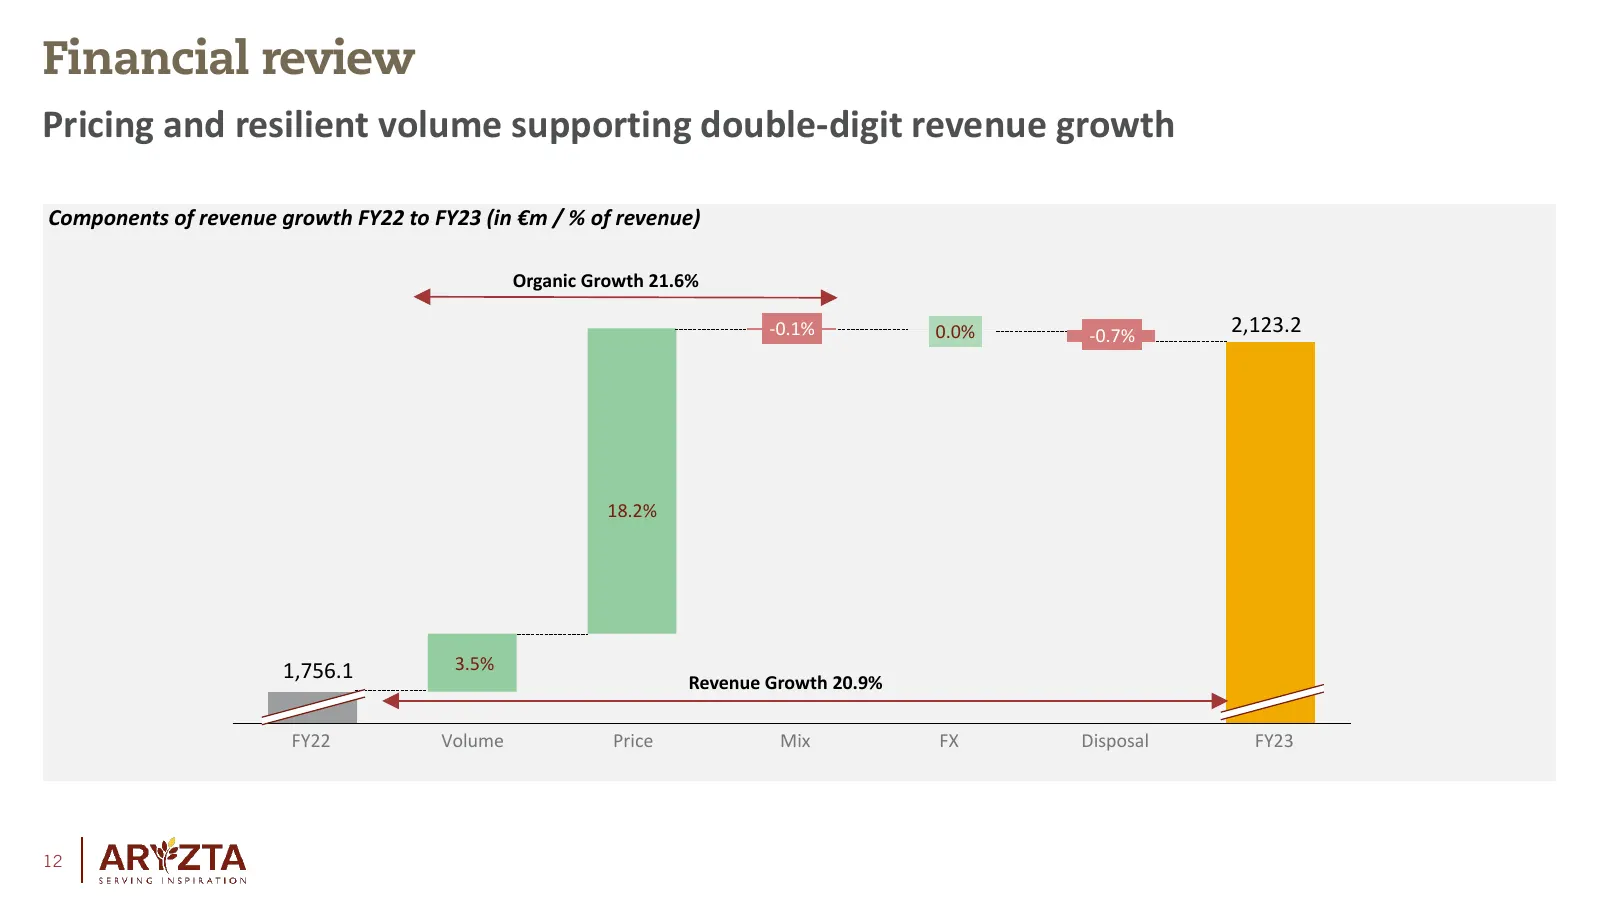
Slide 12: Pricing and resilient volume supporting double-digit revenue growth
Financial review Pricing and resilient volume supporting double-digit revenue growth Components of revenue growth FY22 to FY23 (in €m / % of revenue) Organic Growth 21.6% -0.1% 0.0% -0.7% 2,123.2 18.2% 1,756.1 3.5% Revenue Growth 20.9% FY22 Volume Price Mix FX Disposal FY23 12
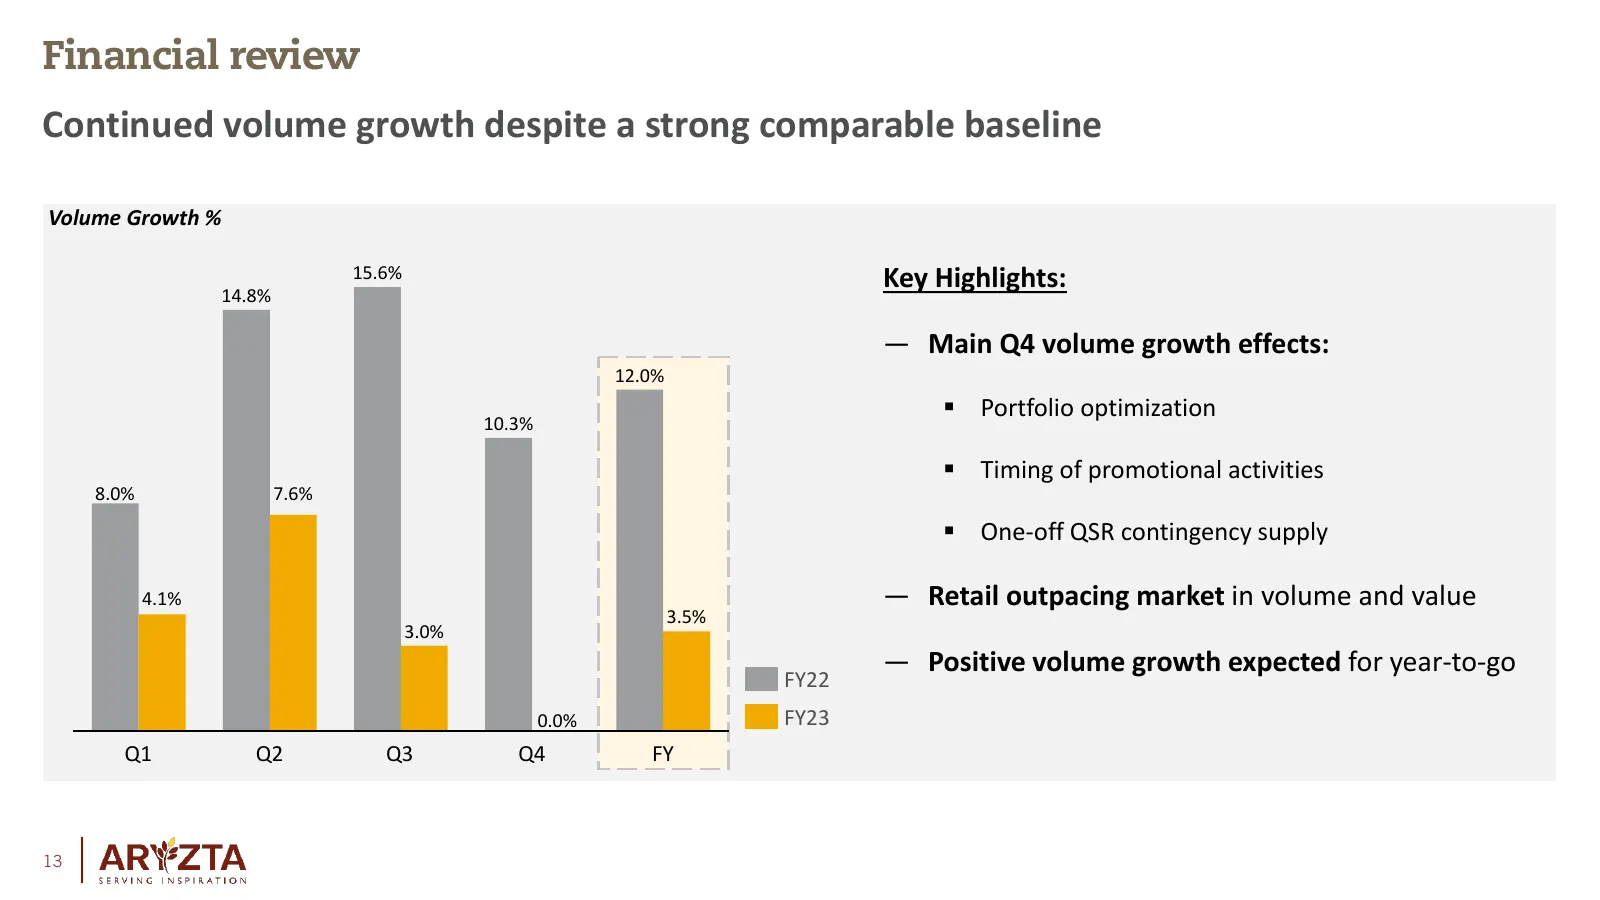
Slide 13: Continued volume growth despite a strong comparable baseline
Financial review Continued volume growth despite a strong comparable baseline Volume Growth % 14.8% 15.6% Key Highlights: — Main Q4 volume growth effects: 12.0% Portfolio optimization 10.3% Timing of promotional activities 8.0% 7.6% One-off QSR contingency supply 4.1% — Retail outpacing market
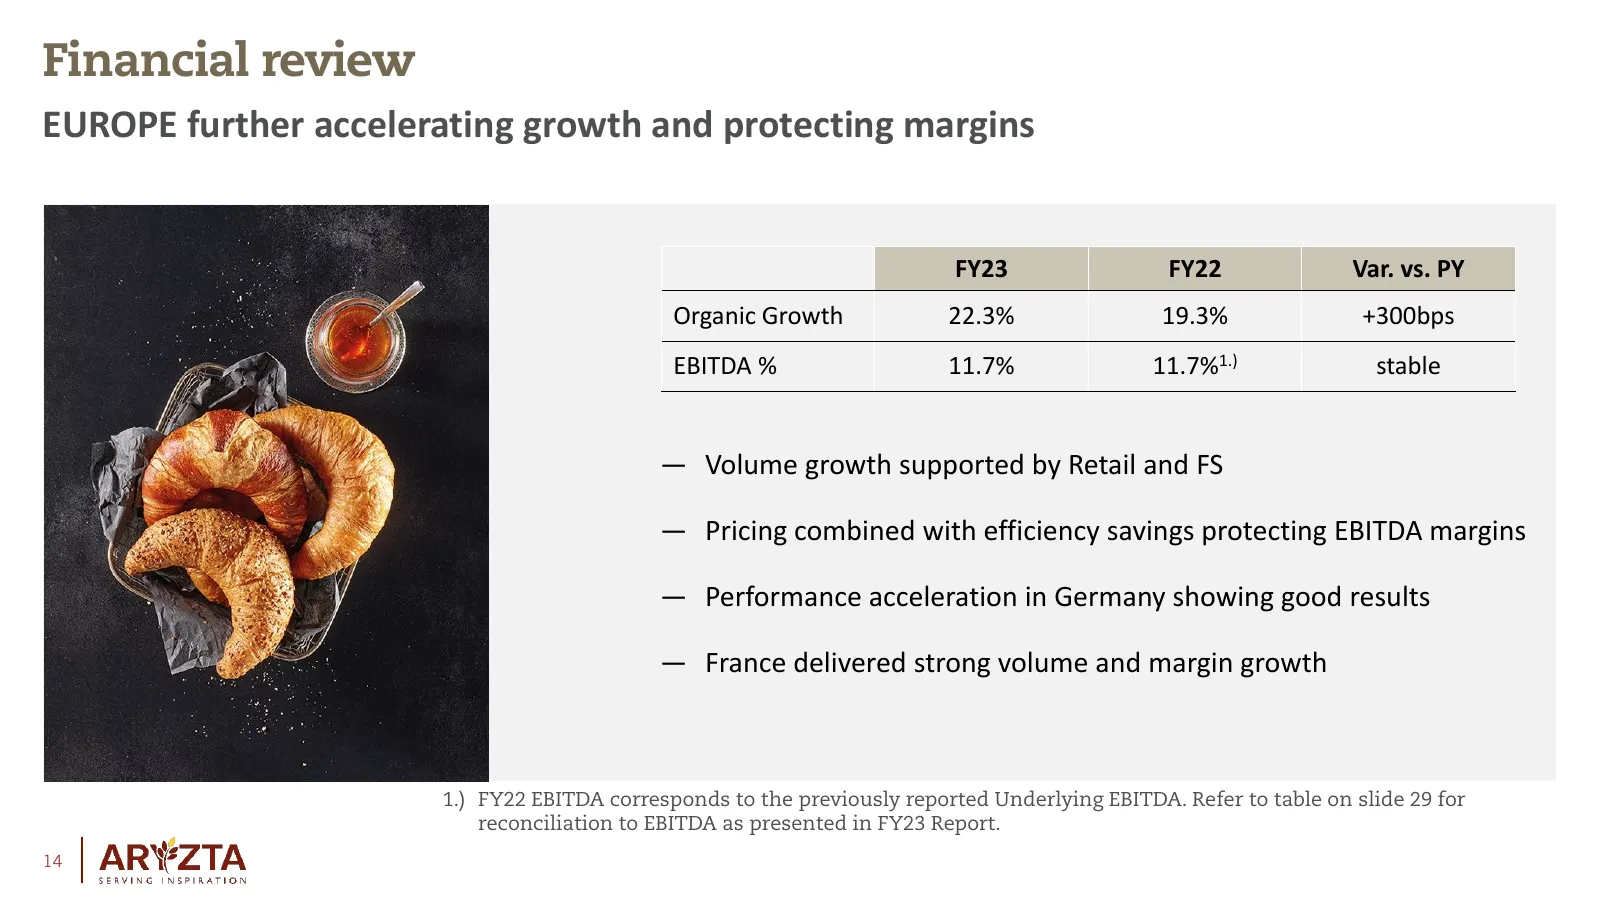
Slide 14: Europe further accelerating growth and protecting margins
Financial review EUROPE further accelerating growth and protecting margins FY23 FY22 Var. vs. PY Organic Growth 22.3% 19.3% +300bps EBITDA % 11.7% 11.7%1.) stable — Volume growth supported by Retail and FS — Pricing combined with efficiency savings protecting EBITDA margins — Performance acceleratio
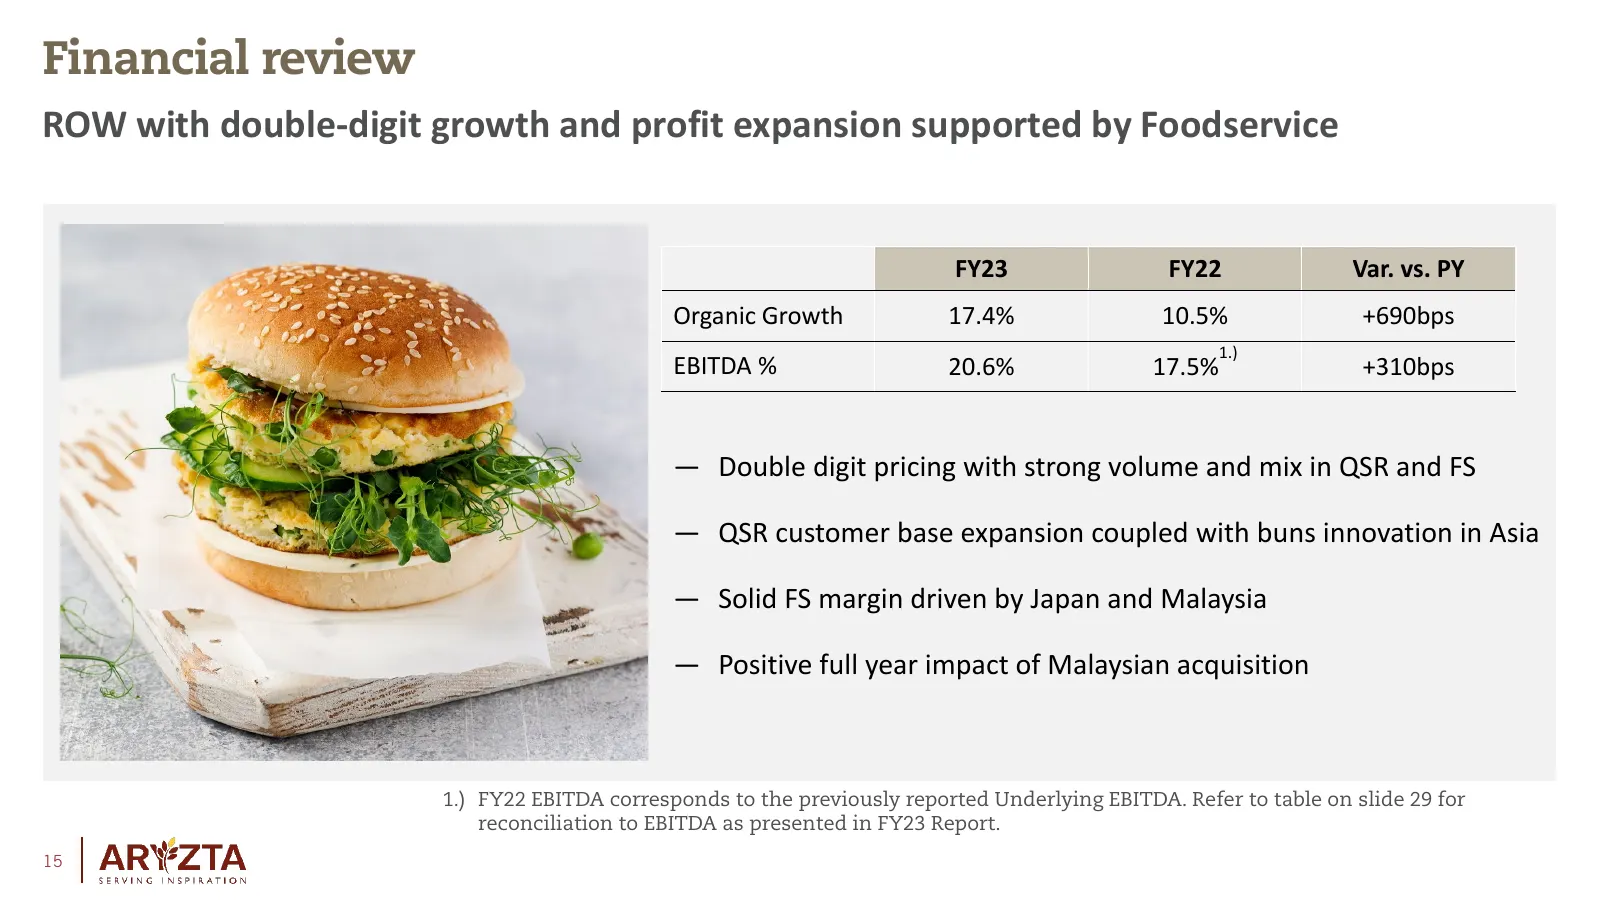
Slide 15: ROW with double-digit growth and profit expansion supported by Foodservice
Financial review ROW with double-digit growth and profit expansion supported by Foodservice FY23 FY22 Var. vs. PY Organic Growth 17.4% 10.5% +690bps 1.) EBITDA % 20.6% 17.5% +310bps — Double digit pricing with strong volume and mix in QSR and FS — QSR customer base expansion coupled with buns innova
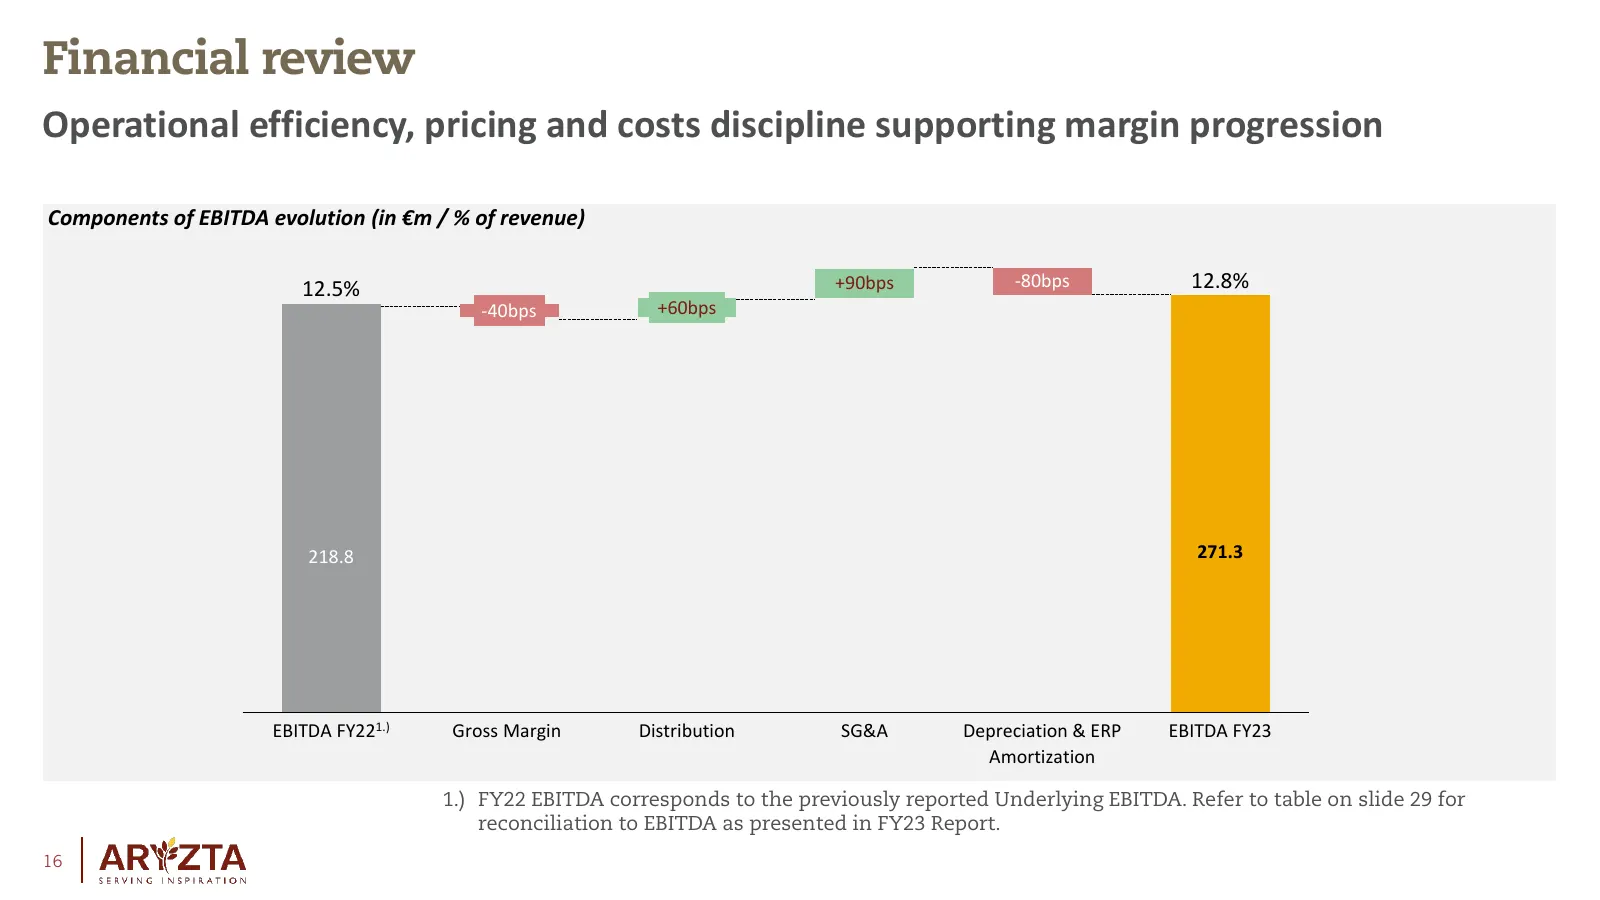
Slide 16: Operational efficiency, pricing and costs discipline supporting margin progression
Financial review Operational efficiency, pricing and costs discipline supporting margin progression Components of EBITDA evolution (in €m / % of revenue) 12.5% +90bps -80bps 12.8% -40bps +60bps 218.8 271.3 EBITDA FY221.) Gross Margin Distribution SG&A Depreciation & ERP EBITDA FY23 Amortization 1.)
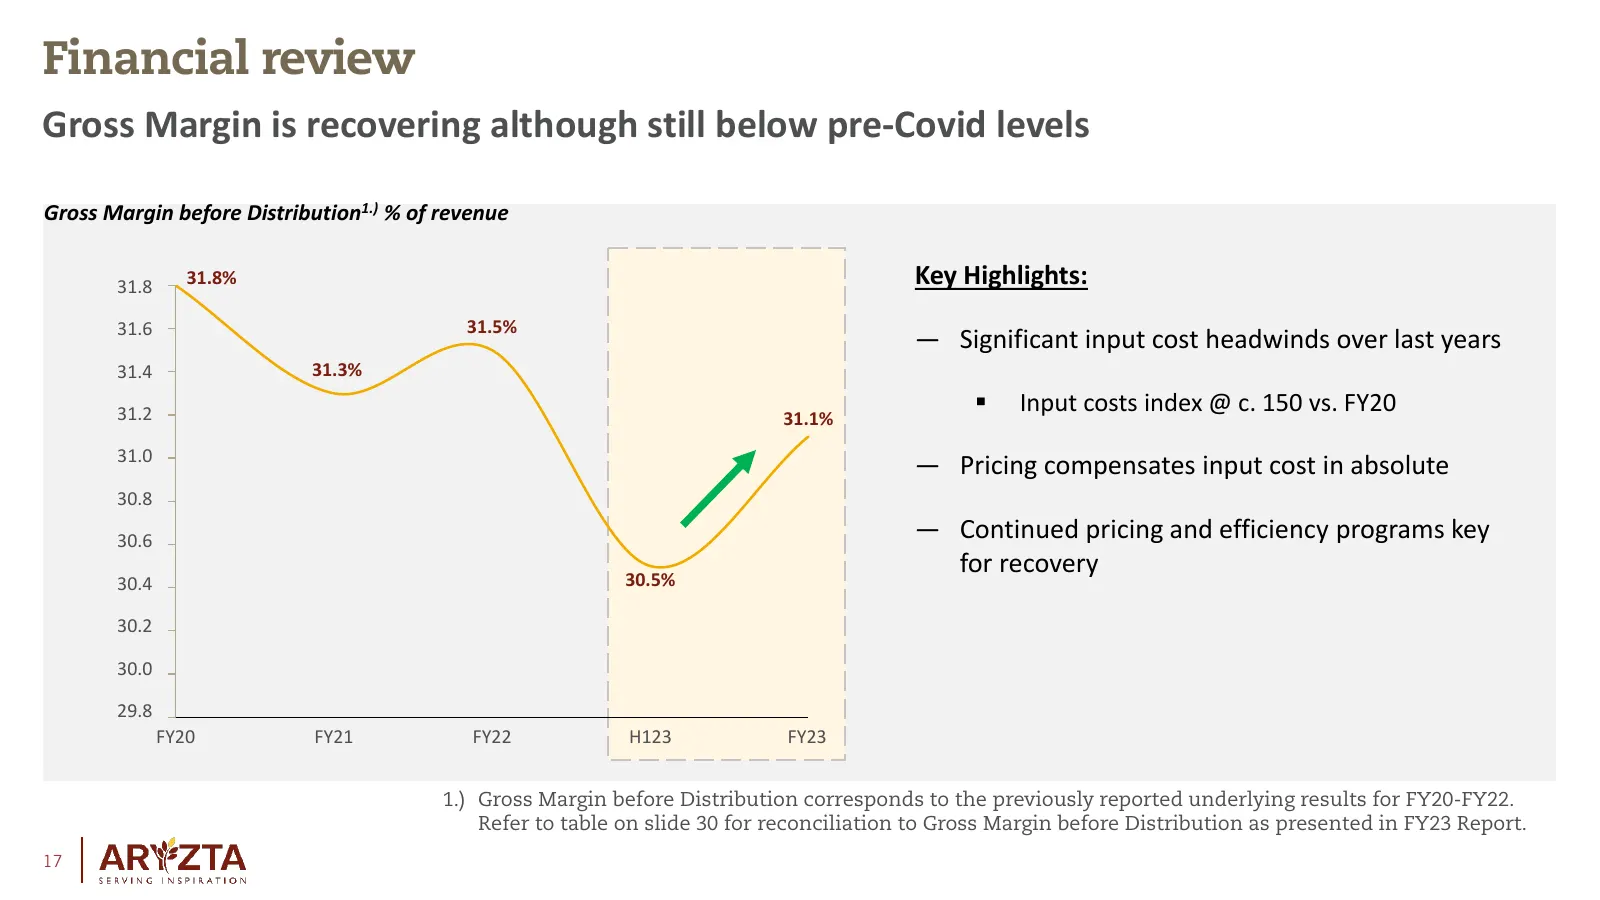
Slide 17: Gross Margin is recovering although still below pre-Covid levels
Financial review Gross Margin is recovering although still below pre-Covid levels Gross Margin before Distribution1.) % of revenue 31.8 31.8% Key Highlights: 31.6 31.5% — Significant input cost headwinds over last years 31.4 31.3% 31.2 Input costs index @ c. 150 vs. FY20 31.1% 31.0 — Pricing compe
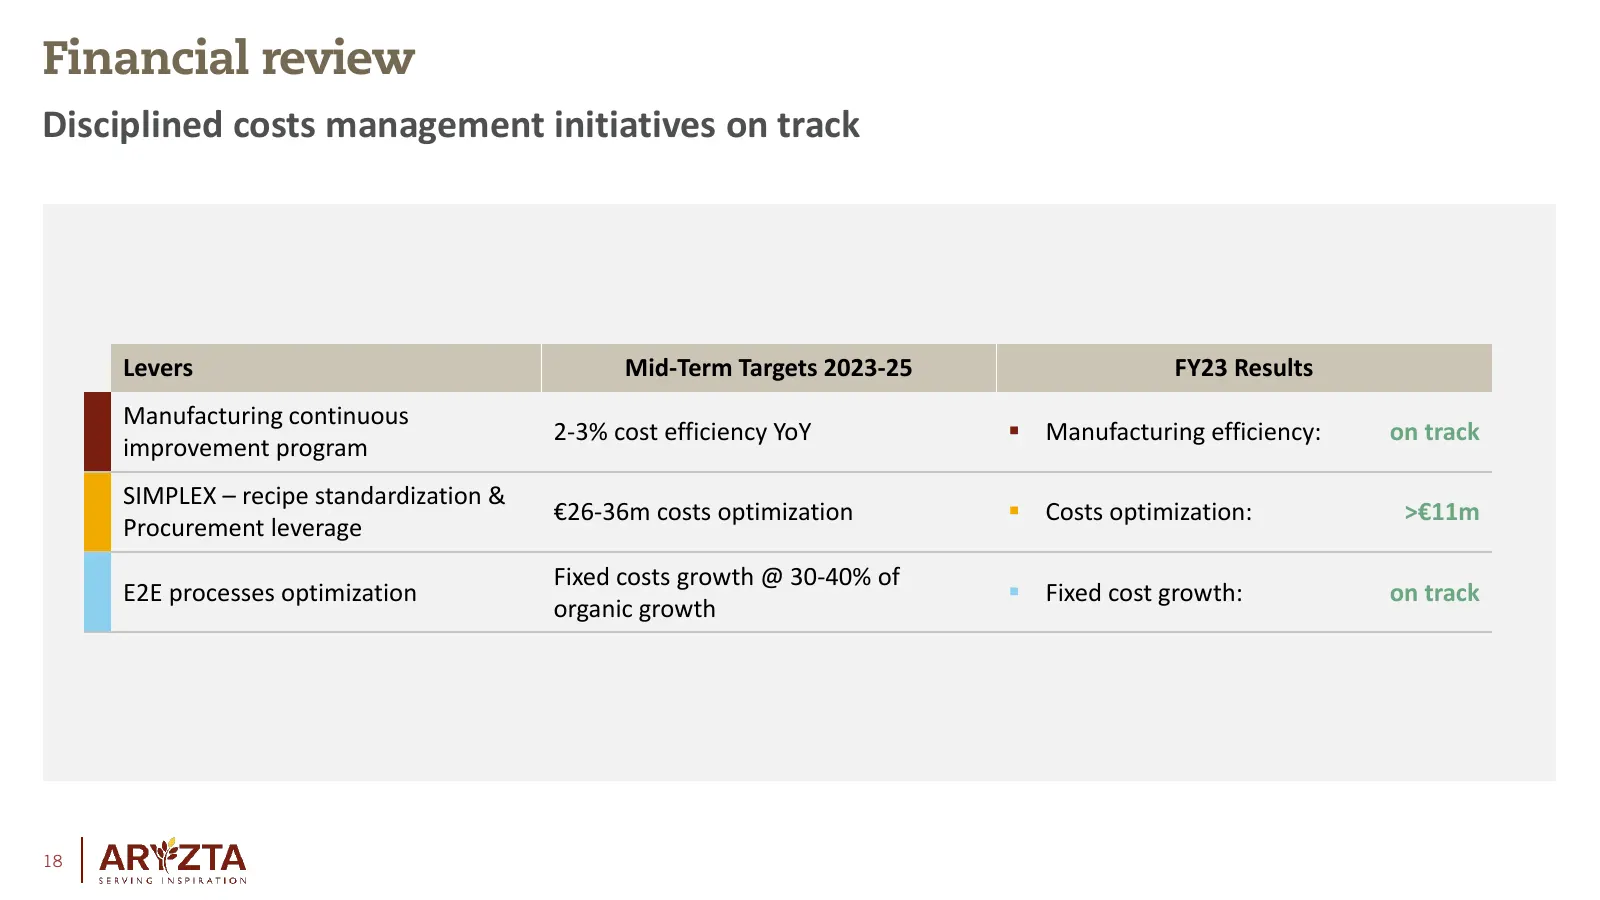
Slide 18: Disciplined costs management initiatives on track
Financial review Disciplined costs management initiatives on track Levers Mid-Term Targets 2023-25 FY23 Results Manufacturing continuous 2-3% cost efficiency YoY Manufacturing efficiency: on track improvement program SIMPLEX – recipe standardization & €26-36m costs optimization Costs optimizatio
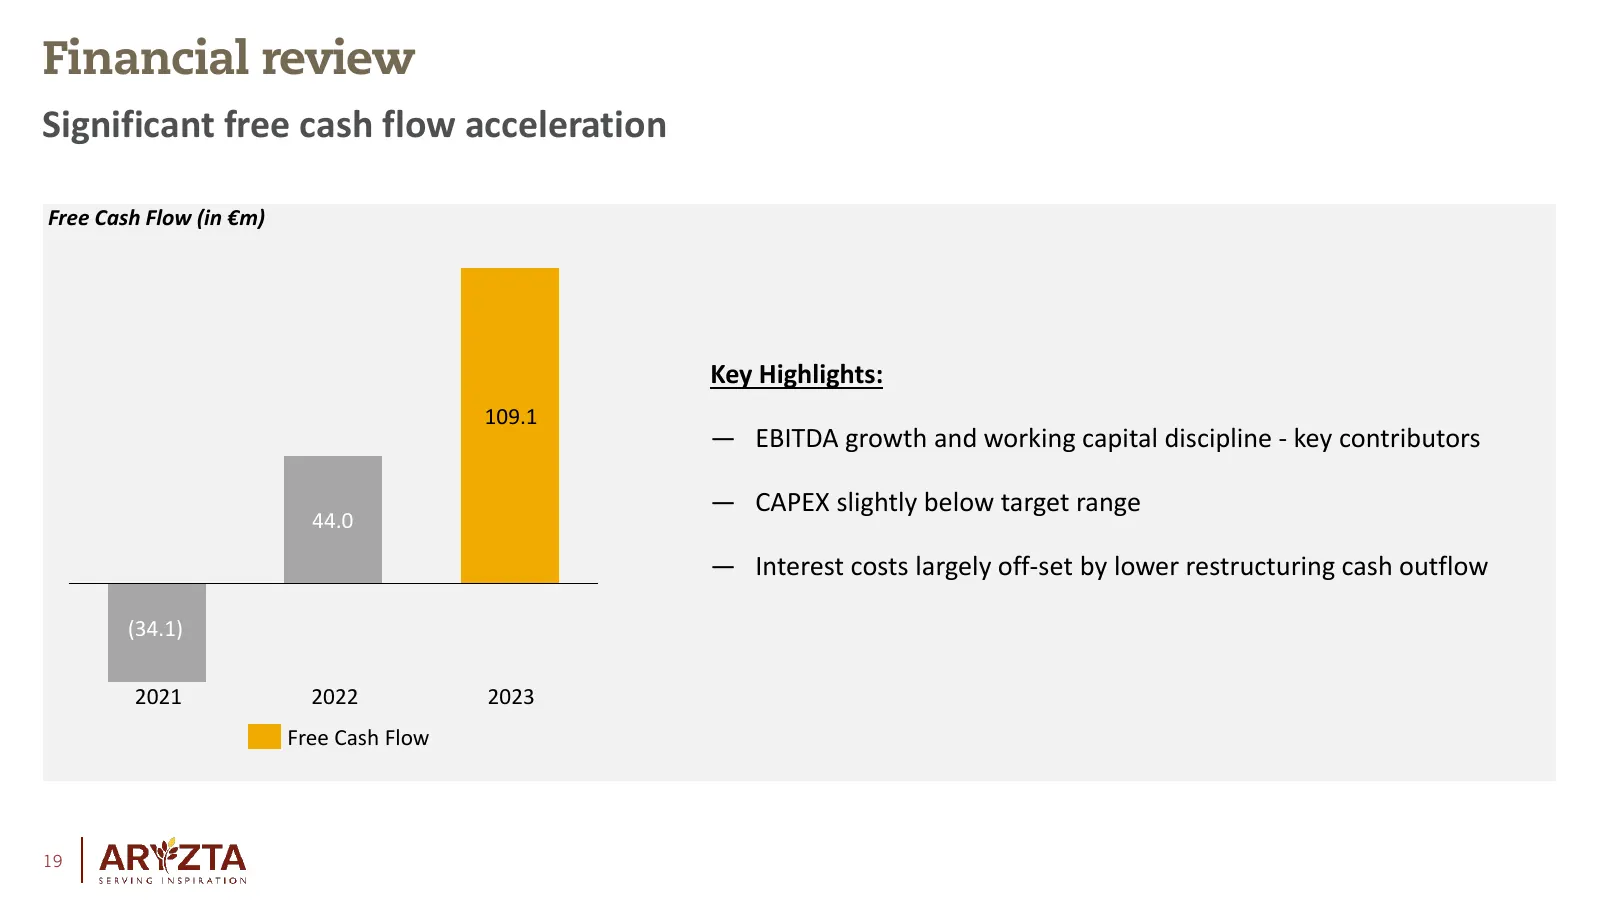
Slide 19: Significant free cash flow acceleration
Financial review Significant free cash flow acceleration Free Cash Flow (in €m) Key Highlights: 109.1 — EBITDA growth and working capital discipline - key contributors — CAPEX slightly below target range 44.0 — Interest costs largely off-set by lower restructuring cash outflow (34.1) 2021 2022 2023
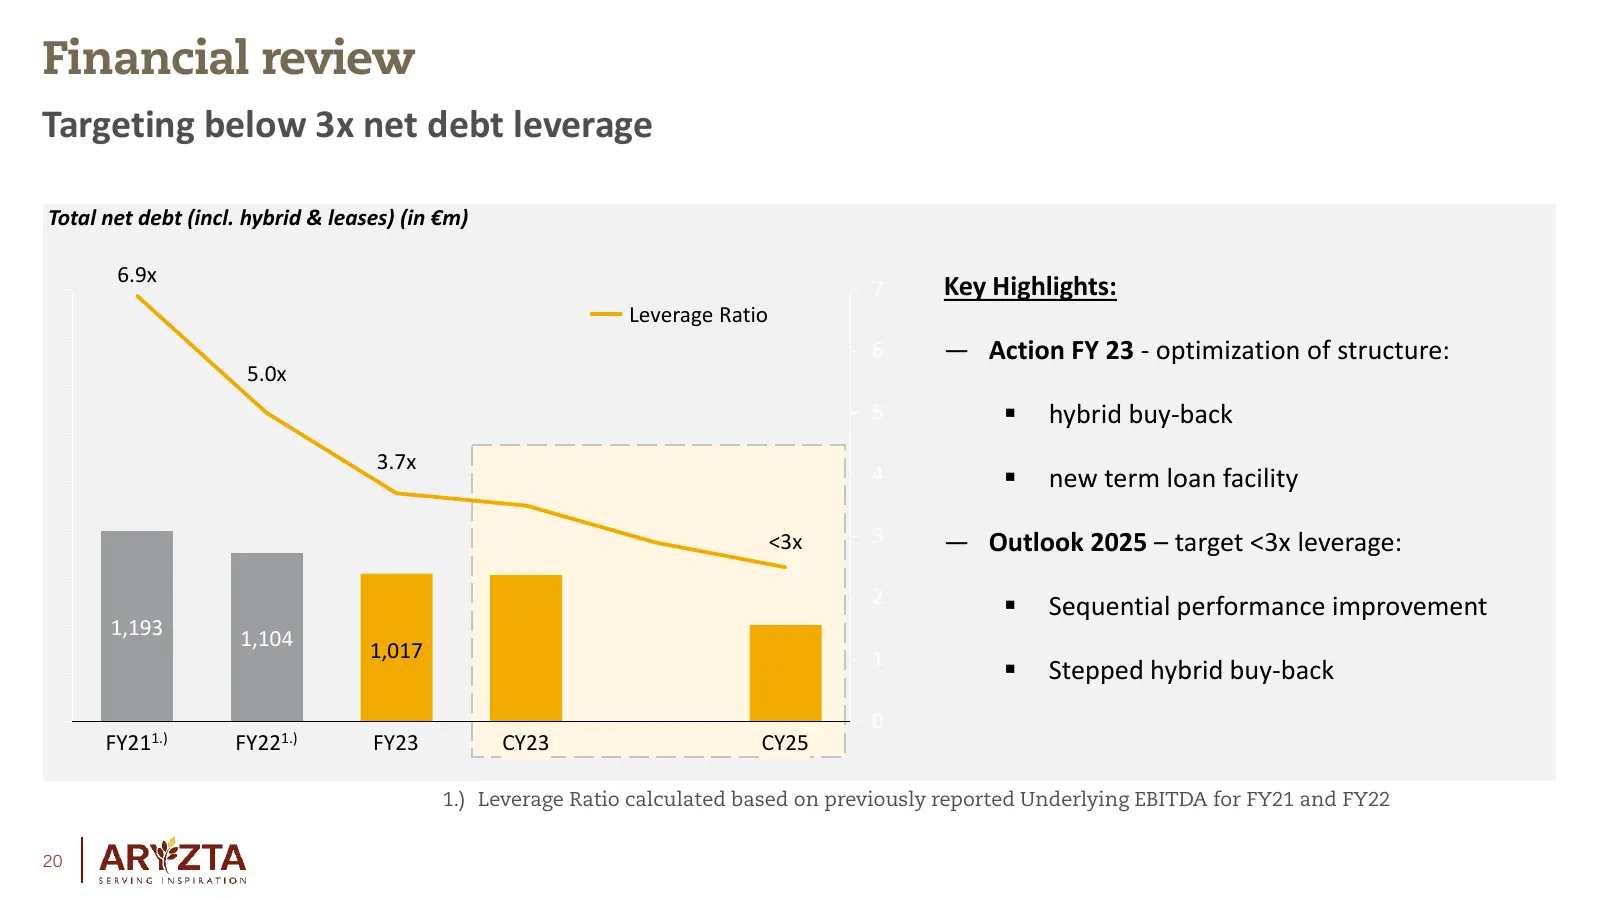
Slide 20: Targeting below 3x net debt leverage
Financial review Targeting below 3x net debt leverage Total net debt (incl. hybrid & leases) (in €m) 6.9x 7 Key Highlights: Leverage Ratio 6 — Action FY 23 - optimization of structure: 5.0x 5 hybrid buy-back 3.7x 4 new term loan facility <3x 3 — Outlook 2025 – target <3x leverage: 2 Sequential
Slide 21: Prudent interest costs management in a challenging context
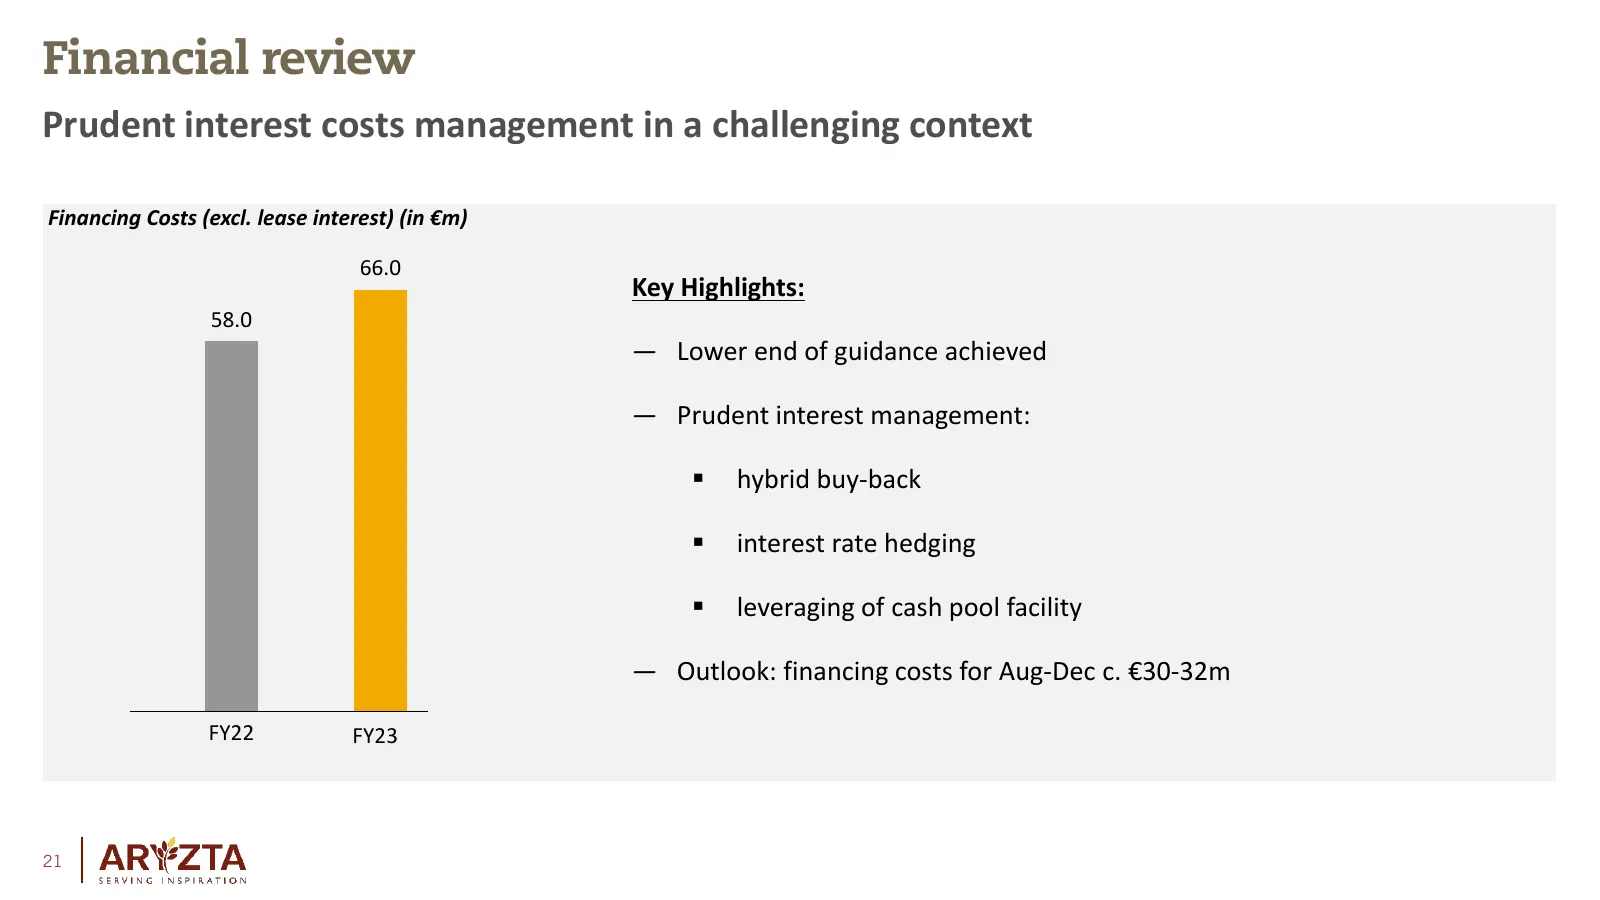
Financial review Prudent interest costs management in a challenging context Financing Costs (excl. lease interest) (in €m) 66.0 Key Highlights: 58.0 — Lower end of guidance achieved — Prudent interest management: hybrid buy-back interest rate hedging leveraging of cash pool facility — Outlook:
Slide 22: ROIC back in value creation territory, on track to mid-term target
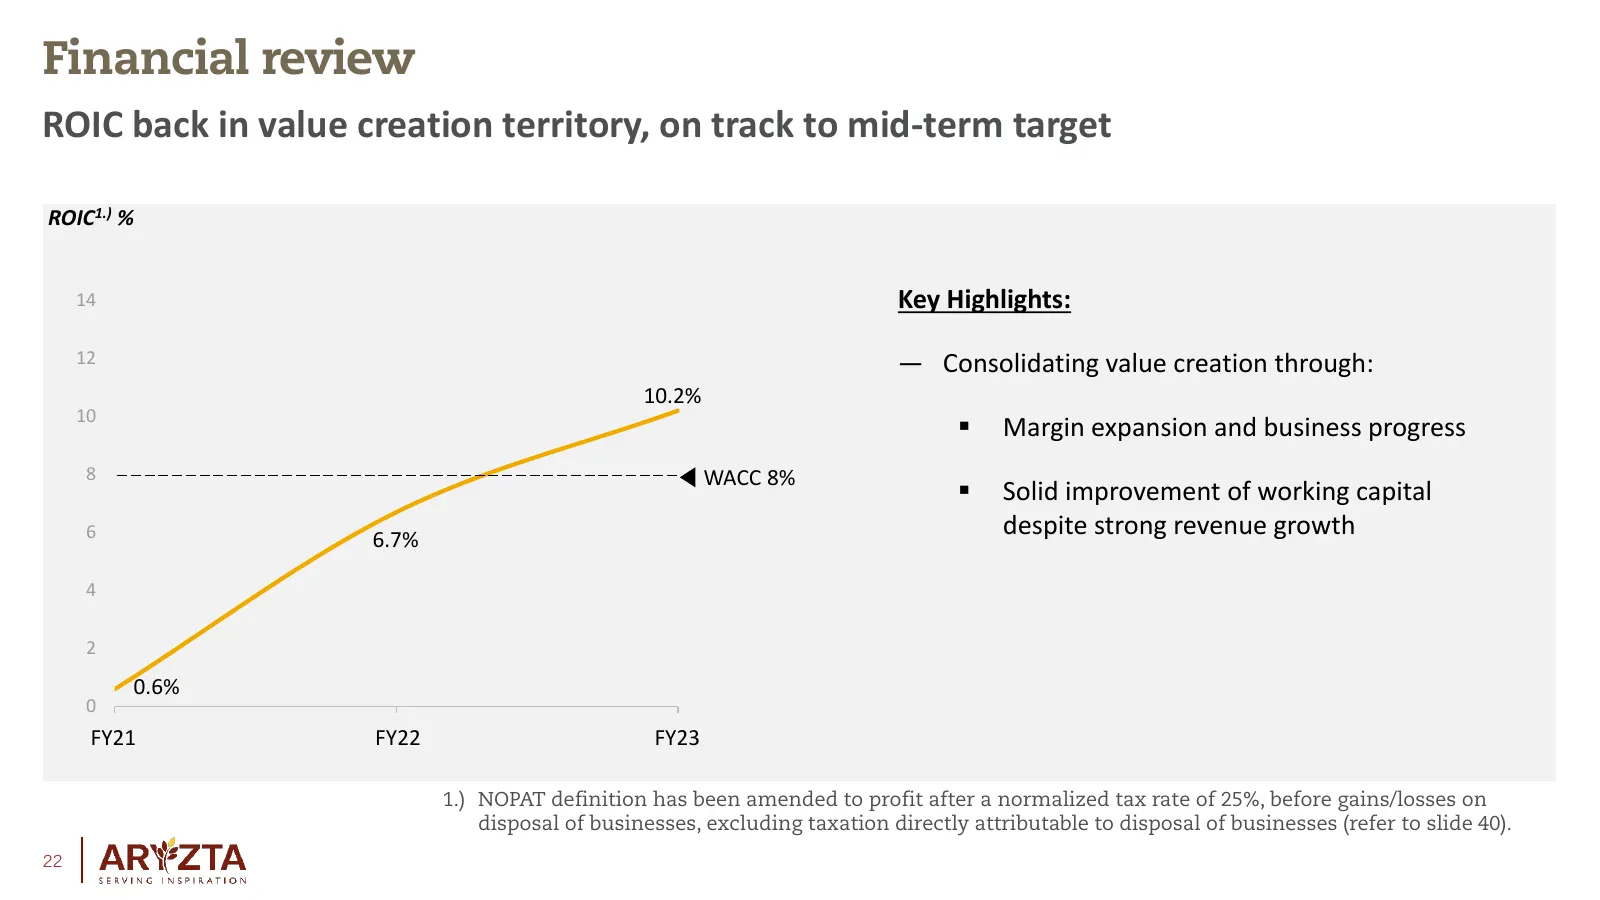
Financial review ROIC back in value creation territory, on track to mid-term target ROIC1.) % 14 Key Highlights: 12 — Consolidating value creation through: 10.2% 10 Margin expansion and business progress 8 WACC 8% Solid improvement of working capital 6 6.7% despite strong revenue growth 4 2 0.6%
Slide 23: Net profit expansion supported by overall business performance
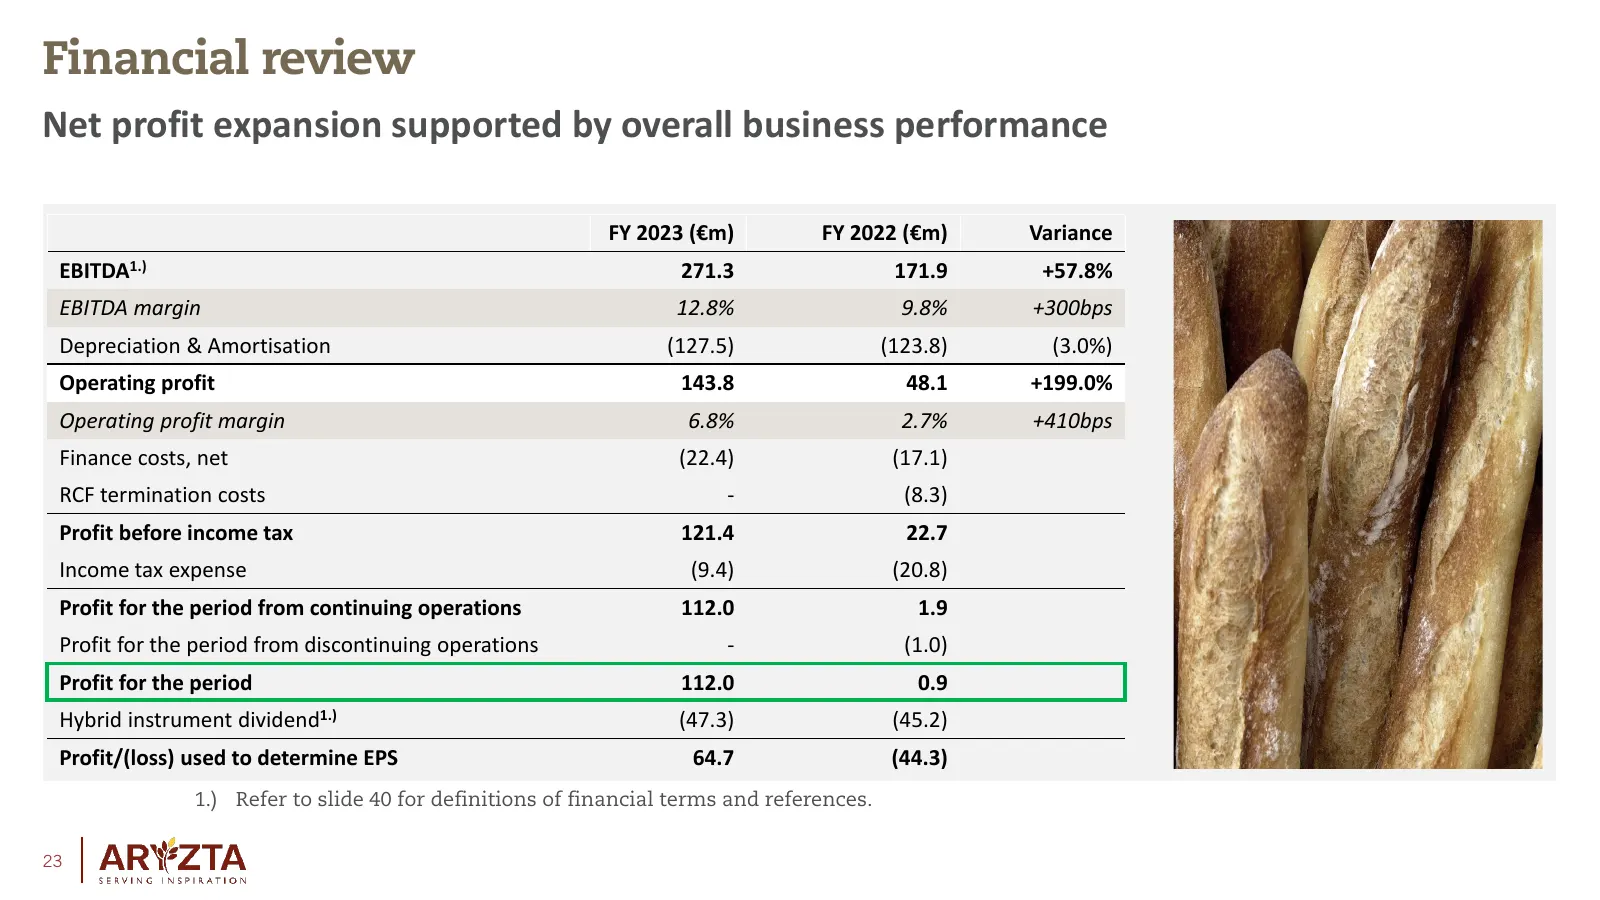
Financial review Net profit expansion supported by overall business performance FY 2023 (€m) FY 2022 (€m) Variance EBITDA1.) 271.3 171.9 +57.8% EBITDA margin 12.8% 9.8% +300bps Depreciation & Amortisation (127.5) (123.8) (3.0%) Operating profit 143.8 48.1 +199.0% Operating profit margin 6.8% 2.7% +4

Slide 24: Appendix
x - Append SERVING INSPIRATION | ARYZTA
Slide 25: Summary Results
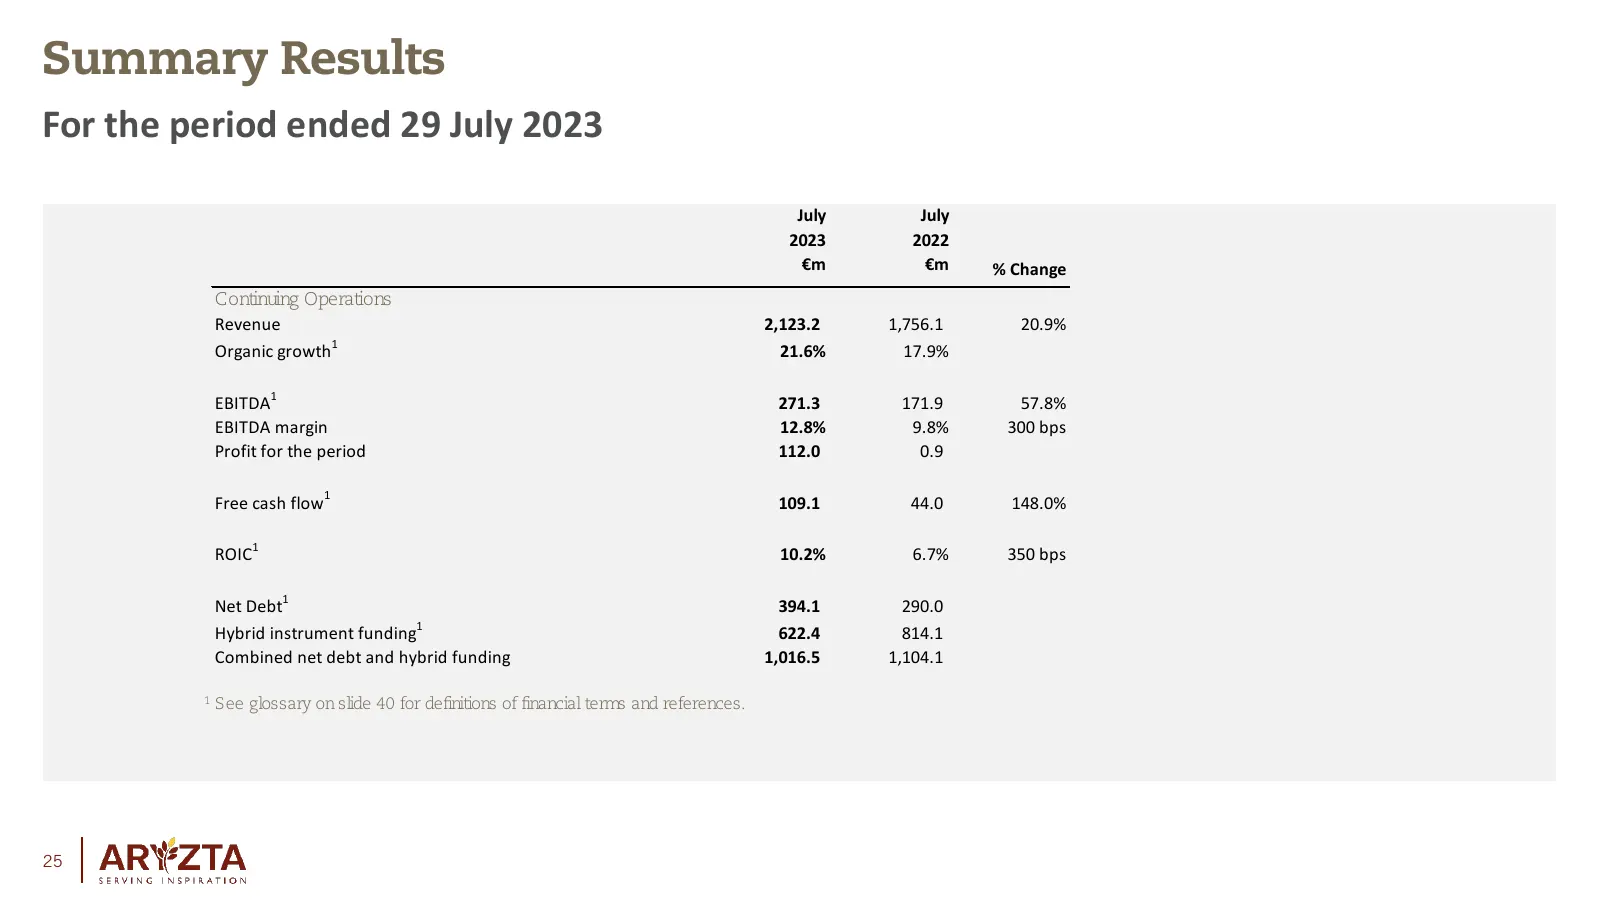
Summary Results For the period ended 29 July 2023 July July 2023 2022 €m €m % Change Continuing Operations Revenue 2,123.2 1,756.1 20.9% 1 Organic growth 21.6% 17.9% EBITDA1 271.3 171.9 57.8% EBITDA margin 12.8% 9.8% 300 bps Profit for the period 112.0 0.9 Free cash flow1 109.1 44.0 148.0% ROIC1 10.
Slide 26: Revenue
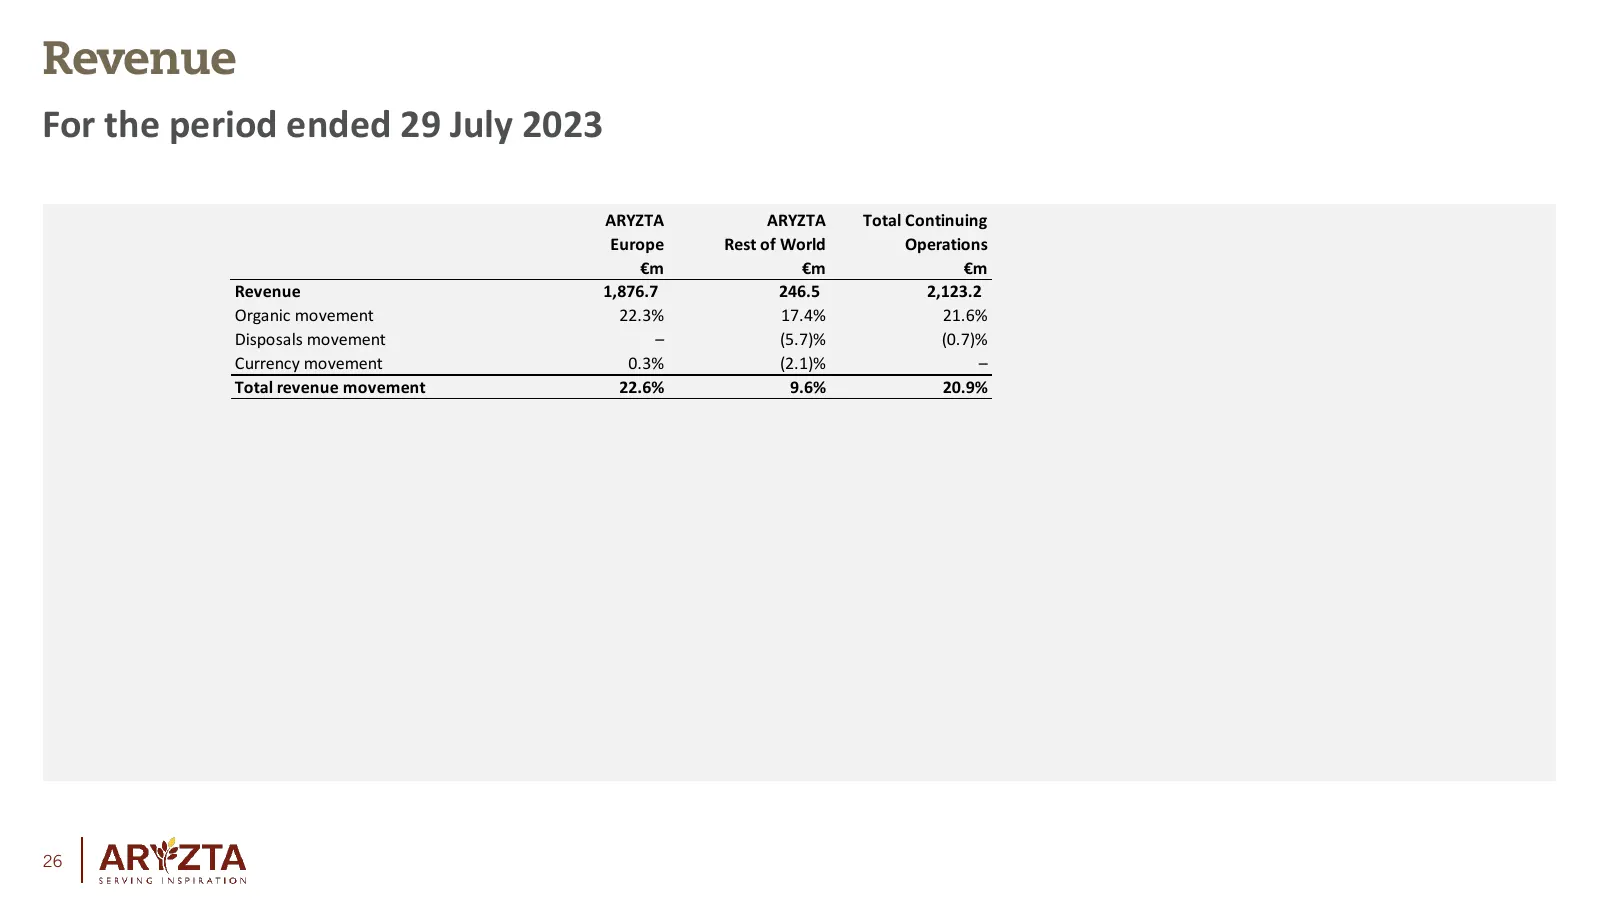
Revenue For the period ended 29 July 2023 ARYZTA ARYZTA Total Continuing Europe Rest of World Operations €m €m €m Revenue 1,876.7 246.5 2,123.2 Organic movement 22.3% 17.4% 21.6% Disposals movement – (5.7)% (0.7)% Currency movement 0.3% (2.1)% – Total revenue movement 22.6% 9.6% 20.9% 26
Slide 27: Quarterly Organic Revenue
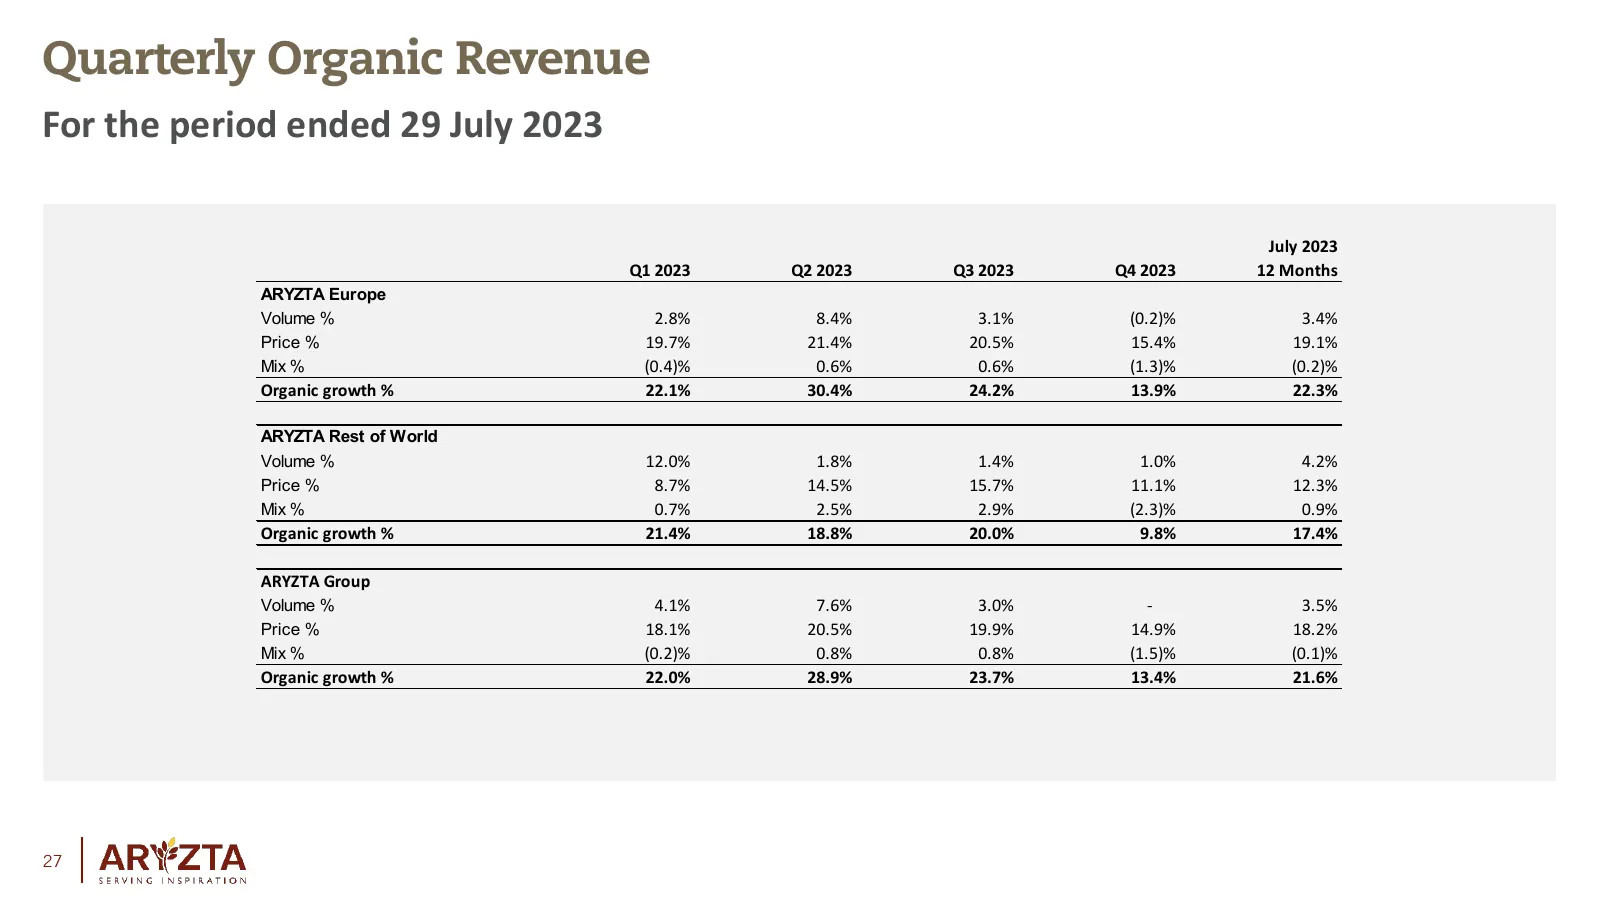
Quarterly Organic Revenue For the period ended 29 July 2023 July 2023 Q1 2023 Q2 2023 Q3 2023 Q4 2023 12 Months ARYZTA Europe Volume % 2.8% 8.4% 3.1% (0.2)% 3.4% Price % 19.7% 21.4% 20.5% 15.4% 19.1% Mix % (0.4)% 0.6% 0.6% (1.3)% (0.2)% Organic growth % 22.1% 30.4% 24.2% 13.9% 22.3% ARYZTA Rest of W
Slide 28: Segmental EBITDA
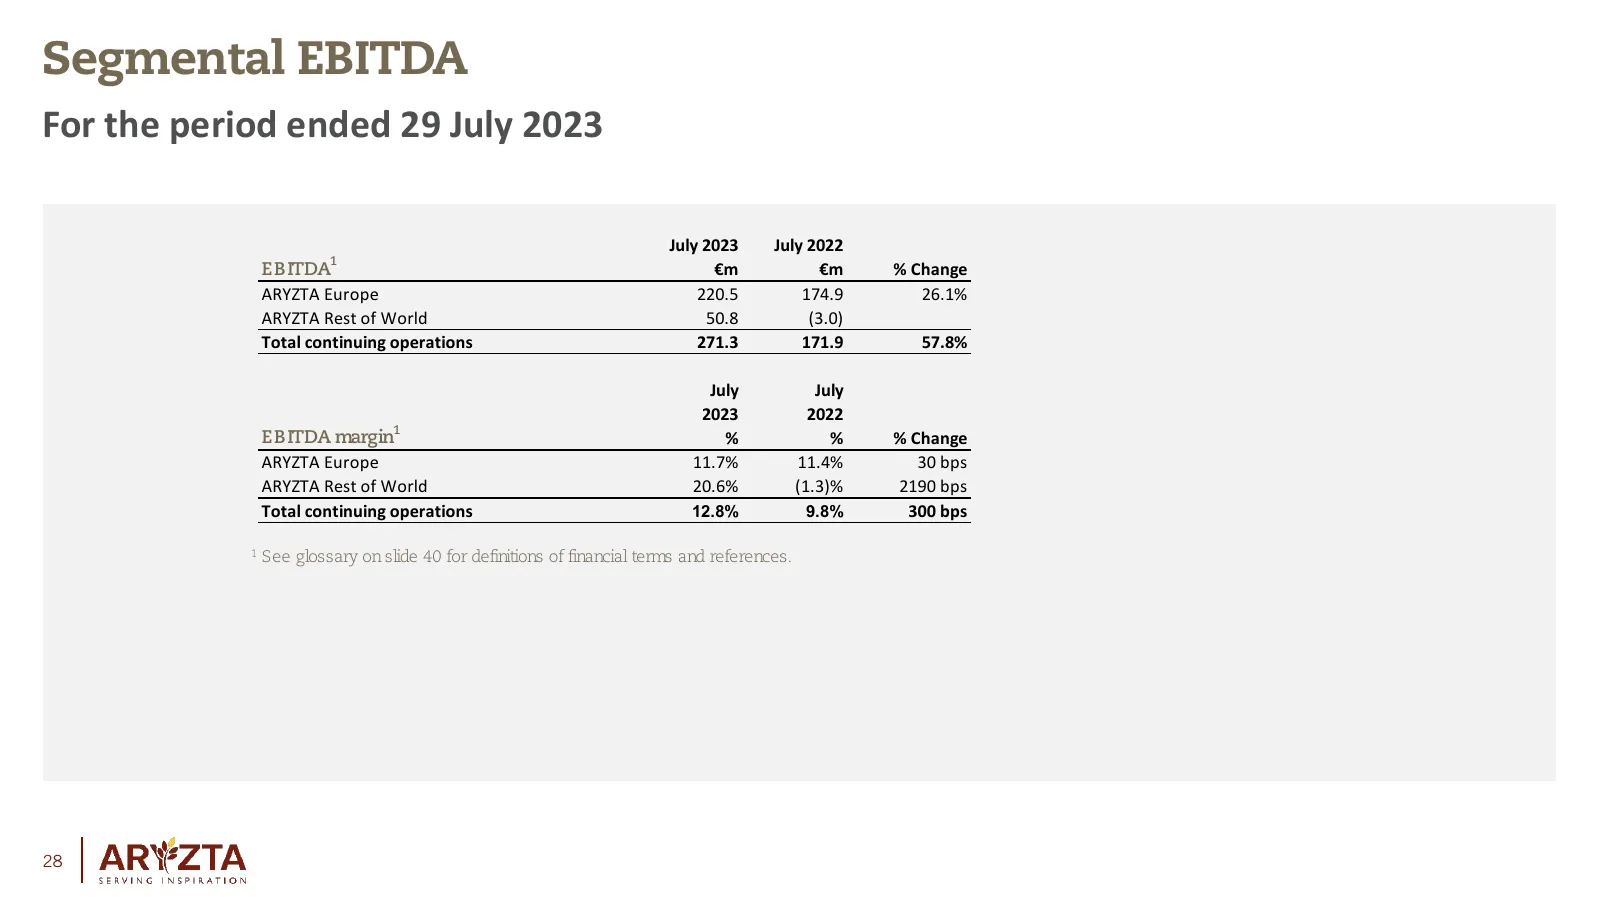
Segmental EBITDA For the period ended 29 July 2023 July 2023 July 2022 1 EBITDA €m €m % Change ARYZTA Europe 220.5 174.9 26.1% ARYZTA Rest of World 50.8 (3.0) Total continuing operations 271.3 171.9 57.8% July July 2023 2022 EBITDA margin1 % % % Change ARYZTA Europe 11.7% 11.4% 30 bps ARYZTA Rest of
Slide 29: Reconciliation from Underlying EBITDA to EBITDA
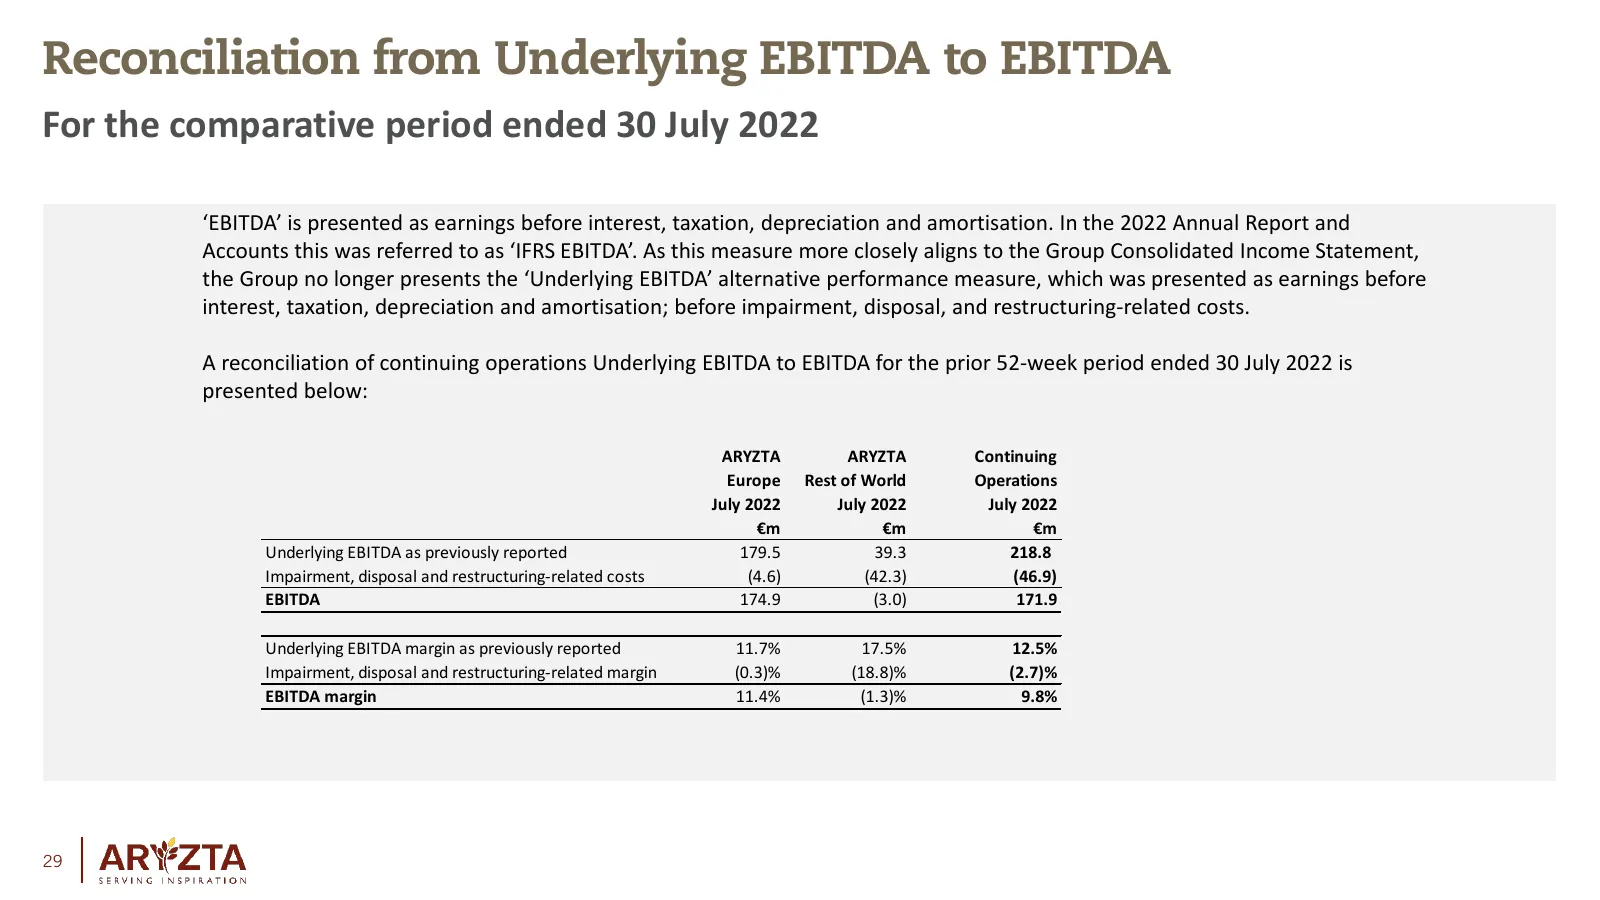
Reconciliation from Underlying EBITDA to EBITDA For the comparative period ended 30 July 2022 ‘EBITDA’ is presented as earnings before interest, taxation, depreciation and amortisation. In the 2022 Annual Report and Accounts this was referred to as ‘IFRS EBITDA’. As this measure more closely aligns
Slide 30: Gross Margin Development
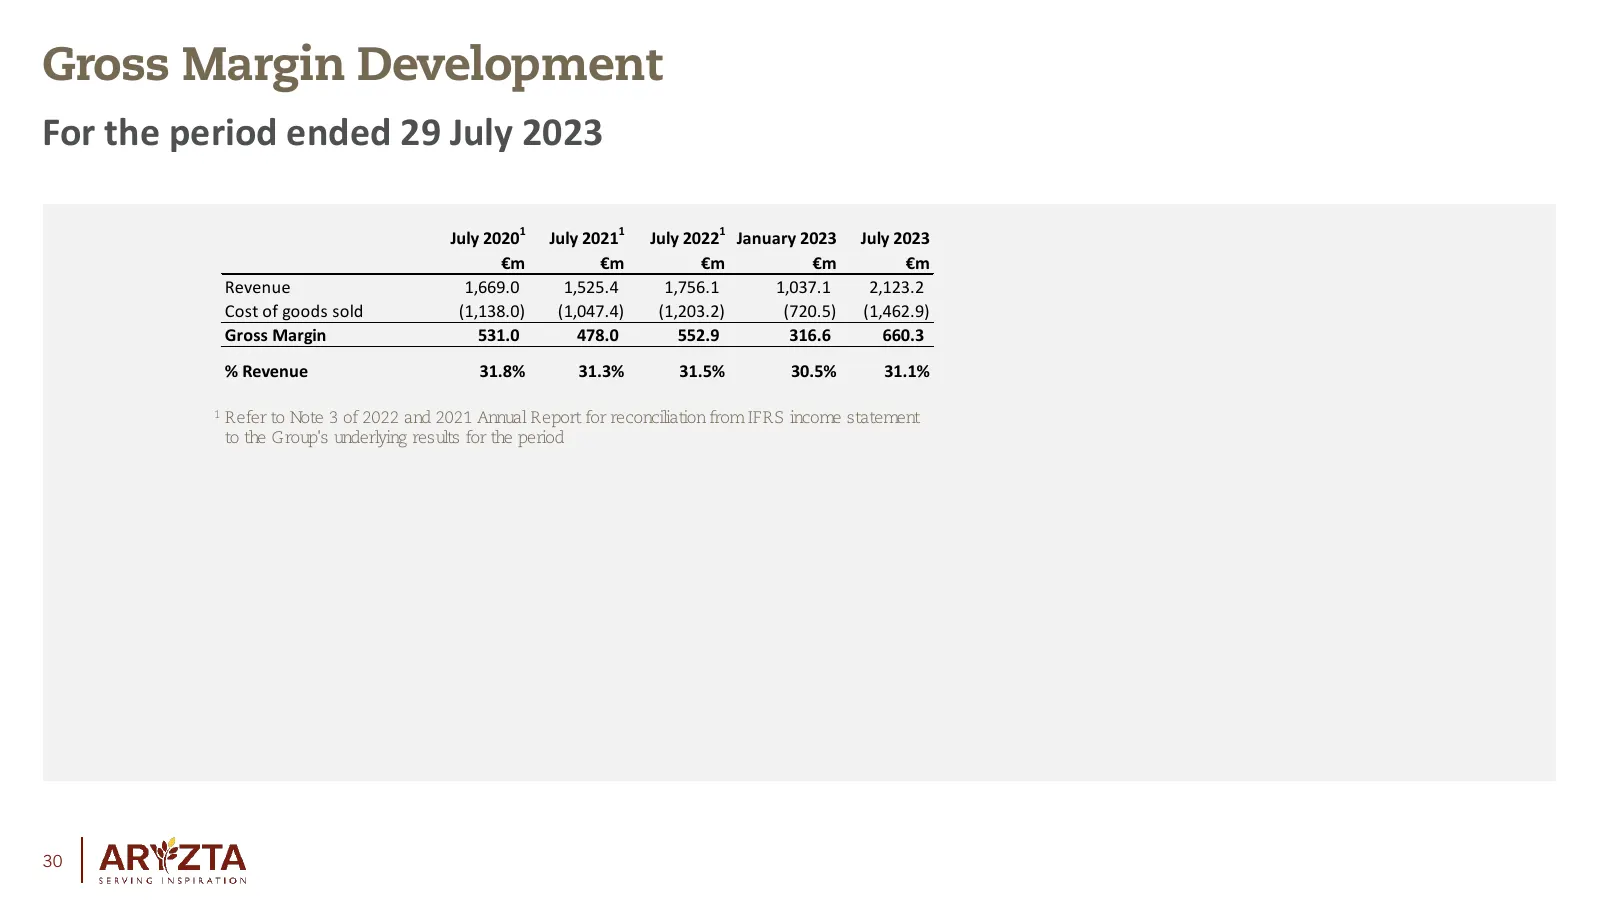
Gross Margin Development For the period ended 29 July 2023 July 20201 July 20211 July 20221 January 2023 July 2023 €m €m €m €m €m Revenue 1,669.0 1,525.4 1,756.1 1,037.1 2,123.2 Cost of goods sold (1,138.0) (1,047.4) (1,203.2) (720.5) (1,462.9) Gross Margin 531.0 478.0 552.9 316.6 660.3 % Revenue 31
Slide 31: Impairment, disposal, and restructuring related costs
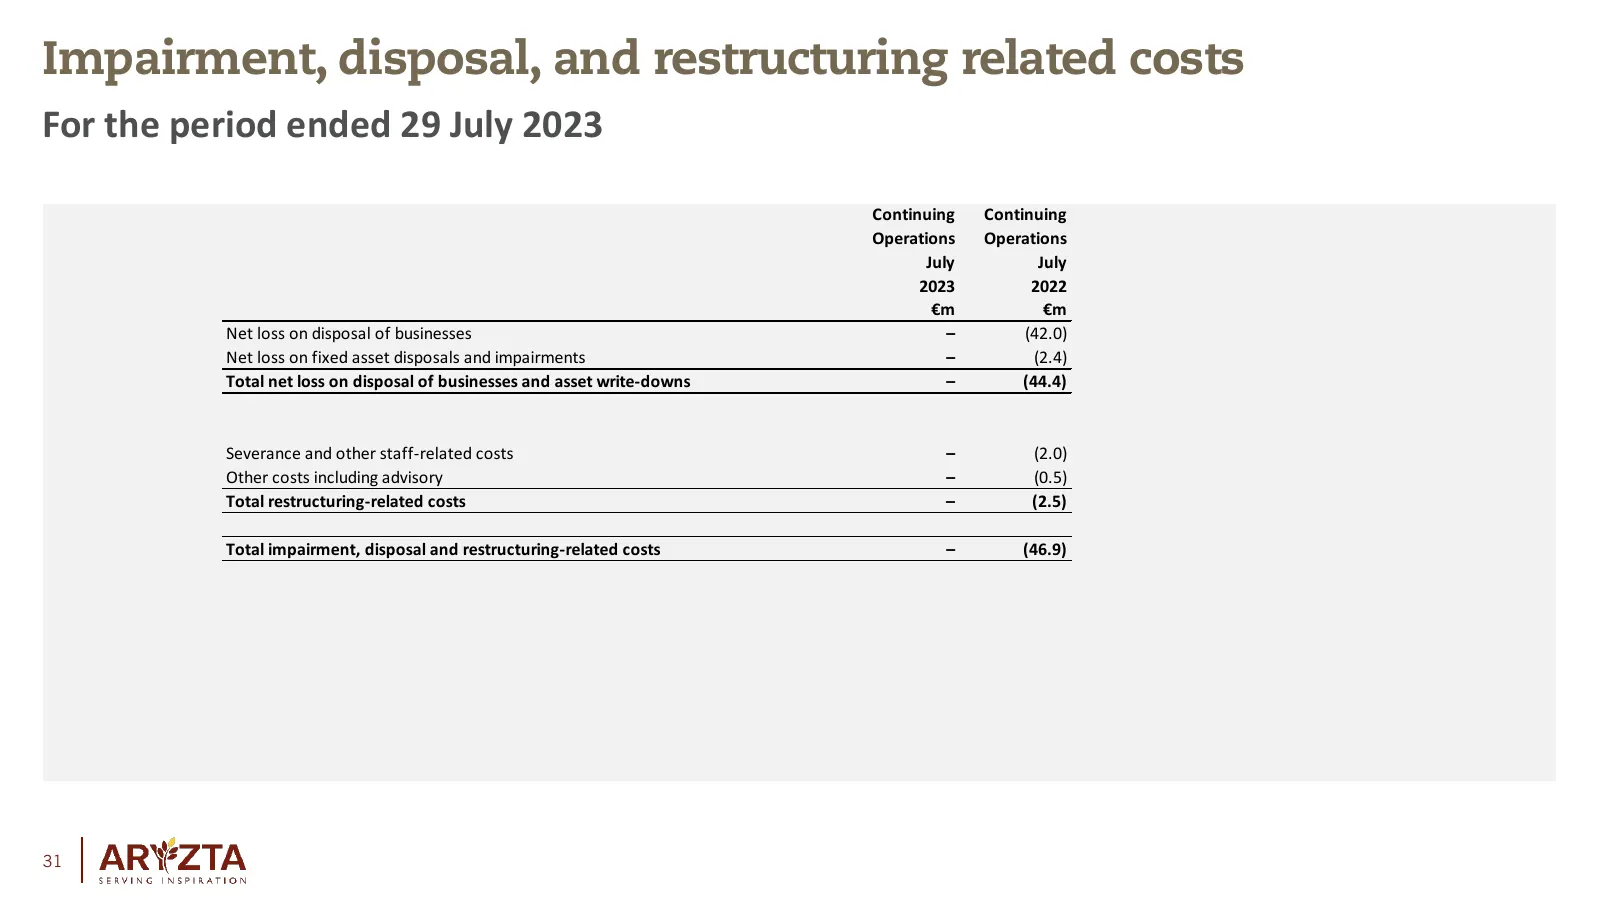
Impairment, disposal, and restructuring related costs For the period ended 29 July 2023 Continuing Continuing Operations Operations July July 2023 2022 €m €m Net loss on disposal of businesses – (42.0) Net loss on fixed asset disposals and impairments – (2.4) Total net loss on disposal of businesses
Slide 32: Free cash flow
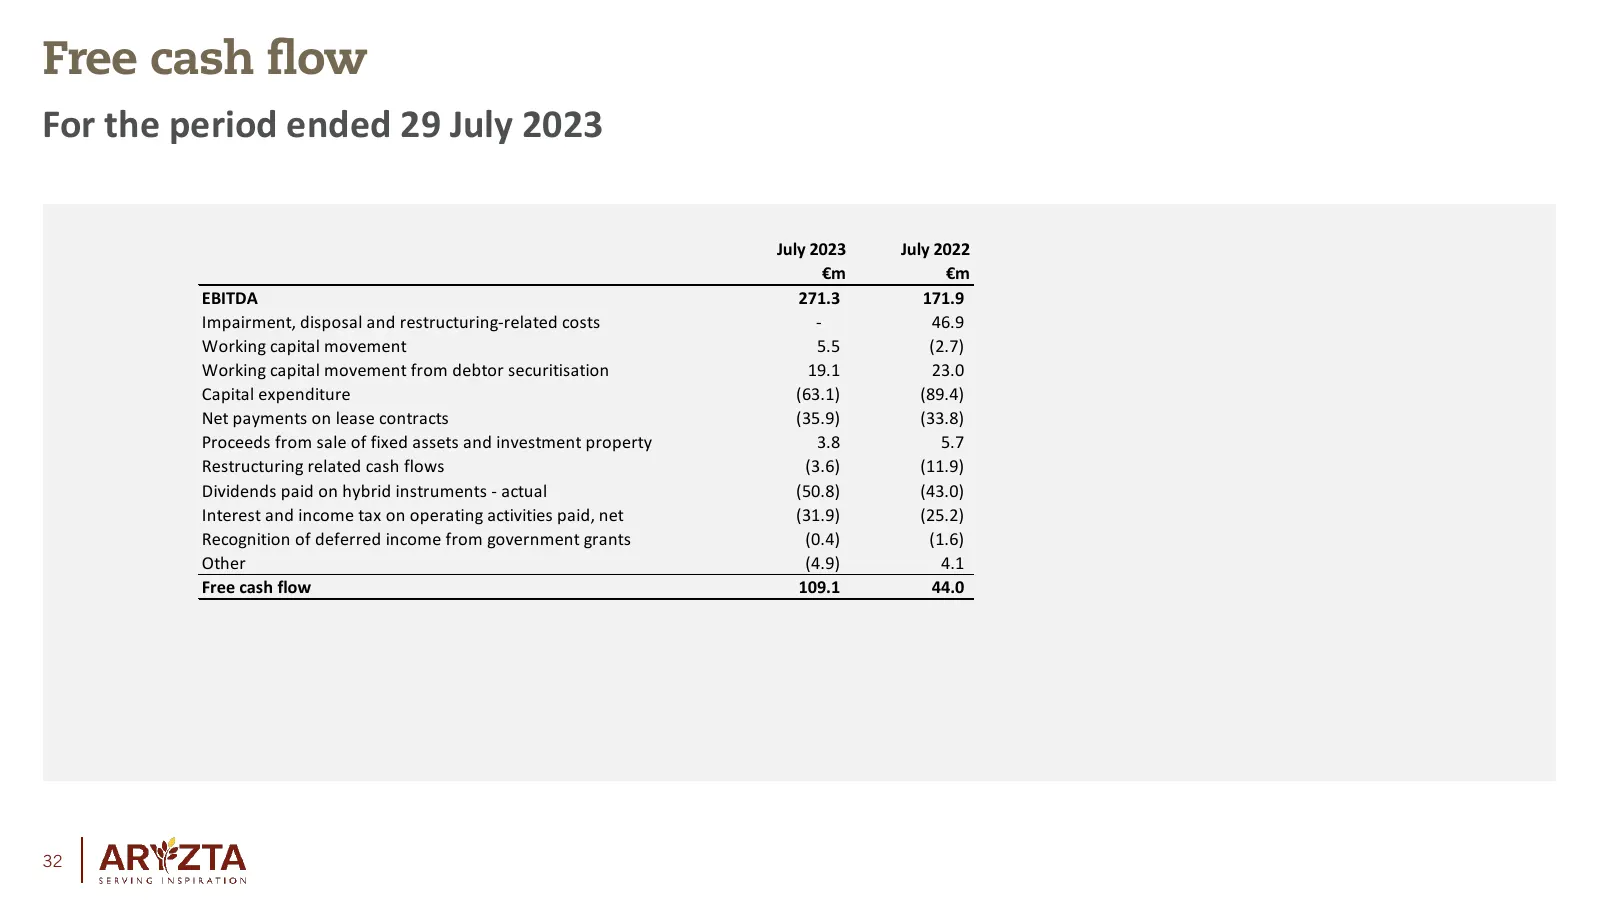
Free cash flow For the period ended 29 July 2023 July 2023 July 2022 €m €m EBITDA 271.3 171.9 Impairment, disposal and restructuring-related costs - 46.9 Working capital movement 5.5 (2.7) Working capital movement from debtor securitisation 19.1 23.0 Capital expenditure (63.1) (89.4) Net payments on
Slide 33: Reconciliation of IFRS cash flow from operating activities to Free Cash Flow
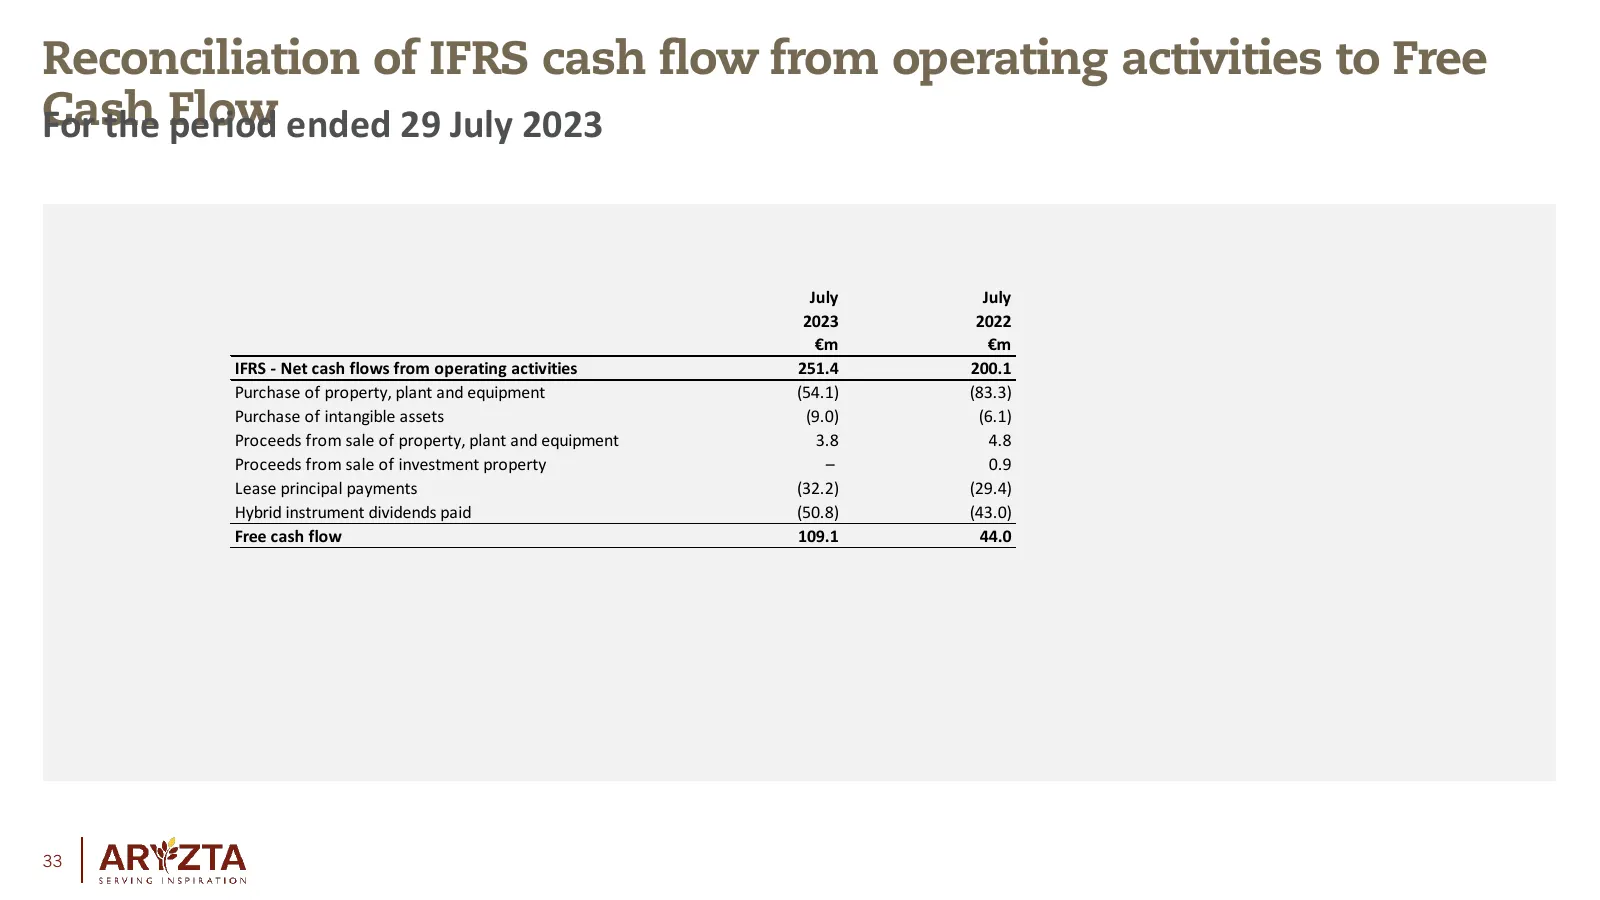
Reconciliation of IFRS cash flow from operating activities to Free Cash For the Flow period ended 29 July 2023 July July 2023 2022 €m €m IFRS - Net cash flows from operating activities 251.4 200.1 Purchase of property, plant and equipment (54.1) (83.3) Purchase of intangible assets (9.0) (6.1) Proce
Slide 34: Net Debt Evolution
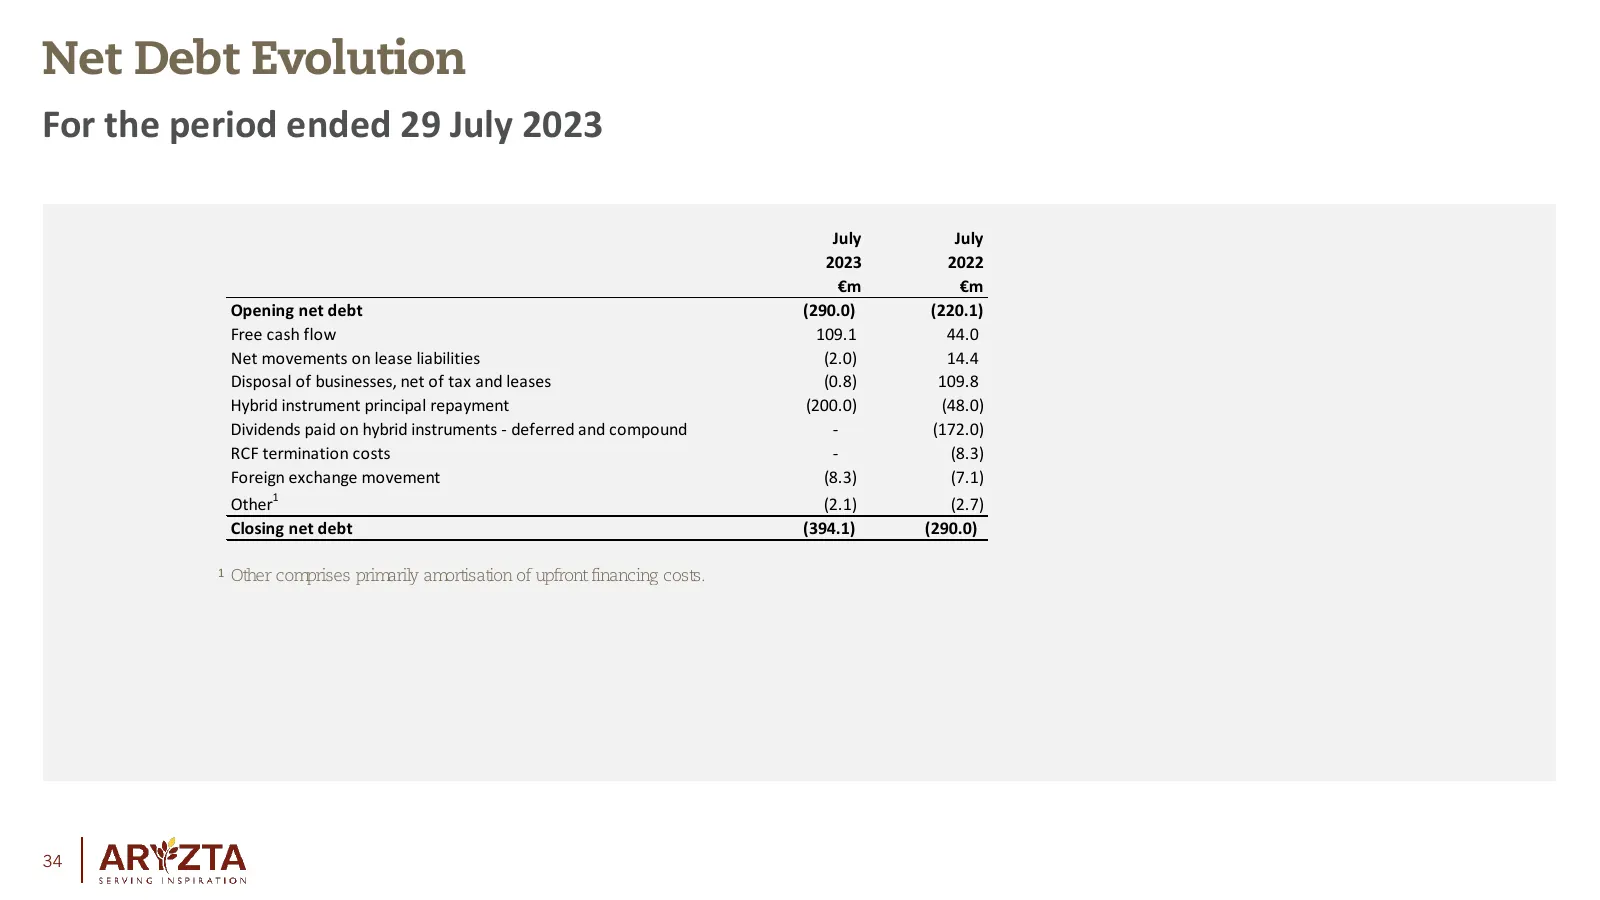
Net Debt Evolution For the period ended 29 July 2023 July July 2023 2022 €m €m Opening net debt (290.0) (220.1) Free cash flow 109.1 44.0 Net movements on lease liabilities (2.0) 14.4 Disposal of businesses, net of tax and leases (0.8) 109.8 Hybrid instrument principal repayment (200.0) (48.0) Divid
Slide 35: ARYZTA Group Gross Term Debt Financing Facilities
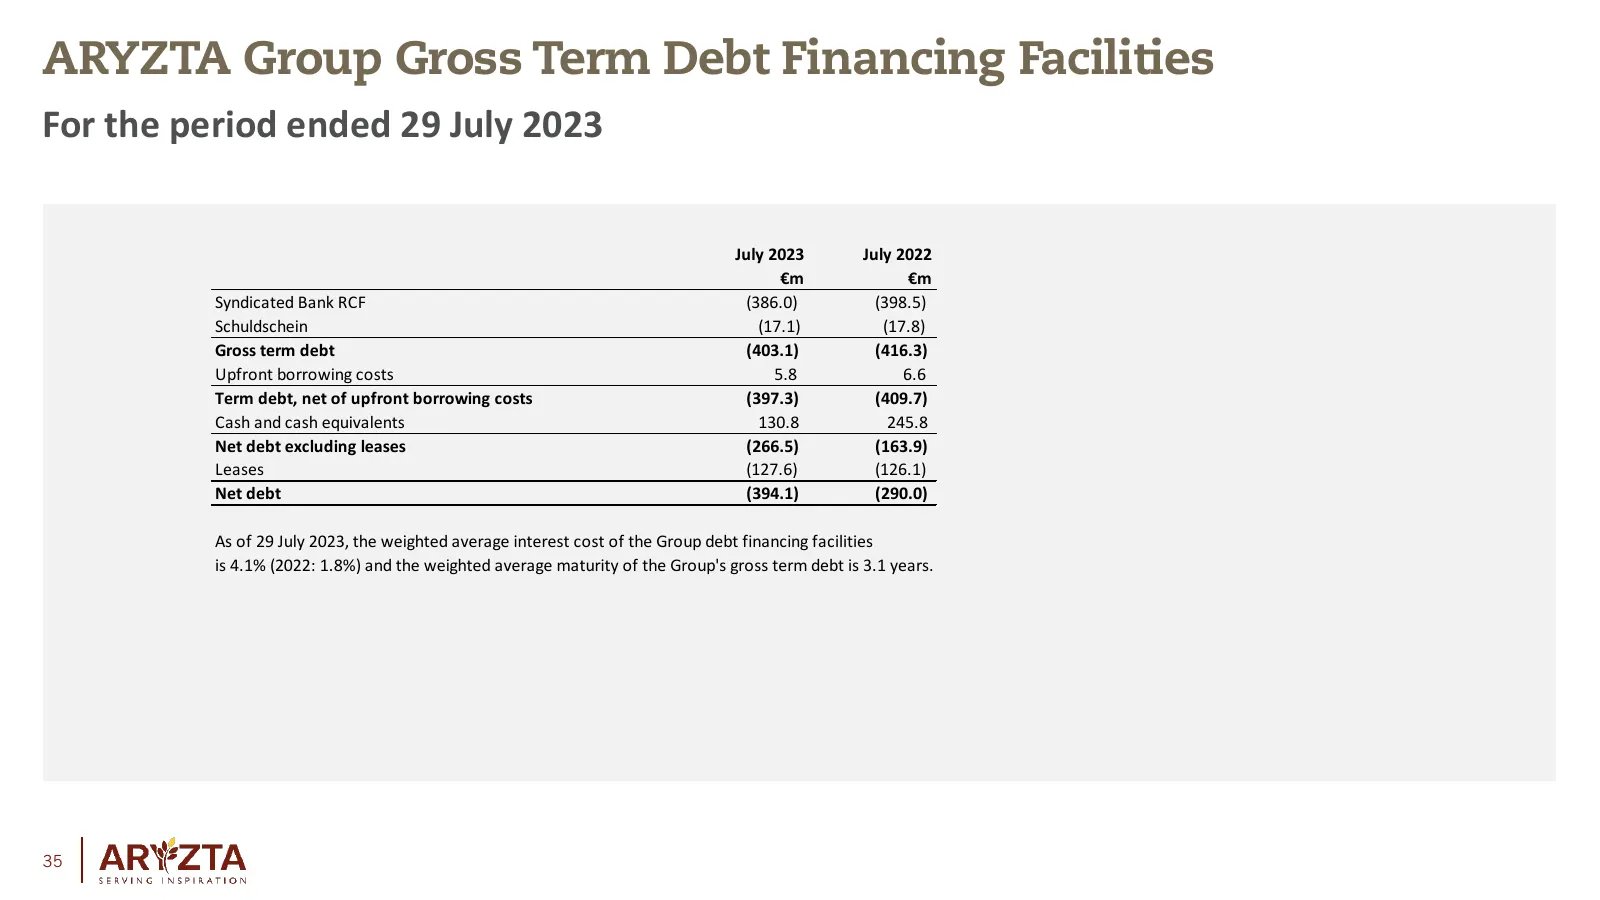
ARYZTA Group Gross Term Debt Financing Facilities For the period ended 29 July 2023 July 2023 July 2022 €m €m Syndicated Bank RCF (386.0) (398.5) Schuldschein (17.1) (17.8) Gross term debt (403.1) (416.3) Upfront borrowing costs 5.8 6.6 Term debt, net of upfront borrowing costs (397.3) (409.7) Cash
Slide 36: Covenants
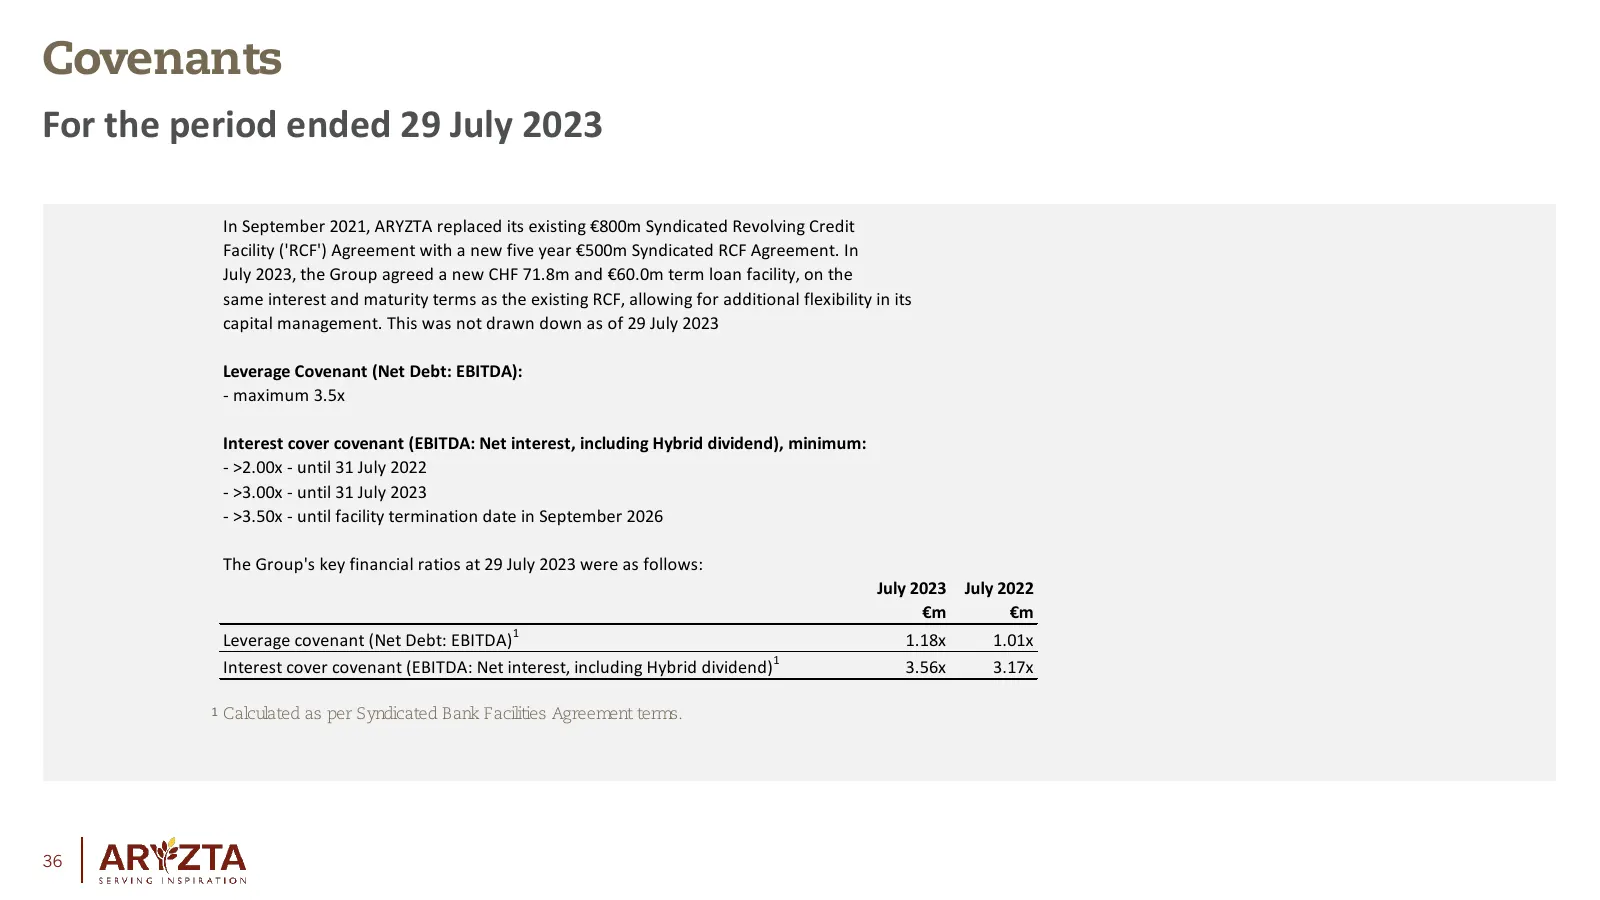
Covenants For the period ended 29 July 2023 In September 2021, ARYZTA replaced its existing €800m Syndicated Revolving Credit Facility ('RCF') Agreement with a new five year €500m Syndicated RCF Agreement. In July 2023, the Group agreed a new CHF 71.8m and €60.0m term loan facility, on the same inte
Slide 37: ARYZTA Group – Return on Invested Capital
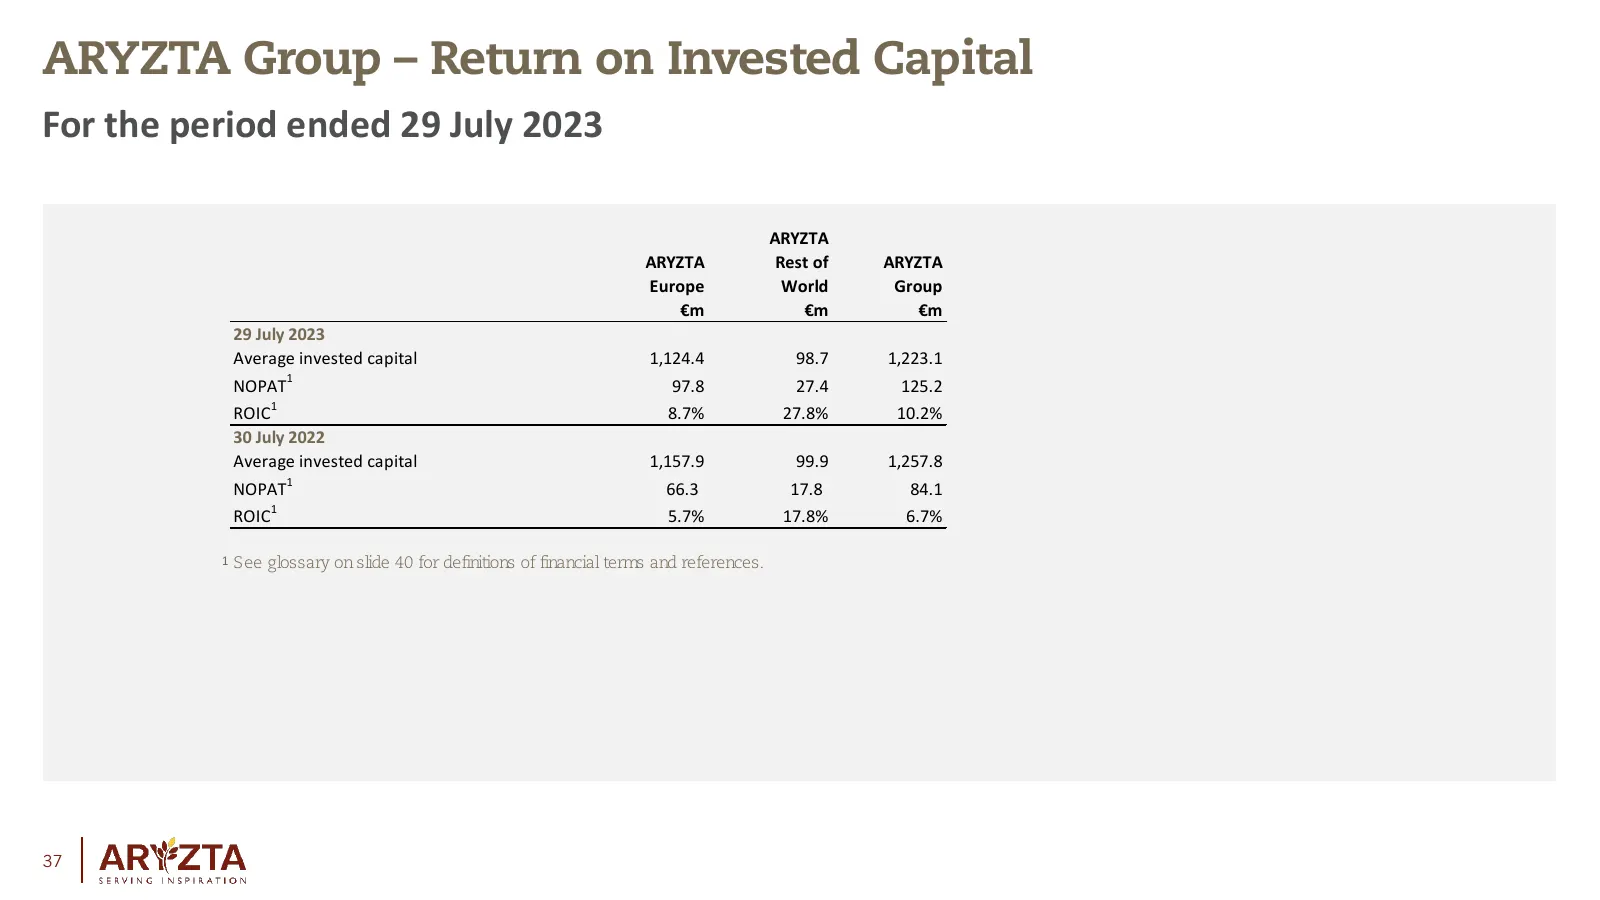
ARYZTA Group – Return on Invested Capital For the period ended 29 July 2023 ARYZTA ARYZTA Rest of ARYZTA Europe World Group €m €m €m 29 July 2023 Average invested capital 1,124.4 98.7 1,223.1 NOPAT1 97.8 27.4 125.2 ROIC1 8.7% 27.8% 10.2% 30 July 2022 Average invested capital 1,157.9 99.9 1,257.8 1 N
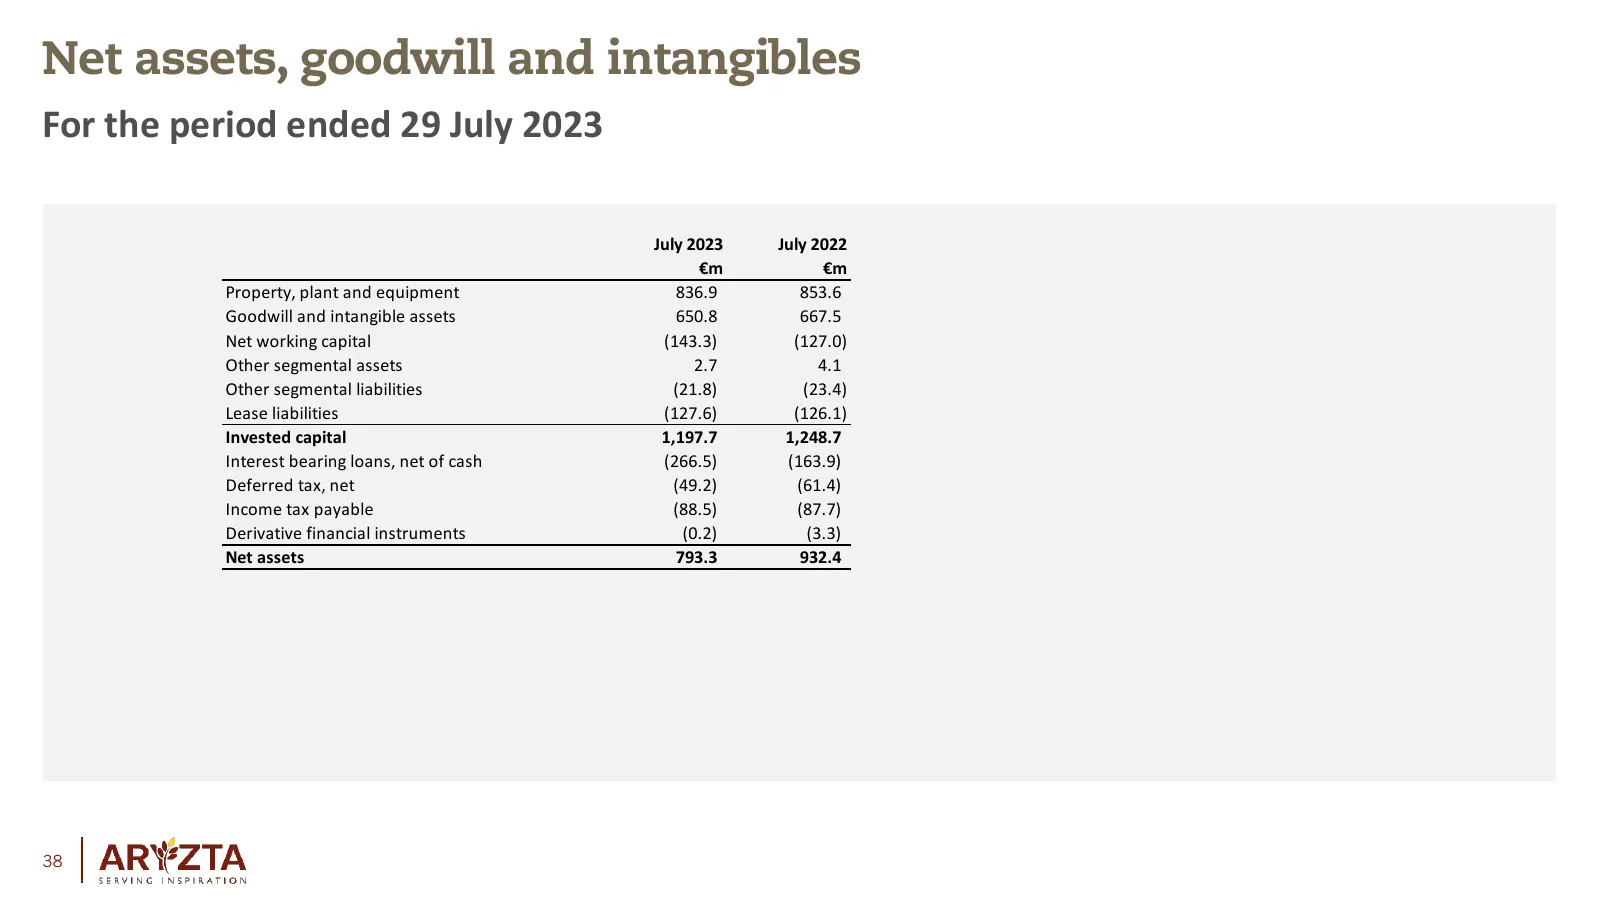
Slide 38: Net assets, goodwill and intangibles
Net assets, goodwill and intangibles For the period ended 29 July 2023 July 2023 July 2022 €m €m Property, plant and equipment 836.9 853.6 Goodwill and intangible assets 650.8 667.5 Net working capital (143.3) (127.0) Other segmental assets 2.7 4.1 Other segmental liabilities (21.8) (23.4) Lease lia
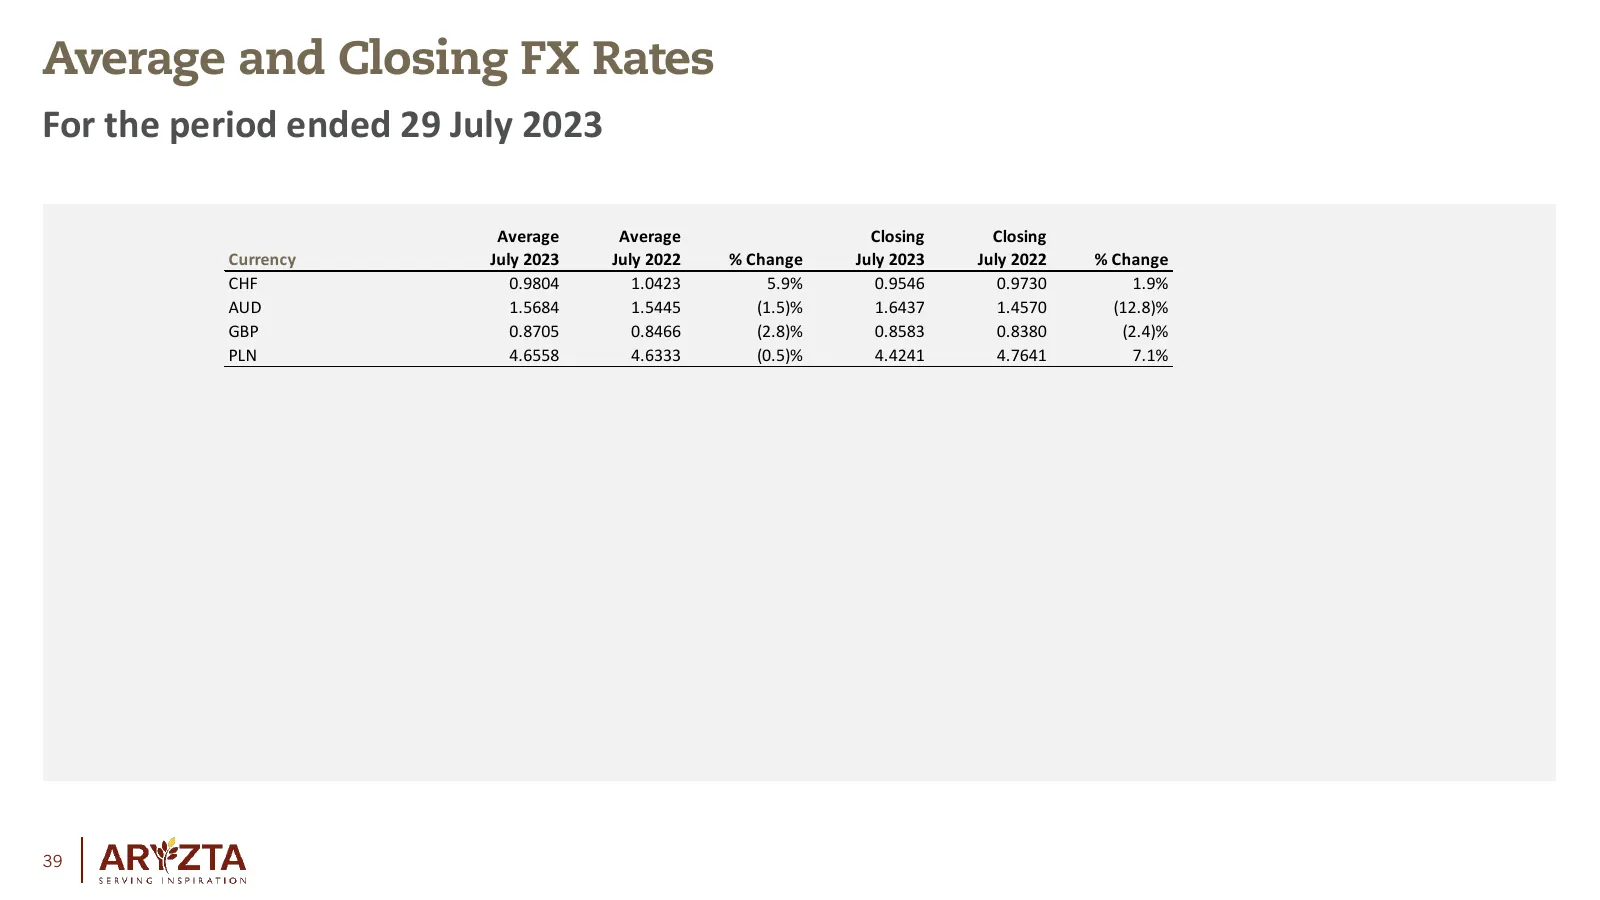
Slide 39: Average and Closing FX Rates
Average and Closing FX Rates For the period ended 29 July 2023 Average Average Closing Closing Currency July 2023 July 2022 % Change July 2023 July 2022 % Change CHF 0.9804 1.0423 5.9% 0.9546 0.9730 1.9% AUD 1.5684 1.5445 (1.5)% 1.6437 1.4570 (12.8)% GBP 0.8705 0.8466 (2.8)% 0.8583 0.8380 (2.4)% PLN
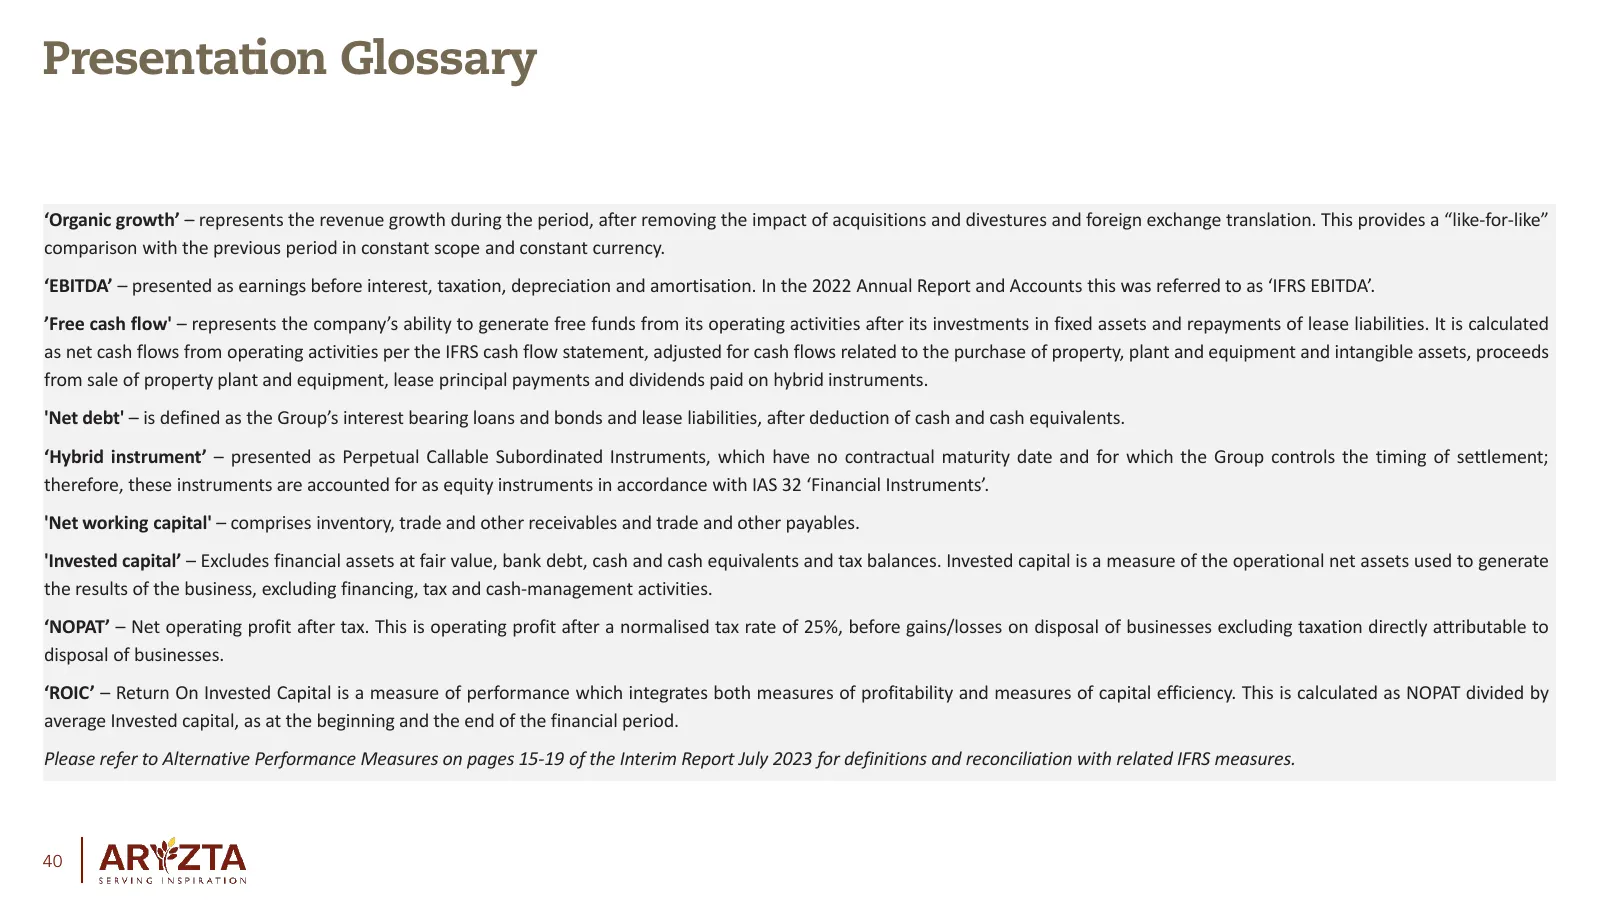
Slide 40: Presentation Glossary
Presentation Glossary ‘Organic growth’ – represents the revenue growth during the period, after removing the impact of acquisitions and divestures and foreign exchange translation. This provides a “like-for-like” comparison with the previous period in constant scope and constant currency. ‘EBITDA’ –
Source: Internet Archive copy of aryzta.com
More decks from Aryzta AG
 H1 2026 Earnings Presentation32 slides · Aug 10, 2026
 FY2025 Earnings Presentation7 slides · Jan 22, 2026
 Q3 2025 Earnings Presentation15 slides · Oct 20, 2025
 H1 2025 Earnings Presentation34 slides · Aug 11, 2025
 Investor Day (May 2025)48 slides · May 7, 2025
 Q1 2025 Earnings Presentation35 slides · Mar 2, 2025