comScore, Inc. · NASDAQ:SCOR
comScore — Q2 2010 Earnings Presentation
50 slides from comScore's earnings presentation, Sep 3, 2010

Slide 1: State of the U.S. Online Retail Economy in Q2 2010
State of the U.S. Online Retail Economy in Q2 2010 Gian Fulgoni, Chairman, comScore, Inc. Note: A copy of this presentation will be sent to all attendees within 24 hours of today’s webinar
Slide 2: Data sources and analysis parameters
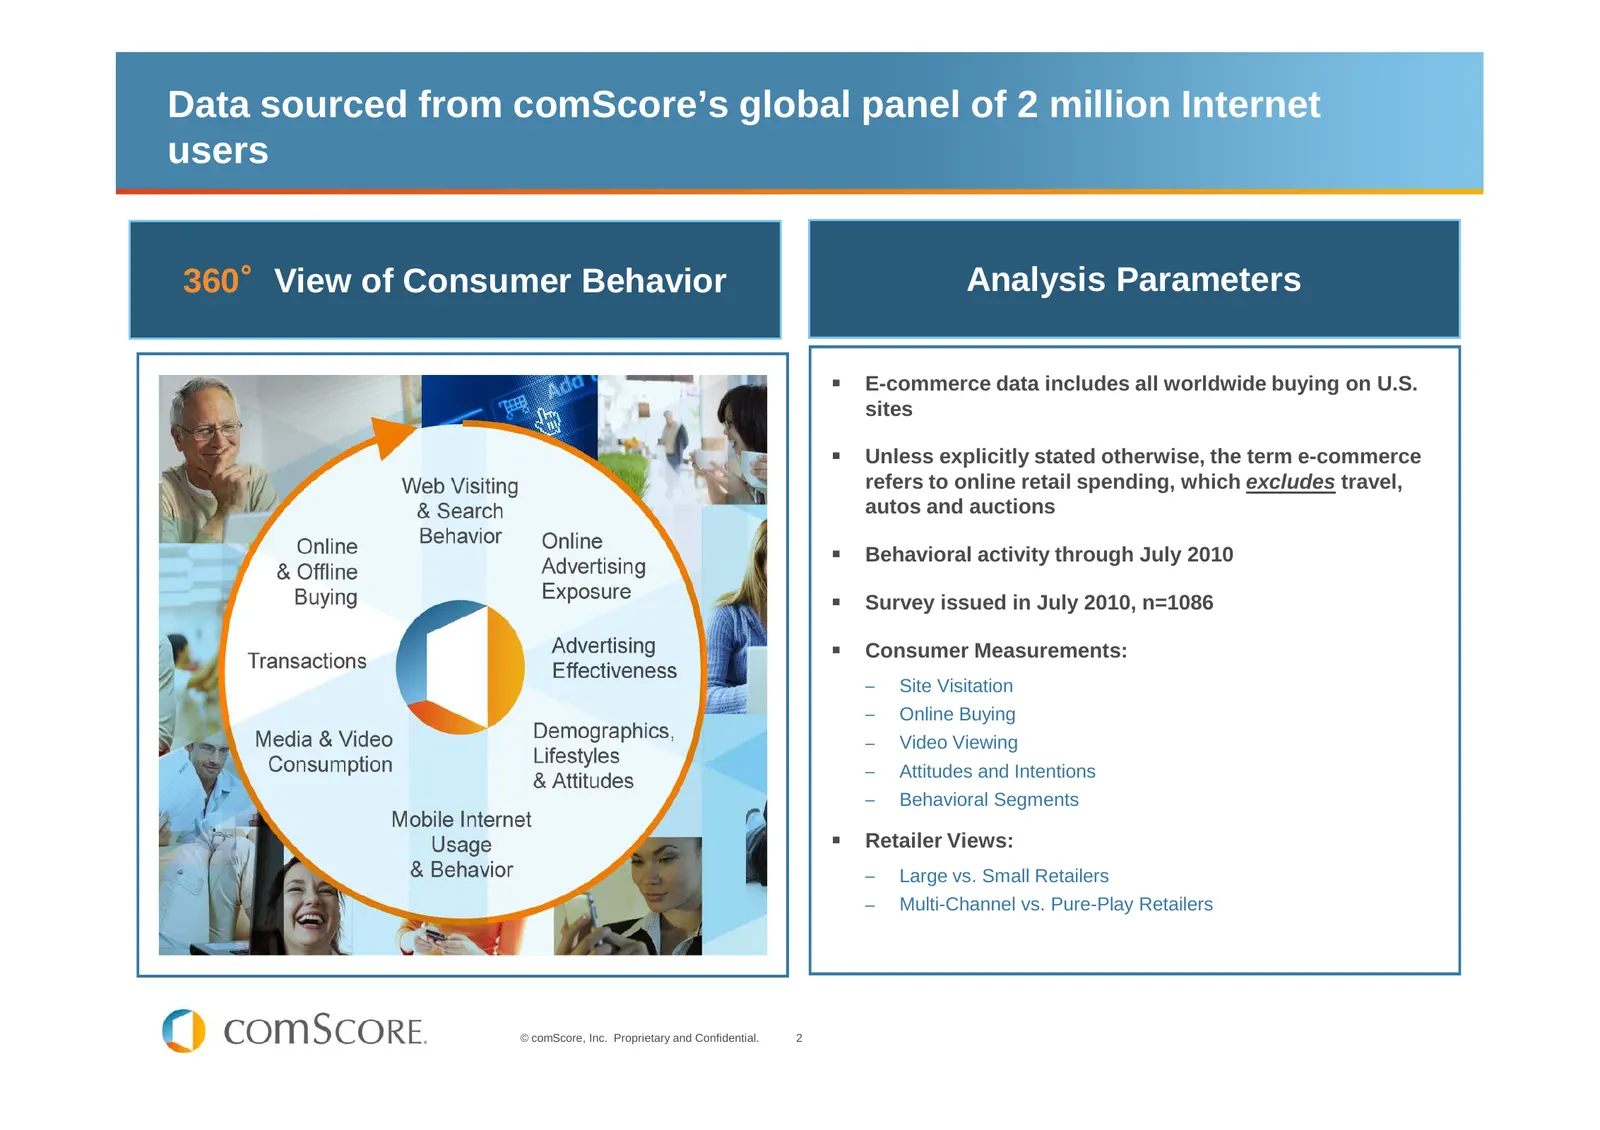
Data sourced from comScore’s global panel of 2 million Internet users °View of Consumer Behavior 360° Analysis Parameters E-commerce data includes all worldwide buying on U.S. sites Unless explicitly stated otherwise, the term e-commerce refers to online retail spending, which excludes travel, autos
Slide 3: Validation of comScore Sales Data vs. U.S. Department of Commerce
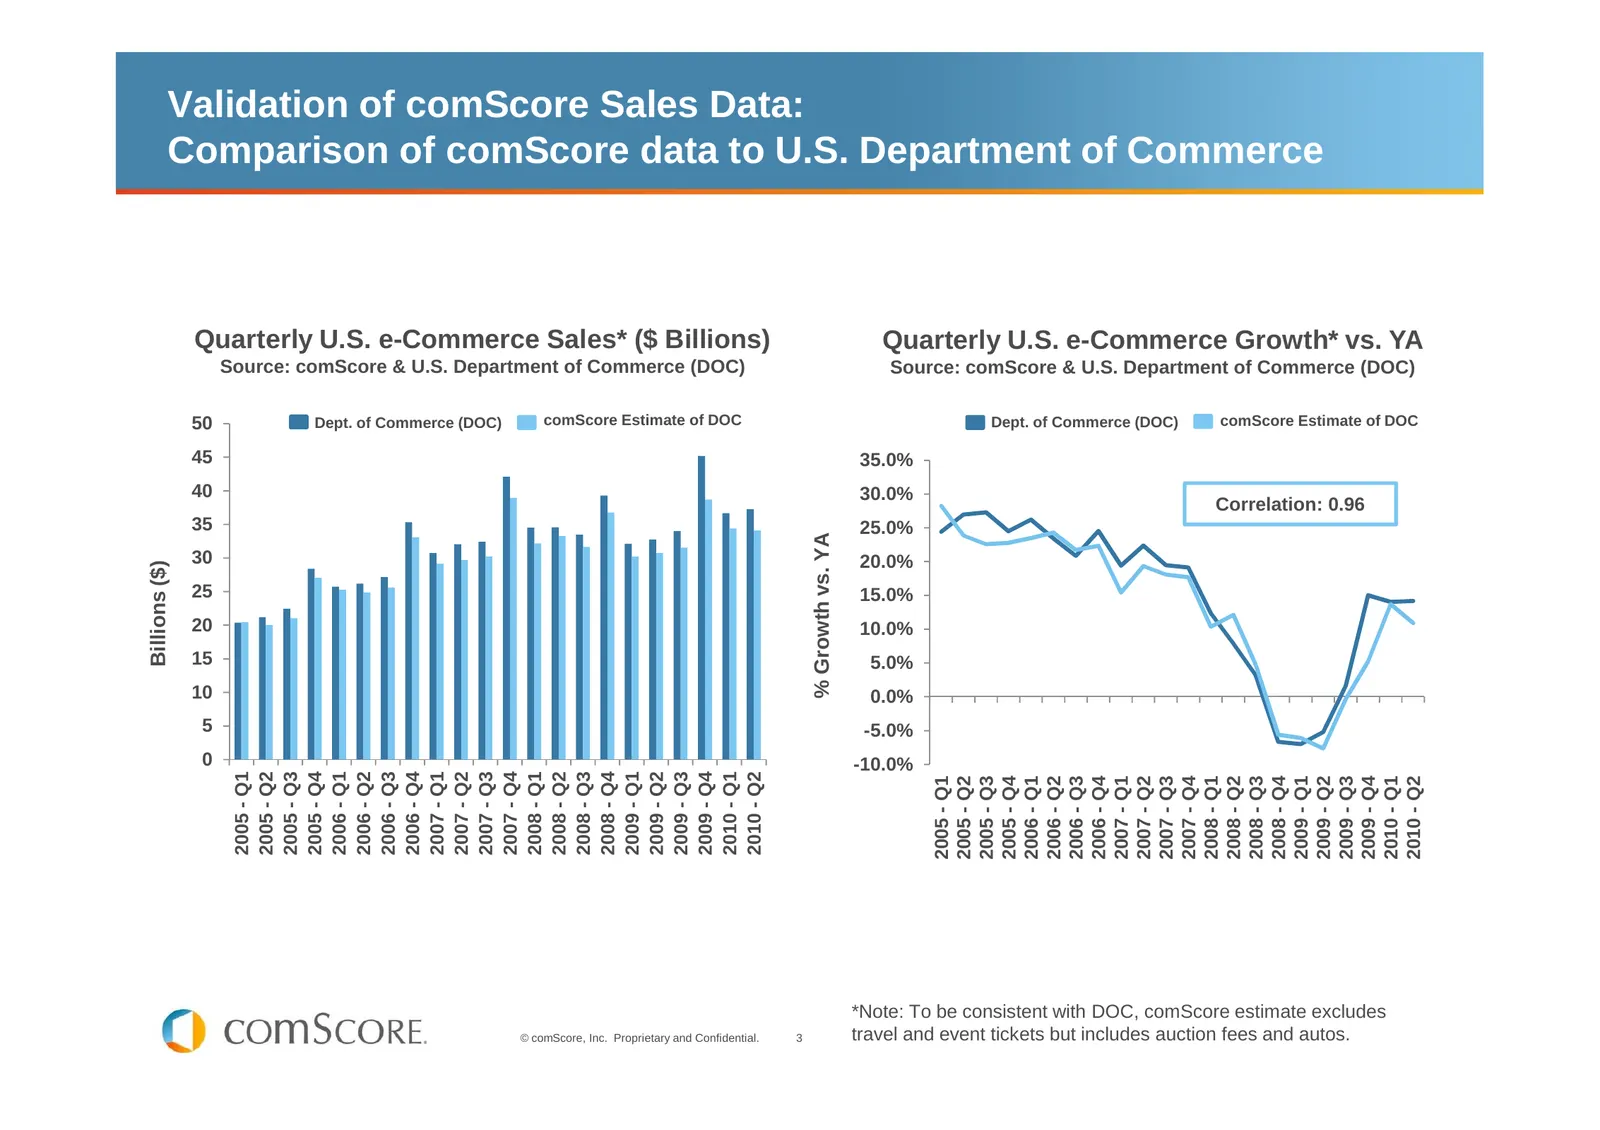
Validation of comScore Sales Data: Comparison of comScore data to U.S. Department of Commerce Quarterly U.S. e-Commerce Sales* ($ Billions) Quarterly U.S. e-Commerce Growth* vs. YA Source: comScore & U.S. Department of Commerce (DOC) Source: comScore & U.S. Department of Commerce (DOC) 50 Dept. of C
Slide 4: Total e-commerce sales through Q2 2010 up 7% versus year ago
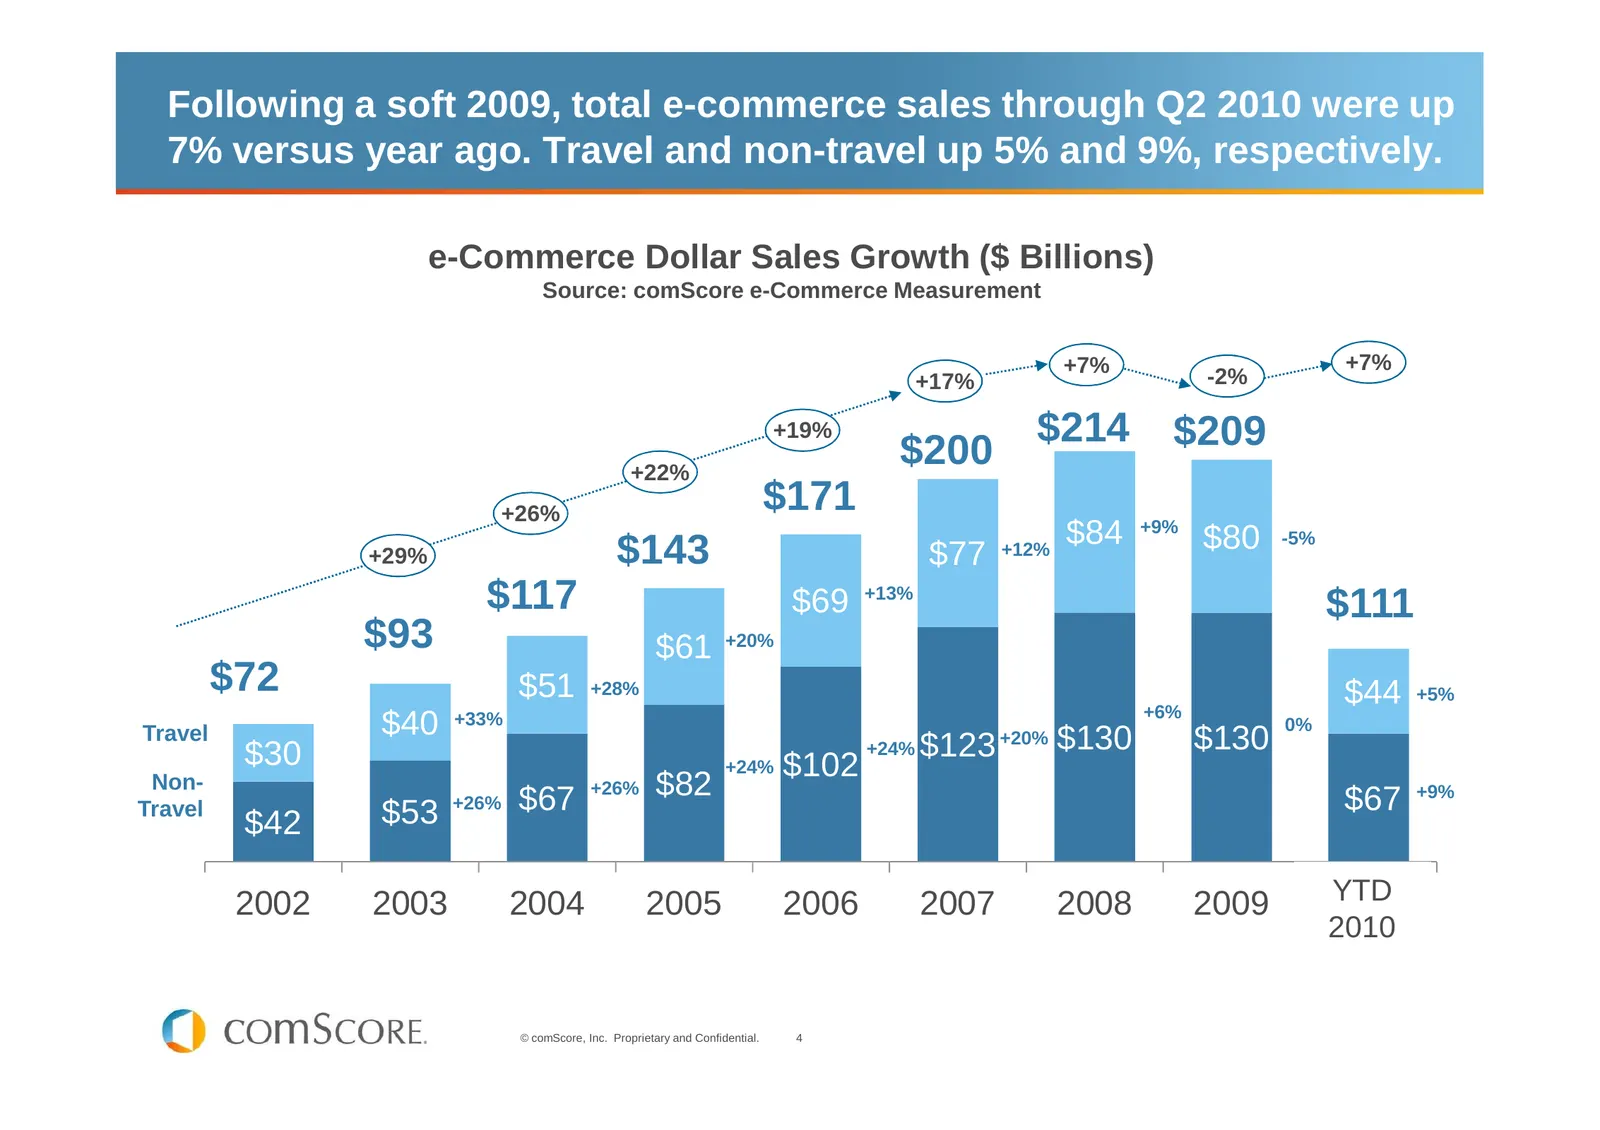
Following a soft 2009, total e-commerce sales through Q2 2010 were up 7% versus year ago. Travel and non-travel up 5% and 9%, respectively. e-Commerce Dollar Sales Growth ($ Billions) Source: comScore e-Commerce Measurement +7% +7% +17% -2% +19% $214 $209 +22% $200 +26% $171 $84 +9% $80 -5% +29% $14
Slide 5: Positive growth returned in 2010, strong in March and April
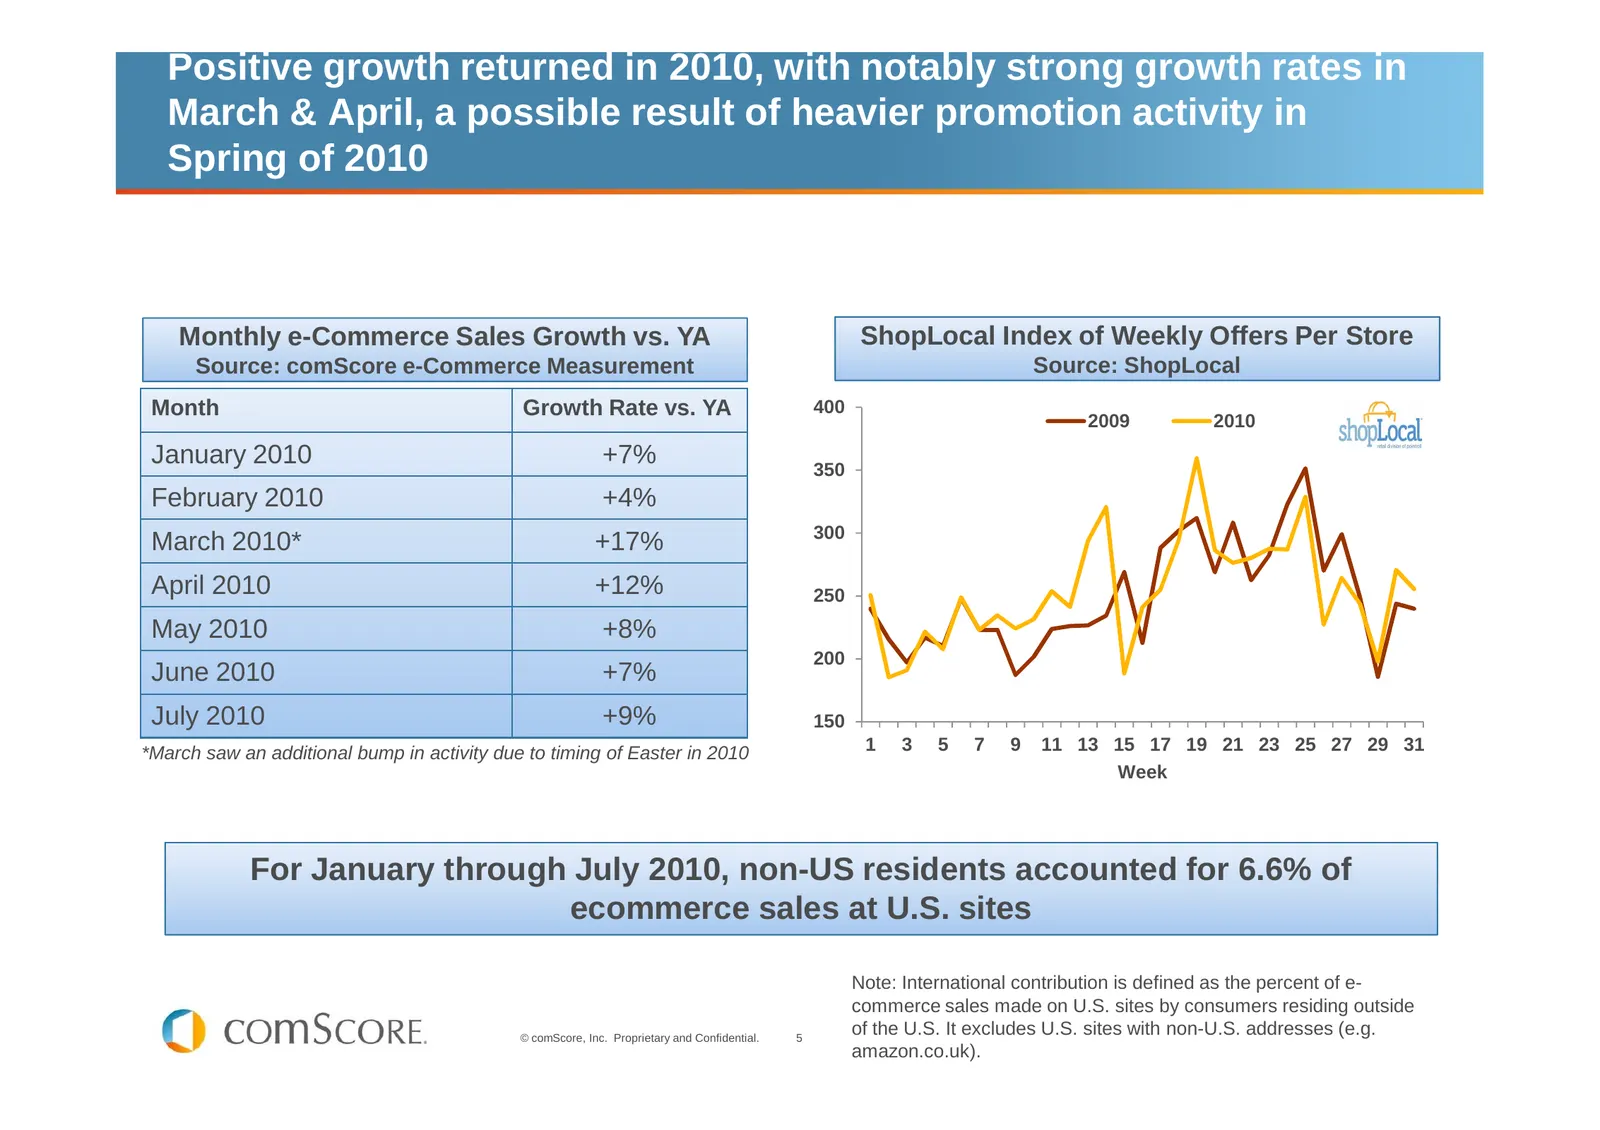
Positive growth returned in 2010, with notably strong growth rates in March & April, a possible result of heavier promotion activity in Spring of 2010 Monthly e-Commerce Sales Growth vs. YA ShopLocal Index of Weekly Offers Per Store Source: comScore e-Commerce Measurement Source: ShopLocal Month Gro
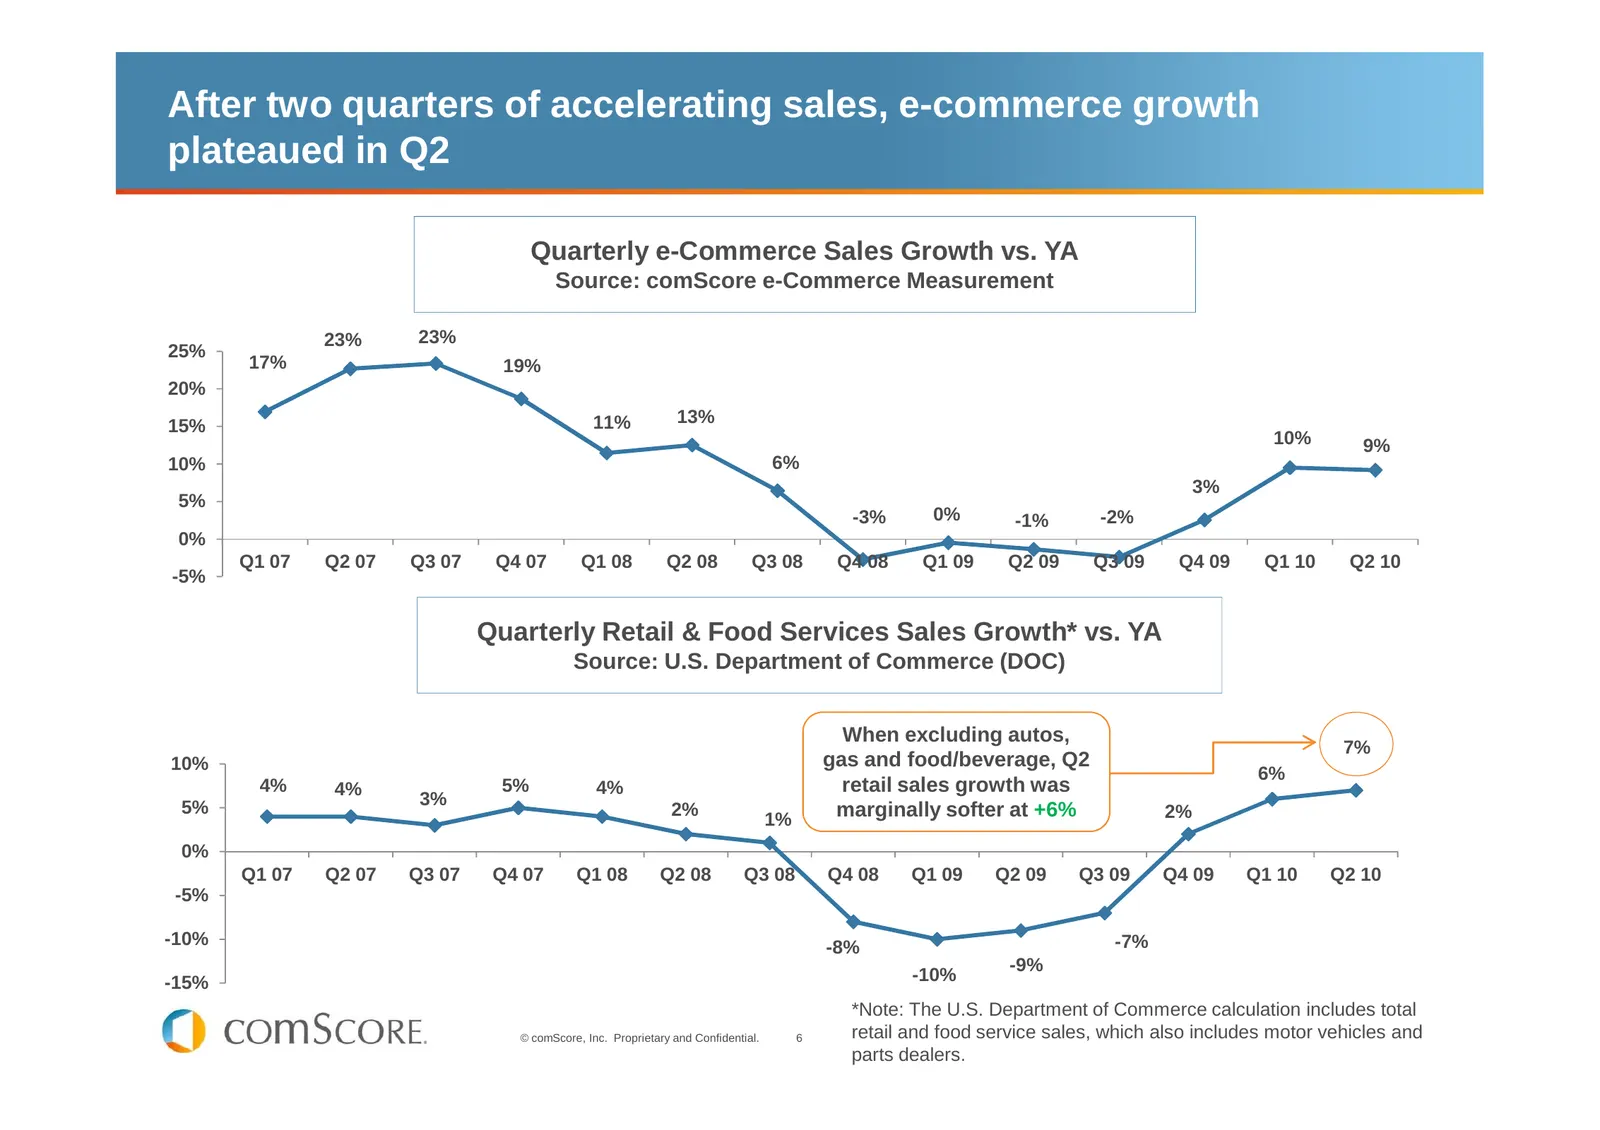
Slide 6: E-commerce growth plateaued in Q2 after two quarters of acceleration
After two quarters of accelerating sales, e-commerce growth plateaued in Q2 Quarterly e-Commerce Sales Growth vs. YA Source: comScore e-Commerce Measurement 23% 23% 25% 17% 19% 20% 15% 11% 13% 10% 9% 10% 6% 3% 5% -3% 0% -1% -2% 0% Q1 07 Q2 07 Q3 07 Q4 07 Q1 08 Q2 08 Q3 08 Q4 08 Q1 09 Q2 09 Q3 09 Q4
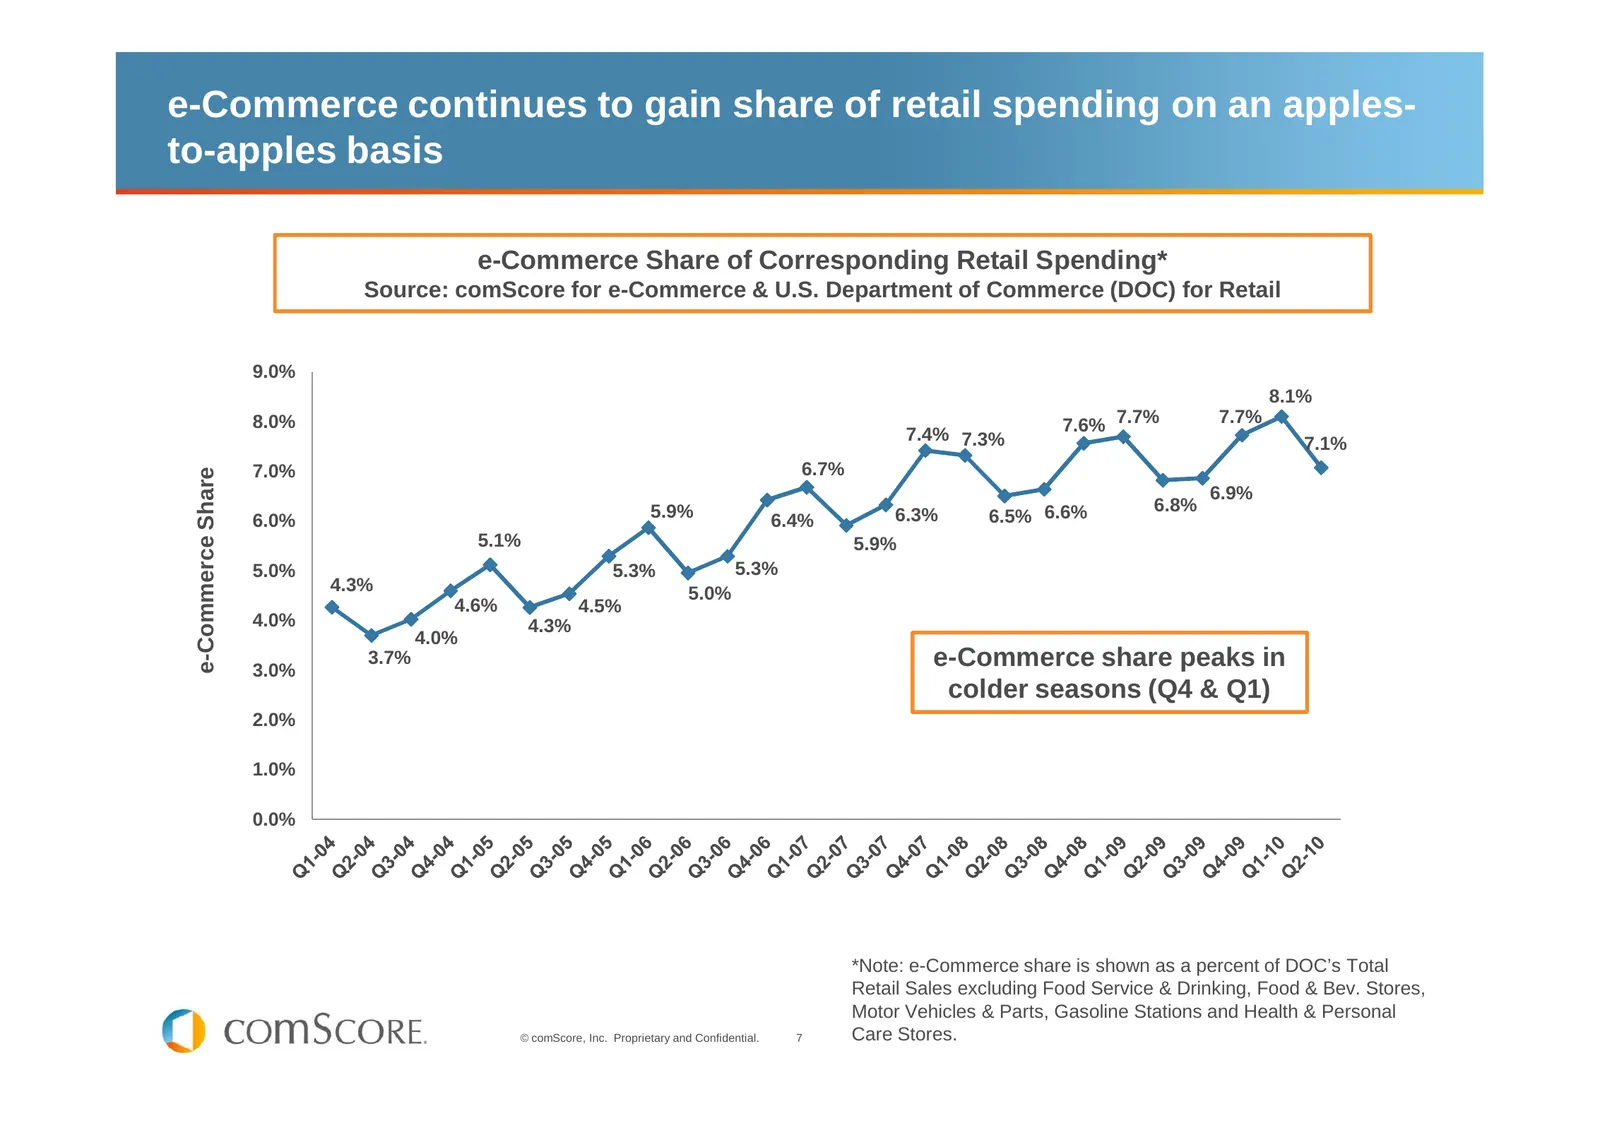
Slide 7: E-commerce continues to gain share of retail spending
e-Commerce continues to gain share of retail spending on an apples- to-apples basis e-Commerce Share of Corresponding Retail Spending* Source: comScore for e-Commerce & U.S. Department of Commerce (DOC) for Retail 9.0% 8.1% 8.0% 7.4% 7.3% 7.6% 7.7% 7.7% 7.1% 7.0% 6.7% Commerce Share 6.9% 5.9% 6.8% 6
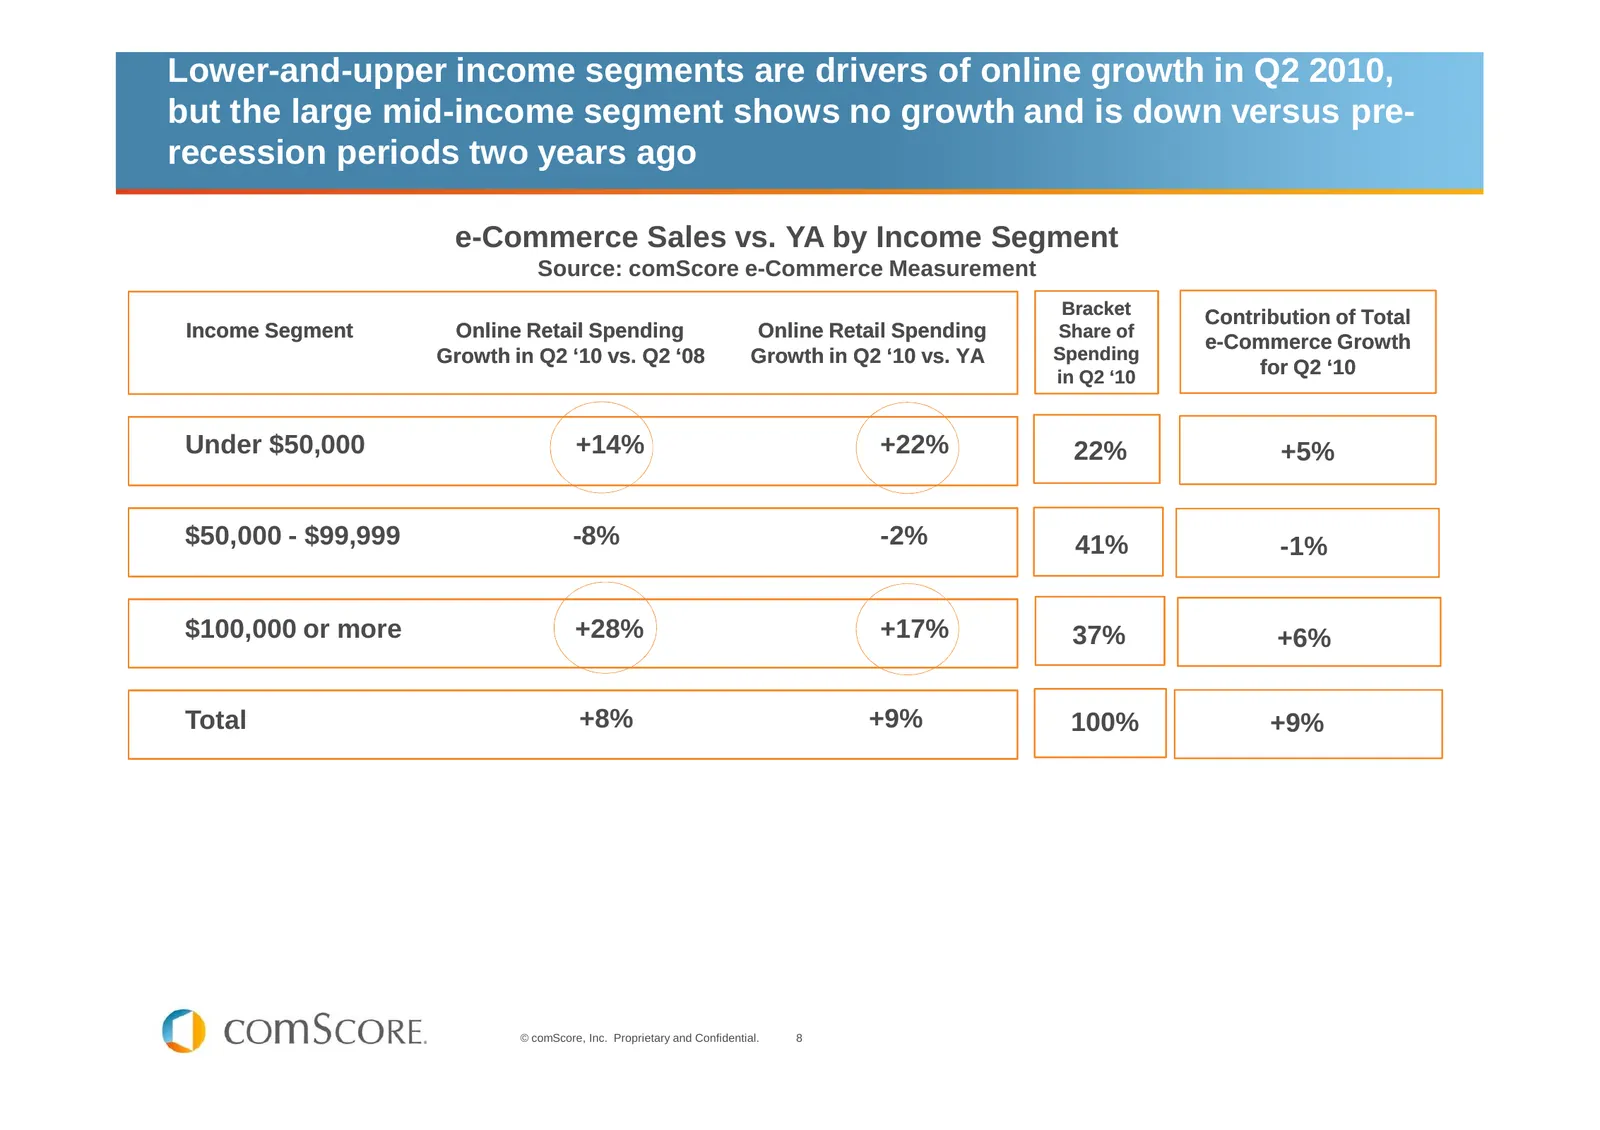
Slide 8: Income segments driving online growth in Q2 2010
Lower-and-upper income segments are drivers of online growth in Q2 2010, but the large mid-income segment shows no growth and is down versus pre- recession periods two years ago e-Commerce Sales vs. YA by Income Segment Source: comScore e-Commerce Measurement Bracket Contribution of Total Income Seg
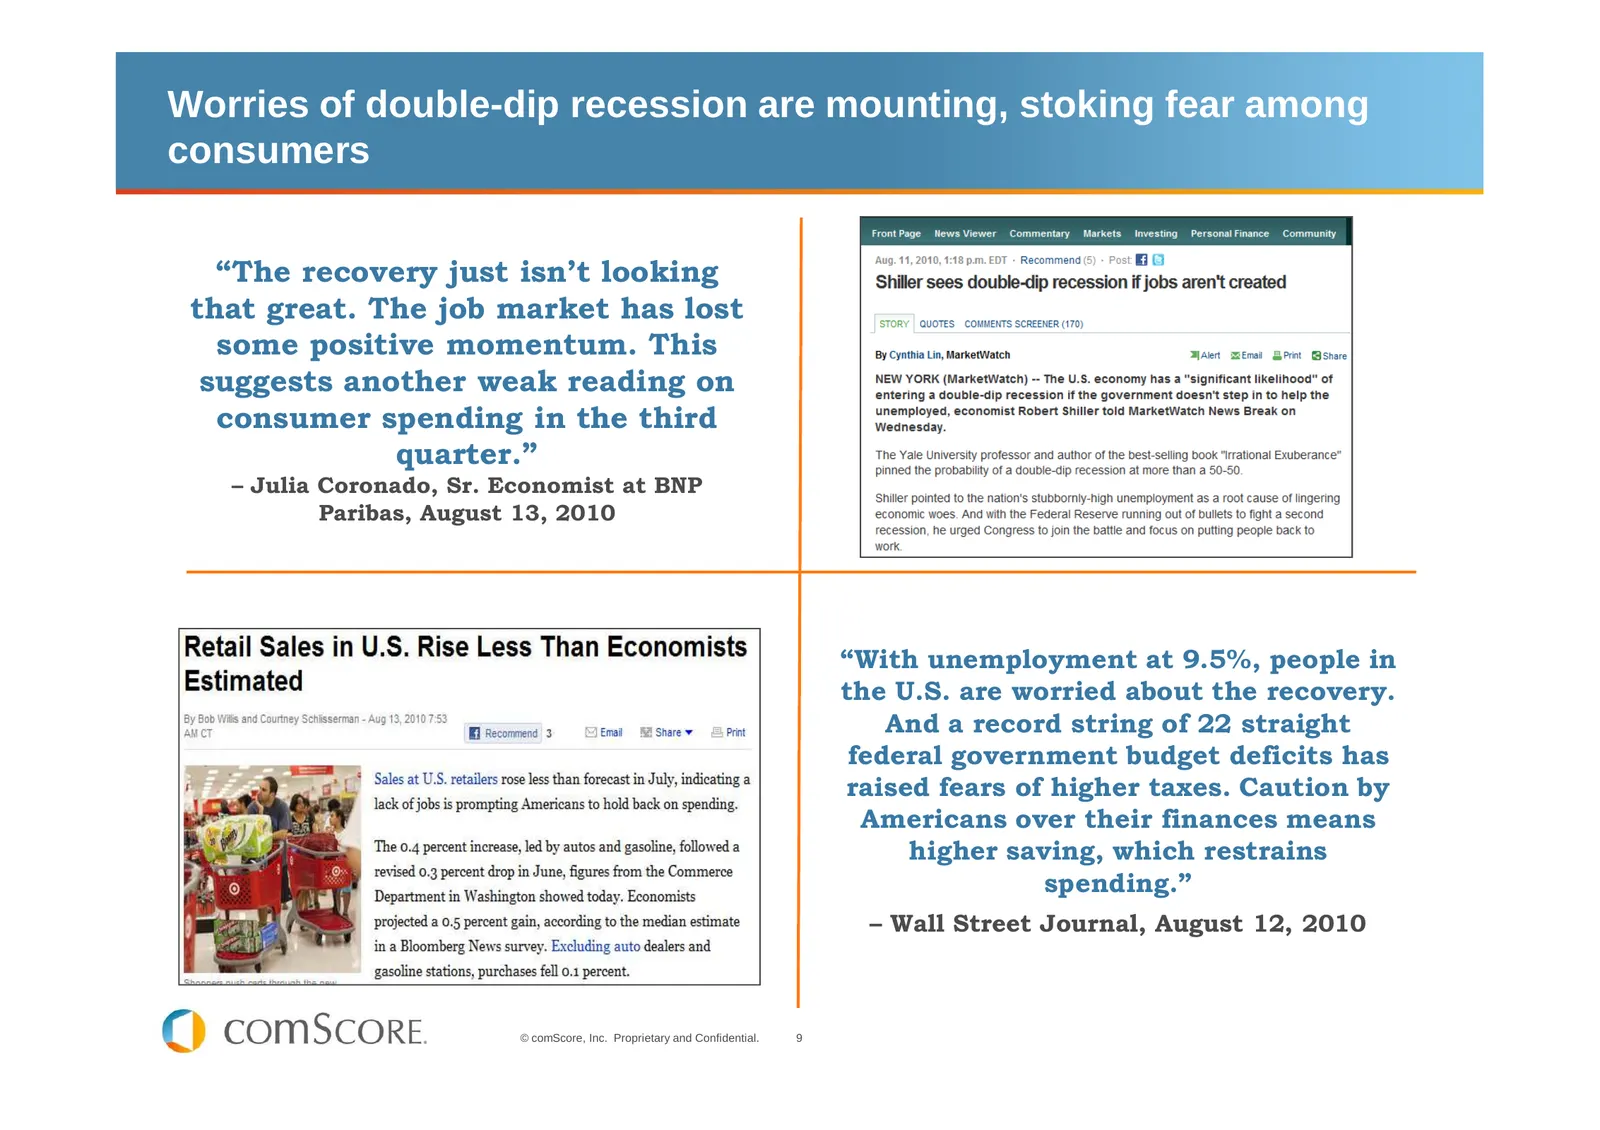
Slide 9: Worries of double-dip recession are mounting
Worries of double-dip recession are mounting, stoking fear among consumers “The recovery just isn’t looking that great. The job market has lost some positive momentum. This suggests another weak reading on consumer spending in the third quarter.” – Julia Coronado, Sr. Economist at BNP Paribas, Augus
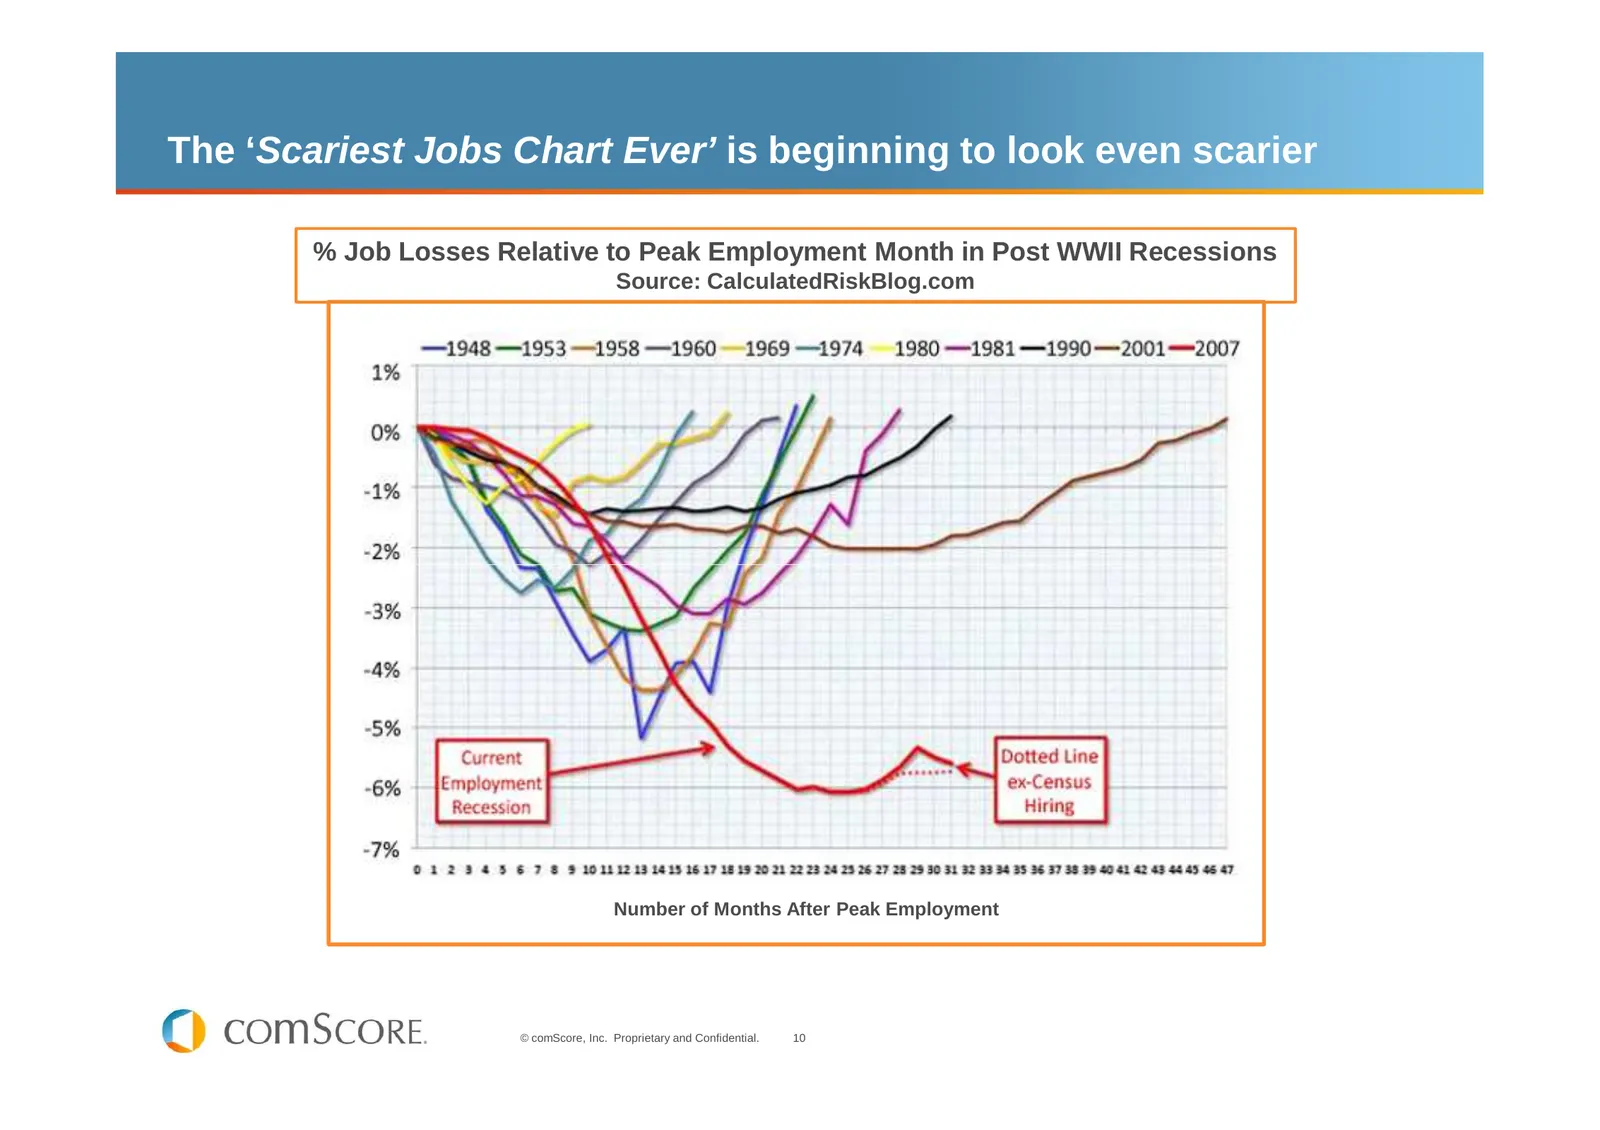
Slide 10: The 'Scariest Jobs Chart Ever' looks even scarier
The ‘Scariest Jobs Chart Ever’ is beginning to look even scarier % Job Losses Relative to Peak Employment Month in Post WWII Recessions Source: CalculatedRiskBlog.com Number of Months After Peak Employment © comScore, Inc. Proprietary and Confidential. 10
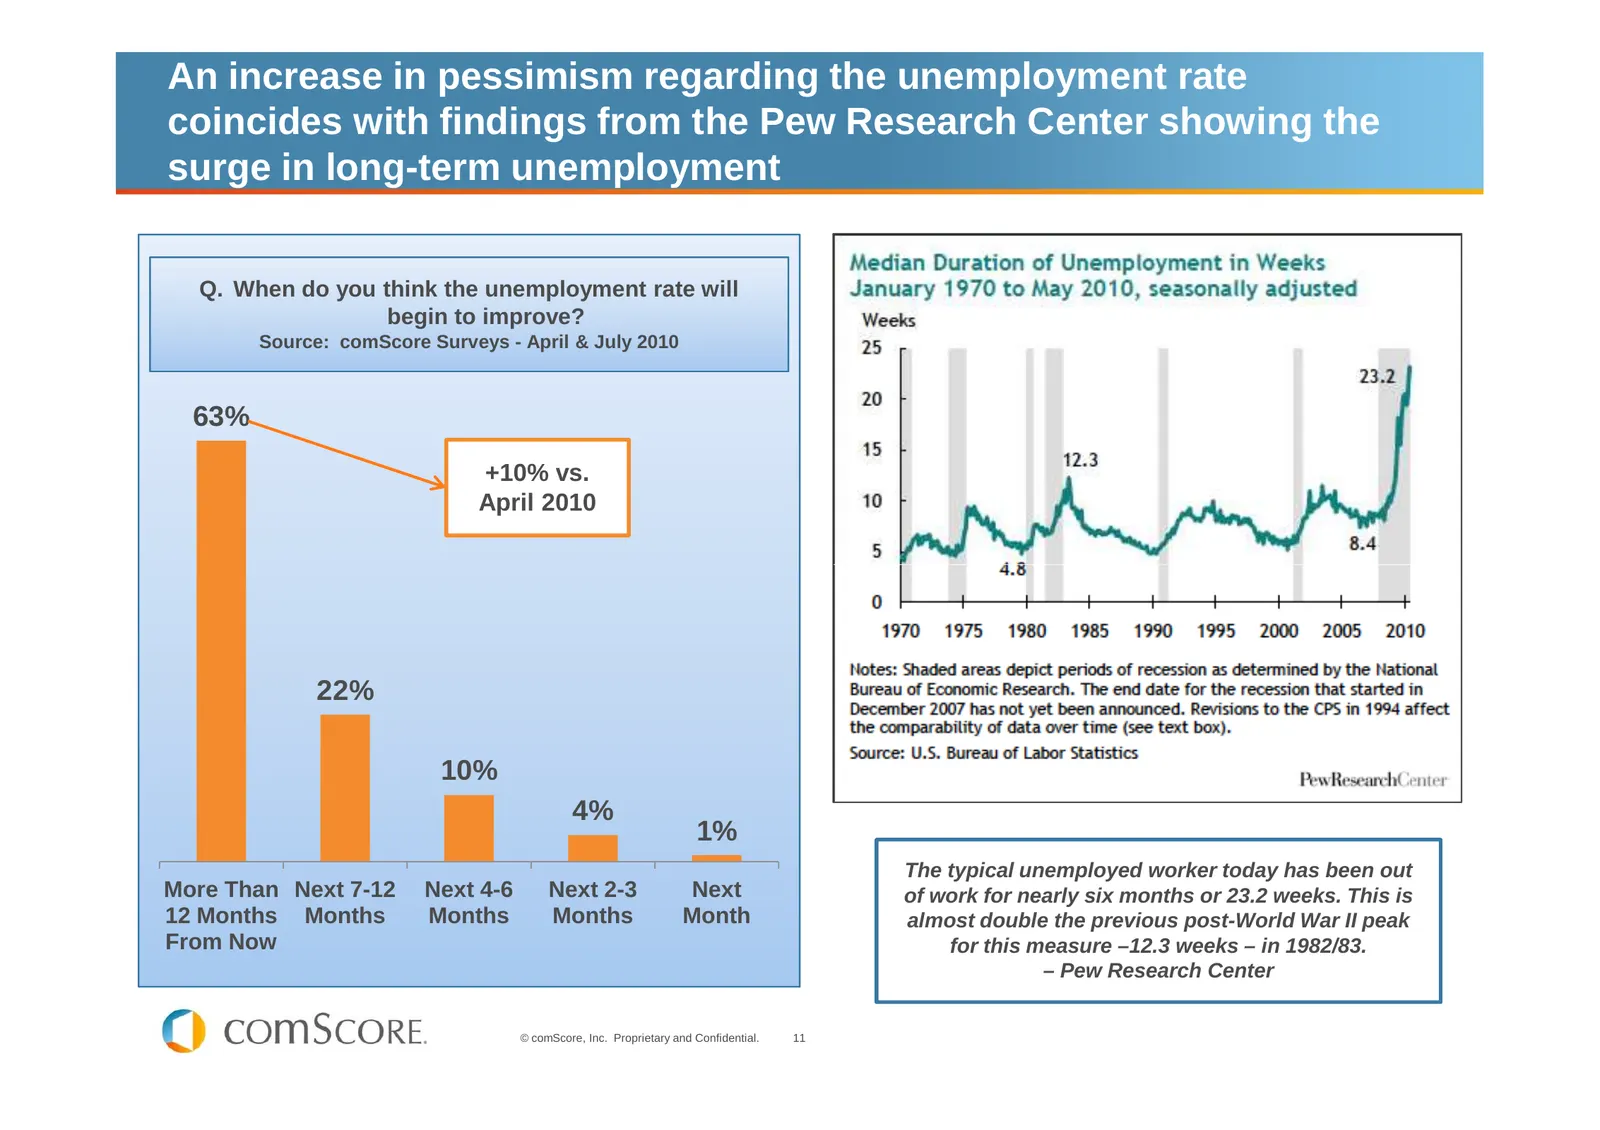
Slide 11: Pessimism regarding the unemployment rate increases
An increase in pessimism regarding the unemployment rate coincides with findings from the Pew Research Center showing the surge in long-term unemployment Q. When do you think the unemployment rate will begin to improve? Source: comScore Surveys - April & July 2010 63% +10% vs. April 2010 22% 10% 4%
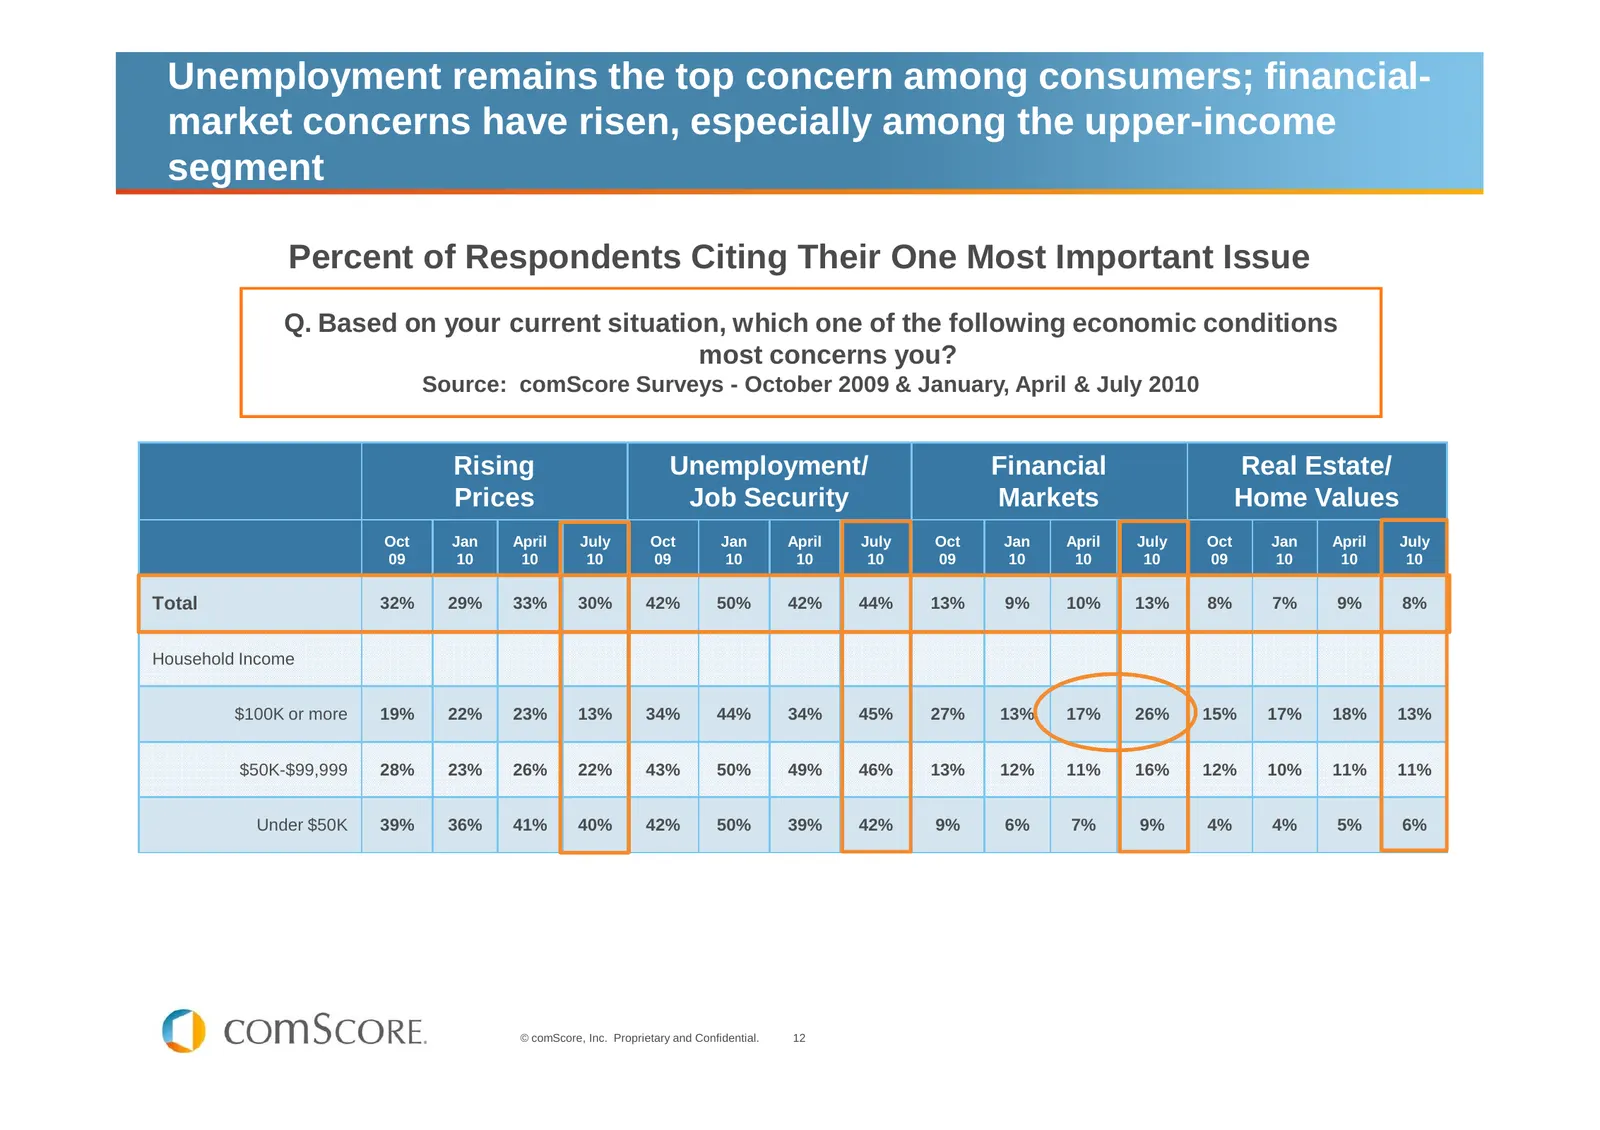
Slide 12: Unemployment remains top concern among consumers
Unemployment remains the top concern among consumers; financial- market concerns have risen, especially among the upper-income segment Percent of Respondents Citing Their One Most Important Issue Q. Based on your current situation, which one of the following economic conditions most concerns you? So
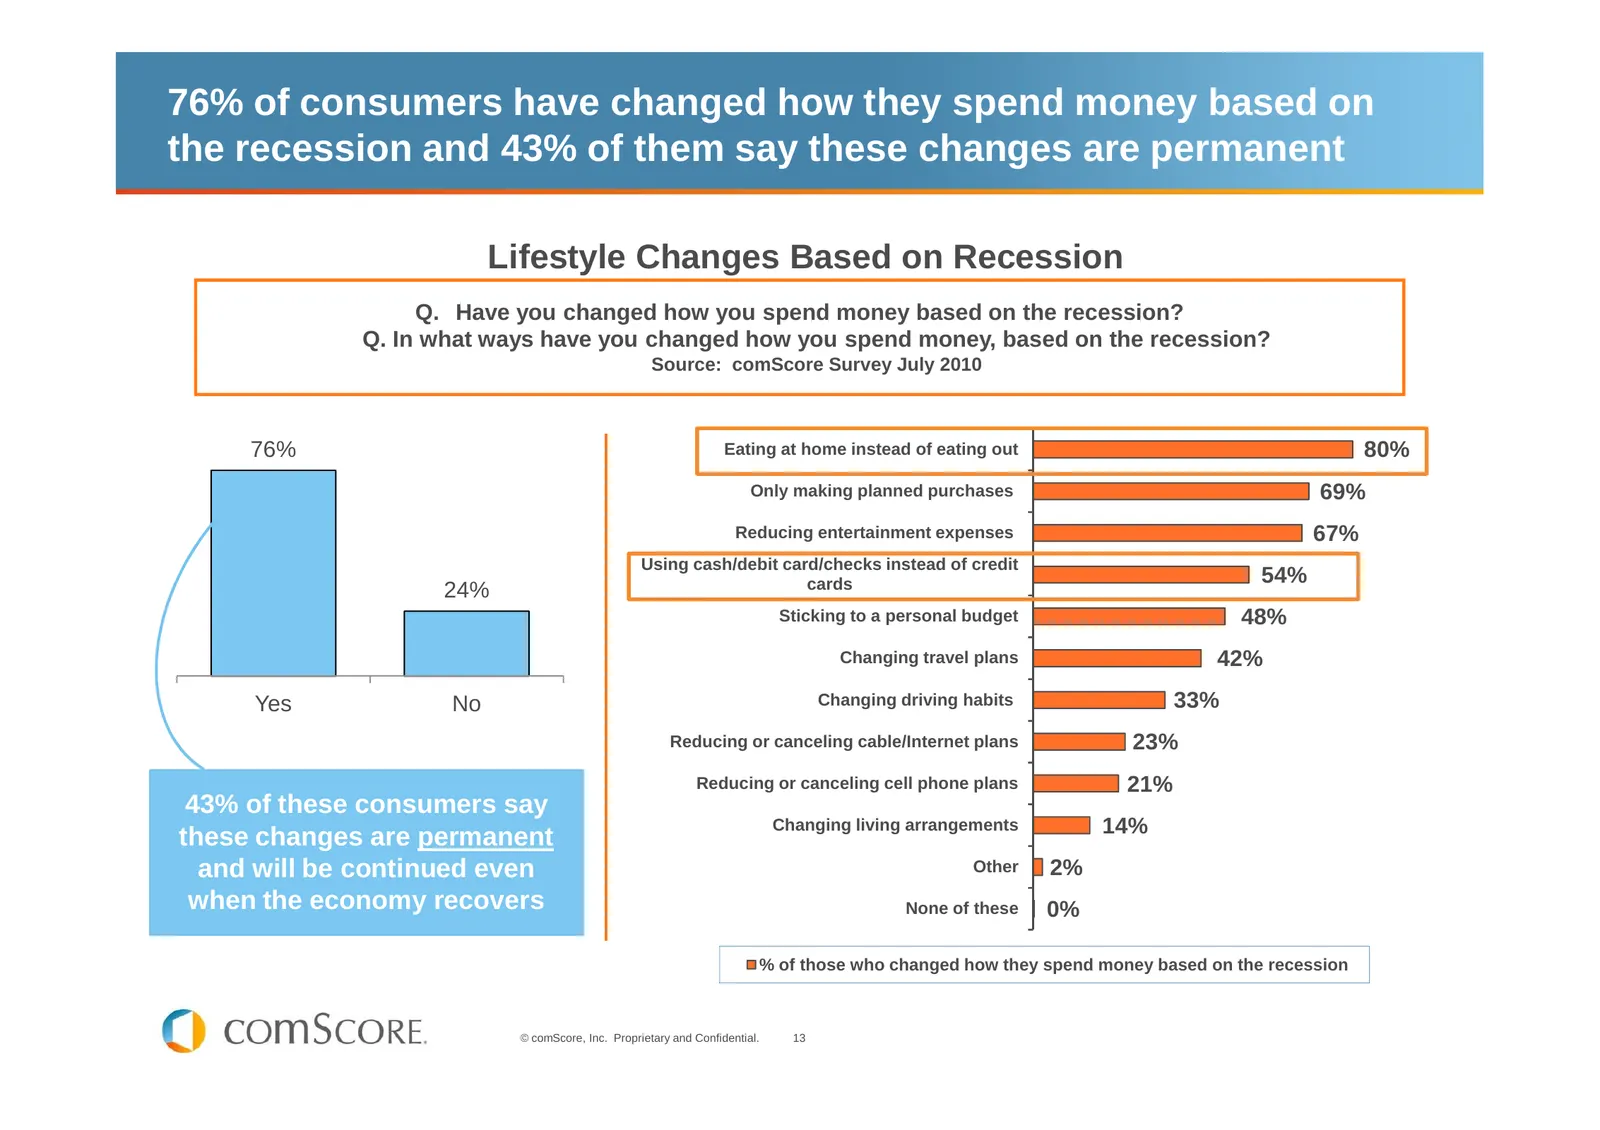
Slide 13: 76% of consumers changed how they spend money
76% of consumers have changed how they spend money based on the recession and 43% of them say these changes are permanent Lifestyle Changes Based on Recession Q. Have you changed how you spend money based on the recession? Q. In what ways have you changed how you spend money, based on the recession?
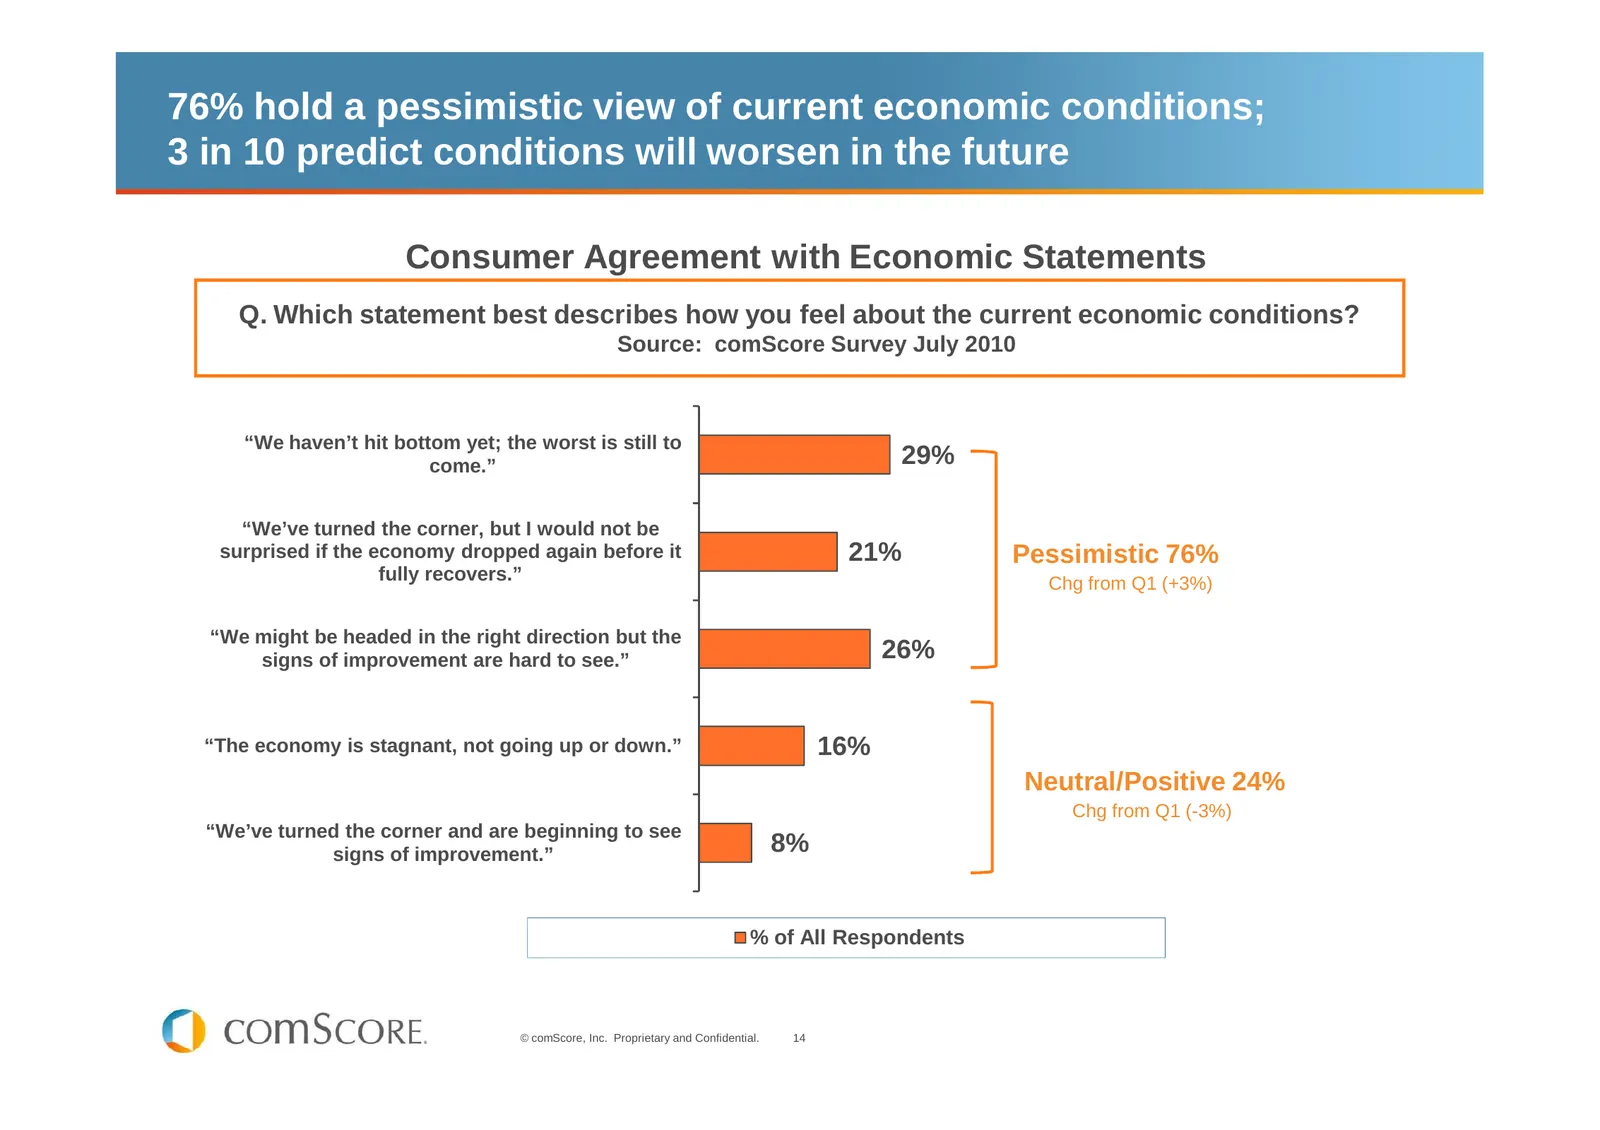
Slide 14: 76% hold a pessimistic view of economic conditions
76% hold a pessimistic view of current economic conditions; 3 in 10 predict conditions will worsen in the future Consumer Agreement with Economic Statements Q. Which statement best describes how you feel about the current economic conditions? Source: comScore Survey July 2010 “We haven’t hit bottom

Slide 15: Who is Today's Online Consumer?
Who is Today’s Online Consumer? © comScore, Inc. Proprietary and Confidential. 15
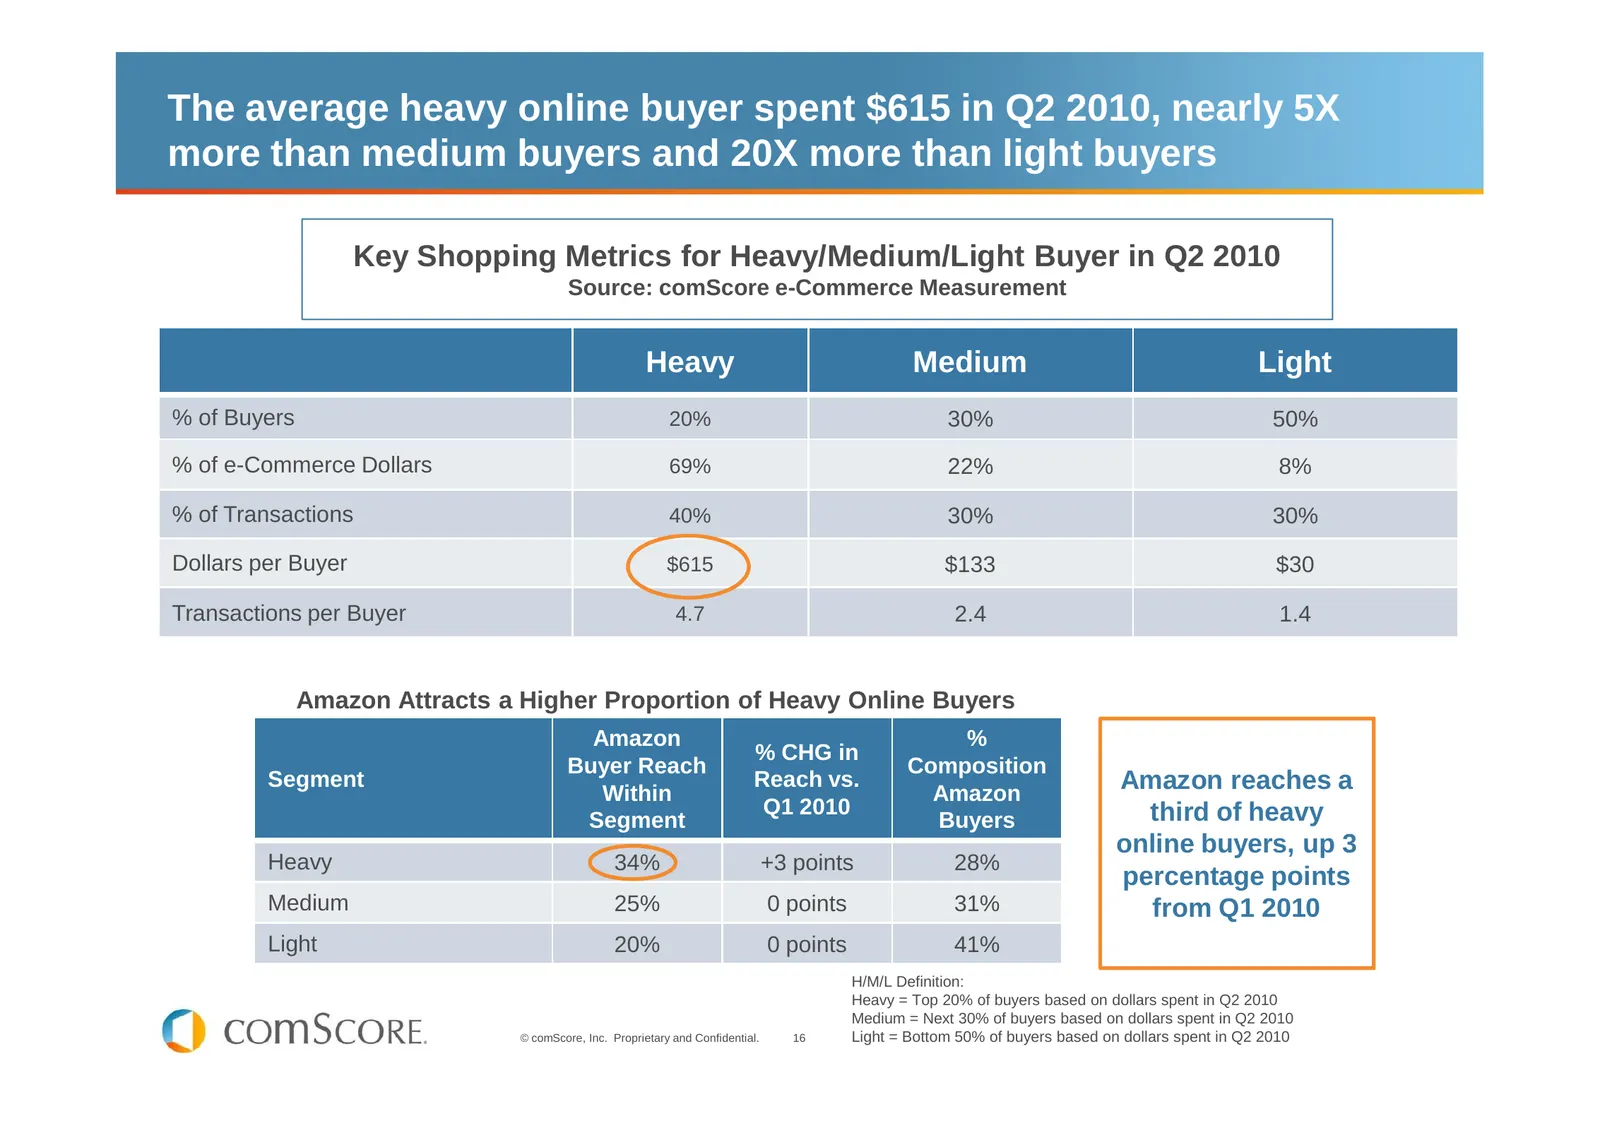
Slide 16: Heavy online buyer spent $615 in Q2 2010
The average heavy online buyer spent $615 in Q2 2010, nearly 5X more than medium buyers and 20X more than light buyers Key Shopping Metrics for Heavy/Medium/Light Buyer in Q2 2010 Source: comScore e-Commerce Measurement Heavy Medium Light % of Buyers 20% 30% 50% % of e-Commerce Dollars 69% 22% 8% %
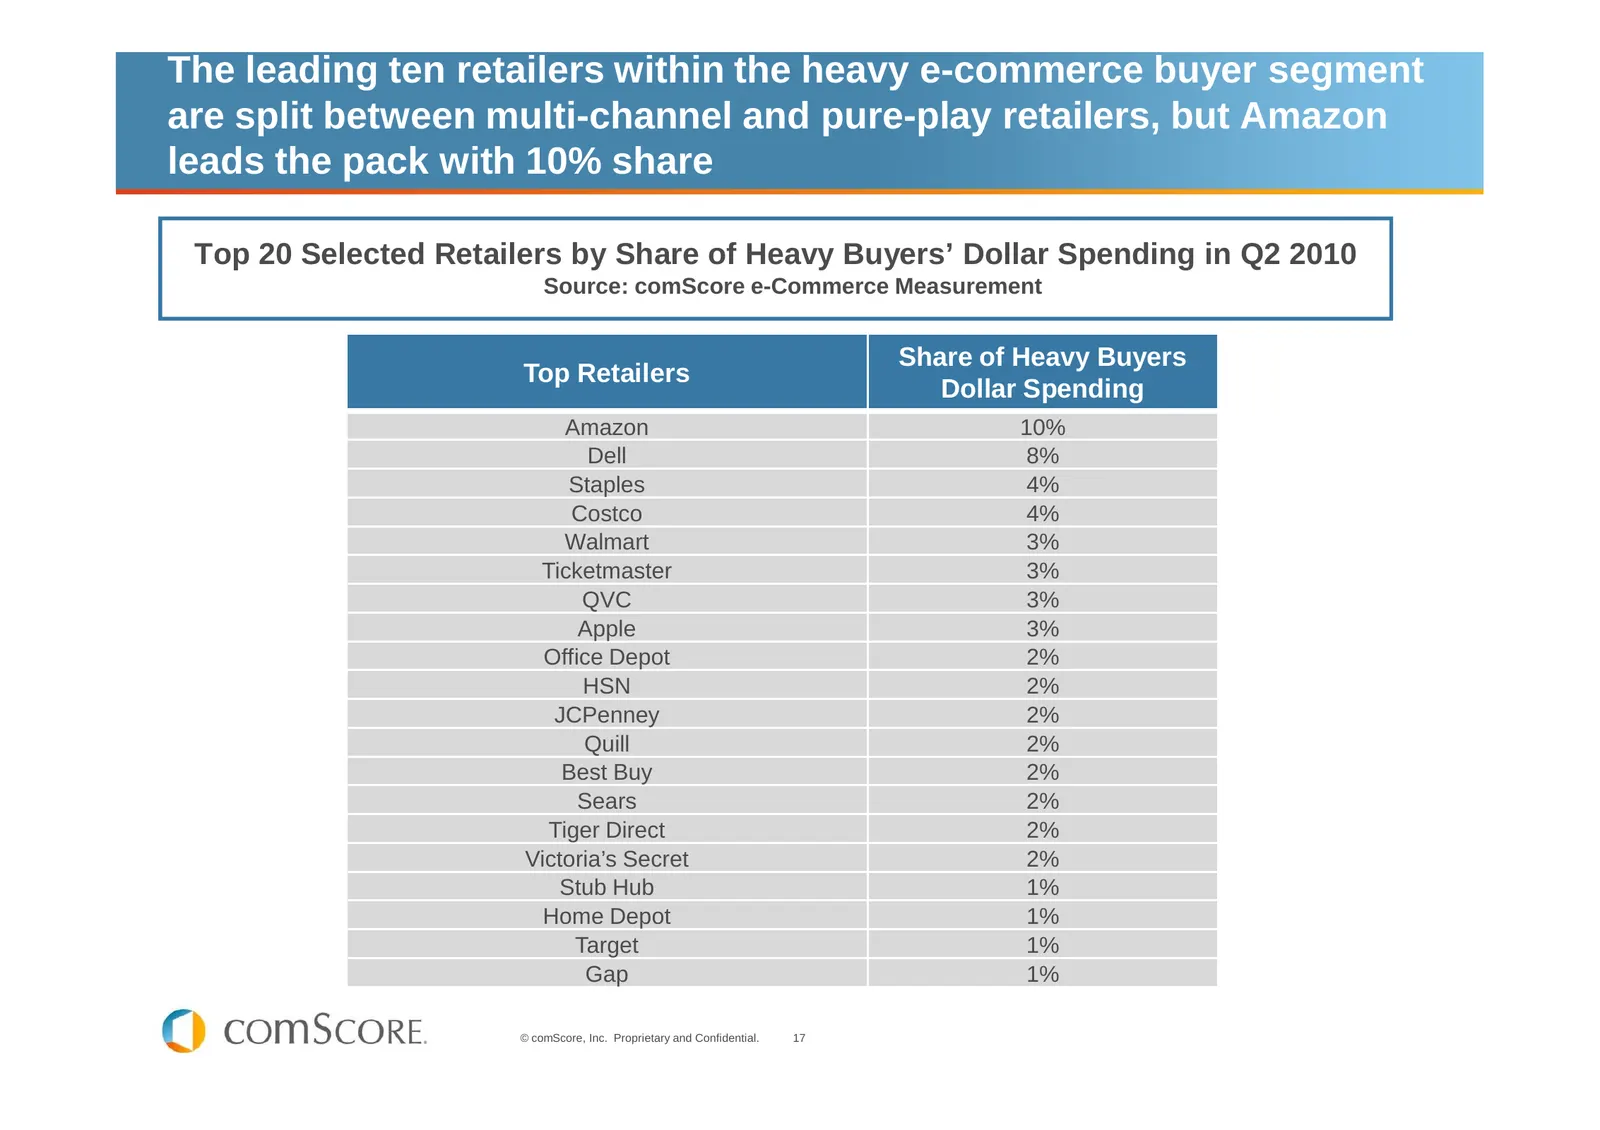
Slide 17: Leading retailers among heavy e-commerce buyers
The leading ten retailers within the heavy e-commerce buyer segment are split between multi-channel and pure-play retailers, but Amazon leads the pack with 10% share Top 20 Selected Retailers by Share of Heavy Buyers’ Dollar Spending in Q2 2010 Source: comScore e-Commerce Measurement Share of Heavy
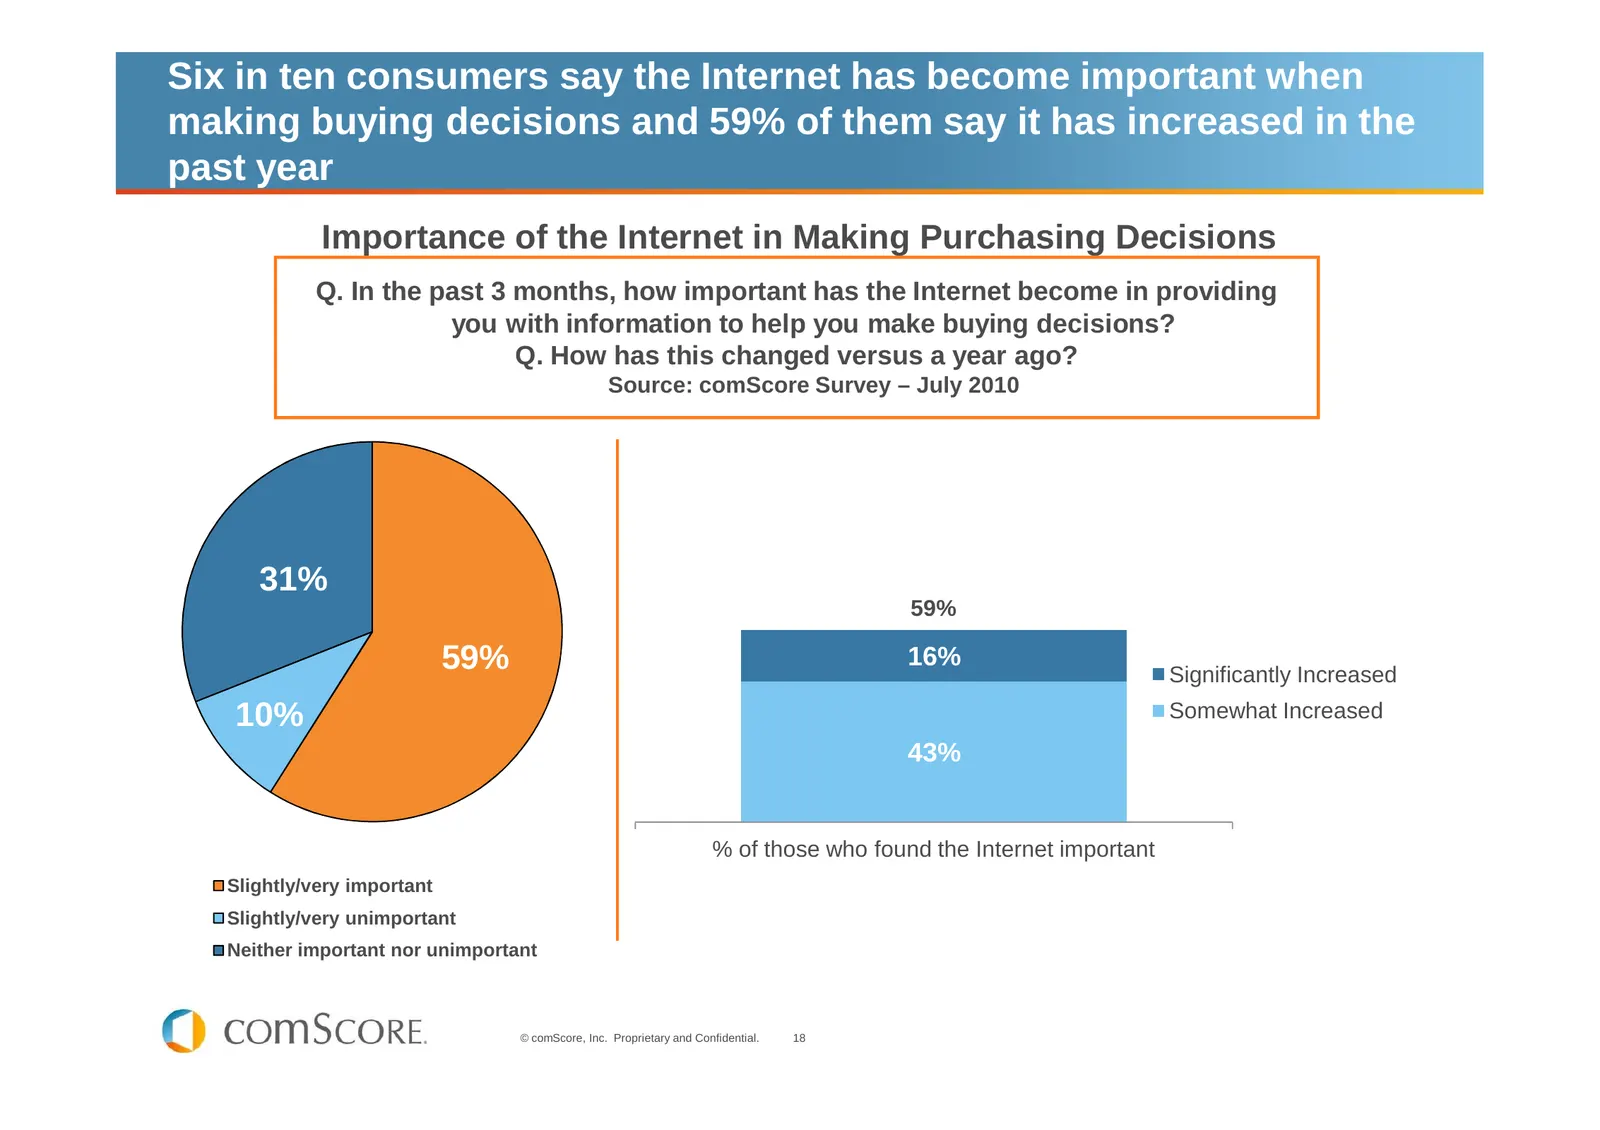
Slide 18: Internet important when making buying decisions
Six in ten consumers say the Internet has become important when making buying decisions and 59% of them say it has increased in the past year Importance of the Internet in Making Purchasing Decisions Q. In the past 3 months, how important has the Internet become in providing you with information to
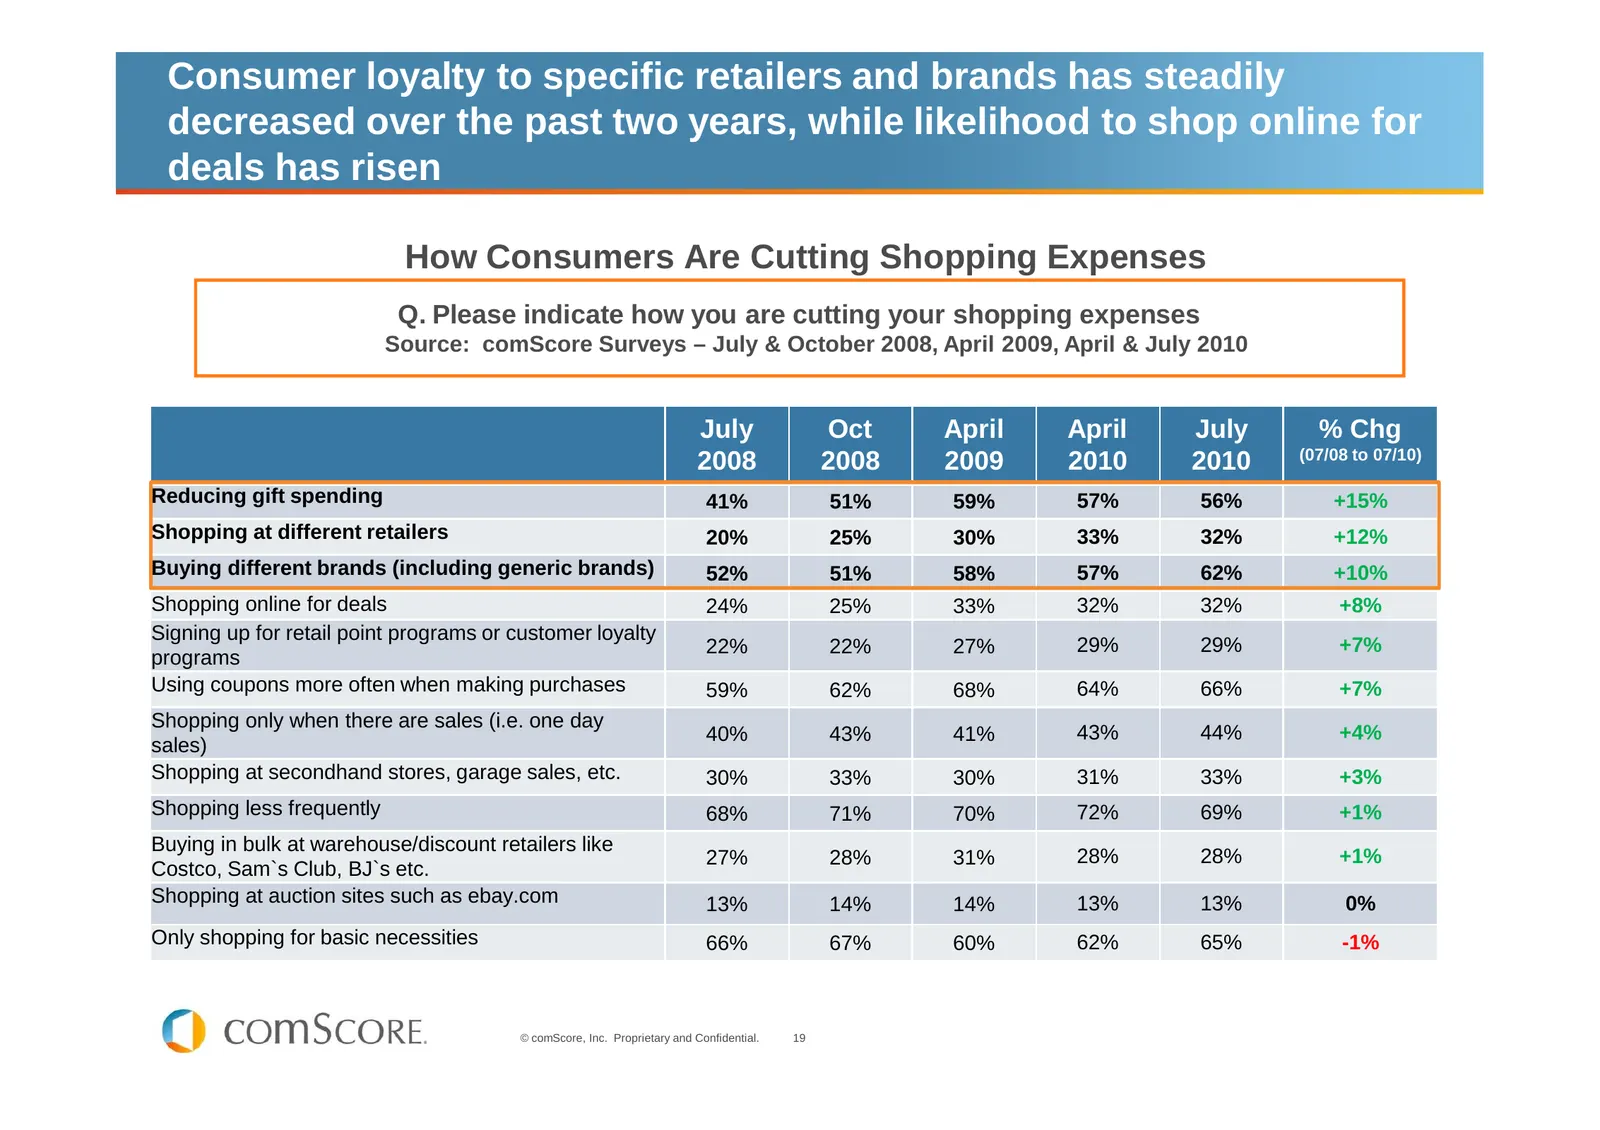
Slide 19: Consumer loyalty to retailers and brands has decreased
Consumer loyalty to specific retailers and brands has steadily decreased over the past two years, while likelihood to shop online for deals has risen How Consumers Are Cutting Shopping Expenses Q. Please indicate how you are cutting your shopping expenses Source: comScore Surveys – July & October 20
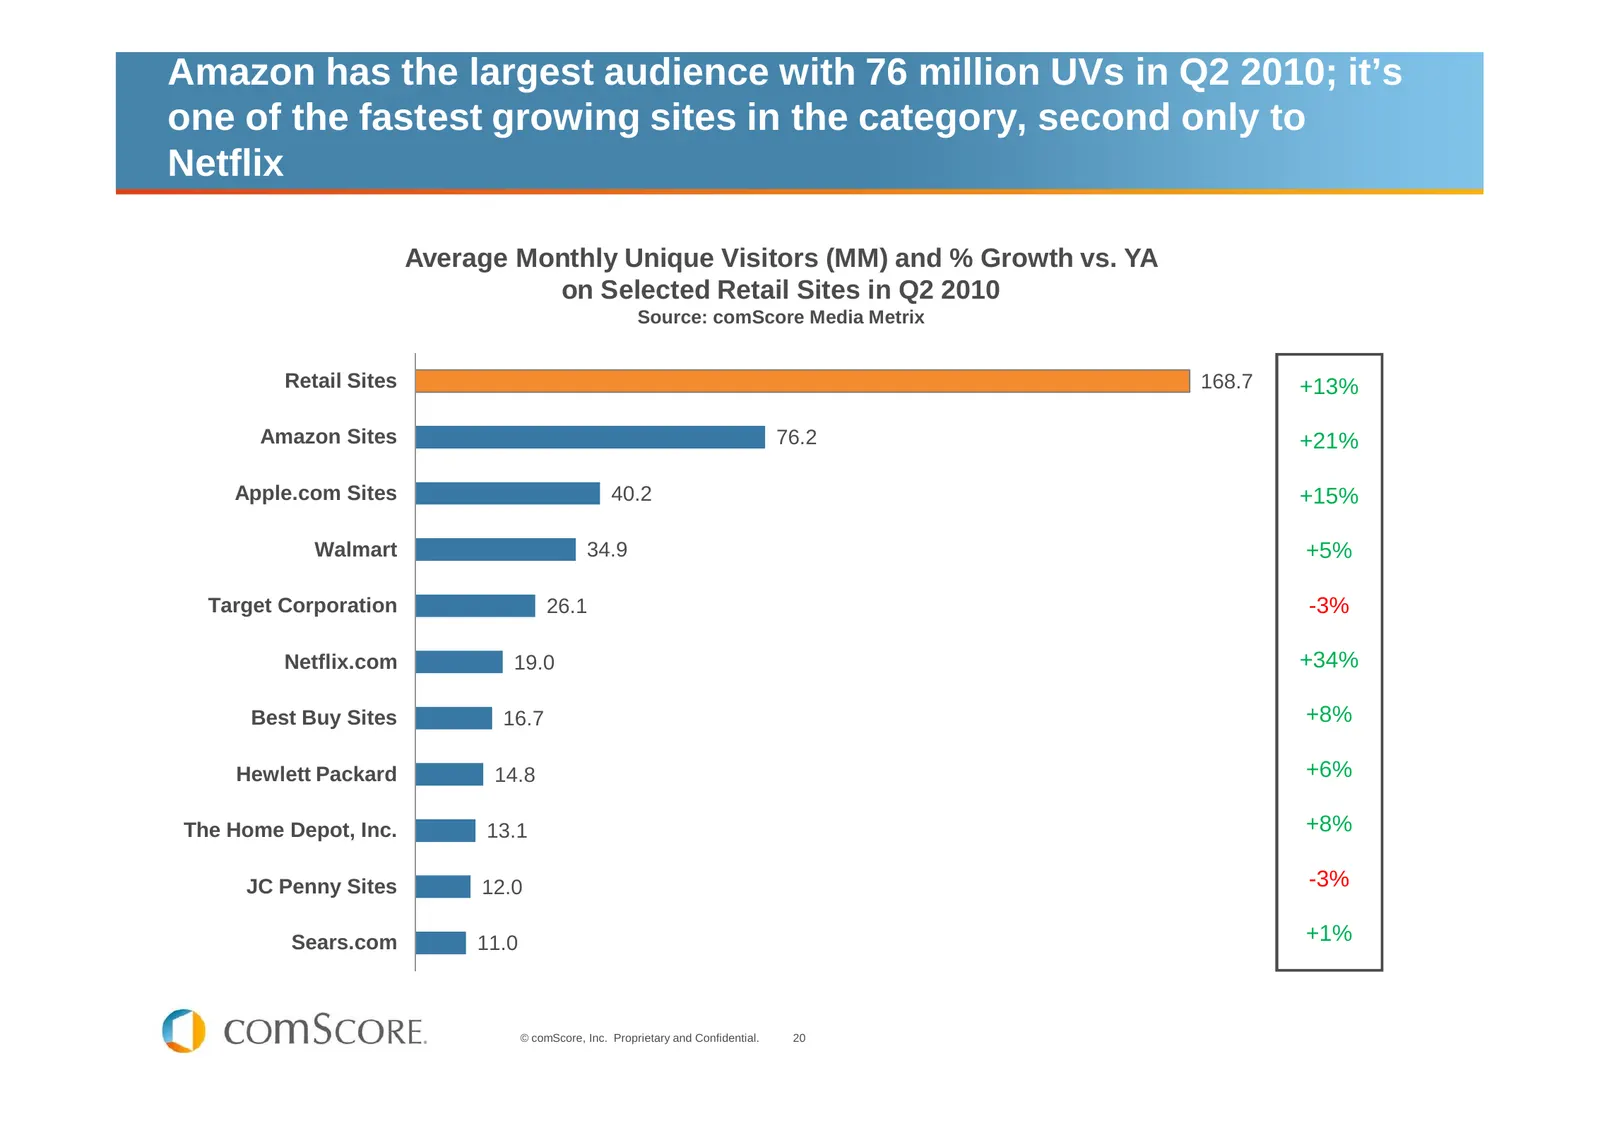
Slide 20: Amazon has the largest retail audience
Amazon has the largest audience with 76 million UVs in Q2 2010; it’s one of the fastest growing sites in the category, second only to Netflix Average Monthly Unique Visitors (MM) and % Growth vs. YA on Selected Retail Sites in Q2 2010 Source: comScore Media Metrix Retail Sites 168.7 +13% Amazon Site
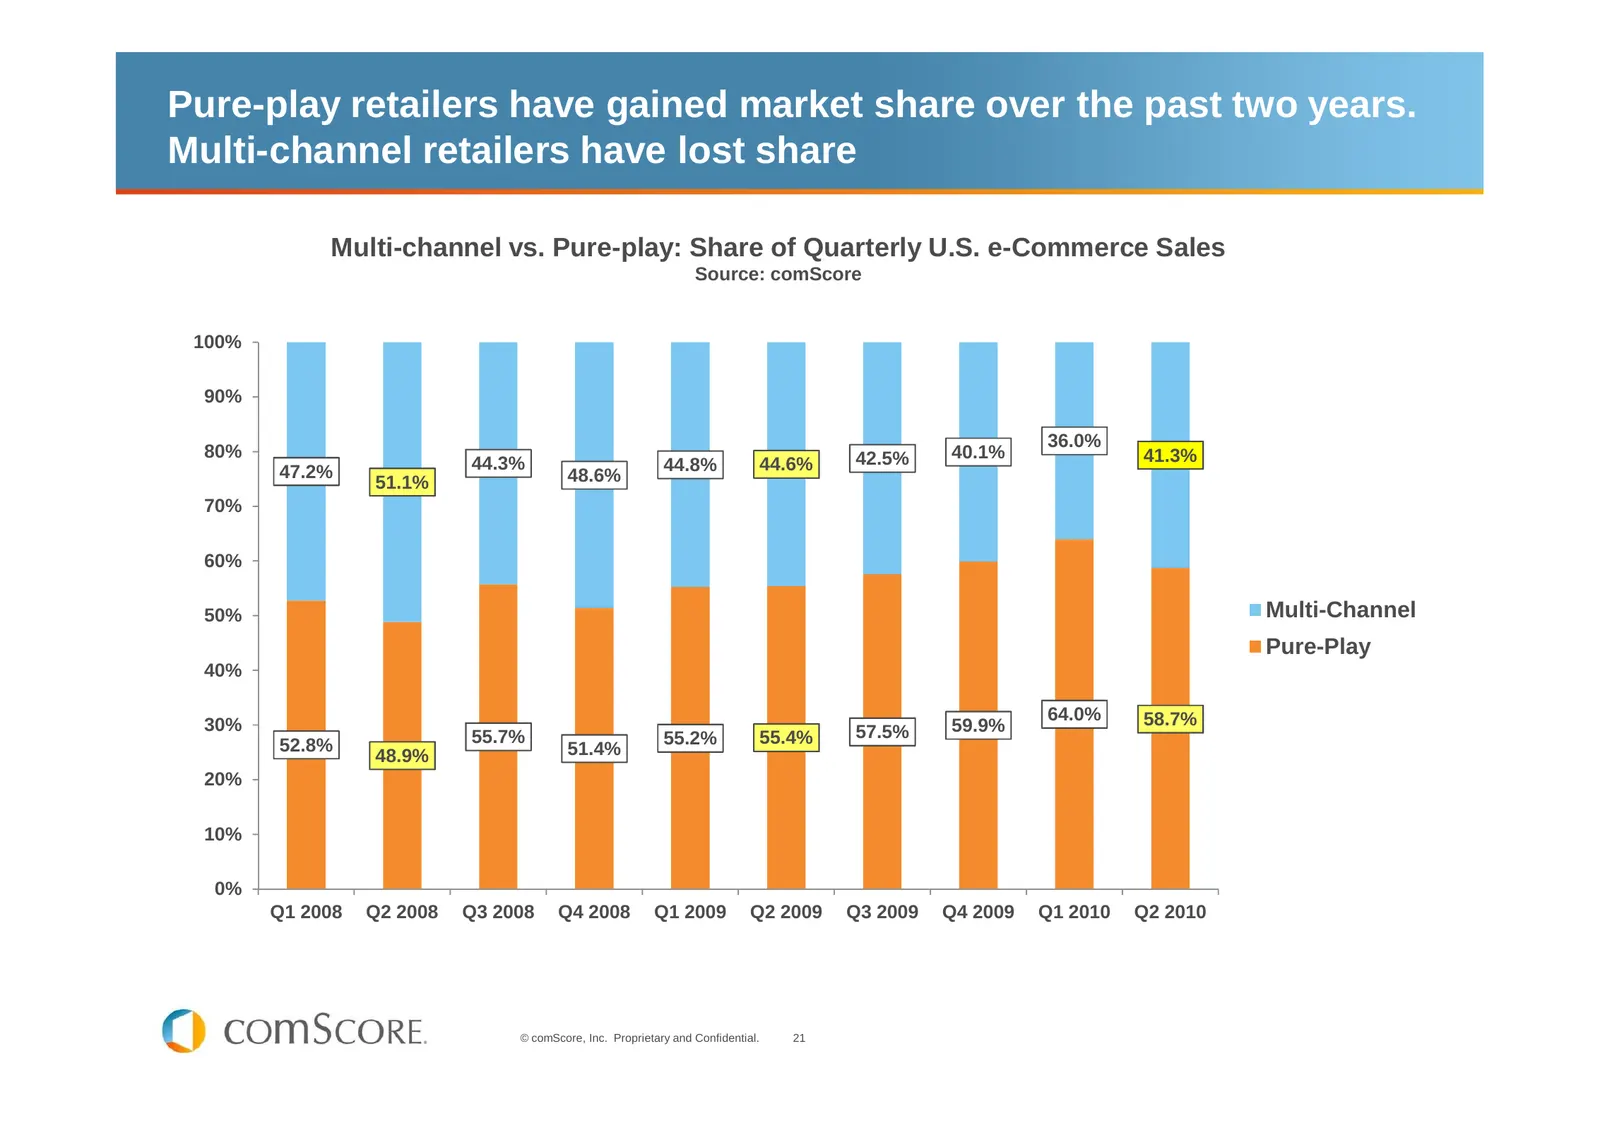
Slide 21: Pure-play retailers gained share over two years
Pure-play retailers have gained market share over the past two years. Multi-channel retailers have lost share Multi-channel vs. Pure-play: Share of Quarterly U.S. e-Commerce Sales Source: comScore 100% 90% 36.0% 80% 42.5% 40.1% 41.3% 47.2% 44.3% 44.8% 44.6% 51.1% 48.6% 70% 60% 50% Multi-Channel Pure
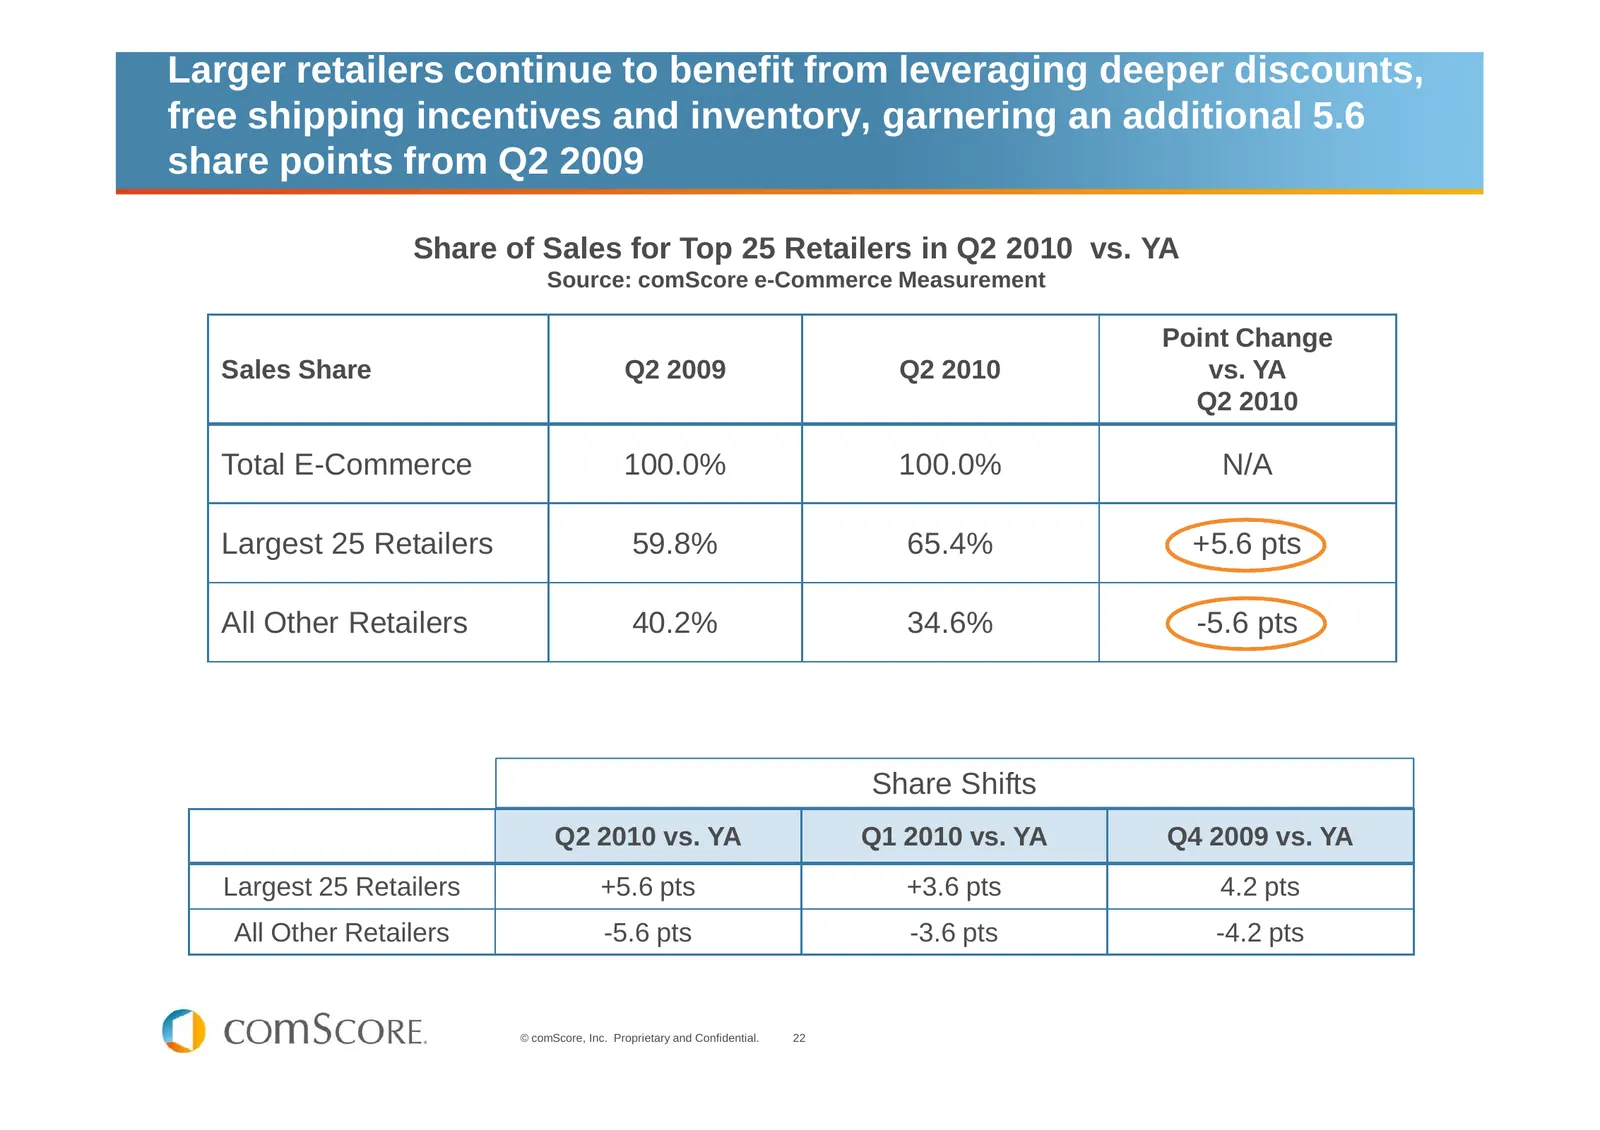
Slide 22: Larger retailers gain share of sales
Larger retailers continue to benefit from leveraging deeper discounts, free shipping incentives and inventory, garnering an additional 5.6 share points from Q2 2009 Share of Sales for Top 25 Retailers in Q2 2010 vs. YA Source: comScore e-Commerce Measurement Point Change Sales Share Q2 2009 Q2 2010
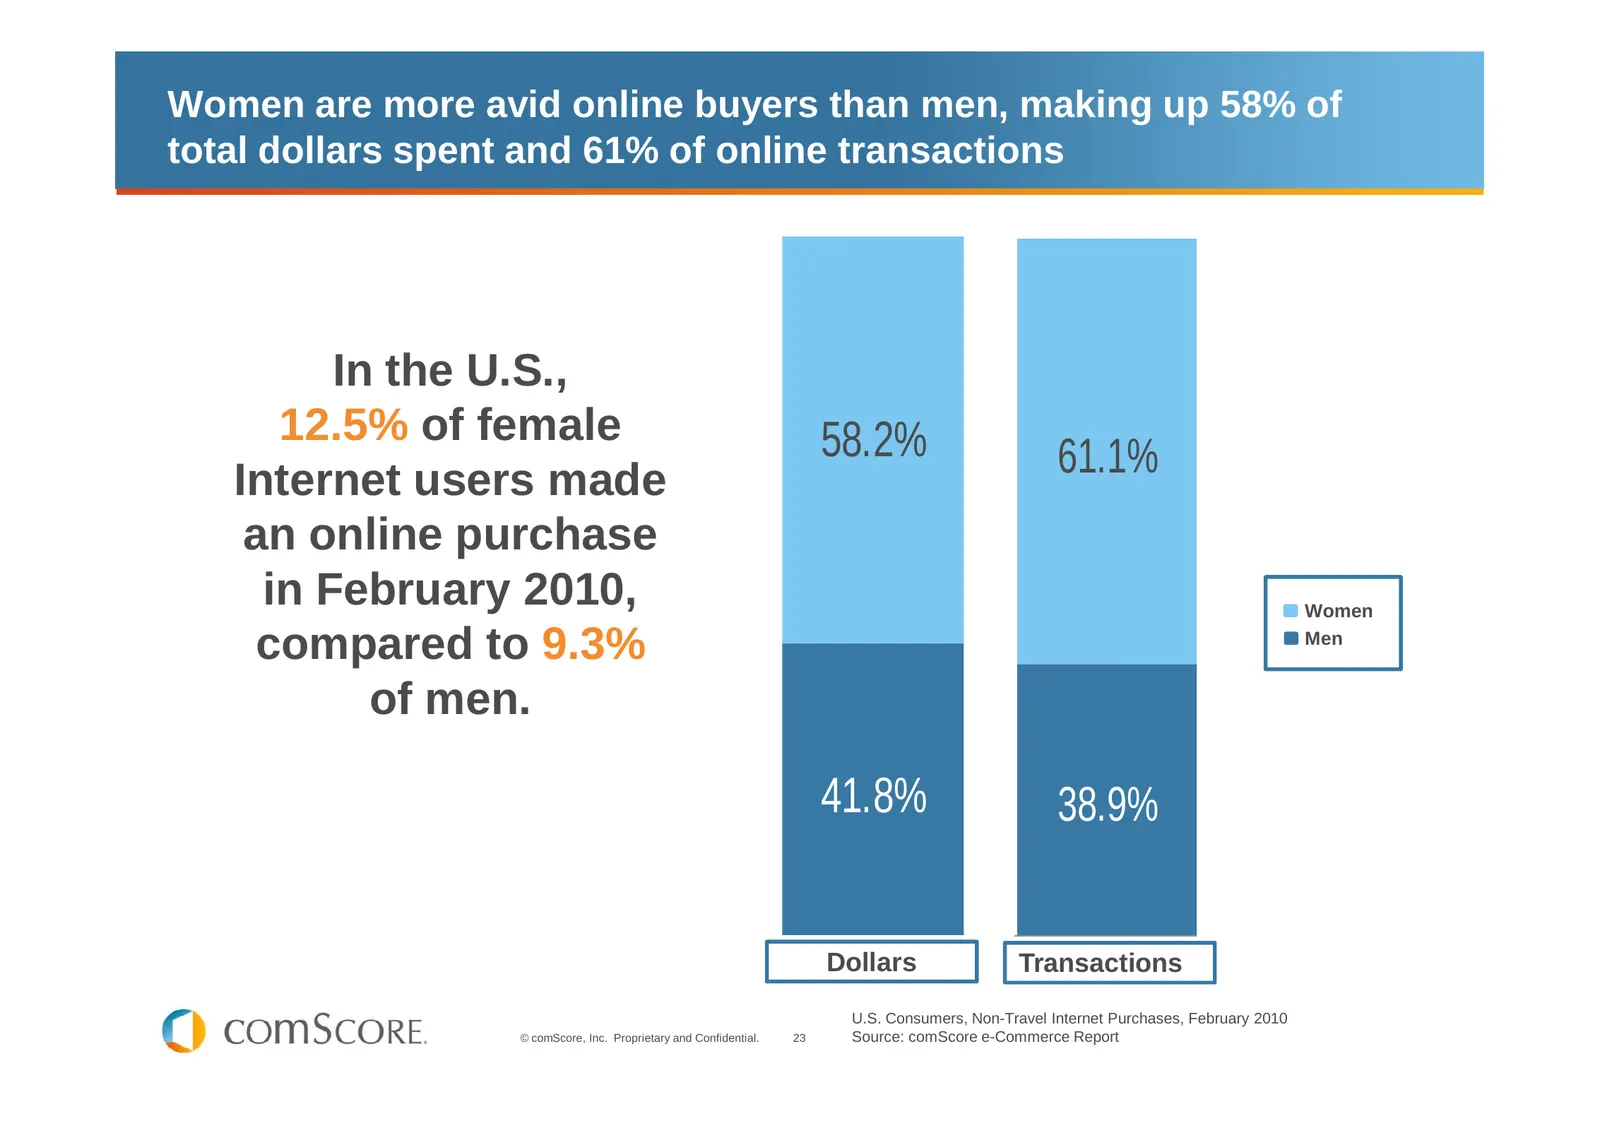
Slide 23: Women are more avid online buyers than men
Women are more avid online buyers than men, making up 58% of total dollars spent and 61% of online transactions In the U.S., 12.5% of female 58.2% Internet users made 61.1% an online purchase in February 2010, Women compared to 9.3% Men of men. 41.8% 38.9% Dollars Transactions U.S. Consumers, Non-Tr
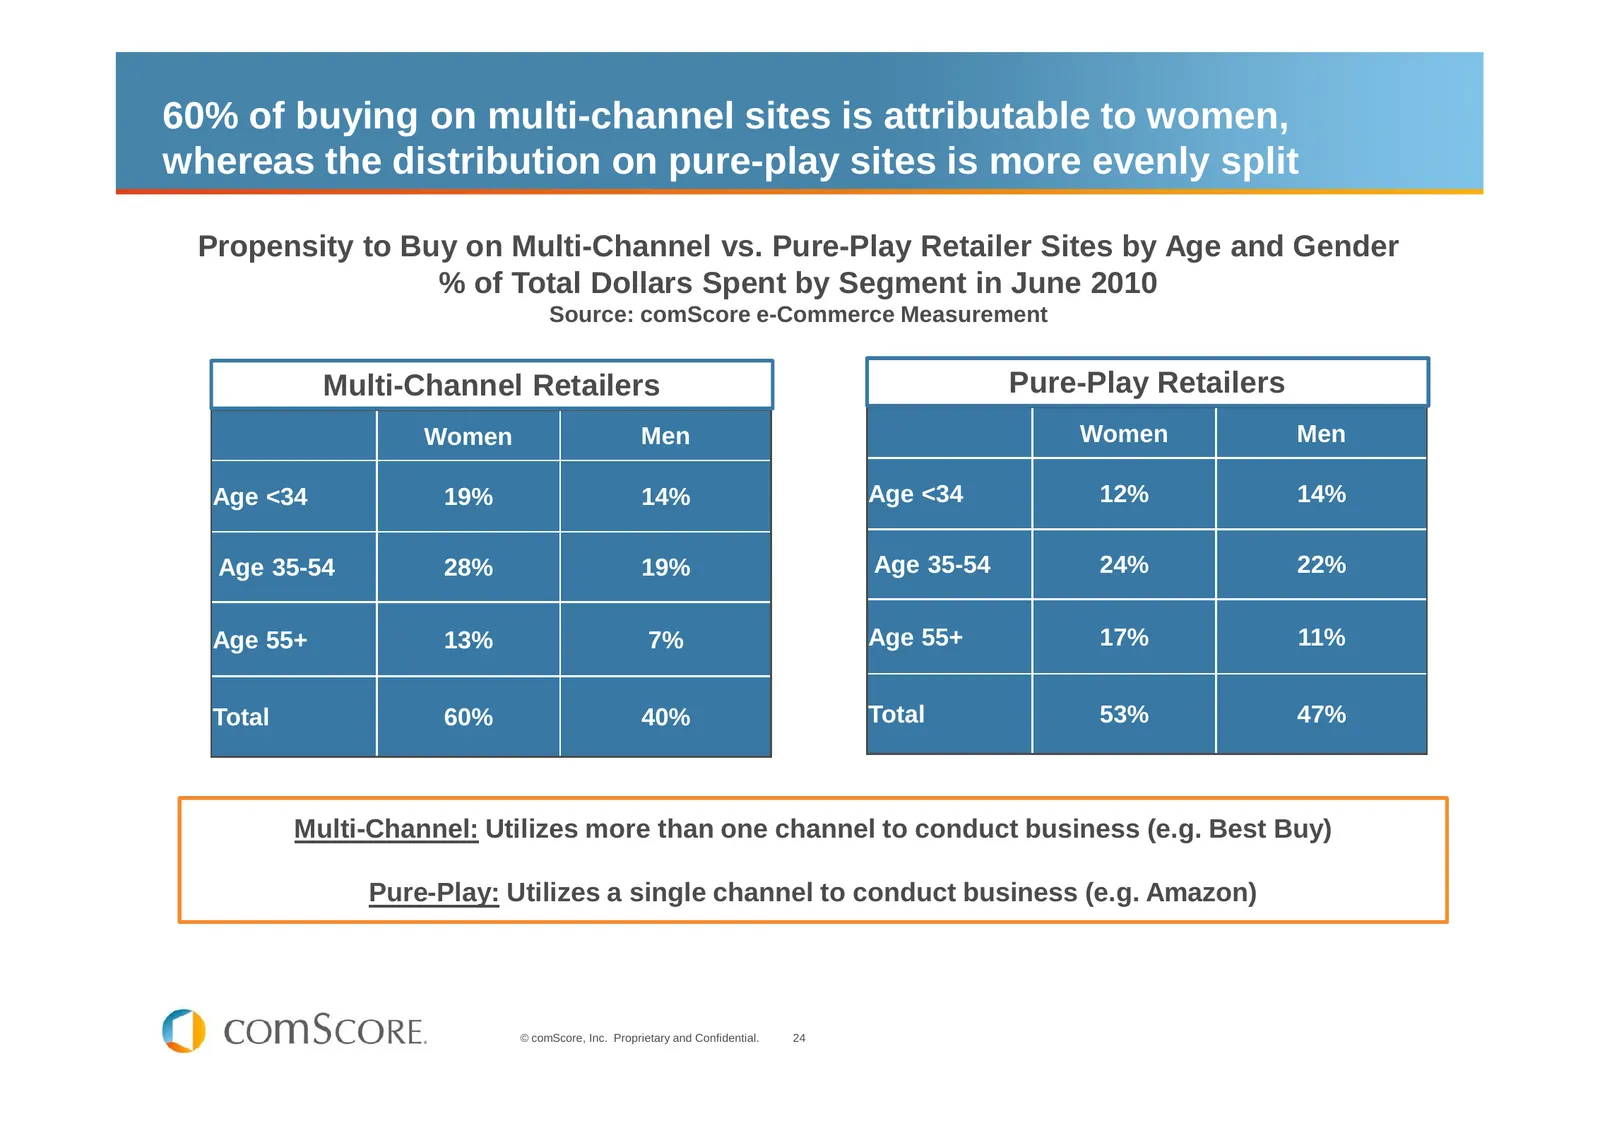
Slide 24: Buying on multi-channel vs. pure-play sites by age and gender
60% of buying on multi-channel sites is attributable to women, whereas the distribution on pure-play sites is more evenly split Propensity to Buy on Multi-Channel vs. Pure-Play Retailer Sites by Age and Gender % of Total Dollars Spent by Segment in June 2010 Source: comScore e-Commerce Measurement M
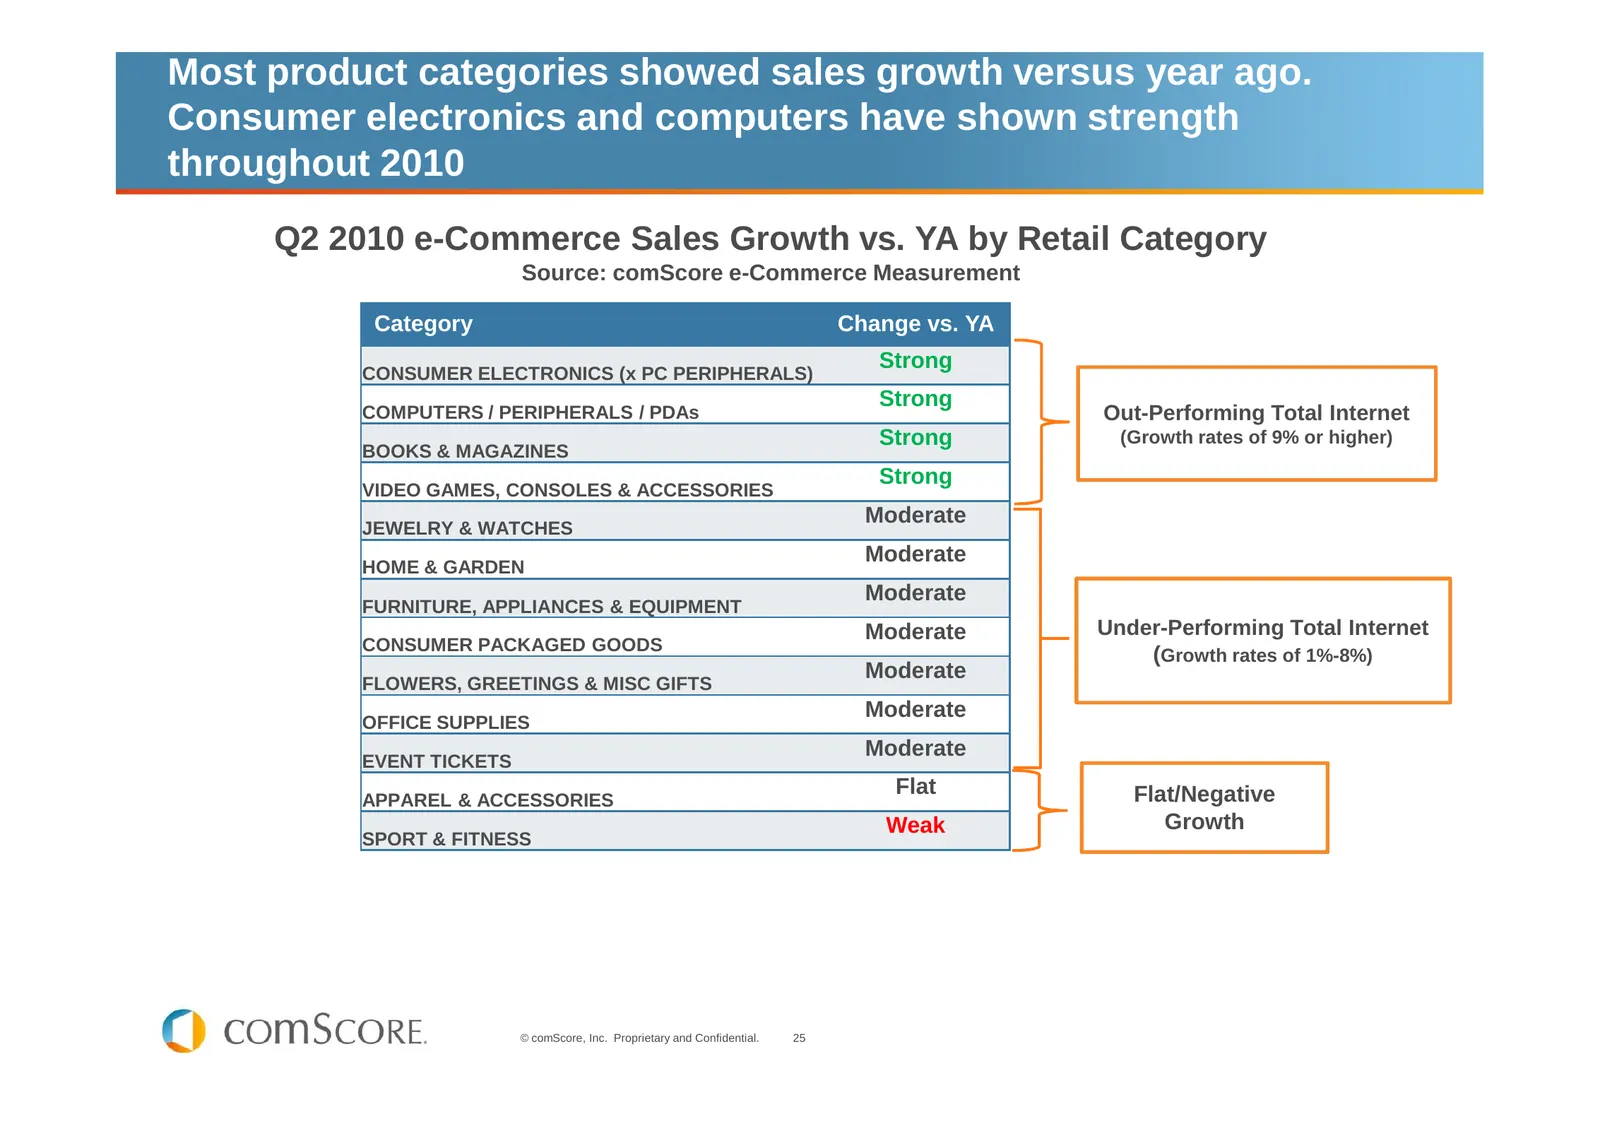
Slide 25: Q2 2010 e-commerce growth by retail category
Most product categories showed sales growth versus year ago. Consumer electronics and computers have shown strength throughout 2010 Q2 2010 e-Commerce Sales Growth vs. YA by Retail Category Source: comScore e-Commerce Measurement Category Change vs. YA Strong CONSUMER ELECTRONICS (x PC PERIPHERALS)

Slide 26: The Impact of Promotions & Price Incentives on Internet Behavior
The Impact of Promotions & Price Incentives on Internet Behavior © comScore, Inc. Proprietary and Confidential. 26
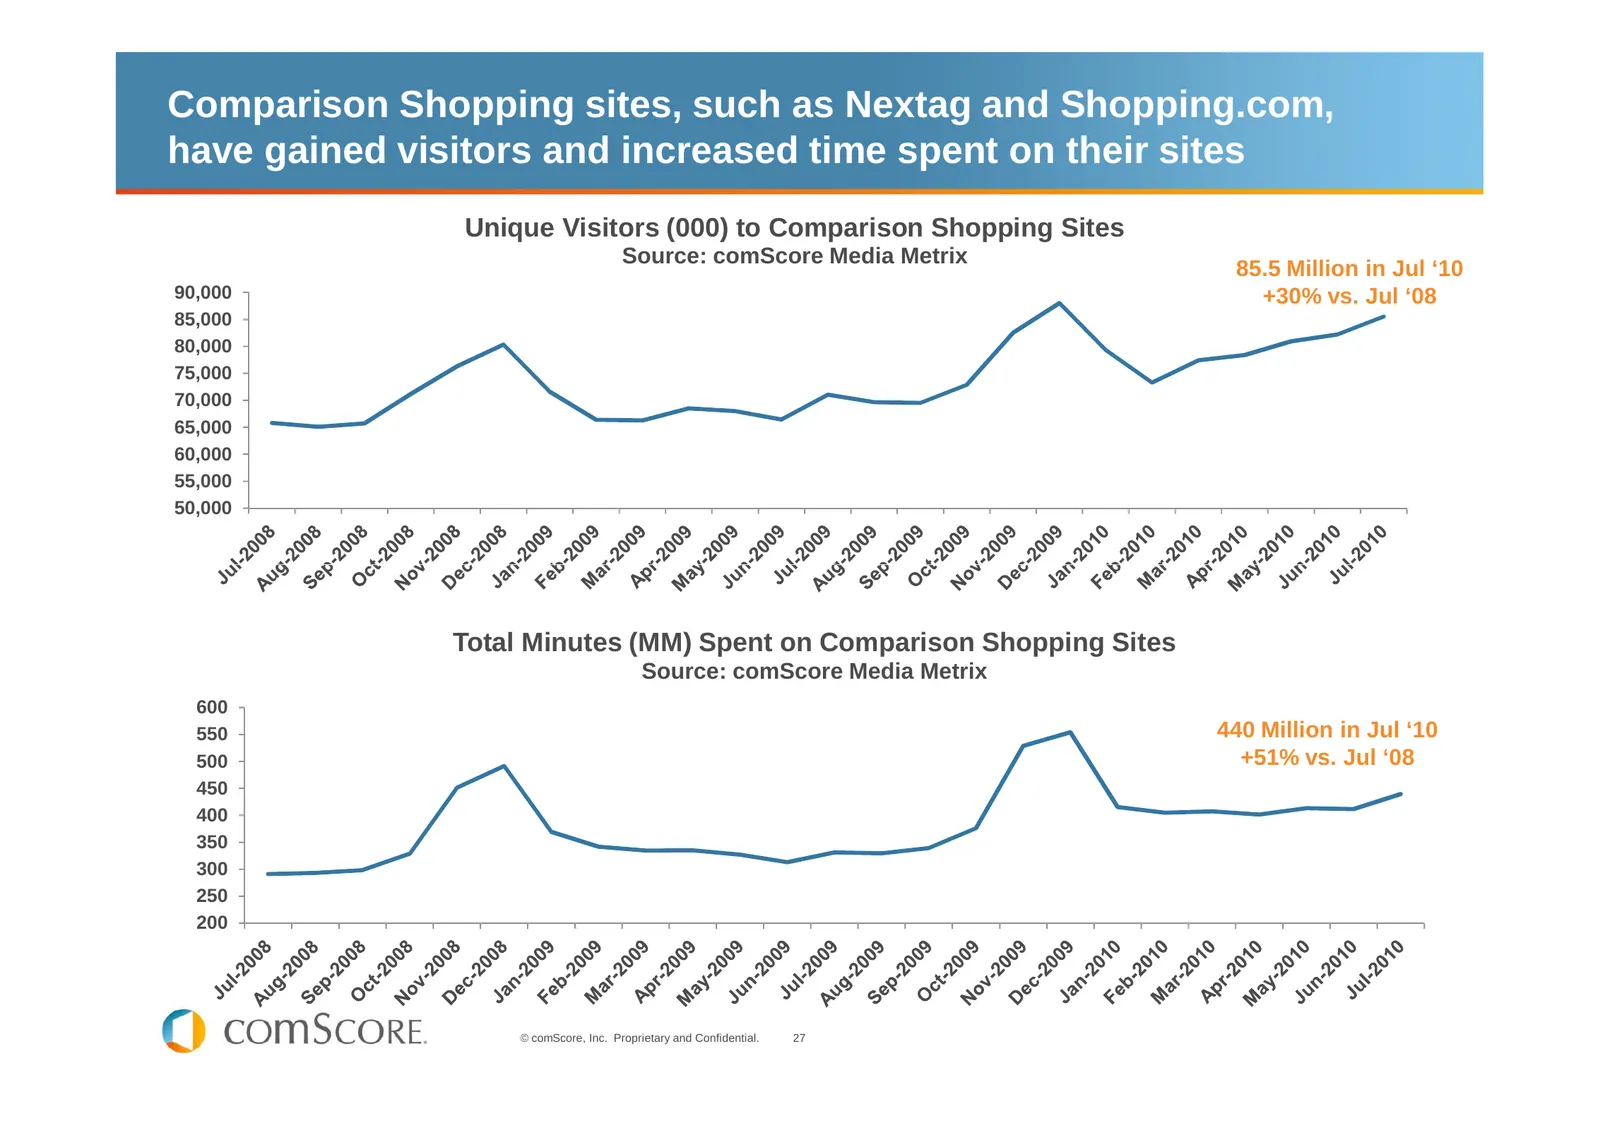
Slide 27: Comparison shopping sites gained visitors and time spent
Comparison Shopping sites, such as Nextag and Shopping.com, have gained visitors and increased time spent on their sites Unique Visitors (000) to Comparison Shopping Sites Source: comScore Media Metrix 85.5 Million in Jul ‘10 90,000 +30% vs. Jul ‘08 85,000 80,000 75,000 70,000 65,000 60,000 55,000 5
Slide 28: Coupon sites continue to grow in importance
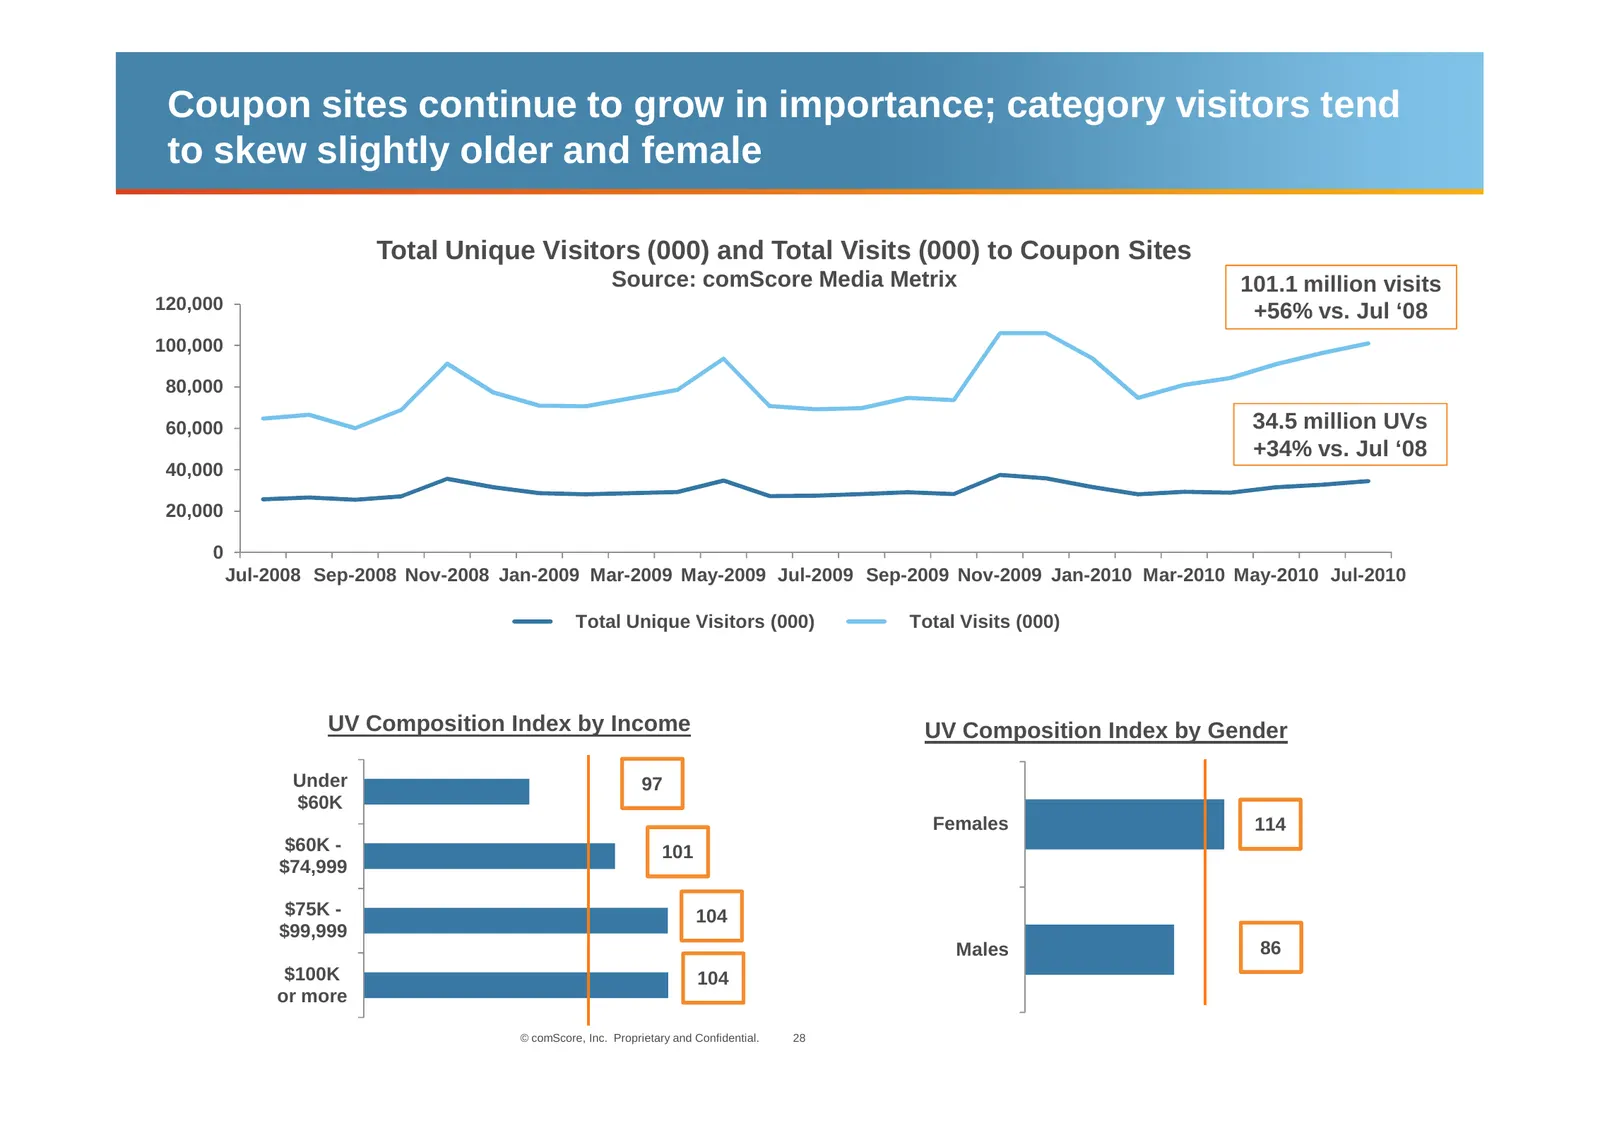
Coupon sites continue to grow in importance; category visitors tend to skew slightly older and female Total Unique Visitors (000) and Total Visits (000) to Coupon Sites Source: comScore Media Metrix 101.1 million visits 120,000 +56% vs. Jul ‘08 100,000 80,000 60,000 34.5 million UVs +34% vs. Jul ‘08
Slide 29: Coupons.com leads coupon category
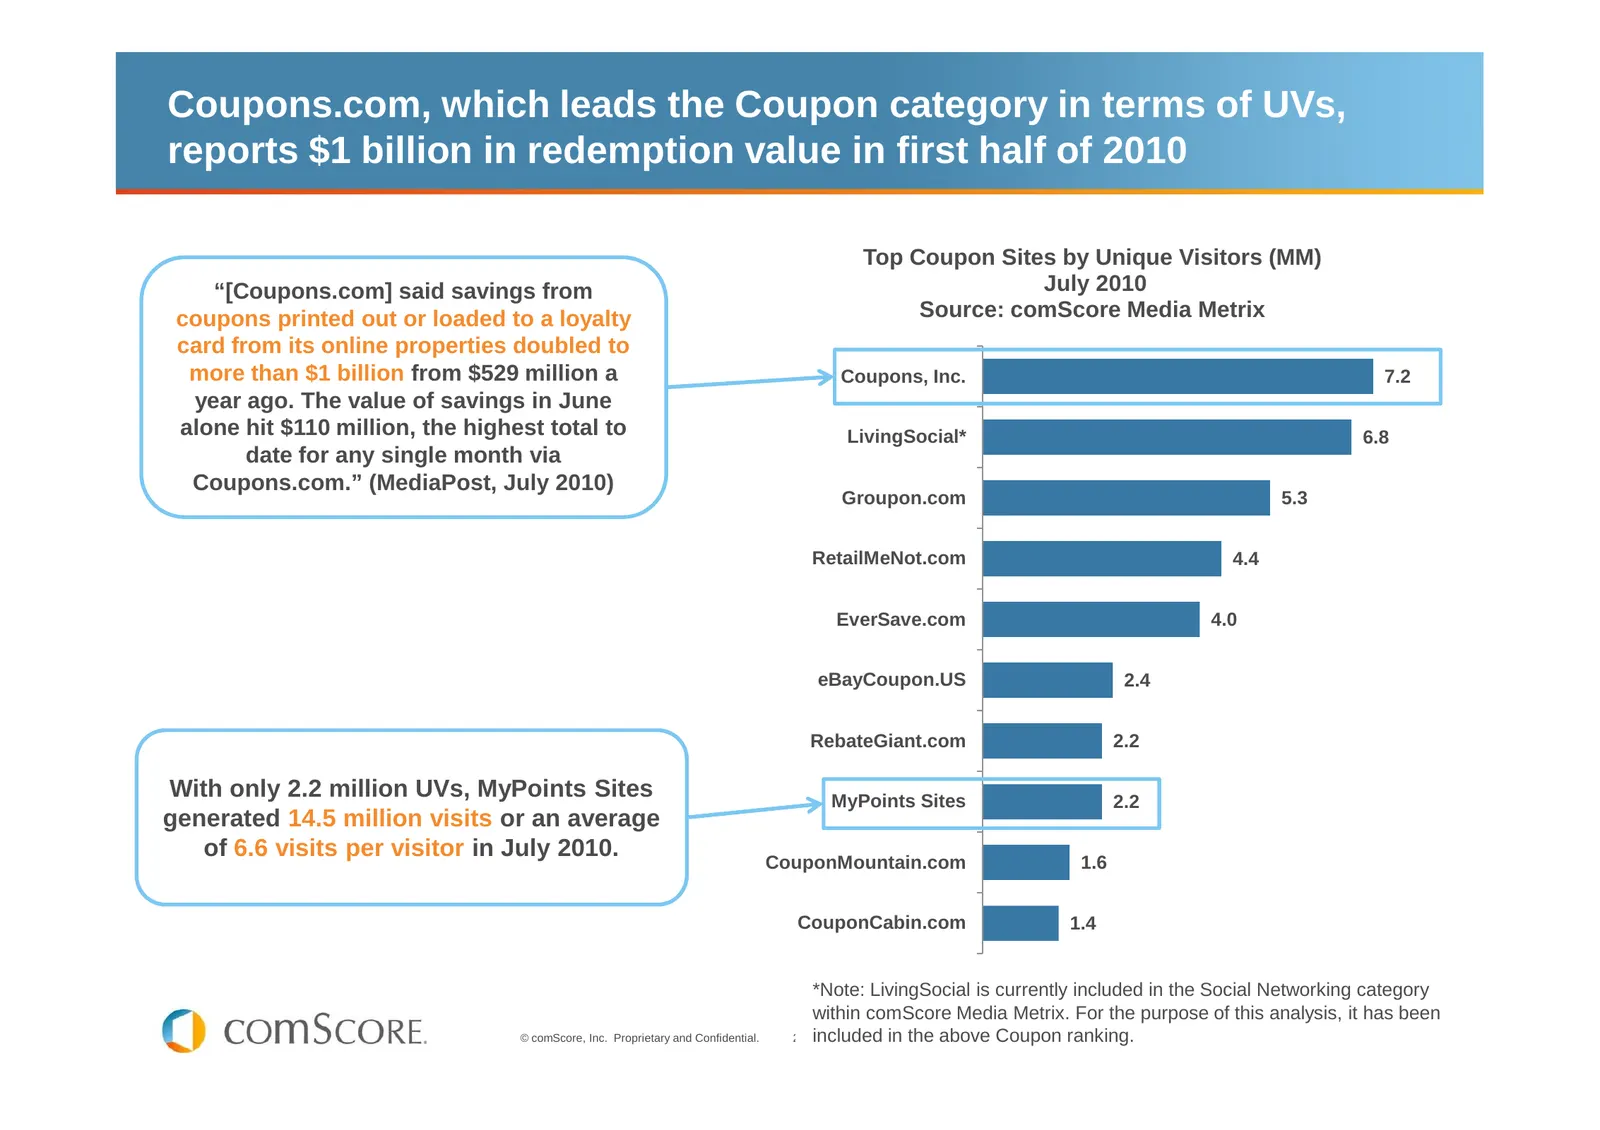
Coupons.com, which leads the Coupon category in terms of UVs, reports $1 billion in redemption value in first half of 2010 Top Coupon Sites by Unique Visitors (MM) “[Coupons.com] said savings from July 2010 coupons printed out or loaded to a loyalty Source: comScore Media Metrix card from its online
Slide 30: Flash sale sites continue to gain traction
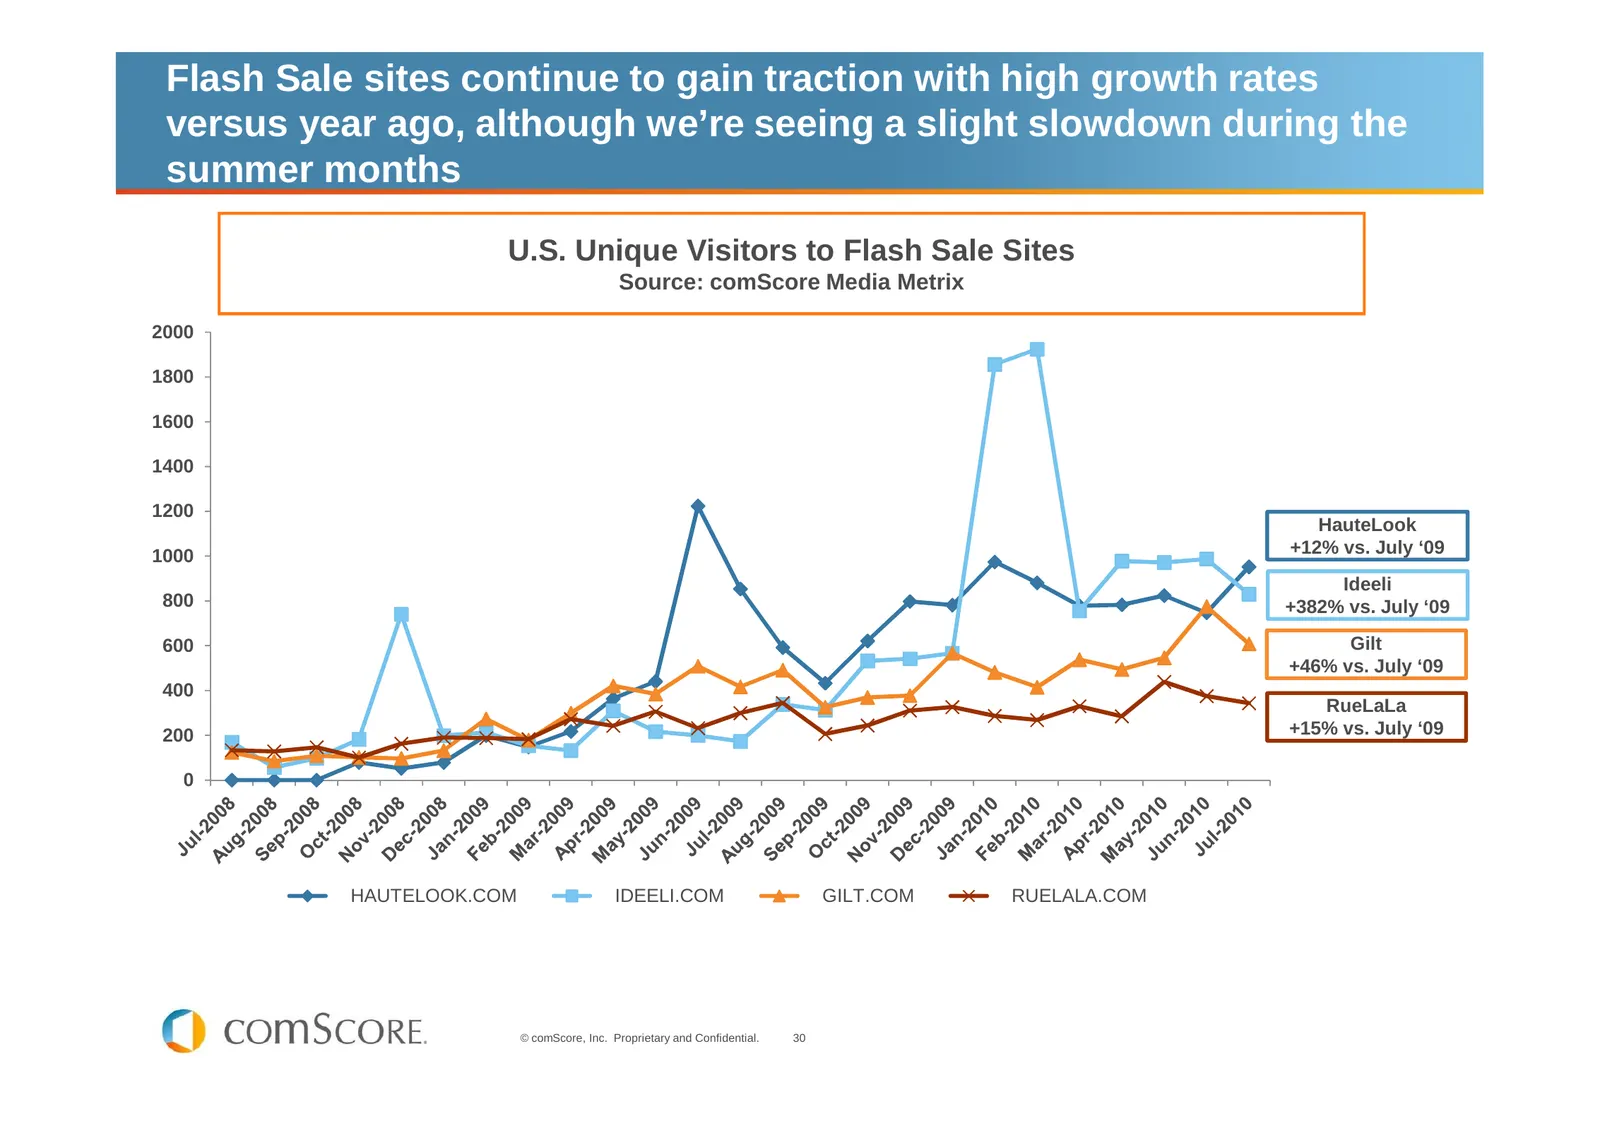
Flash Sale sites continue to gain traction with high growth rates versus year ago, although we’re seeing a slight slowdown during the summer months U.S. Unique Visitors to Flash Sale Sites Source: comScore Media Metrix 2000 1800 1600 1400 1200 HauteLook 1000 +12% vs. July ‘09 Ideeli 800 +382% vs. Ju

Slide 31: Group buying is surging
Group buying is surging. Groupon.com and LivingSocial continue to execute against strategies that enhance the user experience and entice consumers from across the Web U.S. Unique Visitors (000) Source: comScore Media Metrix 8,000 LivingSocial.com 7,000 +8300+% vs. YA 6,000 5,000 4,000 Groupon.com 3,
Slide 32: Half of consumers abandon cart without free shipping
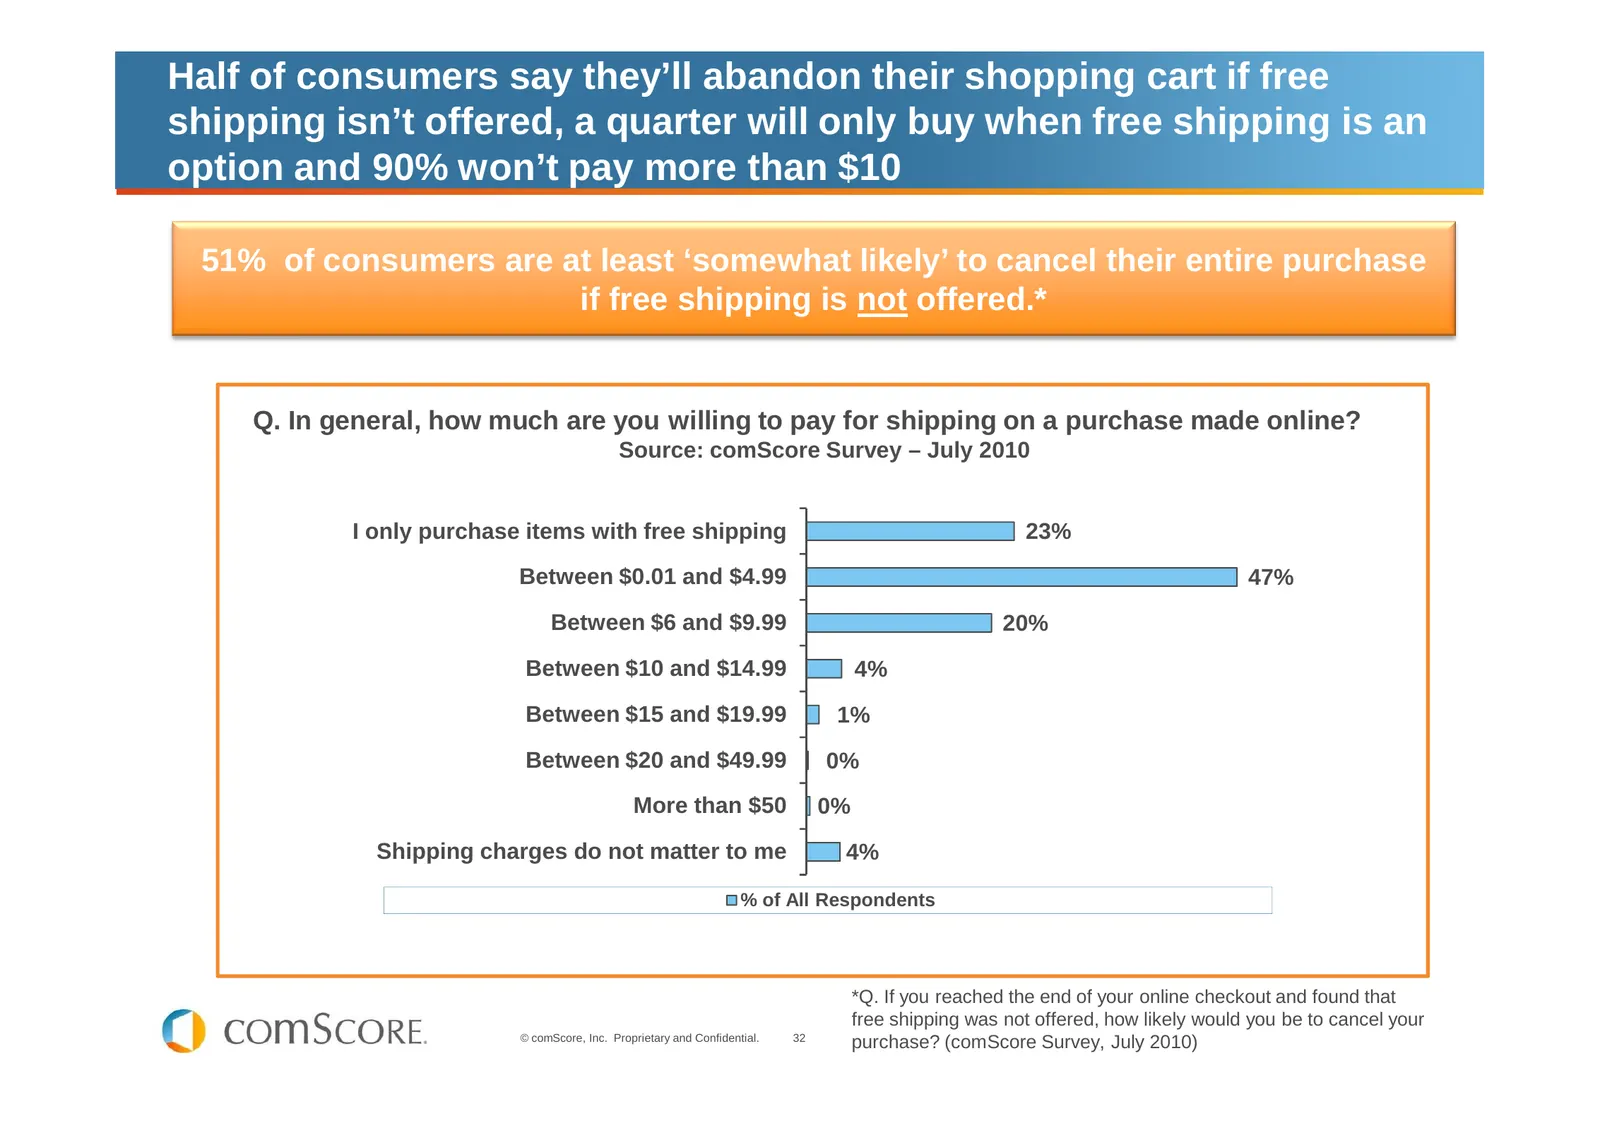
Half of consumers say they’ll abandon their shopping cart if free shipping isn’t offered, a quarter will only buy when free shipping is an option and 90% won’t pay more than $10 51% of consumers are at least ‘somewhat likely’ to cancel their entire purchase if free shipping is not offered.* Q. In ge
Slide 33: Alternatives to free shipping
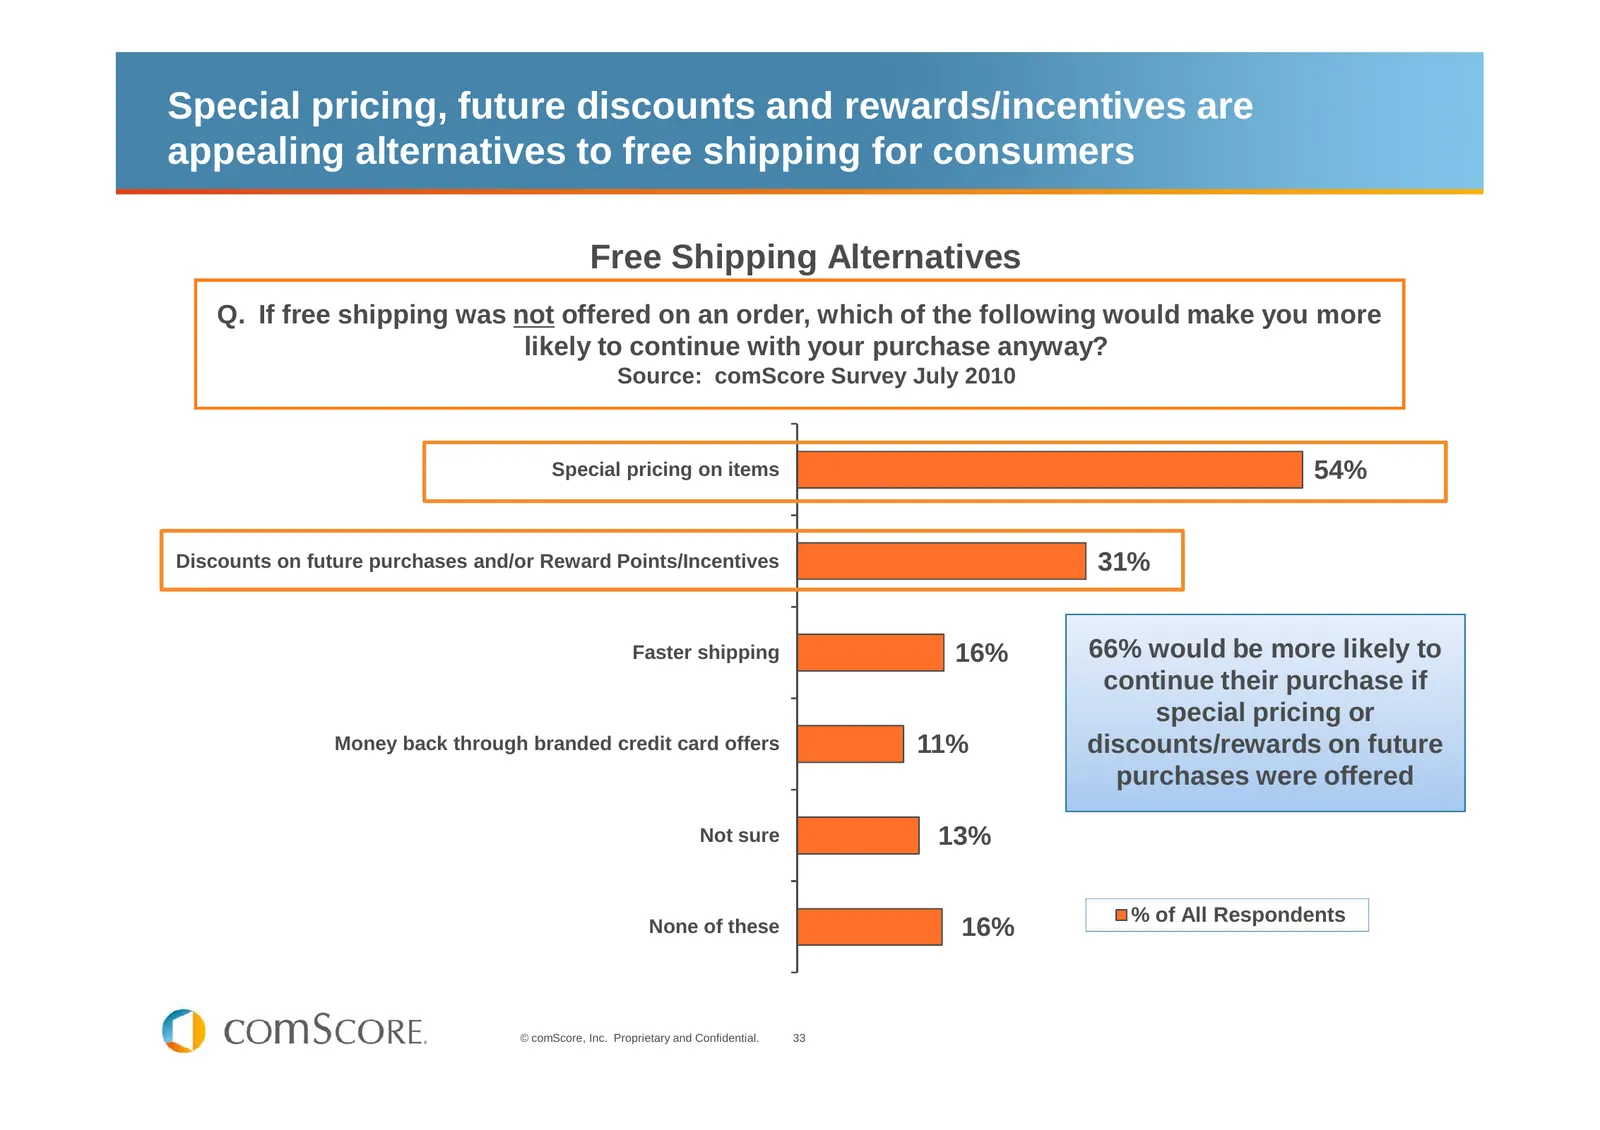
Special pricing, future discounts and rewards/incentives are appealing alternatives to free shipping for consumers Free Shipping Alternatives Q. If free shipping was not offered on an order, which of the following would make you more likely to continue with your purchase anyway? Source: comScore Sur
Slide 34: Other Digital Trends Retailers Can't Afford to Ignore
Other Digital Trends Retailers Can’t Afford to Ignore © comScore, Inc. Proprietary and Confidential. 34
Slide 35: Facebook and MySpace unique visitors
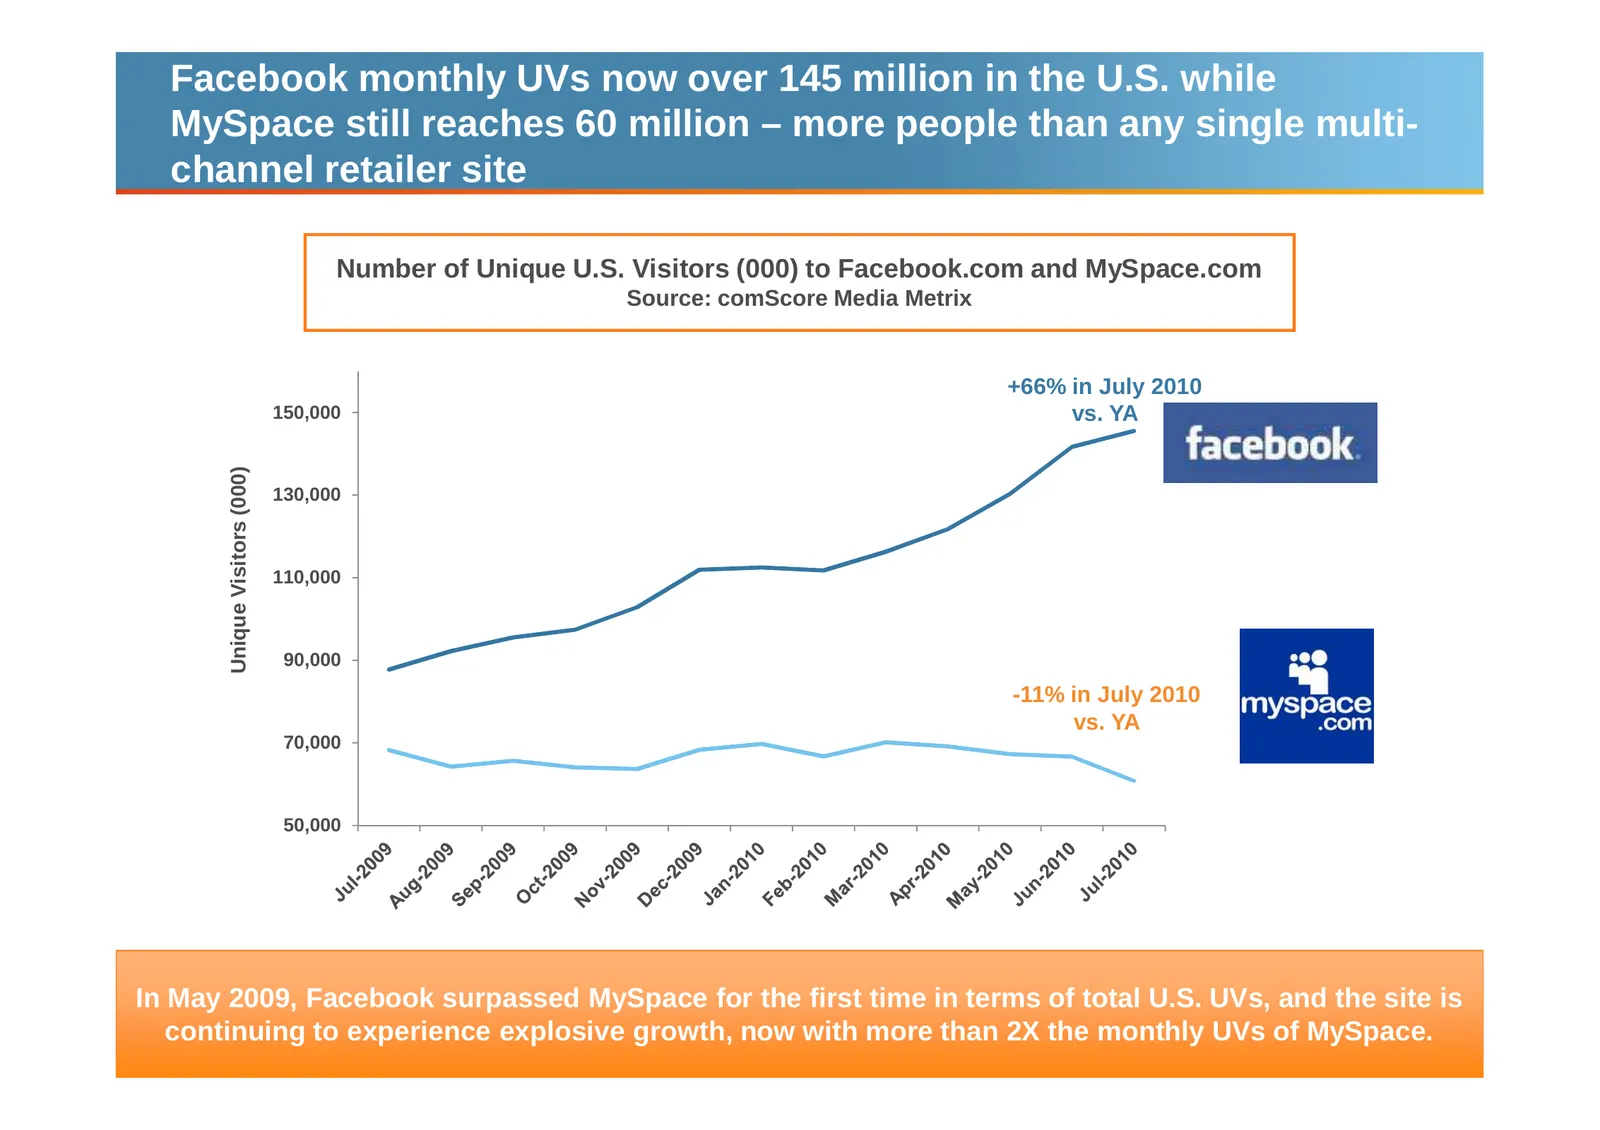
Facebook monthly UVs now over 145 million in the U.S. while MySpace still reaches 60 million – more people than any single multi- channel retailer site Number of Unique U.S. Visitors (000) to Facebook.com and MySpace.com Source: comScore Media Metrix +66% in July 2010 150,000 vs. YA Unique Visitors
Slide 36: Search vs. retail reach on internet, smartphone and mobile
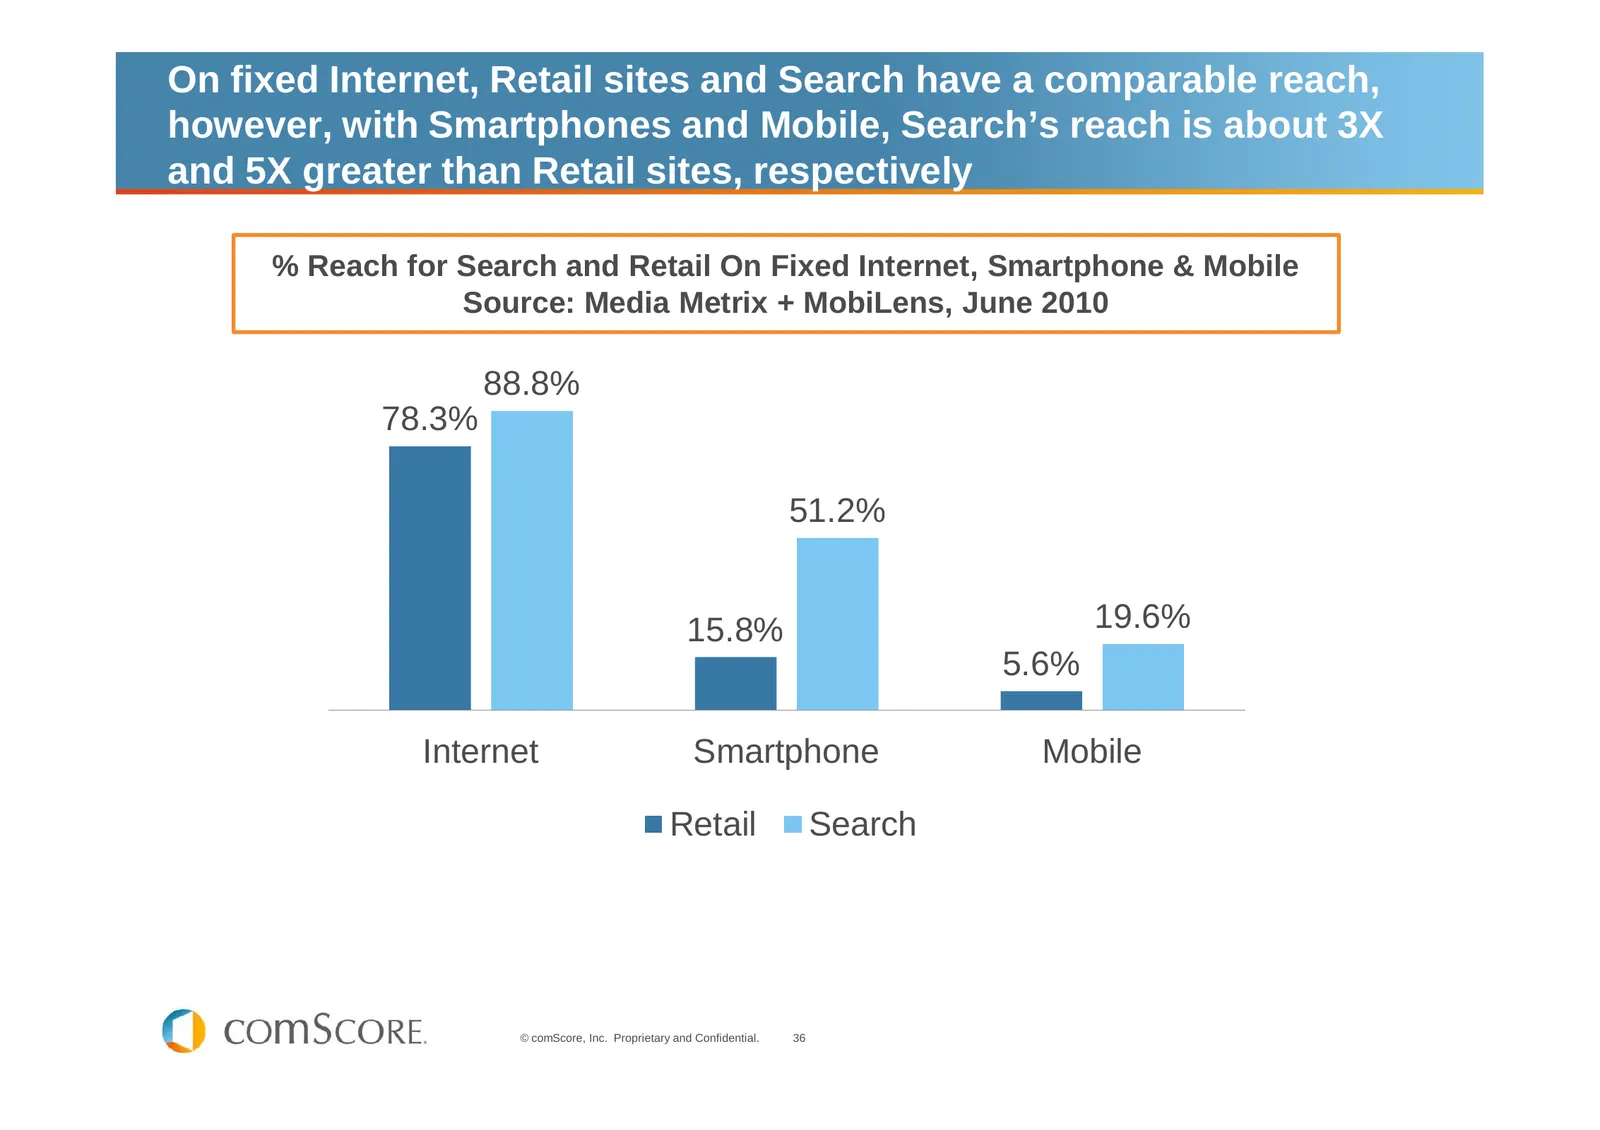
On fixed Internet, Retail sites and Search have a comparable reach, however, with Smartphones and Mobile, Search’s reach is about 3X and 5X greater than Retail sites, respectively % Reach for Search and Retail On Fixed Internet, Smartphone & Mobile Source: Media Metrix + MobiLens, June 2010 88.8% 78
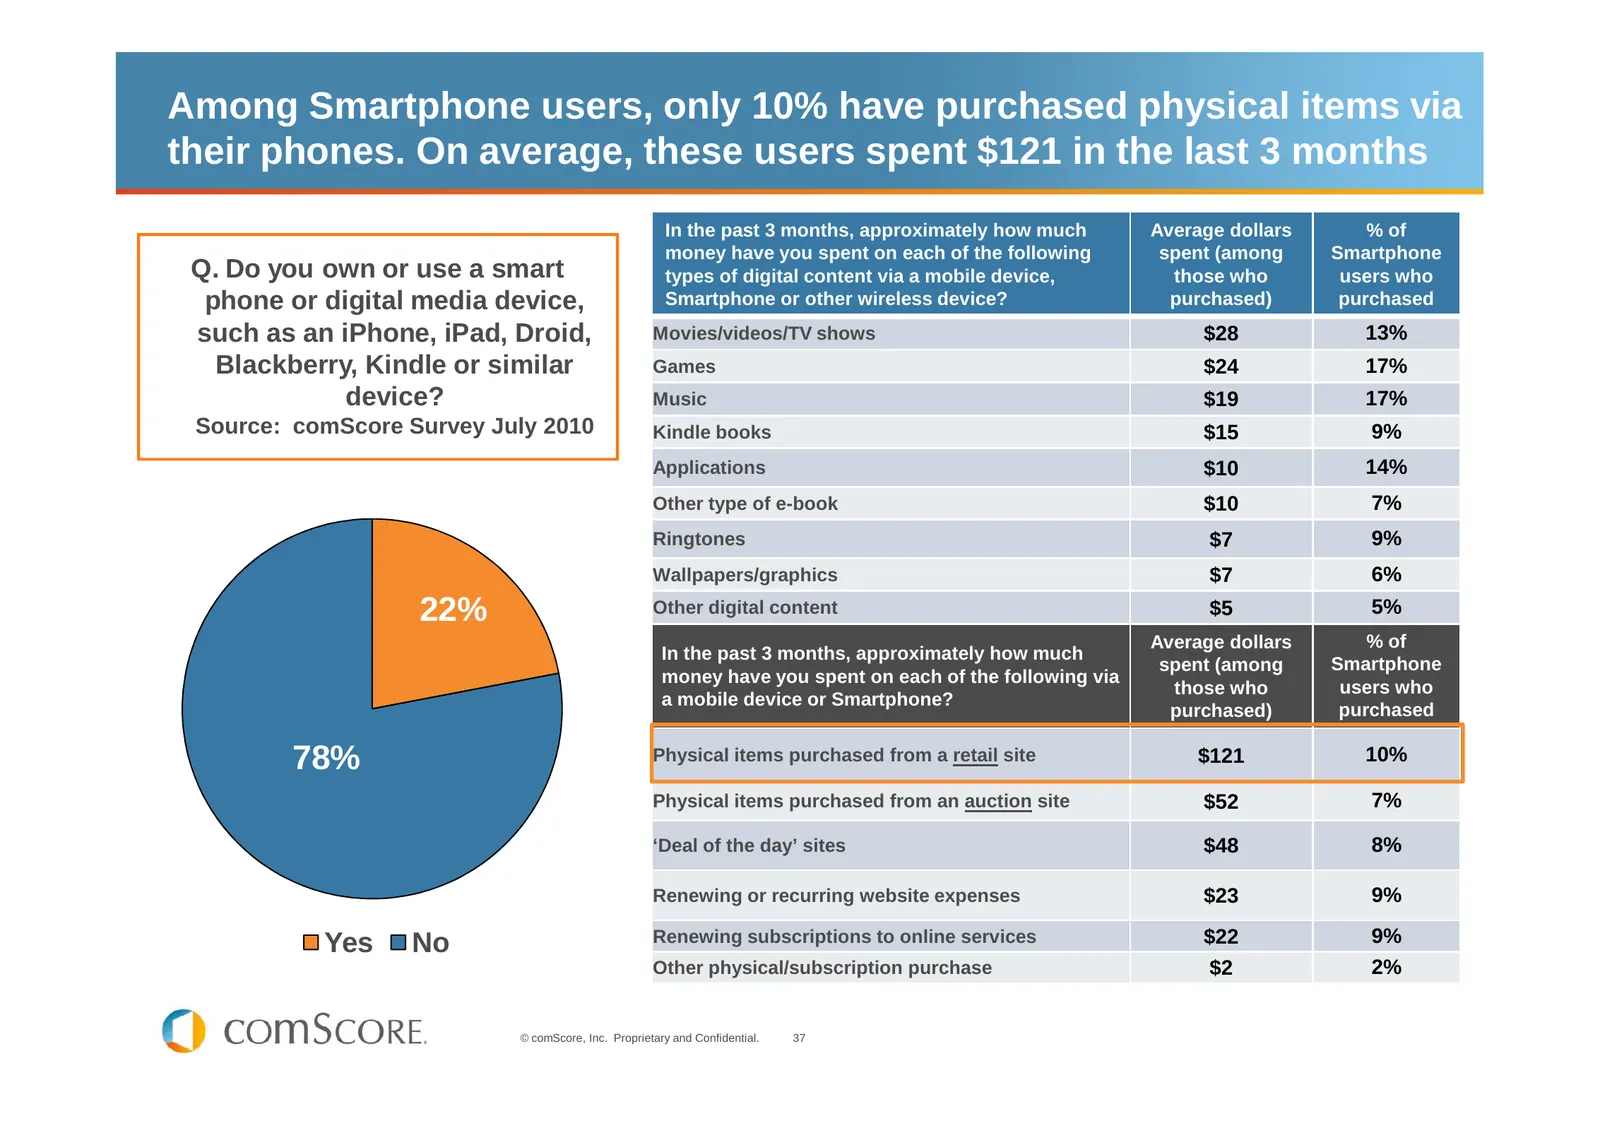
Slide 37: Smartphone users purchasing via their phones
Among Smartphone users, only 10% have purchased physical items via their phones. On average, these users spent $121 in the last 3 months In the past 3 months, approximately how much Average dollars % of money have you spent on each of the following spent (among Smartphone Q. Do you own or use a smar
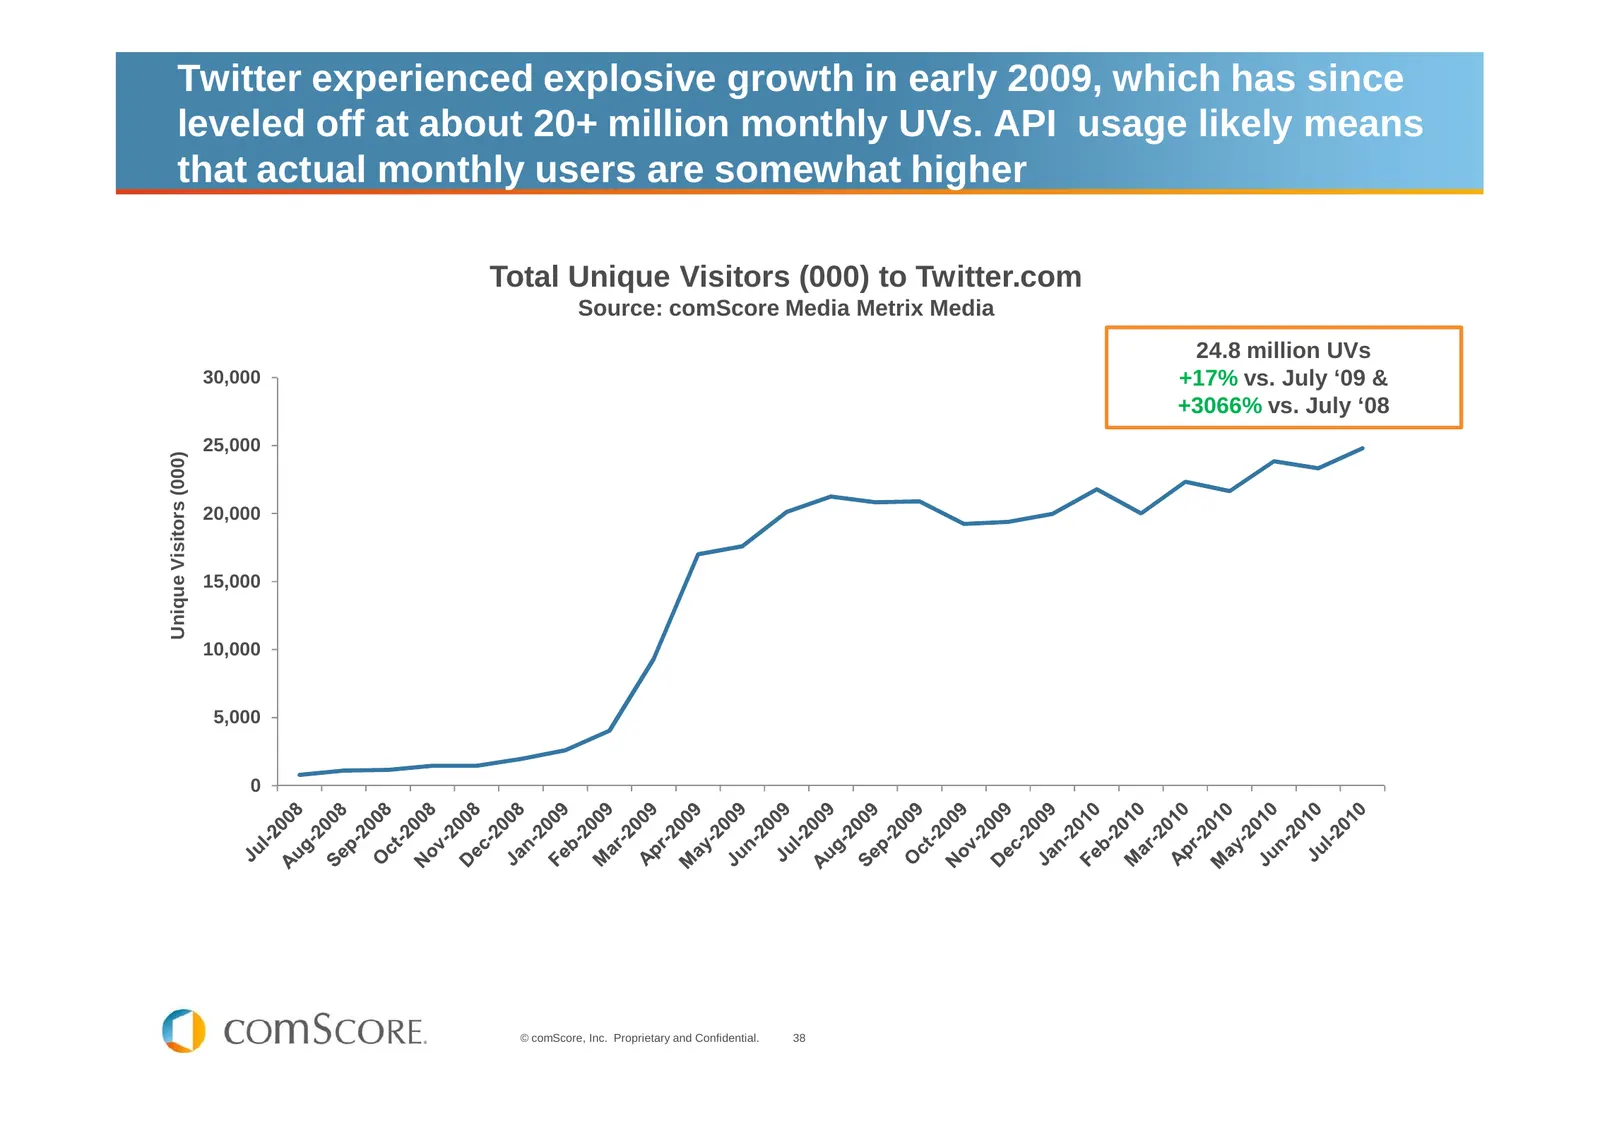
Slide 38: Twitter growth has leveled off
Twitter experienced explosive growth in early 2009, which has since leveled off at about 20+ million monthly UVs. API usage likely means that actual monthly users are somewhat higher Total Unique Visitors (000) to Twitter.com Source: comScore Media Metrix Media 24.8 million UVs 30,000 +17% vs. July
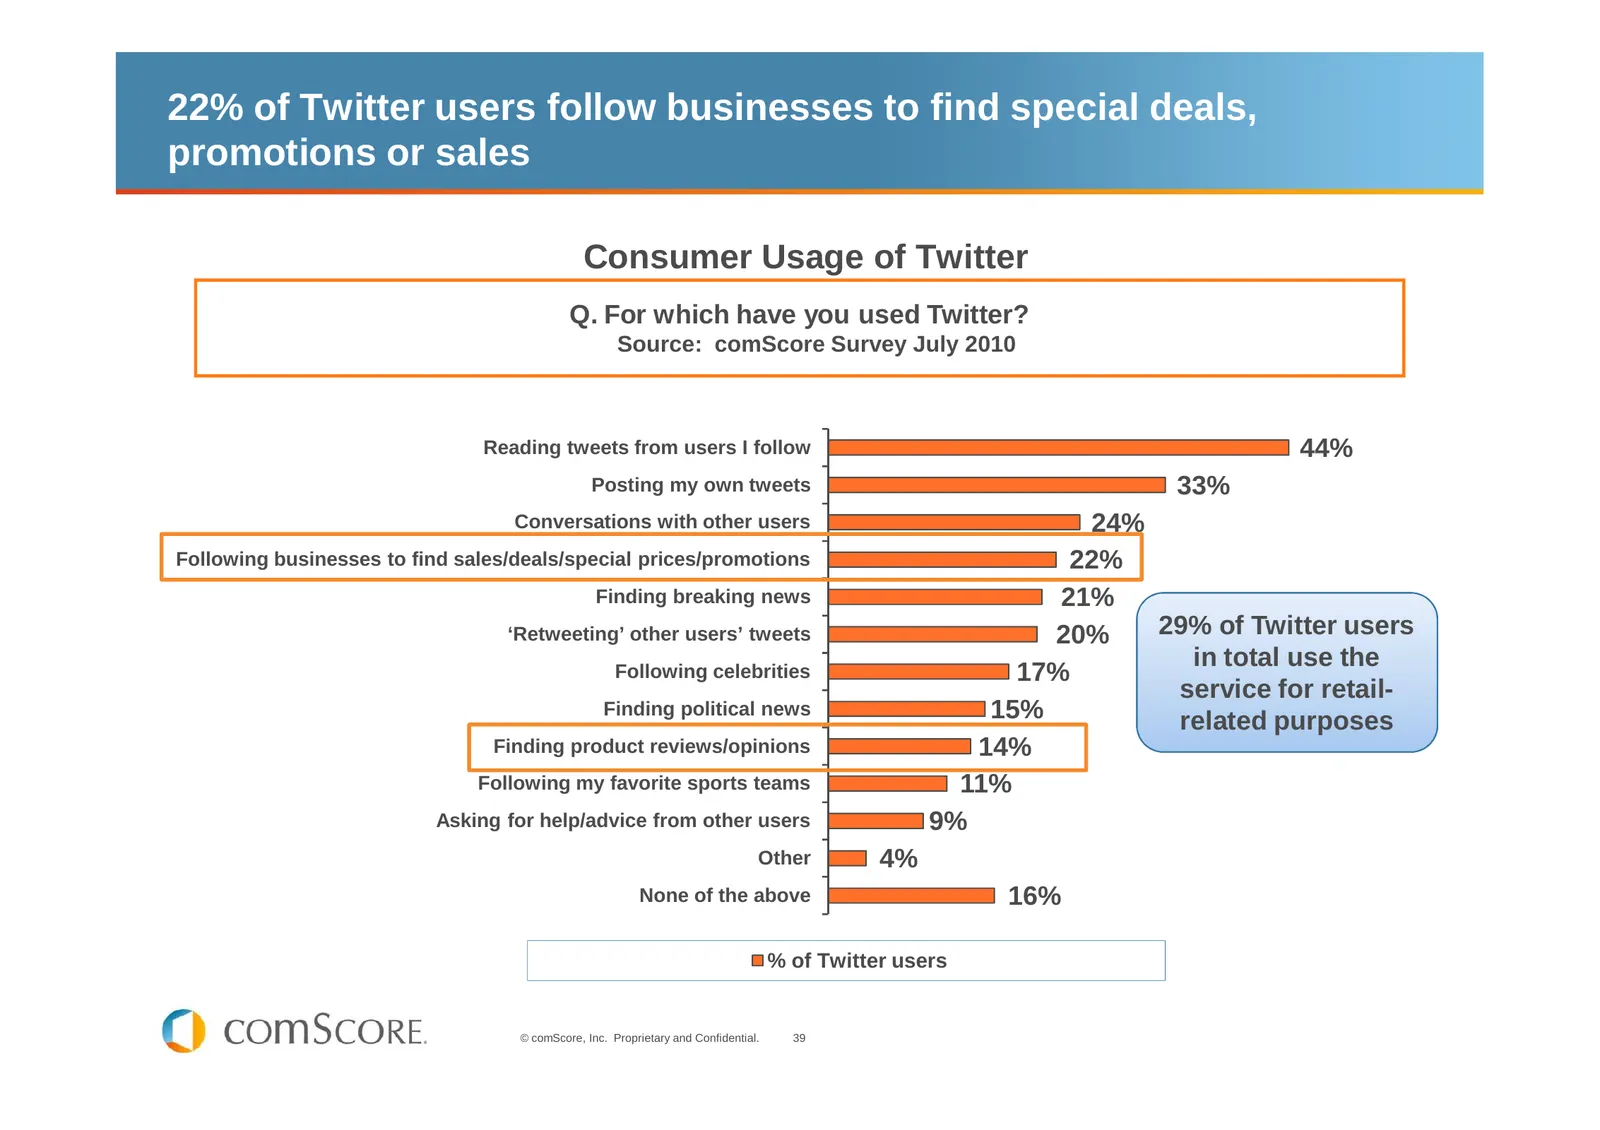
Slide 39: 22% of Twitter users follow businesses for deals
22% of Twitter users follow businesses to find special deals, promotions or sales Consumer Usage of Twitter Q. For which have you used Twitter? Source: comScore Survey July 2010 Reading tweets from users I follow 44% Posting my own tweets 33% Conversations with other users 24% Following businesses t
Slide 40: The Use of Video in Retail
The Use of Video in Retail © comScore, Inc. Proprietary and Confidential. 40
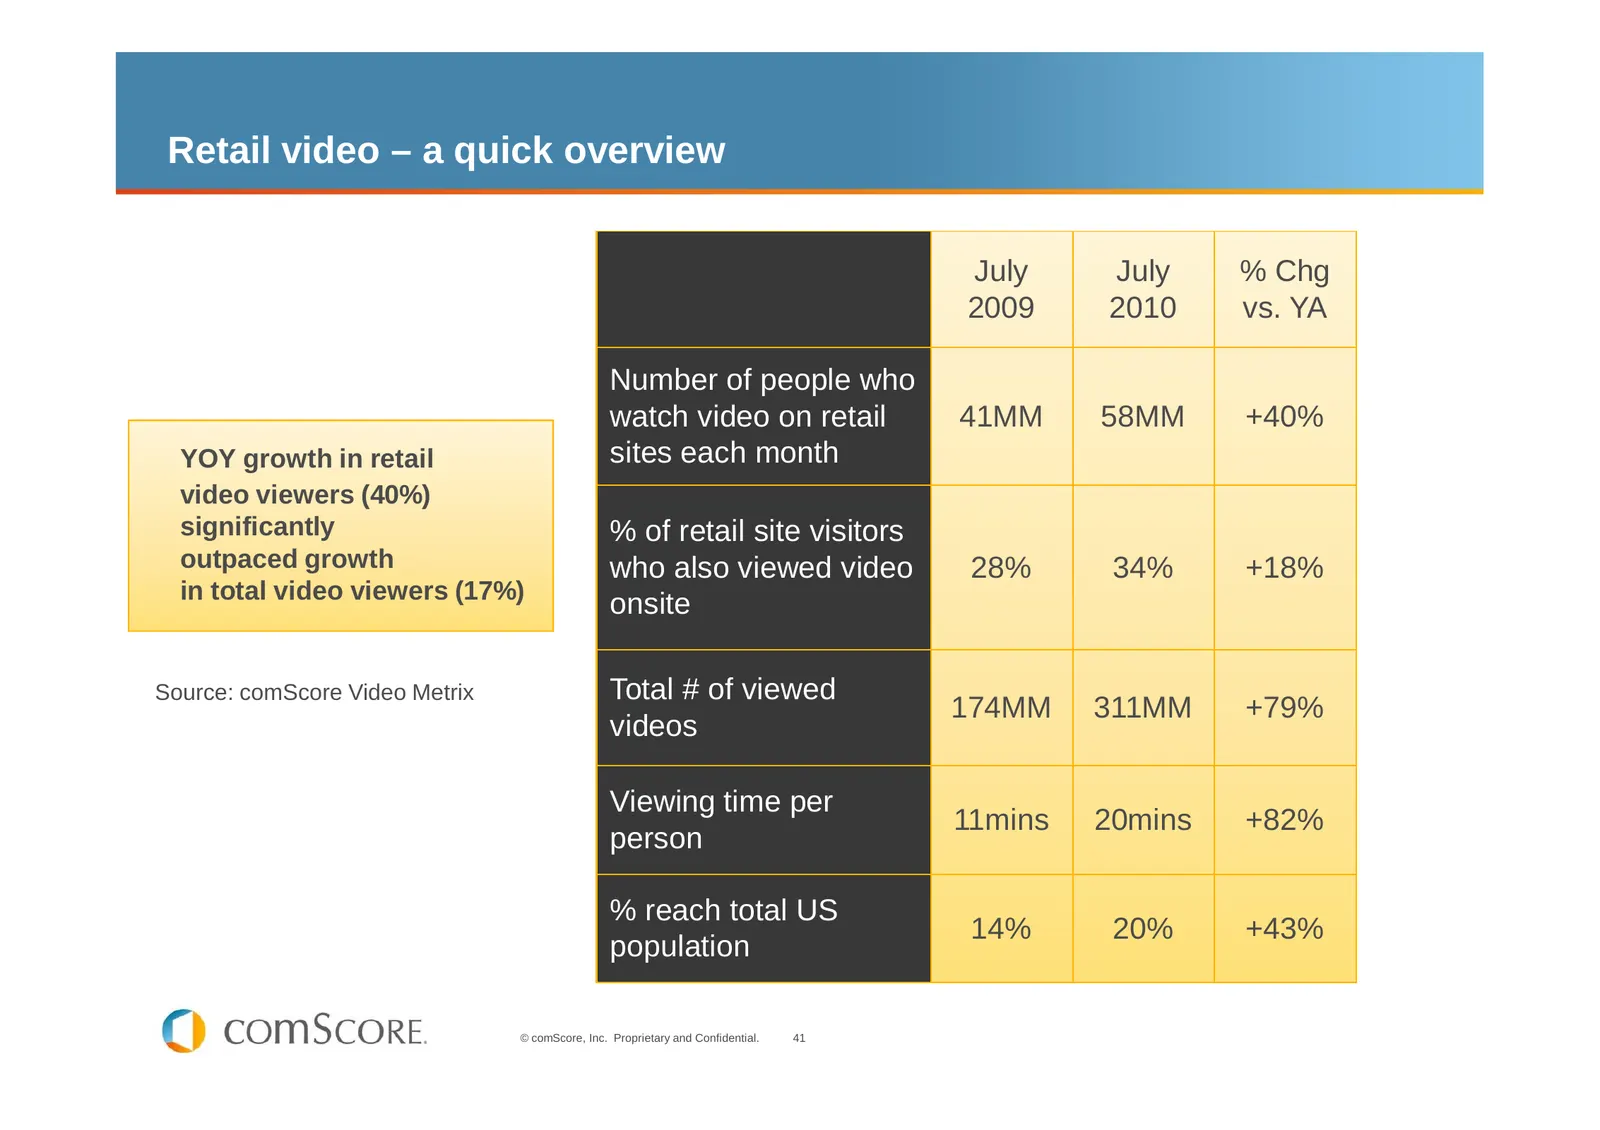
Slide 41: Retail video – a quick overview
Retail video – a quick overview July July % Chg 2009 2010 vs. YA Number of people who watch video on retail 41MM 58MM +40% YOY growth in retail sites each month video viewers (40%) significantly % of retail site visitors outpaced growth who also viewed video 28% 34% +18% in total video viewers (17%)
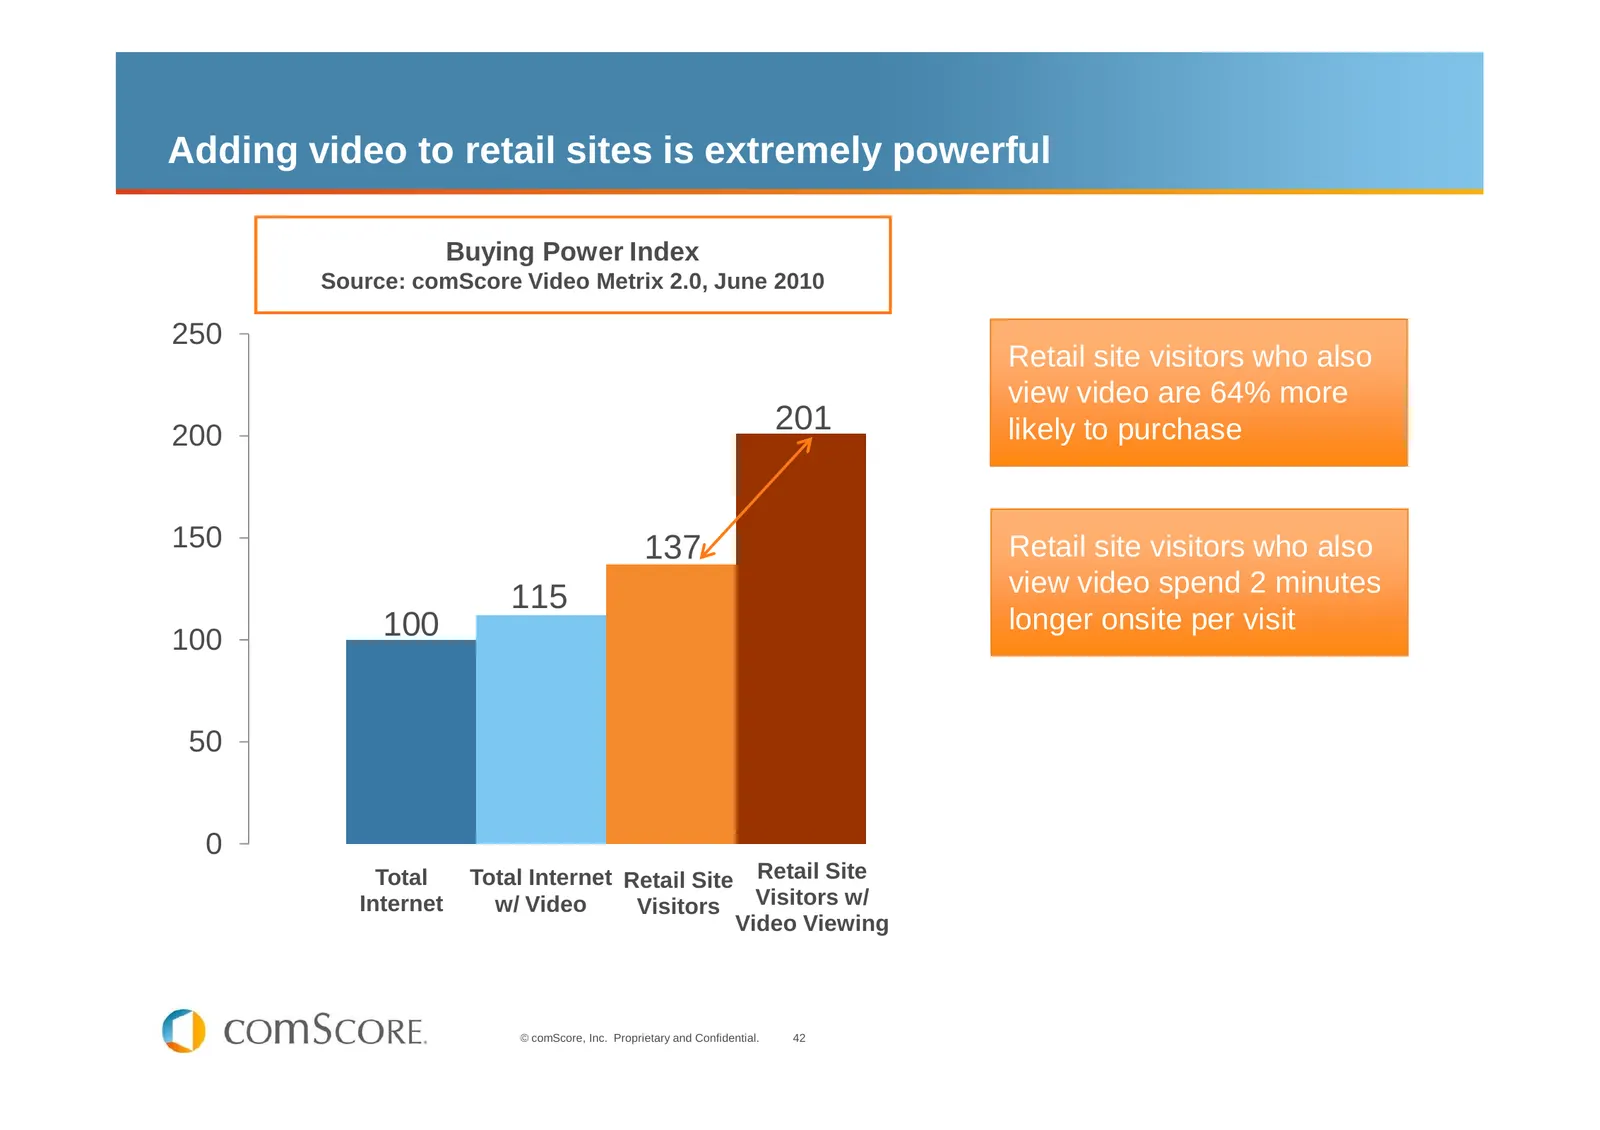
Slide 42: Adding video to retail sites is extremely powerful
Adding video to retail sites is extremely powerful Buying Power Index Source: comScore Video Metrix 2.0, June 2010 250 Retail site visitors who also view video are 64% more 200 201 likely to purchase 150 137 Retail site visitors who also view video spend 2 minutes 115 100 longer onsite per visit 100
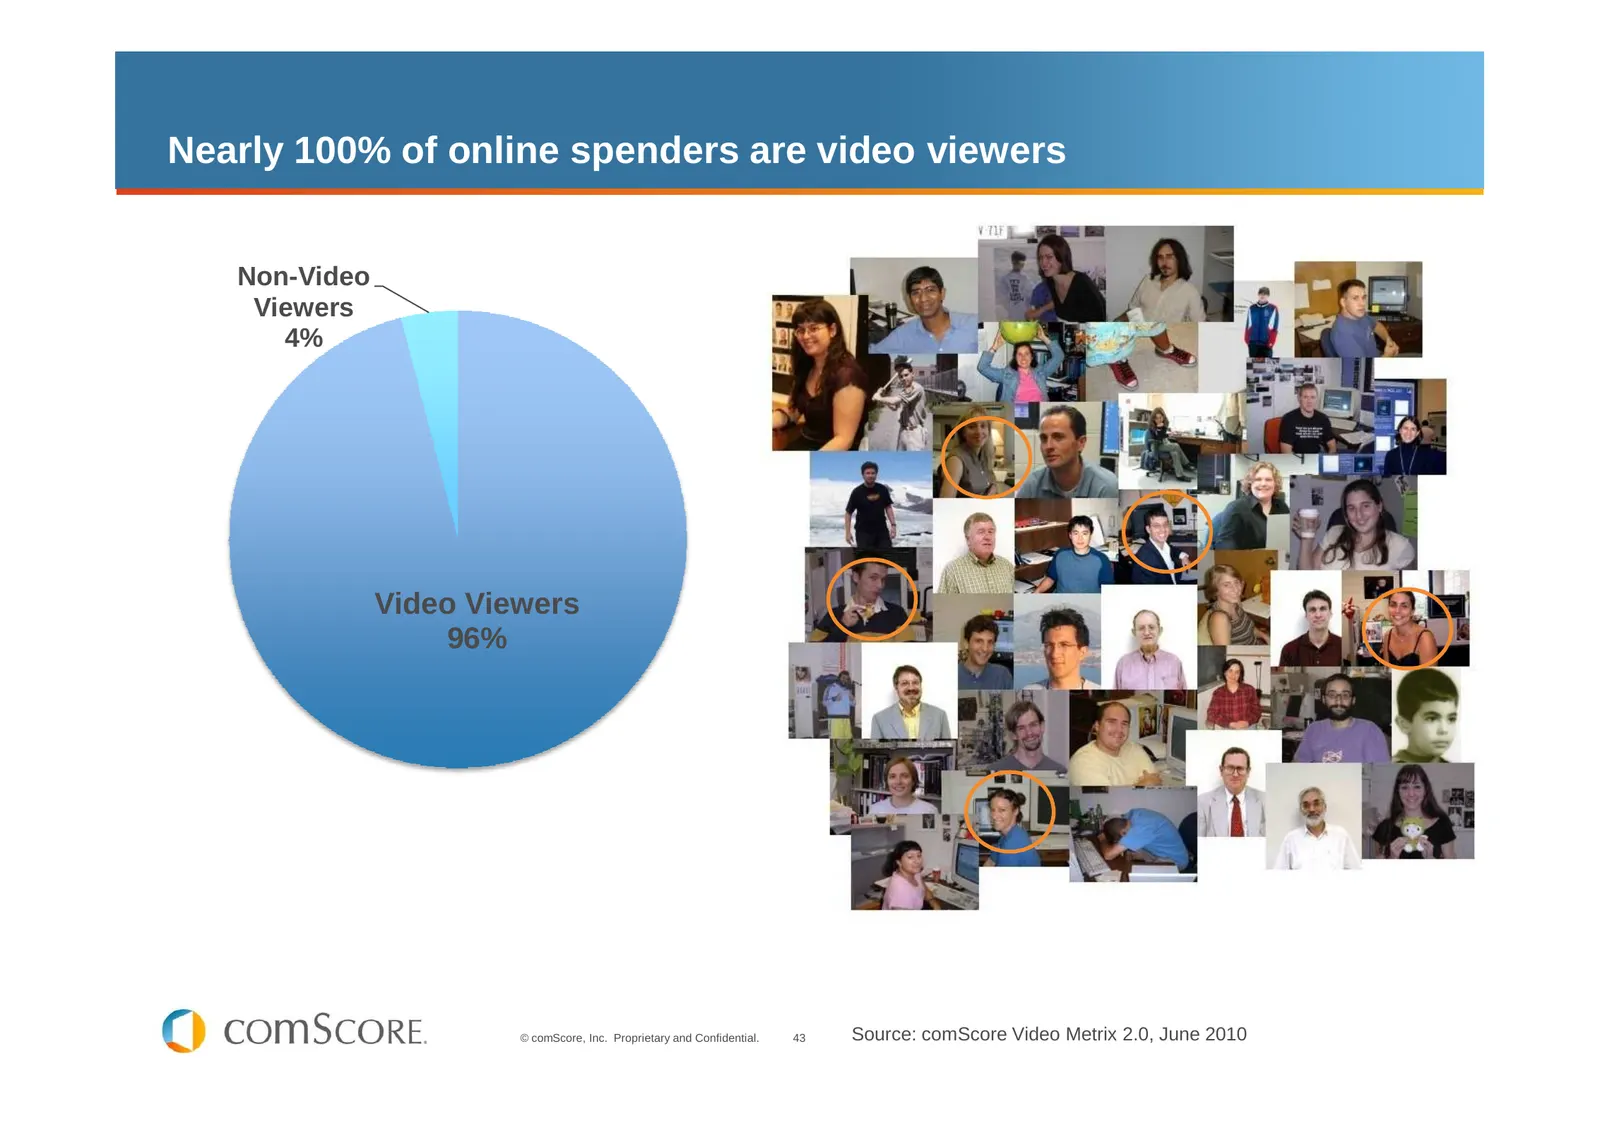
Slide 43: Nearly 100% of online spenders are video viewers
Nearly 100% of online spenders are video viewers Non-Video Viewers 4% Video Viewers 96% © comScore, Inc. Proprietary and Confidential. 43 Source: comScore Video Metrix 2.0, June 2010
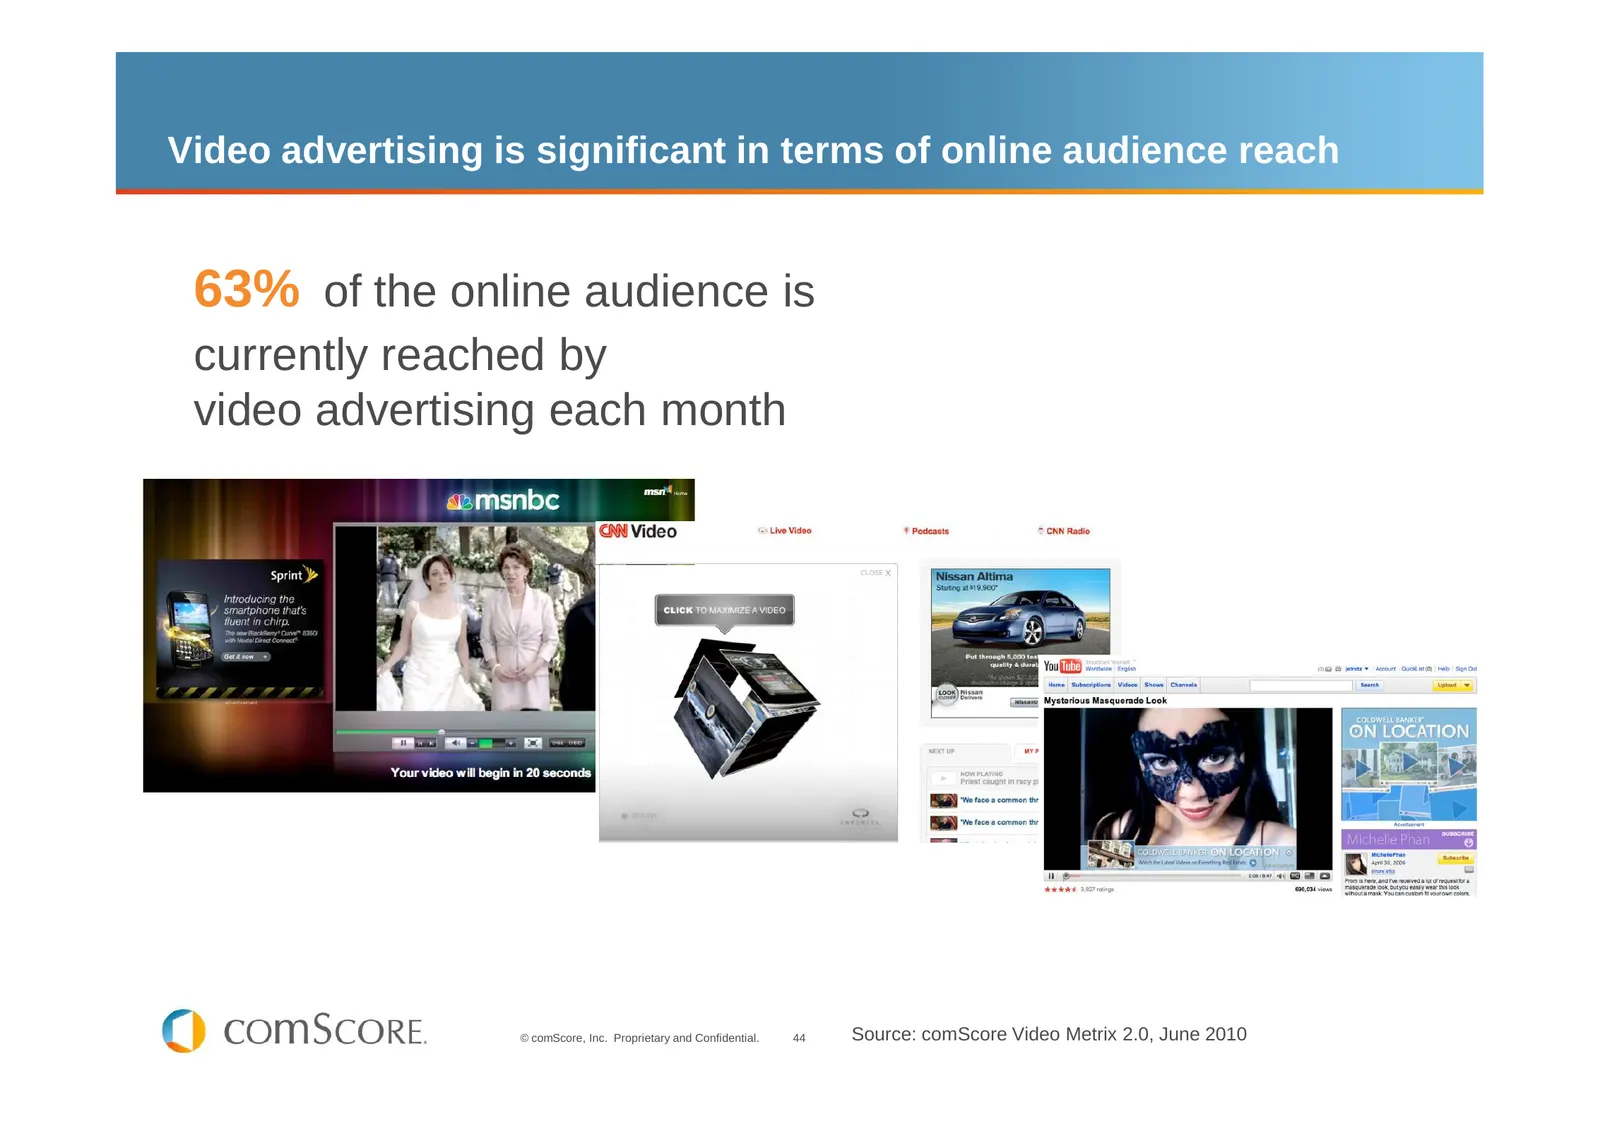
Slide 44: Video advertising reaches 63% of online audience
Video advertising is significant in terms of online audience reach 63% of the online audience is currently reached by video advertising each month 83% of all online spending comes from them © comScore, Inc. Proprietary and Confidential. 44 Source: comScore Video Metrix 2.0, June 2010
Slide 45: Video advertising is increasingly important in impact
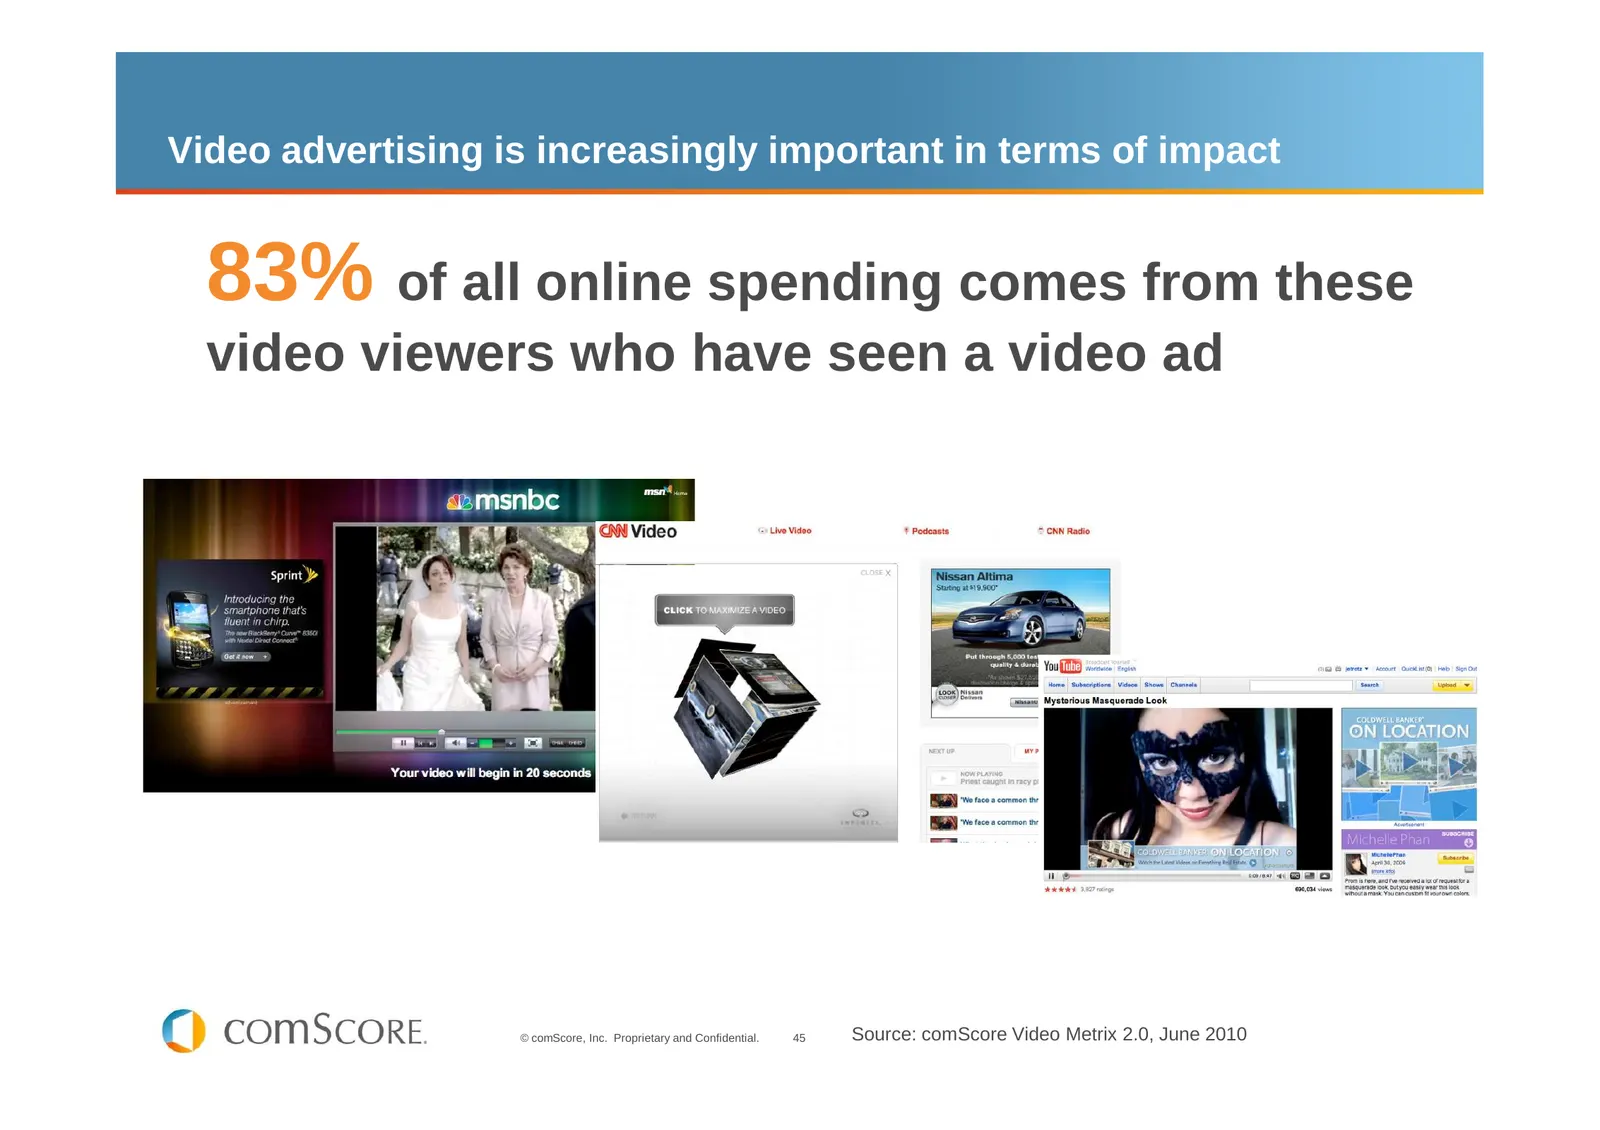
Video advertising is increasingly important in terms of impact 83% of all online spending comes from these video viewers who have seen a video ad © comScore, Inc. Proprietary and Confidential. 45 Source: comScore Video Metrix 2.0, June 2010
Slide 46: Video audiences differ for advertising and retail spending
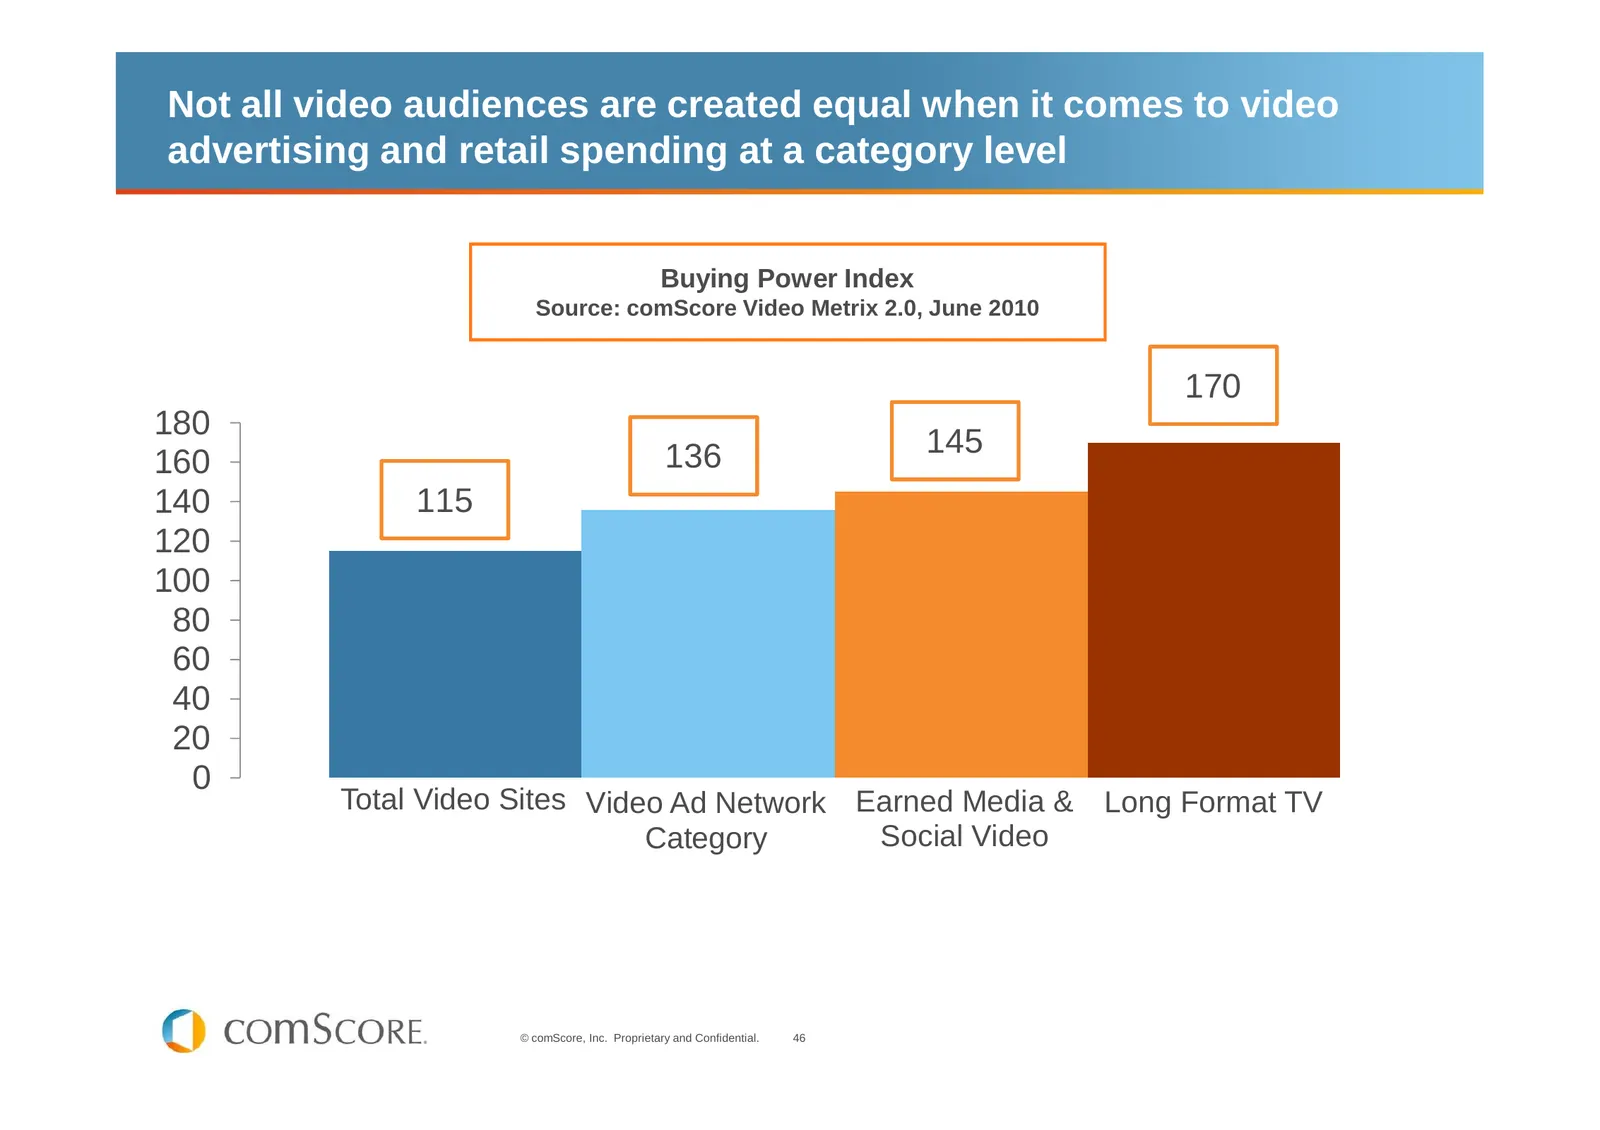
Not all video audiences are created equal when it comes to video advertising and retail spending at a category level Buying Power Index Source: comScore Video Metrix 2.0, June 2010 170 180 136 145 160 140 115 120 100 80 60 40 20 0 Total Video Sites Video Ad Network Earned Media & Long Format TV Cate
Slide 47: Tips for Retailers Considering Video
Tips for Retailers Considering Video For key products with important and detailed benefits, adding video to your site can encourage people to spend more time on your site and ultimately to make a purchase – Remember, almost all online spenders are video viewers and retail site visitors who view vide
Slide 48: comScore Holiday Season Retailer Report
comScore Holiday Season Retailer Report Track the performance of your site versus your competitors’ during the holiday season and get answers to important questions such as: How does my audience size and that of my competitors’ vary day to day throughout the holiday season? What are my peak traffic

Slide 49: Questions?
QUESTIONS? Please contact us at learnmore@comscore.com if you have any additional questions or comments. © comScore, Inc. Proprietary and Confidential. 49

Slide 50: Thank You!
Thank You! Note: A copy of this presentation will be sent to all attendees within 24 hours of today’s webinar. Want more insights? Follow us on Twitter! http://twitter.com/gfulgoni http://twitter.com/comscore
Source: Internet Archive copy of comscore.com
More decks from comScore, Inc.
 Q3 2026 Earnings Presentation17 slides · Nov 3, 2026
 Q2 2026 Earnings Presentation20 slides · Aug 12, 2026
 Investor Presentation (June 2026)27 slides · Jun 10, 2026
 Q4 2025 Earnings Presentation13 slides · Mar 17, 2026
 Q3 2025 Earnings Presentation15 slides · Nov 4, 2025
 Q2 2025 Earnings Presentation11 slides · Aug 5, 2025