Vodacom Group Limited · JSE:VOD
Vodacom — H1 2016 Earnings Presentation
21 slides from Vodacom's earnings presentation, Nov 6, 2015
Slide 1: Vodacom interim results presentation
06/11/2015 Vodacom interim results presentation for the six months ended 30 September 2015 Disclaimer The following presentation is being made only to, and is only directed at, persons to whom such presentations may lawfully be communicated (‘relevant persons’). Any person who is not a relevant pers
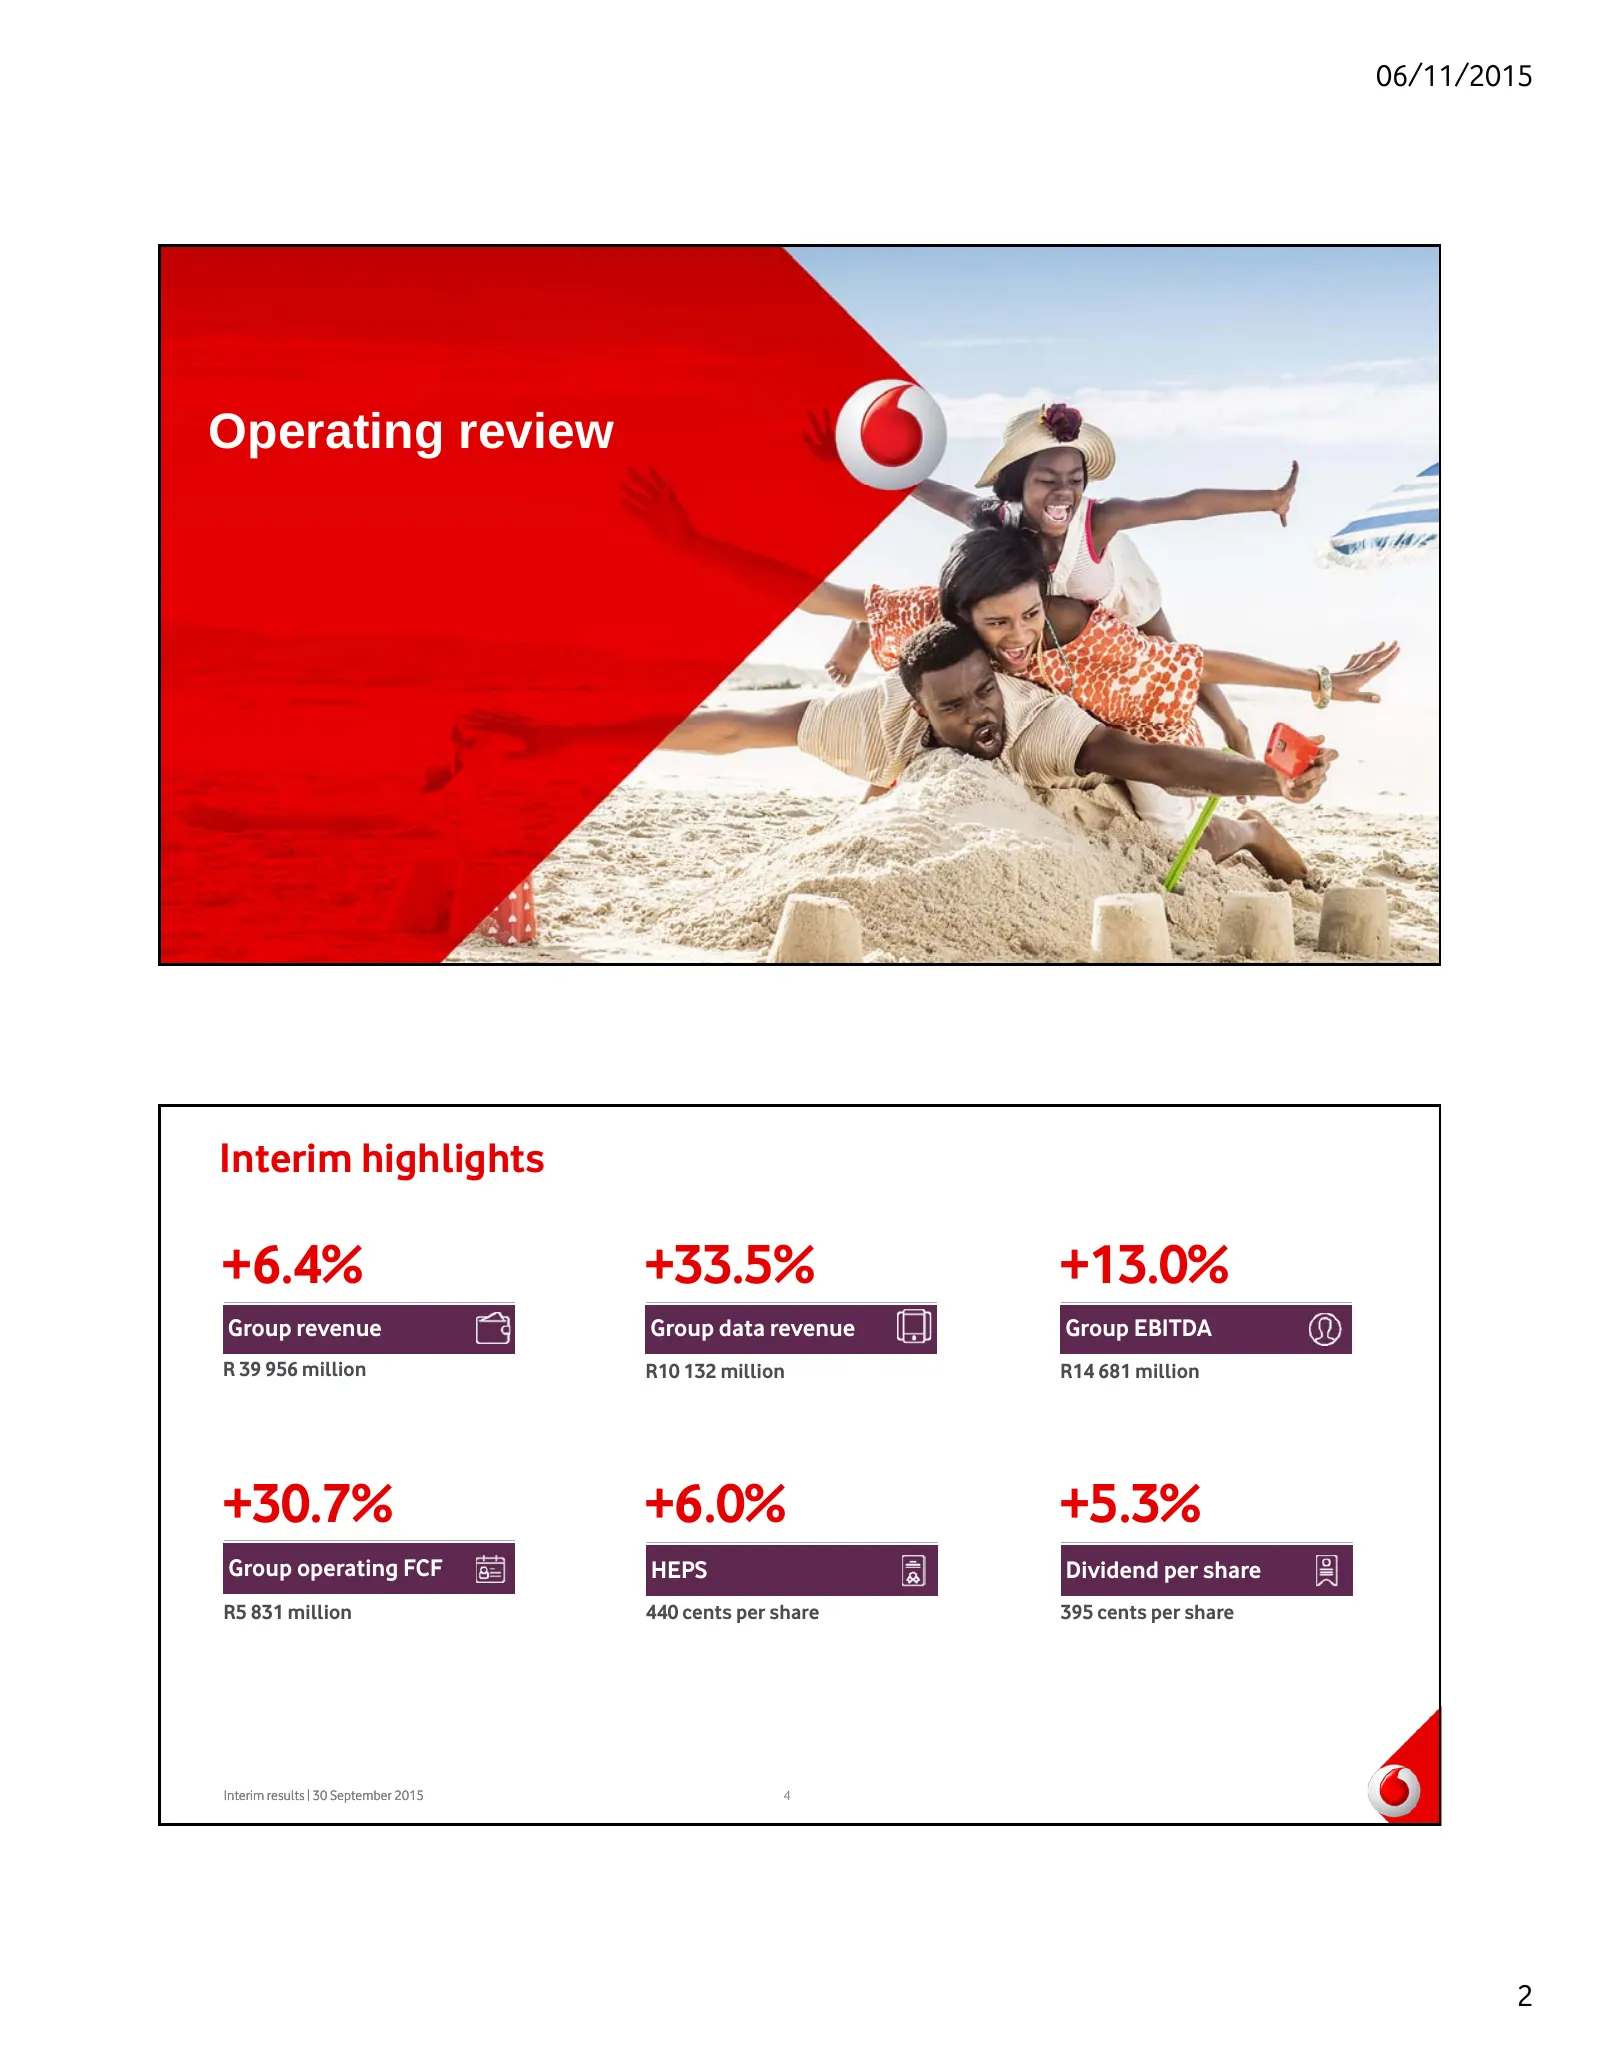
Slide 2: Interim highlights
06/11/2015 Operating review Interim highlights +6.4% +33.5% +13.0% Group revenue Group data revenue Group EBITDA R 39 956 million R10 132 million R14 681 million +30.7% +6.0% +5.3% Group operating FCF HEPS Dividend per share R5 831 million 440 cents per share 395 cents per share Interim results | 30
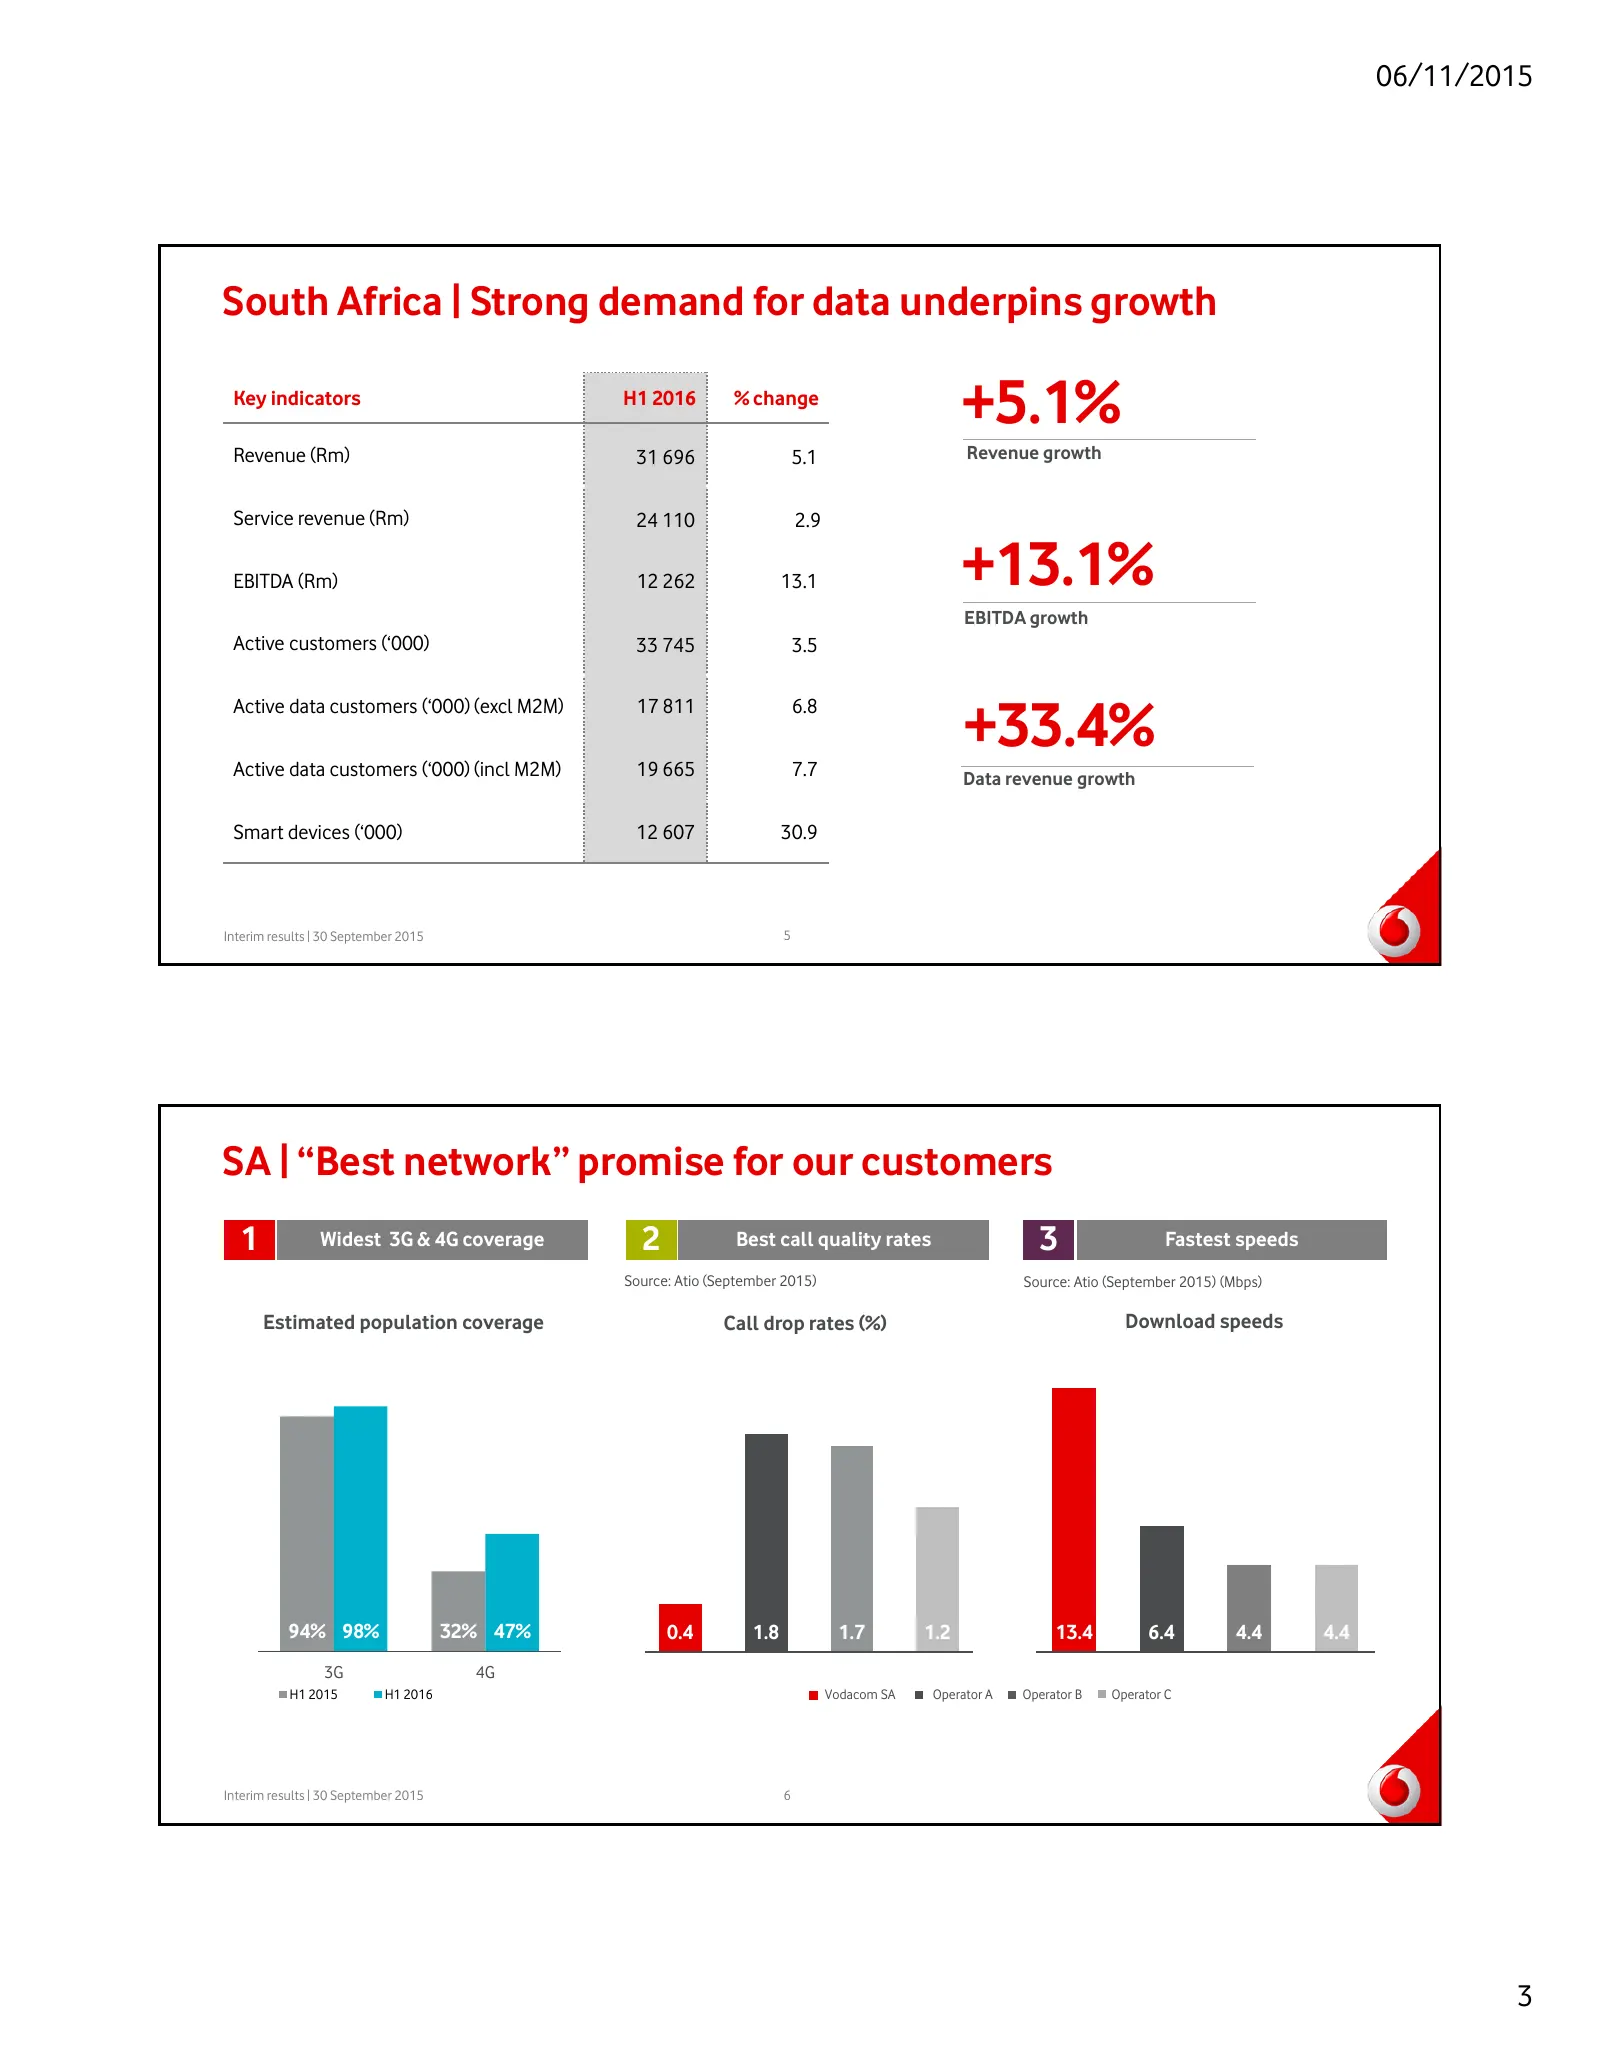
Slide 3: South Africa | Strong demand for data underpins growth
06/11/2015 South Africa | Strong demand for data underpins growth Key indicators H1 2016 % change +5.1% Revenue (Rm) 31 696 5.1 Revenue growth Service revenue (Rm) 24 110 2.9 EBITDA (Rm) 12 262 13.1 +13.1% EBITDA growth Active customers (‘000) 33 745 3.5 +33.4% Active data customers (‘000) (excl M2M
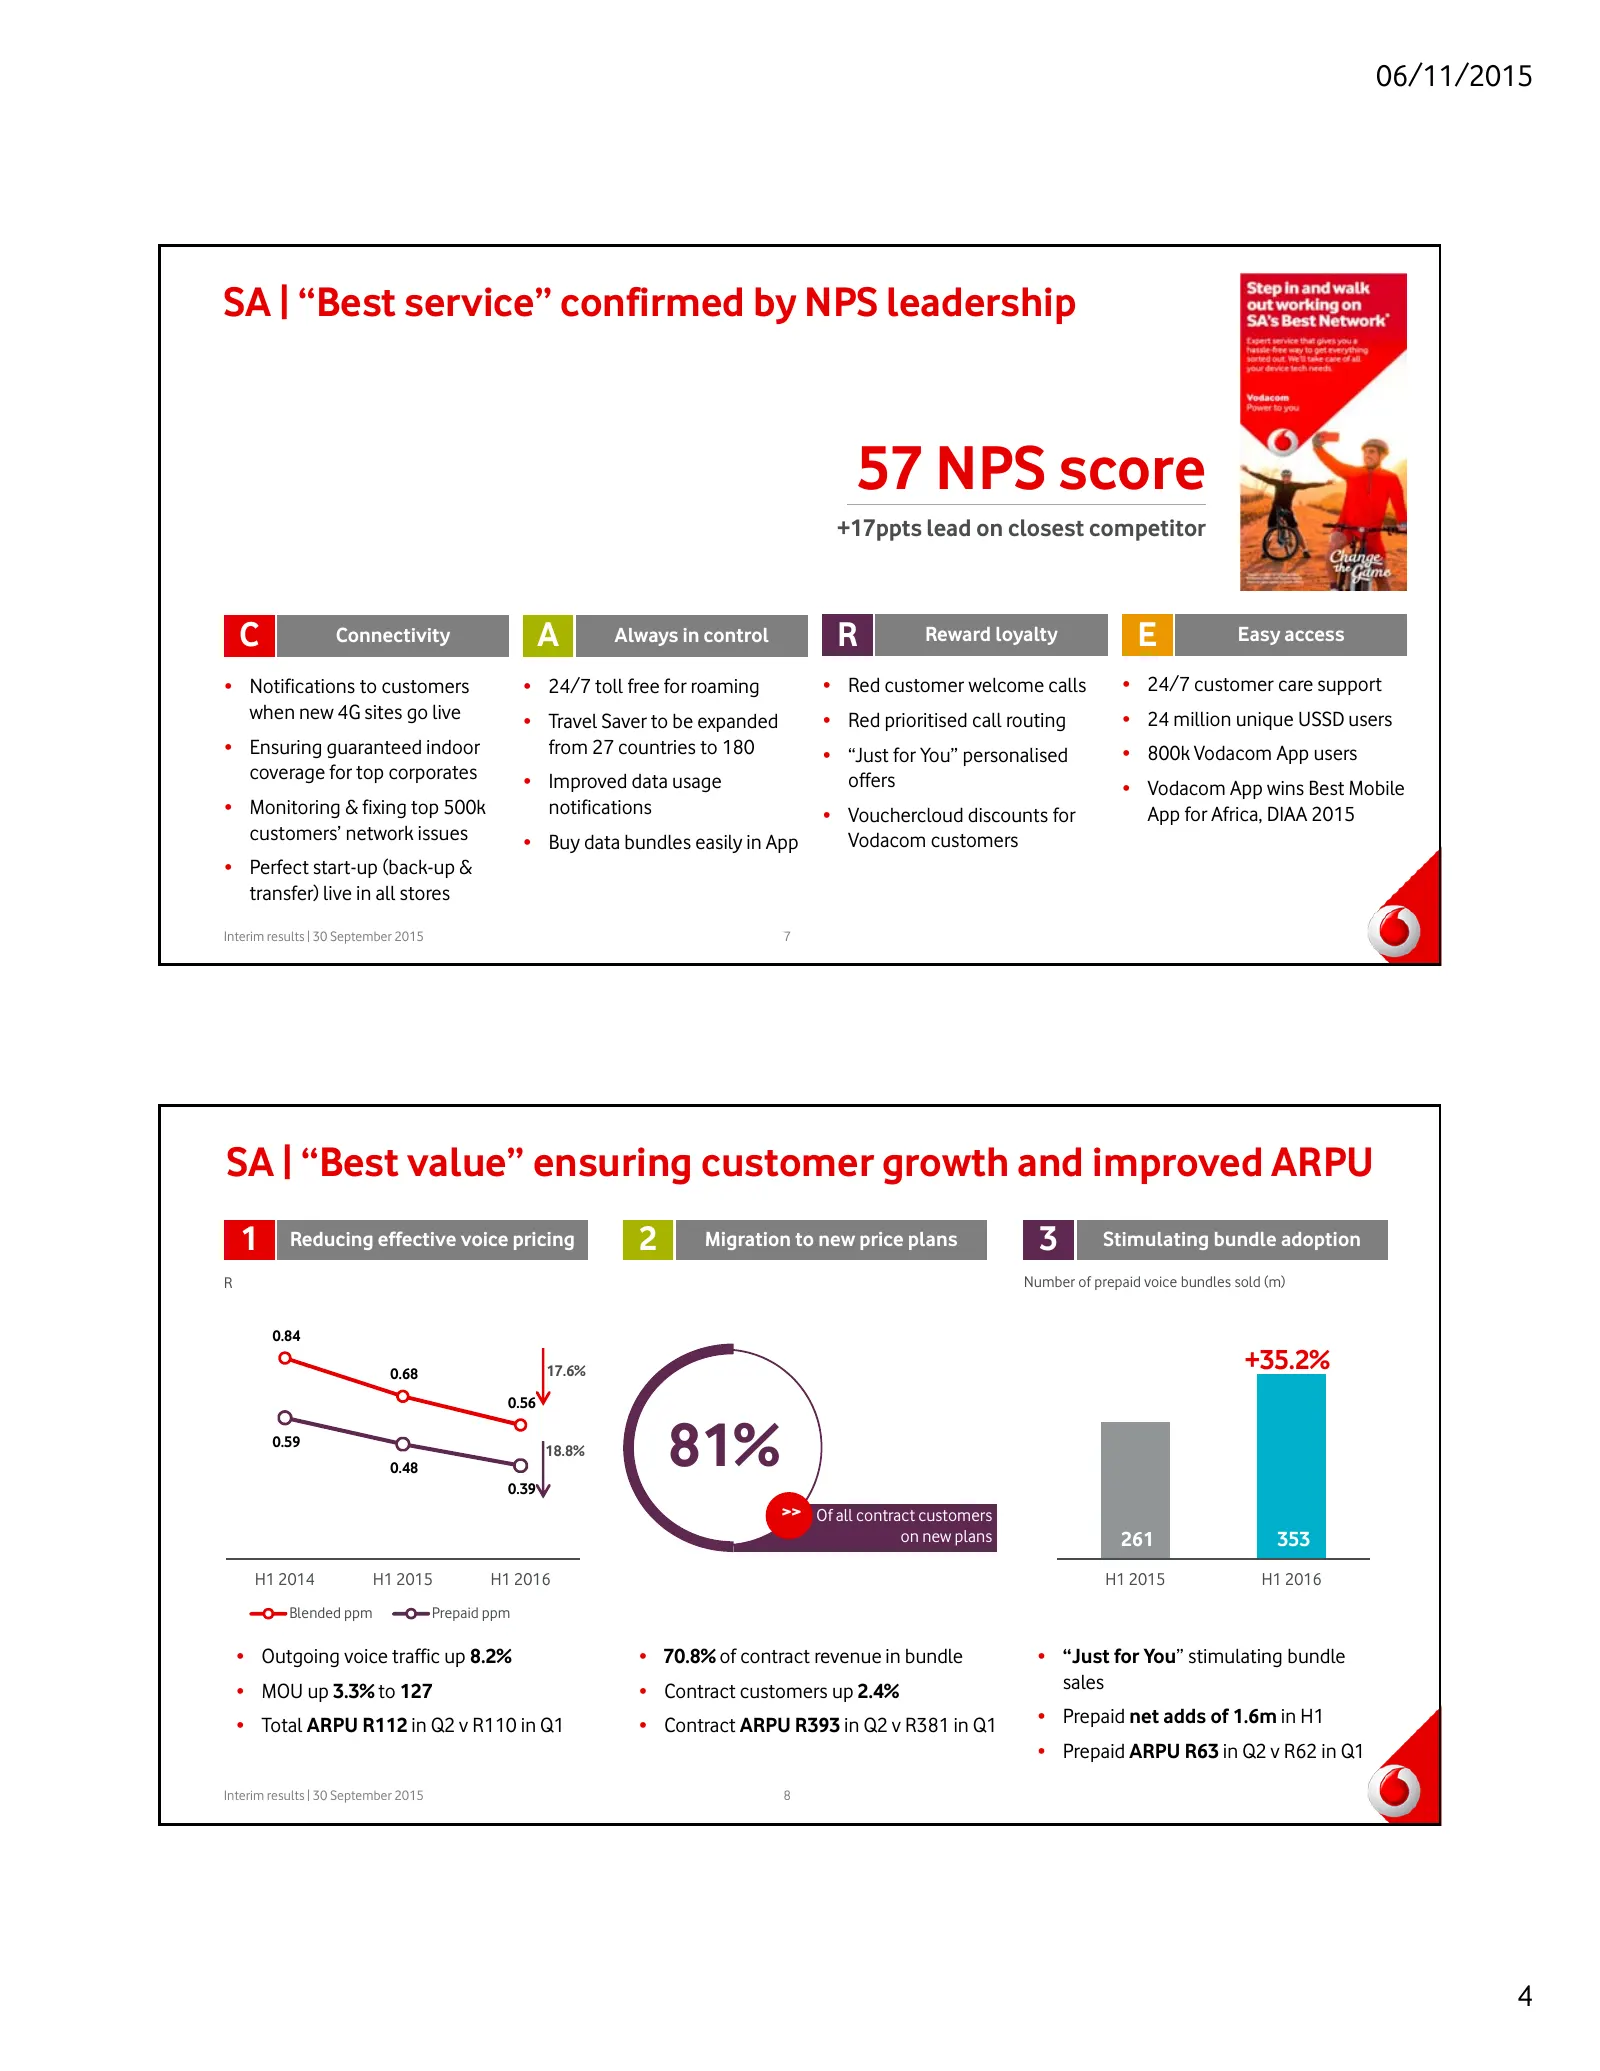
Slide 4: SA | Best service confirmed by NPS leadership
06/11/2015 SA | “Best service” confirmed by NPS leadership 57 NPS score +17ppts lead on closest competitor C Connectivity A Always in control R Reward loyalty E Easy access • Notifications to customers • 24/7 toll free for roaming • Red customer welcome calls • 24/7 customer care support when new 4G
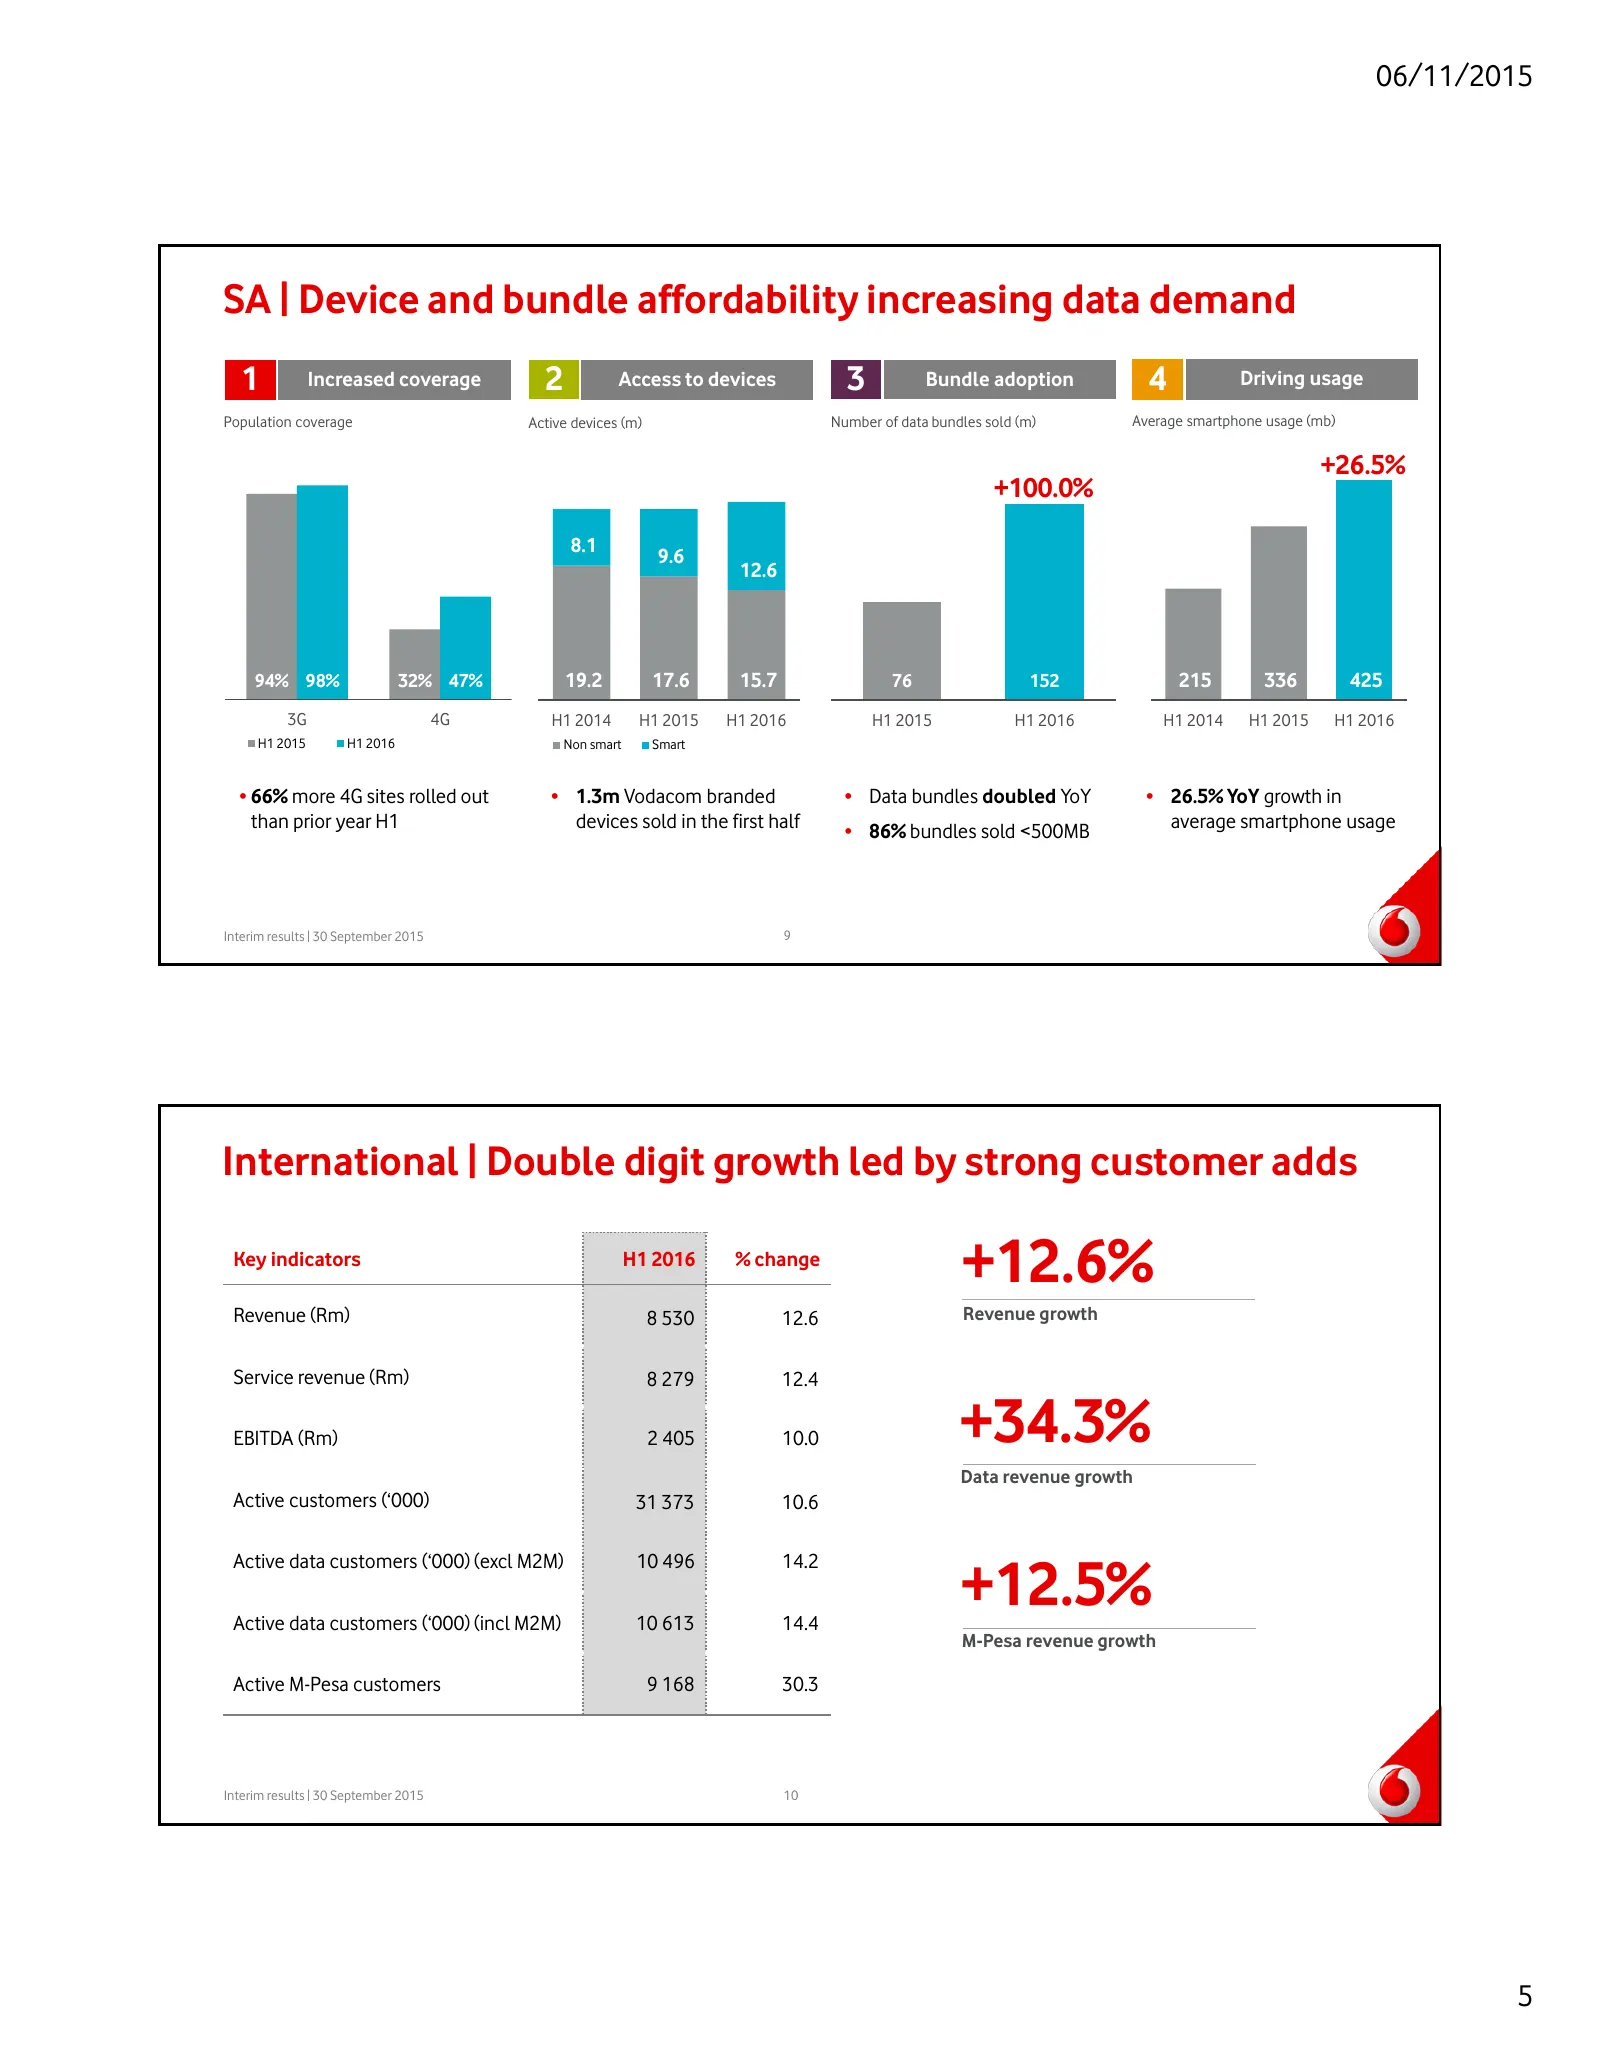
Slide 5: SA device and bundle affordability; International double digit growth
06/11/2015 SA | Device and bundle affordability increasing data demand 1 Increased coverage 2 Access to devices 3 Bundle adoption 4 Driving usage Population coverage Active devices (m) Number of data bundles sold (m) Average smartphone usage (mb) +26.5% +100.0% 8.1 9.6 12.6 94% 98% 32% 47% 19.2 17.6
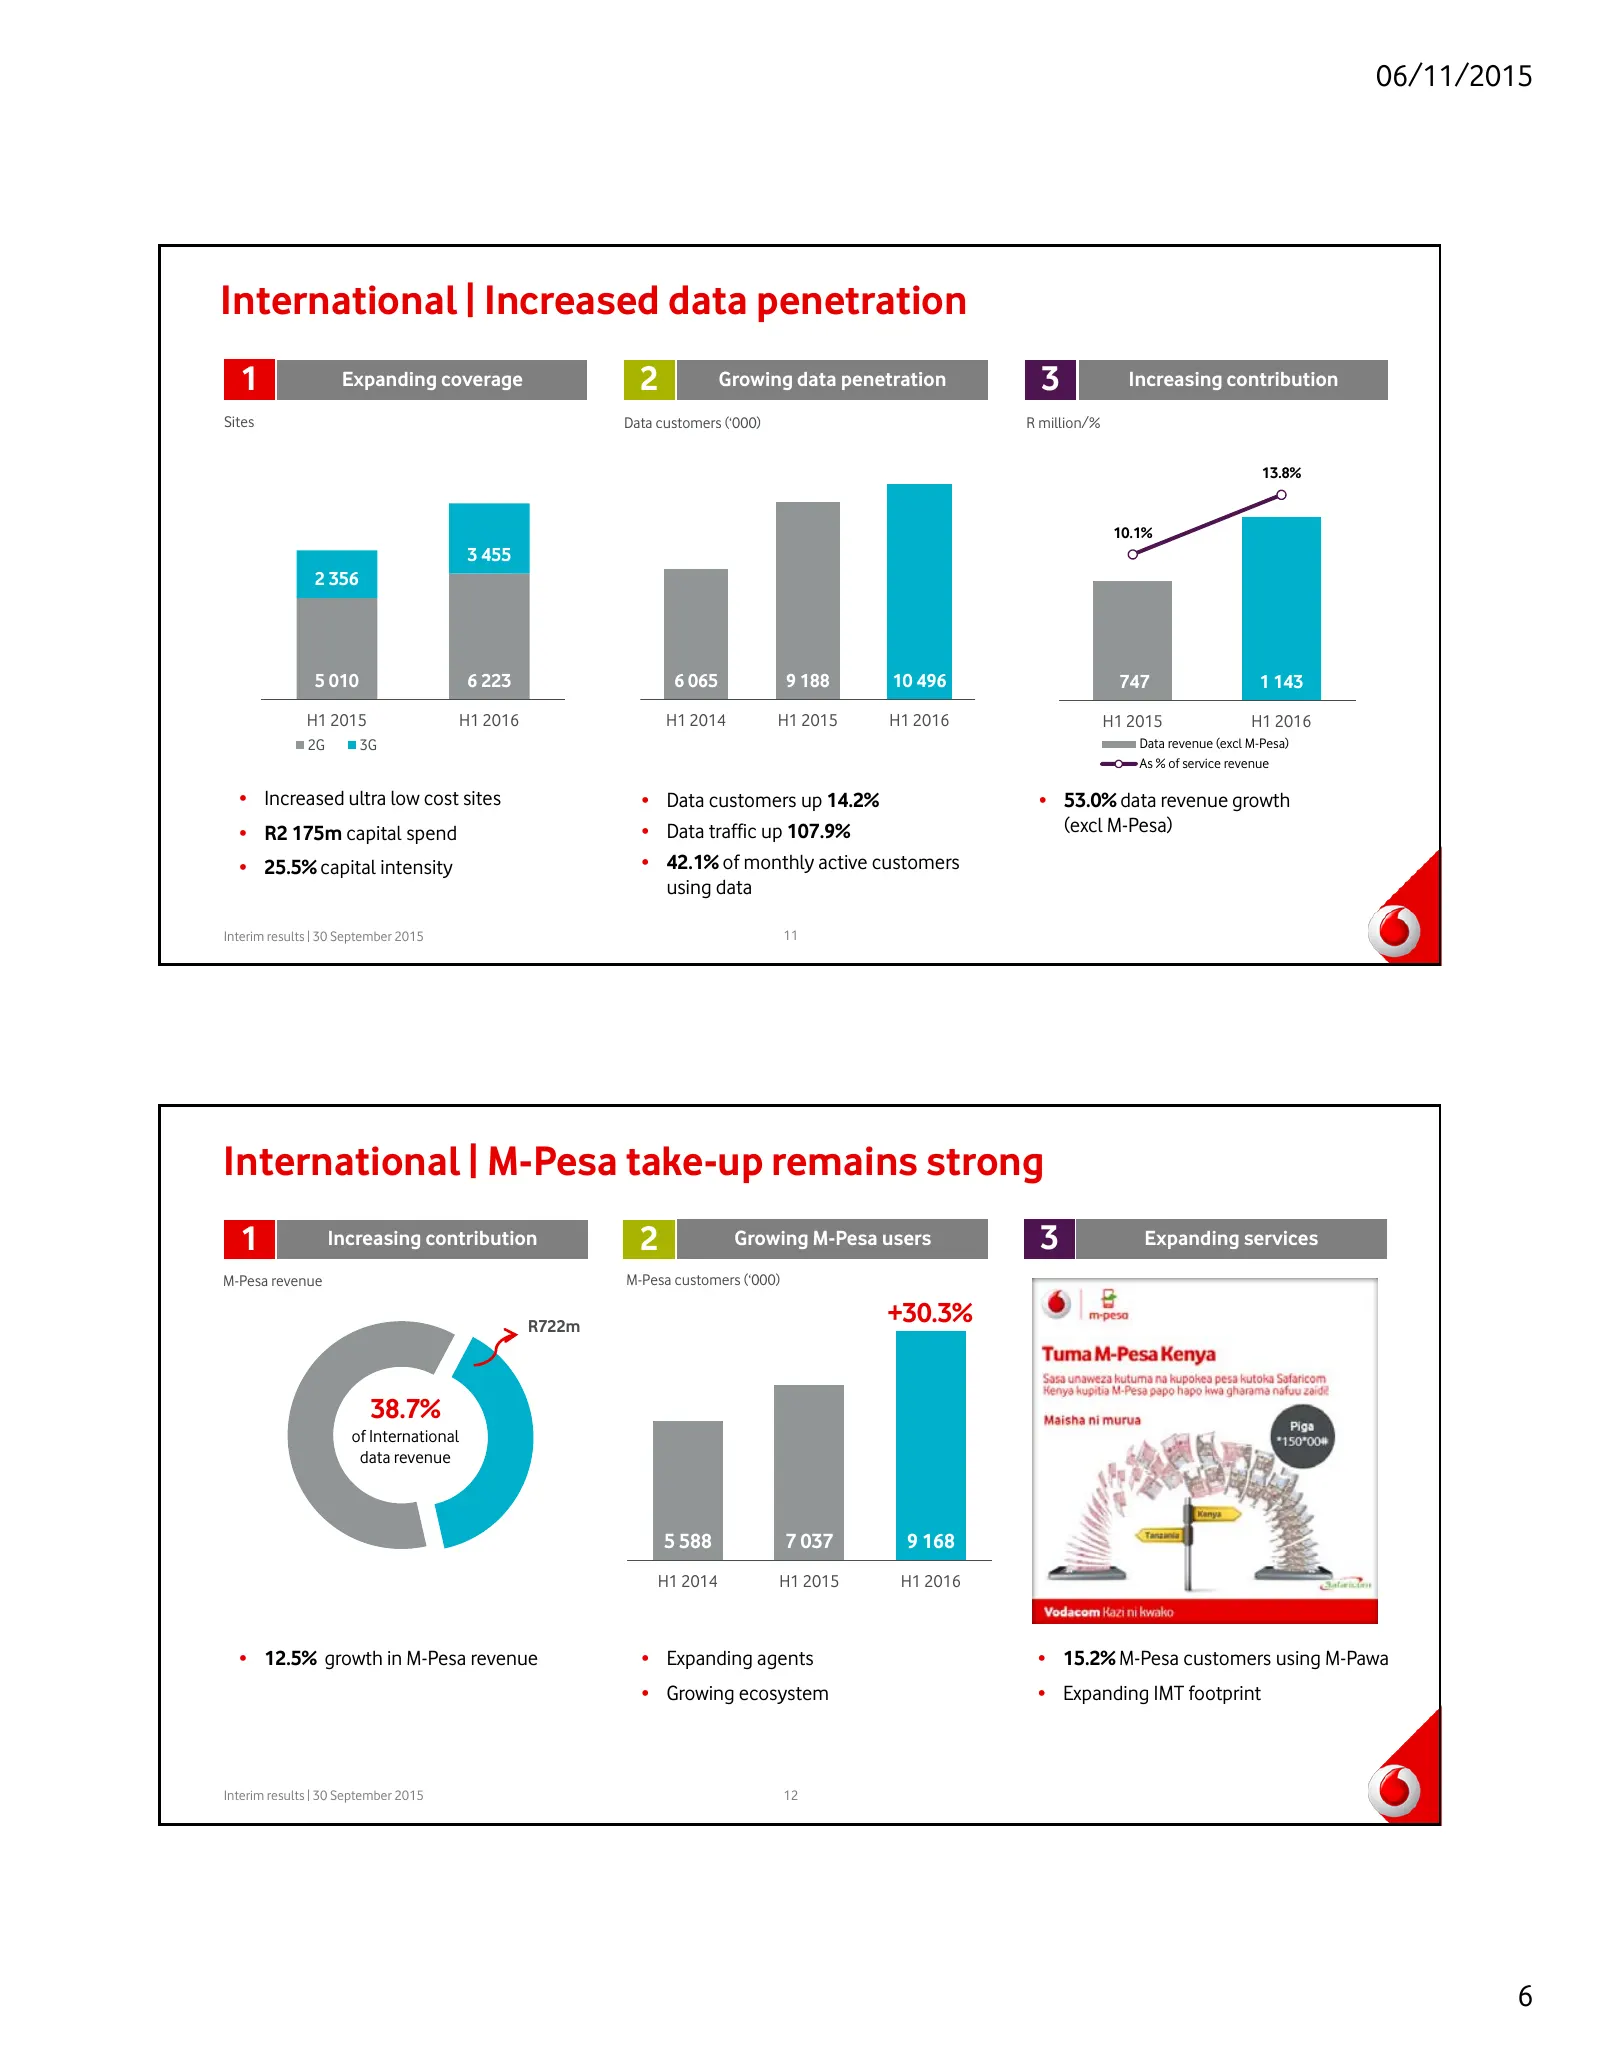
Slide 6: International | Increased data penetration; M-Pesa take-up
06/11/2015 International | Increased data penetration 1 Expanding coverage 2 Growing data penetration 3 Increasing contribution Sites Data customers (‘000) R million/% 13.8% 10.1% 3 455 2 356 5 010 6 223 6 065 9 188 10 496 747 1 143 H1 2015 H1 2016 H1 2014 H1 2015 H1 2016 H1 2015 H1 2016 2G 3G Data
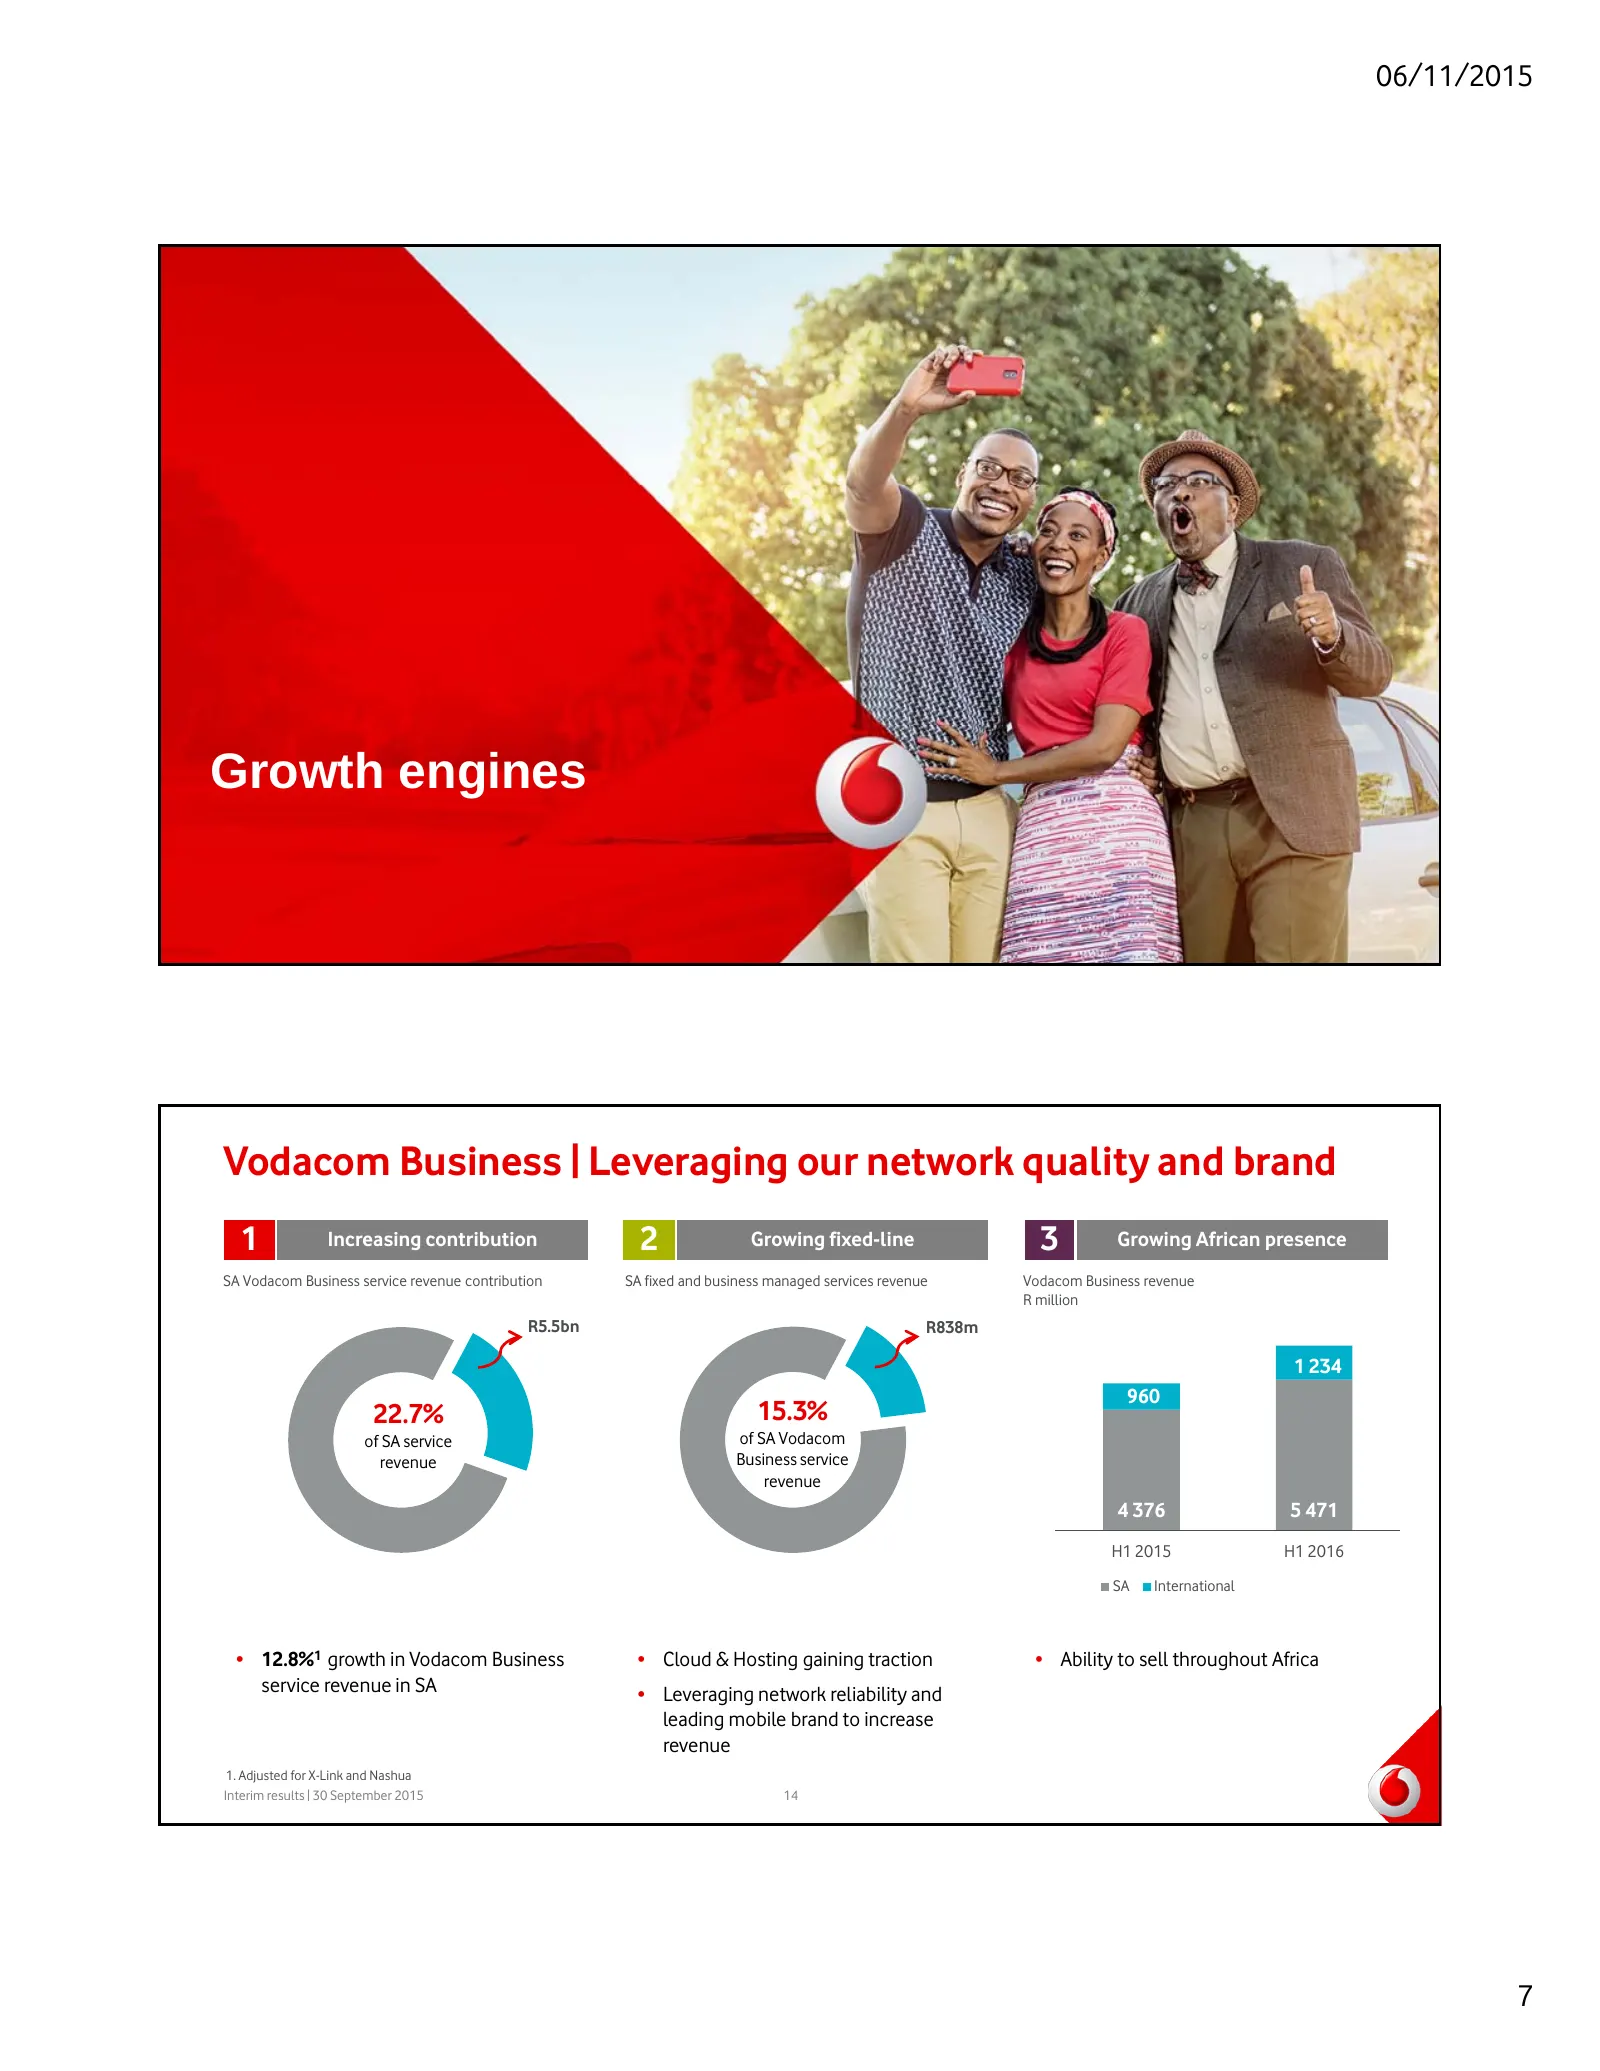
Slide 7: Vodacom Business | Leveraging our network quality and brand
06/11/2015 Growth engines Vodacom Business | Leveraging our network quality and brand 1 Increasing contribution 2 Growing fixed-line 3 Growing African presence SA Vodacom Business service revenue contribution SA fixed and business managed services revenue Vodacom Business revenue R million R5.5bn R8
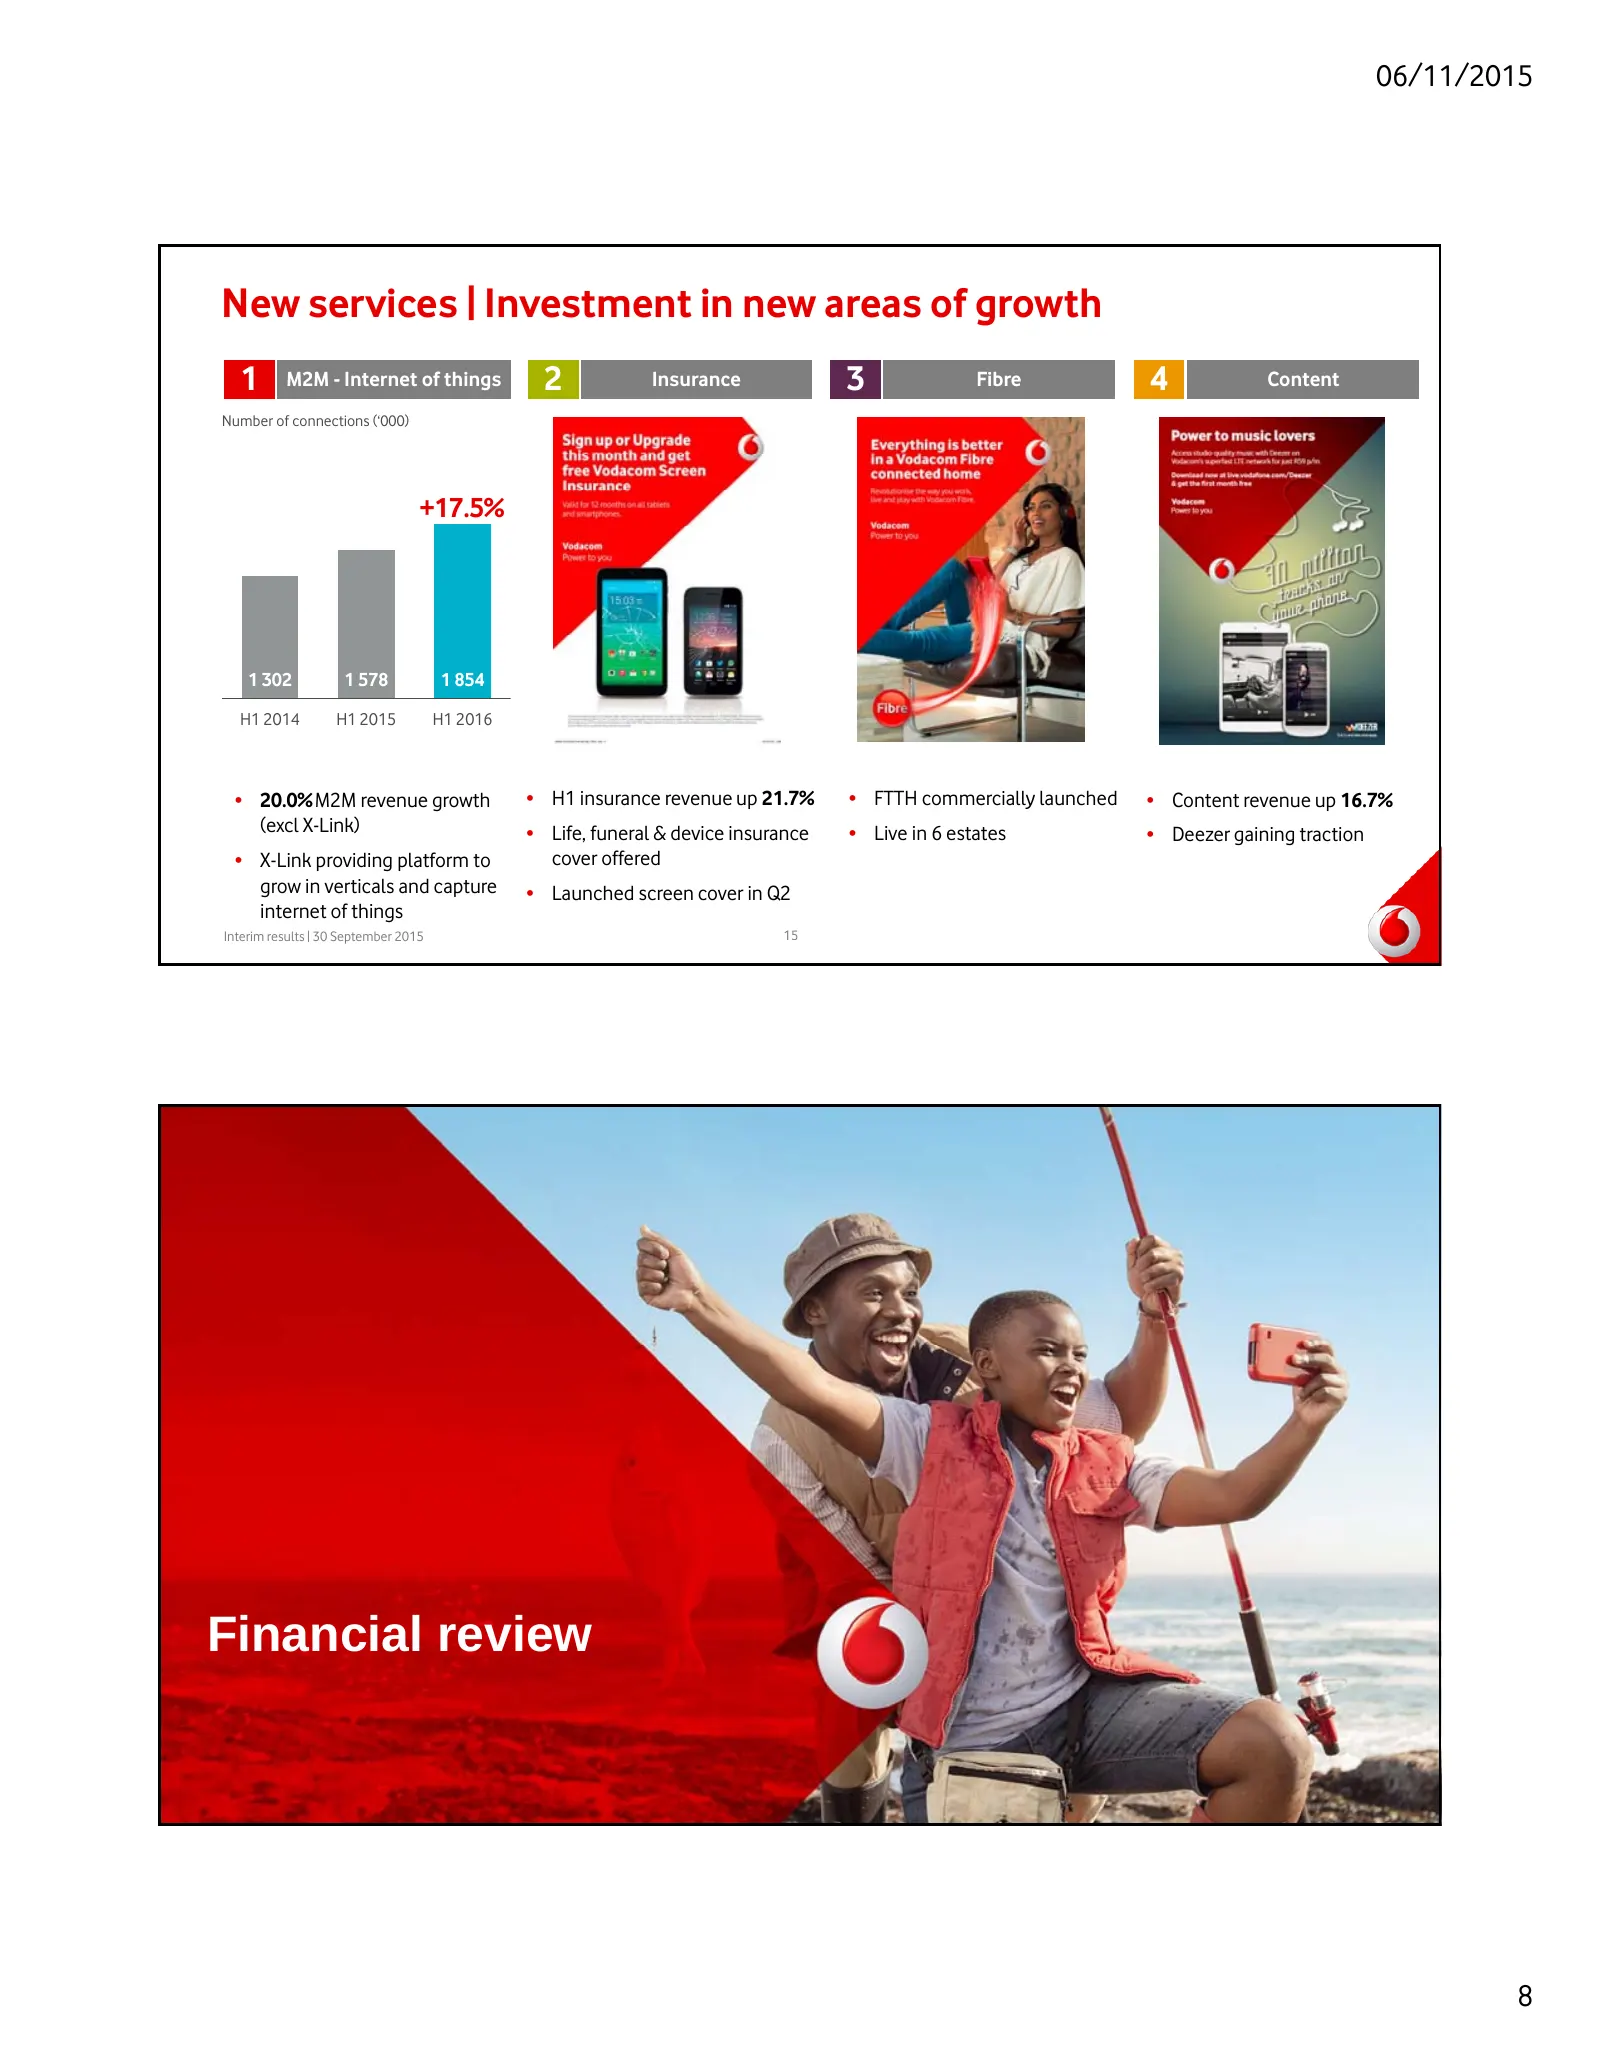
Slide 8: New services | Investment in new areas of growth
06/11/2015 New services | Investment in new areas of growth 1 M2M - Internet of things 2 Insurance 3 Fibre 4 Content Number of connections (‘000) +17.5% 1 302 1 578 1 854 H1 2014 H1 2015 H1 2016 • 20.0% M2M revenue growth • H1 insurance revenue up 21.7% • FTTH commercially launched • Content revenue
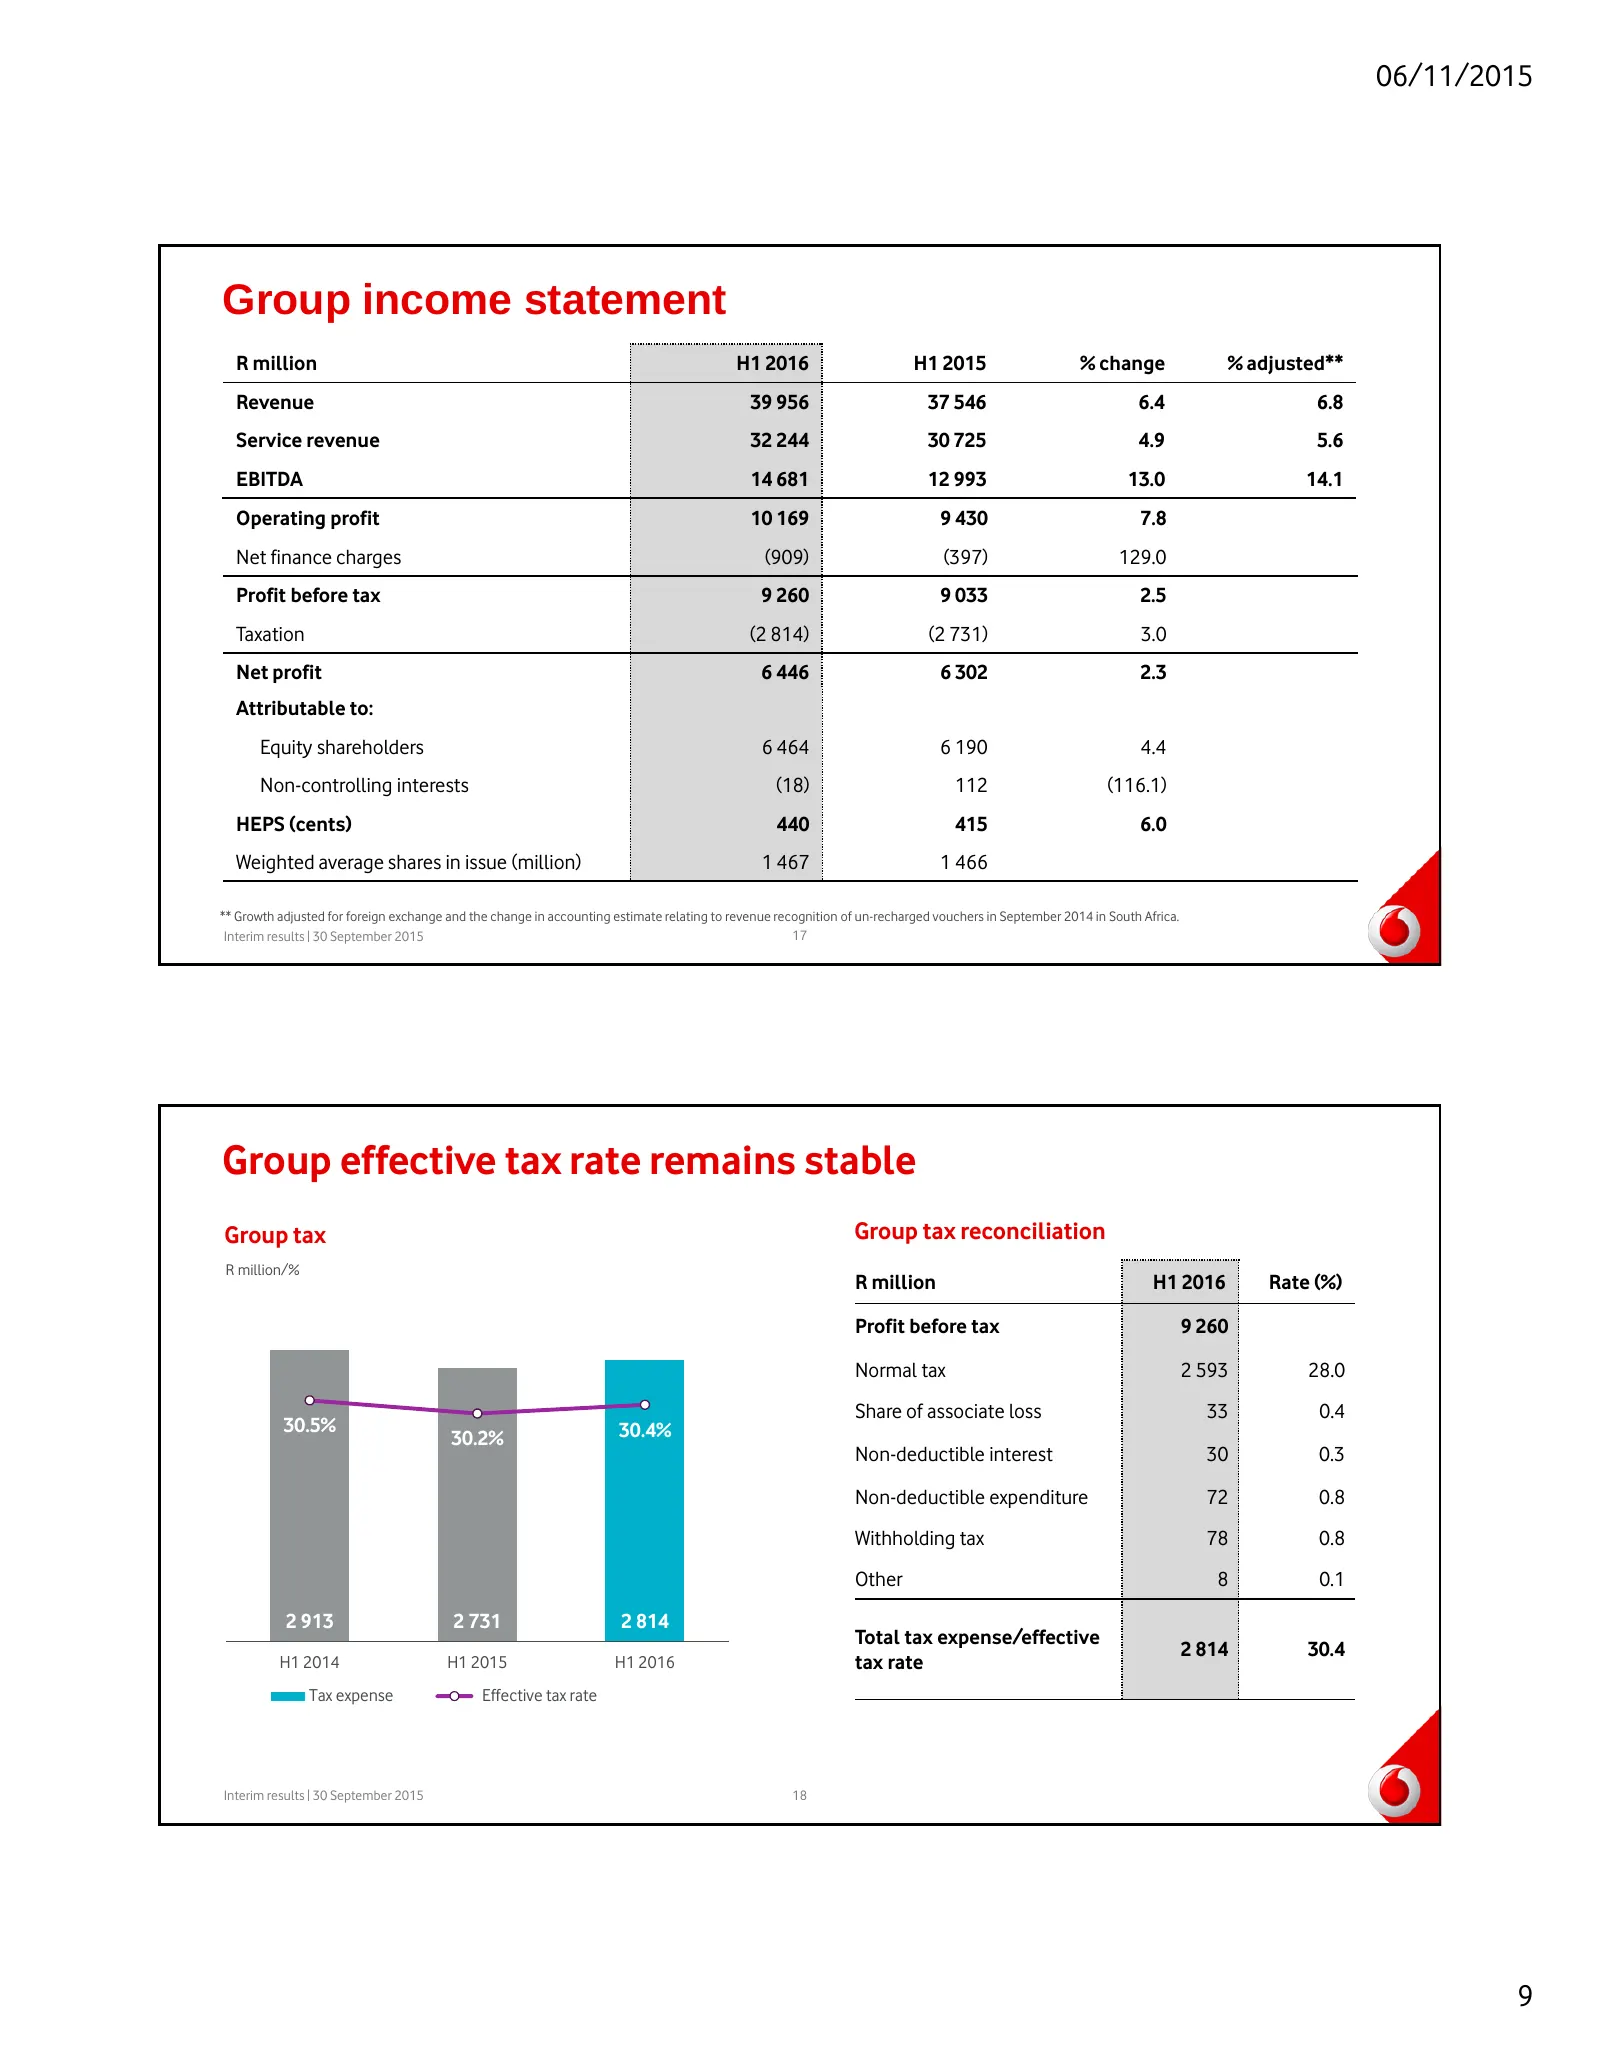
Slide 9: Group income statement and effective tax rate
06/11/2015 Group income statement R million H1 2016 H1 2015 % change % adjusted** Revenue 39 956 37 546 6.4 6.8 Service revenue 32 244 30 725 4.9 5.6 EBITDA 14 681 12 993 13.0 14.1 Operating profit 10 169 9 430 7.8 Net finance charges (909) (397) 129.0 Profit before tax 9 260 9 033 2.5 Taxation (2 8
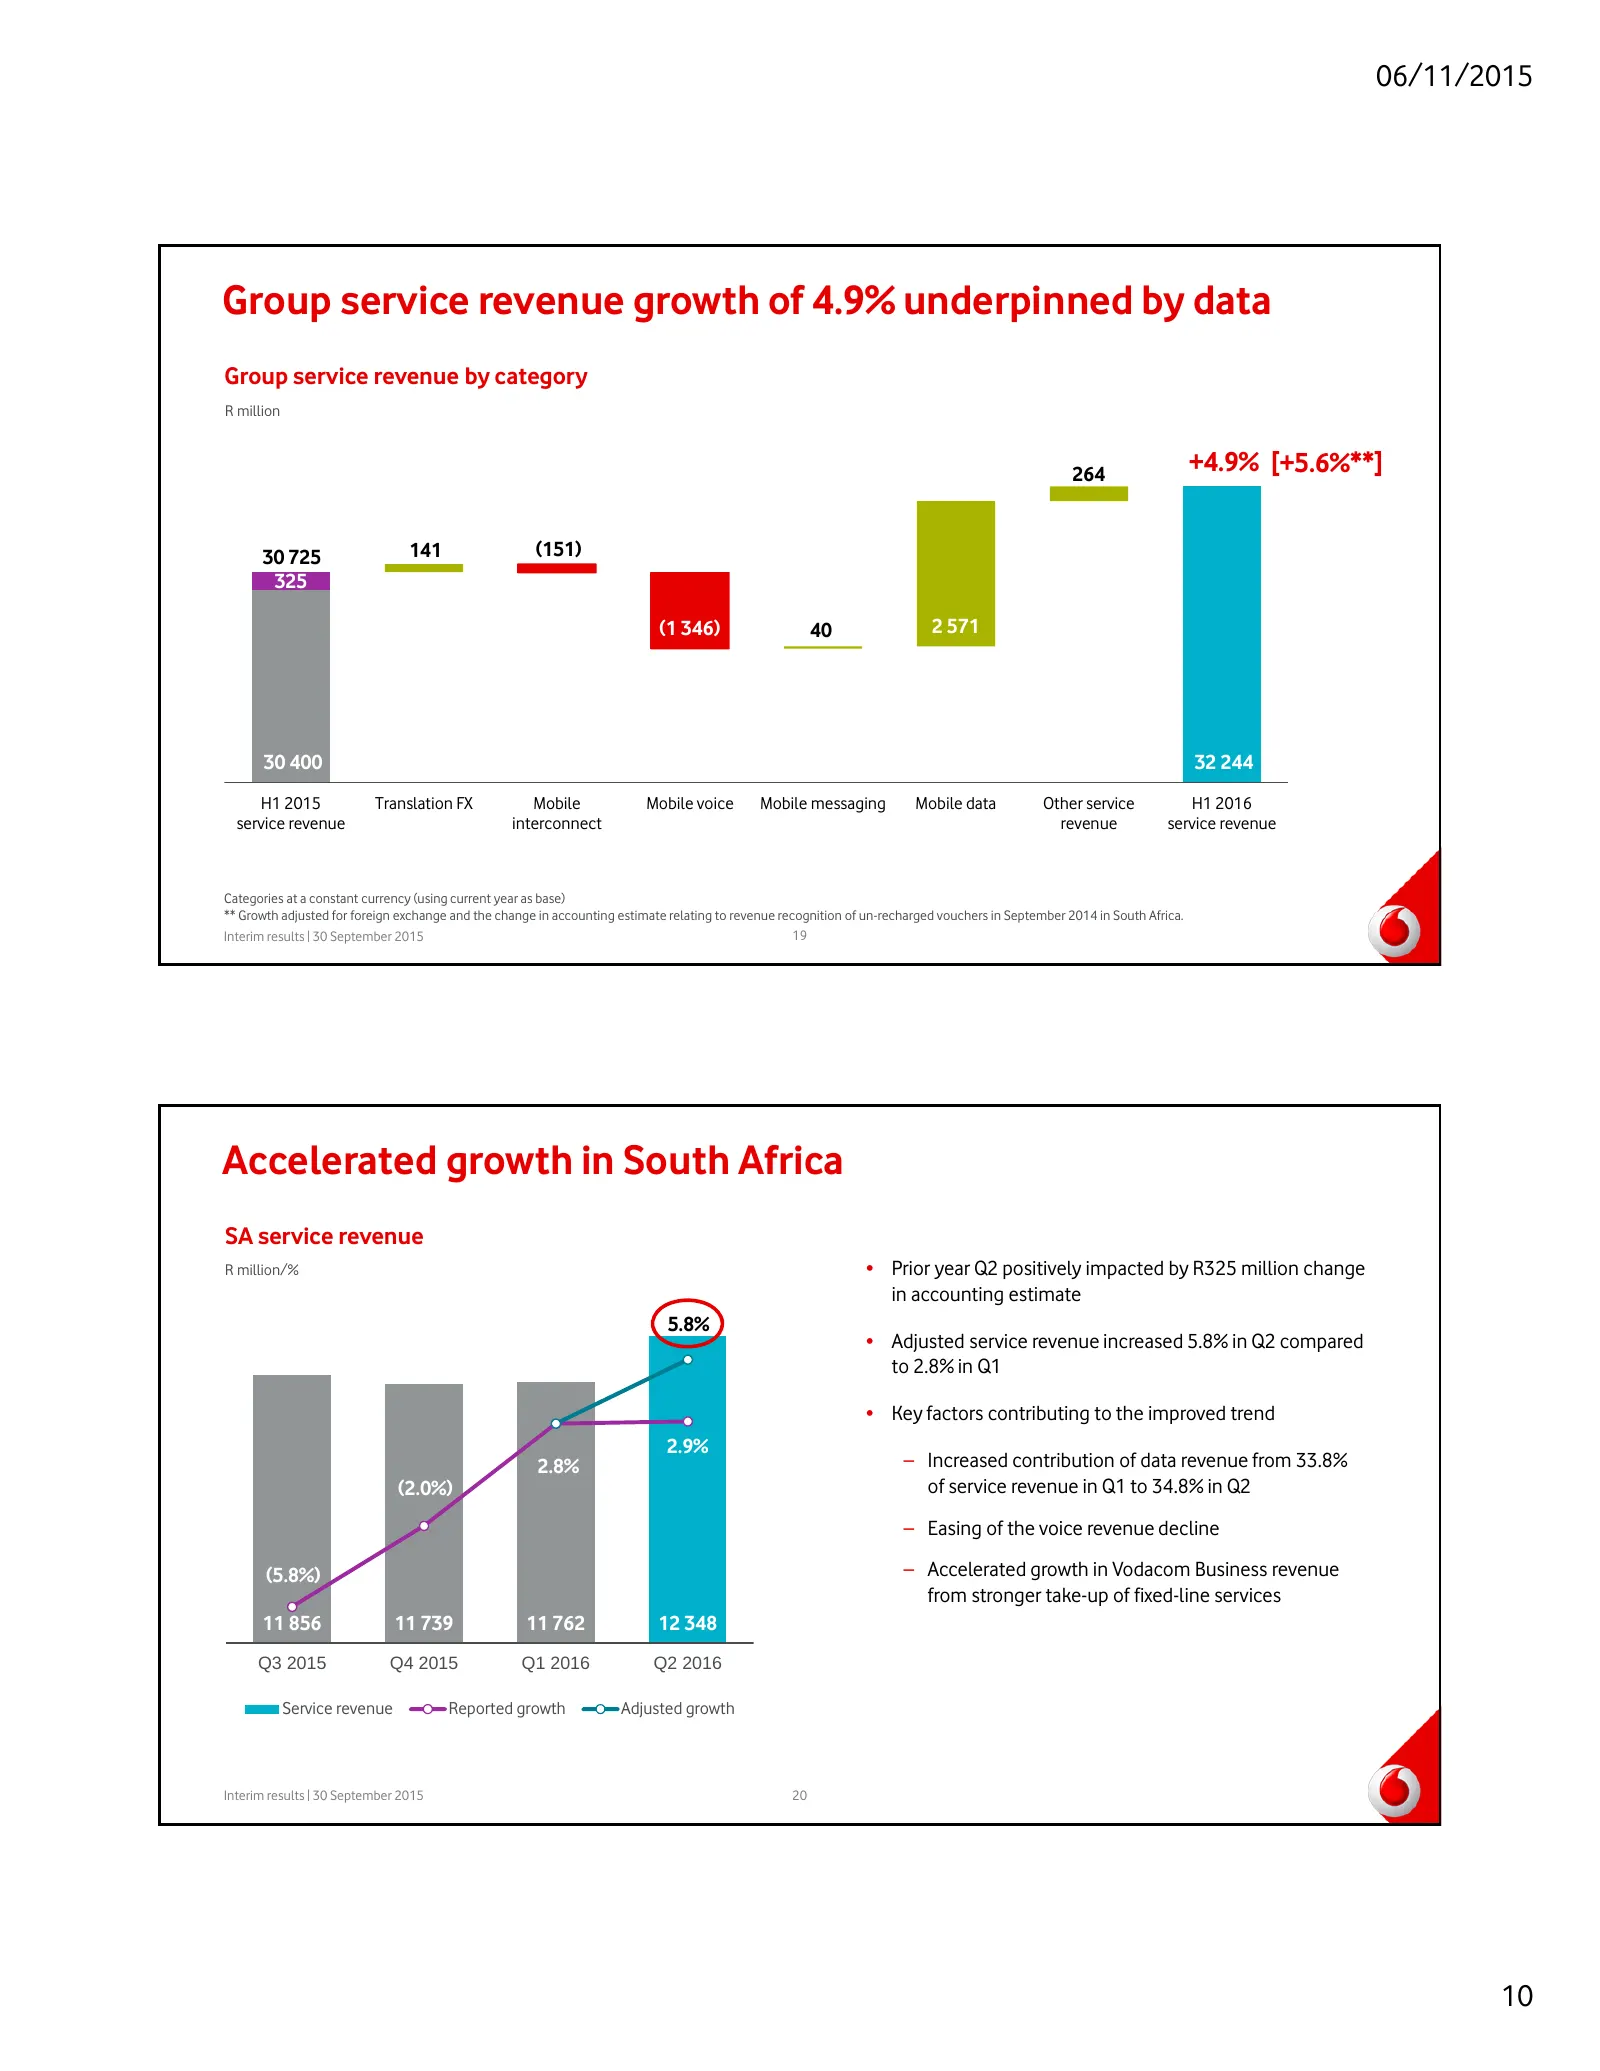
Slide 10: Group service revenue growth of 4.9% underpinned by data
06/11/2015 Group service revenue growth of 4.9% underpinned by data Group service revenue by category R million 264 +4.9% [+5.6%**] 30 725 141 (151) 325 (1 346) 40 2 571 30 400 30 715 32 244 H1 2015 Translation FX Mobile Mobile voice Mobile messaging Mobile data Other service H1 2016 service revenue
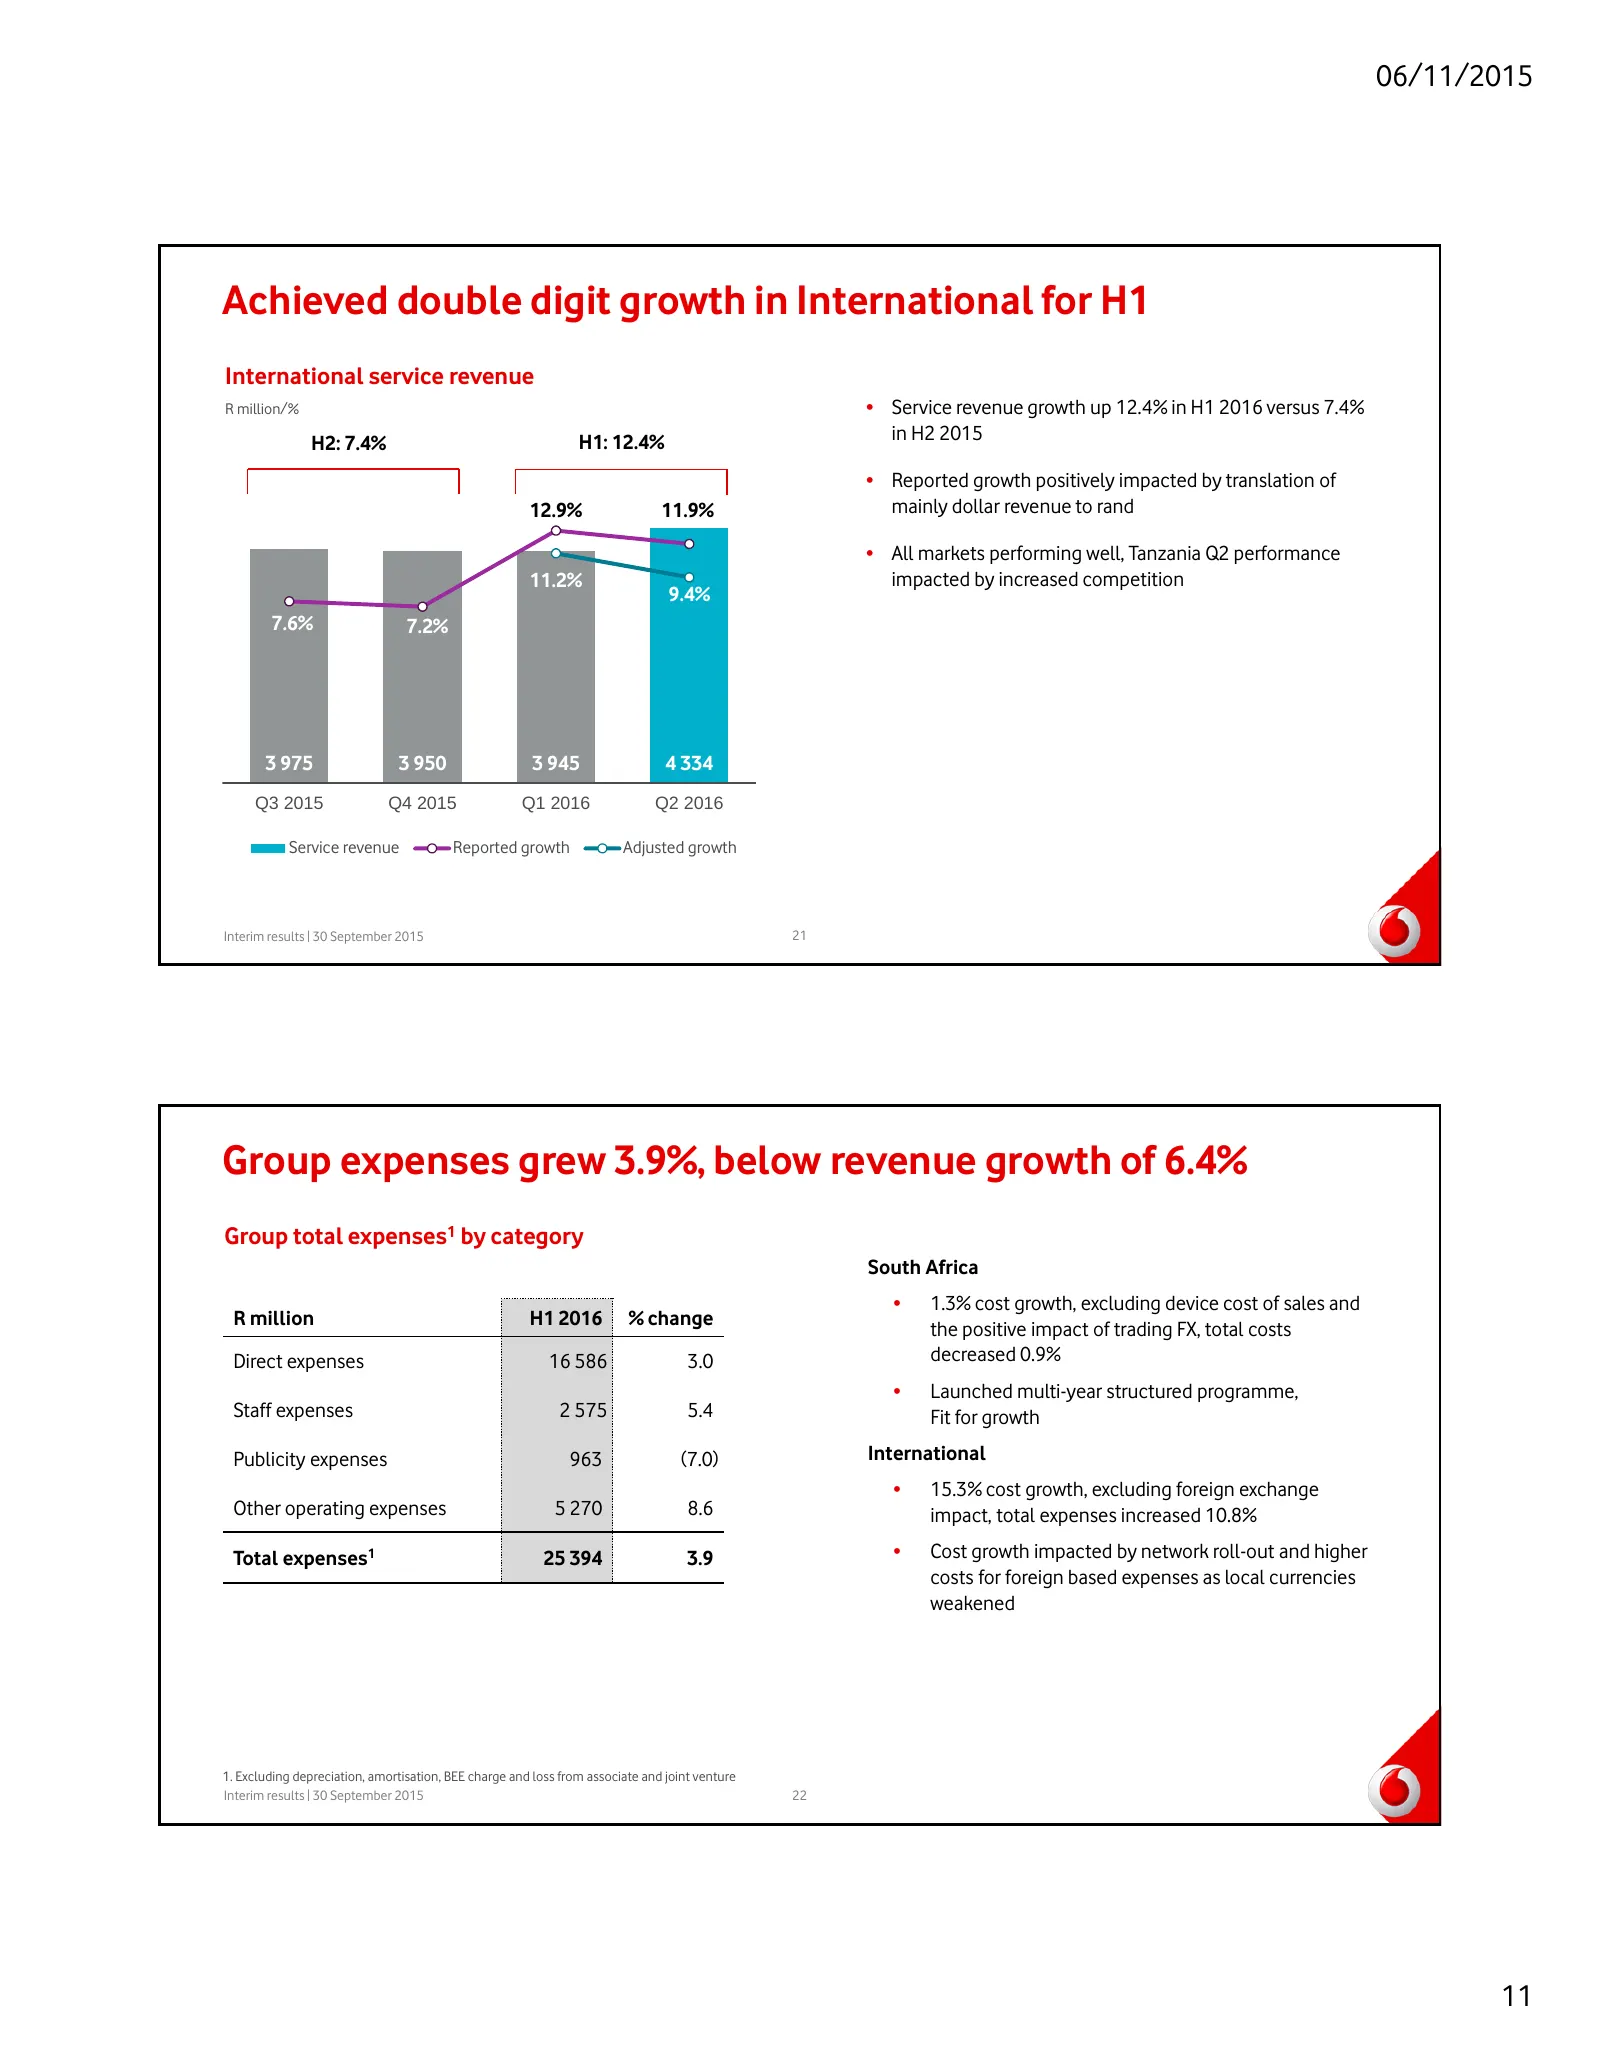
Slide 11: International growth and group expenses
06/11/2015 Achieved double digit growth in International for H1 International service revenue R million/% • Service revenue growth up 12.4% in H1 2016 versus 7.4% H2: 7.4% H1: 12.4% in H2 2015 • Reported growth positively impacted by translation of 12.9% 11.9% mainly dollar revenue to rand • All mar
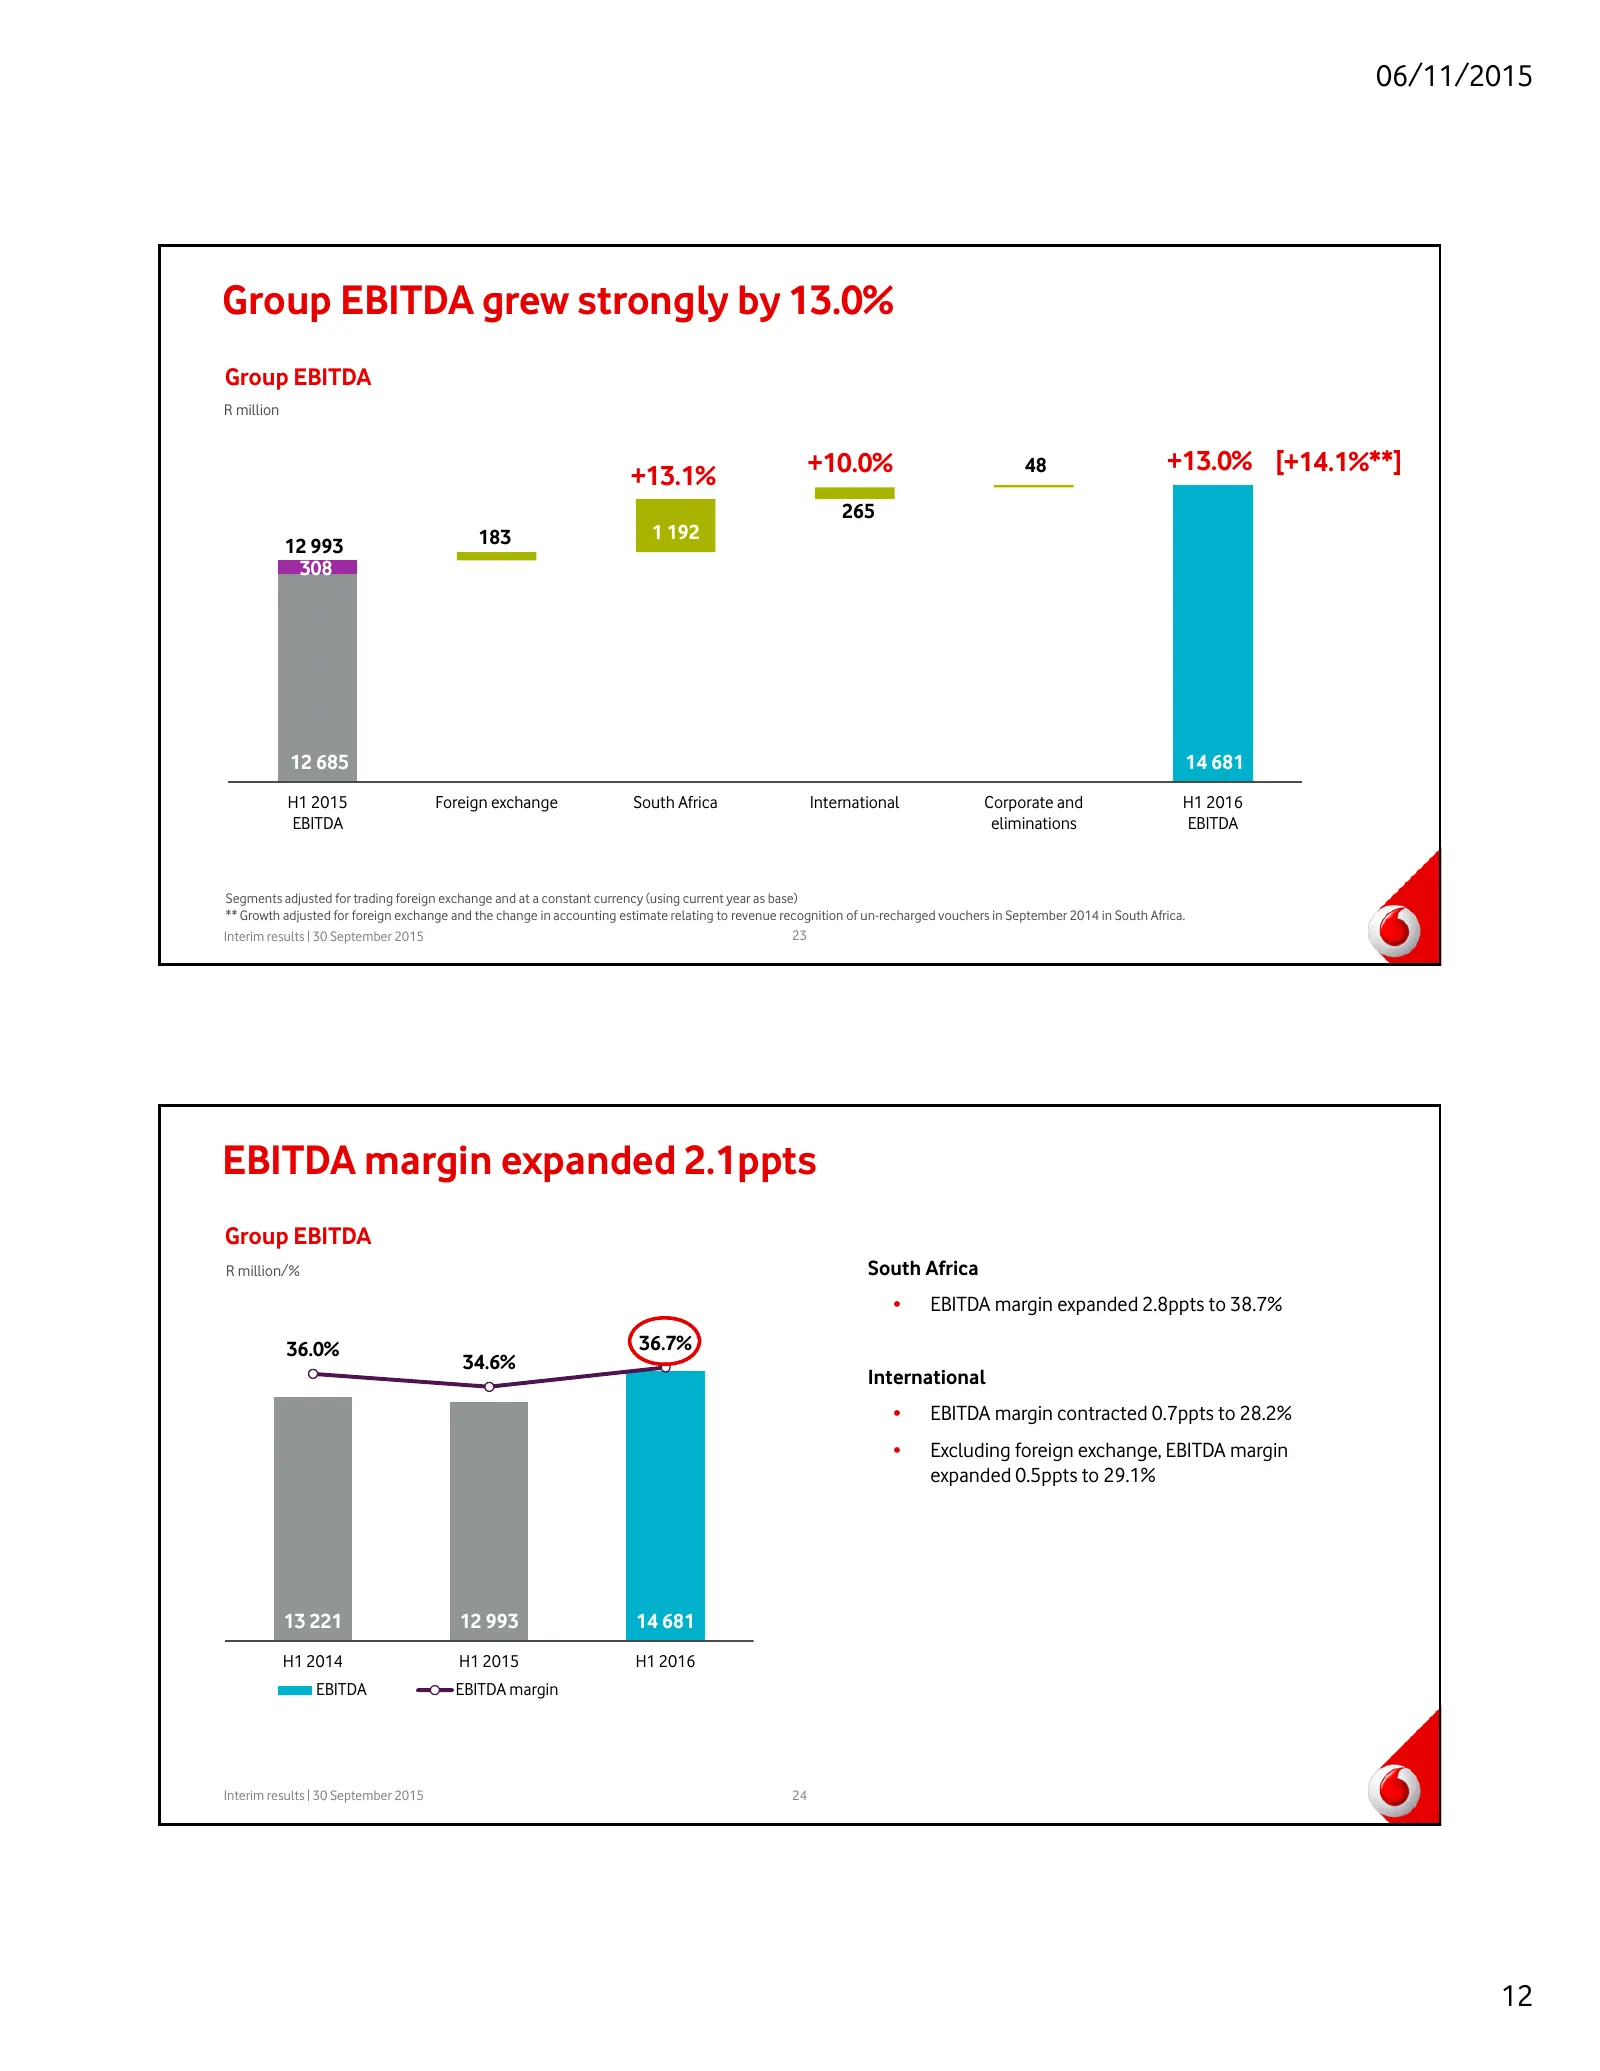
Slide 12: Group EBITDA grew strongly by 13.0%
06/11/2015 Group EBITDA grew strongly by 13.0% Group EBITDA R million +10.0% 48 +13.0% [+14.1%**] +13.1% 265 183 1 192 12 993 308 12 685 14 681 H1 2015 Foreign exchange South Africa International Corporate and H1 2016 EBITDA eliminations EBITDA Segments adjusted for trading foreign exchange and at a
Slide 13: Maintained a healthy balance sheet position
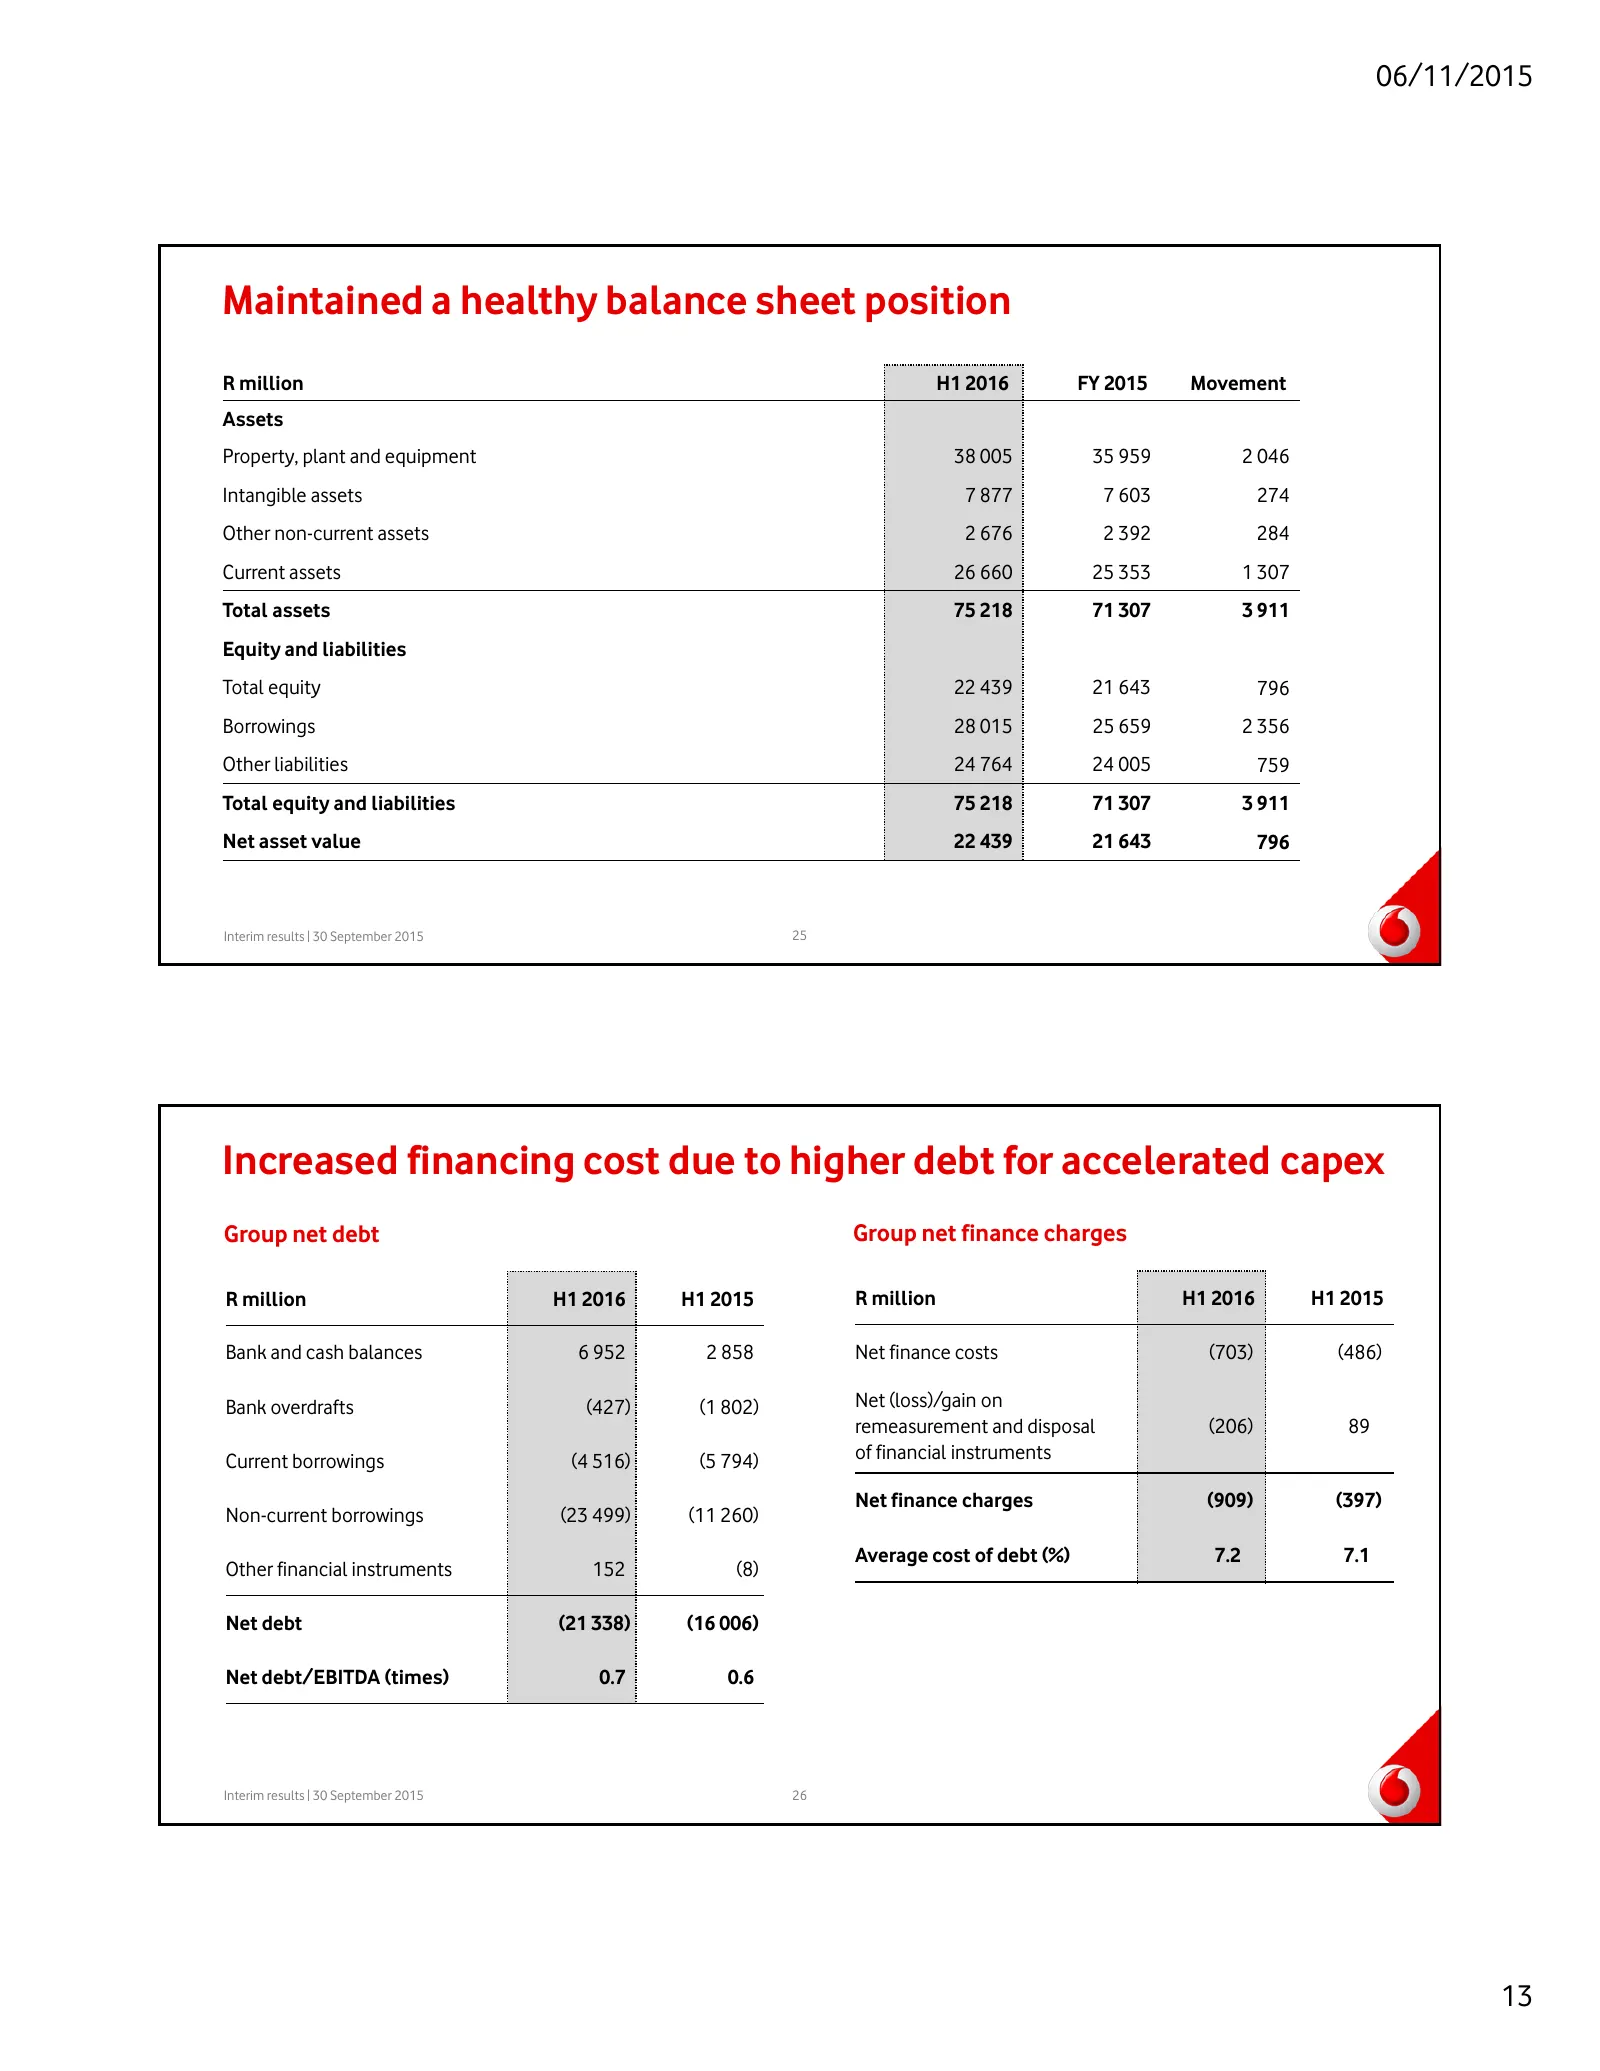
06/11/2015 Maintained a healthy balance sheet position R million H1 2016 FY 2015 Movement Assets Property, plant and equipment 38 005 35 959 2 046 Intangible assets 7 877 7 603 274 Other non-current assets 2 676 2 392 284 Current assets 26 660 25 353 1 307 Total assets 75 218 71 307 3 911 Equity and
Slide 14: Continued investment, strong cash flow; dividend per share
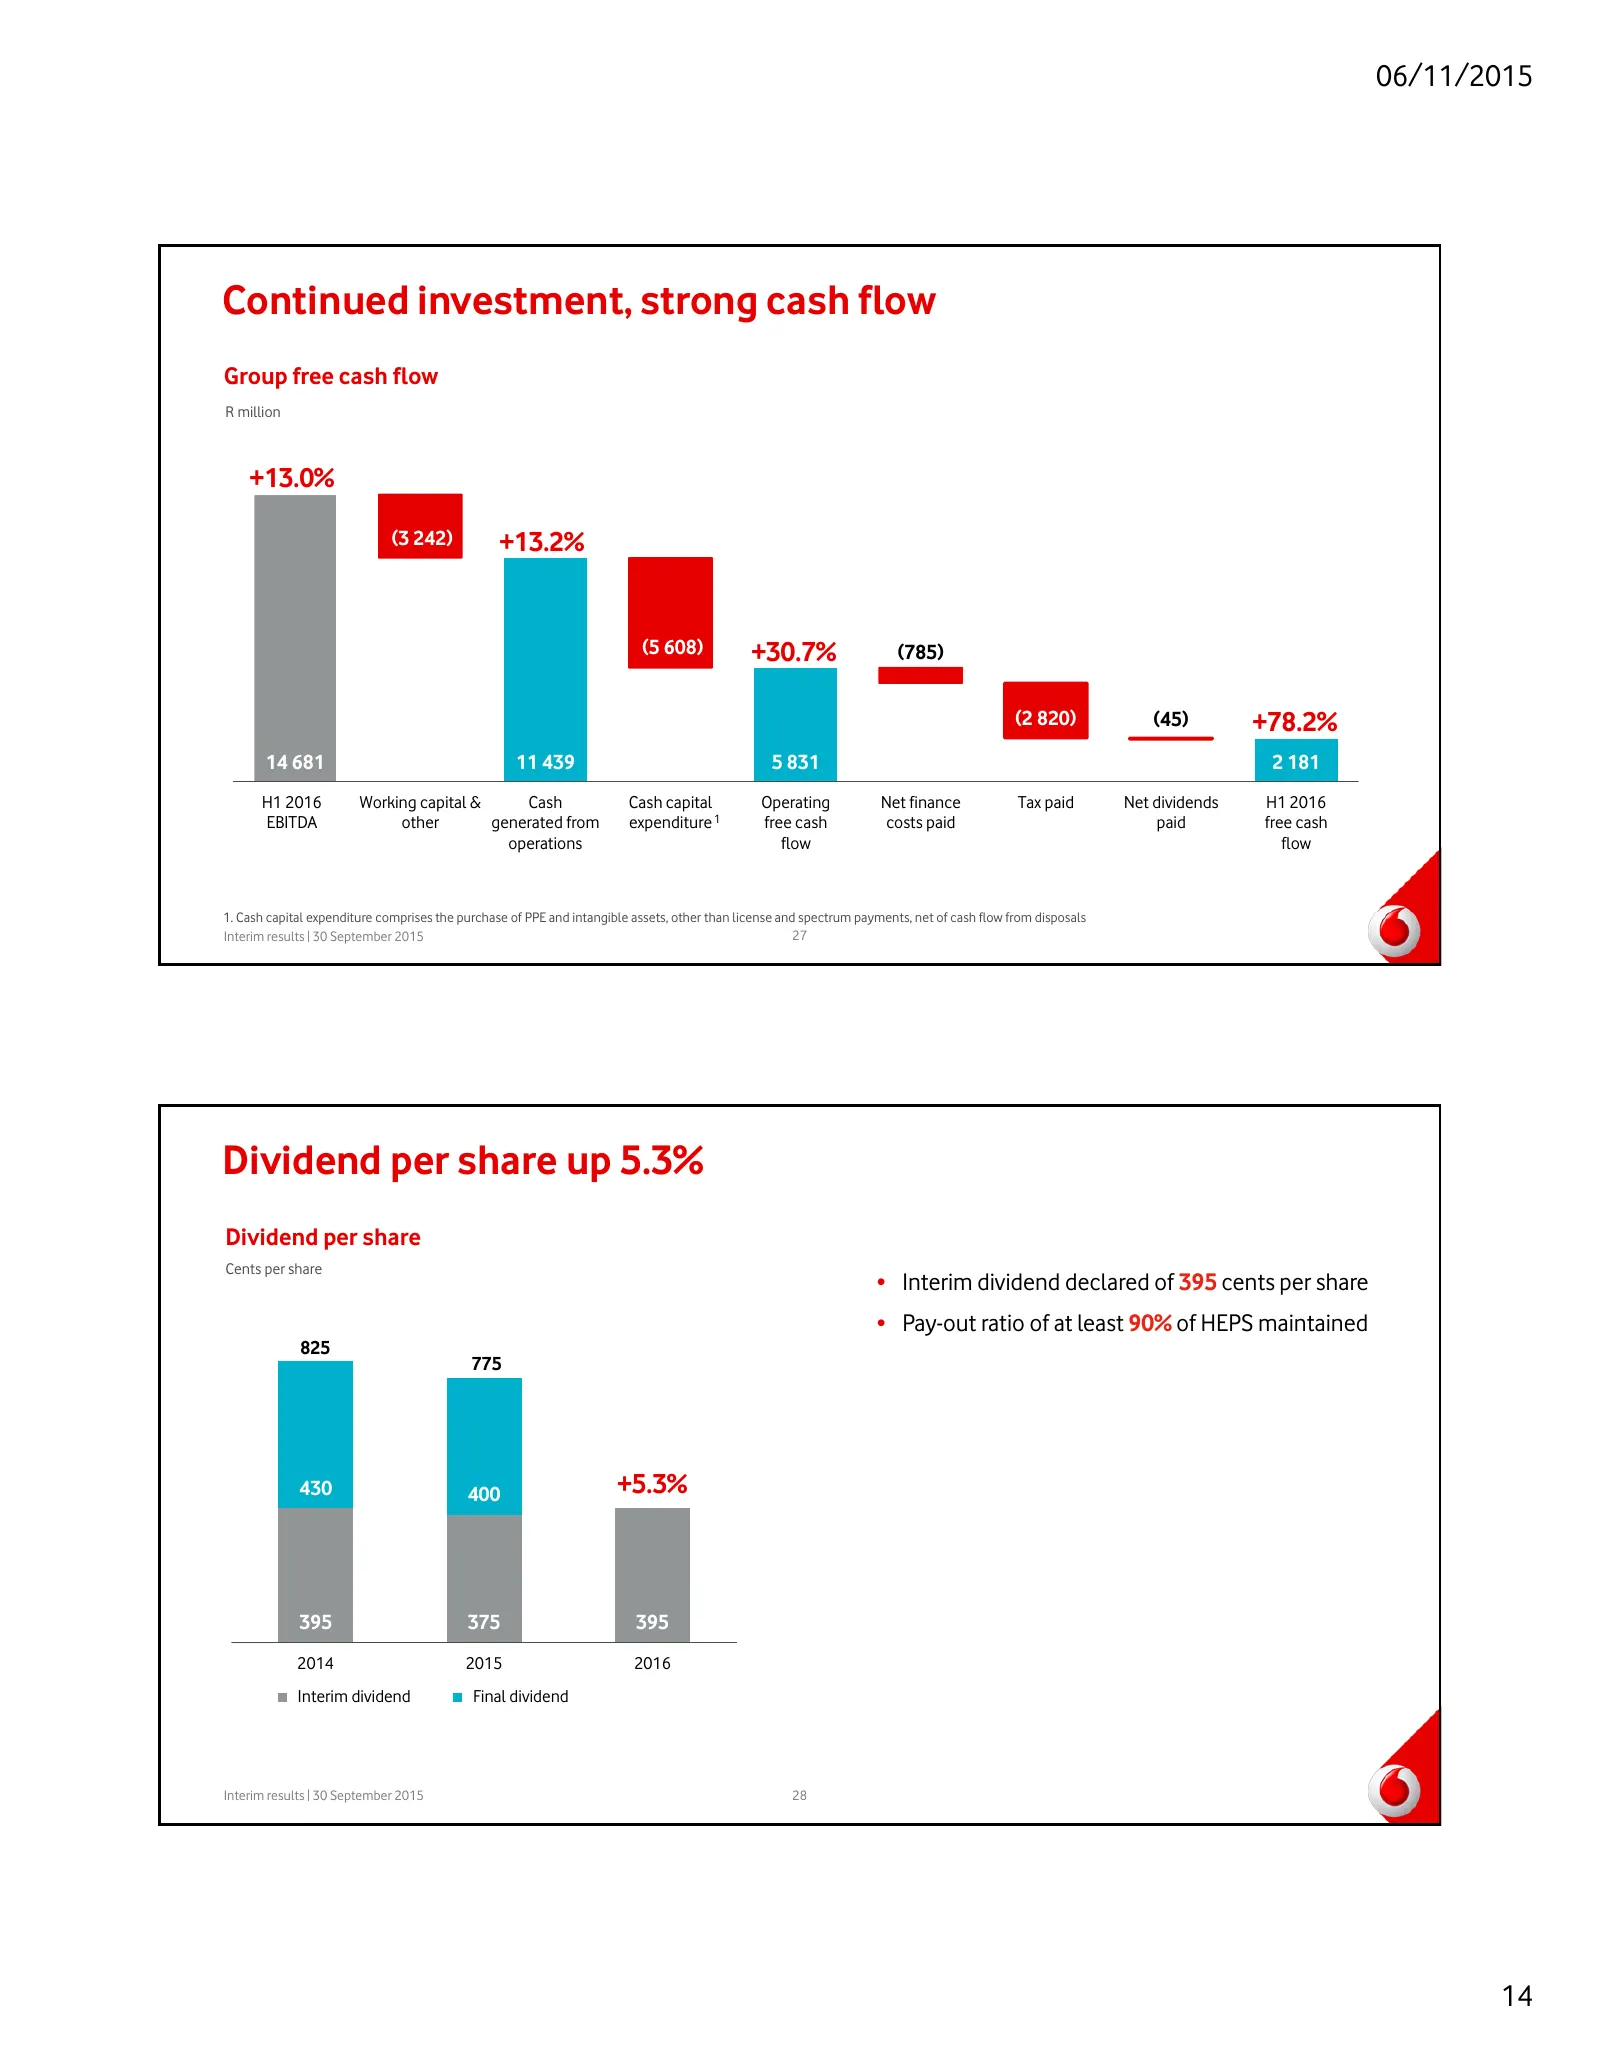
06/11/2015 Continued investment, strong cash flow Group free cash flow R million +13.0% White cover on half slide (3 242) +13.2% (5 608) +30.7% (785) (2 820) (45) +78.2% 14 681 11 439 5 831 2 181 H1 2016 Working capital & Cash Cash capital Operating Net finance Tax paid Net dividends H1 2016 EBITDA
Slide 15: Key priorities; accelerated capital investment
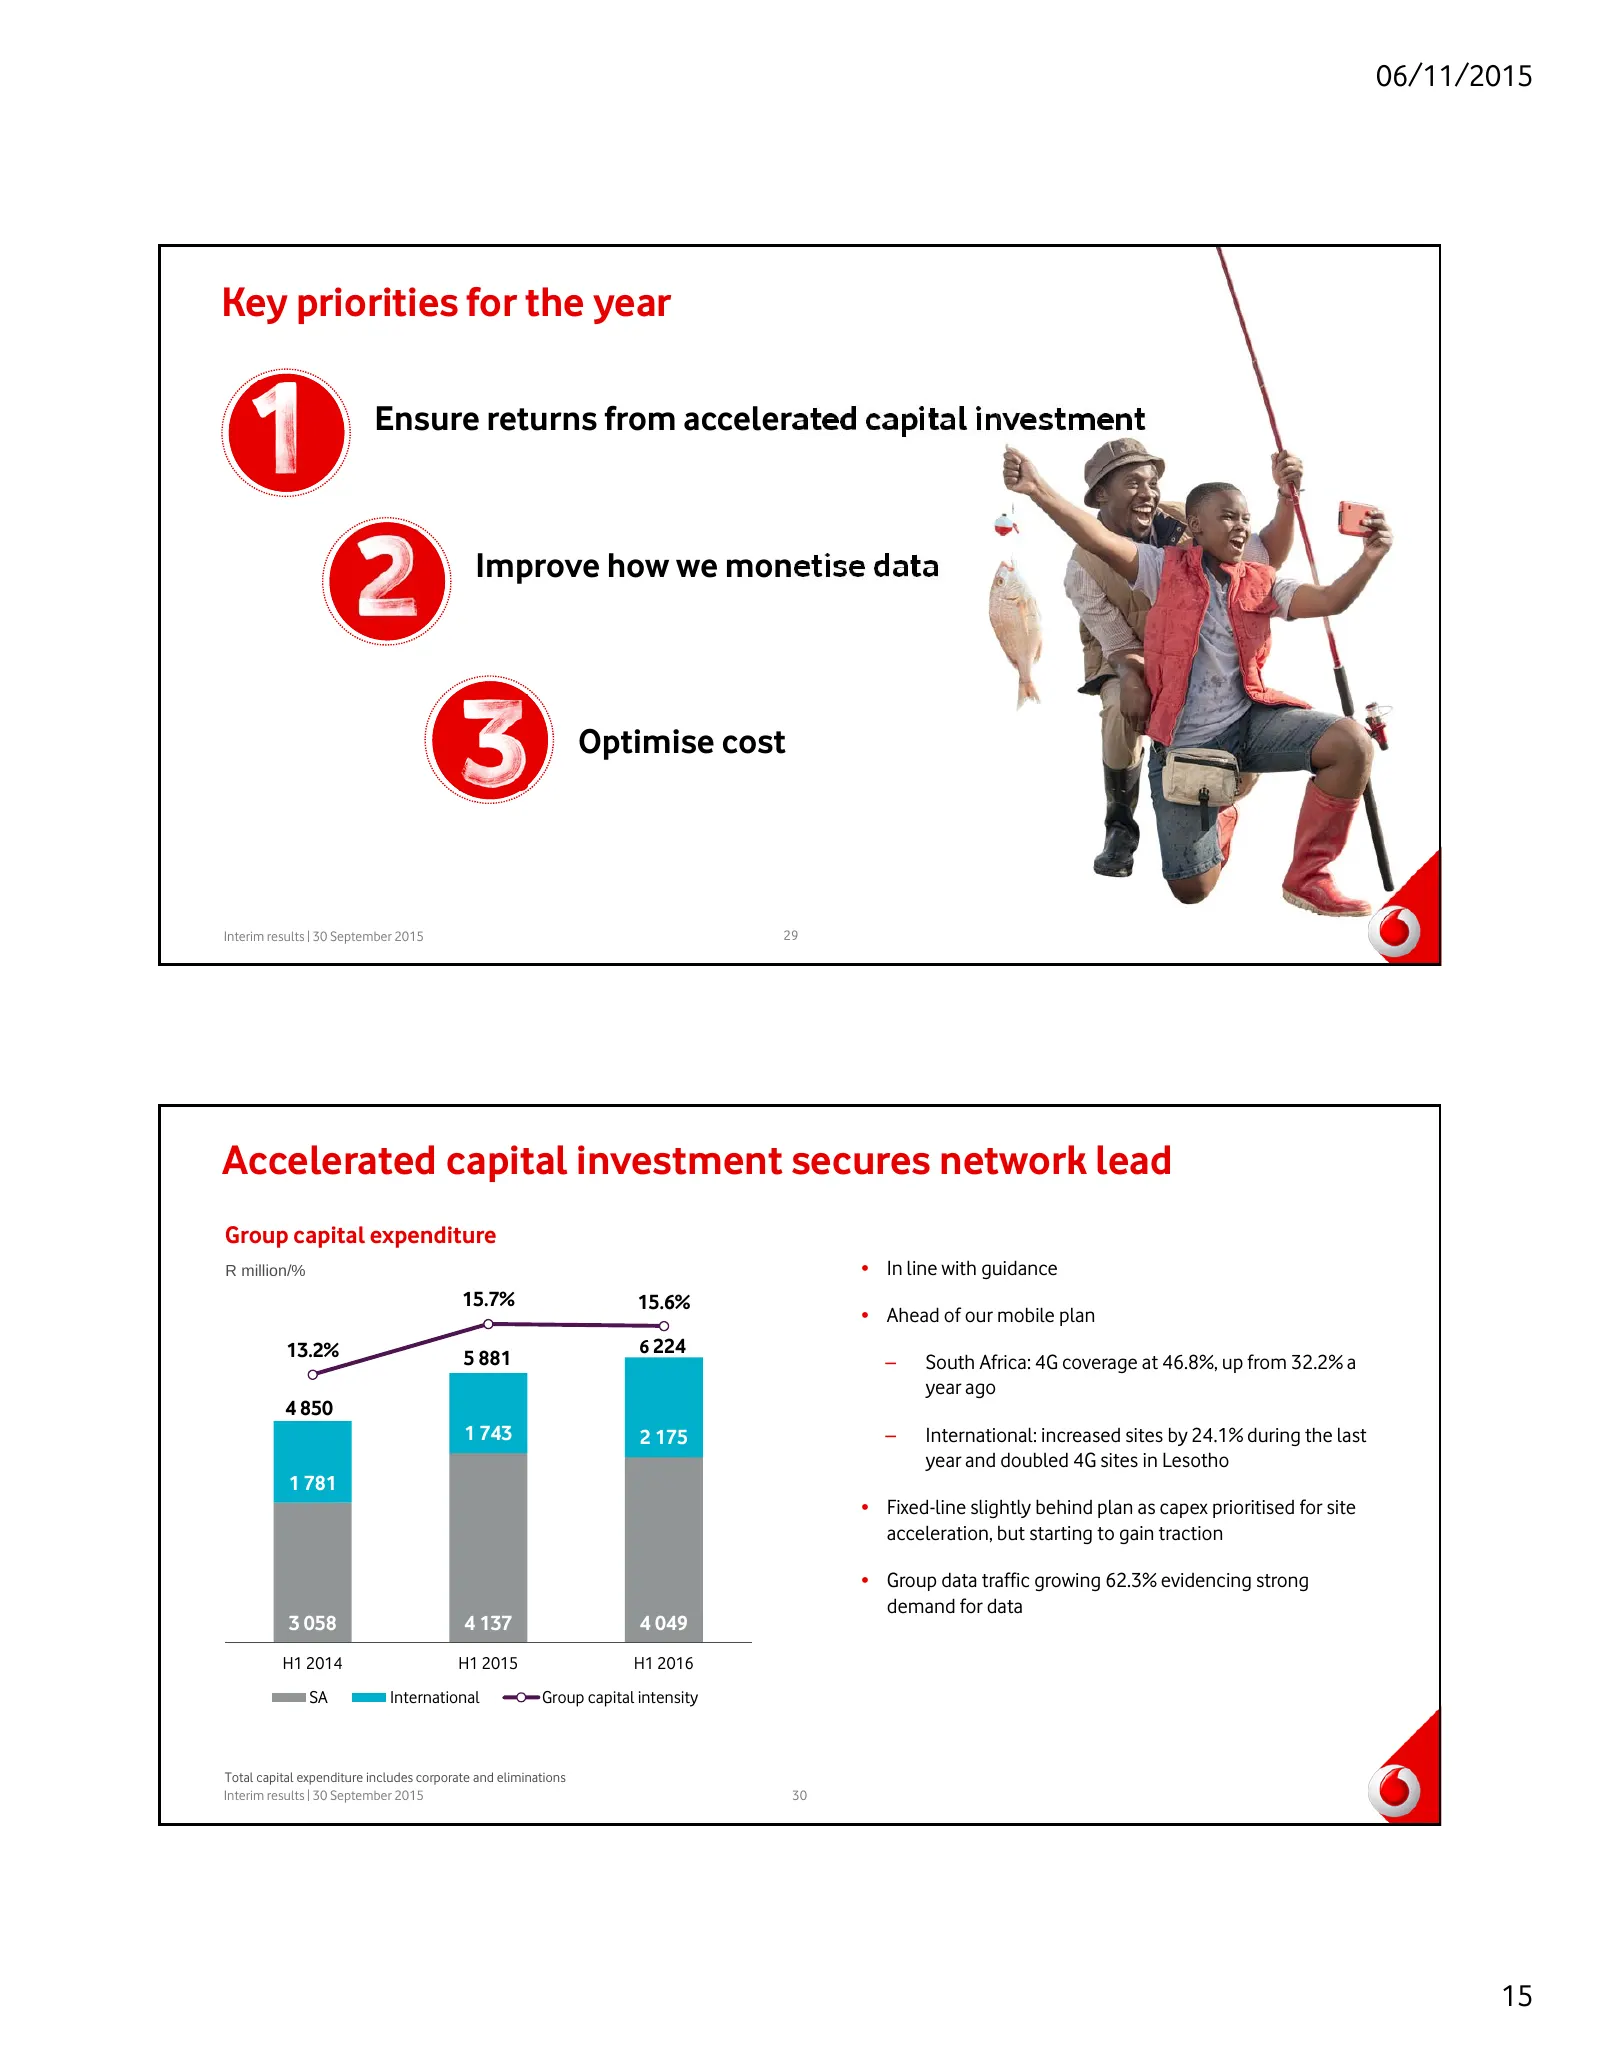
06/11/2015 Key priorities for the year Ensure returns from accelerated capital investment Improve how we monetise data Optimise cost Interim results | 30 September 2015 29 Accelerated capital investment secures network lead Group capital expenditure R million/% • In line with guidance 15.7% 15.6% •
Slide 16: Data revenue growth in SA; multi-year cost saving
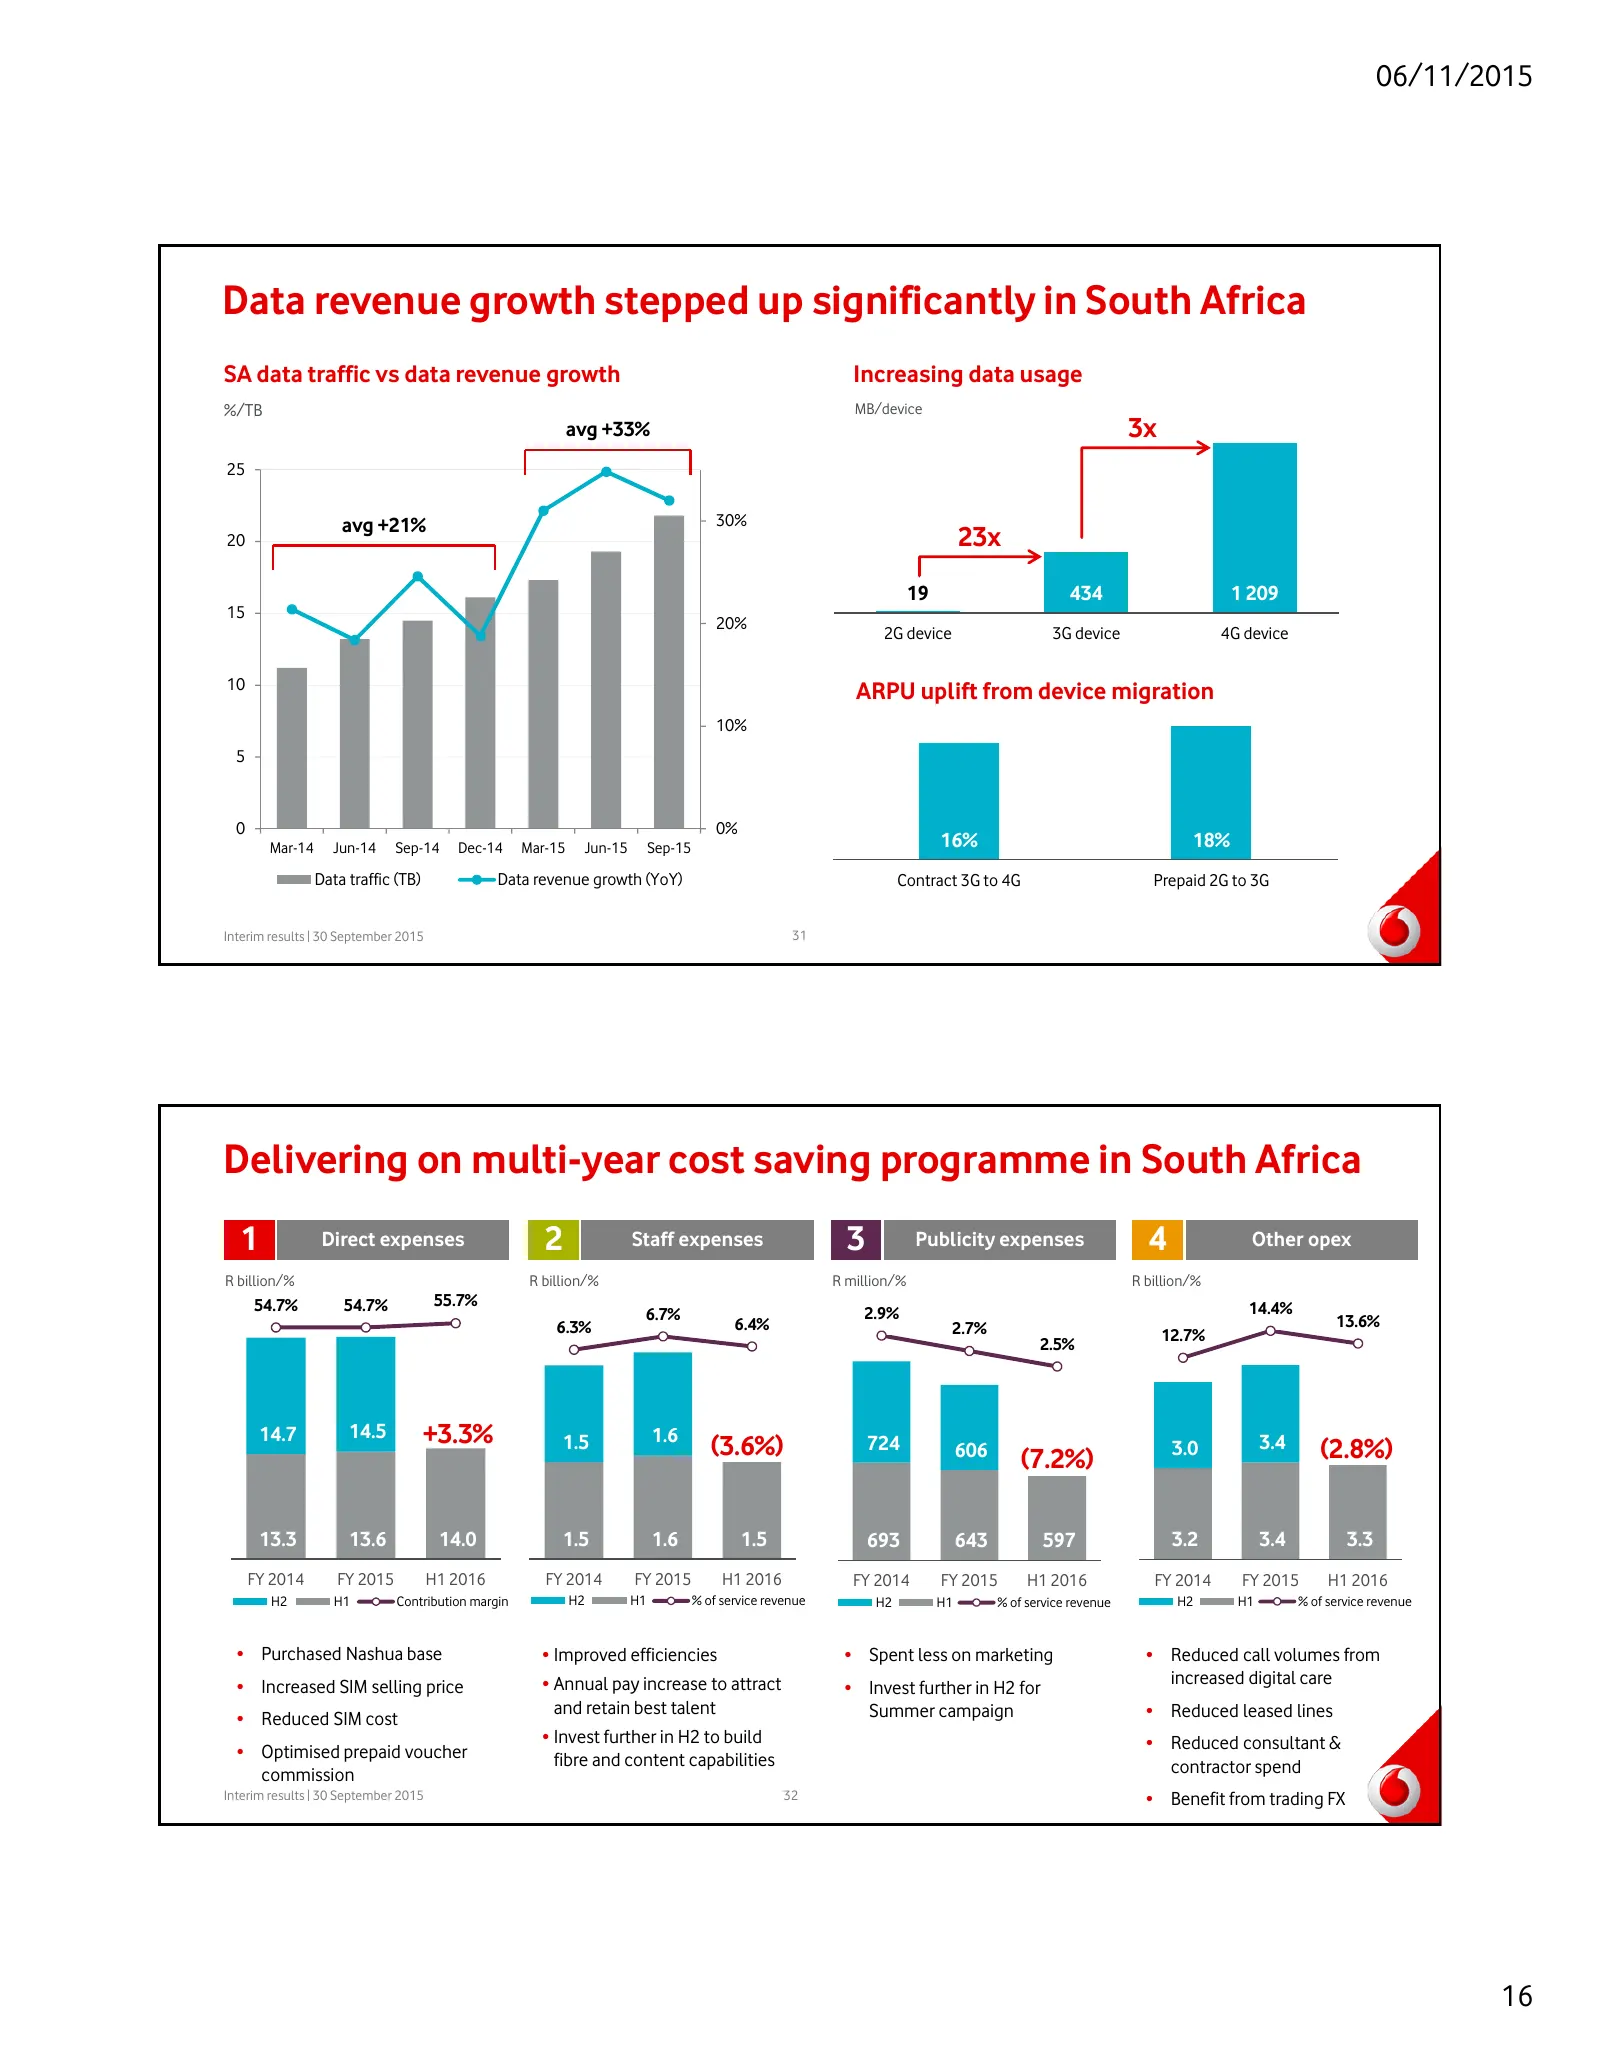
06/11/2015 Data revenue growth stepped up significantly in South Africa SA data traffic vs data revenue growth Increasing data usage %/TB MB/device avg +33% 3x 25 avg +21% 30% 20 23x 19 434 1 209 15 20% 2G device 3G device 4G device 10 ARPU uplift from device migration 10% 5 0 0% Mar-14 Jun-14 Sep-1
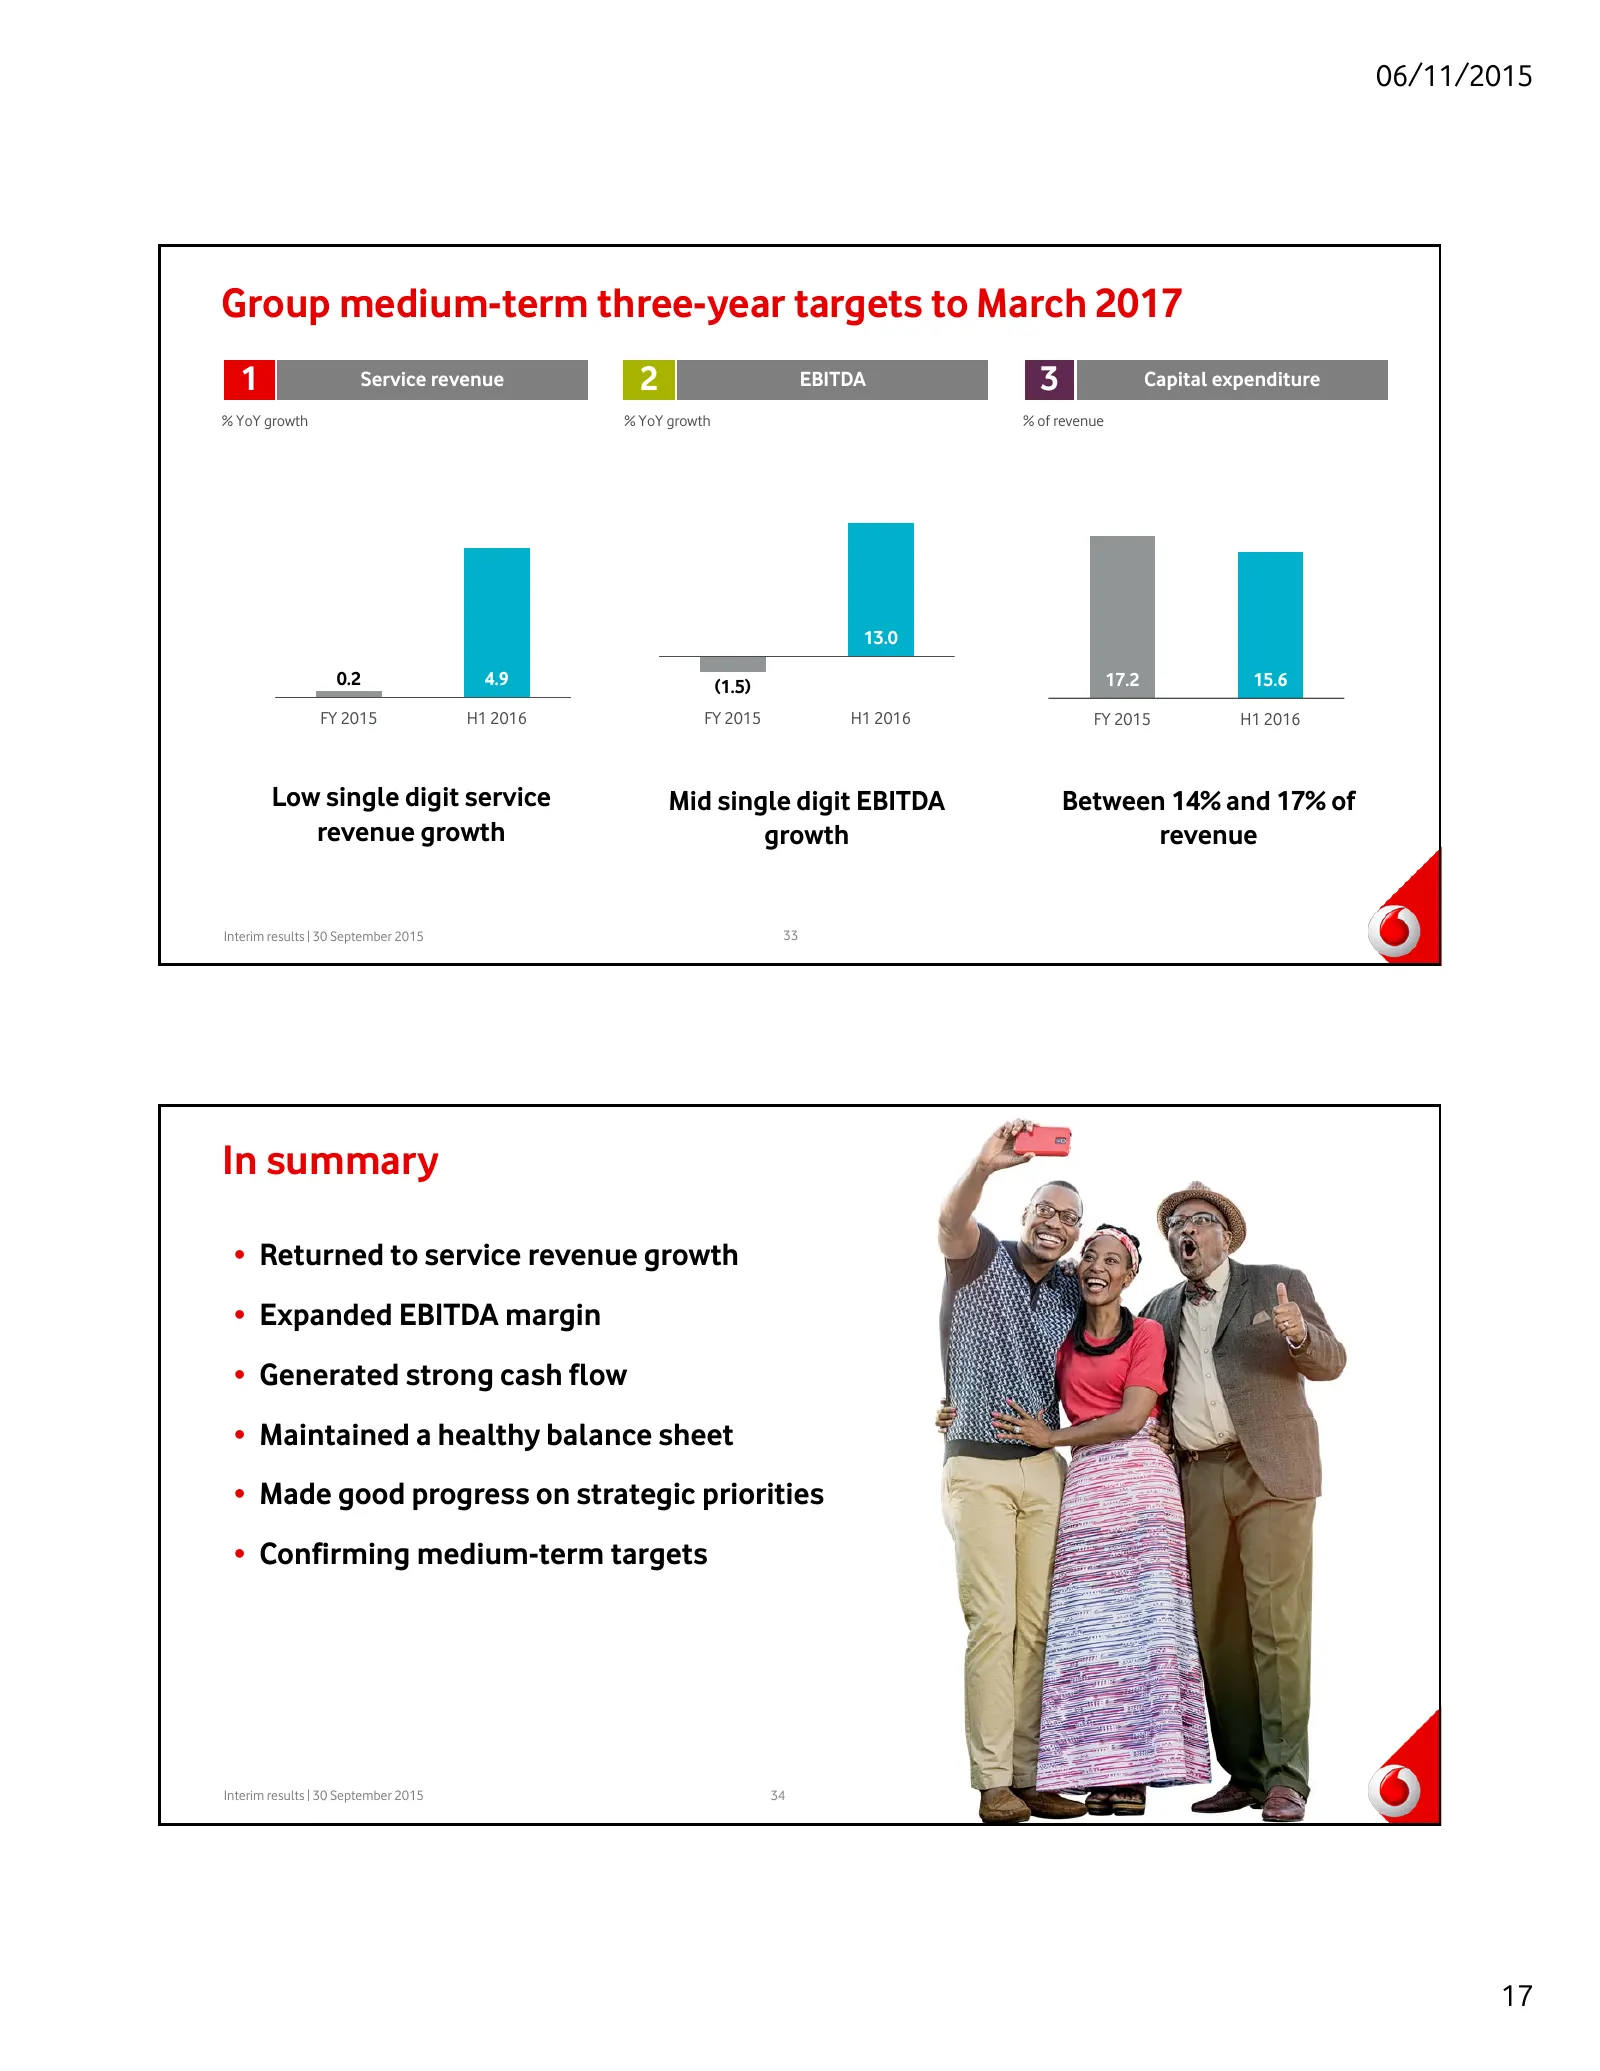
Slide 17: Medium-term three-year targets to March 2017; In summary
06/11/2015 Group medium-term three-year targets to March 2017 1 Service revenue 2 EBITDA 3 Capital expenditure % YoY growth % YoY growth % of revenue 13.0 0.2 4.9 (1.5) 17.2 15.6 FY 2015 H1 2016 FY 2015 H1 2016 FY 2015 H1 2016 Low single digit service Mid single digit EBITDA Between 14% and 17% of r
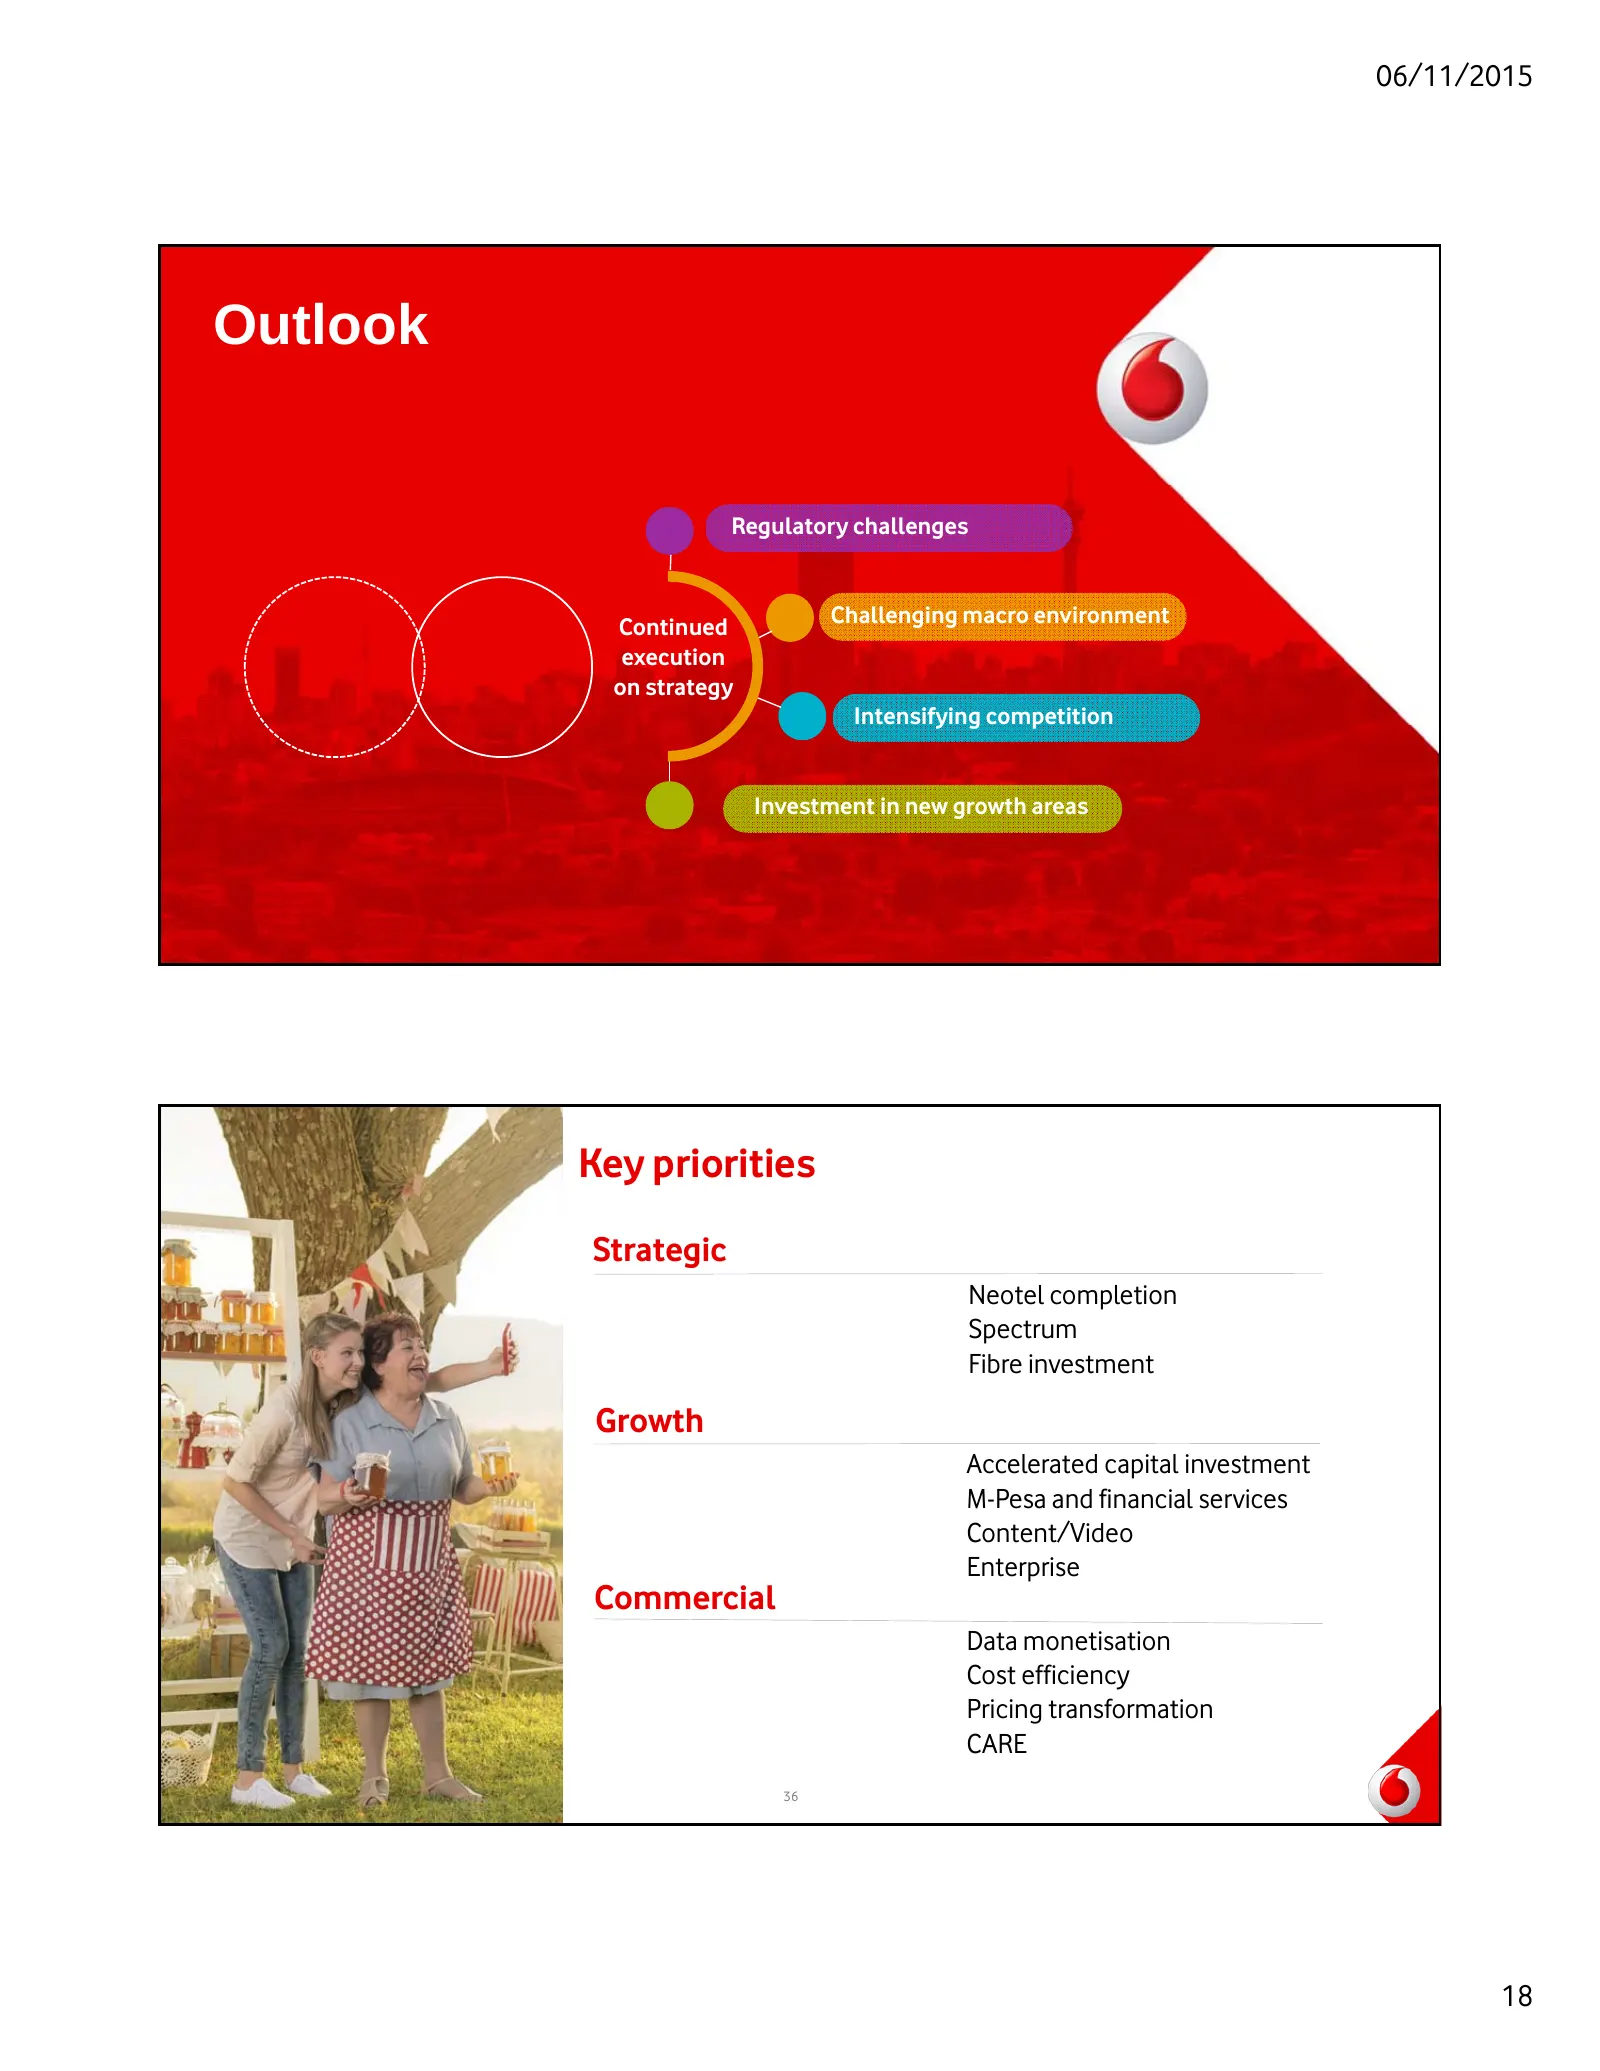
Slide 18: Outlook and key priorities
06/11/2015 Outlook Regulatory challenges Continued Challenging macro environment execution on strategy Intensifying competition Investment in new growth areas Key priorities Strategic Neotel completion Spectrum Fibre investment Growth Accelerated capital investment M-Pesa and financial services Cont
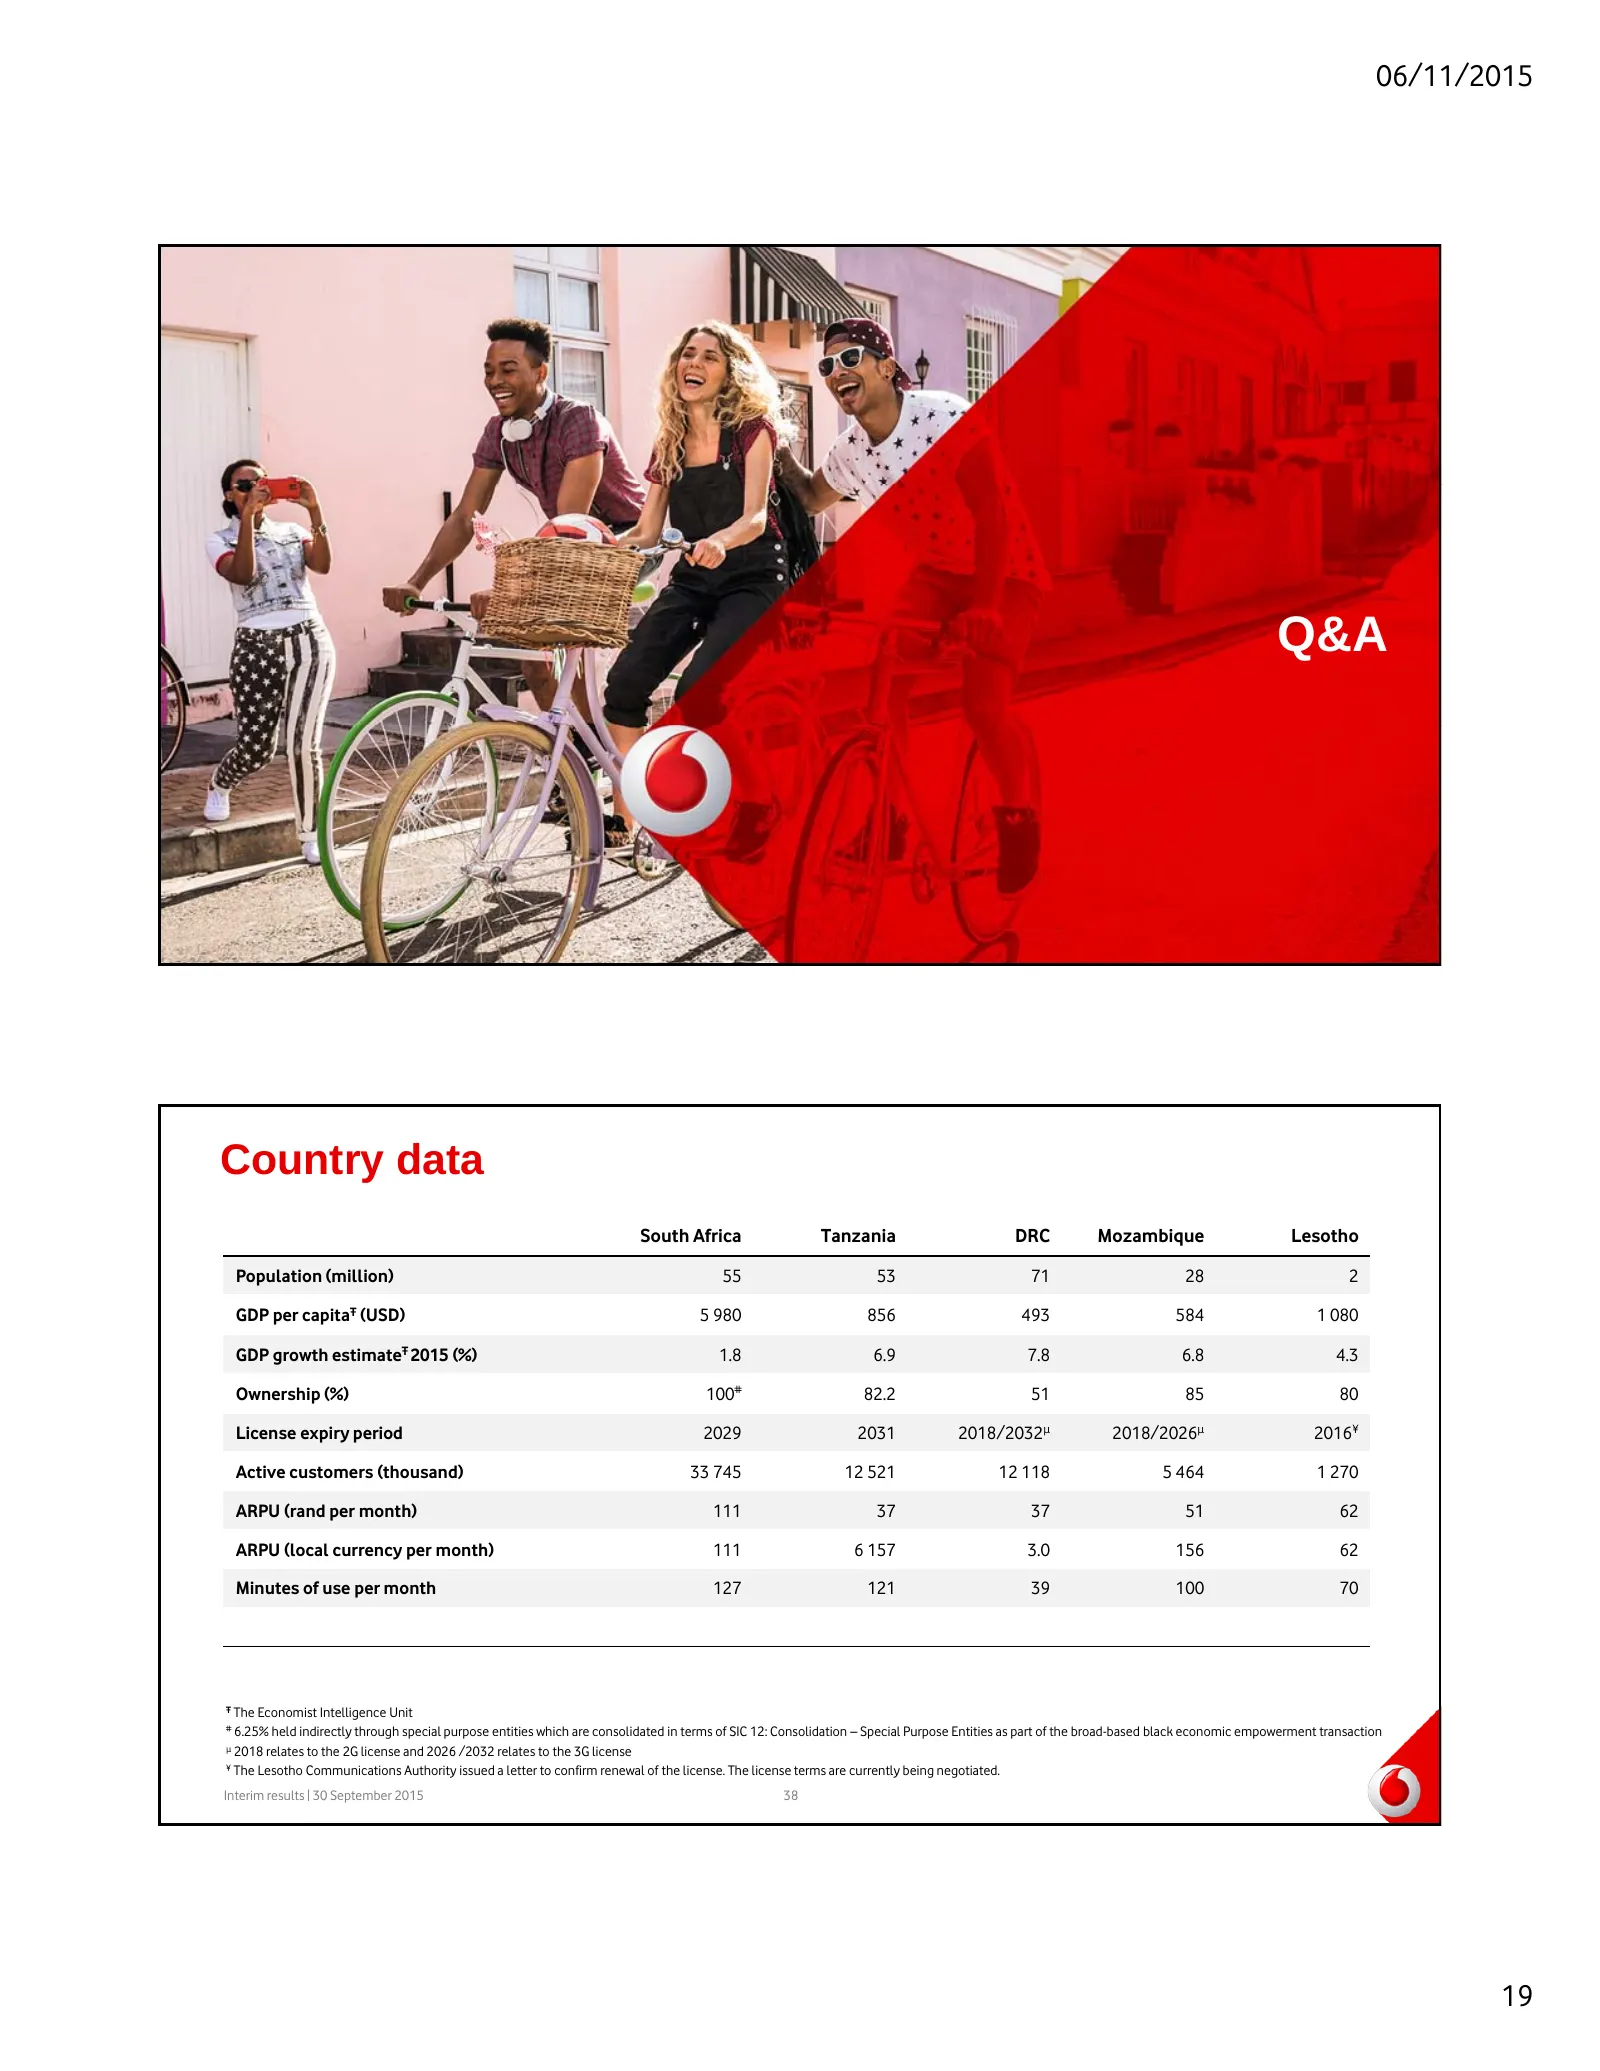
Slide 19: Q&A; Country data
06/11/2015 Q&A Country data South Africa Tanzania DRC Mozambique Lesotho Population (million) 55 53 71 28 2 GDP per capitaŦ (USD) 5 980 856 493 584 1 080 GDP growth estimateŦ 2015 (%) 1.8 6.9 7.8 6.8 4.3 Ownership (%) 100# 82.2 51 85 80 License expiry period 2029 2031 2018/2032μ 2018/2026μ 2016¥ Act
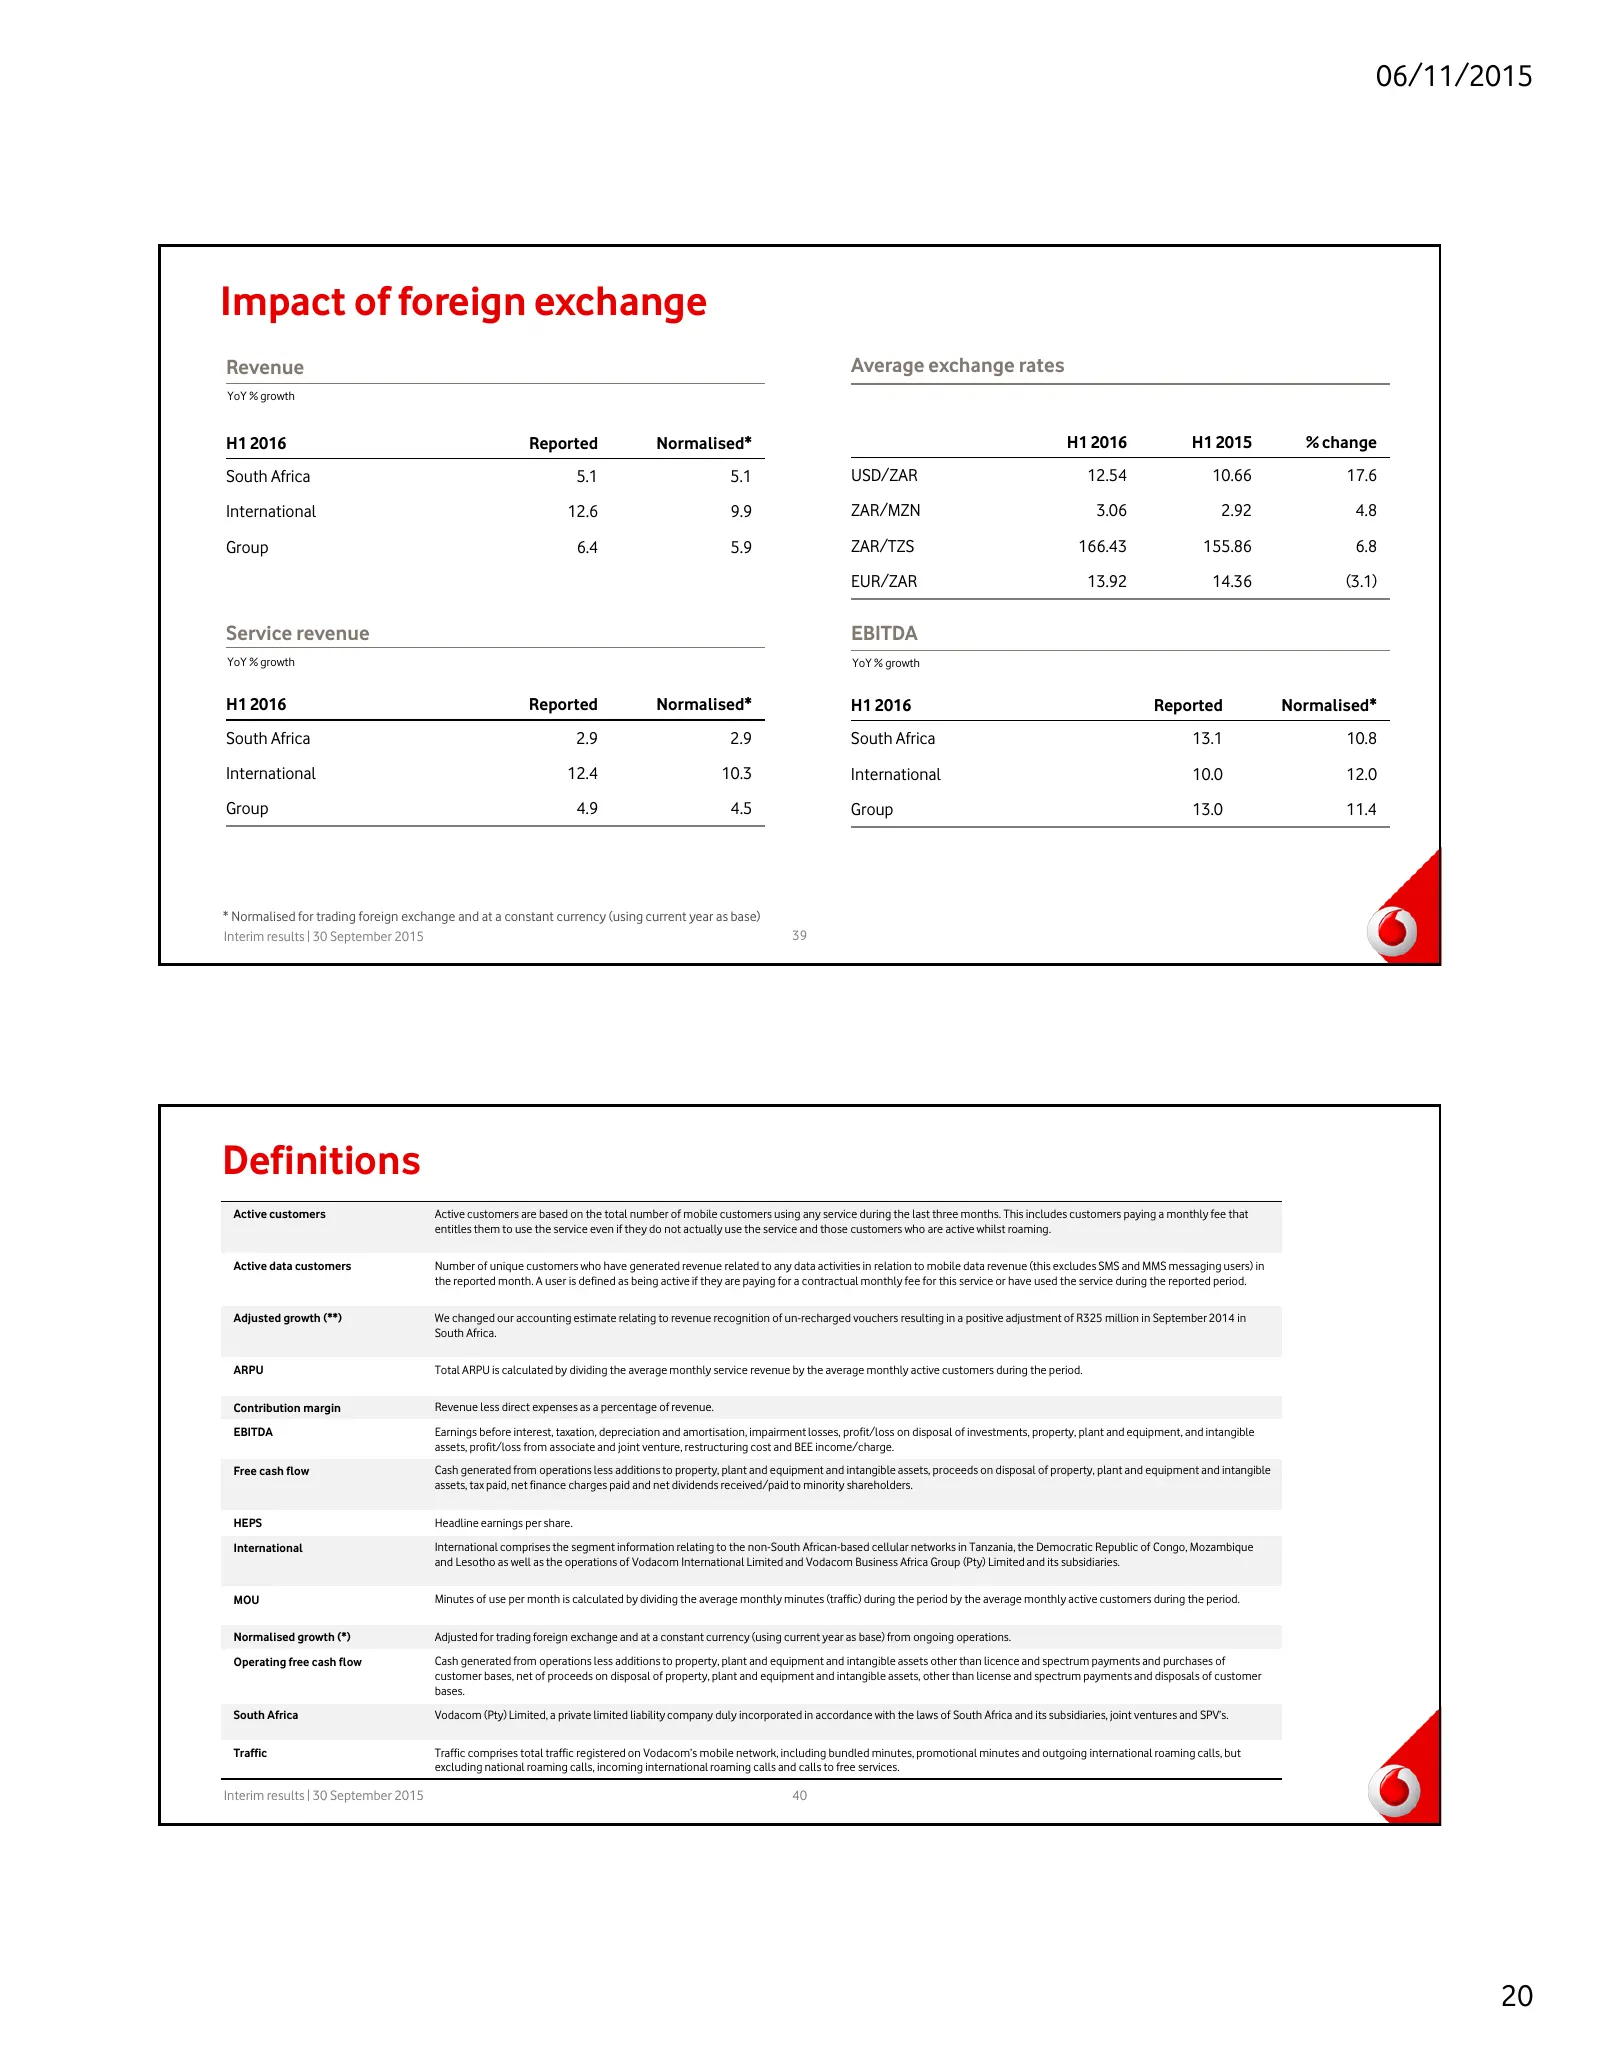
Slide 20: Impact of foreign exchange; Definitions
06/11/2015 Impact of foreign exchange Revenue Average exchange rates YoY % growth H1 2016 Reported Normalised* H1 2016 H1 2015 % change South Africa 5.1 5.1 USD/ZAR 12.54 10.66 17.6 International 12.6 9.9 ZAR/MZN 3.06 2.92 4.8 Group 6.4 5.9 ZAR/TZS 166.43 155.86 6.8 EUR/ZAR 13.92 14.36 (3.1) Service
Slide 21: Forward-looking statements
06/11/2015 Forward-looking statements This presentation which sets out the interim results for Vodacom Group Limited for the six months ended 30 September 2015 contains 'forward-looking statements‘, which have not been reviewed or reported on by the Group’s auditors, with respect to the Group’s fina
Source: Internet Archive copy of vodacom.com
More decks from Vodacom Group Limited
 H1 FY2027 Earnings Presentation40 slides · November 2026
 FY2026 Earnings Presentation39 slides · May 11, 2026
 Merger or Acquisition (December 2025)16 slides · Dec 4, 2025
 Q2 2026 Earnings Presentation39 slides · Nov 10, 2025
 FY2025 Earnings Presentation39 slides · May 19, 2025
 Investor Day (February 2025)34 slides · Feb 19, 2025