Vodacom Group Limited · JSE:VOD
Vodacom — H1 FY2027 Earnings Presentation
40 slides from Vodacom's earnings presentation, November 2026

Slide 1: Vodacom Group Interim results
Vodacom Group Interim results For the six months ended 30 September 2026
Slide 2: Disclaimer
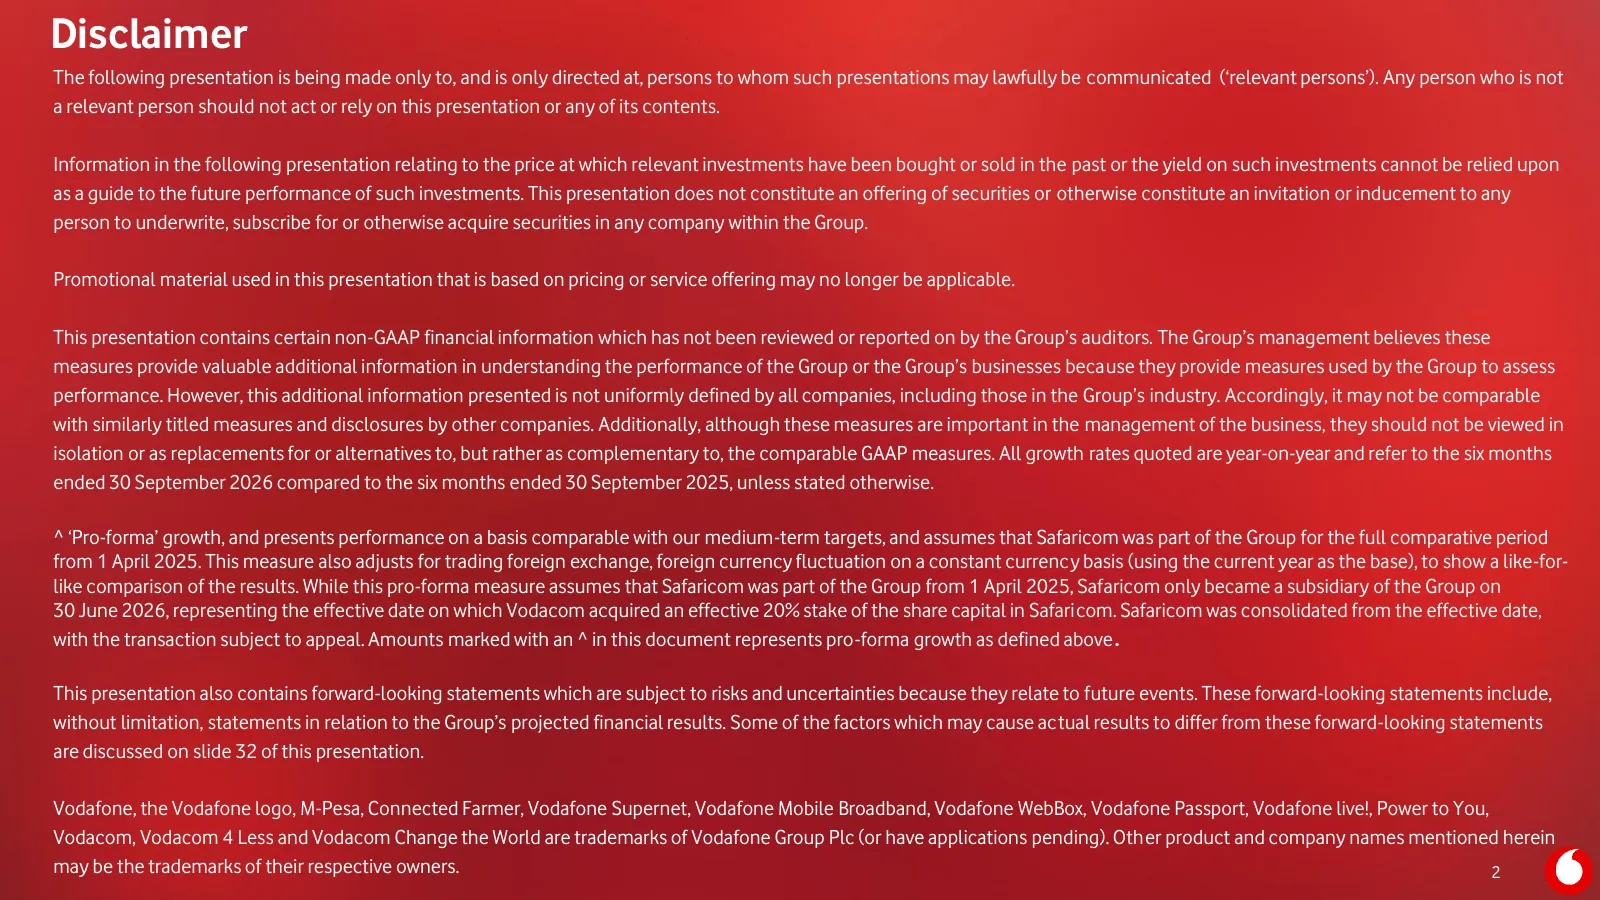
Disclaimer The following presentation is being made only to, and is only directed at, persons to whom such presentations may lawfully be communicated (‘relevant persons’). Any person who is not a relevant person should not act or rely on this presentation or any of its contents. Information in the f
Slide 3: FY1H27 snapshot | Strong results and well positioned for the future
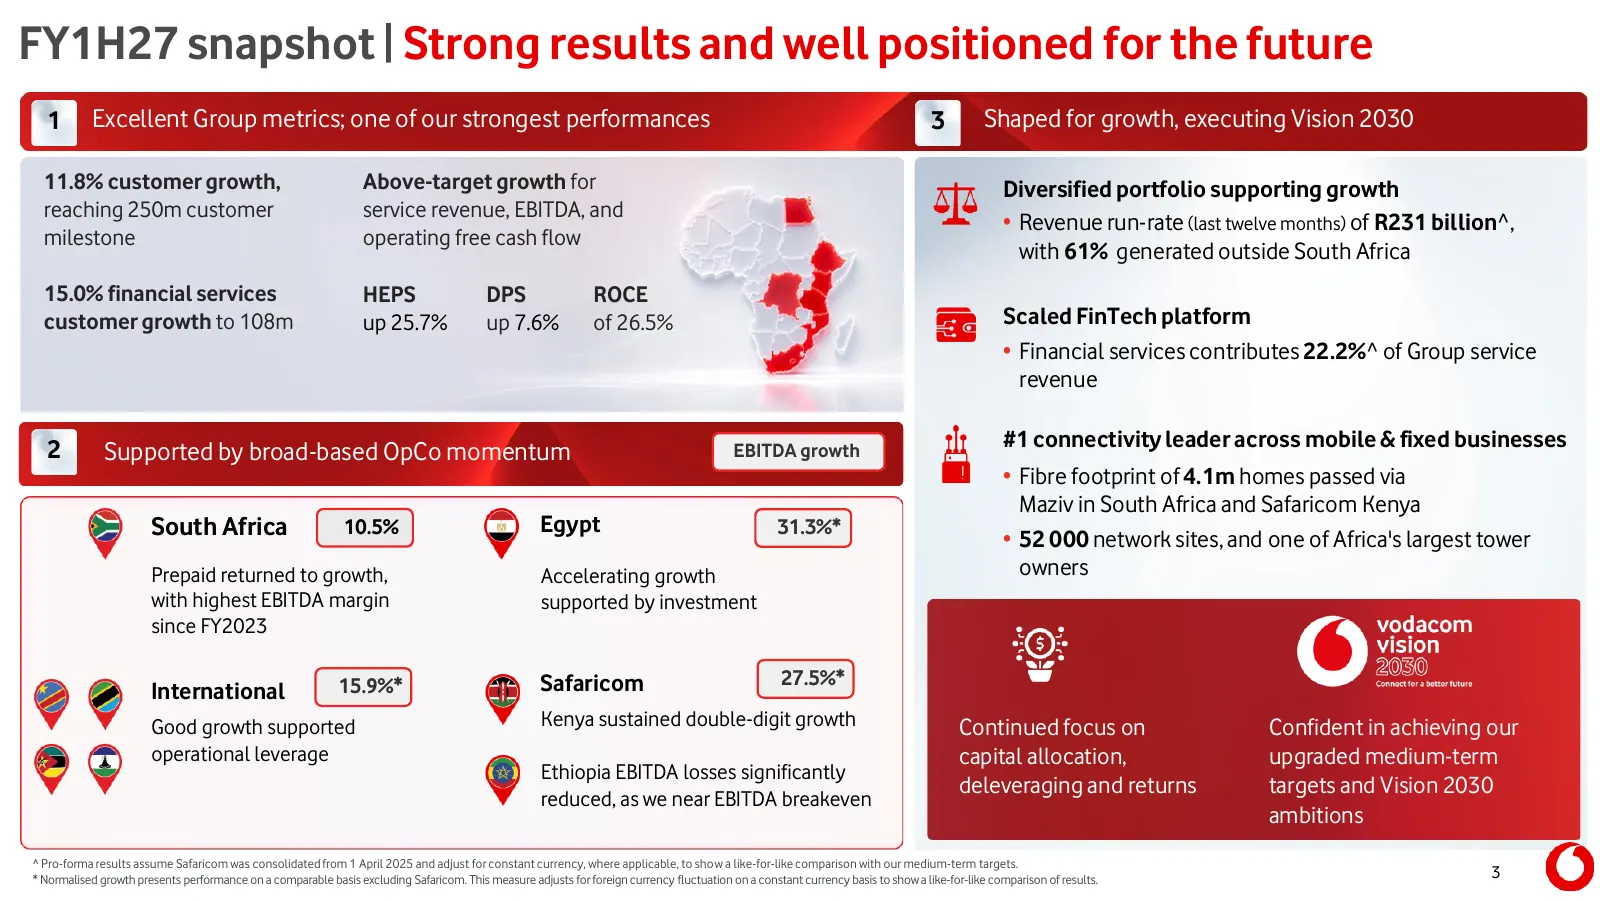
FY1H27 snapshot | Strong results and well positioned for the future 1 Excellent Group metrics; one of our strongest performances 3 Shaped for growth, executing Vision 2030 11.8% customer growth, Above-target growth for Diversified portfolio supporting growth reaching 250m customer service revenue, E
Slide 4: Our purpose | Connecting for a better future
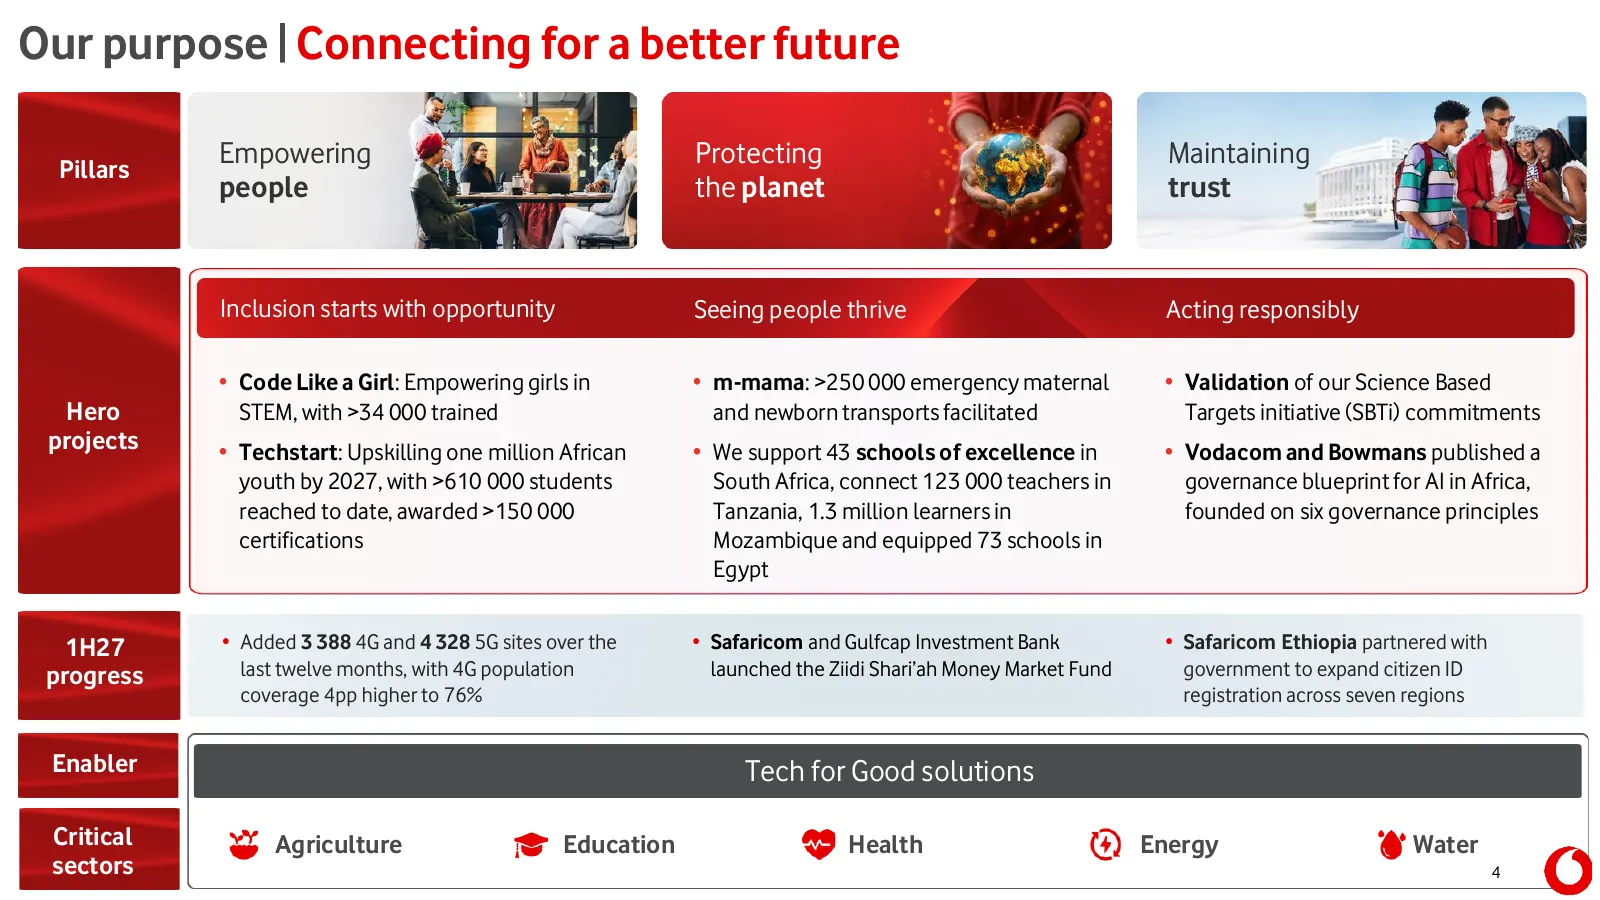
Our purpose | Connecting for a better future Pillars Empowering Protecting Maintaining people the planet trust Inclusion starts with opportunity Seeing people thrive Acting responsibly • Code Like a Girl: Empowering girls in • m-mama: >250 000 emergency maternal • Validation of our Science Based Her
Slide 5: Strategy | Executing on Vision 2030 with strong momentum
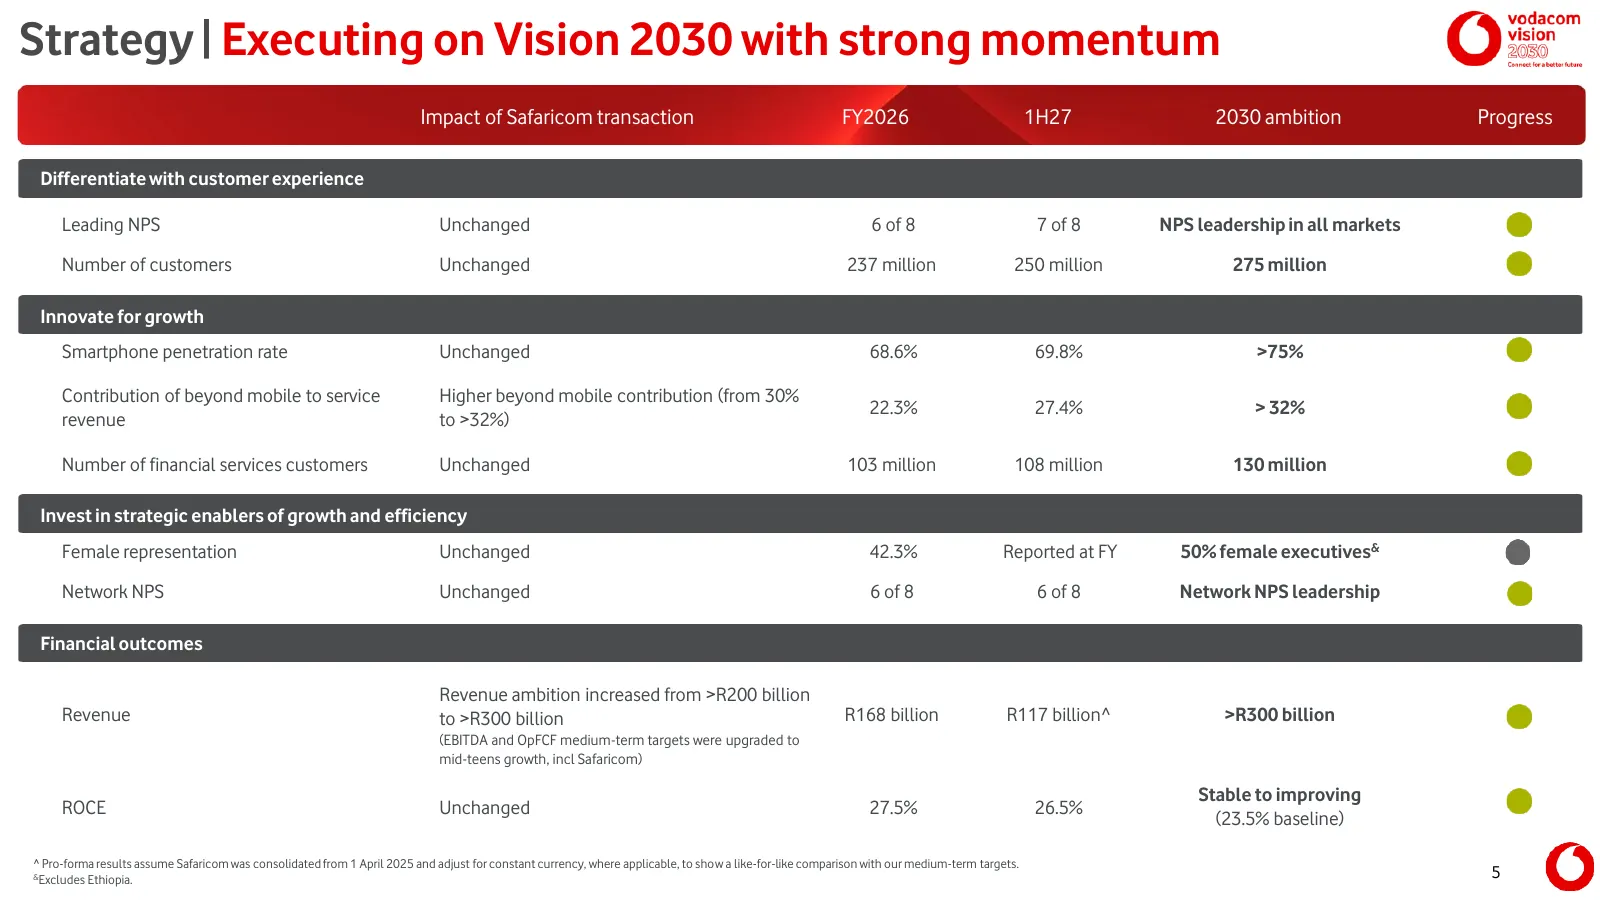
Strategy | Executing on Vision 2030 with strong momentum Impact of Safaricom transaction FY2026 1H27 2030 ambition Progress Differentiate with customer experience Leading NPS Unchanged 6 of 8 7 of 8 NPS leadership in all markets Number of customers Unchanged 237 million 250 million 275 million Innov
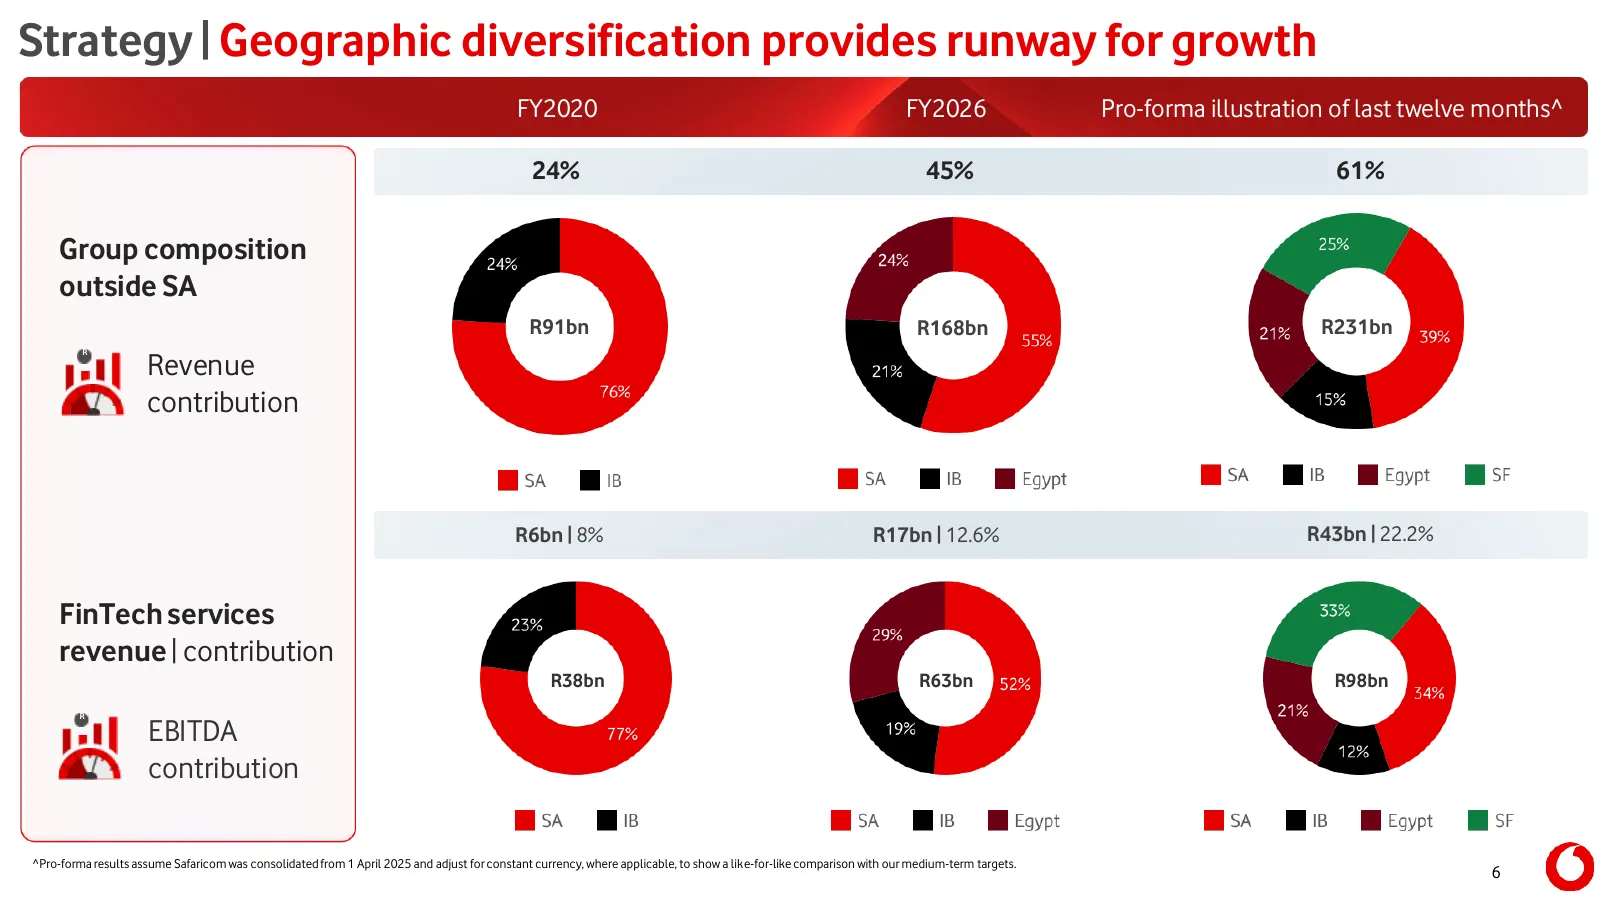
Slide 6: Strategy | Geographic diversification provides runway for growth
Strategy | Geographic diversification provides runway for growth FY2020 FY2026 Pro-forma illustration of last twelve months^ 24% 45% 61% Group composition outside SA R91bn R168bn R231bn Revenue R contribution R6bn | 8% R17bn | 12.6% R43bn | 22.2% FinTech services revenue | contribution R38bn R63bn R
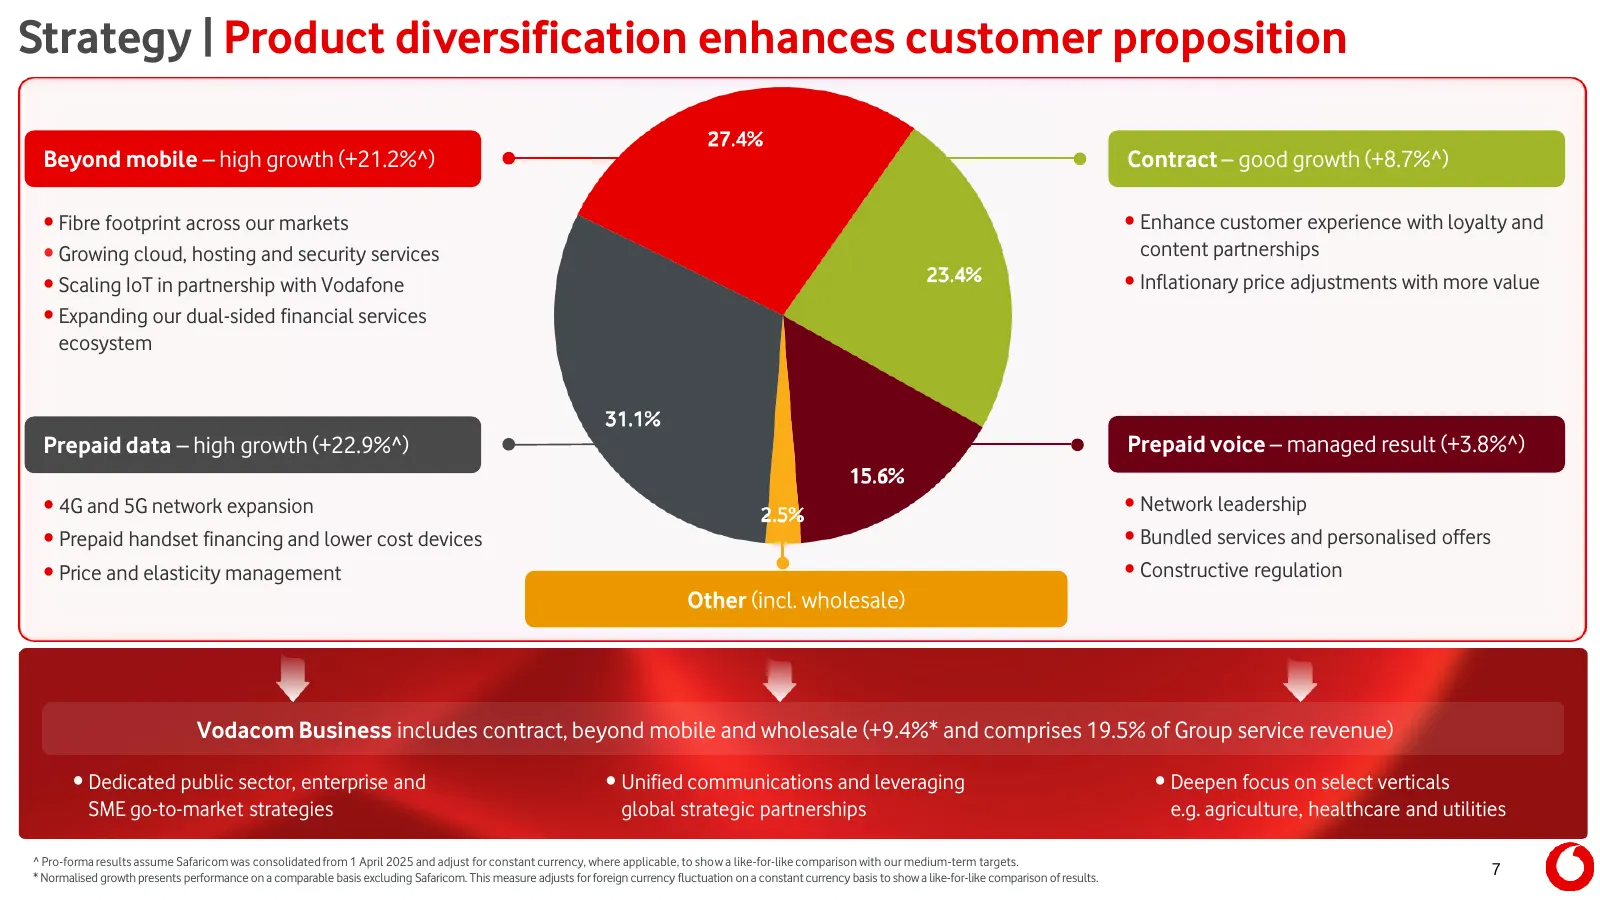
Slide 7: Strategy | Product diversification enhances customer proposition
Strategy | Product diversification enhances customer proposition Beyond mobile – high growth (+21.2%^) Contract – good growth (+8.7%^) • Fibre footprint across our markets • Enhance customer experience with loyalty and • Growing cloud, hosting and security services content partnerships • Scaling IoT
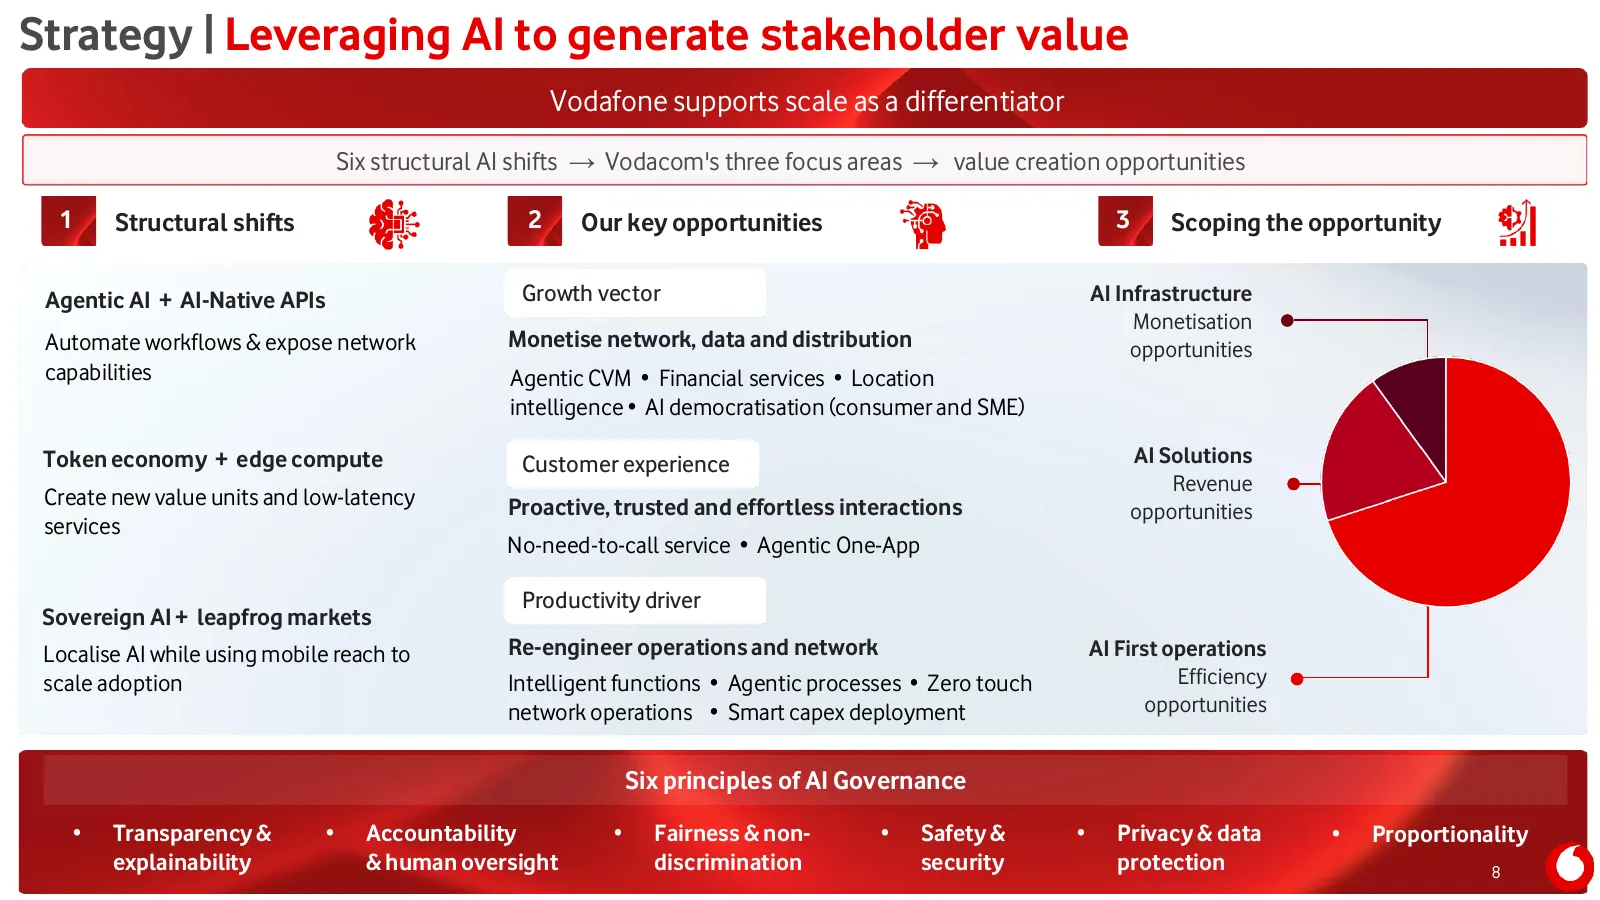
Slide 8: Strategy | Leveraging AI to generate stakeholder value
Strategy | Leveraging AI to generate stakeholder value Vodafone supports scale as a differentiator Six structural AI shifts → Vodacom's three focus areas → value creation opportunities 1 Structural shifts 2 2 opportunities Our key 3 Scoping the opportunity Agentic AI + AI-Native APIs Growth vector A
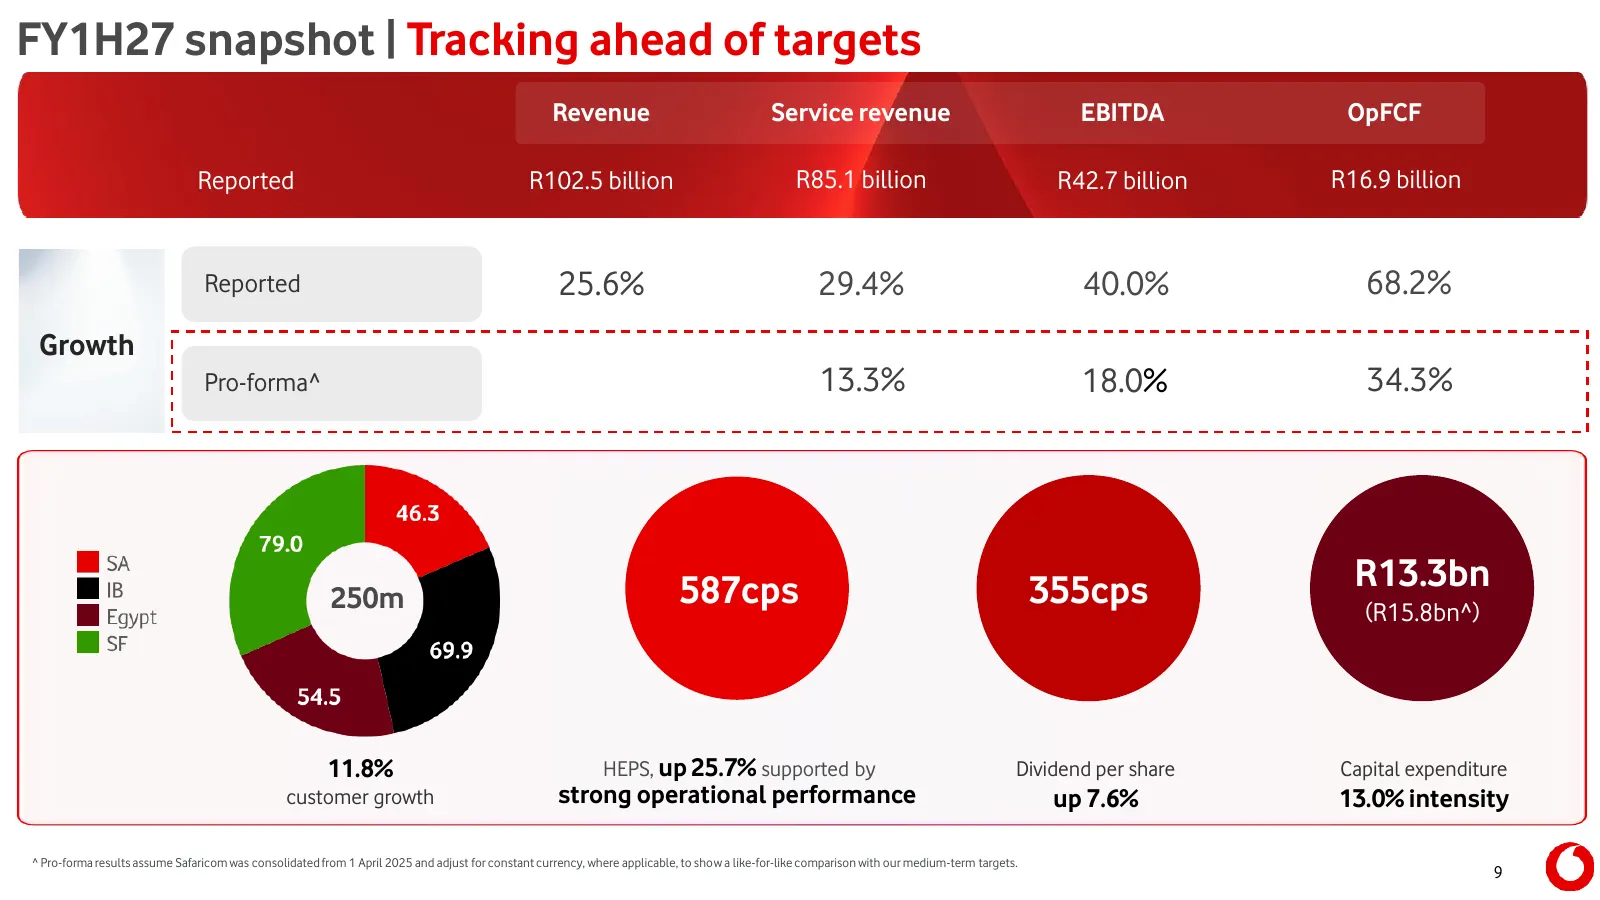
Slide 9: FY1H27 snapshot | Tracking ahead of targets
FY1H27 snapshot | Tracking ahead of targets Revenue Service revenue EBITDA OpFCF Reported R102.5 billion R85.1 billion R42.7 billion R16.9 billion Reported 25.6% 29.4% 40.0% 68.2% Growth Pro-forma^ 13.3% 18.0% 34.3% 587cps 355cps R13.3bn 250m (R15.8bn^) 11.8% HEPS, up 25.7% supported by Dividend per
Slide 10: Beyond mobile | Strong growth drivers in each geographic segment
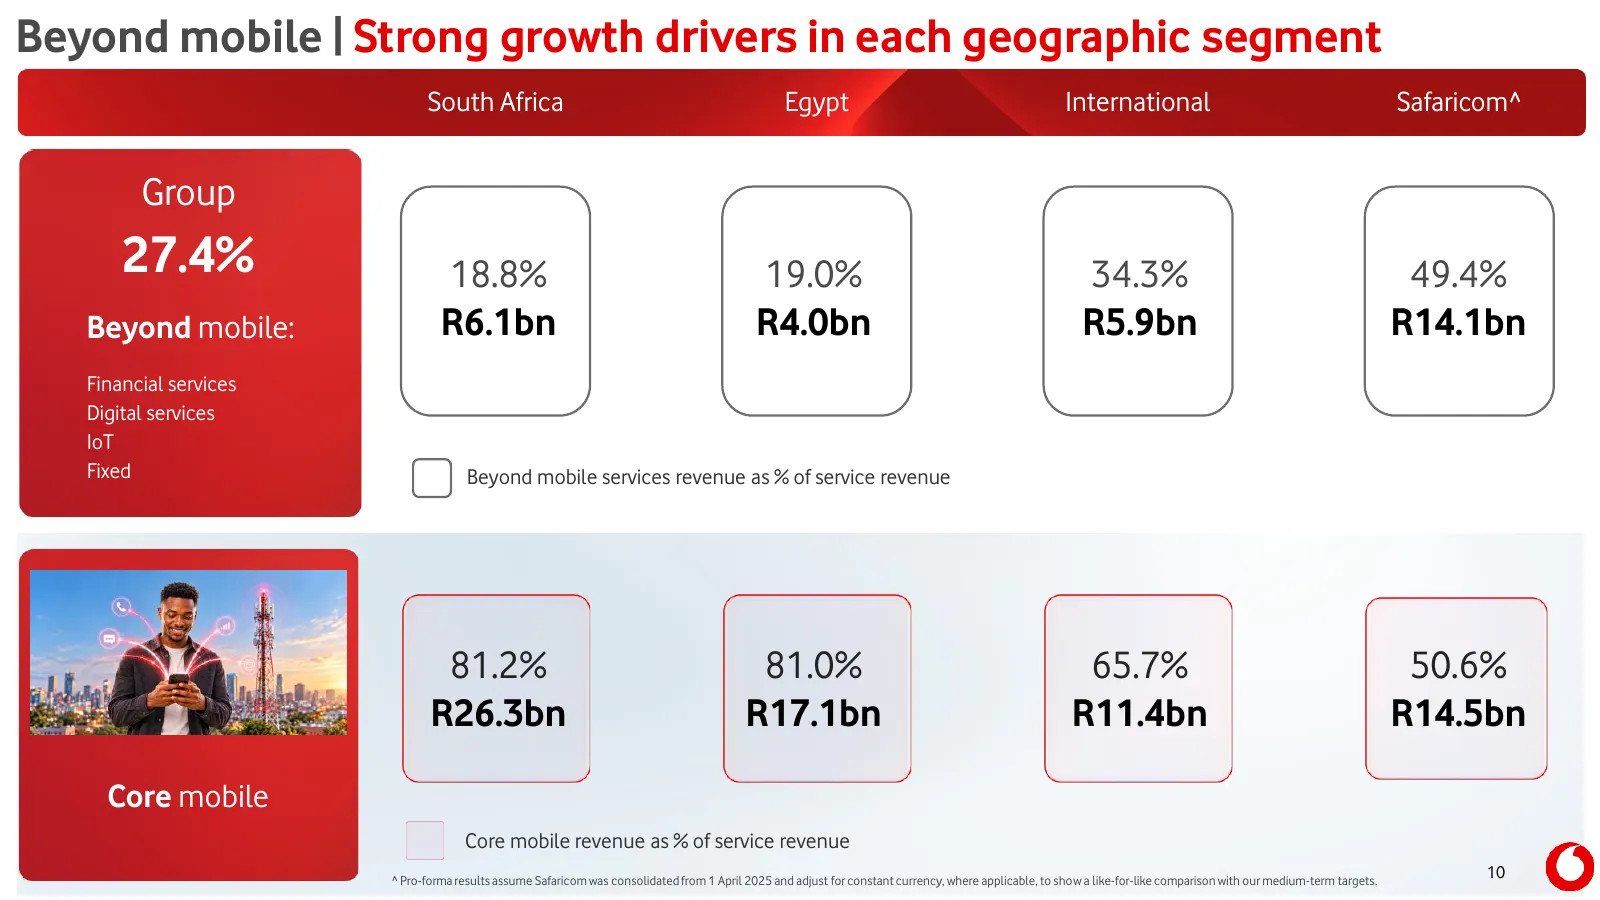
Beyond mobile | Strong growth drivers in each geographic segment South Africa Egypt International Safaricom^ Group 27.4% 18.8% 19.0% 34.3% 49.4% Beyond mobile: R6.1bn R4.0bn R5.9bn R14.1bn Financial services Digital services IoT Fixed Beyond mobile services revenue as % of service revenue 81.2% 81.0
Slide 11: FinTech | Scaling our dual-sided financial services ecosystem
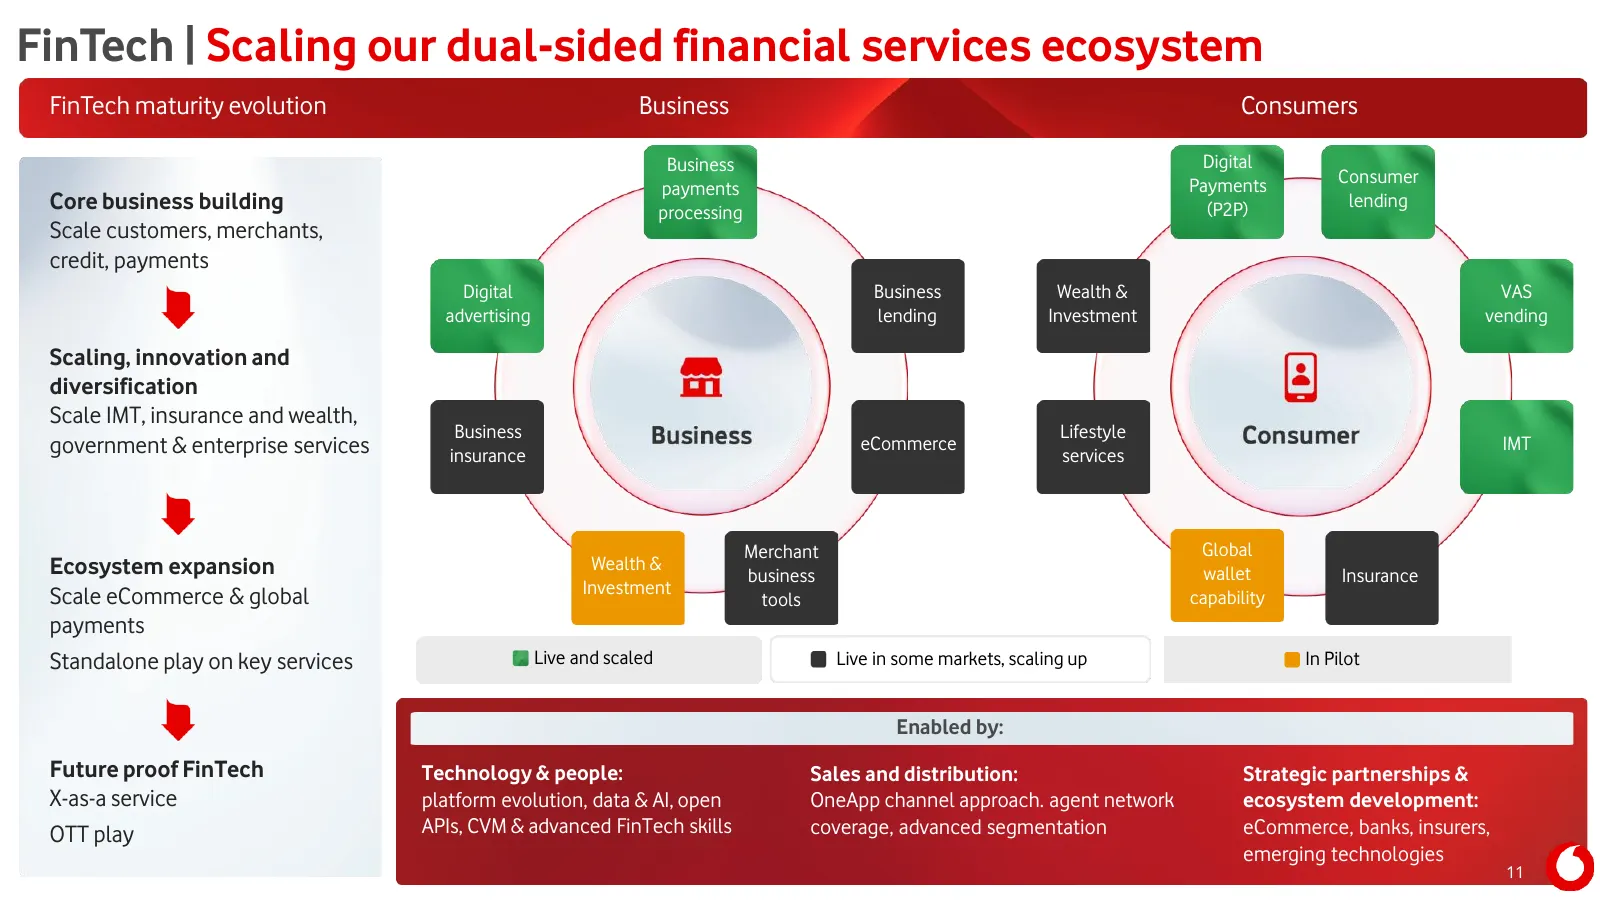
FinTech | Scaling our dual-sided financial services ecosystem FinTech maturity evolution Business Consumers Business Digital Payments Consumer payments Core business building processing (P2P) lending Scale customers, merchants, credit, payments Digital Business Wealth & VAS advertising lending Inves
Slide 12: FinTech | Deepening customer engagement, merchant adoption & beyond-core services
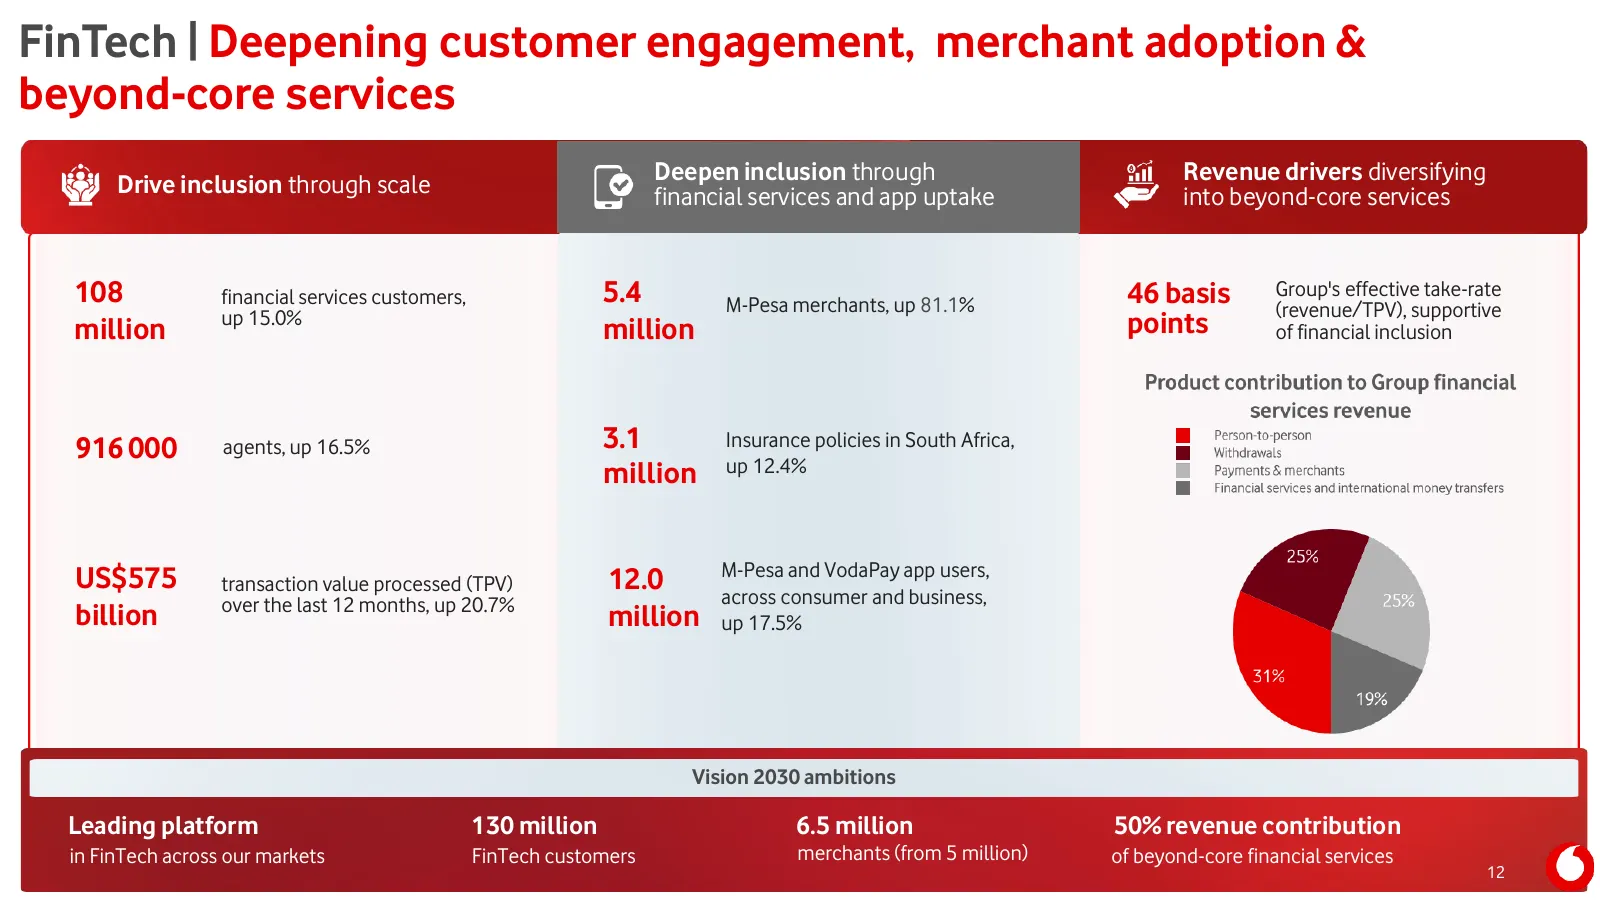
FinTech | Deepening customer engagement, merchant adoption & beyond-core services Drive inclusion through scale Deepen inclusion through Revenue drivers diversifying financial services and app uptake into beyond-core services 108 financial services customers, 5.4 M-Pesa merchants, up 81.1% 46 basis
Slide 13: FinTech | Leading platform in Africa
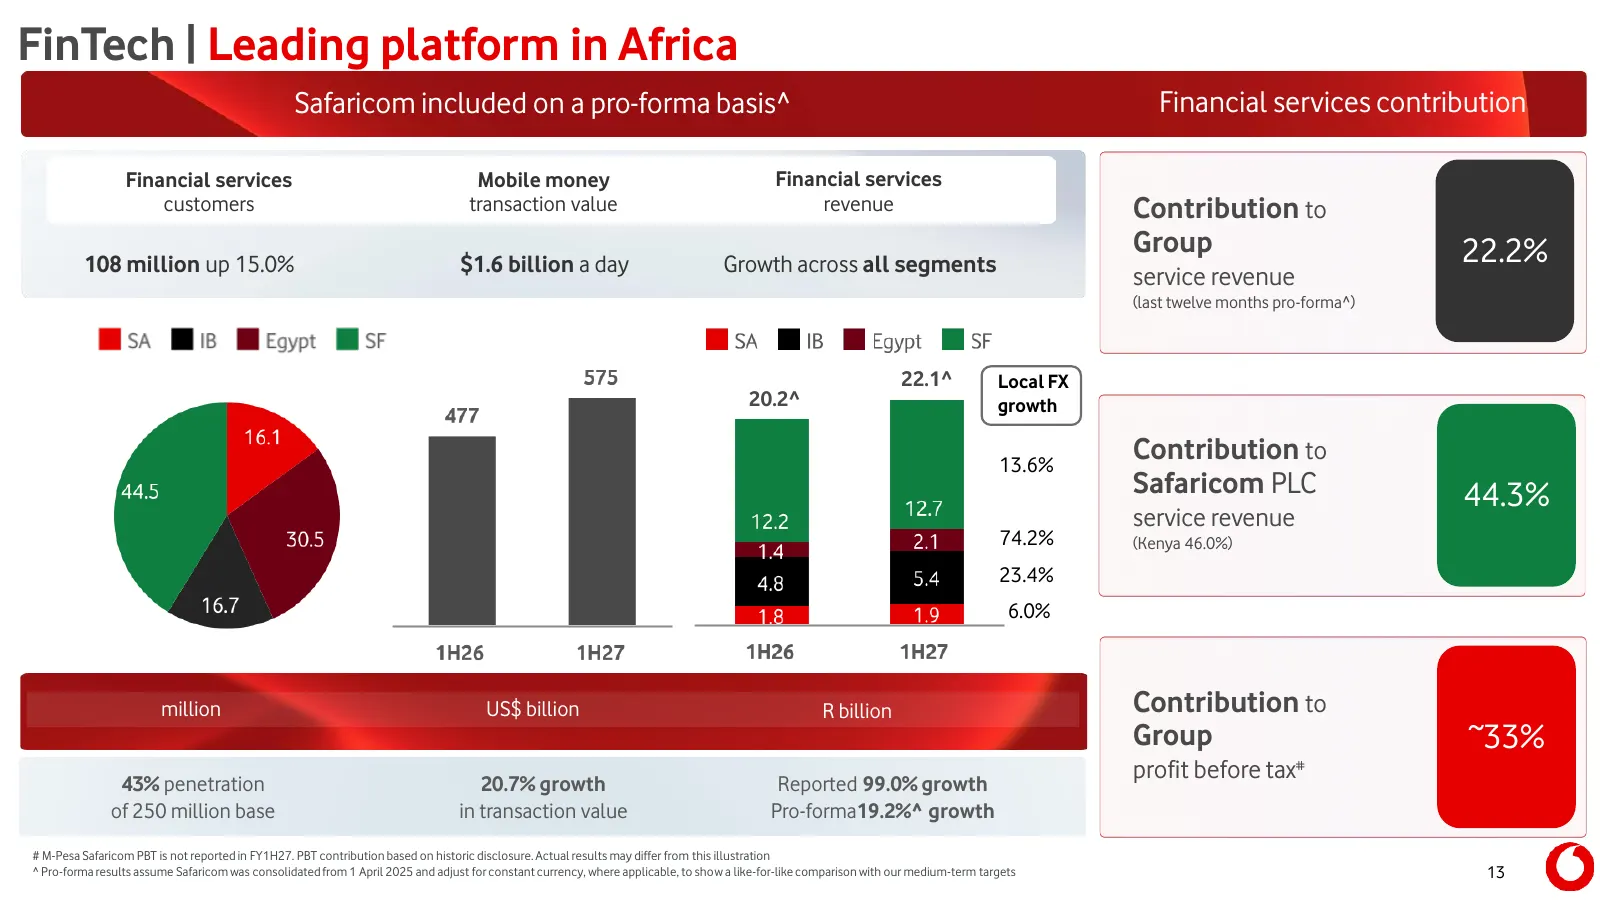
FinTech | Leading platform in Africa Safaricom included on a pro-forma basis^ Financial services contribution Financial services Mobile money Financial services customers transaction value revenue Contribution to Group 22.2% 108 million up 15.0% $1.6 billion a day Growth across all segments service
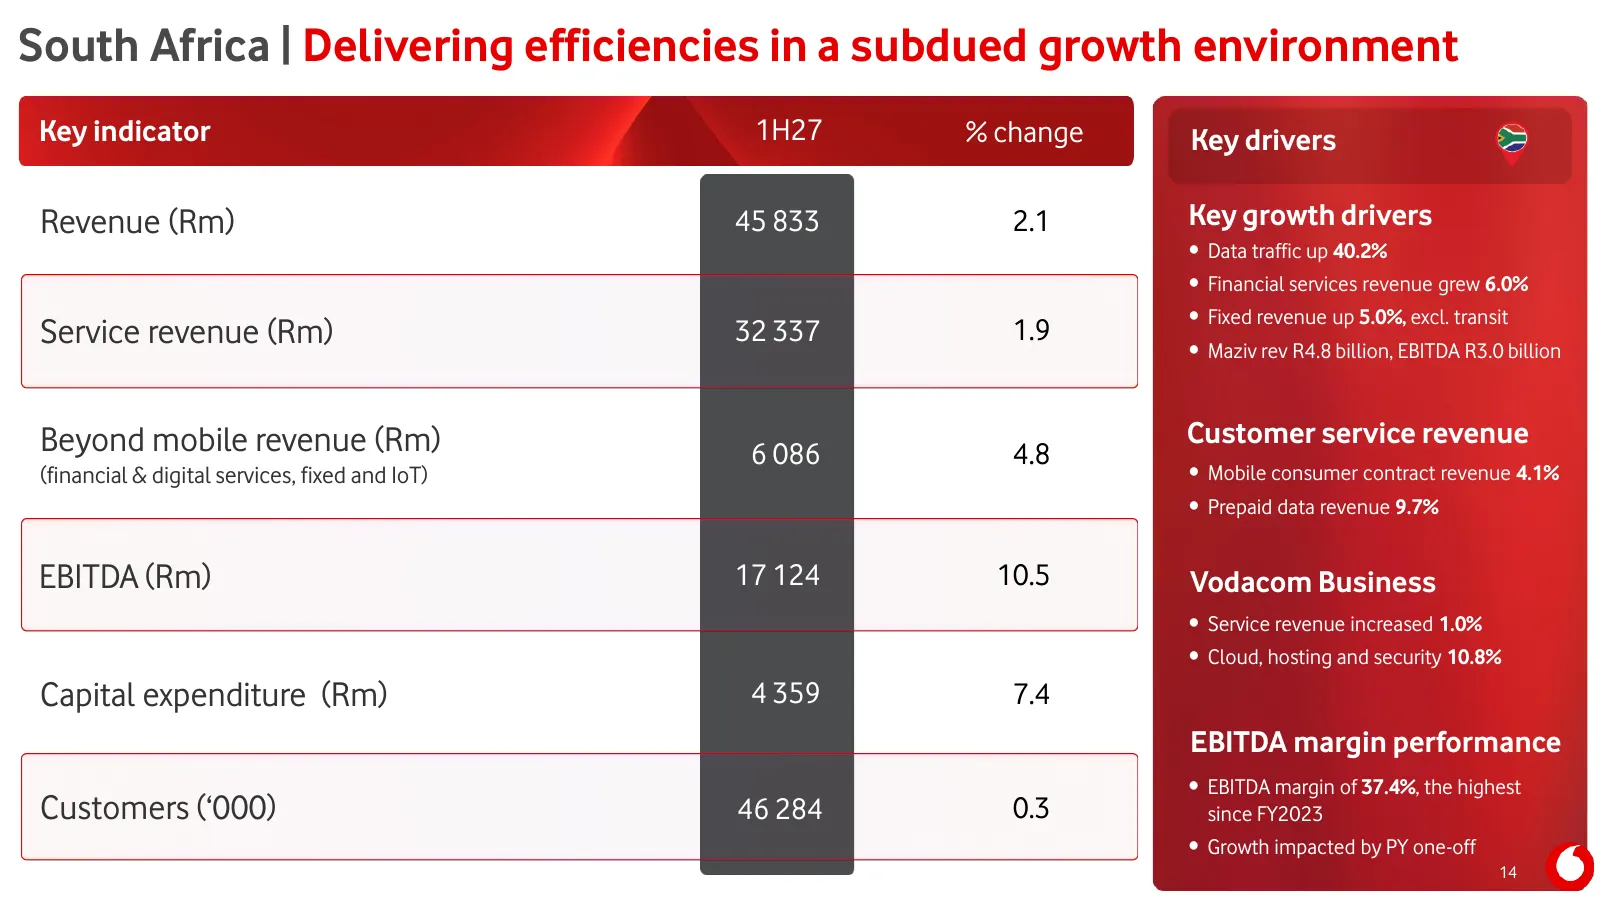
Slide 14: South Africa | Delivering efficiencies in a subdued growth environment
South Africa | Delivering efficiencies in a subdued growth environment Key indicator 1H27 % change Key drivers Revenue (Rm) 45 833 2.1 Key growth drivers • Data traffic up 40.2% • Financial services revenue grew 6.0% • Fixed revenue up 5.0%, excl. transit Service revenue (Rm) 32 337 1.9 • Maziv rev
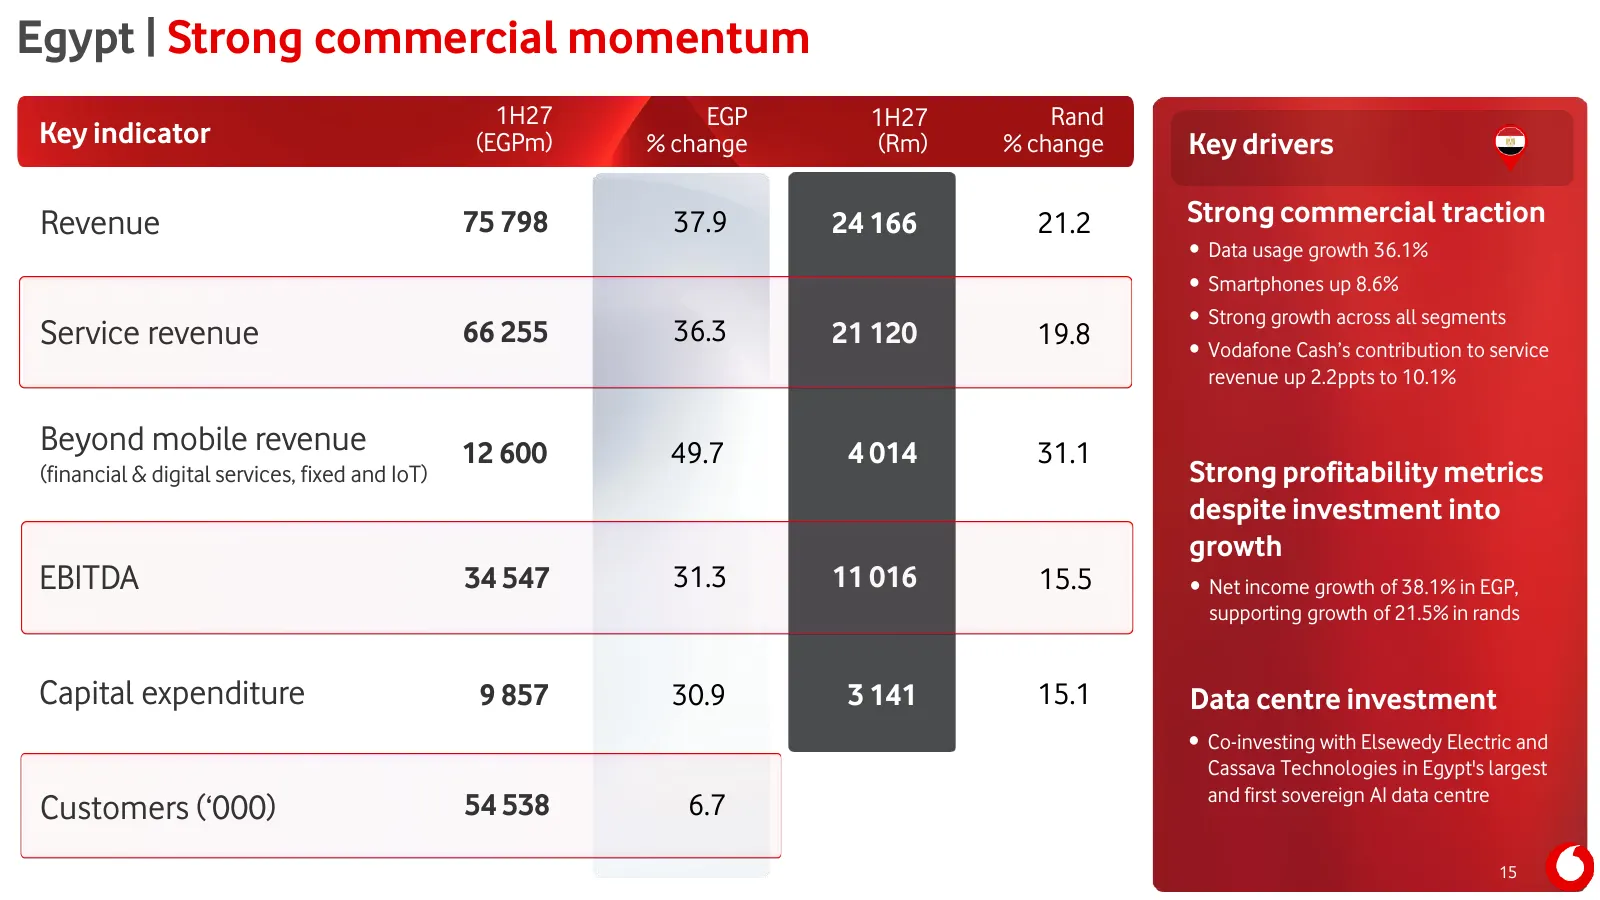
Slide 15: Egypt | Strong commercial momentum
Egypt | Strong commercial momentum 1H27 EGP 1H27 Rand Key indicator (EGPm) % change (Rm) % change Key drivers Revenue 75 798 37.9 24 166 21.2 Strong commercial traction • Data usage growth 36.1% • Smartphones up 8.6% • Strong growth across all segments Service revenue 66 255 36.3 21 120 19.8 • Vodaf
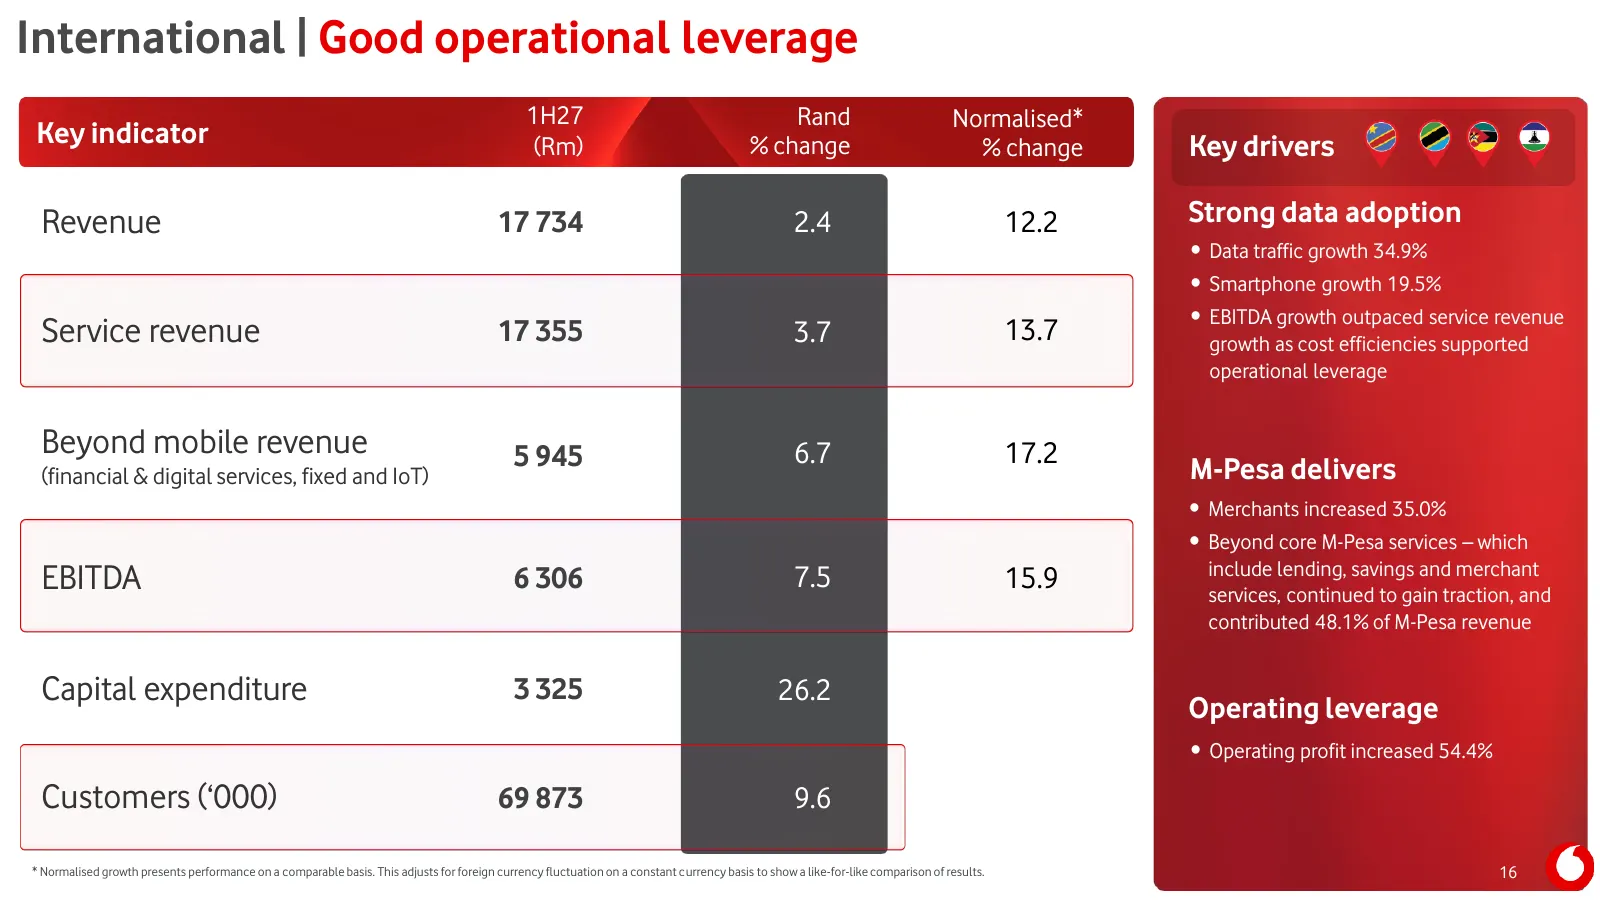
Slide 16: International | Good operational leverage
International | Good operational leverage 1H27 Rand Normalised* Key indicator (Rm) % change % change Key drivers Revenue 17 734 2.4 12.2 Strong data adoption • Data traffic growth 34.9% • Smartphone growth 19.5% • EBITDA growth outpaced service revenue Service revenue 17 355 3.7 13.7 growth as cost
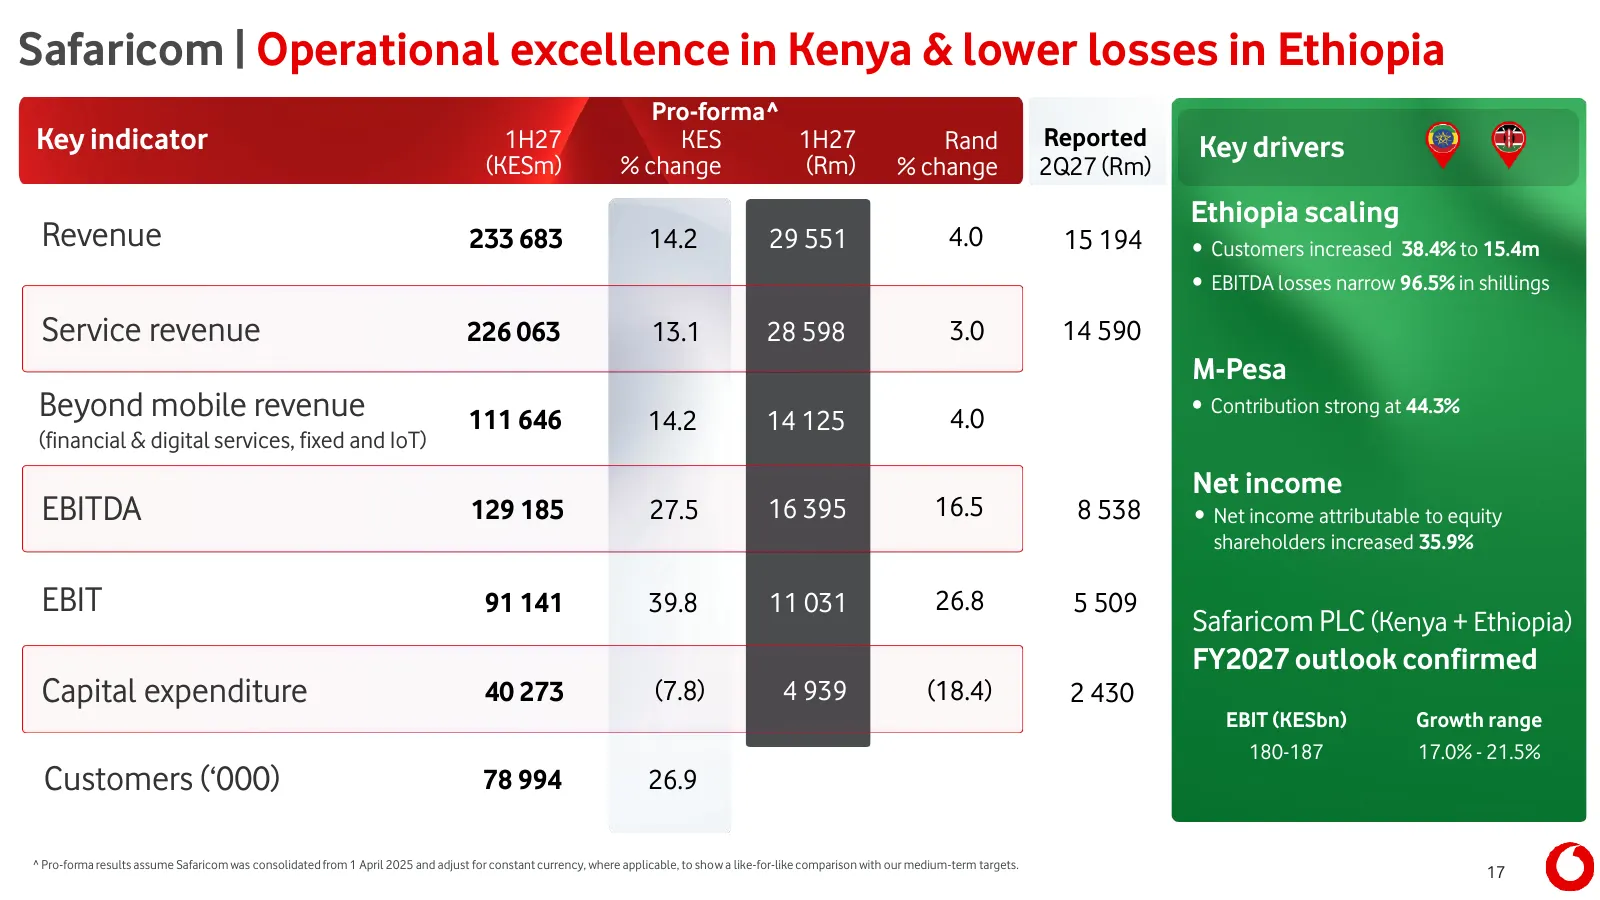
Slide 17: Safaricom | Operational excellence in Kenya & lower losses in Ethiopia
Safaricom | Operational excellence in Kenya & lower losses in Ethiopia Pro-forma^ Key indicator 1H27 KES 1H27 Rand Reported Key drivers (KESm) % change (Rm) % change 2Q27 (Rm) Ethiopia scaling Revenue 233 683 14.2 29 551 4.0 15 194 • Customers increased 38.4% to 15.4m • EBITDA losses narrow 96.5% in

Slide 18: Financial Review
Financial Review everyone.connected
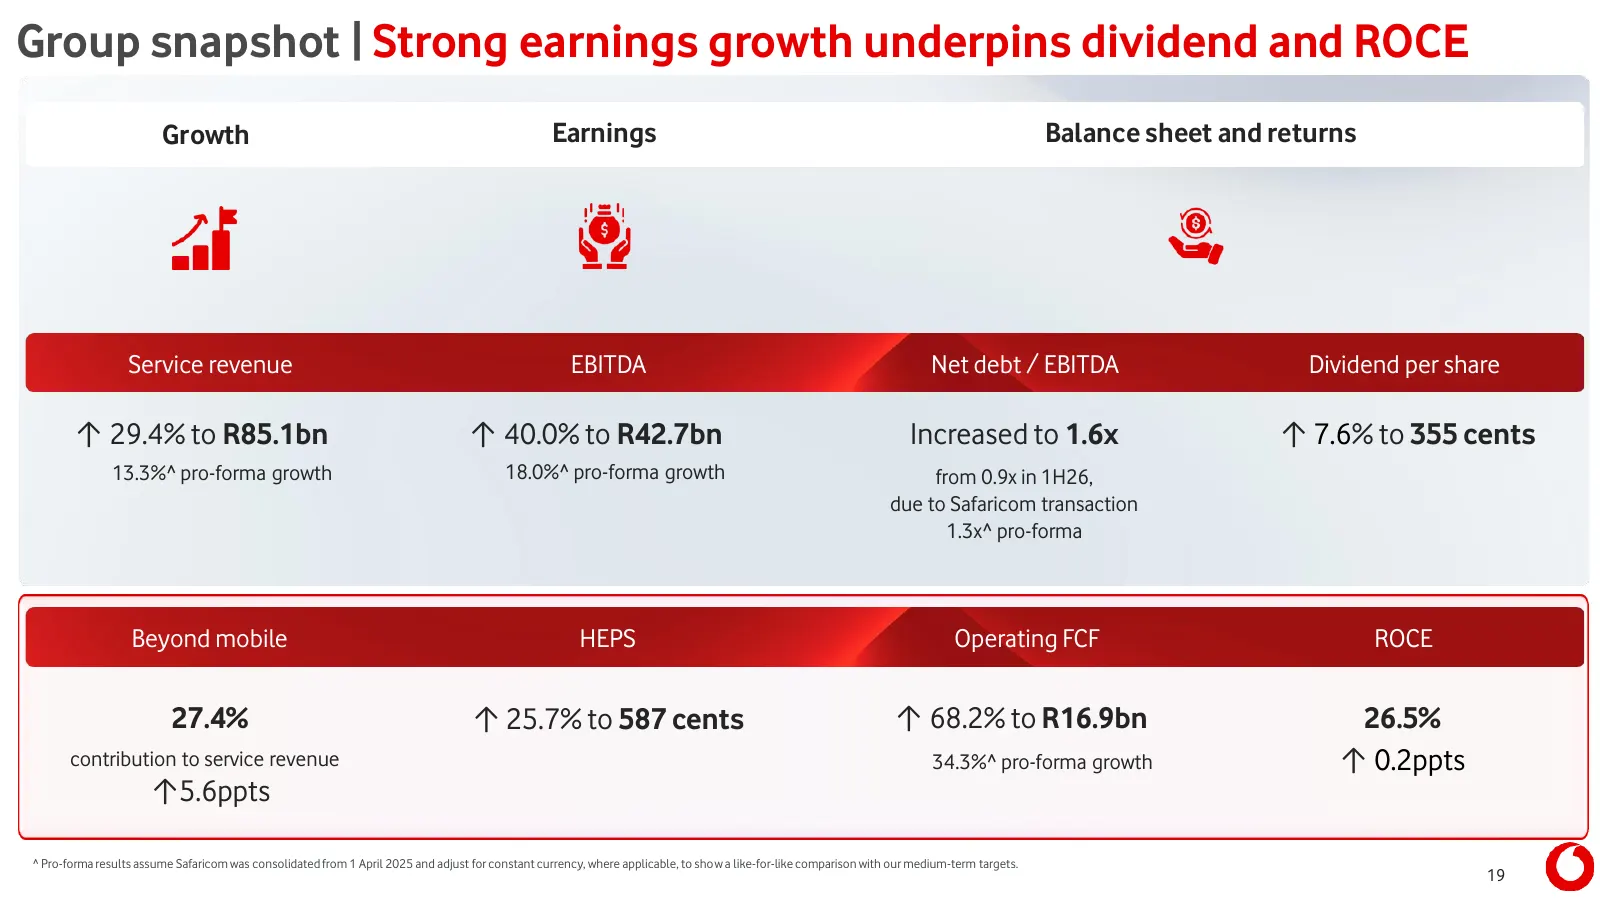
Slide 19: Group snapshot | Strong earnings growth underpins dividend and ROCE
Group snapshot | Strong earnings growth underpins dividend and ROCE Growth Earnings Balance sheet and returns Service revenue EBITDA Net debt / EBITDA Dividend per share ↑ 29.4% to R85.1bn ↑ 40.0% to R42.7bn Increased to 1.6x ↑ 7.6% to 355 cents 13.3%^ pro-forma growth 18.0%^ pro-forma growth from 0
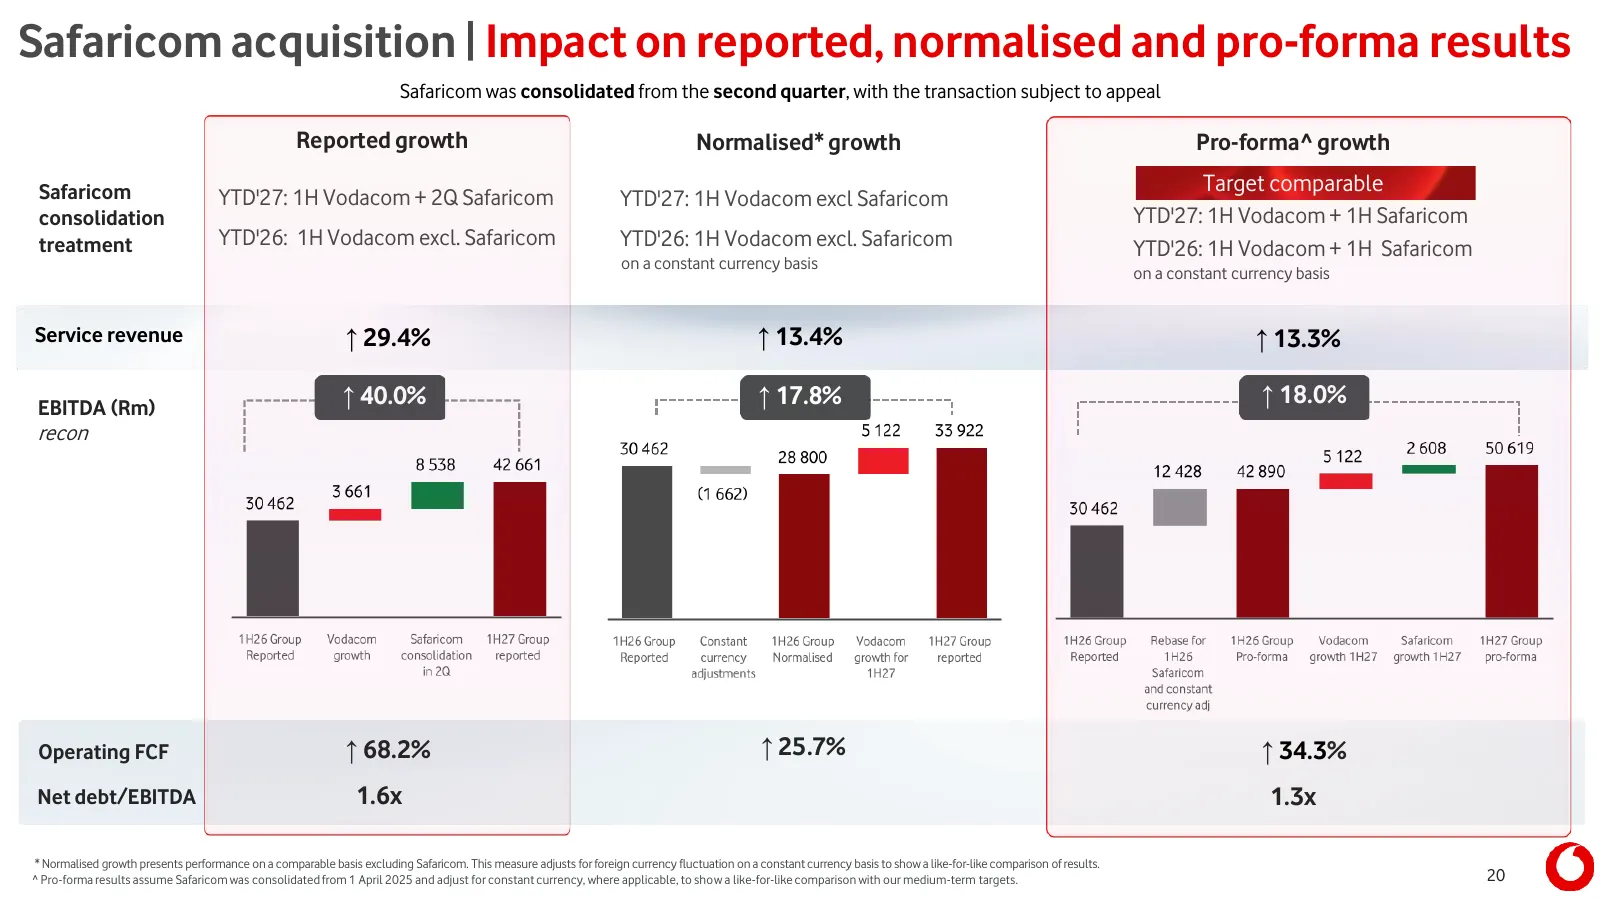
Slide 20: Safaricom acquisition | Impact on reported, normalised and pro-forma results
Safaricom acquisition | Impact on reported, normalised and pro-forma results Safaricom was consolidated from the second quarter, with the transaction subject to appeal Reported growth Normalised* growth Pro-forma^ growth Safaricom Target comparable YTD'27: 1H Vodacom + 2Q Safaricom YTD'27: 1H Vodaco
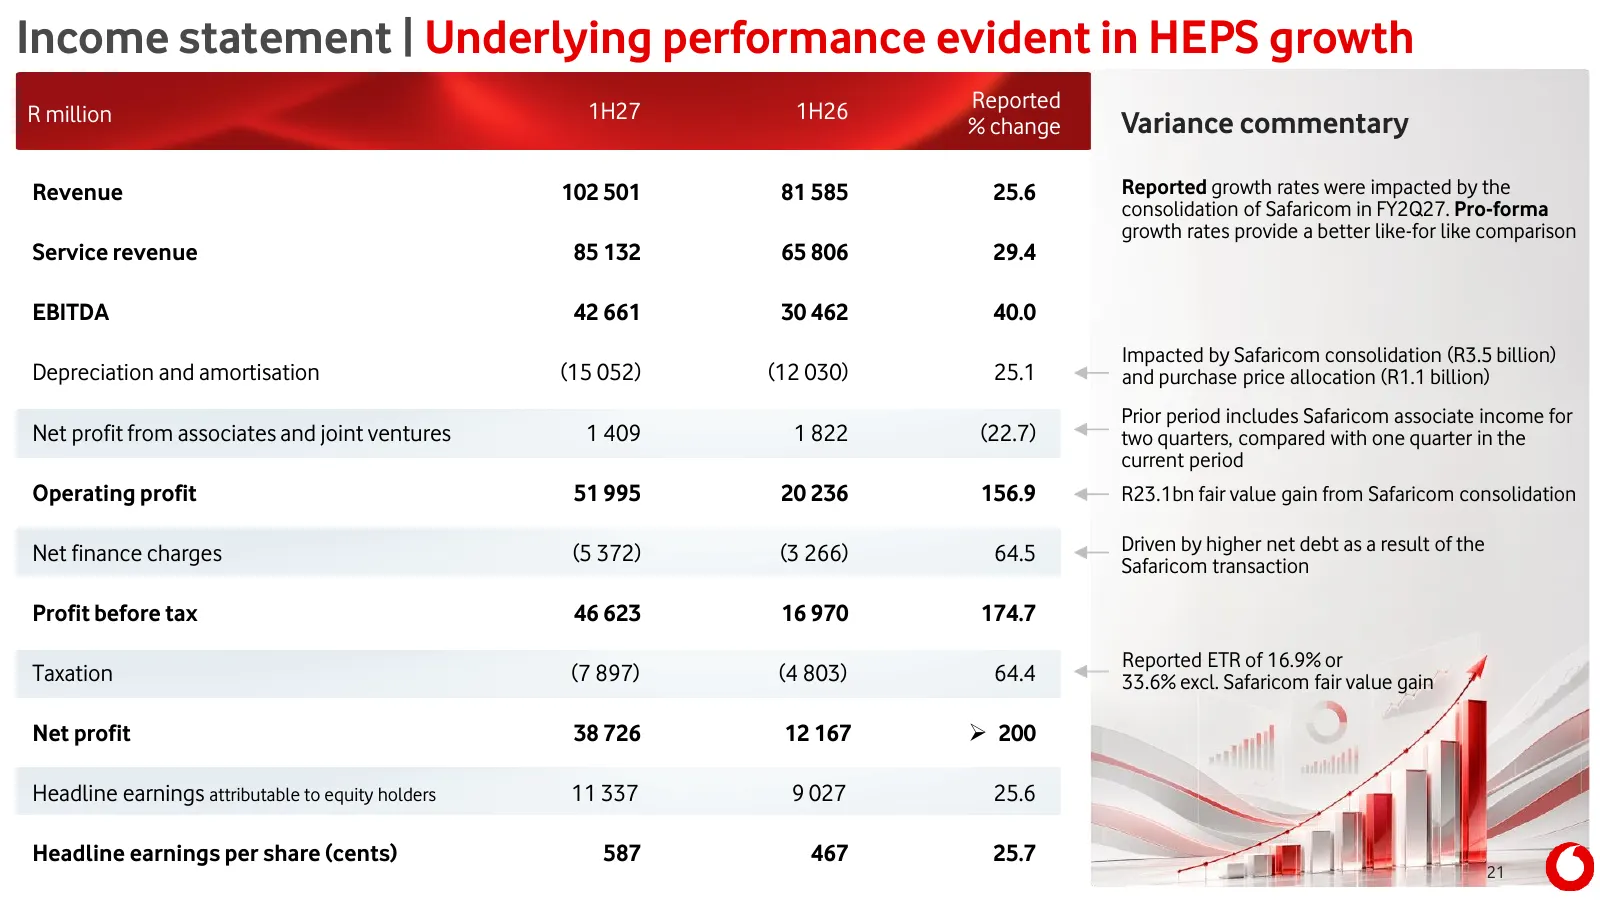
Slide 21: Income statement | Underlying performance evident in HEPS growth
Income statement | Underlying performance evident in HEPS growth 1H27 1H26 Reported R million % change Variance commentary Revenue 102 501 81 585 25.6 Reported growth rates were impacted by the consolidation of Safaricom in FY2Q27. Pro-forma growth rates provide a better like-for like comparison Ser
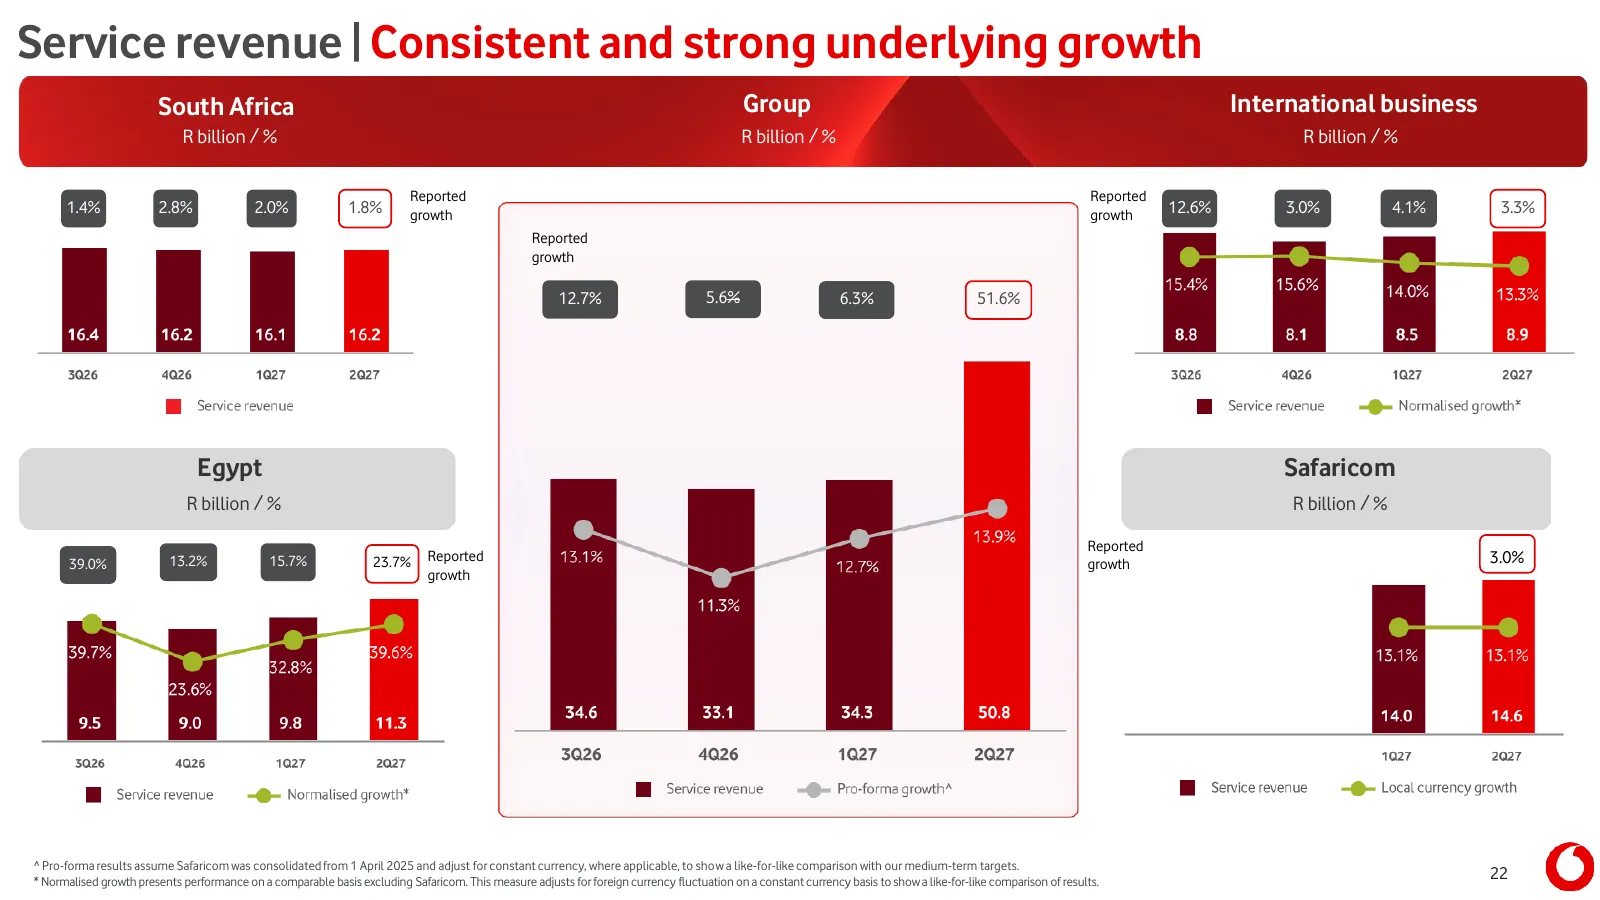
Slide 22: Service revenue | Consistent and strong underlying growth
Service revenue | Consistent and strong underlying growth South Africa Group International business R billion / % R billion / % R billion / % Reported Reported 1.4% 2.8% 2.0% 1.8% growth growth 12.6% 3.0% 4.1% 3.3% Reported growth 12.7% 5.6% 6.3% 51.6% Egypt Safaricom R billion / % R billion / % Rep
Slide 23: Safaricom acquisition | Accounting implications
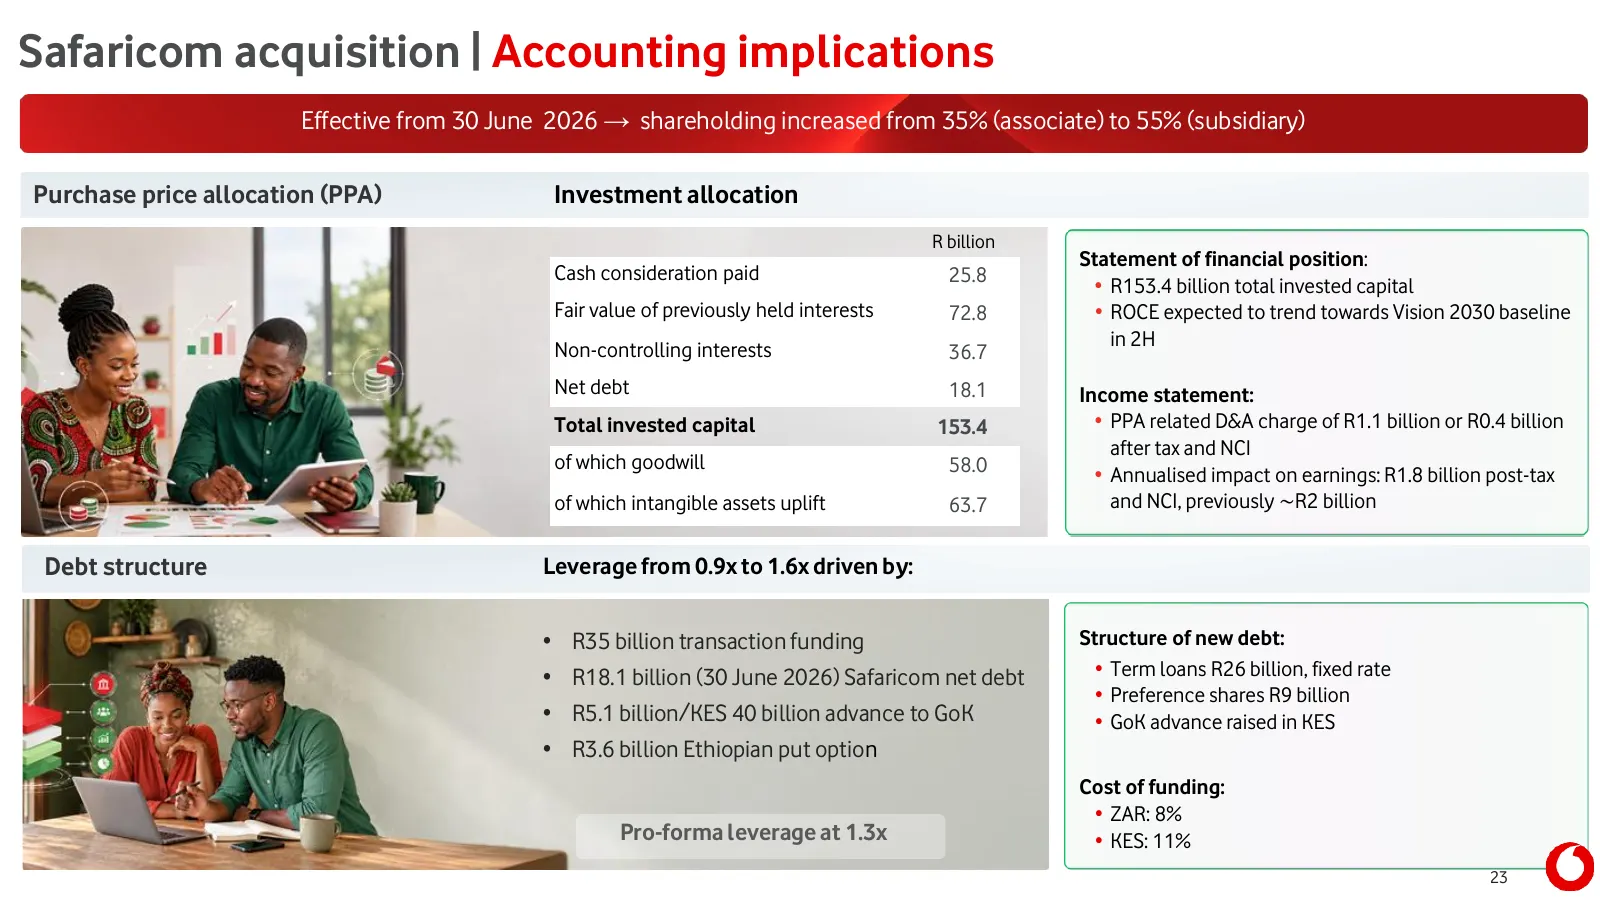
Safaricom acquisition | Accounting implications Effective from 30 June 2026 → shareholding increased from 35% (associate) to 55% (subsidiary) Purchase price allocation (PPA) Investment allocation R billion Statement of financial position: Cash consideration paid 25.8 • R153.4 billion total invested
Slide 24: Cash flow | Equity free cash flow reflects Safaricom NCI dividend payment
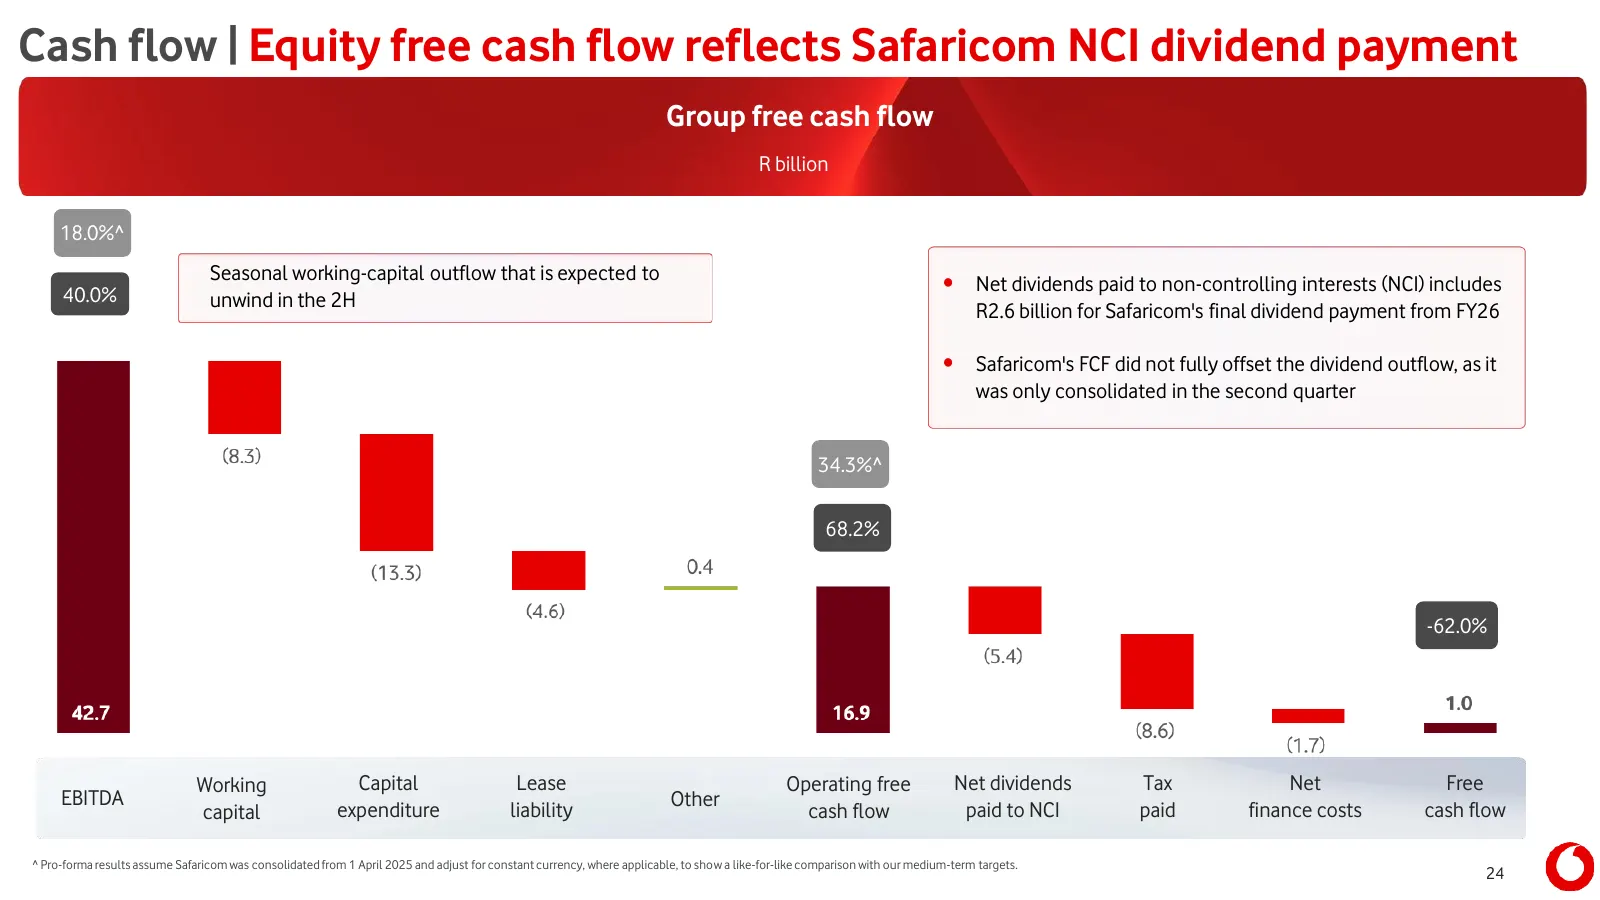
Cash flow | Equity free cash flow reflects Safaricom NCI dividend payment Group free cash flow R billion 18.0%^ Seasonal working-capital outflow that is expected to 40.0% • Net dividends paid to non-controlling interests (NCI) includes unwind in the 2H R2.6 billion for Safaricom's final dividend pay
Slide 25: Headline earnings | Excellent growth driven by EBITDA
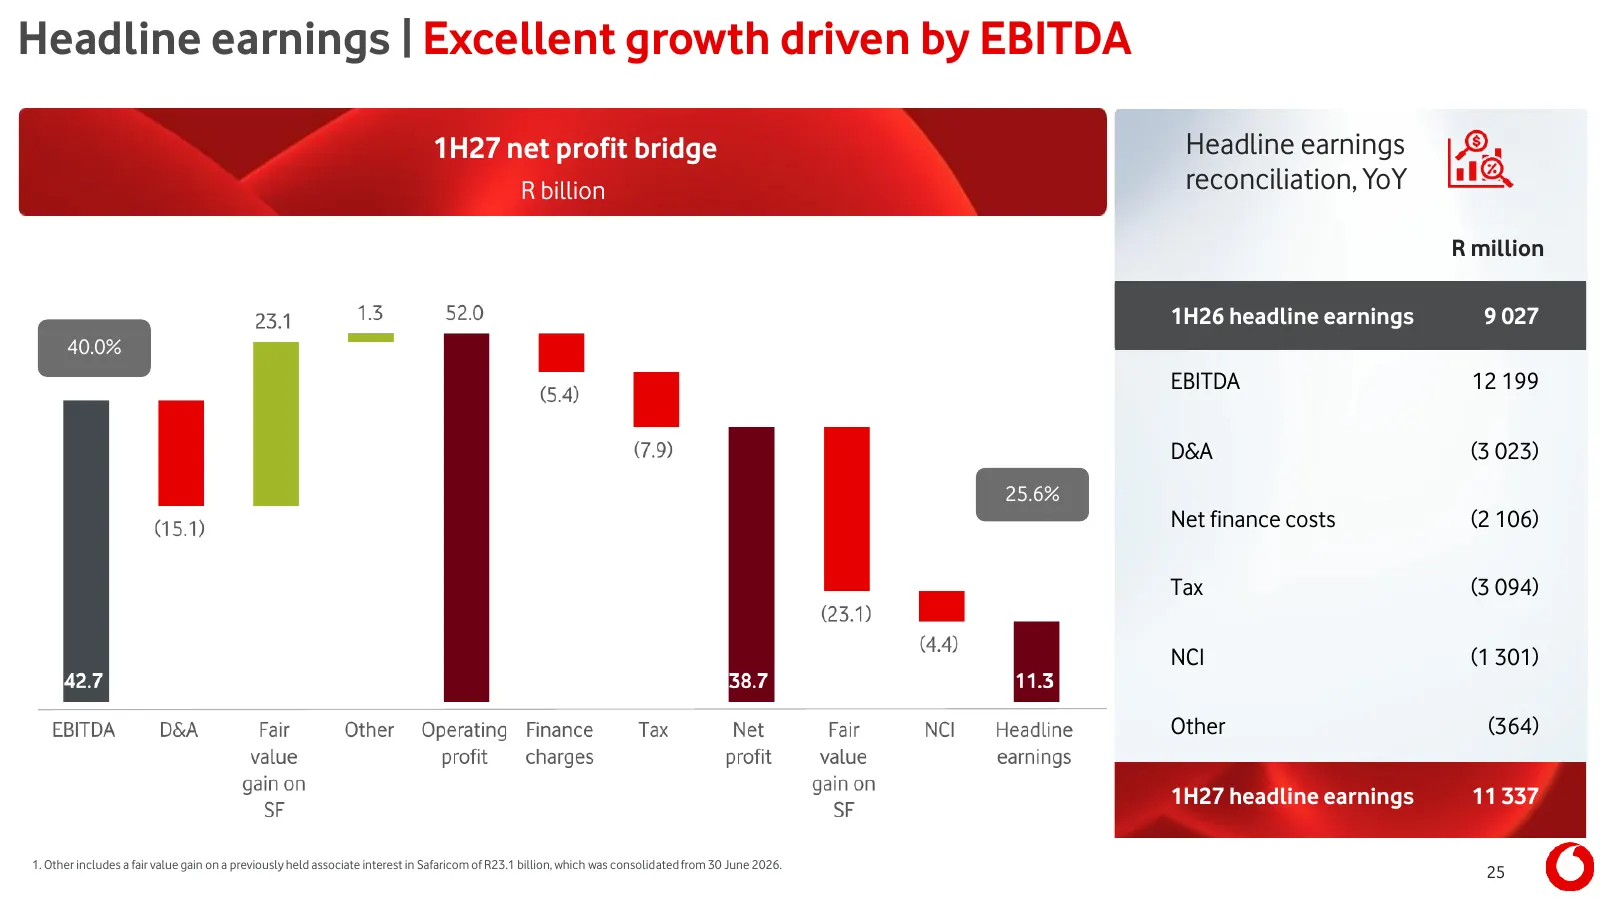
Headline earnings | Excellent growth driven by EBITDA 1H27 net profit bridge Headline earnings R billion reconciliation, YoY R million 1H26 headline earnings 9 027 40.0% EBITDA 12 199 D&A (3 023) 25.6% Net finance costs (2 106) Tax (3 094) NCI (1 301) Other (364) 1H27 headline earnings 11 337 1. Oth
Slide 26: Shareholder returns | Committed to attractive and sustainable returns
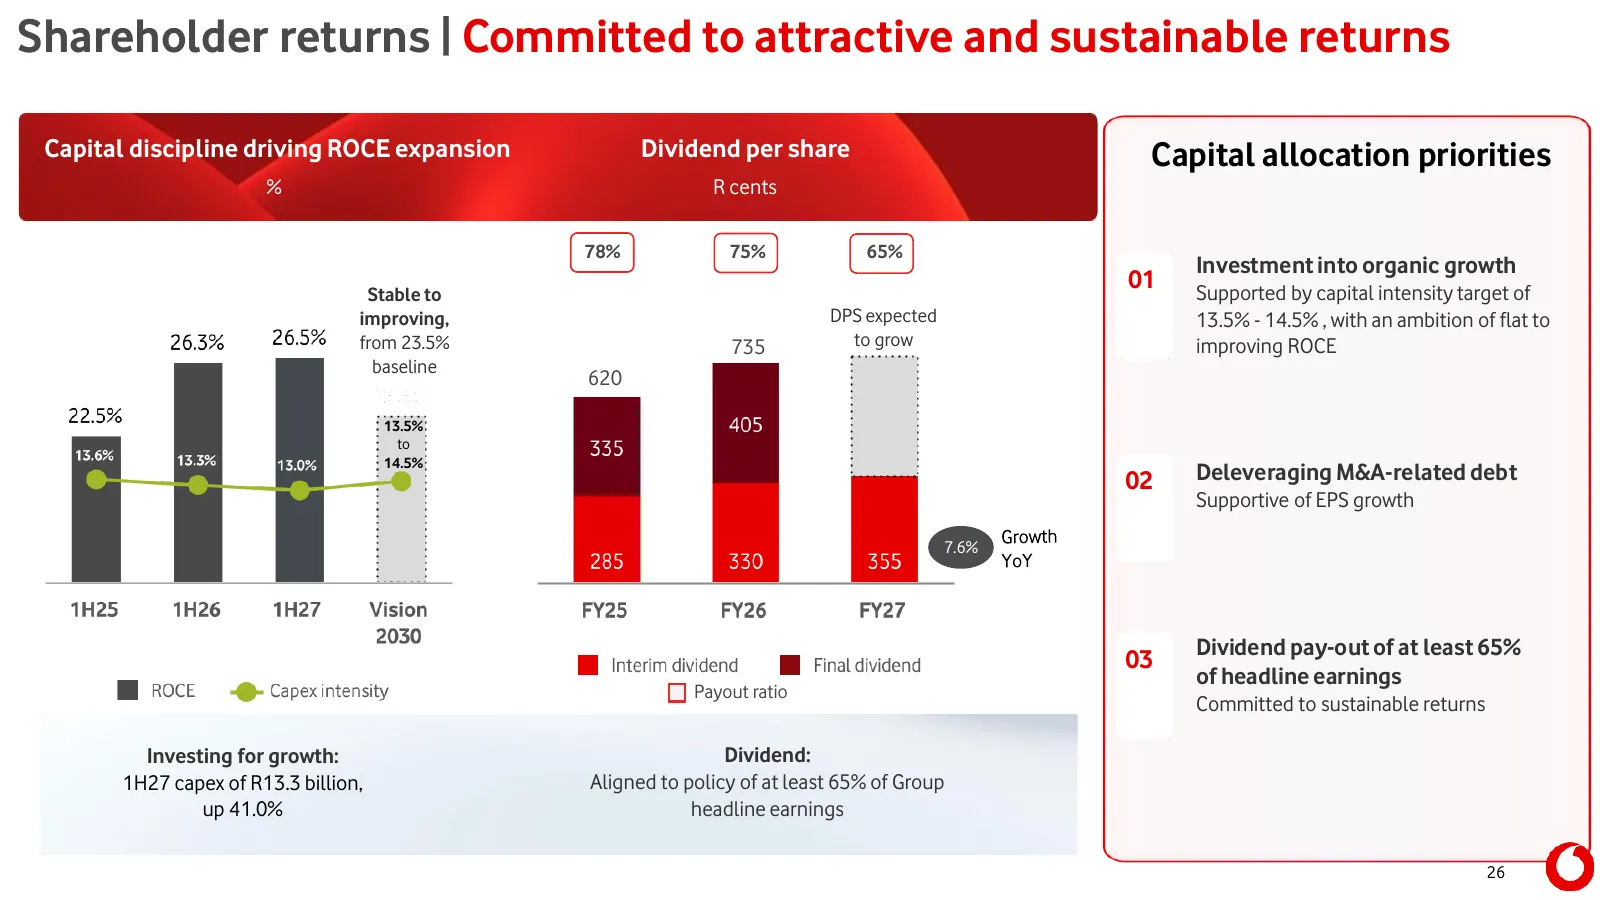
Shareholder returns | Committed to attractive and sustainable returns Capital discipline driving ROCE expansion Dividend per share Capital allocation priorities % R cents 78% 75% 65% Investment into organic growth Stable to 01 Supported by capital intensity target of improving, DPS expected 13.5% -
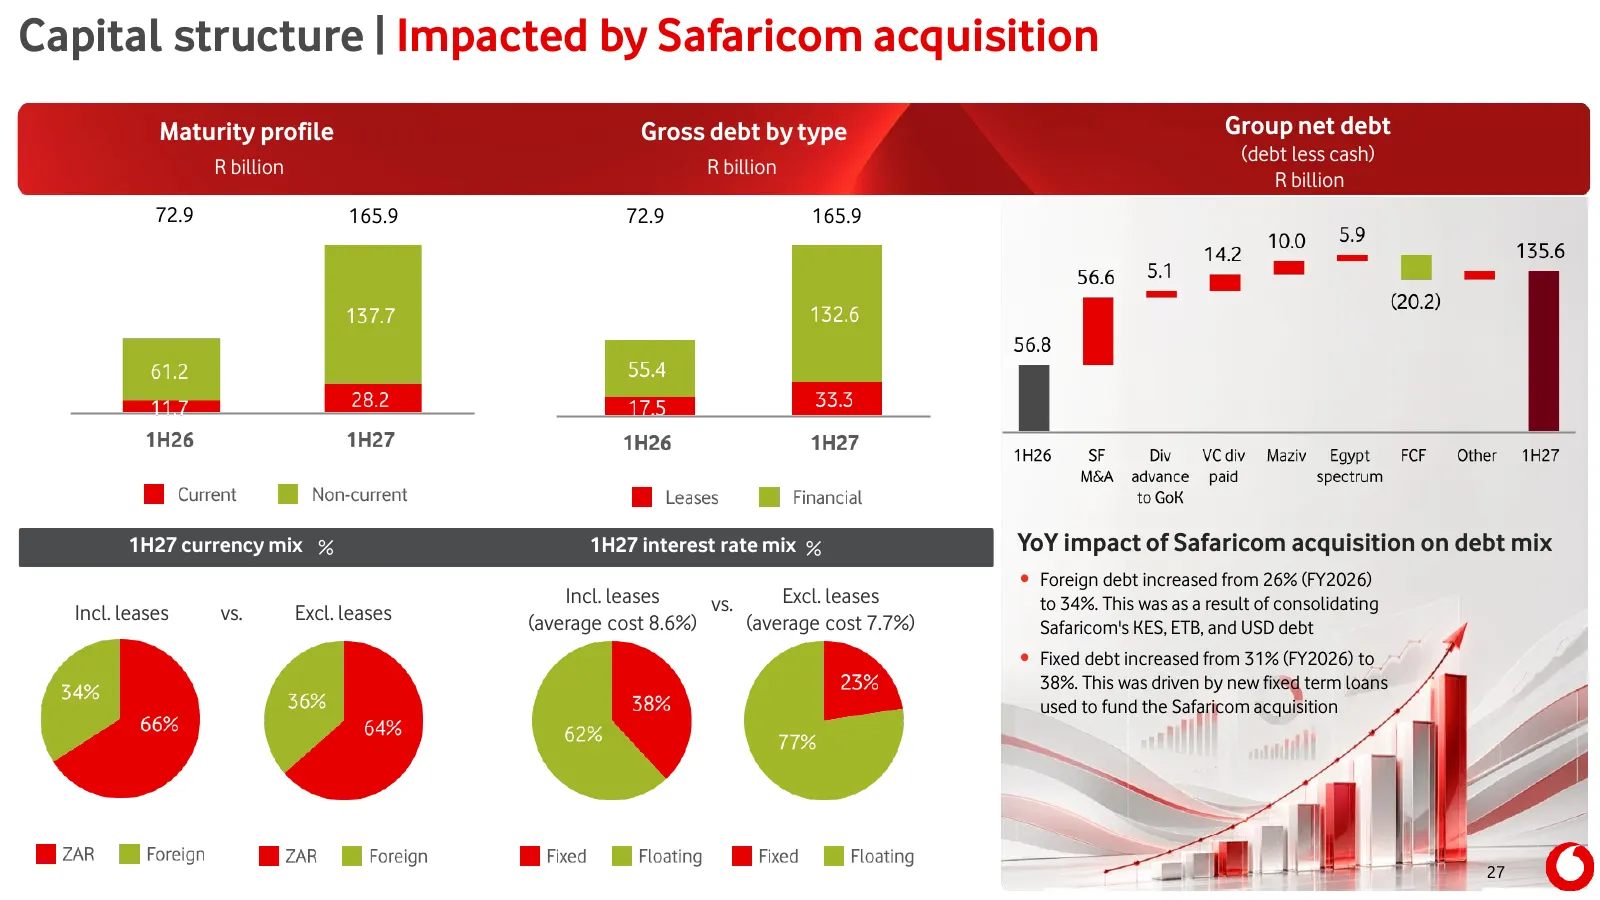
Slide 27: Capital structure | Impacted by Safaricom acquisition
Capital structure | Impacted by Safaricom acquisition Maturity profile Gross debt by type Group net debt (debt less cash) R billion R billion R billion 72.9 165.9 72.9 165.9 1H27 currency mix % 1H27 interest rate mix % YoY impact of Safaricom acquisition on debt mix • Foreign debt increased from 26%
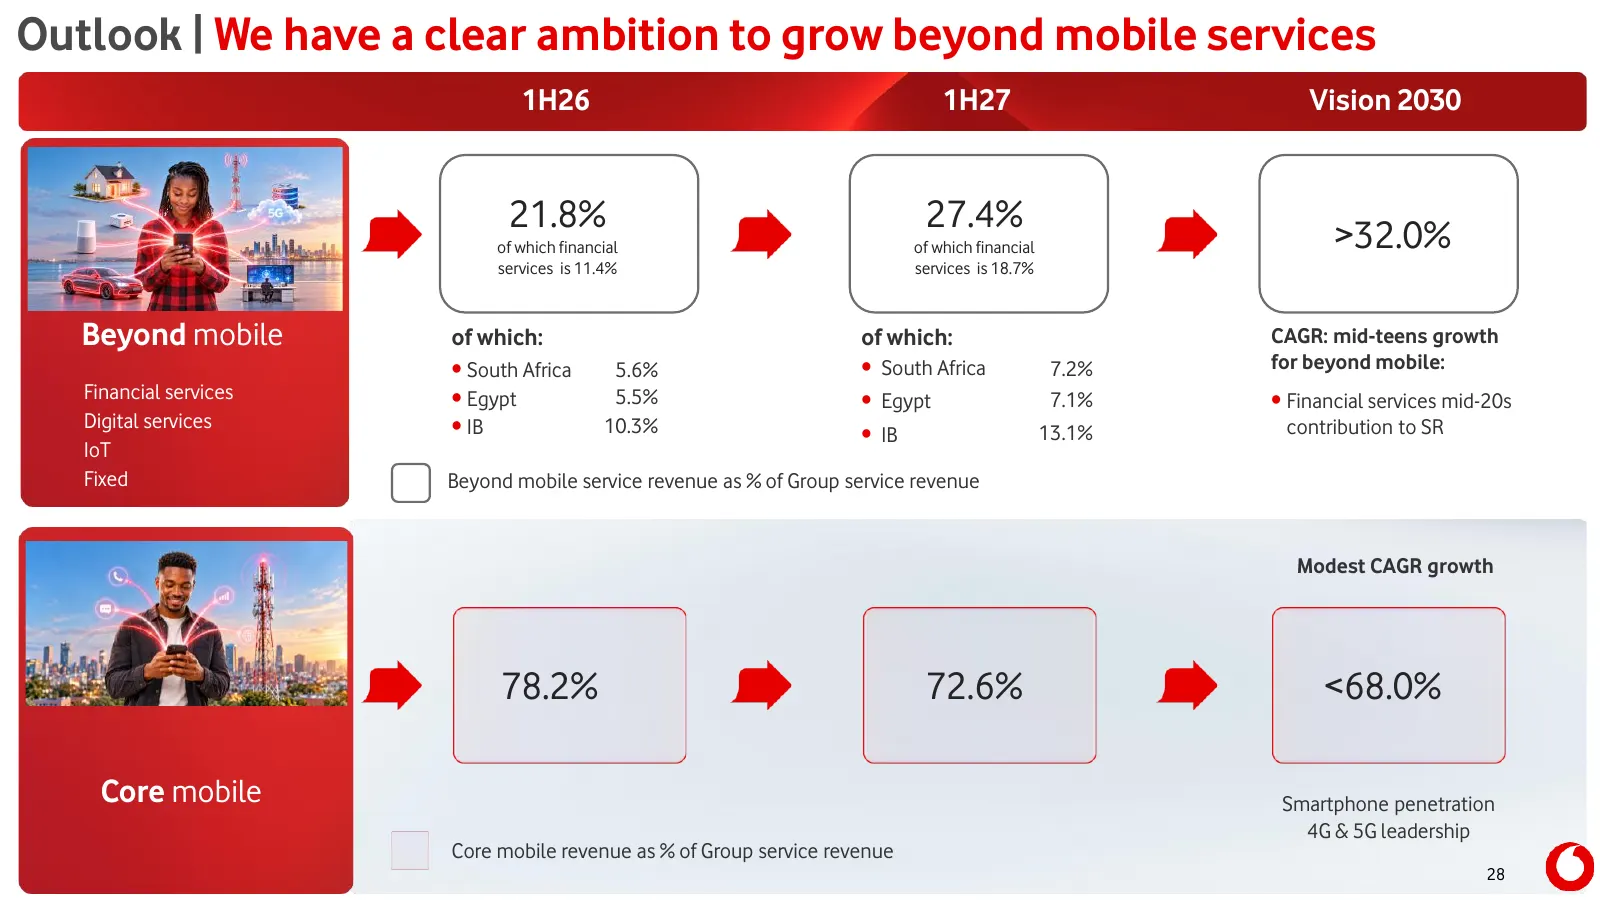
Slide 28: Outlook | We have a clear ambition to grow beyond mobile services
Outlook | We have a clear ambition to grow beyond mobile services 1H26 1H27 Vision 2030 21.8% 27.4% of which financial of which financial >32.0% services is 11.4% services is 18.7% Beyond mobile of which: of which: CAGR: mid-teens growth • South Africa 5.6% • South Africa 7.2% for beyond mobile: Fin
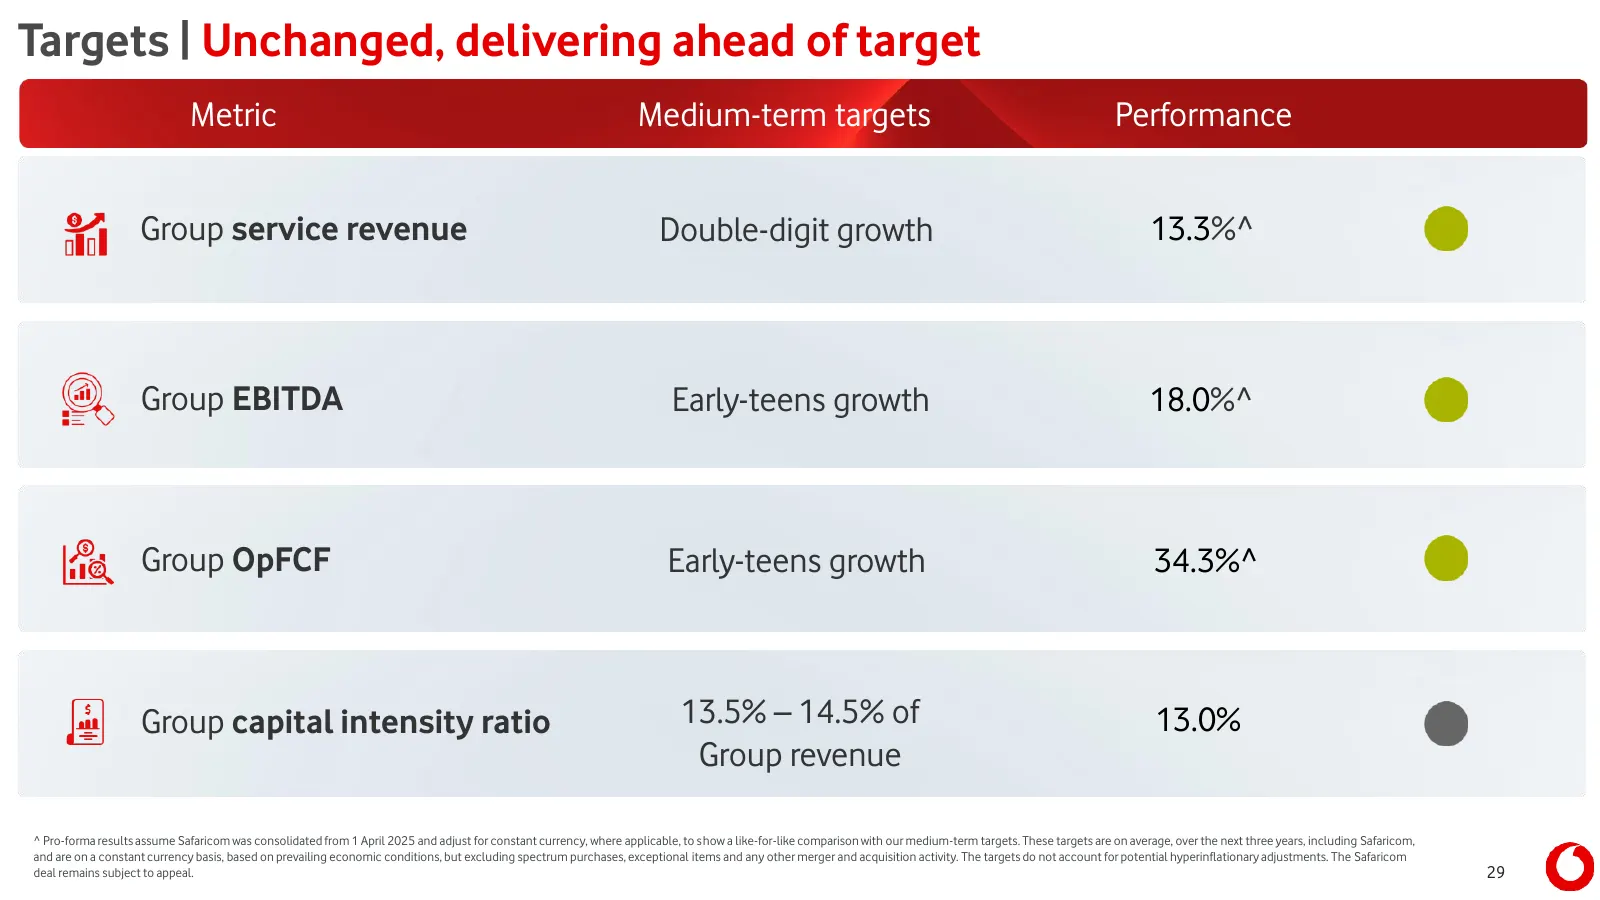
Slide 29: Targets | Unchanged, delivering ahead of target
Targets | Unchanged, delivering ahead of target Metric Medium-term targets Performance Group service revenue Double-digit growth 13.3%^ Group EBITDA Early-teens growth 18.0%^ Group OpFCF Early-teens growth 34.3%^ Group capital intensity ratio 13.5% – 14.5% of 13.0% Group revenue ^ Pro-forma results

Slide 30: Wrap-up
Wrap-up everyone.connected
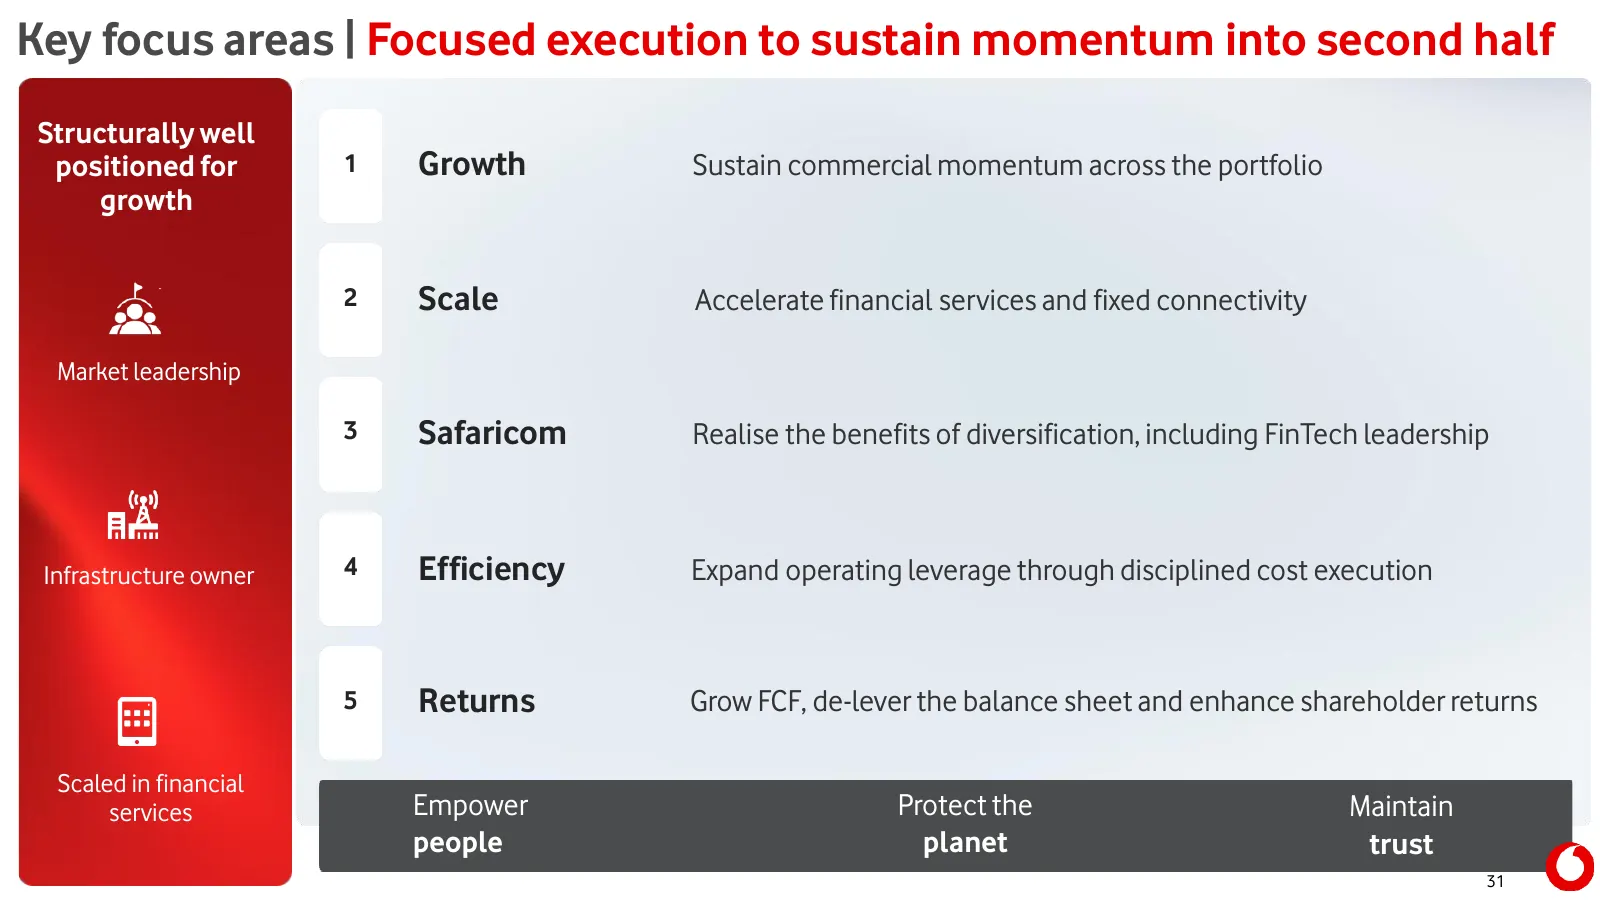
Slide 31: Key focus areas | Focused execution to sustain momentum into second half
Key focus areas | Focused execution to sustain momentum into second half Structurally well positioned for 1 Growth Sustain commercial momentum across the portfolio growth 2 Scale Accelerate financial services and fixed connectivity Market leadership 3 Safaricom Realise the benefits of diversificatio
Slide 32: Forward-looking statement
These factors include, but are not limited to, the following: changes in economic Forward-looking or political conditions in markets served by operations of the Group; greater than statement anticipated competitive activity; higher than expected costs or capital expenditures; slower than expected cu

Slide 33: Appendix
Appendix everyone.connected
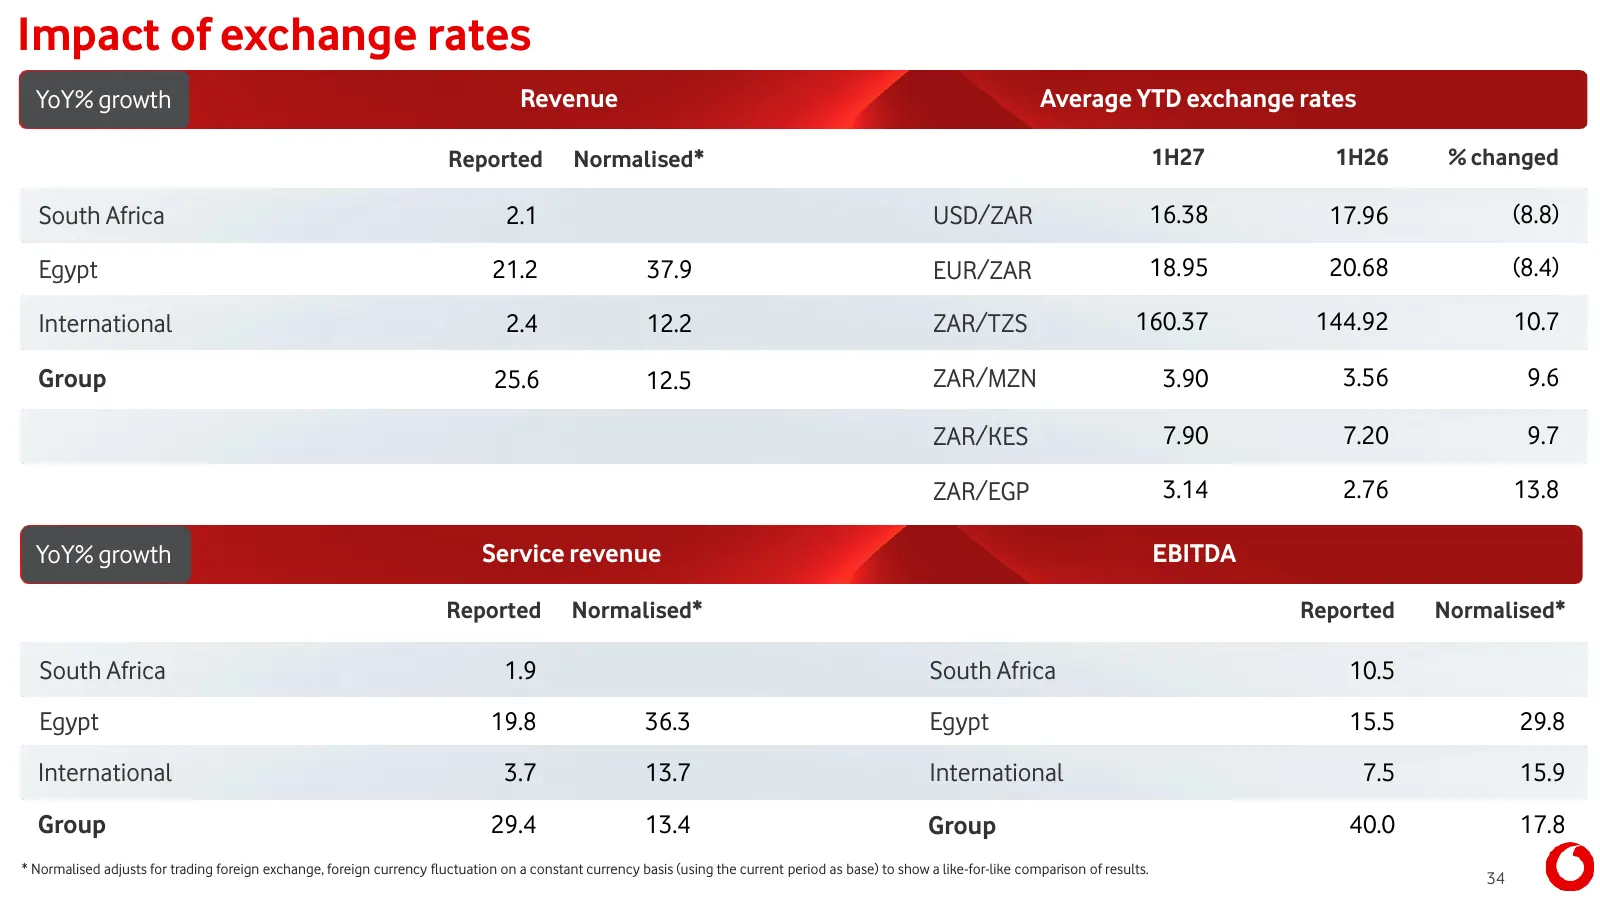
Slide 34: Impact of exchange rates
Impact of exchange rates YoY% growth Revenue Average YTD exchange rates Reported Normalised* 1H27 1H26 % changed South Africa 2.1 USD/ZAR 16.38 17.96 (8.8) Egypt 21.2 37.9 EUR/ZAR 18.95 20.68 (8.4) International 2.4 12.2 ZAR/TZS 160.37 144.92 10.7 Group 25.6 12.5 ZAR/MZN 3.90 3.56 9.6 ZAR/KES 7.90 7
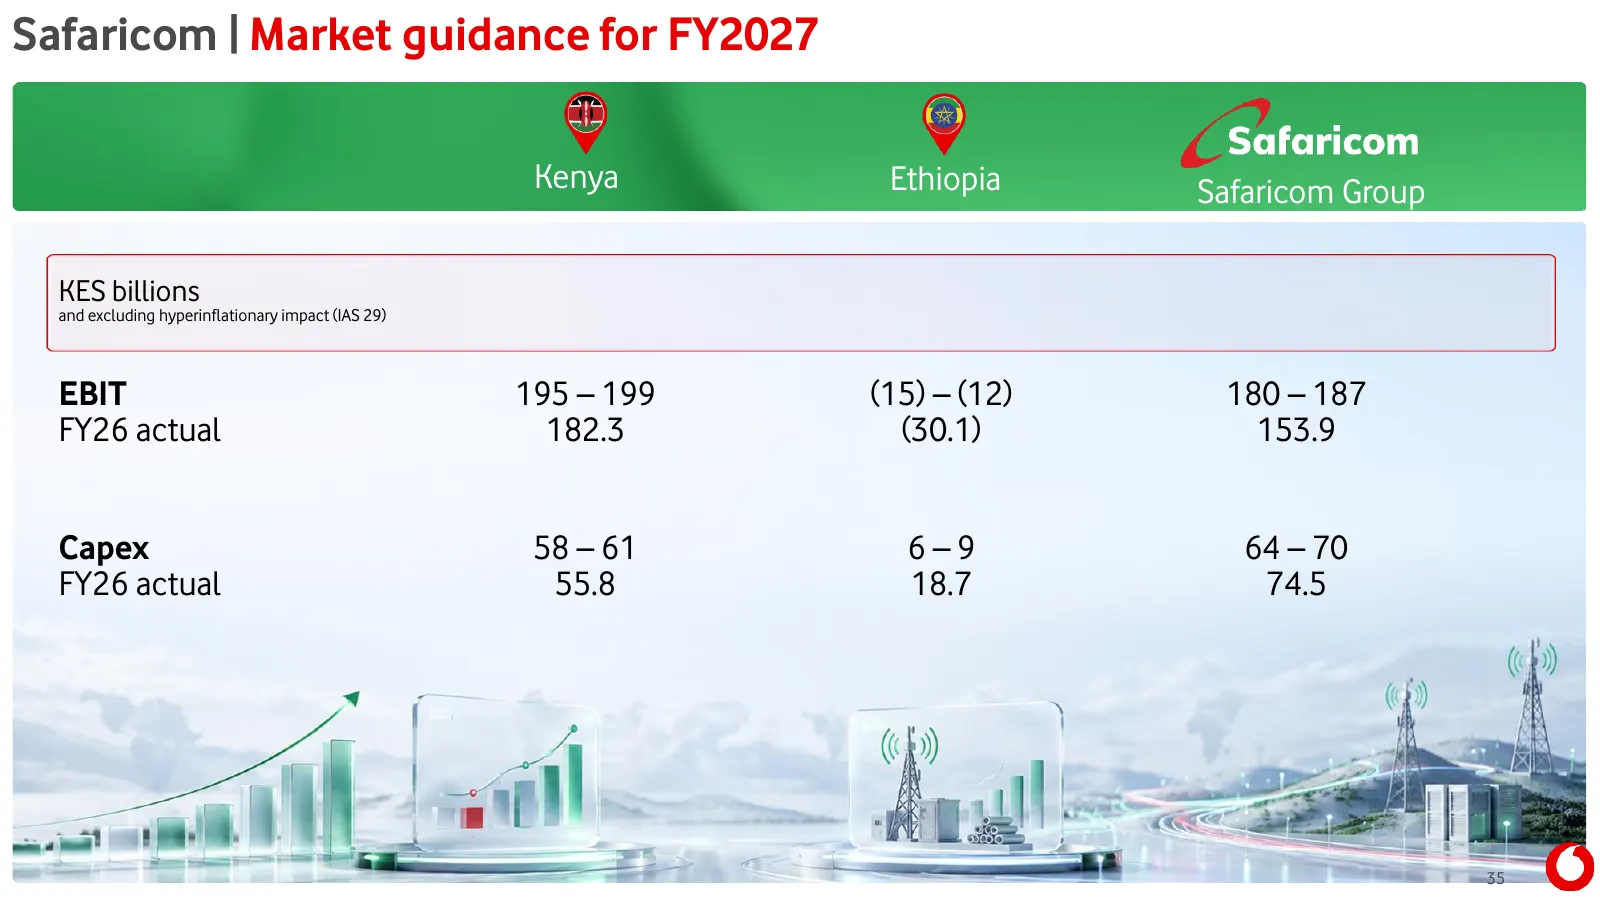
Slide 35: Safaricom | Market guidance for FY2027
Safaricom | Market guidance for FY2027 Kenya Ethiopia Safaricom Group KES billions and excluding hyperinflationary impact (IAS 29) EBIT 195 – 199 (15) – (12) 180 – 187 FY26 actual 182.3 (30.1) 153.9 Capex 58 – 61 6–9 64 – 70 FY26 actual 55.8 18.7 74.5 35
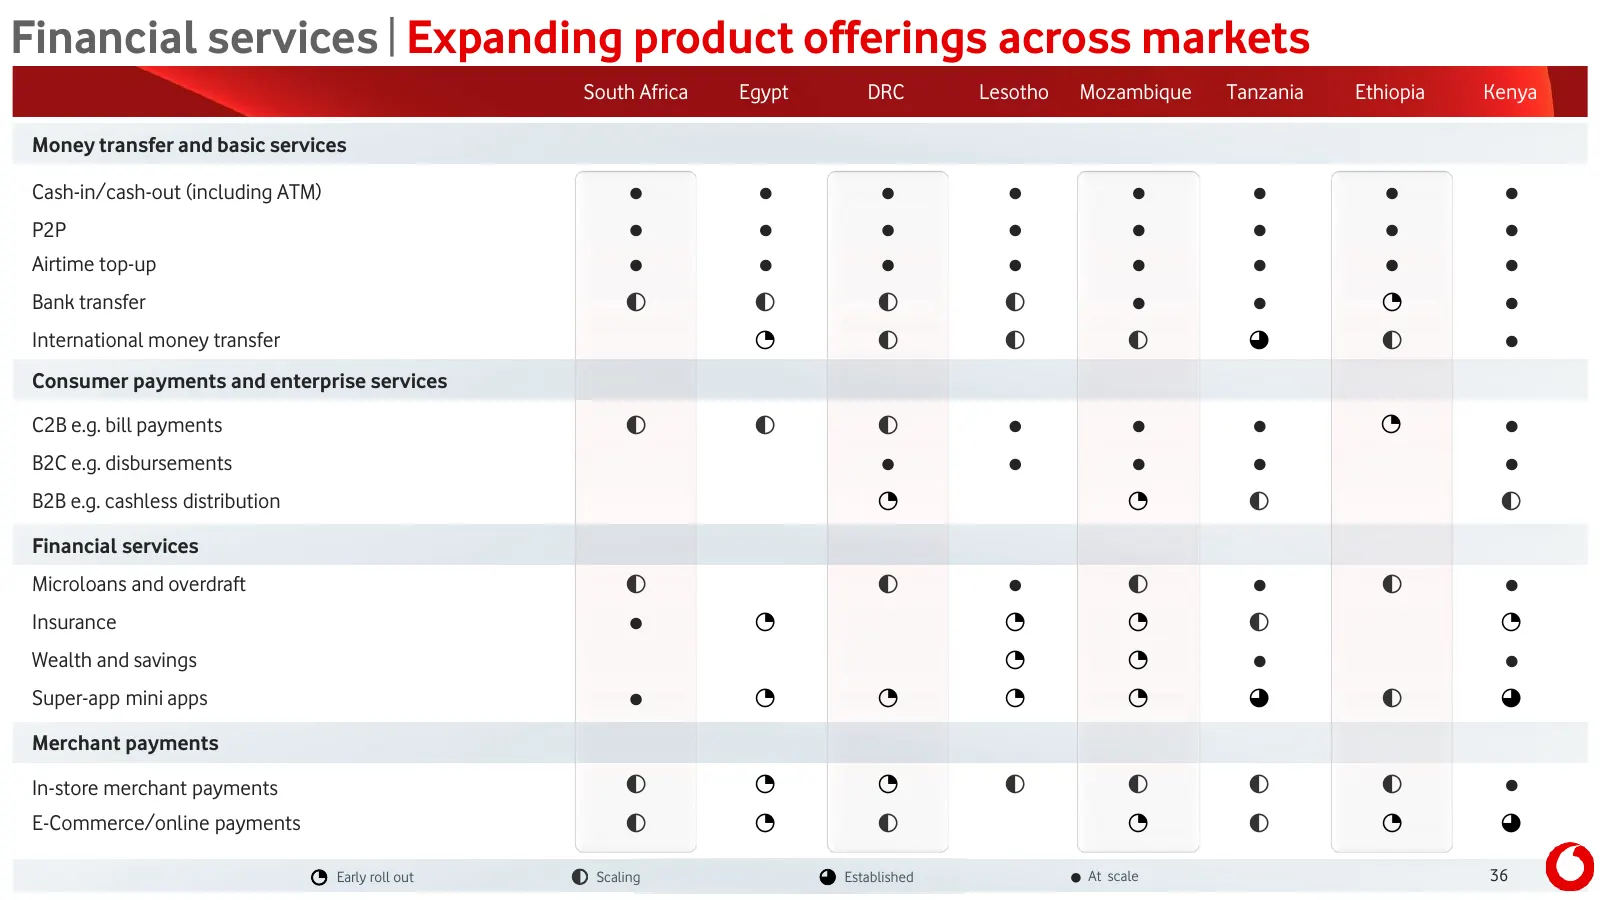
Slide 36: Financial services | Expanding product offerings across markets
Financial services | Expanding product offerings across markets South Africa Egypt DRC Lesotho Mozambique Tanzania Ethiopia Kenya Money transfer and basic services Cash-in/cash-out (including ATM) ● ● ● ● ● ● ● ● P2P ● ● ● ● ● ● ● ● Airtime top-up ● ● ● ● ● ● ● ● Bank transfer ◐ ◐ ◐ ◐ ● ● ◔ ● Intern
Slide 37: Country data
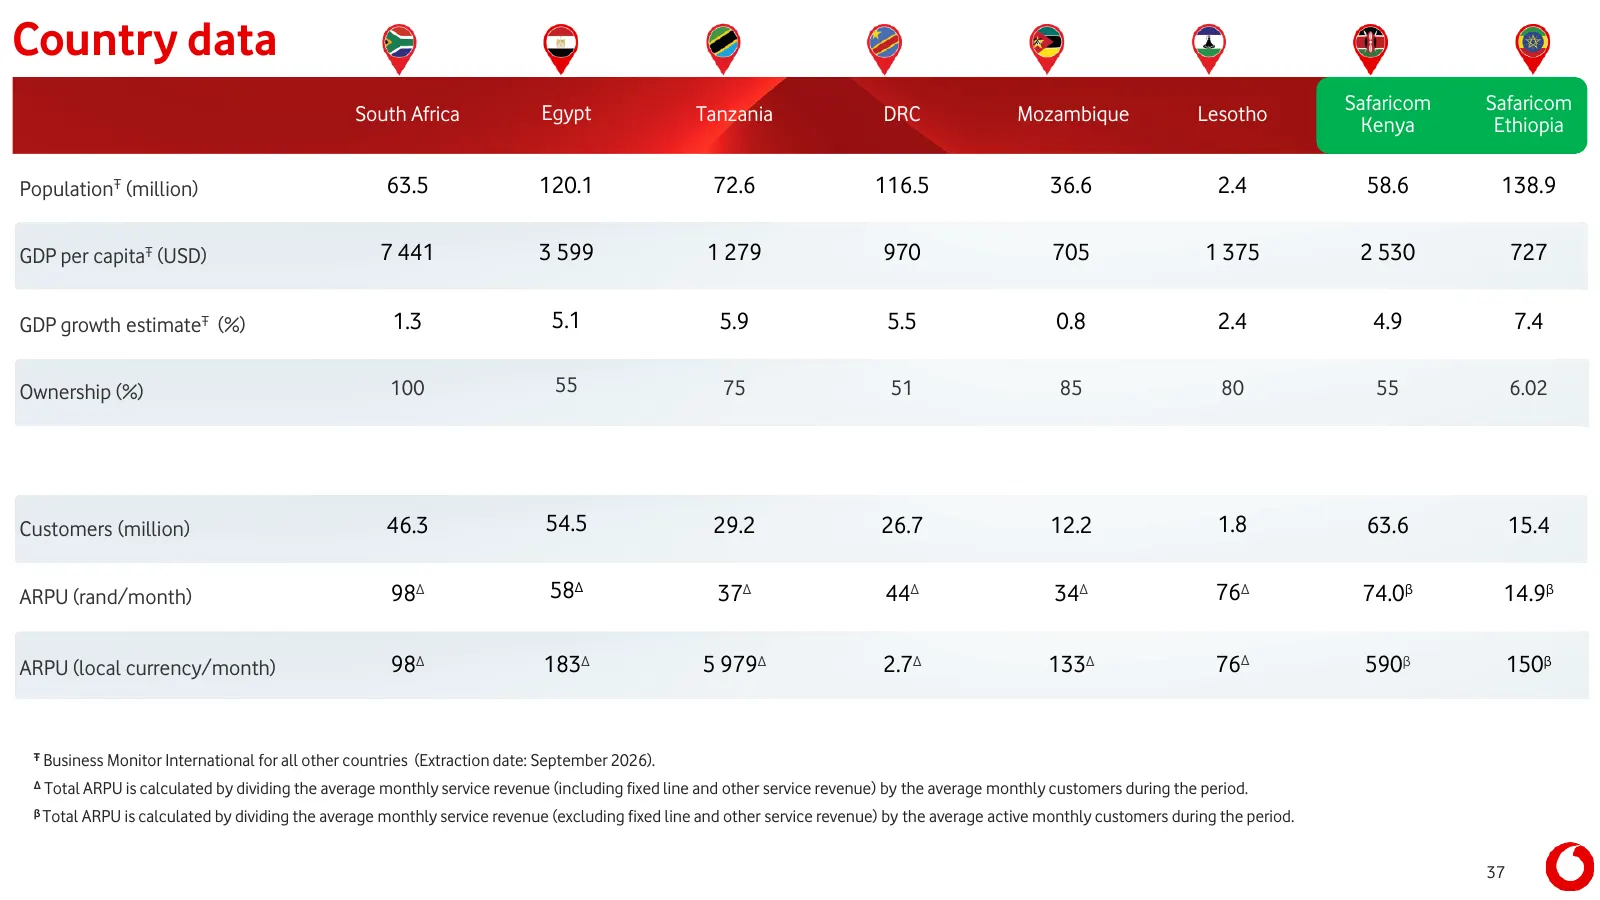
Country data Egypt Lesotho Safaricom Safaricom South Africa Tanzania DRC Mozambique Kenya Ethiopia PopulationŦ (million) 63.5 120.1 72.6 116.5 36.6 2.4 58.6 138.9 GDP per capitaŦ (USD) 7 441 3 599 1 279 970 705 1 375 2 530 727 GDP growth estimateŦ (%) 1.3 5.1 5.9 5.5 0.8 2.4 4.9 7.4 Ownership (%) 10
Slide 38: More information
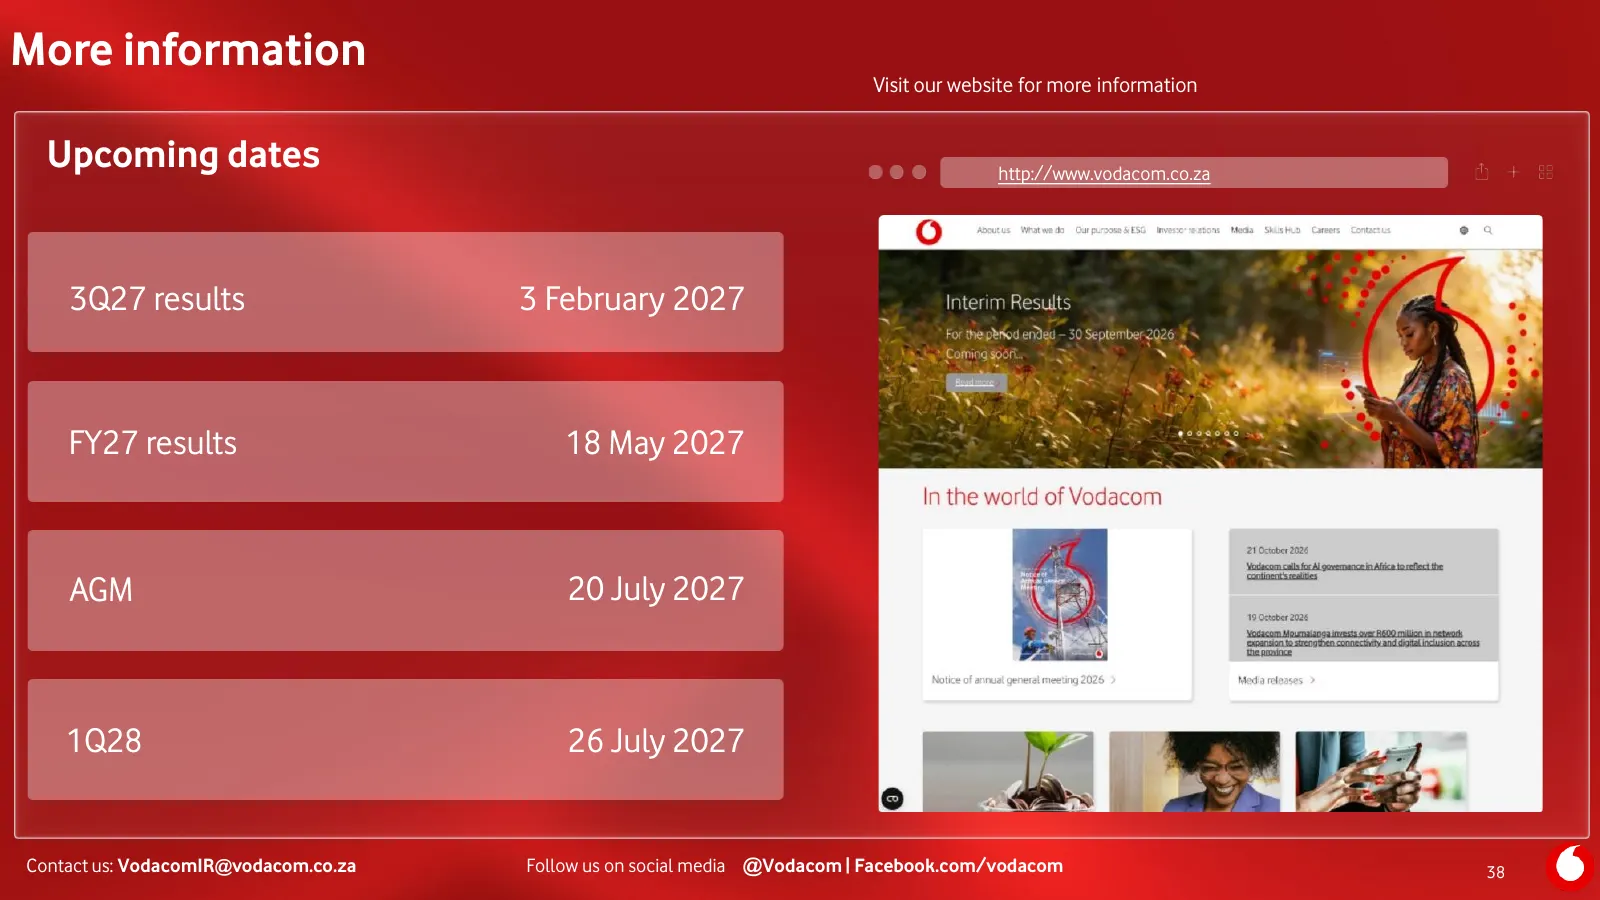
More information Visit our website for more information Upcoming dates http://www.vodacom.co.za 3Q27 results 3 February 2027 FY27 results 18 May 2027 AGM 20 July 2027 1Q28 26 July 2027 Contact us: VodacomIR@vodacom.co.za Follow us on social media @Vodacom | Facebook.com/vodacom 38
Slide 39: Definitions
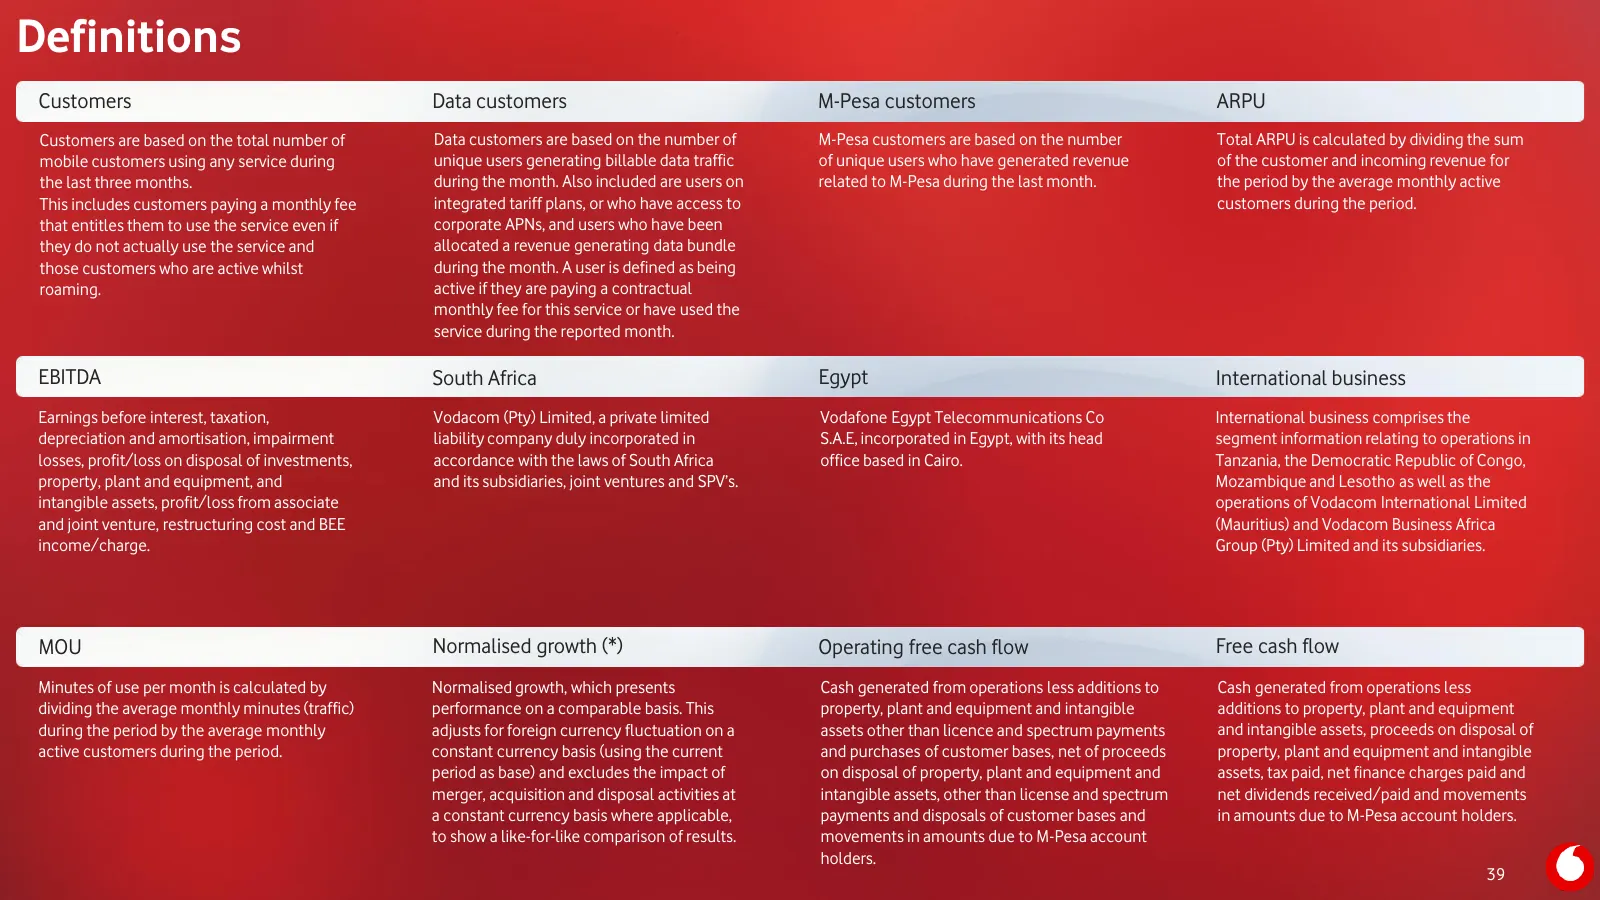
Definitions Customers Data customers M-Pesa customers ARPU Customers are based on the total number of Data customers are based on the number of M-Pesa customers are based on the number Total ARPU is calculated by dividing the sum mobile customers using any service during unique users generating bill
Slide 40: Financial services products
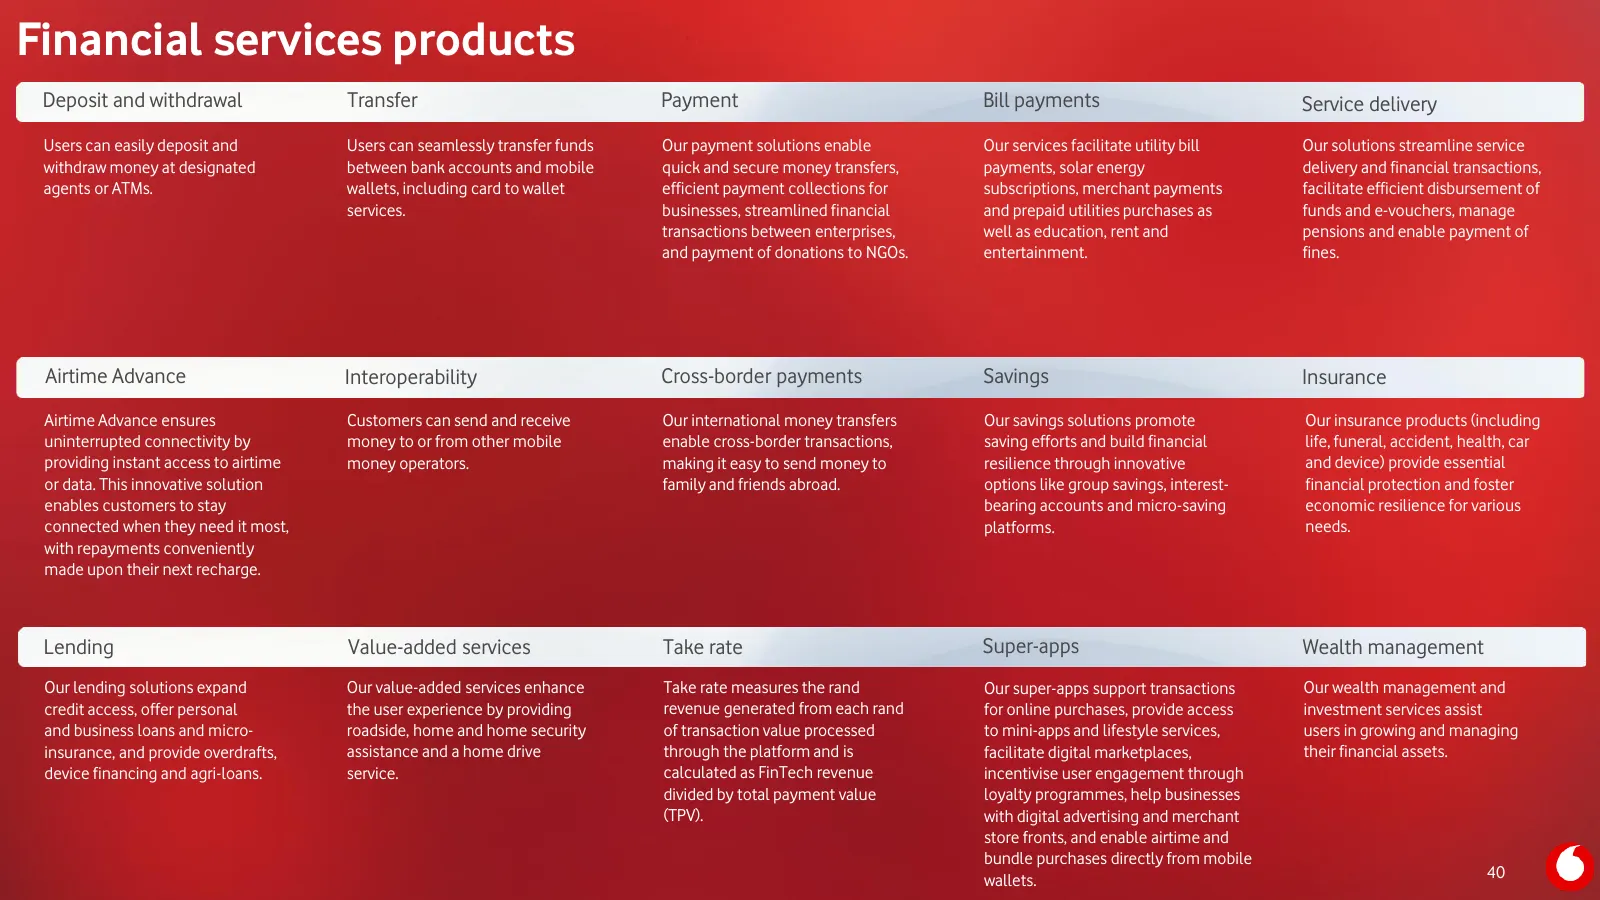
Financial services products Deposit and withdrawal Transfer Payment Bill payments Service delivery Users can easily deposit and Users can seamlessly transfer funds Our payment solutions enable Our services facilitate utility bill Our solutions streamline service withdraw money at designated between
Source: company website
More decks from Vodacom Group Limited
 FY2026 Earnings Presentation39 slides · May 11, 2026
 Merger or Acquisition (December 2025)16 slides · Dec 4, 2025
 Q2 2026 Earnings Presentation39 slides · Nov 10, 2025
 FY2025 Earnings Presentation39 slides · May 19, 2025
 Investor Day (February 2025)34 slides · Feb 19, 2025
 Q2 2025 Earnings Presentation37 slides · Nov 11, 2024