Omnicare — J.P. Morgan Healthcare Conference 2013
44 slides from Omnicare's conference presentation, Jan 8, 2013

Slide 1: Omnicare
Omnicare
Slide 2: Forward-Looking Statements
Forward-Looking Statements Certain of th y and listed within fe rd-looking the f the Private S ities Litigation Reform Act of 1995. These forward-looking statements include, but: are not limited to, all statements ae the intent, Pallet or y current expectations Sucl id Ive k a theo ne ReTenee contin
Slide 3: Long-Term Care Group and Specialty Care Group
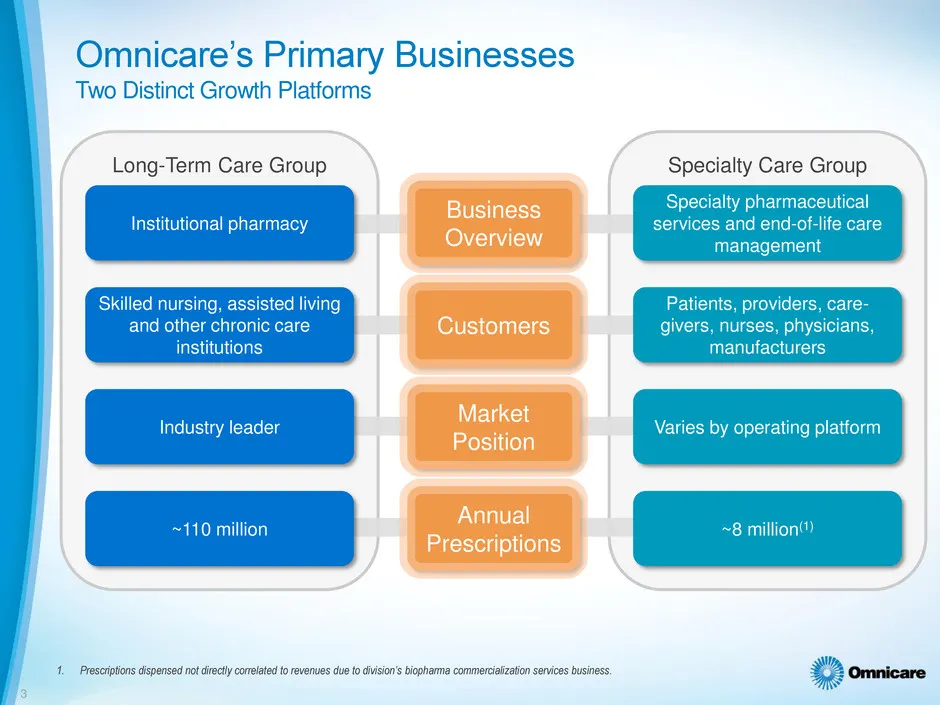
Long-Term Care Group Specialty Care Group Business a Overview ; | Customers ) Market Position | Annual Prescripti i ptions
Slide 4: Omnicare's Primary Businesses
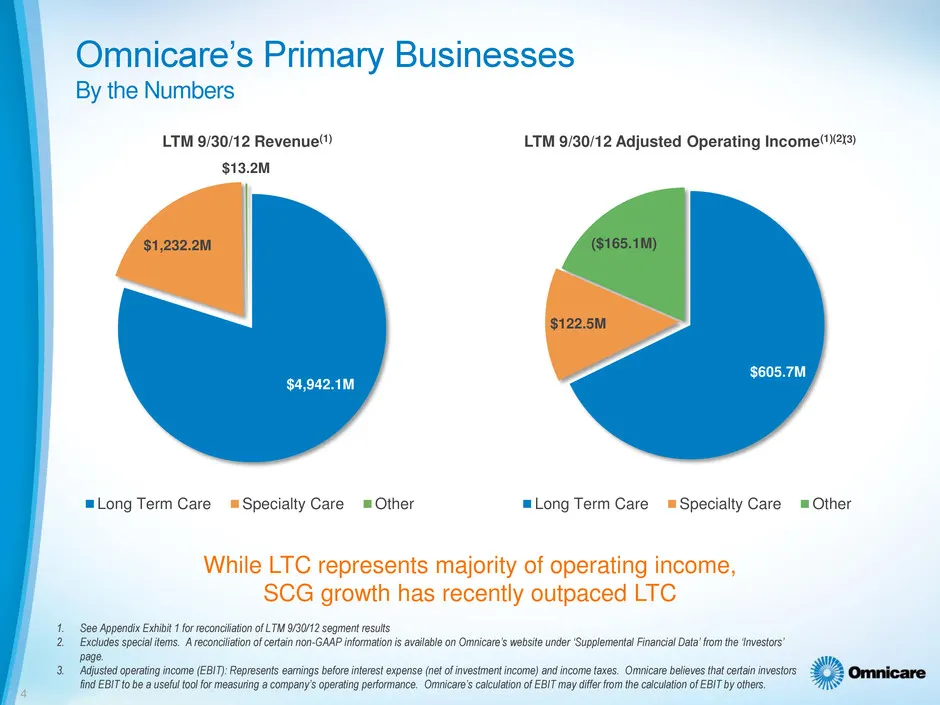
| Omnicare’s Primary Businesses By the Numbers LTM 9/30/12 Adjusted Operating Income 13) LTM 9/30/12 Revenue) $13.2M "Long Term Care Specialty Care = Other Long Term Care s=Specialty Care = Other While LTC represents majority of operating income, SCG growth has recently outpaced LTC ‘rom the Investo

Slide 5: Omnicare Market Trends
WwW, “q¢ Omnicare Market Trends
Slide 6: Demographic Trends
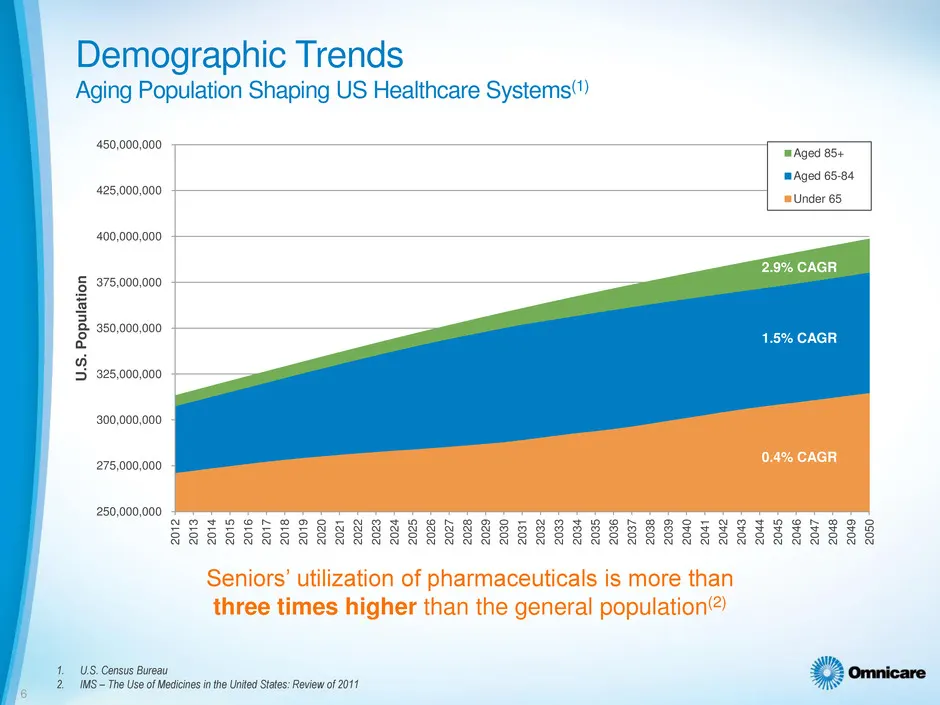
Demographic Trends Aging Population Shaping US Healthcare Systems) 450,000,000 425,000,000 400,000,000 375,000,000 350,000,000 1.5% CAGR U.S. Population 325,000,000 300,000,000 0.4% CAGR 275,000,000 250,000,000 Seniors’ utilization of pharmaceuticals is more than three times higher than the general
Slide 7: Senior Care Market Trends
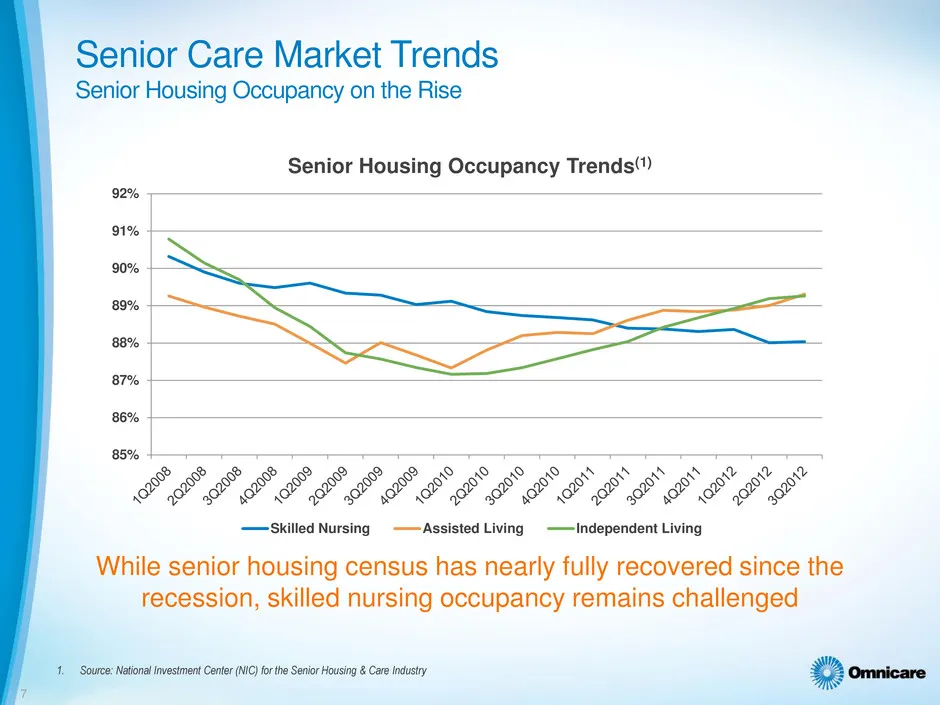
Senior Care Market Trends Senior Housing Occupancy on the Rise Senior Housing Occupancy Trends“) - —— _ on PS a ae PP PPM PM WO WO GO GO WW dh wd Od ho SF PP PP BP FP Pr Pr DO SA A —Skilled Nursing ——Assisted Living ——Independent Living While senior housing census has nearly fully recovered since th
Slide 8: Senior Housing Market Trends
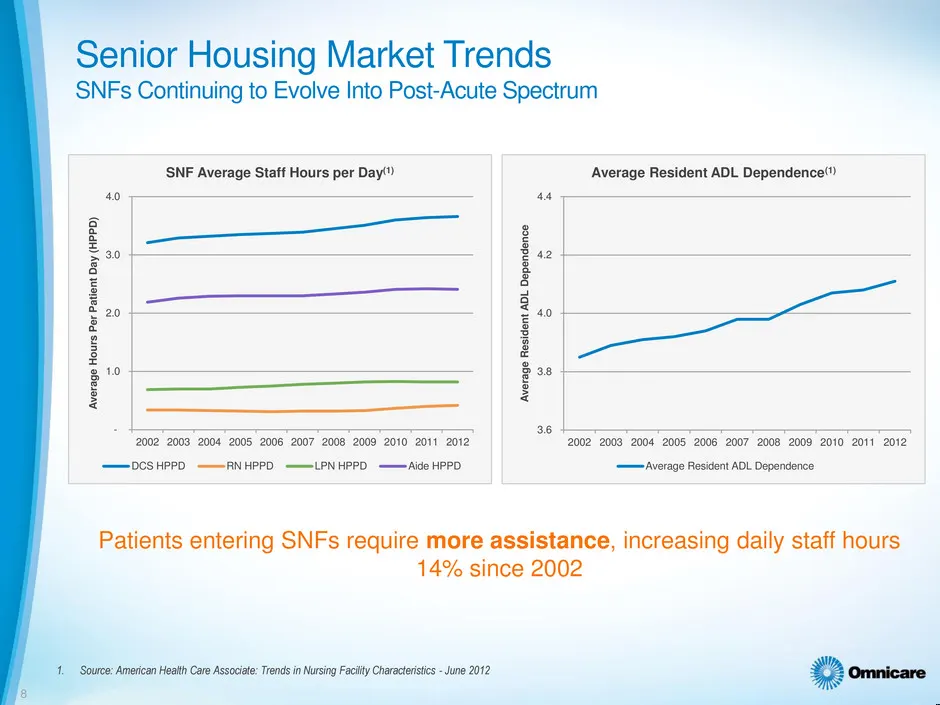
Senior Housing Market Trends SNFs Continuing to Evolve Into Post-Acute Spectrum ‘SNF Average Staff Hours per Day”) Average Resident ADL Dependence’) ‘Average Hours Per Patient Day (HPD) ‘Average Resident ADL Dependence ‘2002 2003 2004 2005 2006 2007 2008 2009 2010 2011 2012 ‘20022003 2004 2005 2006
Slide 9: Senior Housing Market Trends
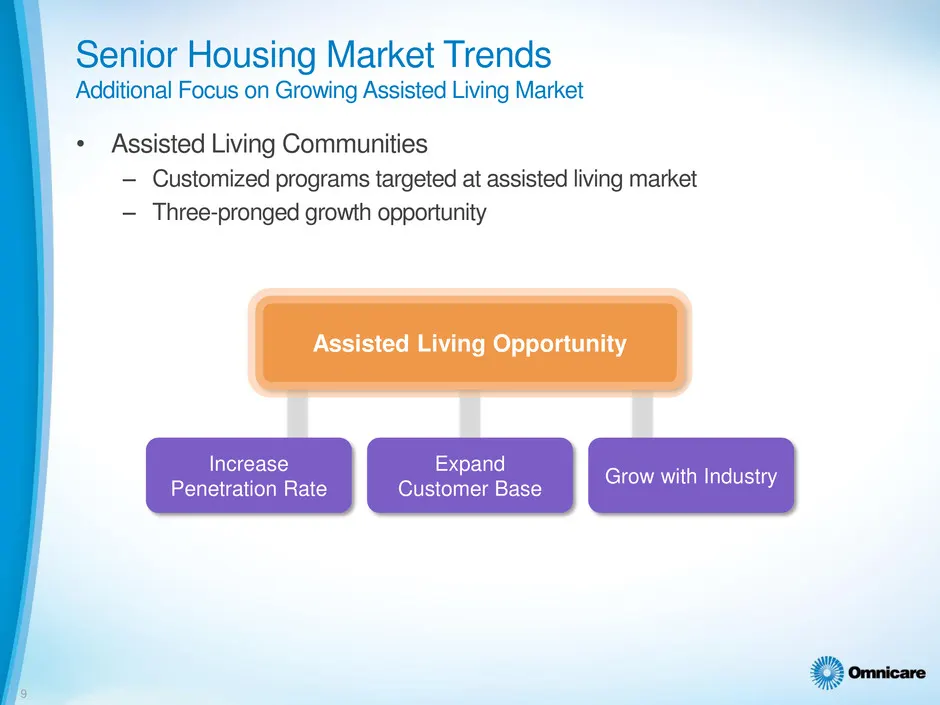
Senior Housing Market Trends Additional Focus on Growing Assisted Living Market * Assisted Living Communities — Customized programs targeted at assisted living market — Three-pronged growth opportunity Assisted Living Opportunity Increase Expand ; ‘ PenetraioniRate Grow with Industry 22 omnicare
Slide 10: Specialty Pharmaceutical Market Trends
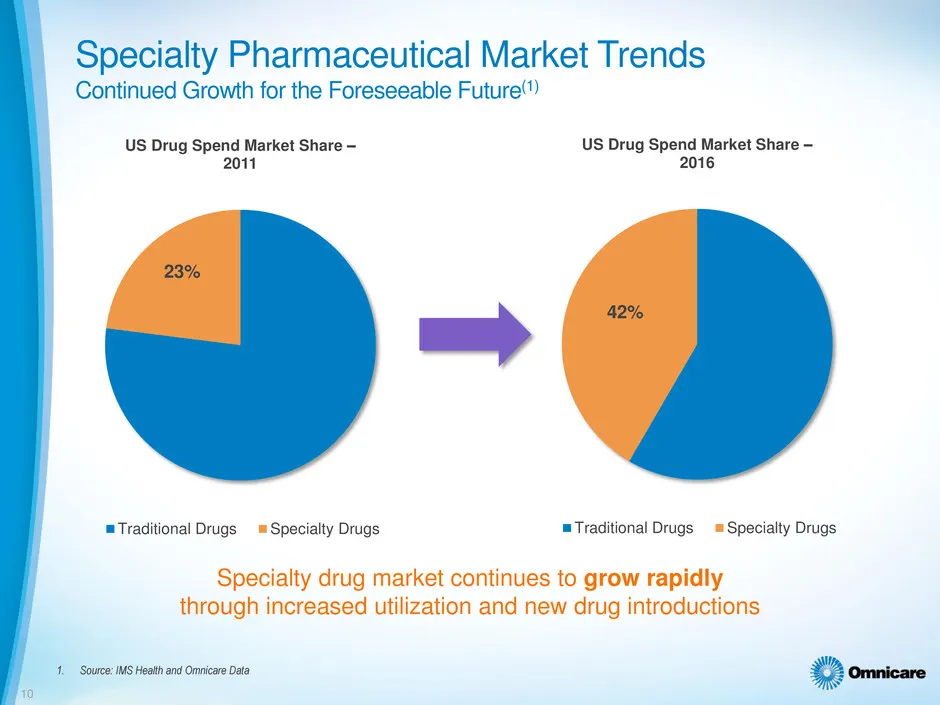
Specialty Pharmaceutical Market Trends Continued Growth for the Foreseeable Future'’) US Drug Spend Market Share — US Drug Spend Market Share — 2011 2016 => = Traditional Drugs _™ Specialty Drugs "Traditional Drugs = Specialty Drugs Specialty drug market continues to grow rapidly through increased u
Slide 11: Specialty Pharmaceutical Market Trends
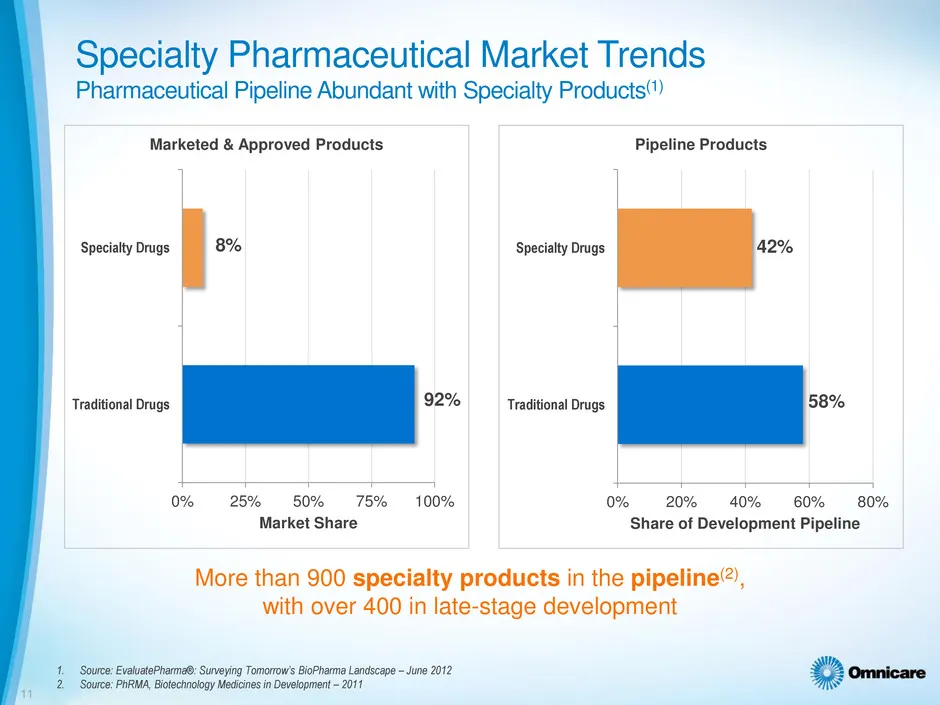
Specialty Pharmaceutical Market Trends Pharmaceutical Pipeline Abundant with Specialty Products“) Marketed & Approved Products Pipeline Products Specialty Drugs 8% Specialty Drugs 42% Traditional Drugs 92% Traditional Drugs 58% 0% 25% © 50% += 75% © 100% 0% — 20% += «40% © 60% © 80% Market Share Sha
Slide 12: Omnicare Long-Term Care Group
WwW, “q¢ Omnicare Long-Term Care Group
Slide 13: Long-Term Care Market Overview
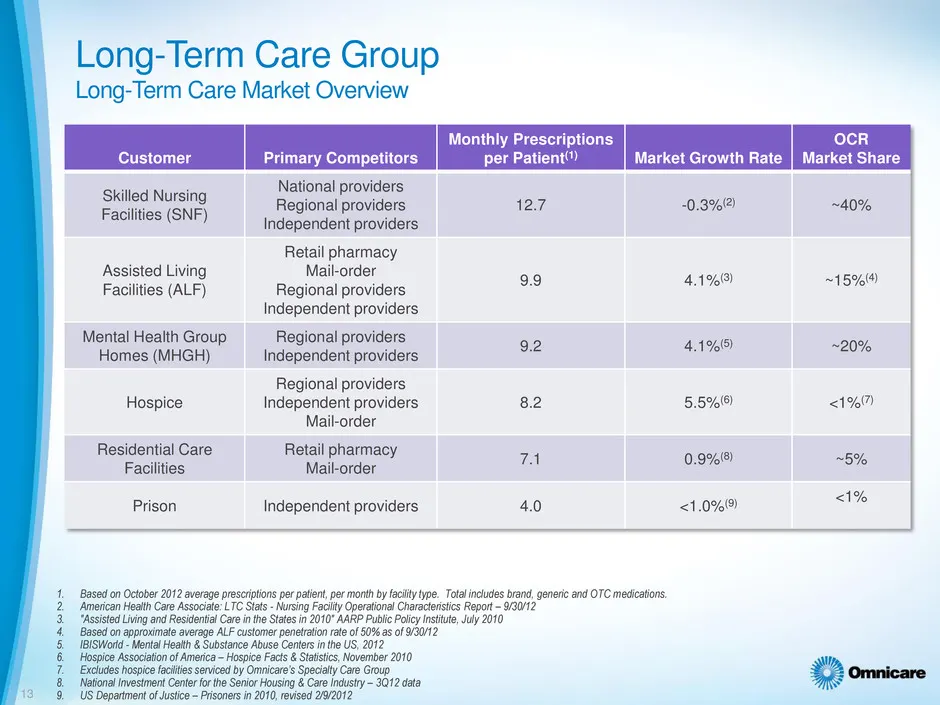
Long-Term Care Group Long-Term Care Market Overview Monthly Prescriptions OcR Customer Primary Competitors per Patient?) Market Growth Rate | Market Share Skilled Nursing Facilities (SNF) Assisted Living Facilities (ALF) Mental Health Group Homes (MHGH) Hospice Residential Care Facilities Prison etn
Slide 14: Institutional Pharmacy Value Proposition
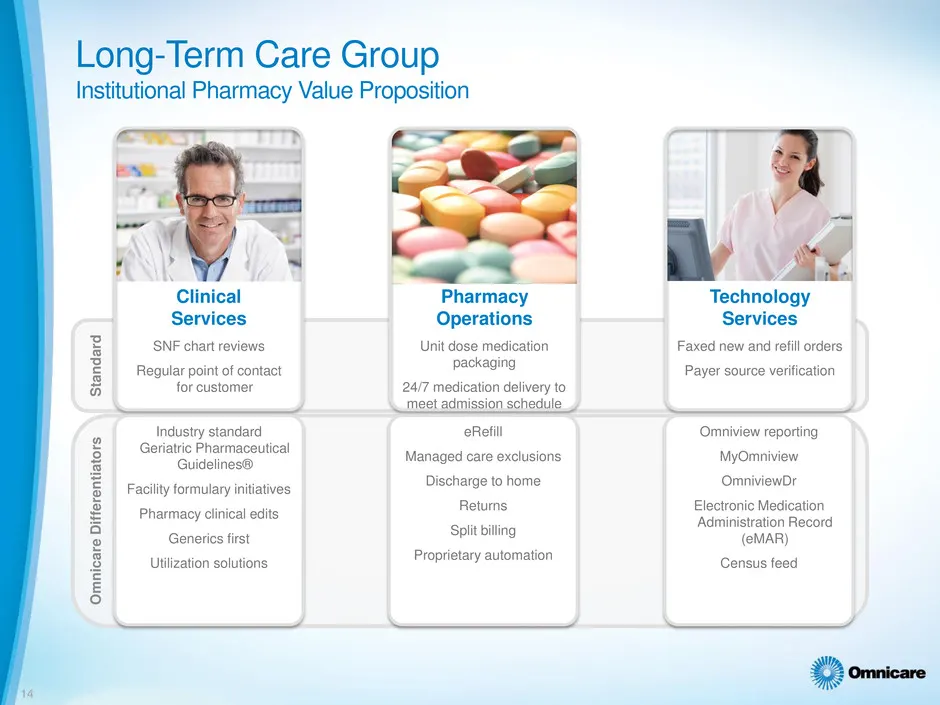
Long-Term Care Group Institutional Pharmacy Value Proposition ay, Pharmacy Technology Operations Services z SNF chart reviews Unit dose medication Faxed new and refill orders E Regular point of contact package Payer source verification 6 for customer 24/7 medication delivery to of gies standard Refi
Slide 15: Omnicare Clinical Services
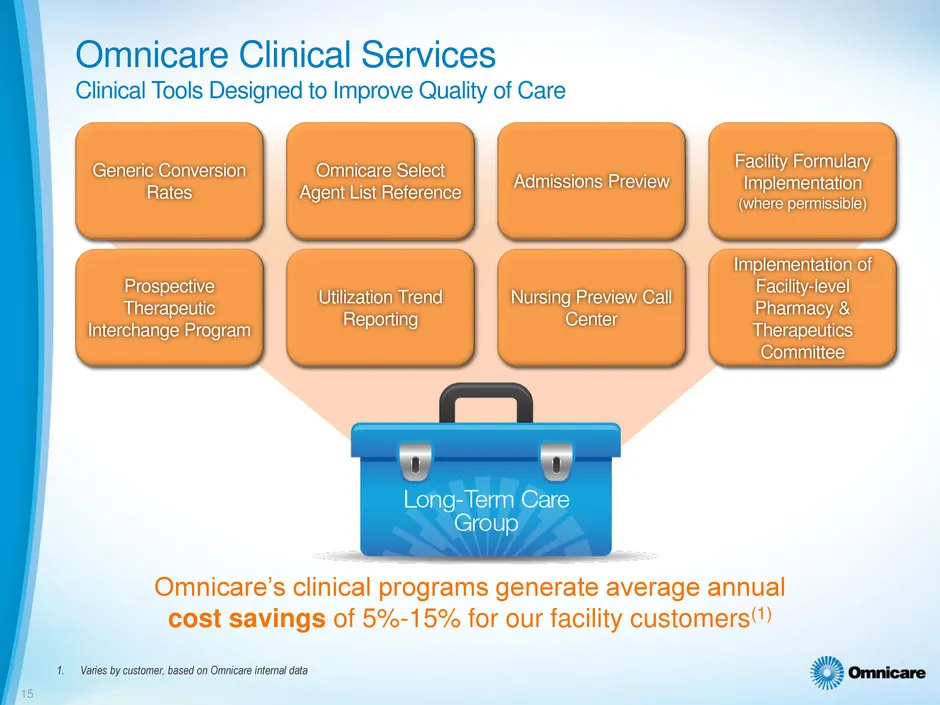
Omnicare Clinical Services Clinical Tools Designed to Improve Quality of Care | " Lae] - — Long-Term Care Group 4. Varies by customer, based on Omnicare internal data 2 omnicare
Slide 16: Omnicare Pharmacy Operations
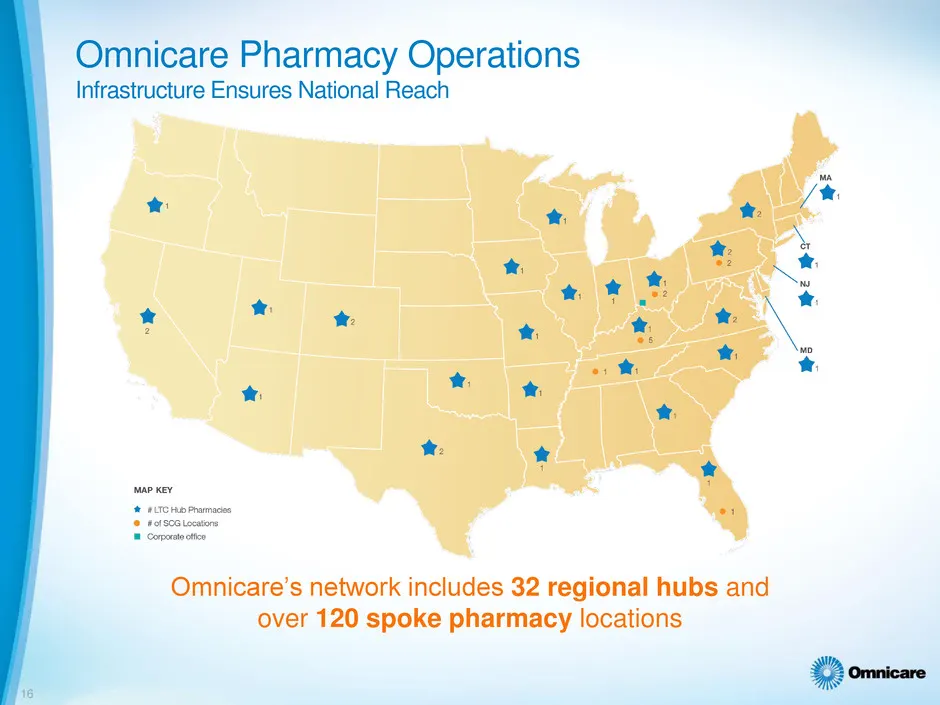
Omnicare Pharmacy Operations Infrastructure Ensures National Reach * * 2 ih n nt ® 2 * i al * ‘ef ; a ot ® ® * *. * * 1 Comper ct Omnicare’s network includes 32 regional hubs and over 120 spoke pharmacy locations 2 omnicare
Slide 17: Omnicare Technology Services
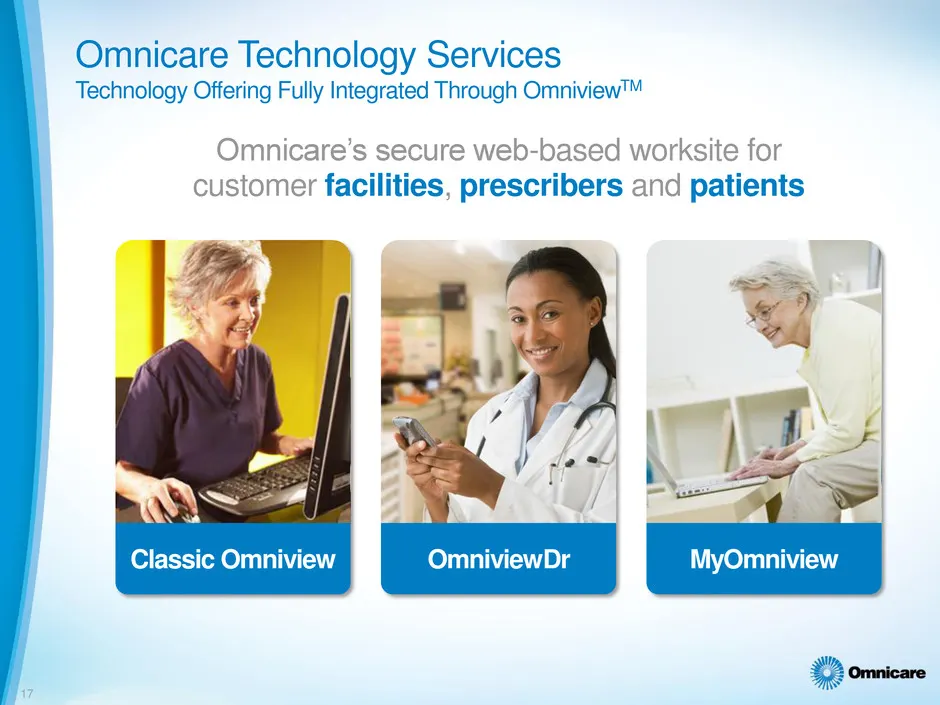
Omnicare Technology Services Technology Offering Fully Integrated Through Omniview™ Omnicare’s secure web-based worksite for customer facilities, prescribers and patients Classic Omniview OmniviewDr
Slide 18: Refining Long-Term Care Focus
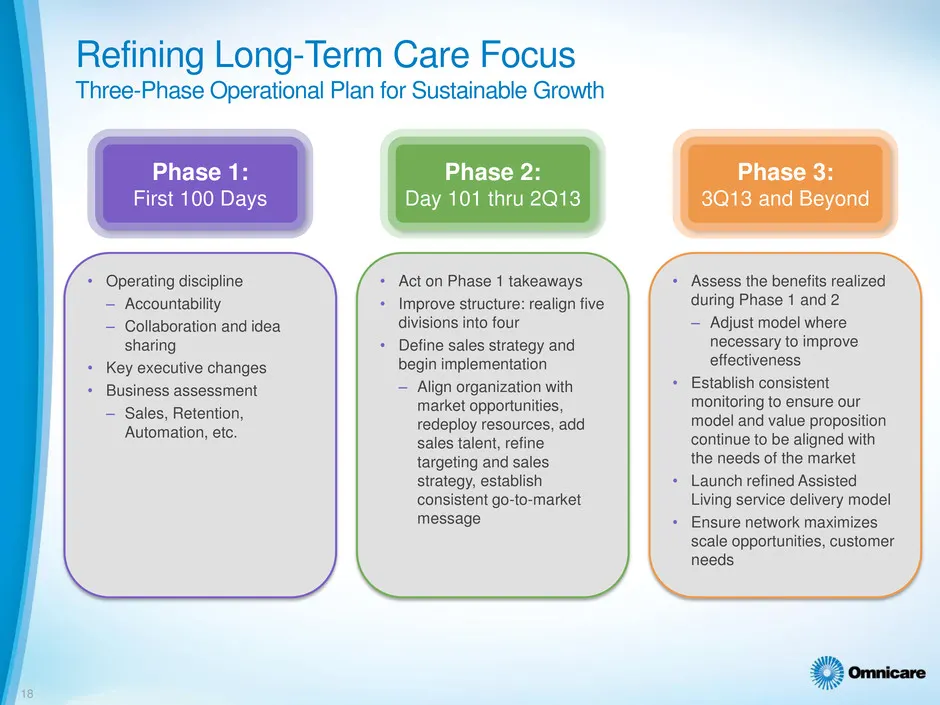
Refining Long-Term Care Focus Three-Phase Operational Plan for Sustainable Growth Phase 1: Phase 2: Phase 3: Day 101 thru 2Q13 3Q13 and Beyond First 100 Days + Operating discipline + Act on Phase 1 takeaways Assess the ‘ovata realized = Accountability + Improve structure: realign five during Phase 1
Slide 19: Establishing Consistent Organic Growth in LTC
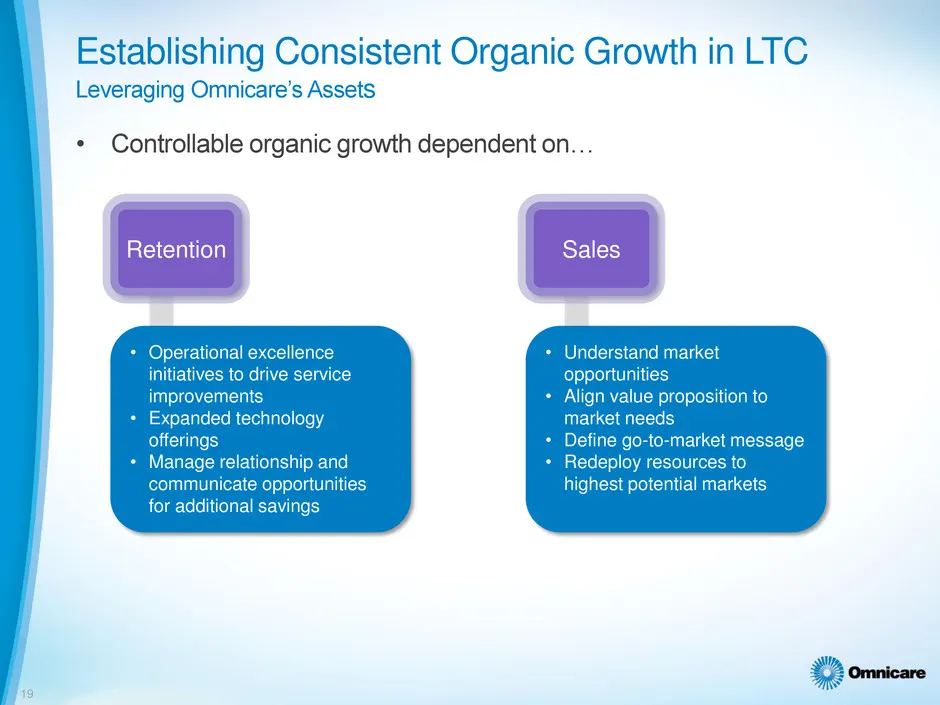
_ Establishing Consistent Organic Growth in LTC Leveraging Omnicare’s Assets * Controllable organic growth dependent on... Retention Understand market opportunities Align value proposition to market needs + Operational excellence initiatives to drive service improvements + Expanded technology Define
Slide 20: Establishing Consistent Organic Growth in LTC
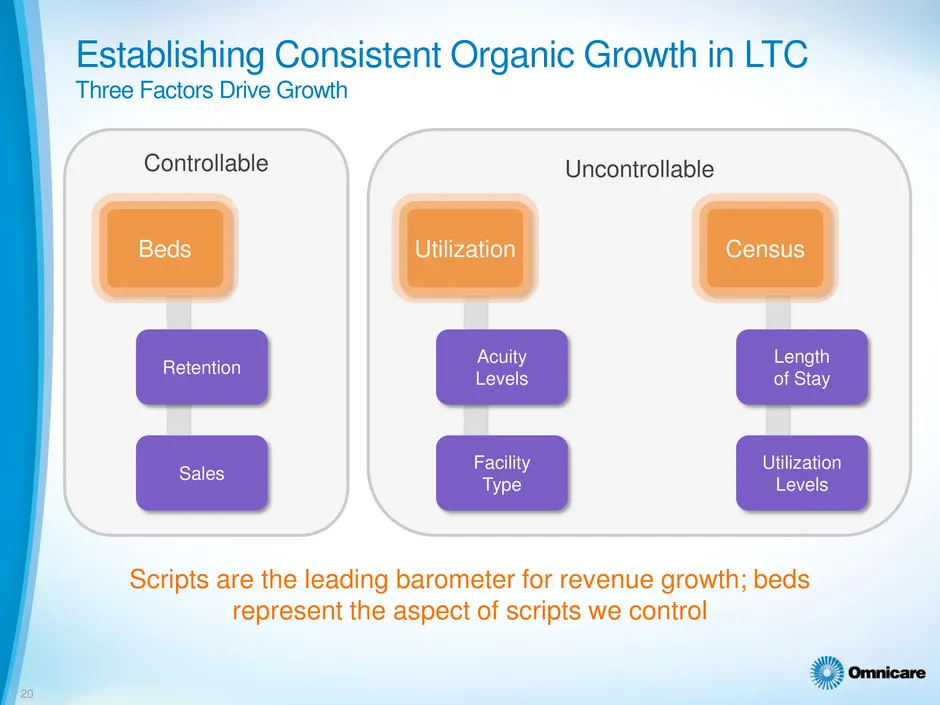
Establishing Consistent Organic Growth in LTC Three Factors Drive Growth Controllable Uncontrollable Beds Utilization Census Acuity Length oY seal Sales Facility Utilization Type Levels Scripts are the leading barometer for revenue growth; beds represent the aspect of scripts we control 22 omnicare
Slide 21: Continued Emphasis on Controlling Bed Losses
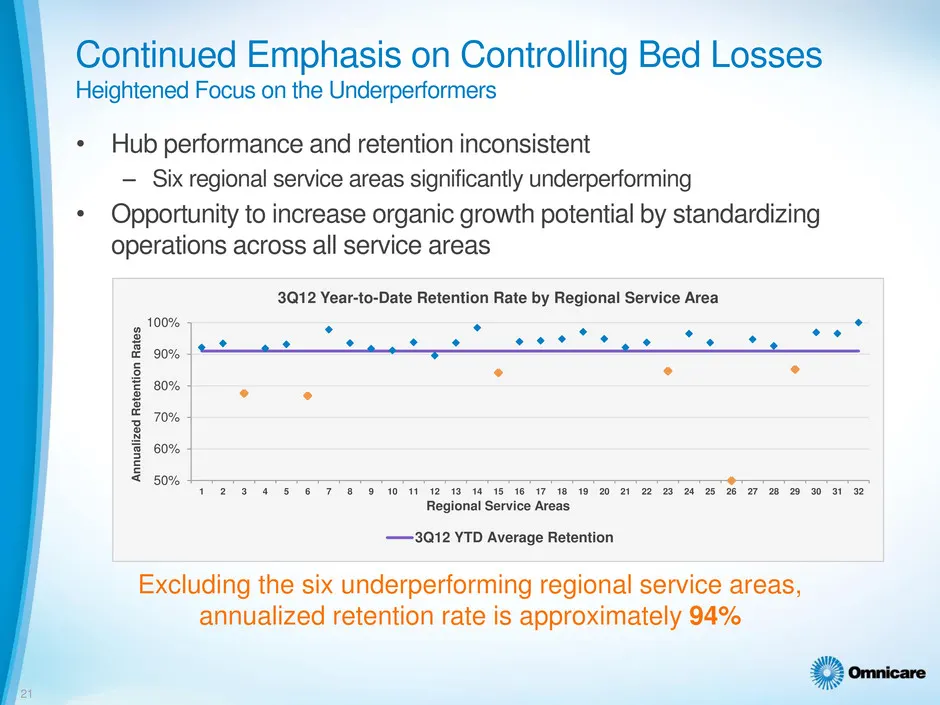
Continued Emphasis on Controlling Bed Losses Heightened Focus on the Underperformers * Hub performance and retention inconsistent — Six regional service areas significantly underperforming * Opportunity to increase organic growth potential by standardizing operations across all service areas 3Q12 Ye
Slide 22: Sales Initiatives Key to Improving Results
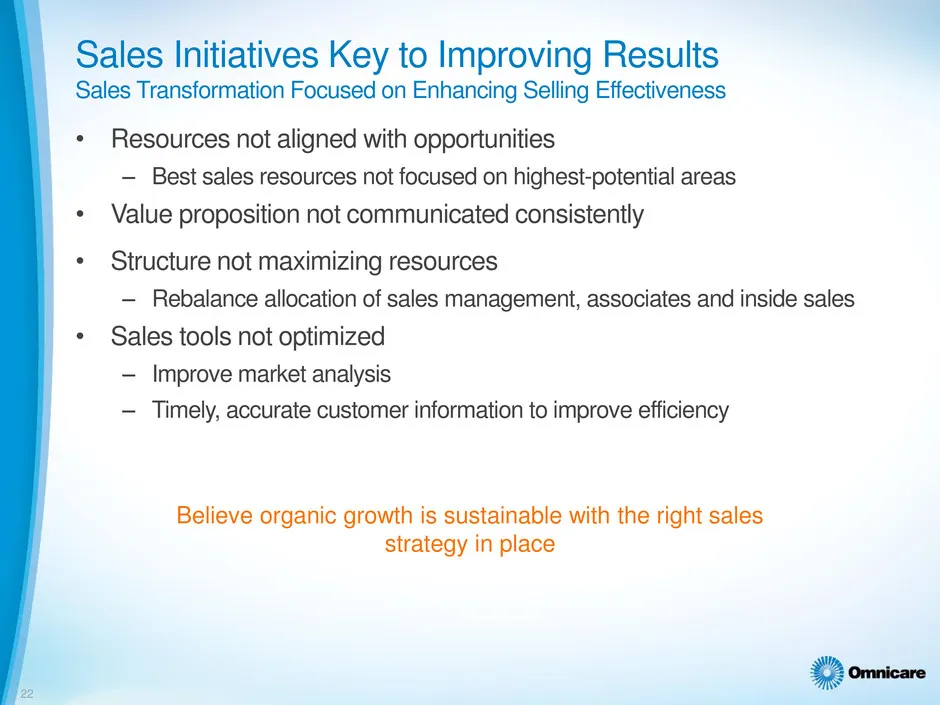
Sales Initiatives Key to Improving Results Sales Transformation Focused on Enhancing Selling Effectiveness Resources not aligned with opportunities — Best sales resources not focused on highest-potential areas Value proposition not communicated consistently Structure not maximizing resources — Rebal
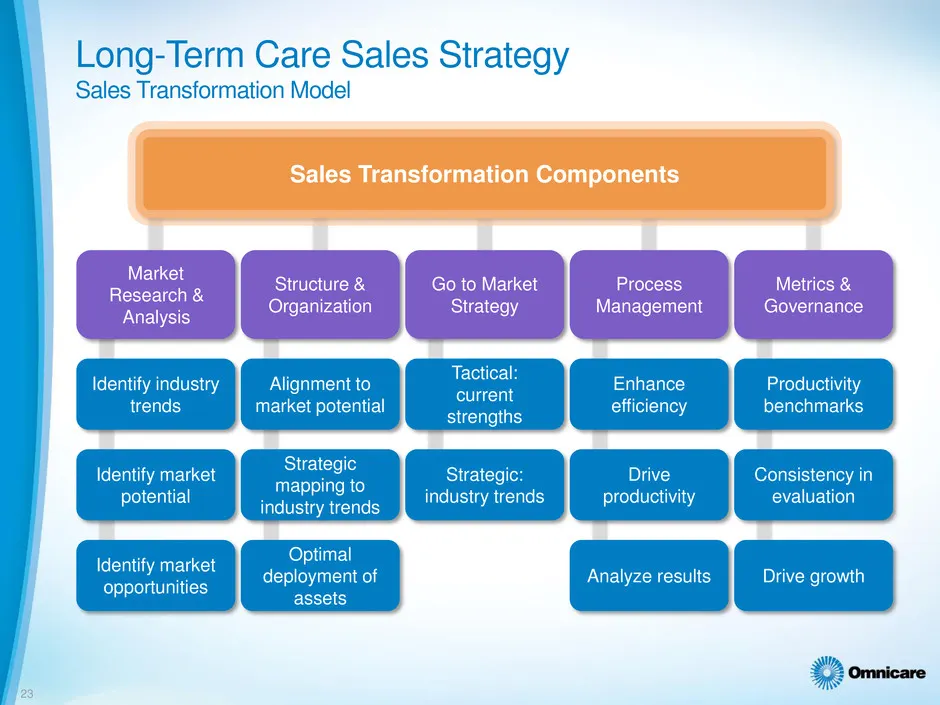
Slide 23: Sales Transformation Components
Sales Transformation Components
Slide 24: Refining Long-Term Care Focus on Operations
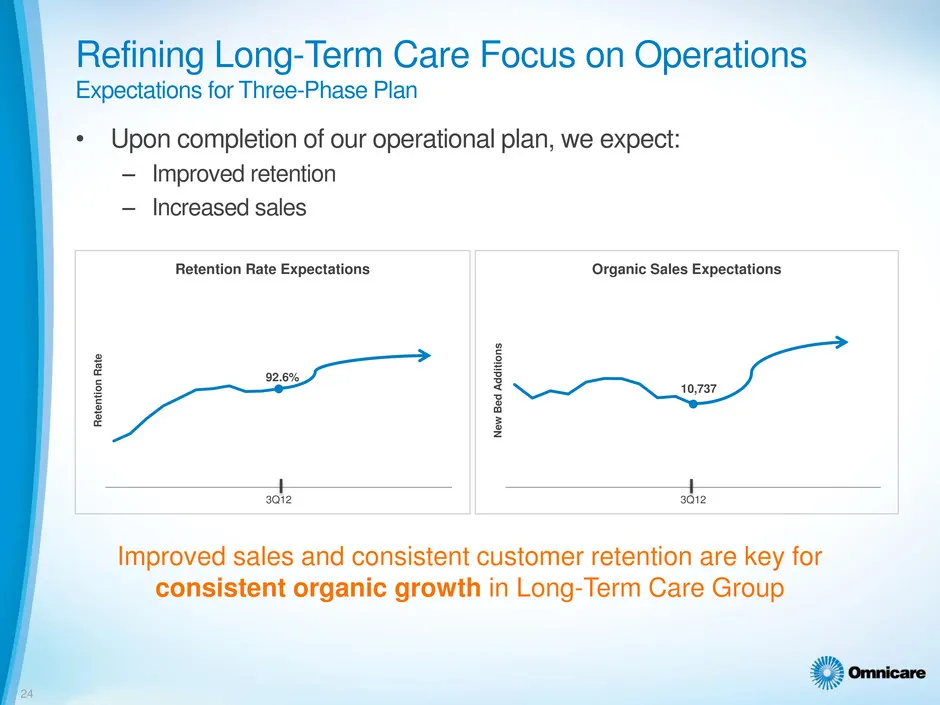
Refining Long-Term Care Focus on Operations Expectations for Three-Phase Plan + Upon completion of our operational plan, we expect: — Improved retention — Increased sales Retention Rate Expectations Organic Sales Expectations Retention Rte by \ New Bed Addons nl 3012 3012 Improved sales and consiste
Slide 25: Omnicare Specialty Care Group
WwW, js OMmicare Specialty Care Group
Slide 26: Specialty Care Group
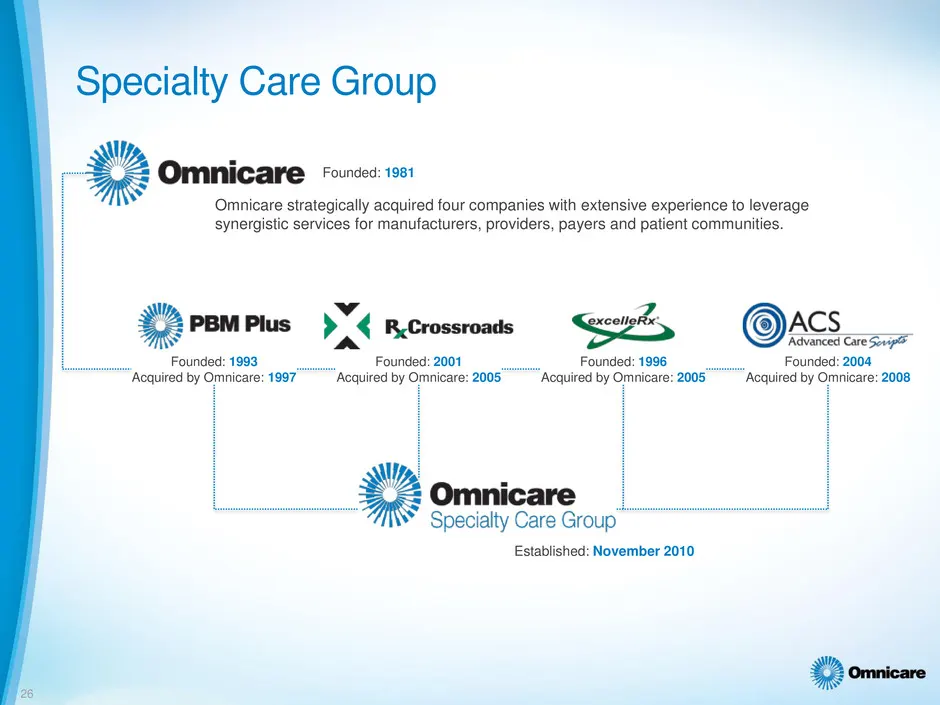
Specialty Care Group rc . Omnicare 20:12: Omnicare strategically acquired four companies with extensive experience to leverage synergistic services for manufacturers, providers, payers and patient communities. fe PBM Plus ryA Crossroads <sy4, ACS Founded: 1993 Founded: 2001 sme Funded: 1996 Founded:
Slide 27: Omnicare's Five Operating Platforms
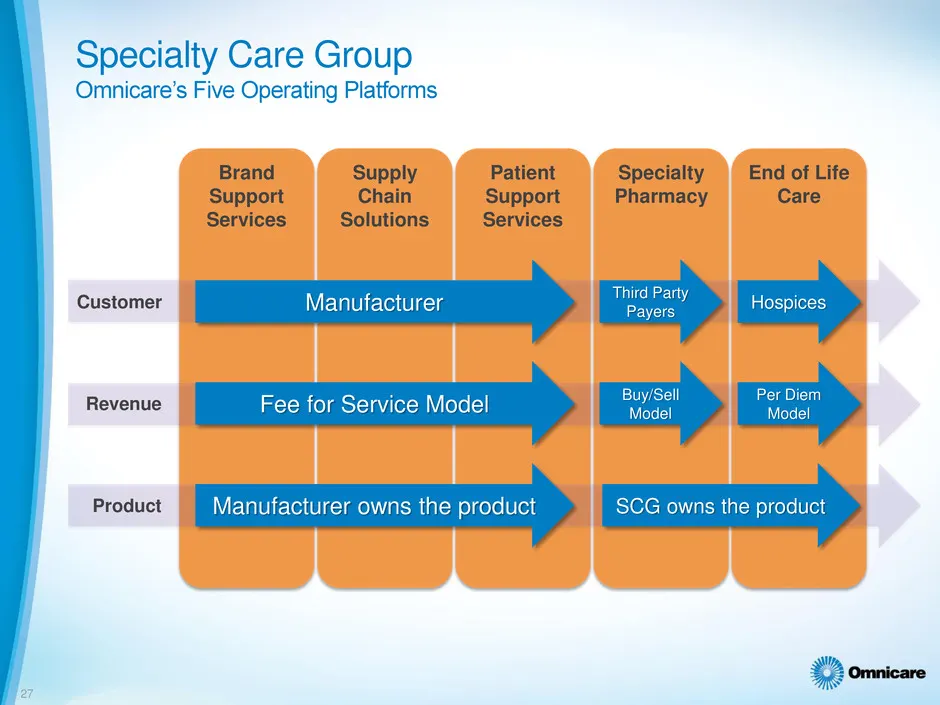
Specialty Care Group Omnicare’s Five Operating Platforms Brand Supply Patient Support Chain Support Services Solutions Services Customer Revenue Fee for Service Model Product Manufacturer owns the product Third Party Specialty End of Life Pharmacy Care Payers Buy/Sell Per Diem Model Model SCG owns t
Slide 28: Manufacturer focused
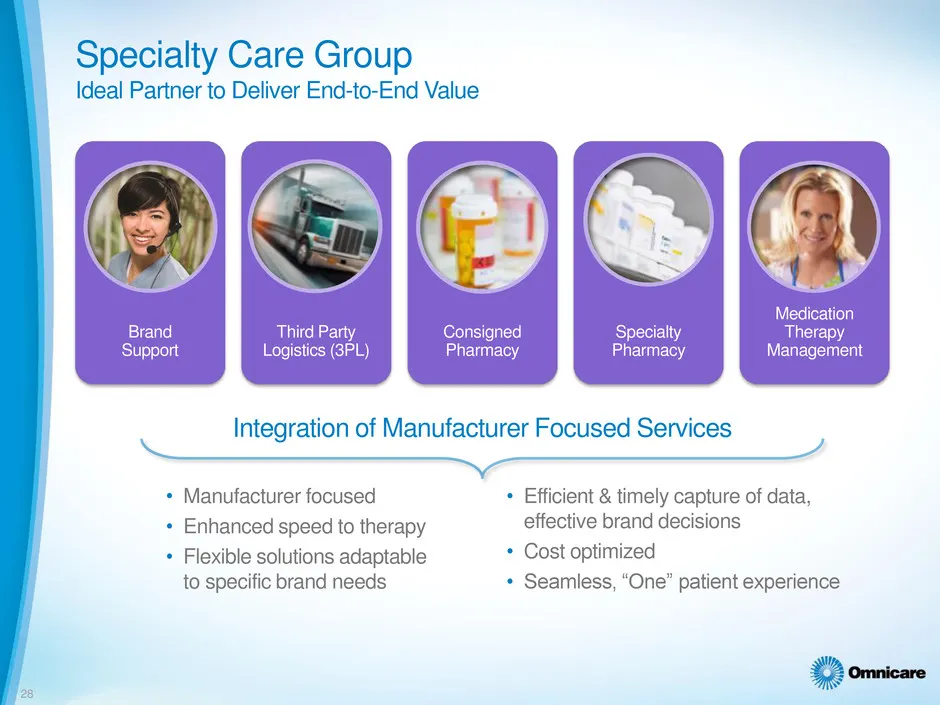
Manufacturer focused Enhanced speed to therapy Flexible solutions adaptable to specific brand needs Efficient & timely capture of data, effective brand decisions Cost optimized Seamless, “One” patient experience
Slide 29: Manufacturer-centric
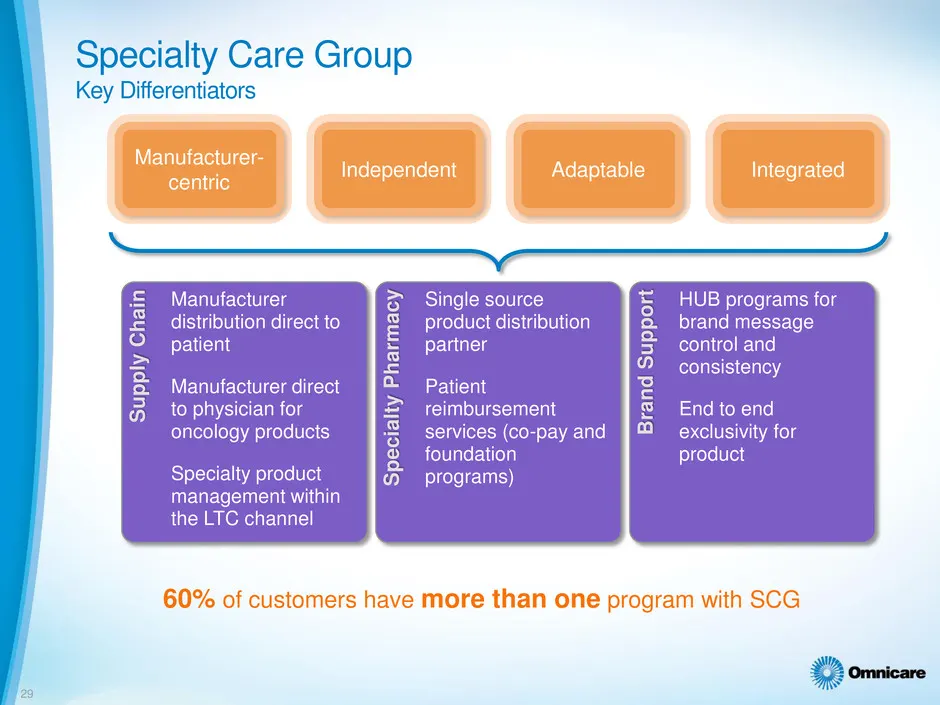
Manufacturer- ntric Independent Adaptable Integrated 60% of customers have more than one program with SCG
Slide 30: Continuing SCG Growth Momentum
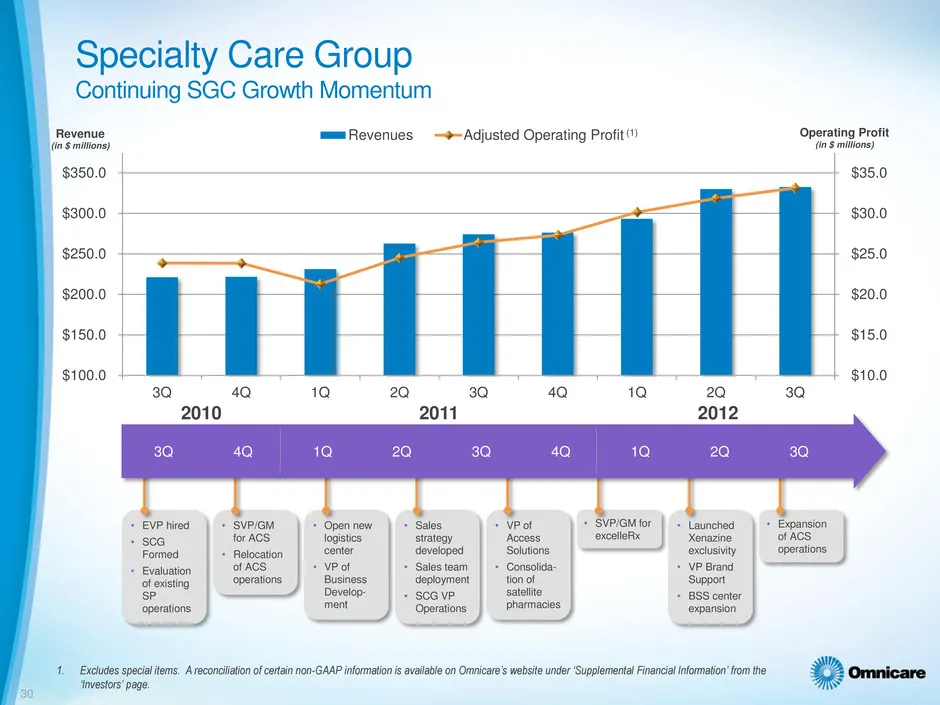
Specialty Care Group Continuing SGC Growth Momentum - Revenue mmsRevenues | —2Adjusted Operating Profit”) Operating Profit “(in $ miions) (in $ millions) $950.0 Less o ‘pau $30.0 5 $2500 $250 $2000 $20.0 | $150.0 $15.0 $10.0
Slide 31: Maximizing Internal and External Opportunities
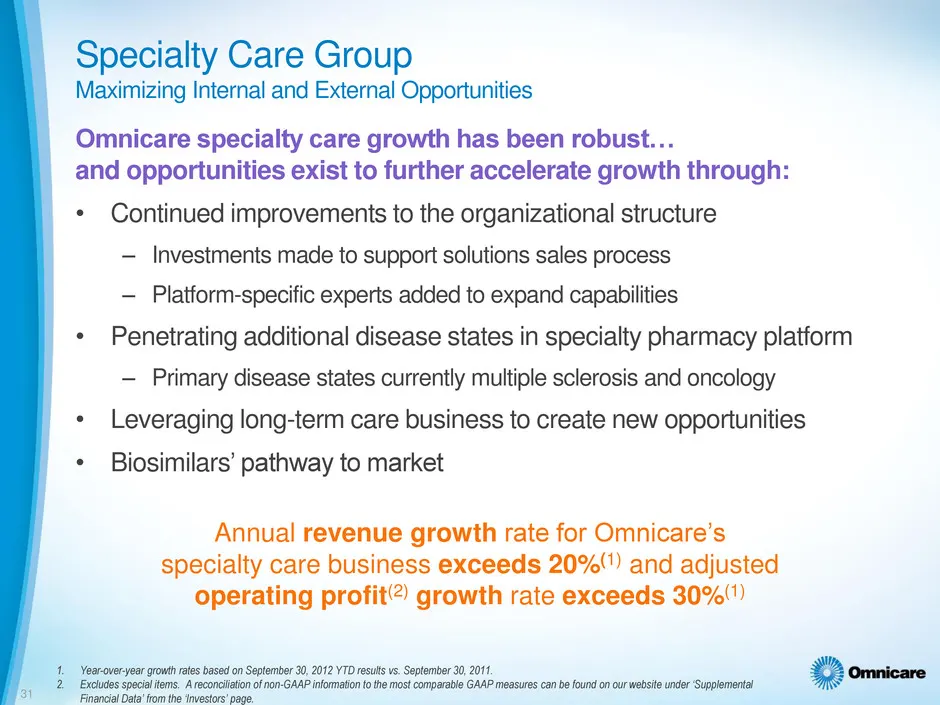
Specialty Care Group Maximizing Internal and External Opportunities Omnicare specialty care growth has been robust... and opportunities exist to further accelerate growth through: Continued improvements to the organizational structure — Investments made to support solutions sales process — Platform-
Slide 32: Benefits SCG Brings to Omnicare
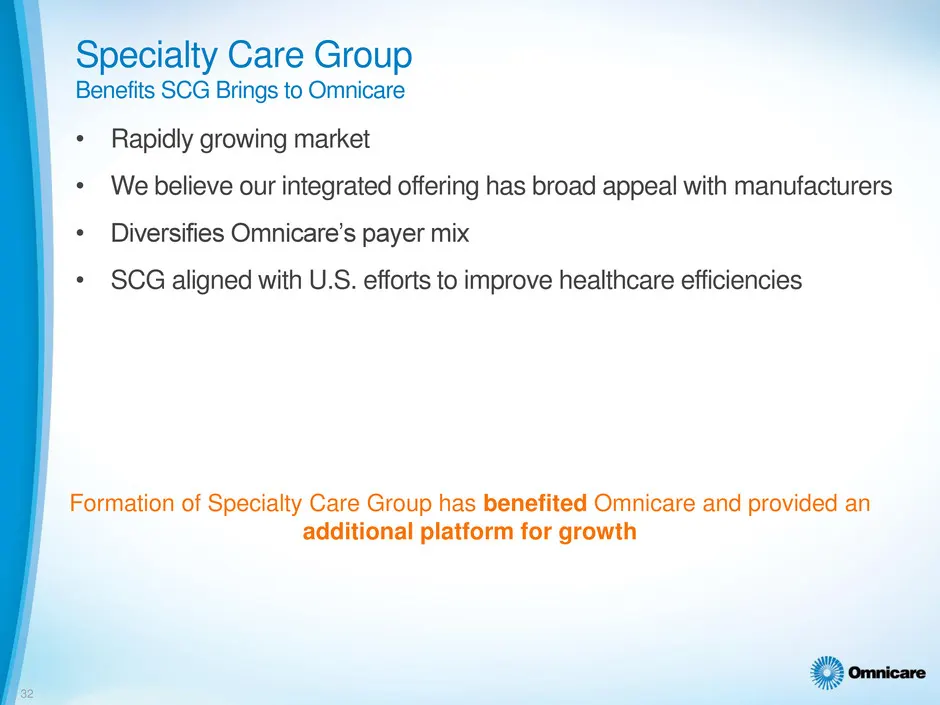
Specialty Care Group Benefits SCG Brings to Omnicare Rapidly growing market We believe our integrated offering has broad appeal with manufacturers Diversifies Omnicare’s payer mix SCG aligned with U.S. efforts to improve healthcare efficiencies Formation of Specialty Care Group has benefited Omnicar
Slide 33: Omnicare Financial Overview
WwW, “q¢ Omnicare Financial Overview
Slide 34: Operating Performance
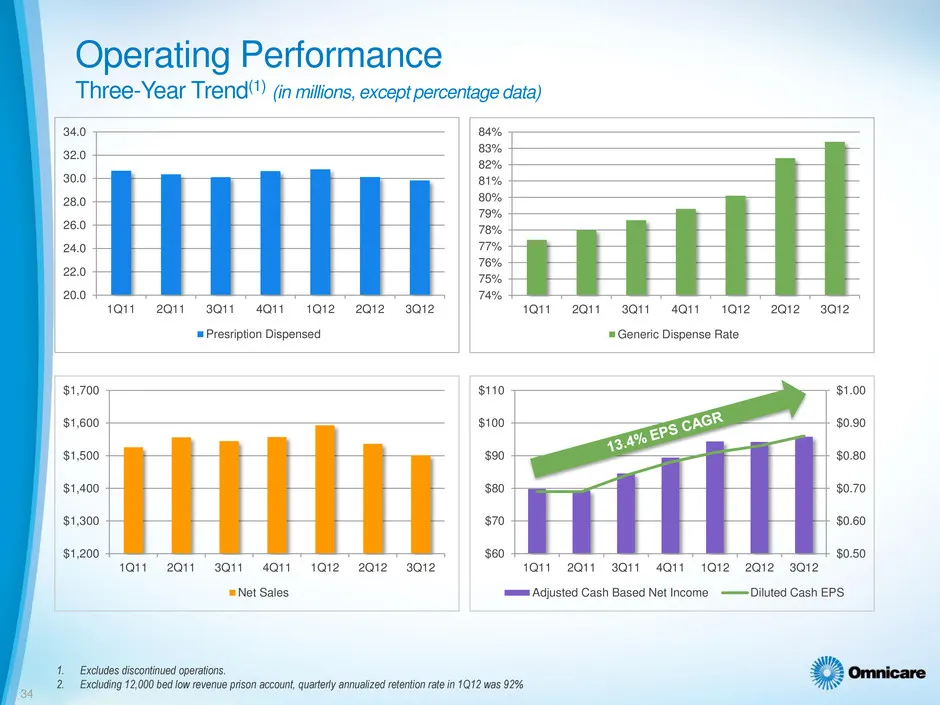
Operating Performance Three-Year Trend") (in millions, except percentage data) 1O11 2011 sai att 1012 2012 saz JQ 2Q11 3Q11 4Qt1 1Q12-2Q12sQ12 '=Presription Dispensed '= Generic Dispense Rate $1,700 $1,600 $1,500 $1,400 $1,300 | $1,200 $60 1011 2011 3QIt 4a11 1012 2a12 3Q12 1O11 2QIt 3QIt 4Q1t 1012
Slide 35: Capital Allocation Program
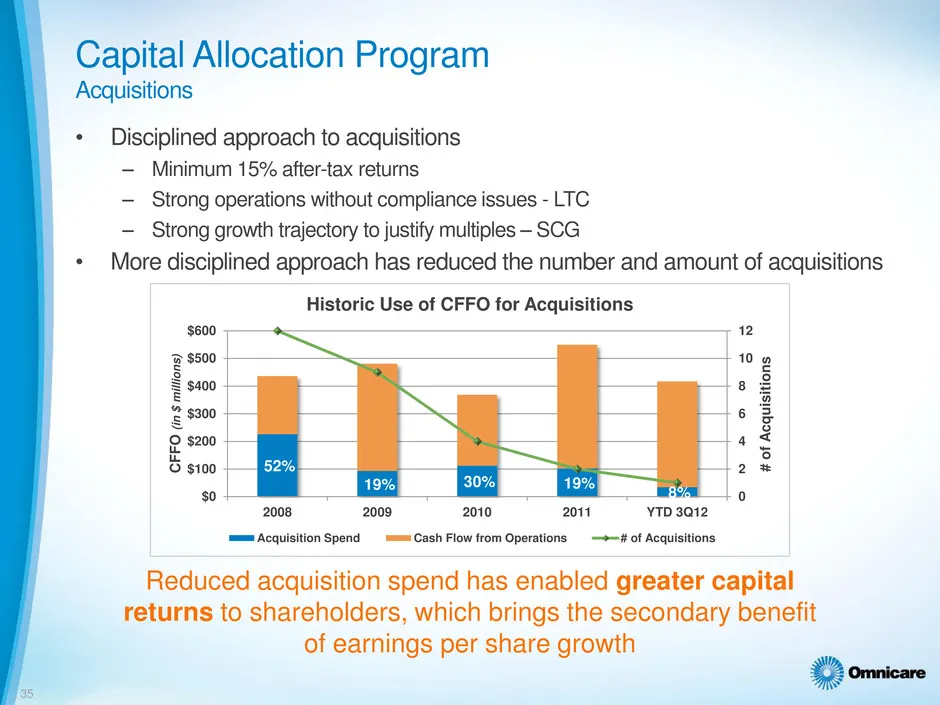
Capital Allocation Program Acquisitions + Disciplined approach to acquisitions — Minimum 15% after-tax returns — Strong operations without compliance issues - LTC — Strong growth trajectory to justify multiples - SCG + More disciplined approach has reduced the number and amount of acquisitions Histo
Slide 36: Capital Allocation Program
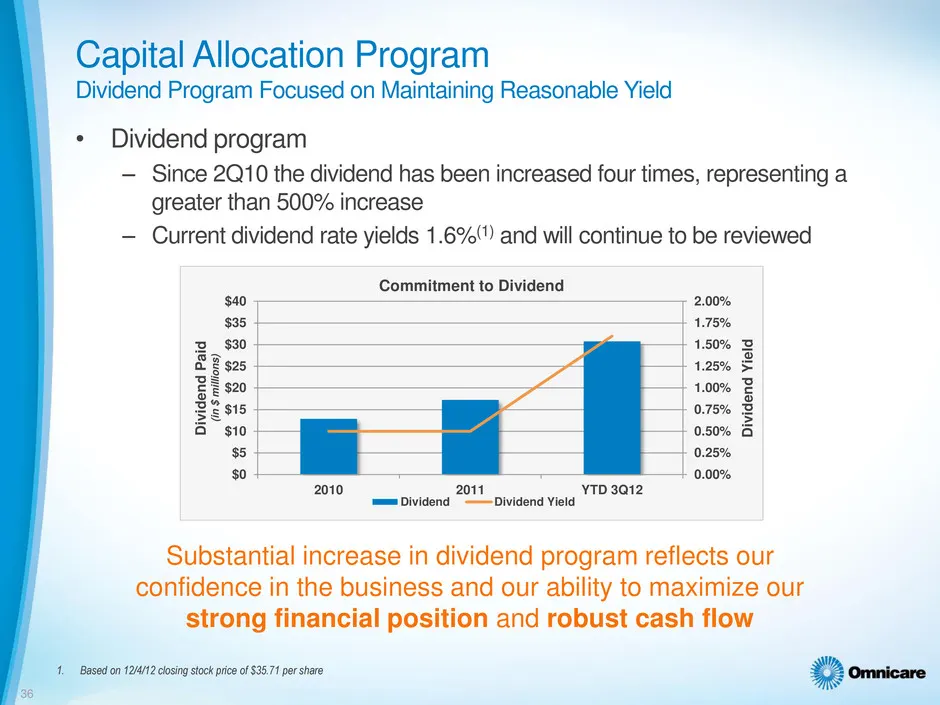
Capital Allocation Program Dividend Program Focused on Maintaining Reasonable Yield * Dividend program — Since 2Q10 the dividend has been increased four times, representing a greater than 500% increase — Current dividend rate yields 1.6%'") and will continue to be reviewed Commitment to Dividend EER
Slide 37: Capital Allocation Program
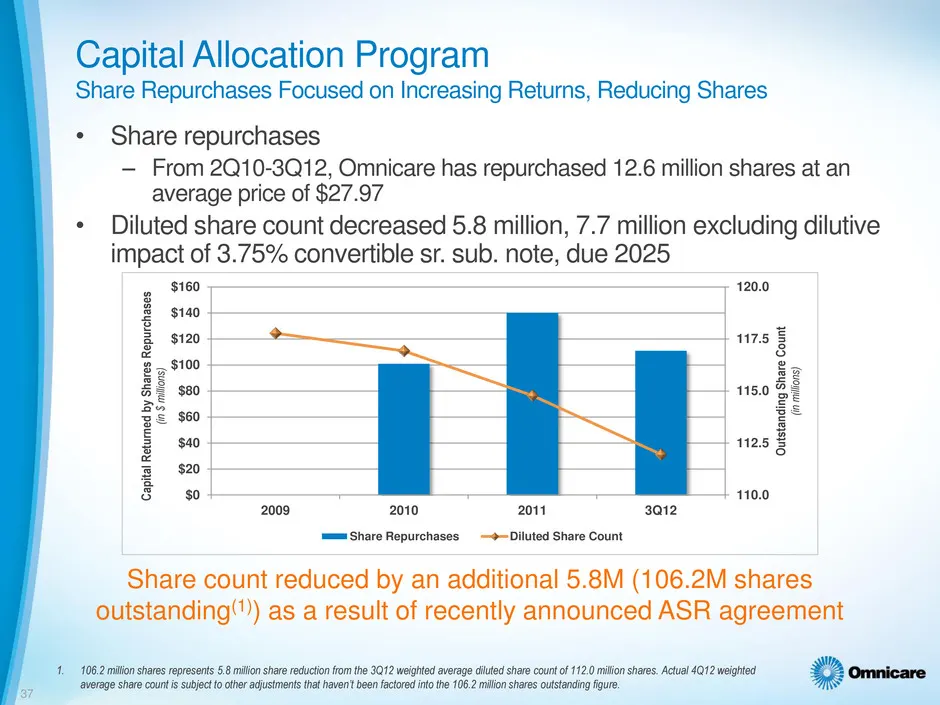
Capital Allocation Program Share Repurchases Focused on Increasing Returns, Reducing Shares * Share repurchases — From 2Q10-3Q12, Omnicare has repurchased 12.6 million shares at an average price of $27.97 * Diluted share count decreased 5.8 million, 7.7 million excluding dilutive impact of 3.75% con
Slide 38: Capital Allocation Program
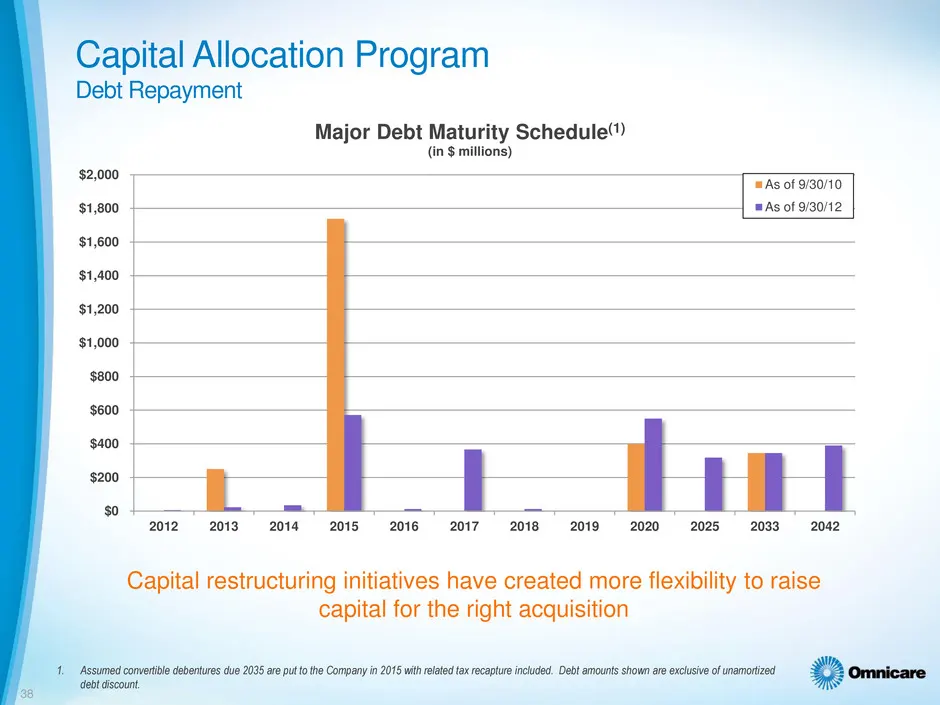
Capital Allocation Program Debt Repayment Major Debt Maturity Schedule” (in $ millions) $2,000 $1,800 $1,600 $1,400 $1,200 $1,000 s |_—_._.._- _ Bm _. ——__ 2012 2013 2014 2015 2016 2017 2018 2019 2020 2025 2033 Capital restructuring initiatives have created more flexibility to raise capital for the
Slide 39: Financial Performance
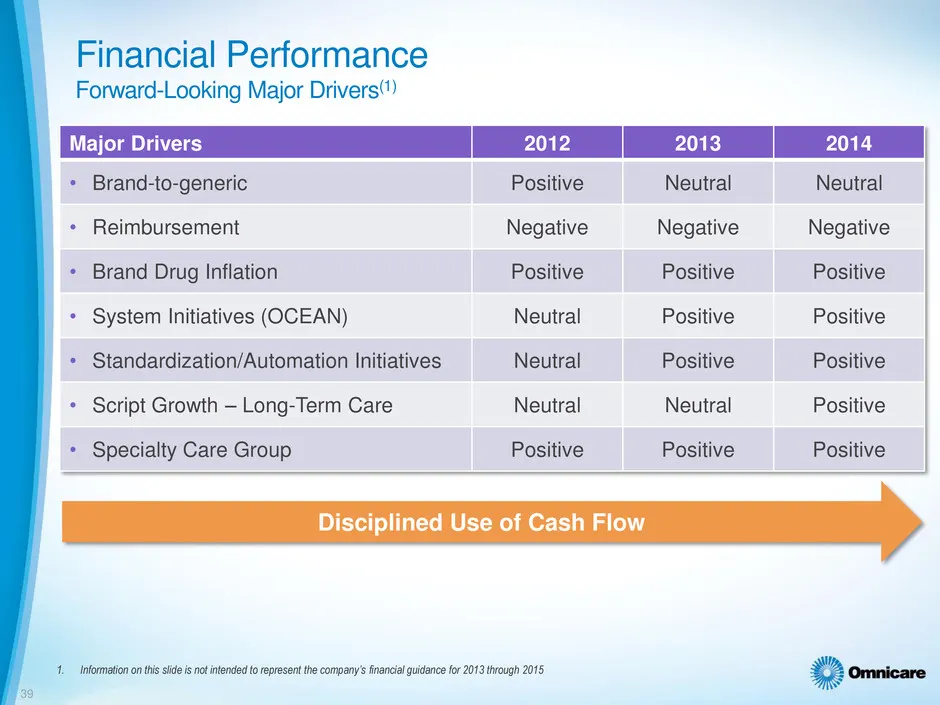
Financial Performance Forward-Looking Major Drivers‘) Brand-to-generic Positive Reimbursement Negative Brand Drug Inflation Positive System Initiatives (OCEAN) Neutral Standardization/Automation Initiatives Neutral Script Growth — Long-Term Care Neutral Specialty Care Group Positive Neutral Negative
Slide 40: LTC Organic Growth, SCG Momentum, Efficient Capital Allocation
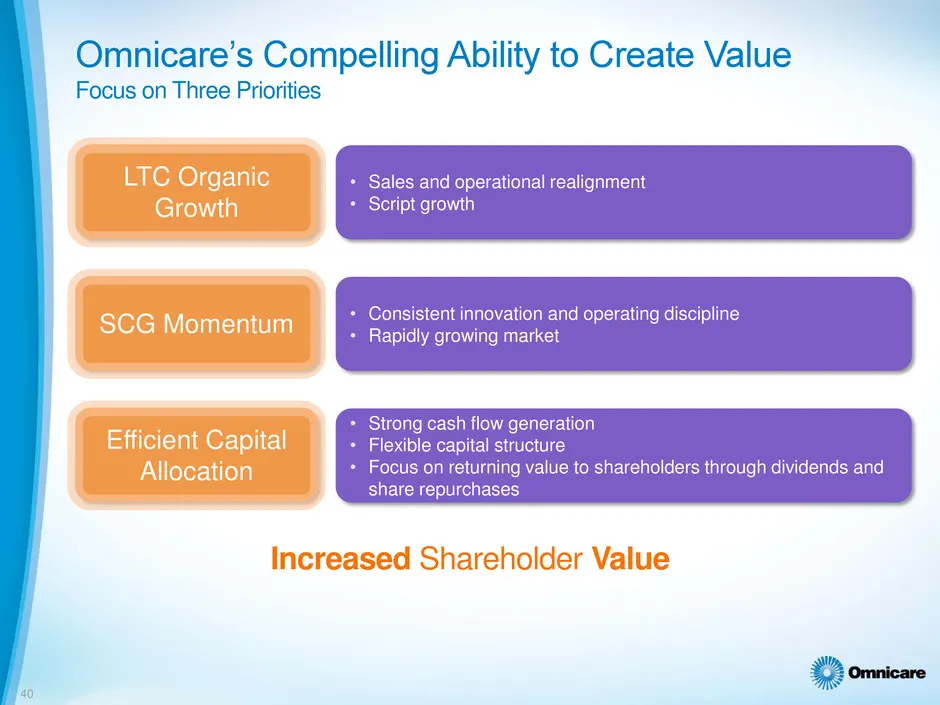
LTC Organic Growth SCG Momentum Efficient Capital Allocation Increased Shareholder Value
Slide 41: Omnicare's Compelling Ability to Create Value

Slide 42: Omnicare
Omnicare
Slide 43: Omnicare Appendix
WwW, ne Omnicare Appendix
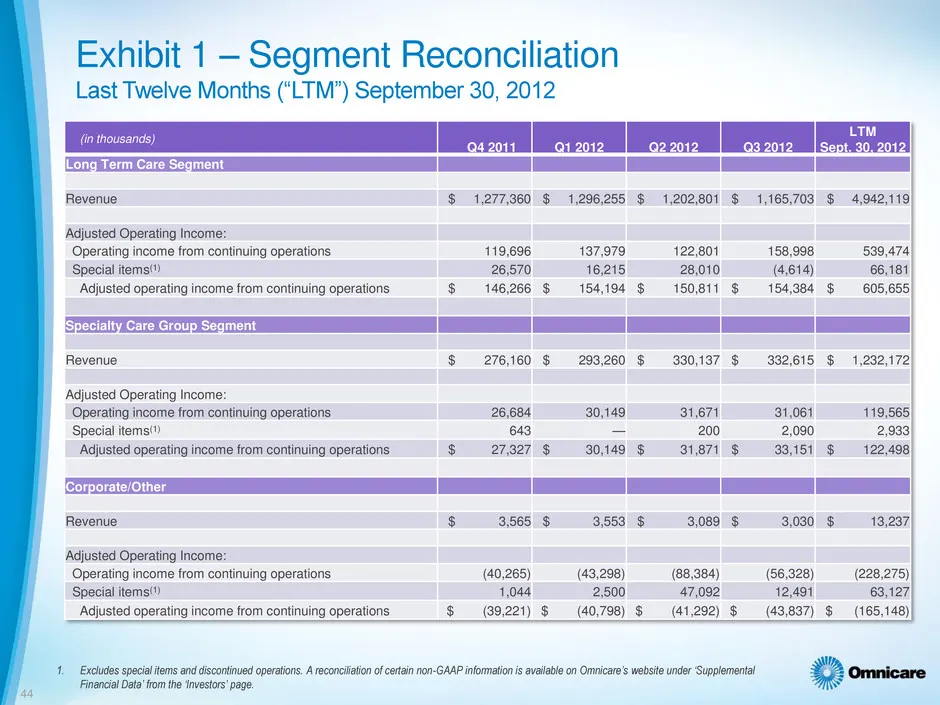
Slide 44: Exhibit - Segment Reconciliation
Exhibit 1 - Segment Reconciliation Last Twelve Months (“LTM”) September 30, 2012 Loss | crane | cazoie | osaoie |e ani 942011 Q12012 Q 93.2012 _| Sept, 30,2012 EEE EE ES Eee (nth iCong Term Care Segment Revenue $ 1,277,360 $ 1,296,255 $ 1,202,801 $ 1,165,703 $ 4,942,119 ‘Adjusted Operating Income: S
Source: SEC EDGAR · 8-K filed Jan 8, 2013
More decks from Omnicare Inc
 Bank of America Merrill Lynch 2015 Health Care Conference20 slides · May 12, 2015
 Q1 2015 Earnings Presentation17 slides · Apr 29, 2015
 Q4 2014 Earnings Presentation18 slides · Feb 25, 2015
 33rd Annual J.P. Morgan Healthcare Conference (January 2015)34 slides · Jan 12, 2015
 Credit Suisse conference (November 2014)21 slides · Nov 10, 2014
 Q3 2014 Earnings Presentation16 slides · Oct 24, 2014