Curo — Investor Presentation (June 2020)
32 slides from Curo's investor presentation, Jun 17, 2020
Slide 1: June 2020 Investor Presentation
June 2020 Investor Presentation
Slide 2: Disclaimer
Disclaimer IMPORTANT: You must read the following information before continuing to the rest of the presentation, which is being provided to you for informational purposes only. Forward-Looking Statements This presentation contains forward-looking statements. These forward-looking statements include
Slide 3: Business Overview
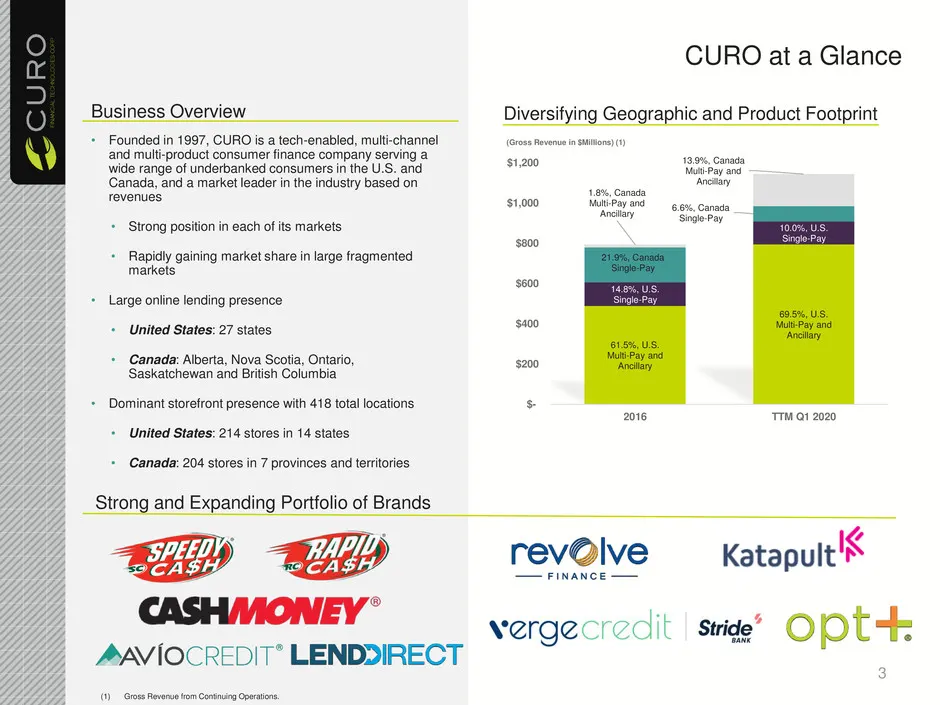
Business Overview • Founded in 1997, CURO is a tech-enabled, multi-channel and multi-product consumer finance company serving a wide range of underbanked consumers in the U.S. and Canada, and a market leader in the industry based on revenues • Strong position in each of its markets • Rapidly gaining
Slide 4: Managing COVID-19
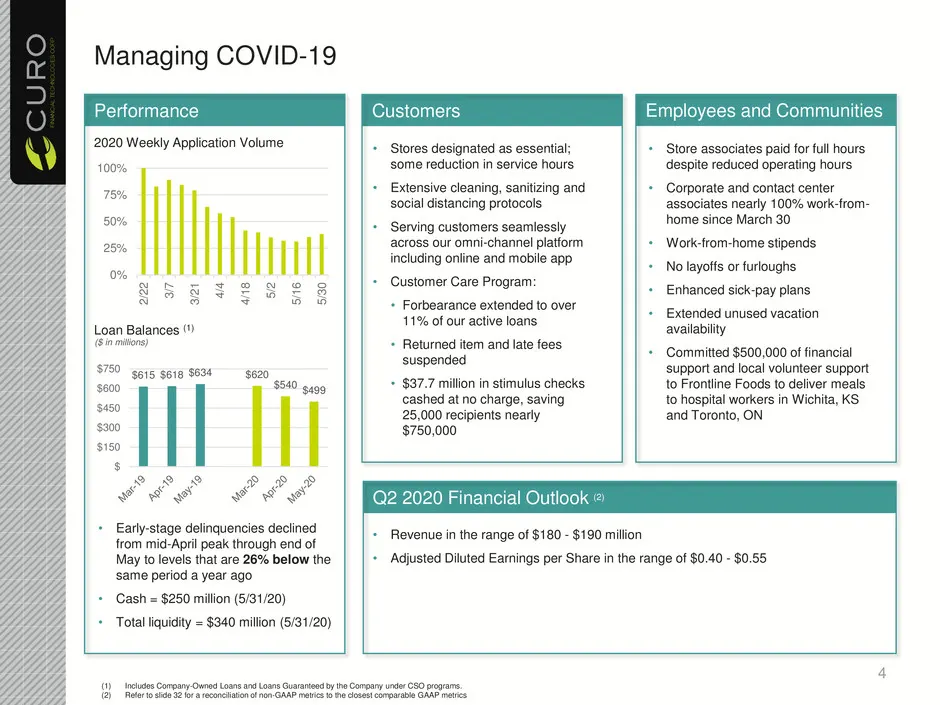
Managing COVID-19 4 Performance 2020 Weekly Application Volume Loan Balances (1) • Early-stage delinquencies declined from mid-April peak through end of May to levels that are 26% below the same period a year ago • Cash = $250 million (5/31/20) • Total liquidity = $340 million (5/31/20) Customers Em
Slide 5: Powering Innovation for Underbanked Consumers
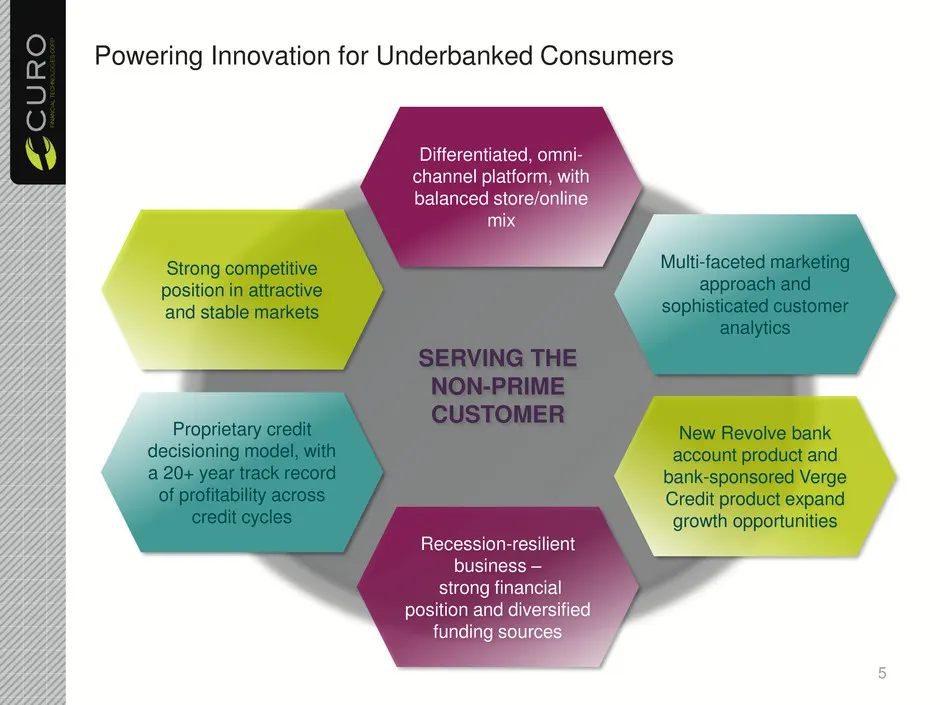
SERVING THE NON-PRIME CUSTOMER Powering Innovation for Underbanked Consumers 5 Differentiated, omni- channel platform, with balanced store/online mix Multi-faceted marketing approach and sophisticated customer analytics Recession-resilient business – strong financial position and diversified funding
Slide 6: Leading Large-Scale Lender To Underbanked Consumers With Track Record of Profitability
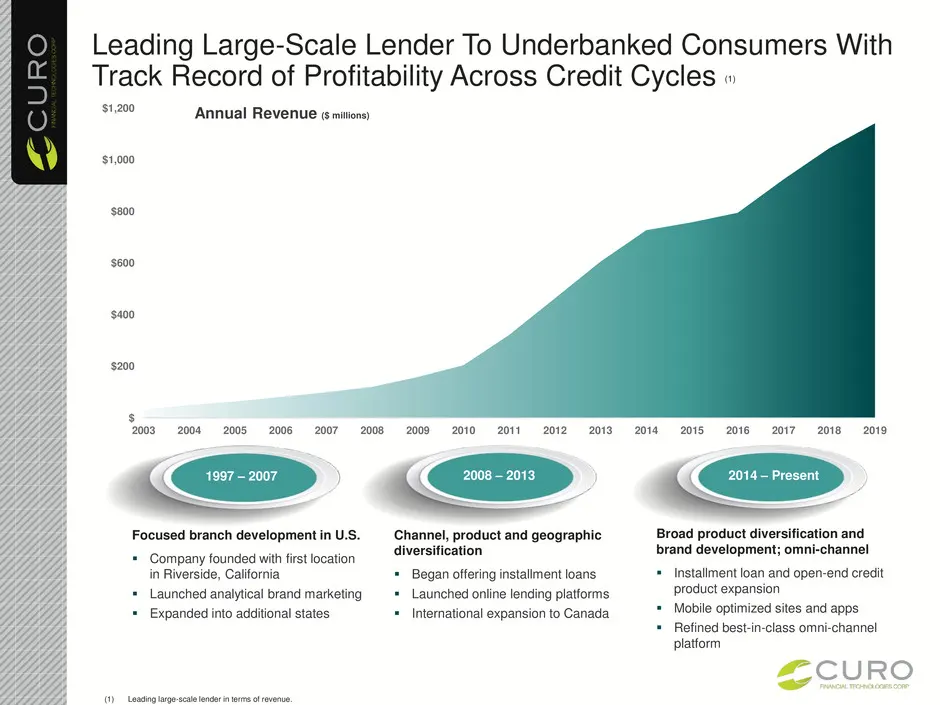
$ $200 $400 $600 $800 $1,000 $1,200 2003 2004 2005 2006 2007 2008 2009 2010 2011 2012 2013 2014 2015 2016 2017 2018 2019 Leading Large-Scale Lender To Underbanked Consumers With Track Record of Profitability Across Credit Cycles (1) (1) Leading large-scale lender in terms of revenue. 1997 – 2007 200
Slide 7: Large Addressable Market in US is Underserved
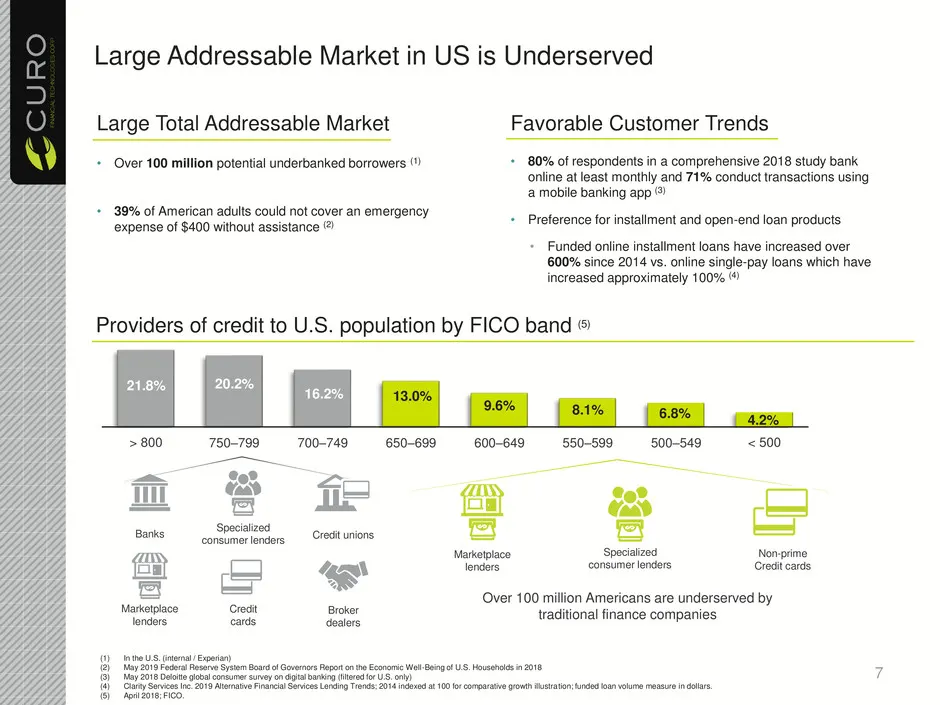
Large Addressable Market in US is Underserved 21.8% 20.2% 16.2% 13.0% 9.6% 8.1% 6.8% 4.2% > 800 750–799 700–749 650–699 600–649 550–599 500–549 < 500 Providers of credit to U.S. population by FICO band (5) Over 100 million Americans are underserved by traditional finance companies Specialized consum
Slide 8: Evolving U.S. Competitive Landscape
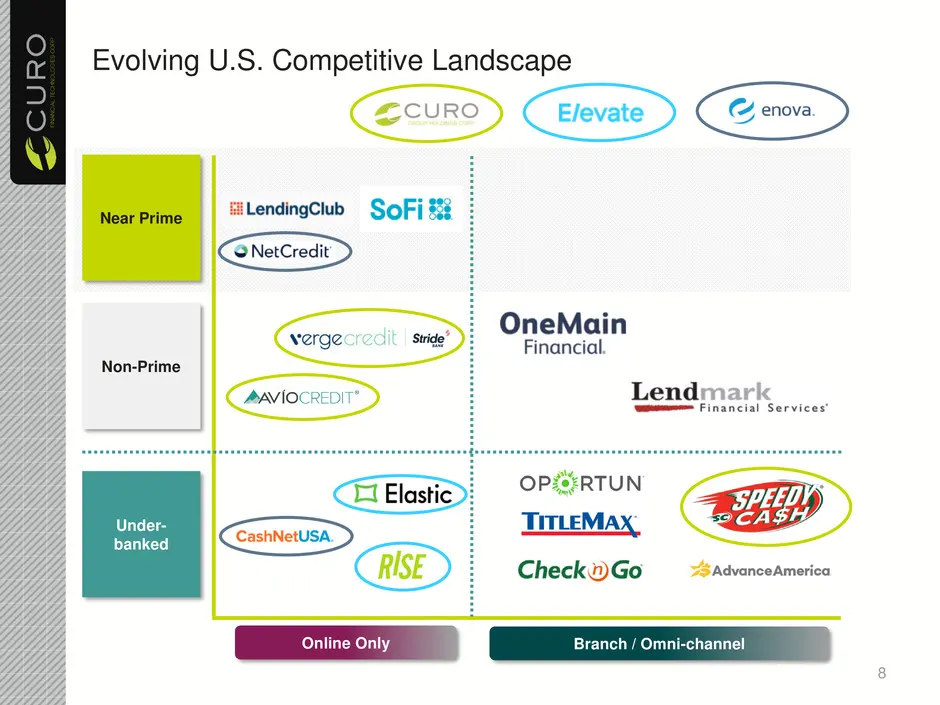
8 Evolving U.S. Competitive Landscape Online Only Branch / Omni-channel Near Prime Non-Prime Under- banked
Slide 9: Canadian Market Remains Very Attractive
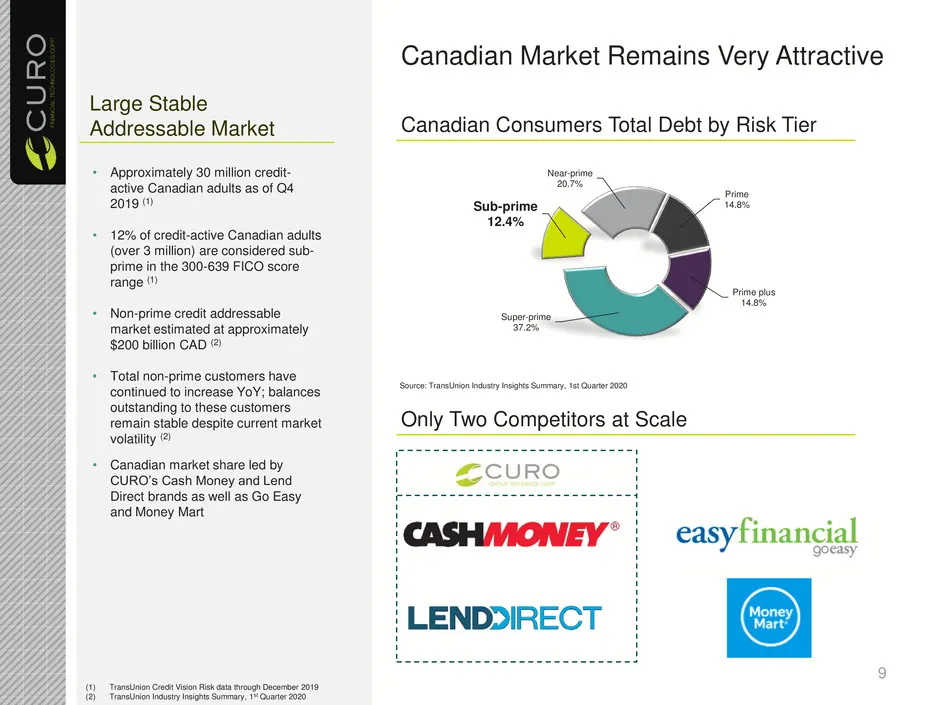
Canadian Market Remains Very Attractive • Approximately 30 million credit- active Canadian adults as of Q4 2019 (1) • 12% of credit-active Canadian adults (over 3 million) are considered sub- prime in the 300-639 FICO score range (1) • Non-prime credit addressable market estimated at approximately $
Slide 10: Omni-Channel Platform Supports Call, Click or Come In
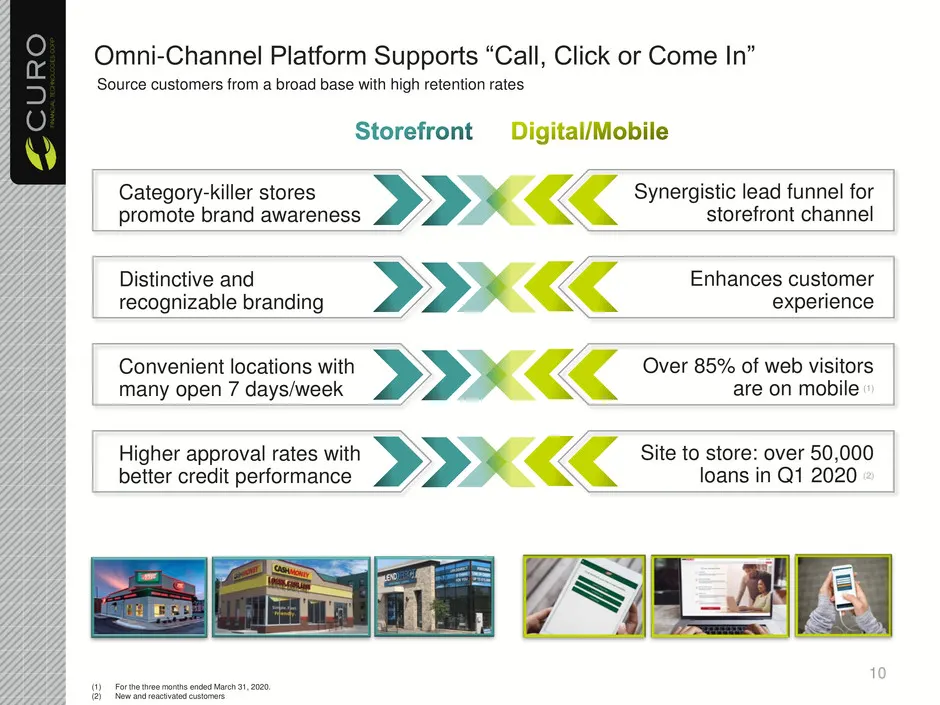
Omni-Channel Platform Supports “Call, Click or Come In” Category-killer stores promote brand awareness Synergistic lead funnel for storefront channel Distinctive and recognizable branding Enhances customer experience Convenient locations with many open 7 days/week Over 85% of web visitors are on mob
Slide 11: Comprehensive Product Offerings and Diversified Revenue
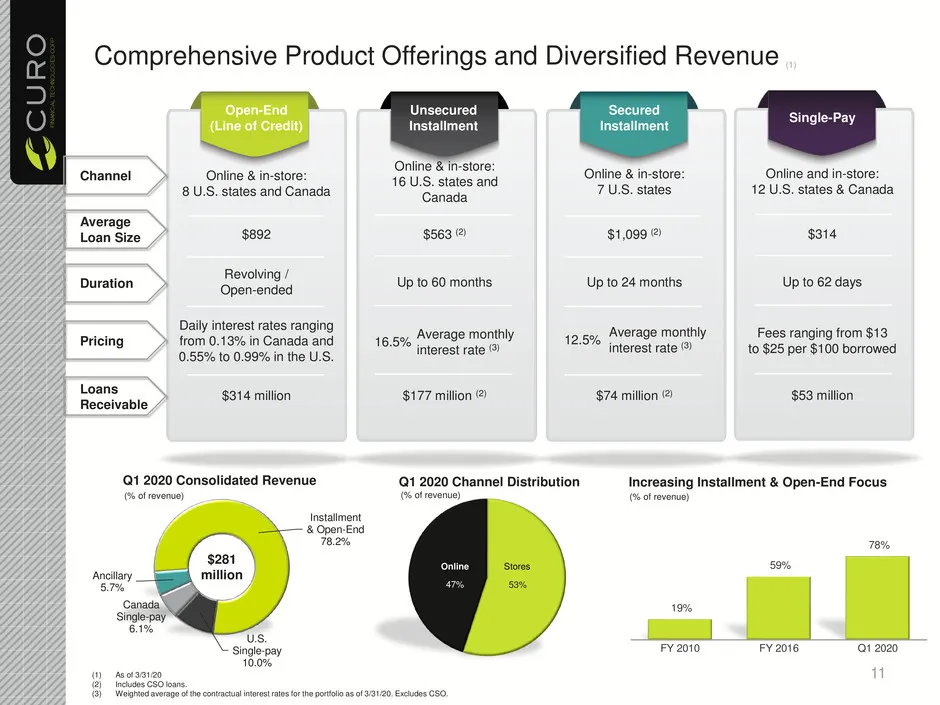
Comprehensive Product Offerings and Diversified Revenue (1) (1) As of 3/31/20 (2) Includes CSO loans. (3) Weighted average of the contractual interest rates for the portfolio as of 3/31/20. Excludes CSO. Q1 2020 Channel Distribution Installment & Open-End 78.2% U.S. Single-pay 10.0% Canada Single-pa
Slide 12: Strong Loan Growth Driven by Success of Open-End
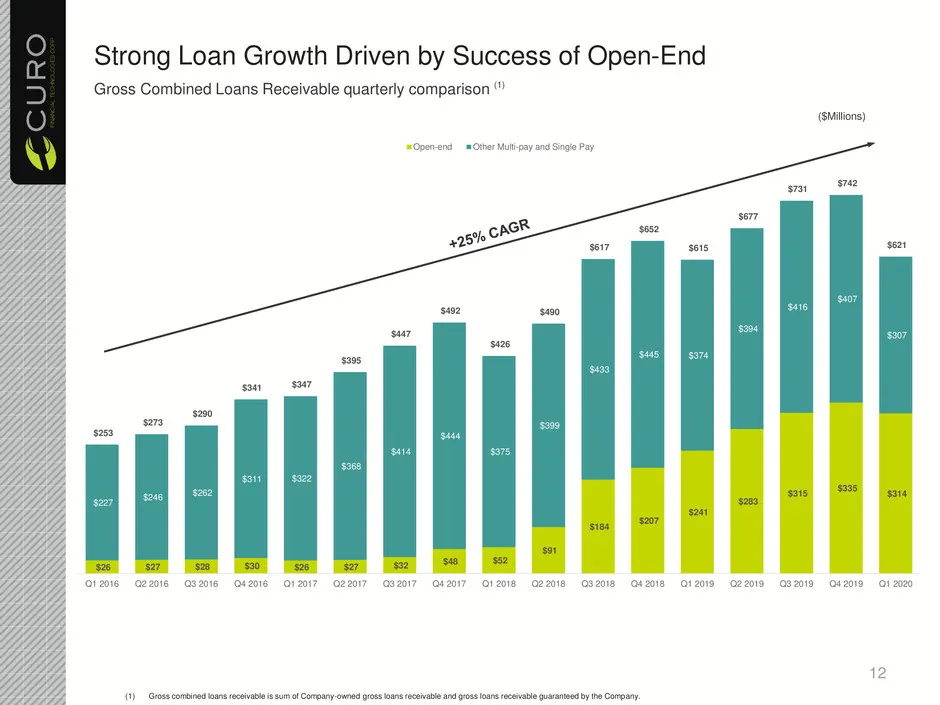
Strong Loan Growth Driven by Success of Open-End Gross Combined Loans Receivable quarterly comparison (1) ($Millions) (1) Gross combined loans receivable is sum of Company-owned gross loans receivable and gross loans receivable guaranteed by the Company. $26 $27 $28 $30 $26 $27 $32 $48 $52 $91 $184
Slide 13: Canada – Successful Launch of Multi-Pay Loans
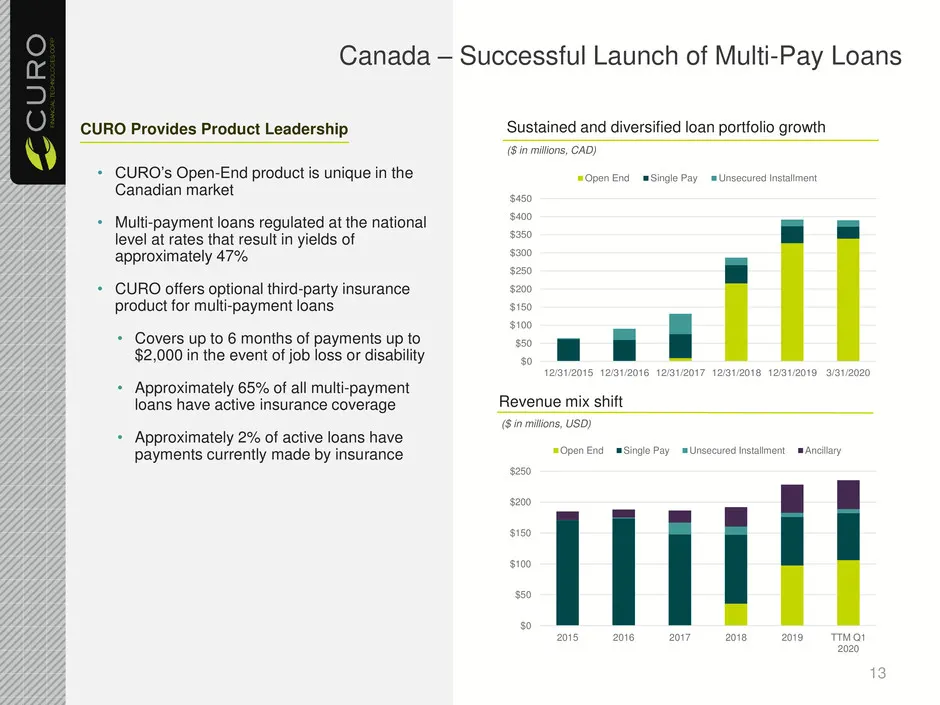
Canada – Successful Launch of Multi-Pay Loans • CURO’s Open-End product is unique in the Canadian market • Multi-payment loans regulated at the national level at rates that result in yields of approximately 47% • CURO offers optional third-party insurance product for multi-payment loans • Covers up
Slide 14: Proprietary Centralized IT and Analytics Platform
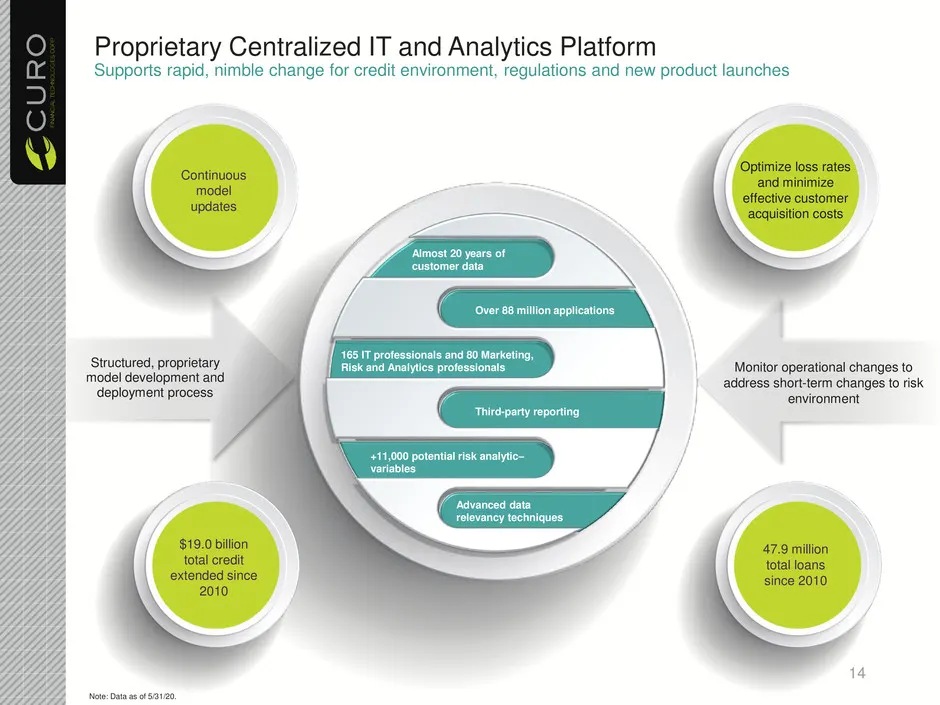
Note: Data as of 5/31/20. Structured, proprietary model development and deployment process Proprietary Centralized IT and Analytics Platform Supports rapid, nimble change for credit environment, regulations and new product launches 14 Over 88 million applications Advanced data relevancy techniques +
Slide 15: Multi-faceted Marketing Strategy and Deep Data Analysis
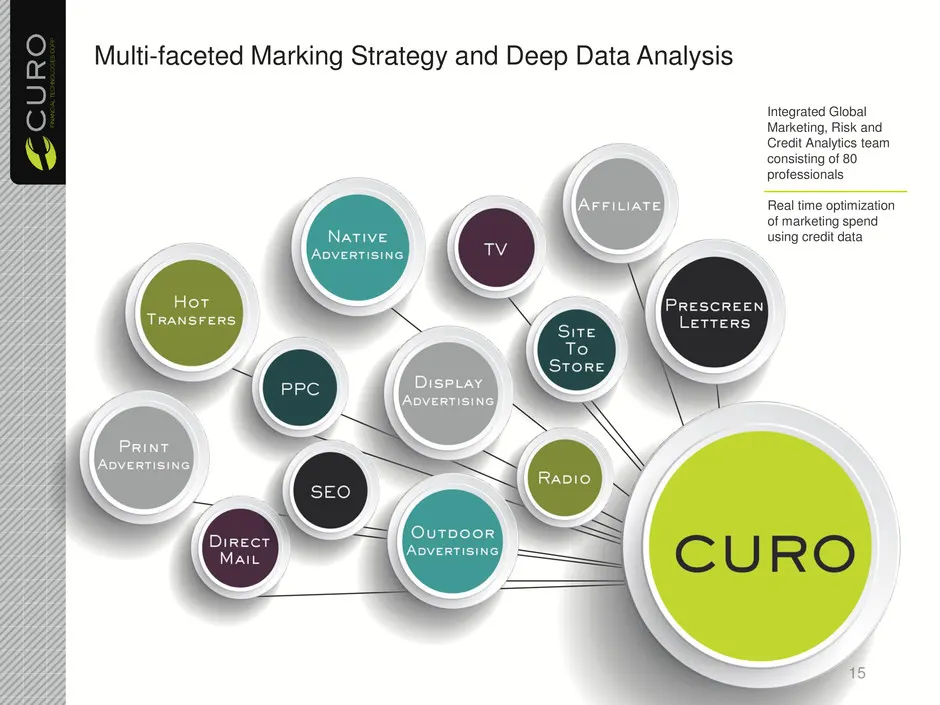
Multi-faceted Marking Strategy and Deep Data Analysis 15 Integrated Global Marketing, Risk and Credit Analytics team consisting of 80 professionals Real time optimization of marketing spend using credit data
Slide 16: Continued Diversification = New Growth Opportunities
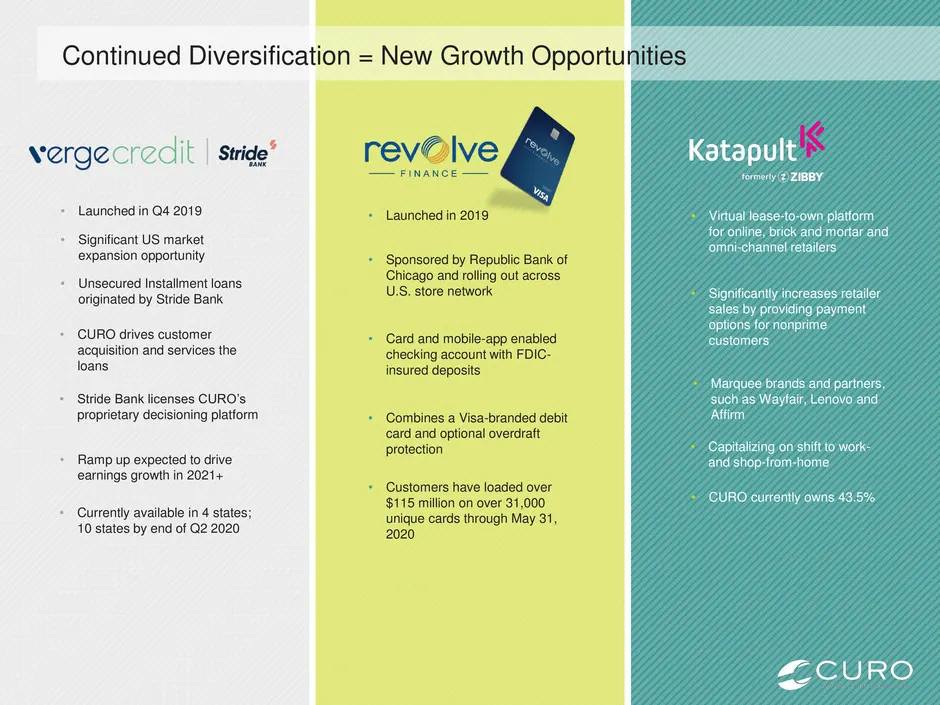
• Virtual lease-to-own platform for online, brick and mortar and omni-channel retailers • Significantly increases retailer sales by providing payment options for nonprime customers • Marquee brands and partners, such as Wayfair, Lenovo and Affirm Continued Diversification = New Growth Opportunities
Slide 17: Addressing a Large Online Market Opportunity
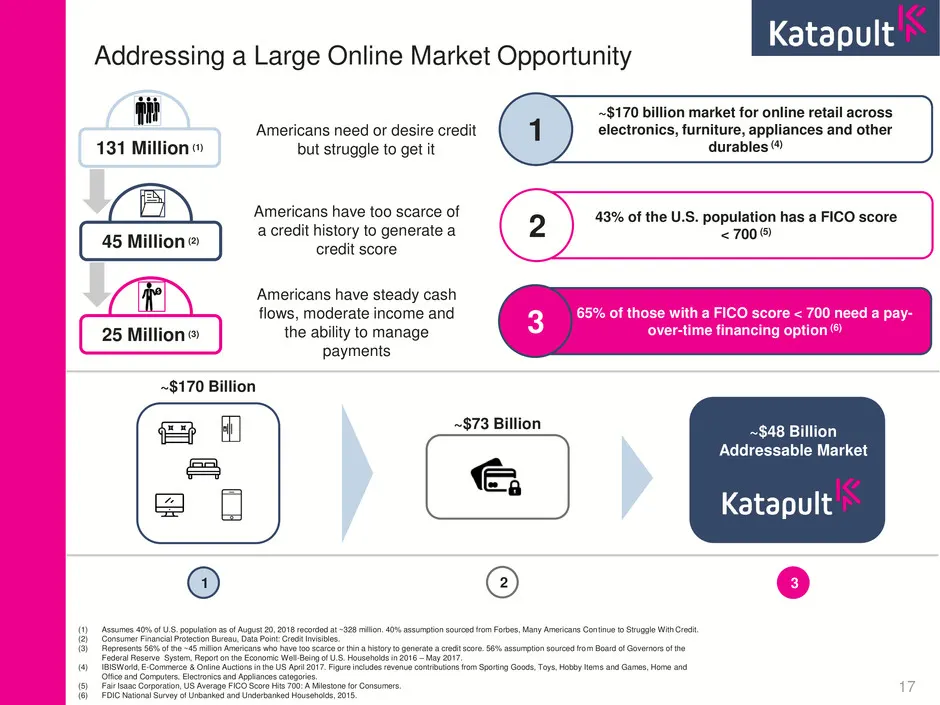
17 Addressing a Large Online Market Opportunity Americans need or desire credit but struggle to get it Americans have steady cash flows, moderate income and the ability to manage payments Americans have too scarce of a credit history to generate a credit score 25 Million (3) ~$170 billion market for
Slide 18: The New Way to Pay, for Everyday People
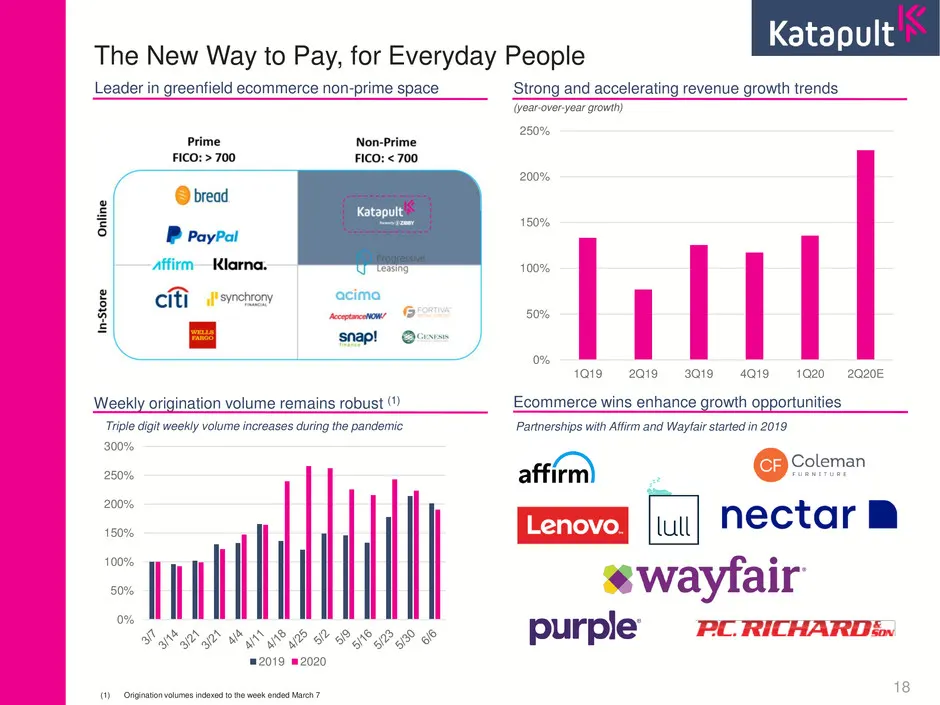
18 The New Way to Pay, for Everyday People Leader in greenfield ecommerce non-prime space Strong and accelerating revenue growth trends Weekly origination volume remains robust (1) Ecommerce wins enhance growth opportunities 0% 50% 100% 150% 200% 250% 1Q19 2Q19 3Q19 4Q19 1Q20 2Q20E (year-over-year g
Slide 19: Consumer spending and activity levels trending upward
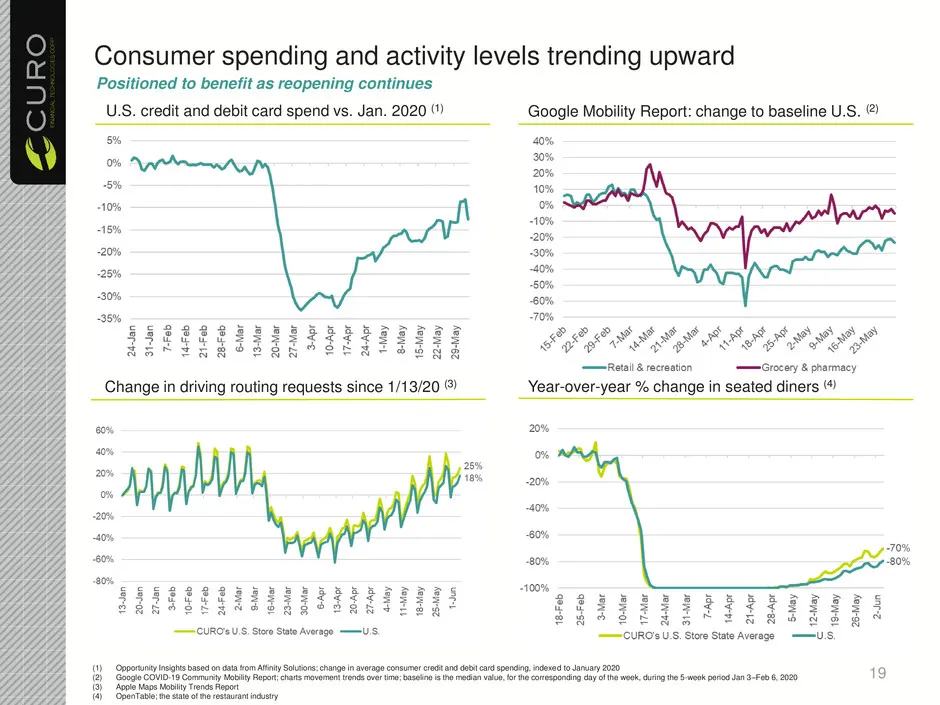
Consumer spending and activity levels trending upward Change in driving routing requests since 1/13/20 (3) Positioned to benefit as reopening continues Year-over-year % change in seated diners (4) U.S. credit and debit card spend vs. Jan. 2020 (1) (1) Opportunity Insights based on data from Affinity
Slide 20: Near-Term Opportunities
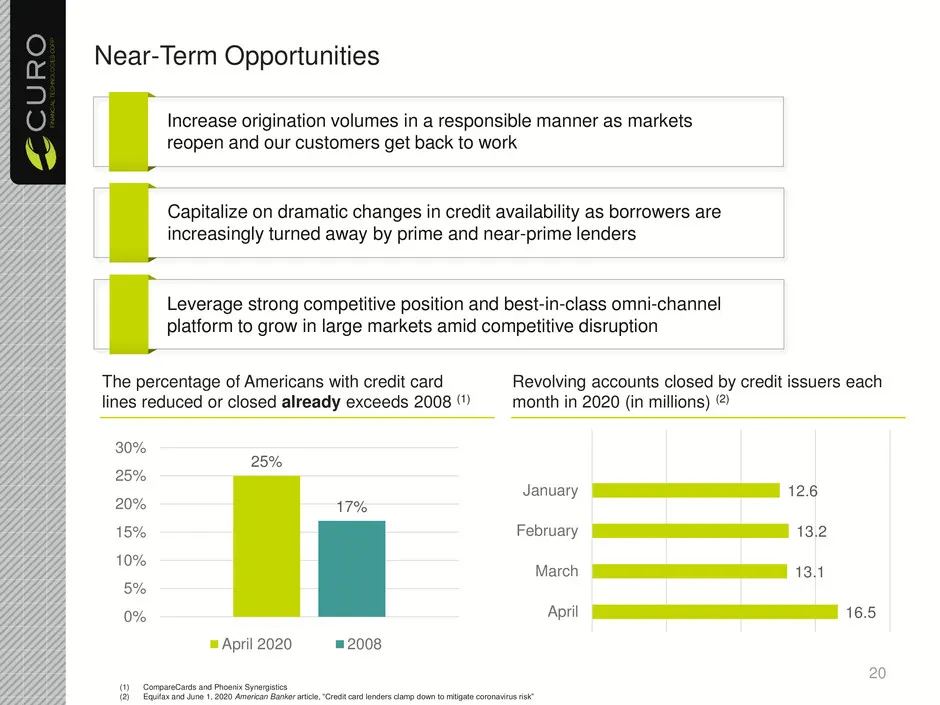
Near-Term Opportunities 25% 17% 0% 5% 10% 15% 20% 25% 30% April 2020 2008 The percentage of Americans with credit card lines reduced or closed already exceeds 2008 (1) Revolving accounts closed by credit issuers each month in 2020 (in millions) (2) 16.5 13.1 13.2 12.6 April March February January (1
Slide 21: Recent Business Trends
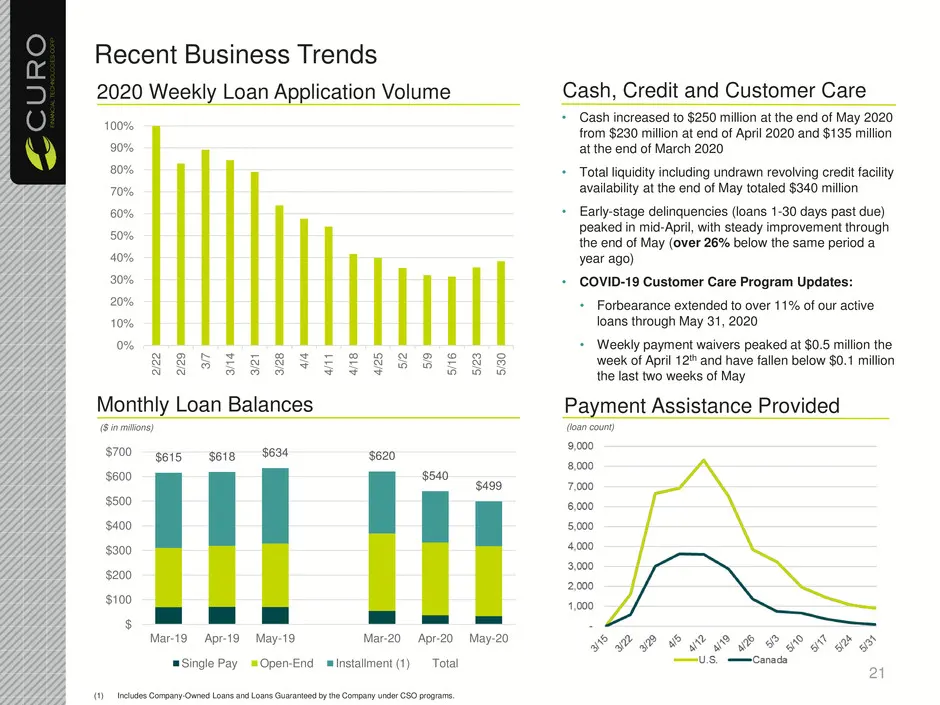
Recent Business Trends 2020 Weekly Loan Application Volume Cash, Credit and Customer Care • Cash increased to $250 million at the end of May 2020 from $230 million at end of April 2020 and $135 million at the end of March 2020 • Total liquidity including undrawn revolving credit facility availabilit
Slide 22: COVID-19 Customer Care Plan Reinforces our Commitment
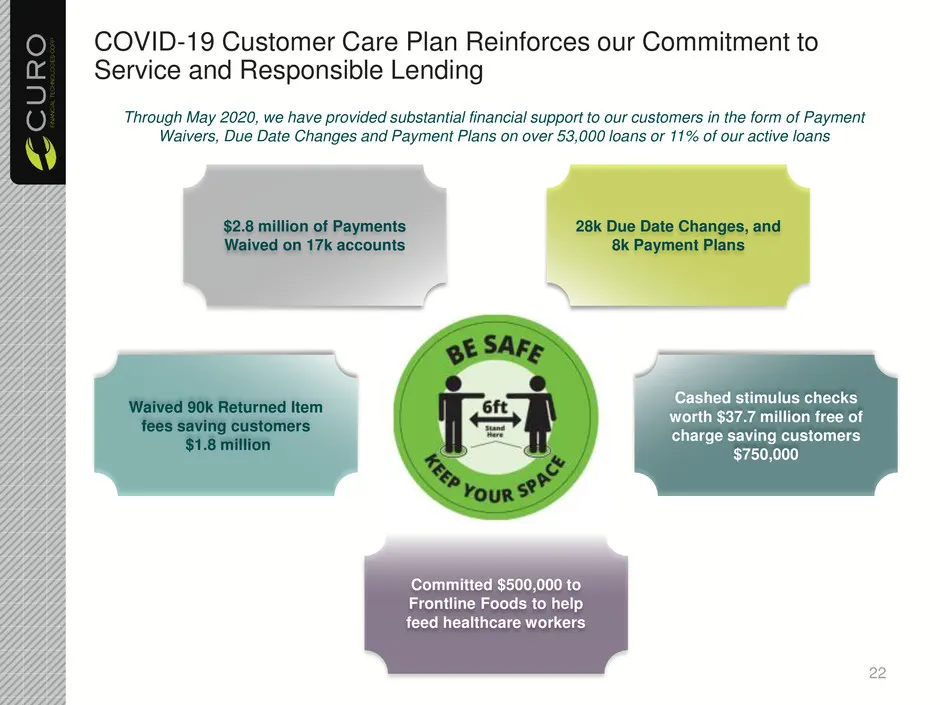
COVID-19 Customer Care Plan Reinforces our Commitment to Service and Responsible Lending Waived 90k Returned Item fees saving customers $1.8 million Cashed stimulus checks worth $37.7 million free of charge saving customers $750,000 28k Due Date Changes, and 8k Payment Plans $2.8 million of Payments

Slide 23: Financial Summary
Financial Summary 23
Slide 24: Q1 2020 Financial Results: Loans Receivable, Revenue, Gross Margin
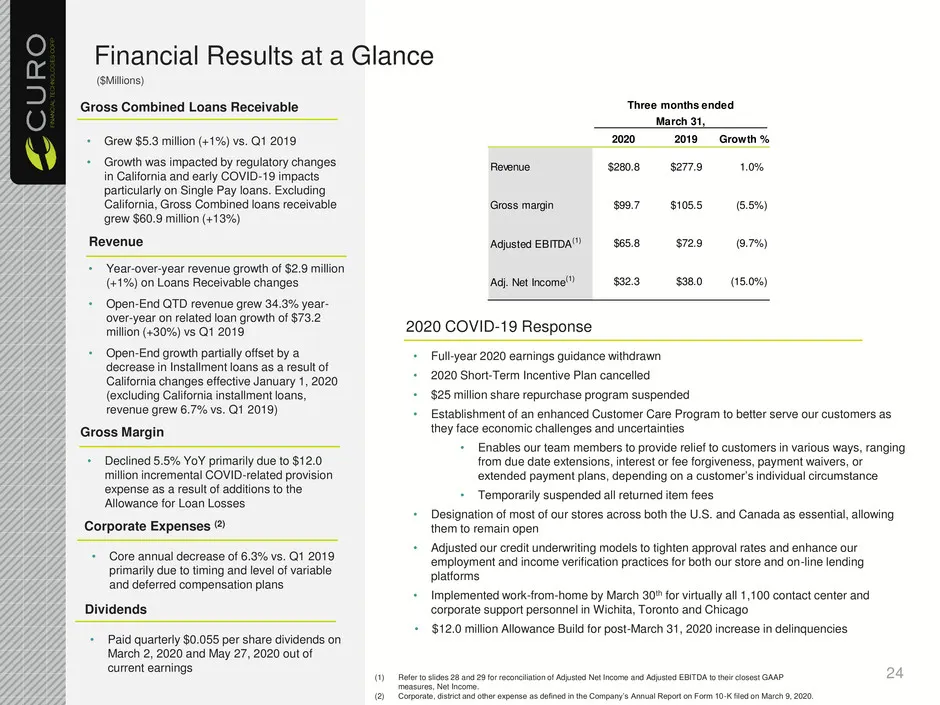
Gross Combined Loans Receivable • Grew $5.3 million (+1%) vs. Q1 2019 • Growth was impacted by regulatory changes in California and early COVID-19 impacts particularly on Single Pay loans. Excluding California, Gross Combined loans receivable grew $60.9 million (+13%) Revenue • Year-over-year revenu
Slide 25: Improved Quarterly Net Charge-Off Rates
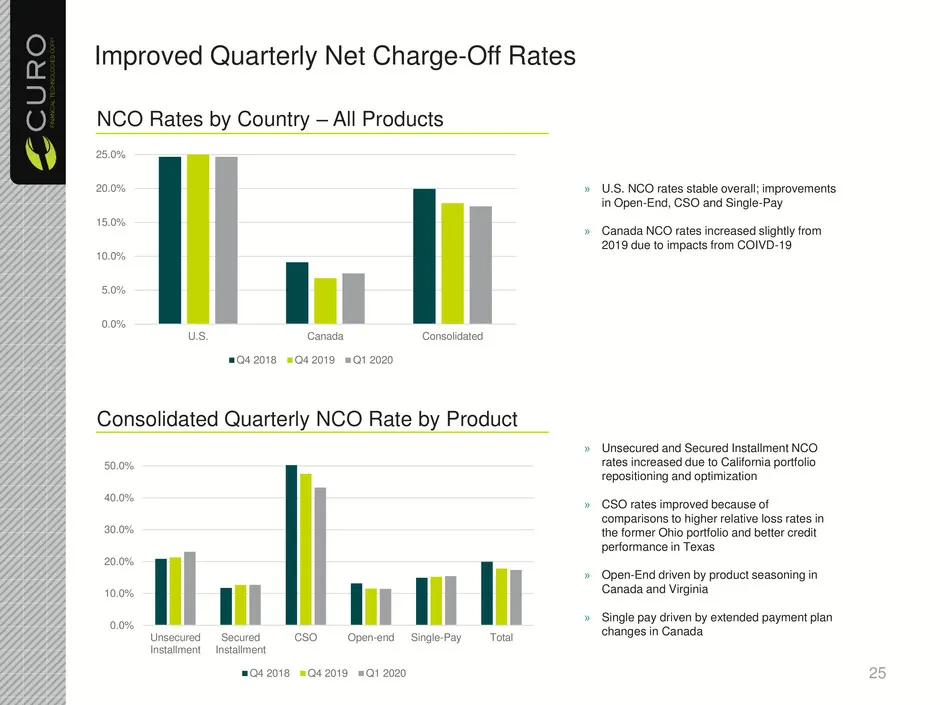
Improved Quarterly Net Charge-Off Rates Consolidated Quarterly NCO Rate by Product NCO Rates by Country – All Products » U.S. NCO rates stable overall; improvements in Open-End, CSO and Single-Pay » Canada NCO rates increased slightly from 2019 due to impacts from COIVD-19 » Unsecured and Secured In
Slide 26: Strong Debt Capitalization and Liquidity
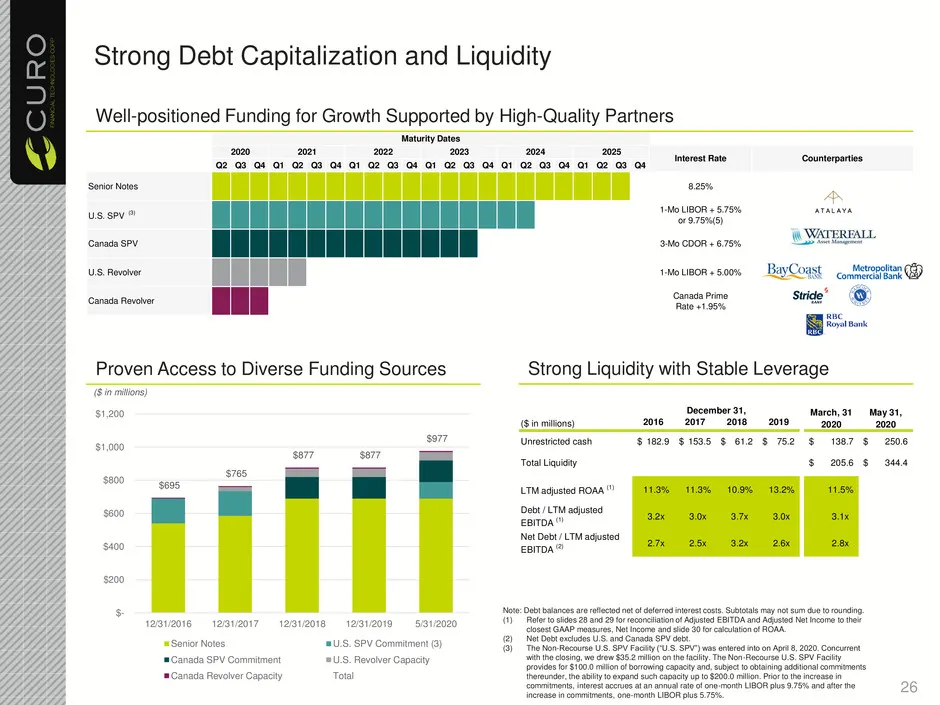
Q2 Q3 Q4 Q1 Q2 Q3 Q4 Q1 Q2 Q3 Q4 Q1 Q2 Q3 Q4 Q1 Q2 Q3 Q4 Q1 Q2 Q3 Q4 Senior Notes 8.25% U.S. SPV (3) 1-Mo LIBOR + 5.75% or 9.75%(5) Canada SPV 3-Mo CDOR + 6.75% U.S. Revolver 1-Mo LIBOR + 5.00% Canada Revolver Canada Prime Rate +1.95% Interest Rate Counterparties Maturity Dates 202520242023202220212

Slide 27: Appendix
27 Appendix
Slide 28: Historical Consolidated Adjusted EBITDA Reconciliation
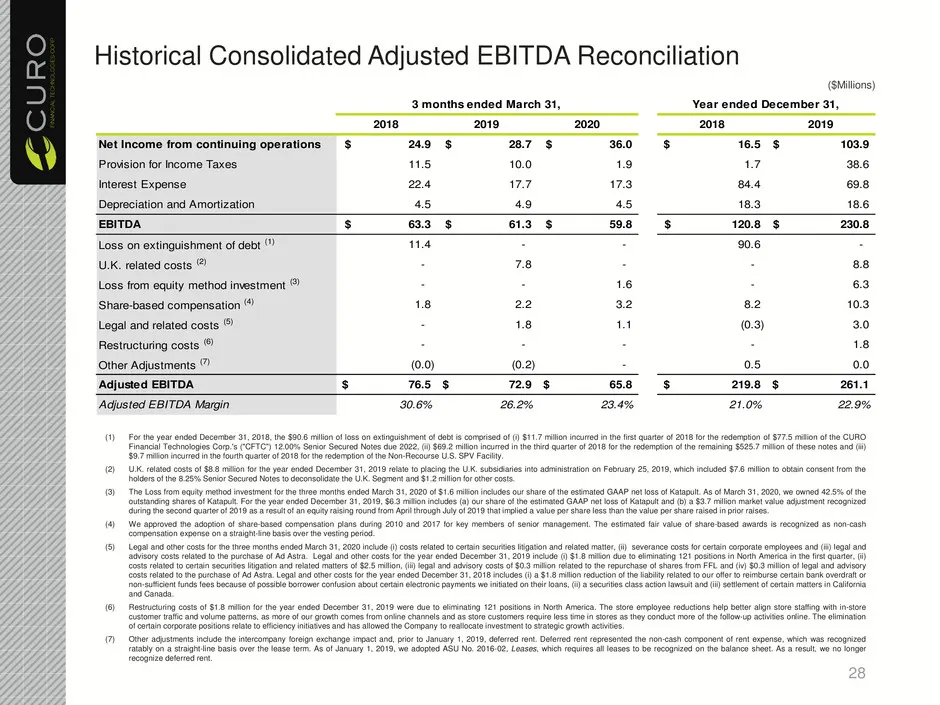
Historical Consolidated Adjusted EBITDA Reconciliation 28 ($Millions) (1) For the year ended December 31, 2018, the $90.6 million of loss on extinguishment of debt is comprised of (i) $11.7 million incurred in the first quarter of 2018 for the redemption of $77.5 million of the CURO Financial Techno
Slide 29: Historical Consolidated Adjusted Net Income Reconciliation
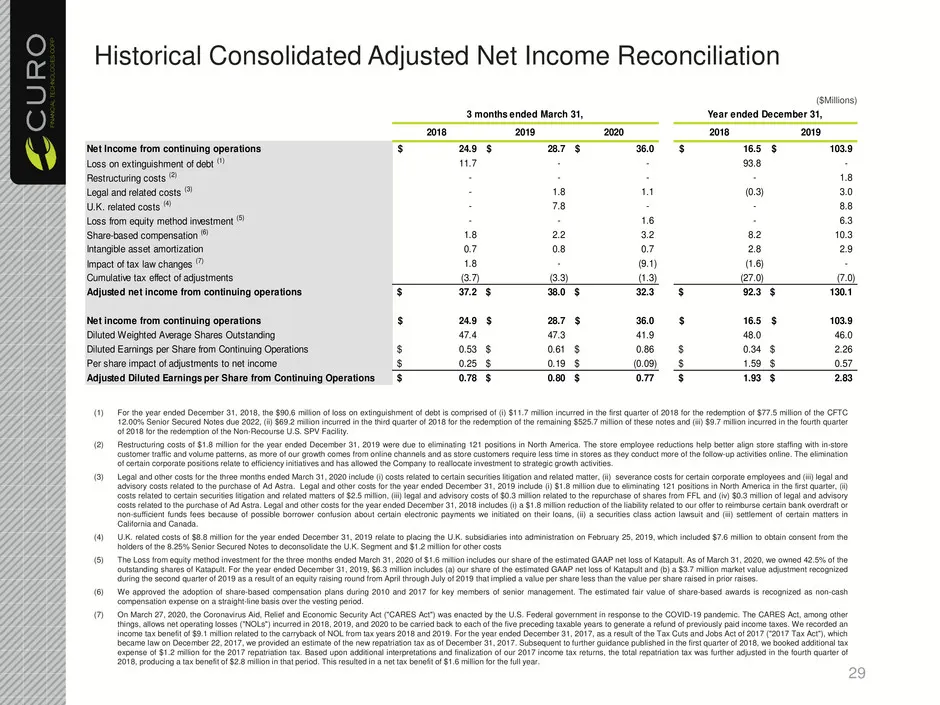
Historical Consolidated Adjusted Net Income Reconciliation 29 ($Millions) (1) For the year ended December 31, 2018, the $90.6 million of loss on extinguishment of debt is comprised of (i) $11.7 million incurred in the first quarter of 2018 for the redemption of $77.5 million of the CFTC 12.00% Senio
Slide 30: Historical Gross Combined Loan Receivables and Adjusted ROAA Reconciliations
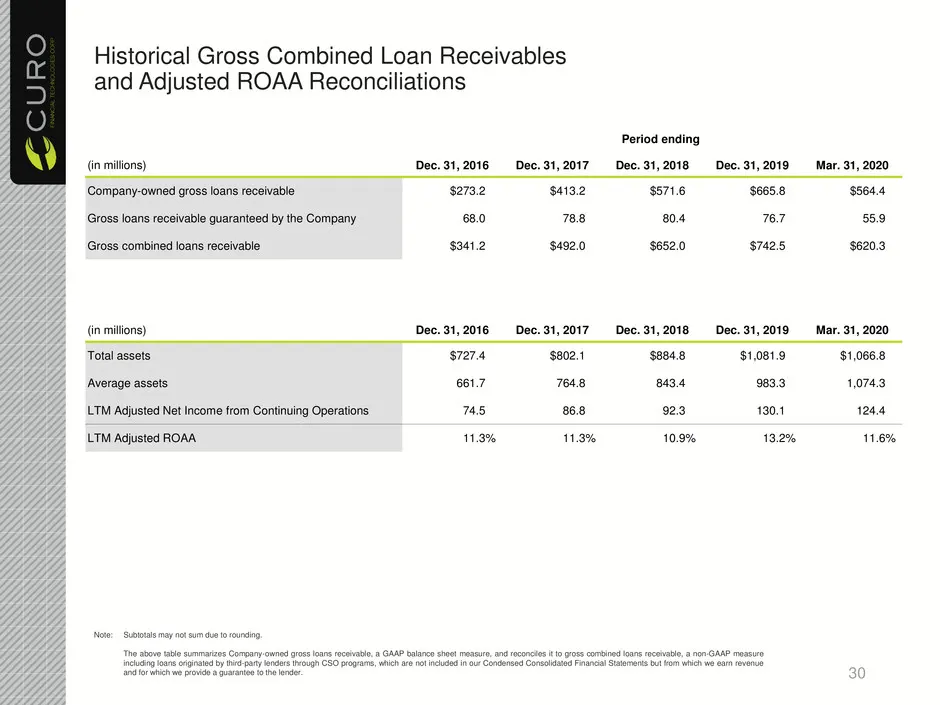
Historical Gross Combined Loan Receivables and Adjusted ROAA Reconciliations 30 Note: Subtotals may not sum due to rounding. The above table summarizes Company-owned gross loans receivable, a GAAP balance sheet measure, and reconciles it to gross combined loans receivable, a non-GAAP measure includi
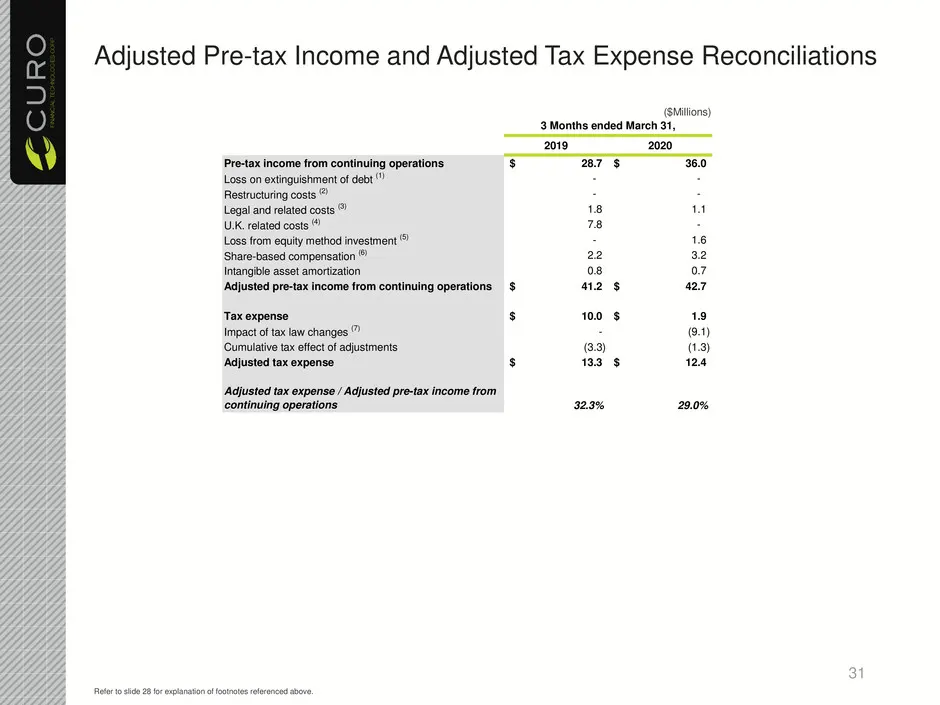
Slide 31: Adjusted Pre-tax Income and Adjusted Tax Expense Reconciliations
Adjusted Pre-tax Income and Adjusted Tax Expense Reconciliations 31 Refer to slide 28 for explanation of footnotes referenced above. 2019 2020 Pre-tax income from continuing operations 28.7$ 36.0$ Loss on extinguishment of debt (1) - - Restructuring costs (2) - - Legal and related costs (3) 1.8 1.1
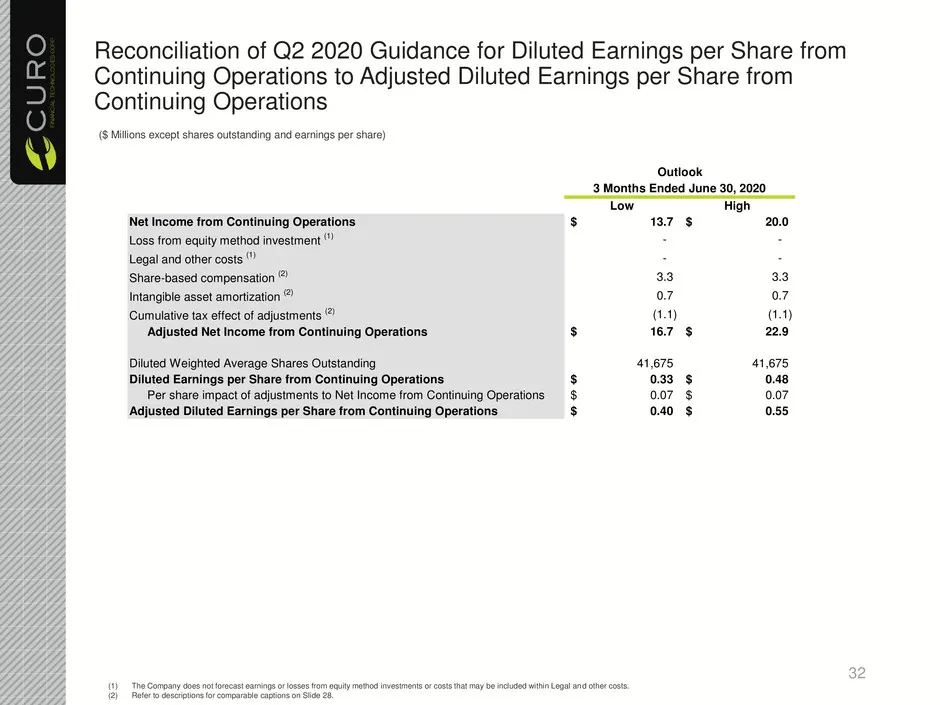
Slide 32: Reconciliation of Q2 2020 Guidance for Diluted EPS
Reconciliation of Q2 2020 Guidance for Diluted Earnings per Share from Continuing Operations to Adjusted Diluted Earnings per Share from Continuing Operations 32 (1) The Company does not forecast earnings or losses from equity method investments or costs that may be included within Legal and other c
Source: SEC EDGAR · 8-K filed Jun 17, 2020
More decks from Curo Group Holdings Corp
 Q4 2023 Earnings Presentation21 slides · Feb 12, 2024
 Investor Presentation (November 2023)15 slides · Nov 13, 2023
 Q3 2023 Earnings Presentation20 slides · Nov 2, 2023
 Debt Investor Presentation (October 2023)21 slides · Oct 23, 2023
 Investor Presentation (September 2023)15 slides · Sep 25, 2023
 Q2 2023 Earnings Presentation21 slides · Aug 3, 2023