Kraft Foods — CAGNY Conference 2013
66 slides from Kraft Foods's conference presentation, Feb 19, 2013

Slide 1: The New Kraft Foods Group
The New Kraft Foods Group CAGNY Conference February 19, 2013 Exhibit 99.1

Slide 2: Chris Jakubik, Vice President, Investor Relations
Chris Jakubik Vice President, Investor Relations

Slide 3: Forward-Looking Statements
Forward-Looking Statements This presentation contains a number of forward-looking statements. The words “plan,” “drive,” “make,” “expect,” “will,” “deliver,” “taking,” “moving,” “executing” and similar expressions are intended to identify the forward-looking statements. Examples of forward-looking s

Slide 4: The New Kraft Foods Group
The New Kraft Foods Group • Our Plan • Driving Profitable Growth Through Innovation • Making Cash King • Q&A

Slide 5: Tony Vernon, Chief Executive Officer
Tony Vernon Chief Executive Officer
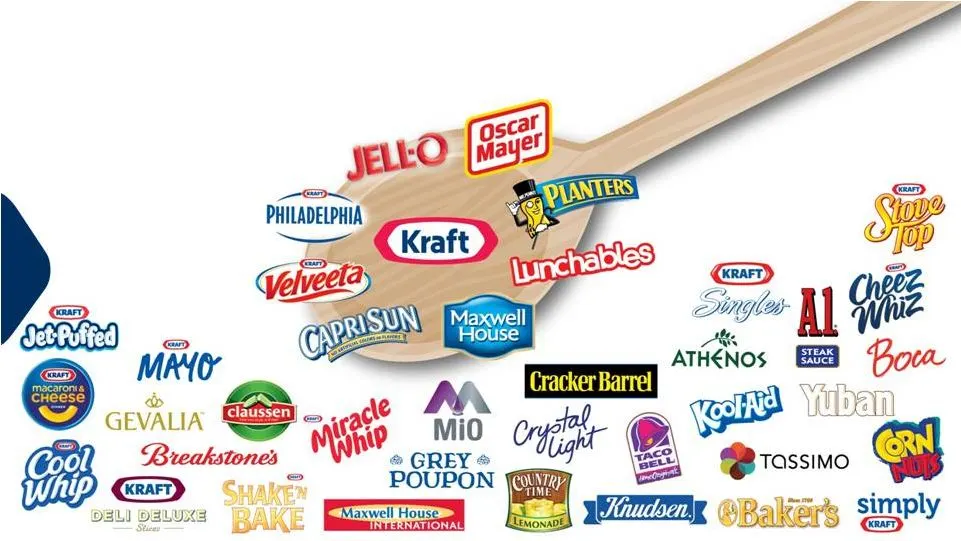
Slide 6: PHILADELPHIA KS Sot ho
PHILADELPHIA KS Sot ho Gon) Si oo a a Sng “i M1 MAO a Cracker Barrel Atiienos ou racker Barrel _ @ ity Lomate AA ma Vai

Slide 7: We Have The Best Sandbox in Our Industry
We Have The Best Sandbox in Our Industry • $18 billion annual food and beverage sales, and growing – Focused on the most profitable market in the world – Household penetration 98% in U.S., 99% in Canada • The best portfolio of food and beverage brands – 9 brands >$500MM = 70% of 2012 net revenue – 2
Slide 8: Our Mission
Superior Dividend Payout Profitable Top-Line Growth Consistent Bottom-Line Growth Our Mission Make Kraft North American Food & Beverage Company Best Investment in the Industry
Slide 9: Our Plan
Redefine Efficiency Turbocharge Our Iconic Brands Execute with Excellence Make Our People Our Competitive Edge Our Plan
Slide 10: Making Progress: People
Redefine Efficiency Turbocharge Our Iconic Brands Execute with Excellence Make Our People Our Competitive Edge Making Progress • Actively recruiting top talent • Populating Kraft University curriculum • 20/70/10 performance management in place for 2013 • Expanding stock ownership across employee bas
Slide 11: Making Progress: Integrated Business Planning
Redefine Efficiency Turbocharge Our Iconic Brands Execute with Excellence Make Our People Our Competitive Edge Product Management Demand Management Supply Management Making Progress • Rolling out Integrated Business Planning – Focusing Business Units, Sales, Supply Chain on ONE number – Piloted in U
Slide 12: Making Progress: Sales Incentives and Cash KPIs
Redefine Efficiency Turbocharge Our Iconic Brands Execute with Excellence Make Our People Our Competitive Edge Making Progress • Rolling out Integrated Business Planning • Changing sales incentive program • Increasing focus on cash KPI’s
Slide 13: Making Progress: Industry-Leading Productivity
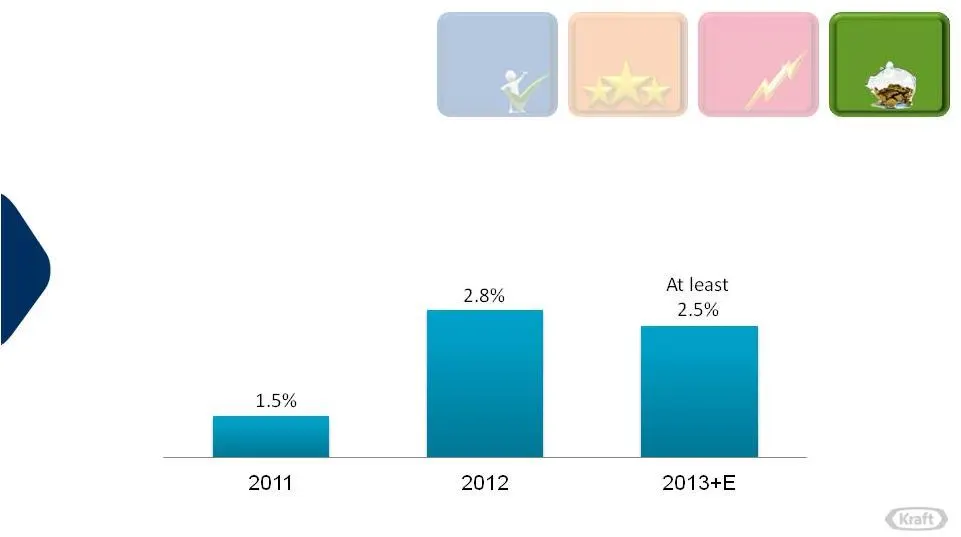
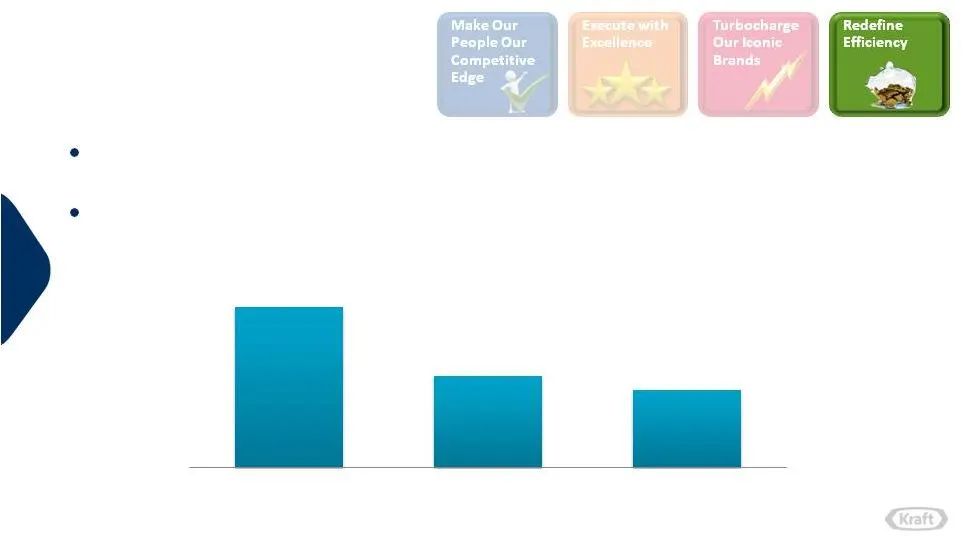
Redefine Efficiency Turbocharge Our Iconic Brands Execute with Excellence Make Our People Our Competitive Edge Making Progress • Driving industry-leading productivity Net Productivity as a % of COGS
Slide 14: Making Progress: Lowest-Cost Overheads
Making Progress Driving industry-leading productivity Redefining lowest-cost overheads North America Overhead as a % of Net Revenue 12.3% 8.7% ~8% 2010 Kraft Foods 2012 Kraft Foods Group Best-in-Class
Slide 15: Never a Greater Need to Contemporize and Innovate
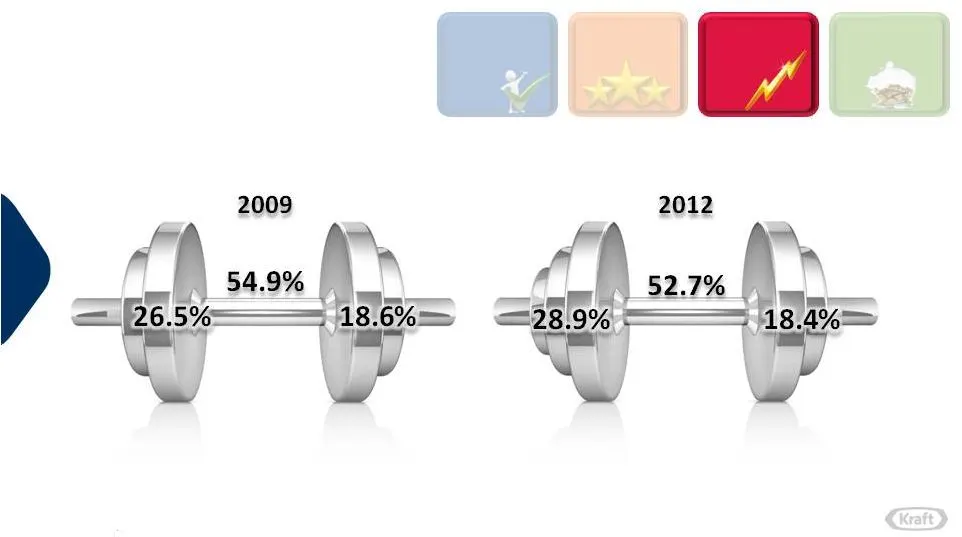
Redefine Efficiency Turbocharge Our Iconic Brands Execute with Excellence Make Our People Our Competitive Edge Making Progress • Never a greater need to contemporize and innovate Low Income Middle Income High Income Low Income Middle Income High Income Source: Kraft Foods Group, Nielsen Homescan Pan
Slide 16: Consumer, Customer, Competition Trends
Redefine Efficiency Turbocharge Our Iconic Brands Execute with Excellence Make Our People Our Competitive Edge Consumer Customer Competition Making Progress • Never a greater need to contemporize and innovate • Gravitating to value and premium; the middle is being squeezed • Prefer healthier offerin
Slide 17: Making Progress: Marketing and Innovation
Making Progress Never a greater need to contemporize and innovate Increasing share of voice behind world-class marketing – Advertising to net revenue 3.5% in 2012 vs 2.9% in 2011 Driving gains through bigger, better innovation http://www.youtube.com/watch?v=hJvX_m0Xqls

Slide 18: Barry Calpino, Vice President, Breakthrough Innovation
Barry Calpino Vice President, Breakthrough Innovation

Slide 19: Innovation at Kraft: The End in Mind
Innovation at Kraft: The End in Mind Consistent, sustained, best-in-class innovation — year after year after year A source of true competitive advantage and differentiation versus competition and industry peers That helps deliver consistent, sustainable, profitable growth
Slide 20: Where We Were
) WHERE WE WERE

Slide 21: We Were "Worst"
We Were “Worst” • With customers • Versus competition • With analysts • Industry reputation • Every study, by any measure
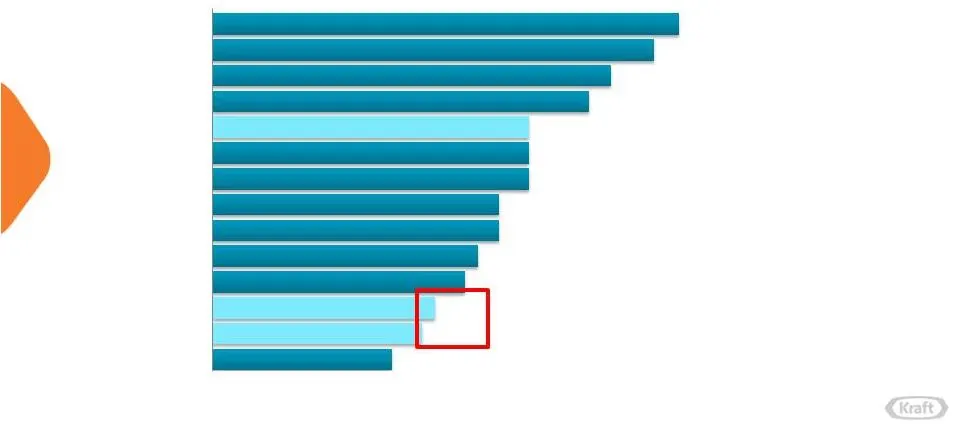
Slide 22: 2008 CPG Ranking – Bottom Tier
Nestle Hershey General Mills Unilever Pepsi Heinz Kellogg’s ConAgra Sara Lee Campbell’s Danone 2008 CPG Ranking – Bottom Tier Peer Average Kraft Kraft Top 25 2008 3-Outlet Consumption Index From New Products Source: ACN FDM 52 w.e. 12/27/08; All Food & Beverage categories. Excludes up or down-sized
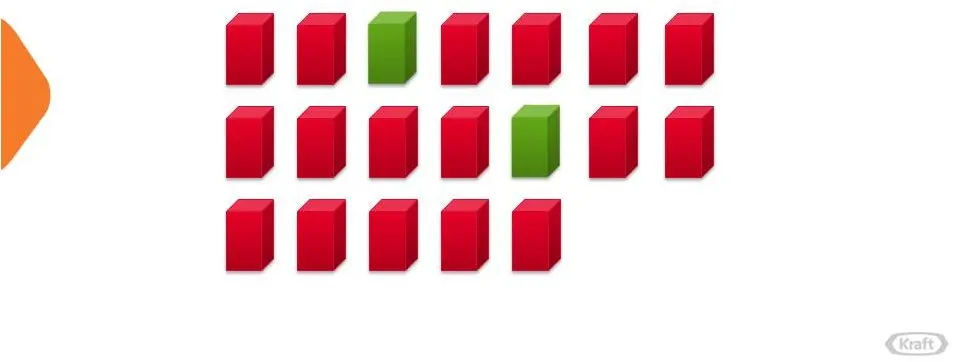
Slide 23: Share of Kraft New Product Launches in 2008 Were Failures
17 of 19 Kraft New Product Launches in 2008 Were Considered Failures
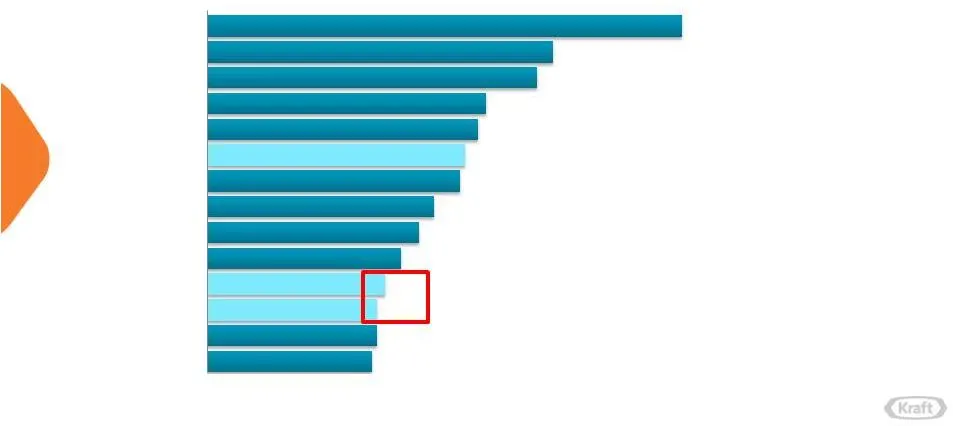
Slide 24: 2009 CPG Ranking – Bottom Tier Again
Nestle Hershey General Mills Unilever Pepsi Heinz Kellogg’s ConAgra Sara Lee Campbell’s Danone 2009 CPG Ranking – Bottom Tier Again 2009* 3-Outlet Consumption Index From New Products Peer Average Kraft Kraft Top 25 Source: ACN FDM 52 w.e. 12/26/09; All Food & Beverage categories. Excludes up or down

Slide 25: Bad Habits Made Us "Worst"
Bad Habits Made Us “Worst” Small ideas Poor execution with customers—not leveraging our incredible Sales advantage Lack of focus, rigor, prioritization, discipline in Stage Gate process Very low investment —or big ideas made small —behind launches

Slide 26: Launches Receiving More Than $10 Million in A&C Support
Only 3 of 16 2009 launches received more than $10 million in A&C support... …and these were the 3 most successful

Slide 27: Bad Habits Fostered a Bad Innovation Culture
Bad Habits Fostered a Bad Innovation Culture • Culture of “we don’t”, “we are bad at innovation” • Culture where innovators were 3rd class, “dead-end” job • Culture of “innovation doesn’t really matter here”
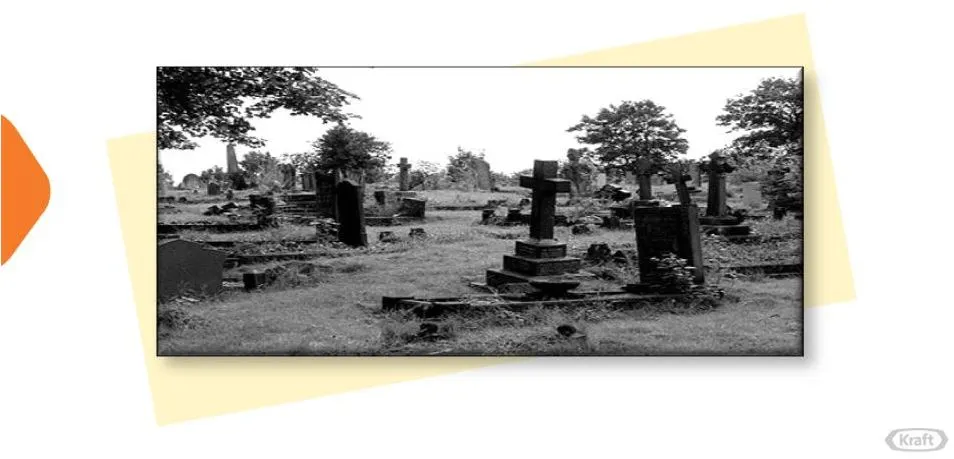
Slide 28: "Kraft is where good ideas go to die"
“Kraft is where good ideas… “Kraft is where good ideas… ...go to die” ...go to die”

Slide 29: Where We've Come
) WHERE WE’VE COME

Slide 30: The Ingredients for a Comeback
The Ingredients for a Comeback • Looking in the mirror, honestly • Top to bottom attention to innovation • Recognizing underutilized strengths and gems (R&D, Sales, Iconic Brands) • Spirit of “positive discontent” • … and a new playbook

Slide 31: Essence of the Playbook
Essence of the Playbook Good, proven principles, fundamentals, habits... • … that emphasize transparency, data, the right rigor, KPI’s, simple processes • … that give the ball to the business unit teams to make great things happen

Slide 32: Principles of the Playbook
Principles of the Playbook • Real Fewer, Bigger, Bette r • Great consumer concepts, products, packaging • Great customer execution • Focused and disciplined financial criteria, KPI’s incrementality, cash • Heavy A&C investment for great marketing of new platforms —actions, not words —with the right

Slide 33: Principles of the Playbook…Continued
Principles of the Playbook…Continued • Multi-year platforms — • 3-year pipelines of future multi-year platforms • “What gets measured gets done” • “Lessons learned” “year 2” matters!

Slide 34: 2011: Something's Happening Here!
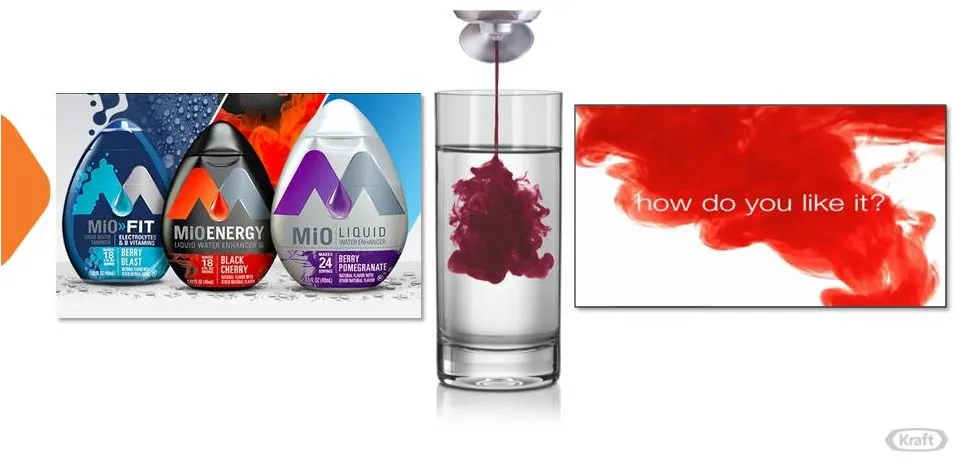
2011: Something’s Happening Here! • Focus shifted from dozens of “items” to 13 “Big Bets” • A&C increased from ~$5 million per launch to ~$25 million per Big Bet • New brand launched (MiO) with over $50 million in A&C • Sales step up to delivering best-in-class distribution and merchandising on Big

Slide 35: 2011 Results
2011 Results • Over $600 million from Big Bets • Revenue from innovation over last 3 years jumps to 10% • Three $100 million platforms are born—MiO, Oscar Mayer Selects, Velveeta Skillets • A real shift in distortion from small Tier * 3 to big Tier 1 projects • Culture begins to shift *Based on crit

Slide 36: Others Begin to Notice
Others Begin to Notice • Walmart Innovator of the Year, all departments • Walmart Innovation of the Year, MiO • Edison Award: #1 Food and Beverage Innovation, MiO • 3 IRI Pacesetters, top-selling new products

Slide 37: Customer Testimonial from Target
“I never thought I would think of Kraft as an innovative company, but lately your innovation has been so impressive.” Dave Mirelez DMM - Perishables Target
Slide 38

Slide 39: New $100MM Platforms
New $100MM Platforms
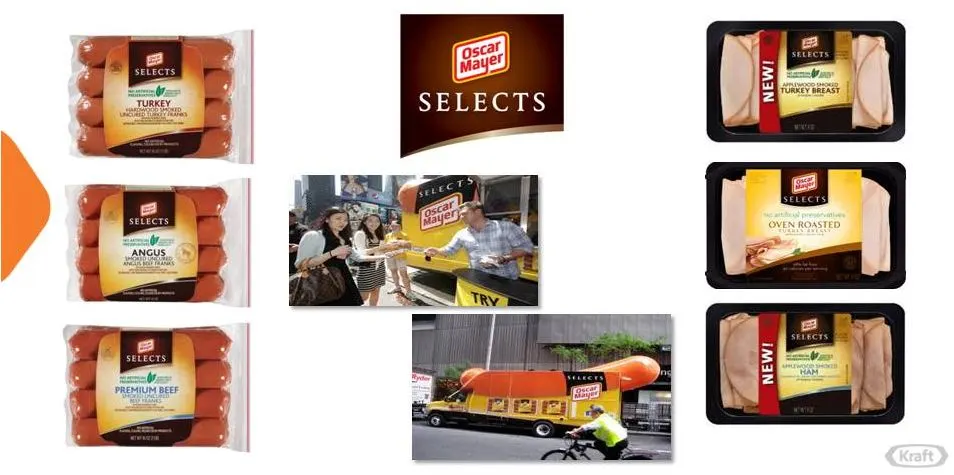
Slide 40: New $100MM Platforms
New $100MM Platforms
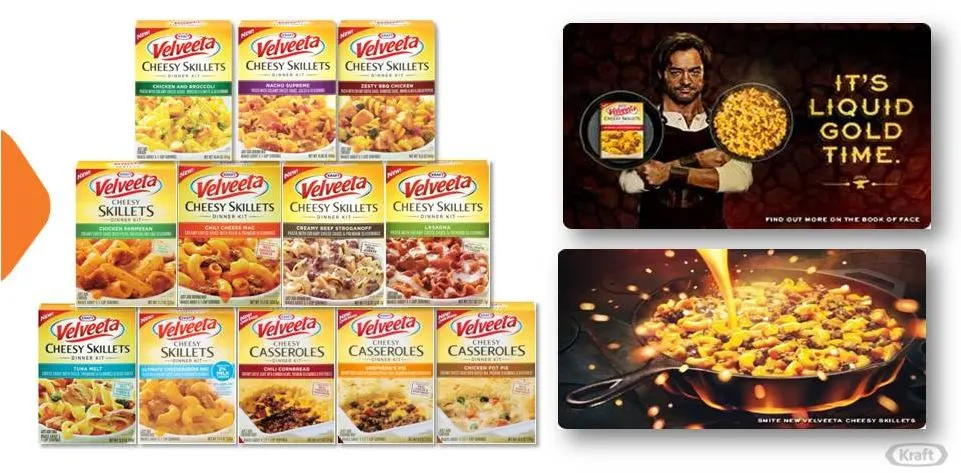
Slide 41: yelveel)
yelveel) (CHEESY Sats ae LIQUID ogay GOLD ie TIME. (Velvet Goi é Pag CHEESY SKILLETS | CHEESY SKILLE
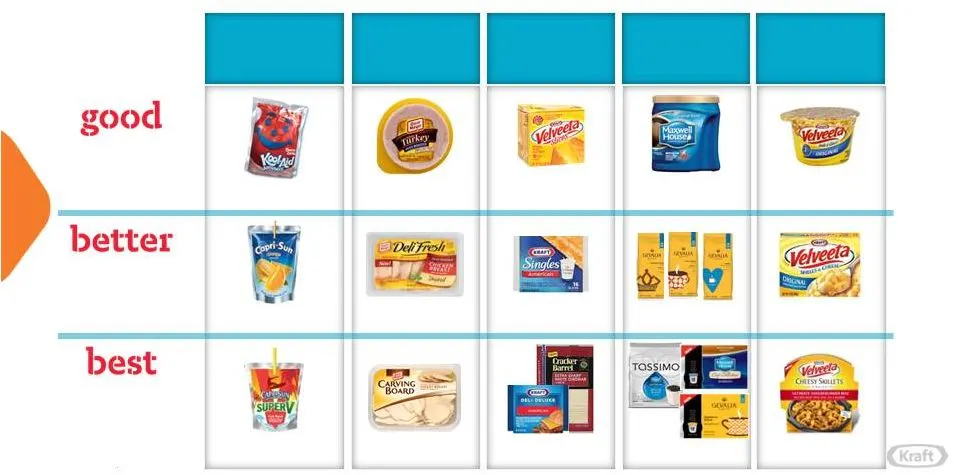
Slide 42: Good-Better-Best
Ready-to- Drink Beverages Cold Cuts Coffee Sandwich Cheese Convenient Meals *per serving Good-Better-Best *per serving $1.79 $2.49 $2.99 $1.99 $2.99 $3.99 $0.04-$0.06 * $0.09-$0.15 * $0.60-$1.00 * $1.99 $2.99 $3.99 $0.99 $1.99 $3.49
Slide 43: Real Resource Distortion
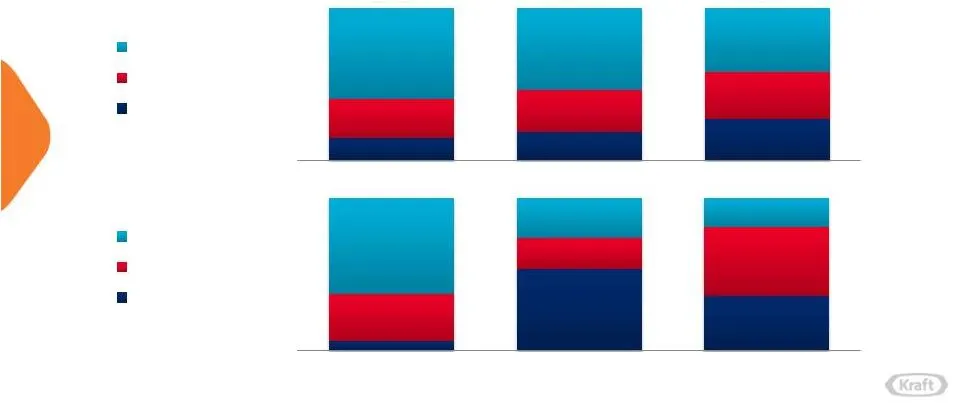
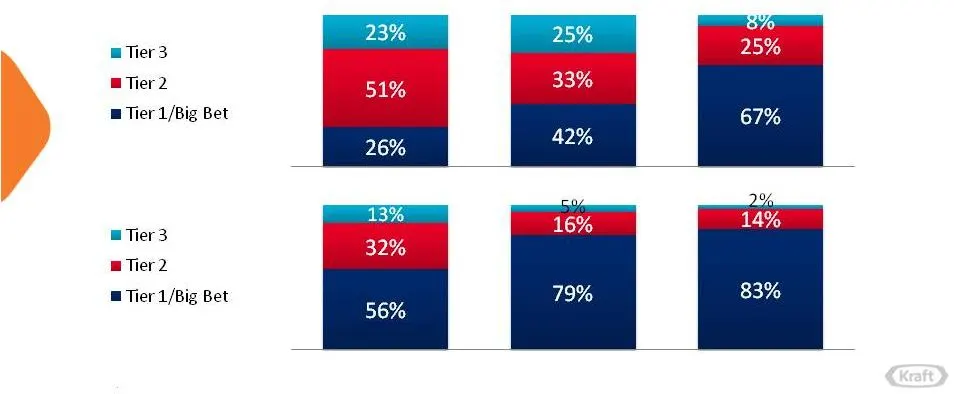
15% 19% 27% 26% 28% 31% 59% 54% 42% 5% 52% 43% 26% 55% 52% 23% 20% 25% Real Resource Distortion Kraft Innovation Profile – 2010 to 2012 % NP Initiatives % NP SKUs Tier 3 Tier 2 Tier 1/Big Bet Tier 3 Tier 2 Tier 1/Big Bet Source: Kraft Financial Shipment data, 3 year rolling average; ¹ 2012 Estimate:
Slide 44: Real Resource Distortion
Real Resource Distortion Kraft Innovation Profile – 2010 to 2012 % NP A&C Spending % NP Revenue Source: Kraft Financial Shipment data, 3 year rolling average; ¹ 2012 Estimate; Tiers are based on criteria for initiative size, investment, pipeline and margin

Slide 45: 2012 Results
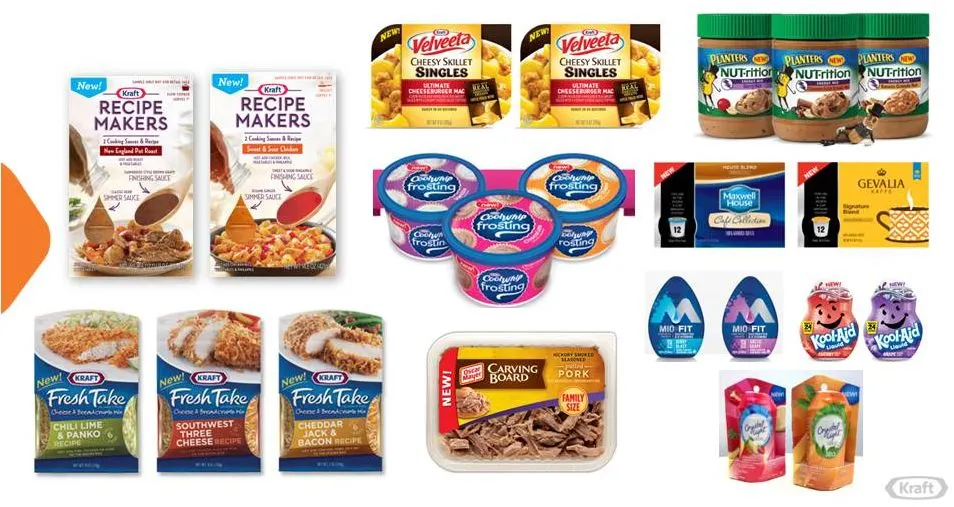
2012 Results • “Year 2” principle executed for Velveeta Skillets, MiO and a blow-out of Oscar Mayer Selects platform • New Fresh Take, Gevalia, Capri Super V platforms launched • Canada implements Fewer, Bigger, Better, with even better results • Significant improvement in key aspects of customer ex
Slide 46: Contribution from Innovation Sets a New High!
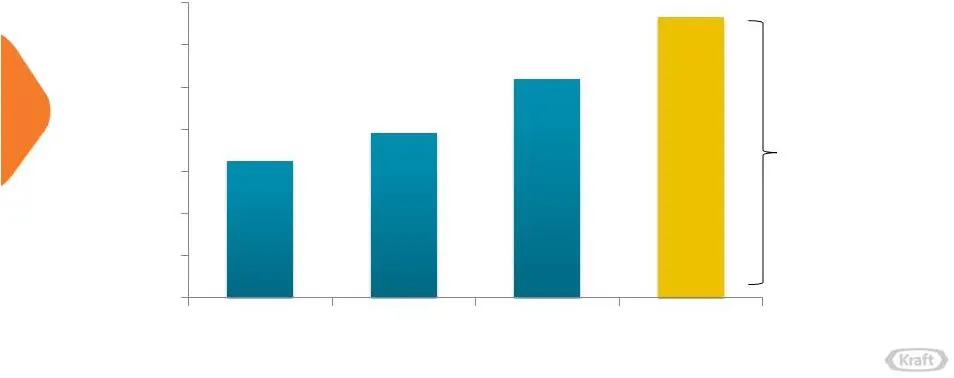
Contribution from Innovation Sets a New High! Net revenue from new product innovation over last 3 years Range across Business Units: 8%-15% 0% 2% 4% 6% 8% 10% 12% 14% 2012E* 6.5% 7.8% 10.4% 13.0% Source: U.S. Nielsen Consumption - 3-Outlet (2009-2011) and All Outlet-xAOC (2012), *2012 Estimate

Slide 47: Where We're Going
) WHERE WE’RE GOING
Slide 48: PANTIES ISNT
— PANTIES ISNT Oa RECIPE MAKERS \S

Slide 49: In Innovation, "First to Worst" Can Happen as Easily as "Worst to First"
In Innovation, “First to Worst” can happen as easily and as often as “Worst to First” This will not happen at Kraft

Slide 50: Innovation at Kraft: The End in Mind
That helps deliver consistent, sustainable, profitable growth Innovation at Kraft: The End in Mind • Consistent, sustained, best-in-class innovation — year after year after year • A source of true competitive advantage and differentiation versus competition and industry peers • —year after That help

Slide 51: Today's Honest Look in the Mirror
Today’s Honest Look in the Mirror • Process, best practices, decision-making process upgrade • Channel ubiquity • Voice of the Hispanic • Talent and culture • Consistency —end-to-end —consistently in our innovation work —the team with the best players wins —especially in quality of hand-offs, launch
Slide 52: Today's Honest Look in the Mirror
Today’s Honest Look in the Mirror • Process, best practices, decision-making process upgrade • Channel ubiquity • Voice of the Hispanic • Talent and culture • Consistency —end-to-end —Value, Club, Immediate Consumption —consistently in our innovation work —the team with the best players wins —especi

Slide 53: A Typical Innovation Mindset: It All Ends at Launch
CREATION PHASE MANY MANY IDEAS DEVELOPMENT PHASE A SELECT FEW LAUNCH PHASE THE VERY FINEST CREATION PHASE MANY MANY IDEAS DEVELOPMENT PHASE A SELECT FEW LAUNCH PHASE THE VERY FINEST A Typical Innovation Mindset: It All “Ends” at Launch
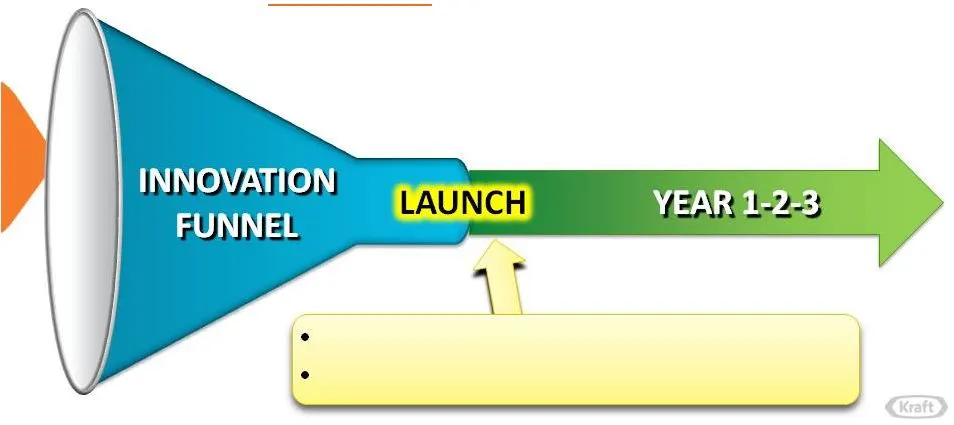
Slide 54: Future State Mindset
Future State Mindset: Launch The Beginning of a New Business! Big Hand-off issues Post-launch rigor drops off vs. pre-launch

Slide 55: "Be quick, but don't hurry" – John Wooden
“Be quick, “Be quick, but don’t hurry” but don’t hurry” John Wooden UCLA Hall of Fame Coach

Slide 56: Innovation Can Be a Competitive Advantage at Kraft
We will make it happen Innovation Can Be a Competitive Advantage at Kraft • Nobody is really good at it—and it’s really hard • We have shown what’s possible — • We have a playbook that is timeless — • We have Top Leadership’s total commitment and key strengths in our Brands, R&D, Sales and Marketing

Slide 57: Tim McLevish, Chief Financial Officer
Tim McLevish Chief Financial Officer

Slide 58: Making Cash King at the New Kraft
Making Cash King at the New Kraft • Cash is now an objective—not an outcome – Pushing FCF and ROIC metrics to business unit and category manager score cards – Embedding into compensation metrics in 2014
Slide 59: Making Cash King at the New Kraft
Sales Force Focus Business Unit Focus Making Cash King at the New Kraft • Cash is now an objective—not an outcome • Changing our culture to focus decisions on true economics – Rolling out cash training across the company Category Management, SKU rationalization Trade spend ROI Optimized price-change

Slide 60: Making Cash King at the New Kraft
Making Cash King at the New Kraft • Cash is now an objective—not an outcome • Changing our culture to focus decisions on true economics • Inoculating earnings and cash flow streams against potential volatility of post-employment benefits
Slide 61: We're Off to a Strong Start
We’re Off to a Strong Start FYE 2012E Cash and Cash Equivalents 2013E Free Cash Flow (1) Annual Dividends @ $2.00/Share FYE 2013E Cash and Cash Equivalents ~$1.0 B ~($1.2) B ~$1.1 B (1) Free Cash Flow = Cash Flow from Operations (~$1.4 billion) less Capital Expenditures (~$0.4 billion) Includes: ~$6
Slide 62: Priorities for Free Cash Flow
Fund a highly competitive dividend Priorities for Free Cash Flow Fund a highly competitive dividend Reinvest in the business Acquisitions that quickly achieve EPS accretion and an IRR > risk-adjusted hurdle rate Share repurchase

Slide 63: We are Well-Positioned to Deliver Predictable Returns
Profitable Top-Line Growth Consistent Bottom-Line Growth Superior Dividend Payout We are Well-Positioned to Deliver Predictable Returns
Slide 64: Our Plan
Redefine Efficiency Turbocharge Our Iconic Brands Execute with Excellence Make Our People Our Competitive Edge Our Plan
Slide 65: Our Mission
Superior Dividend Payout Profitable Top-Line Growth Consistent Bottom-Line Growth Our Mission Make Kraft North American Food & Beverage Company Best Investment in the Industry

Slide 66
Source: SEC EDGAR · 8-K filed Feb 19, 2013
More decks from Kraft Foods Group Inc
 Merger or Acquisition (March 2015)35 slides · Mar 25, 2015
 Merger or Acquisition (March 2015)34 slides · Mar 25, 2015
 Kraft Foods Group Back-to-School Conference 201438 slides · Sep 3, 2014
 CAGE Conference 201436 slides · Mar 17, 2014
 CAGNY Conference 201438 slides · Feb 18, 2014
 Barclays Back-to-School Conference 201339 slides · Sep 4, 2013